Article

Spatial and Temporal Distribution Characteristics of Active Fires in China Using Remotely Sensed Data

1
College of Geography and Environmental Science, Northwest Normal University, Lanzhou 730070, China
2
Key Laboratory of Remote Sensing of Gansu Province, Heihe Remote Sensing Experimental Research Station, Northwest Institute of Eco-Environment and Resources, Chinese Academy of Sciences, Lanzhou 730000, China
*
Author to whom correspondence should be addressed.
Fire 2022, 5(6), 200; https://doi.org/10.3390/fire5060200
Submission received: 19 October 2022 / Revised: 13 November 2022 / Accepted: 22 November 2022 / Published: 25 November 2022
(This article belongs to the Section Fire Science Models, Remote Sensing, and Data)

Abstract

:
Based on the FIRMS MODIS active fire location data in the Chinese mainland from 2001 to 2018, the GIS fishing net (1 km × 1 km) was used to analyze the spatiotemporal distribution characteristics of active fire occurrence probability and intensity, and a GWLR fire risk assessment model was established to explore its influencing factors. The results show that active fires in the Chinese mainland are mainly low intensity. They are mainly distributed in the area where the annual average temperature is 14–19 °C, the precipitation is 400–800 mm, the surface temperature is 15–20 °C, the altitude is 1000–3000 m, the slope is <15°, and the NDVI value is >0.6. The GWLR fire risk assessment model was constructed to divide mainland China into five fire risk zones. NDVI, temperature, elevation, and slope have significant spatial effects on the occurrence of active fires in the Chinese mainland. Eight fire risk influencing factor areas were divided by calculation, and differentiated fire prevention suggestions are put forward.

1. Introduction

Since the 21st century, global active fire has become increasingly frequent [1,2,3]. Active fire is a process that affects the carbon cycle of the global terrestrial ecosystem [4,5]. Active fire can drastically change environmental conditions in a short period through vegetation burning and temperature increase, affecting terrestrial ecosystems and the natural carbon cycle [6]. It can quickly change the physical and chemical properties of plant soil [7,8,9,10], affect the distribution structure of vegetation, reduce the fertility of surface soil and the ability of water conservation, and has a substantial impact on the climate system and biogeochemical cycle [11]. It has a huge impact on animals, plant microorganisms, and even the whole ecosystem, seriously affecting species diversity [10,11]. At the same time, active fire also threatens the safety of human life and property and has a significant impact on regional societies and economies [3].
At present, information about active fire is mainly obtained by remote sensing technology [12,13]. Through satellite monitoring, the brightness temperature of the potential fire is compared with that of the surrounding land cover. If the brightness temperature difference exceeds the given threshold, the potential fire is recognized as an active fire or “hot spot” [6]. The surface temperature anomalies monitored by remote sensing mainly include volcanic eruption, forest, grassland, burning of artificial targets, open burning of straw, and industrial heat emissions [14,15]. From the perspective of monitoring and spatiotemporal distribution of active fires, there are few studies on active fires in the Chinese mainland, mainly focusing on fire research, and most of them are areas with high fire incidence on a small regional scale, such as in the Beijing–Tianjin–Hebei region [16], Jilin province [17], Yunnan province [18], and Fujian province [19]; there are few studies on a large regional scale. The development of remote sensing technology makes it possible to obtain data in a large range, and large-scale active fire monitoring can be carried out [15]. Studying the probability, intensity, and spatiotemporal distribution characteristics of active fires in the Chinese mainland can not only provide a physical basis for remote sensing of vegetation fires on a regional scale, but also be of great significance for their economic losses, air pollution, and public safety assessment [20].
From the perspective of the influencing factors of active fire, combustibles, combustion-supporting substances, and ignition sources are the three basic elements for fire occurrence. The occurrence of active fire is closely related to local meteorology, terrain, vegetation, human activities, and other factors. Depending on the geographic location, the influencing factors also change, and the likelihood of active fires is also different. Currently, the research methods used are mainly to determine the influencing factors of fire risk and establish prediction models, such as principal component analysis, Fuzzy clustering analysis, the Keetch –Byram Drought Index method, Fuzzy comprehensive evaluation method, and system dynamics [21,22,23,24,25]. These methods mainly use experience and mathematical statistics, with low accuracy and poor realism. However, the occurrence mechanism of active fire is very complex, and the influencing factors vary greatly in different regions. The fire risk assessment model can pass through the complicated appearance of the fire, after a large number of quantitative and qualitative analyses, simplify the complex problem, and master its essence, but it can also verify the model and evaluate the error [26,27]; thus, this paper adopts the fire risk assessment model to analyze the influence factors of active fires in the Chinese mainland. The main fire models include the BLR model, GWR model, GWLR model, and so on [28,29,30,31]. The GWLR model introduces geographic location as a variable into the regression parameters, which helps to improve the reliability of the model when studying the fire risk in a large area, conducting more scientific fire risk zoning, and accurately exploring the influencing factors of active fire occurrence.
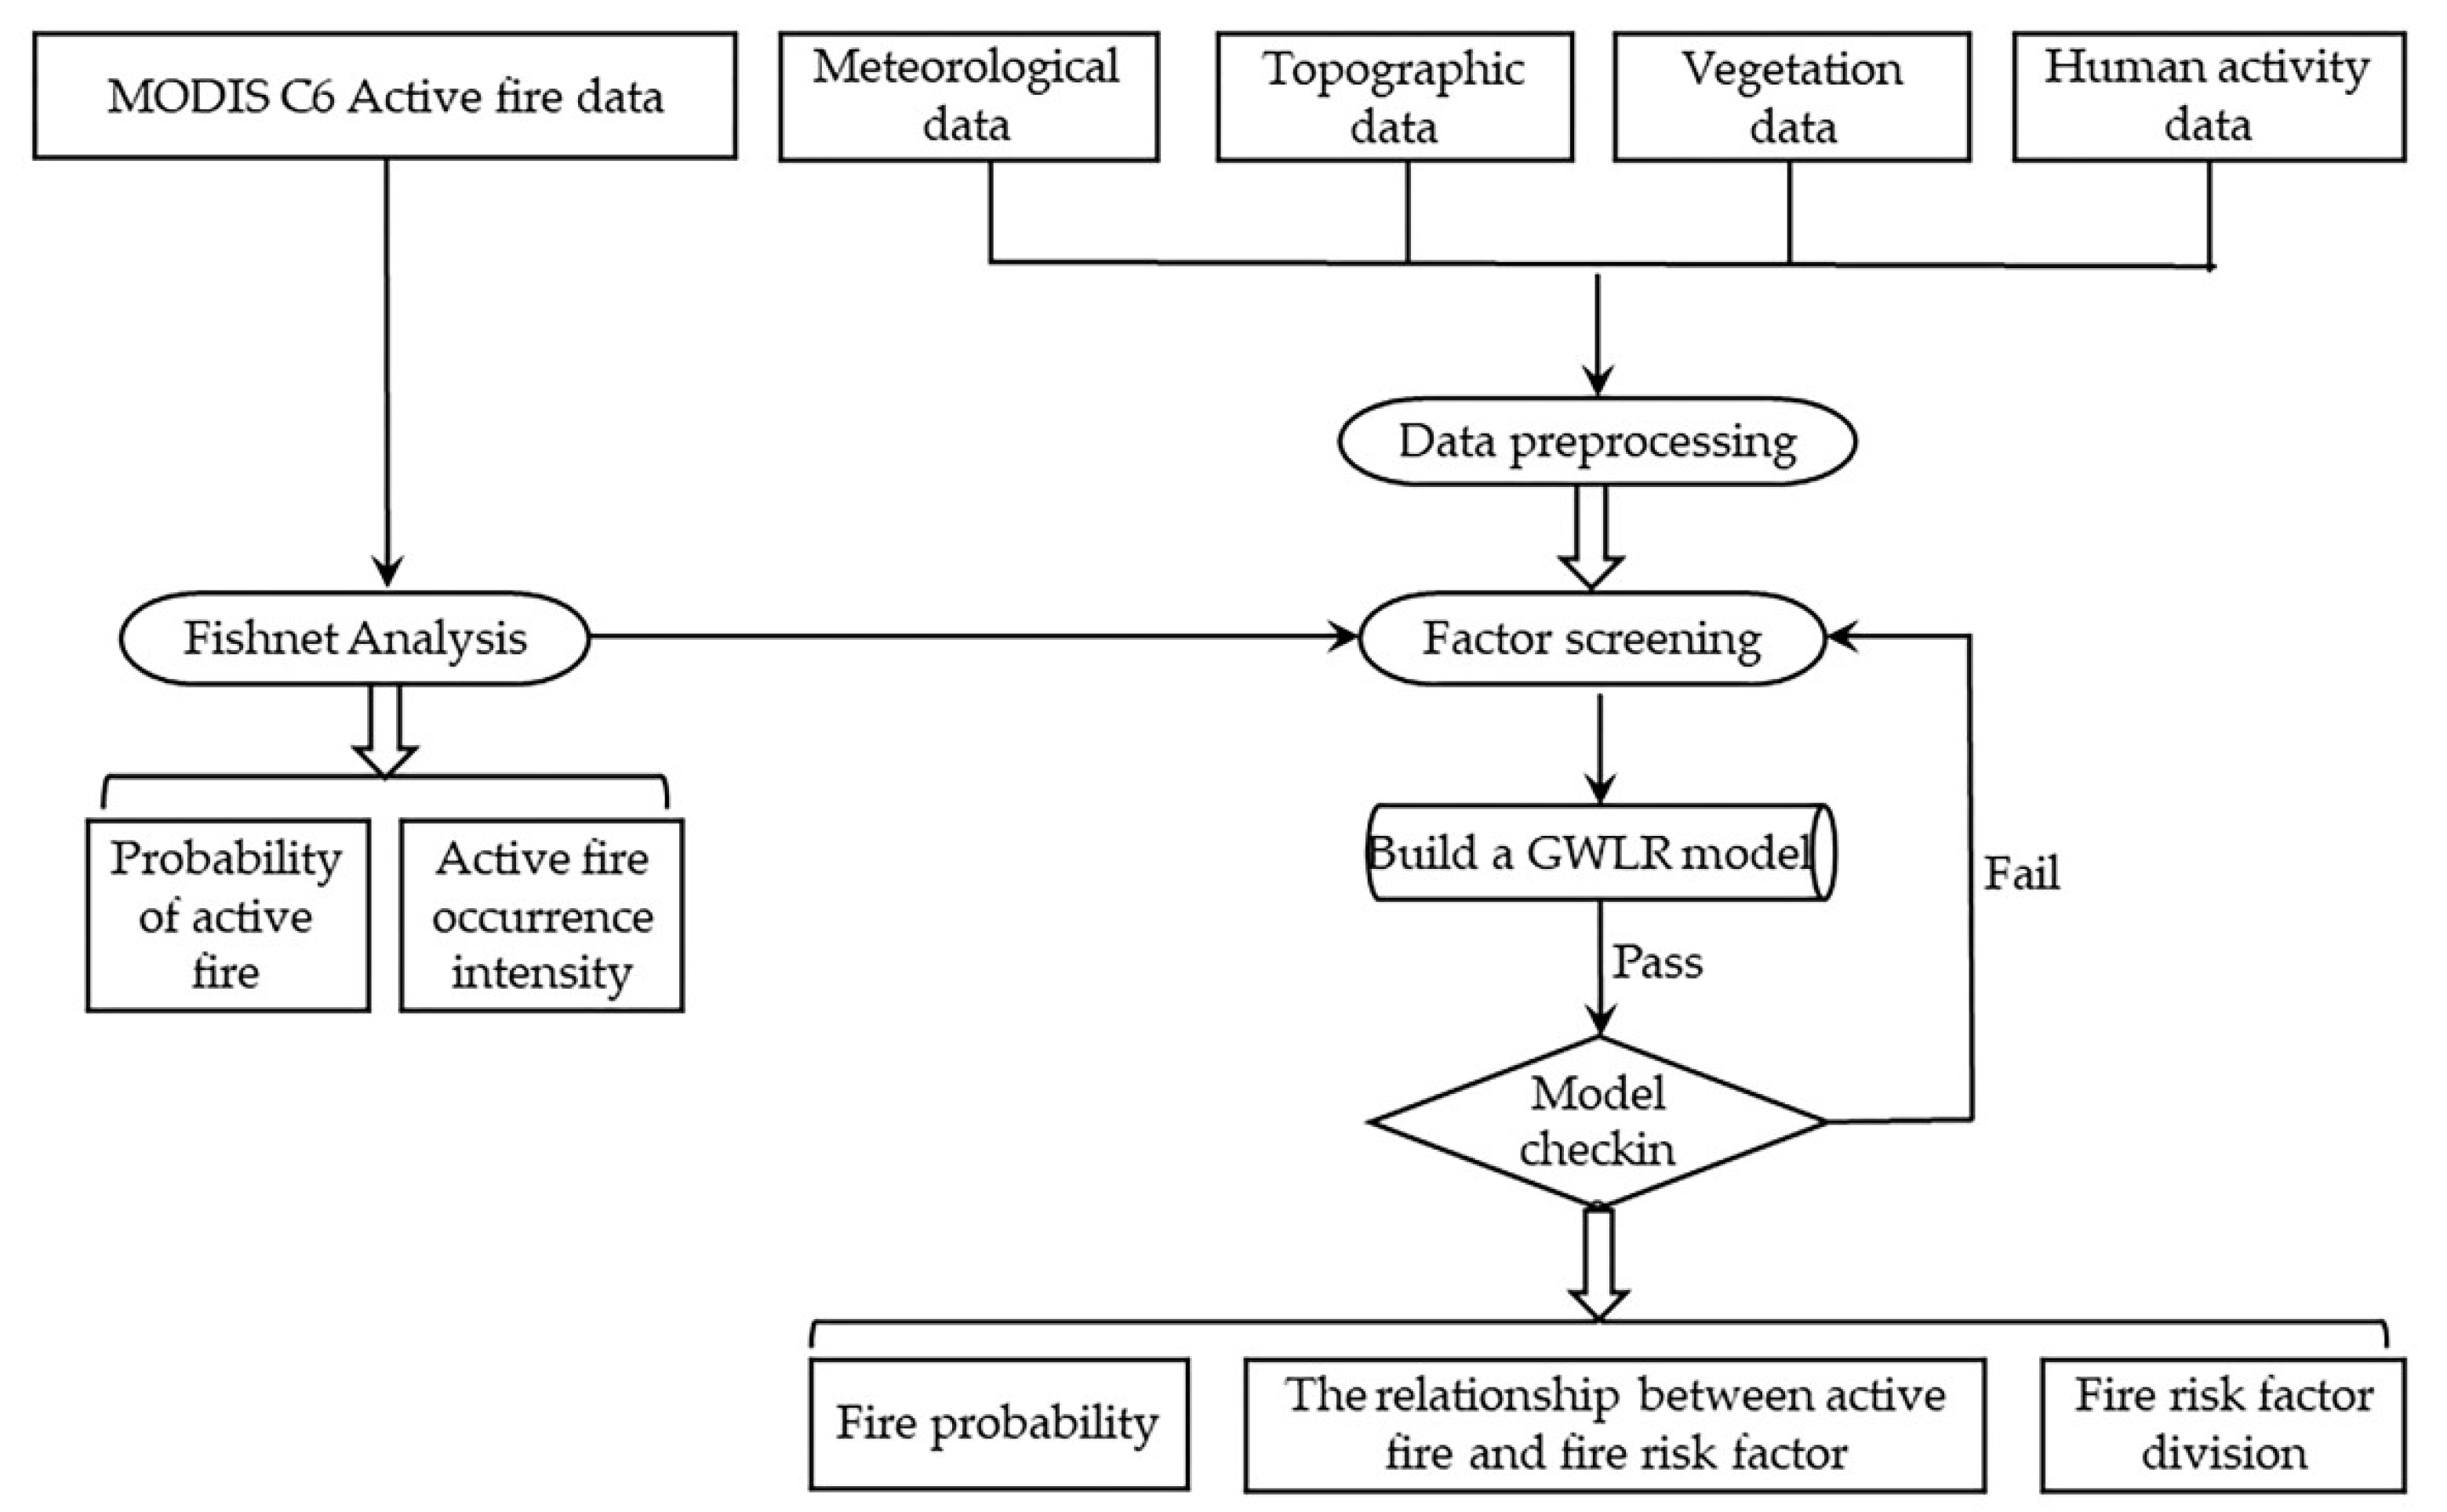
In this paper, the occurrence probability and intensity of active fires in the Chinese mainland from 2001 to 2018 were analyzed to reveal the temporal and spatial distribution characteristics of active fires with different probability and intensity levels, providing a research basis for future fire prevention work. The fire risk influencing factors are selected from the four aspects of meteorology, topography, vegetation, and human activities, and the relationship between active fire and each influencing factor is analyzed. Then, multiple linear tests are carried out, and the appropriate factors are selected to participate in the establishment of the GWLR fire risk assessment model. Finally, the modeling results are analyzed to obtain the fire risk probability and fire risk impact factor zoning in the Chinese mainland to explore the influence factors of active fires and put forward corresponding fire prevention suggestions.

2. Data Sources

The data used herein mainly include five types: active fire, meteorology, DEM, NDVI, and socioeconomic data (Table 1). Active fire data products were mainly obtained from NASA’s fire information resource management system (FIRMS). It has made certain progress in fire condition assessment [32]. This paper selected MODIS C6 active fire position vector data for subsequent analysis. The MODIS C6 data from 2001 to 2018 are mainly obtained by real-time observation of Terra and Aqua satellite sensors four times a day. Terra passes over the equator daily at approximately 10:30 AM and 10:30 PM (MLT) local time to obtain active fire information, with data acquisition starting in November 2000. Aqua (EOS PM) passes by the equator at about 1:30 PM and 1:30 AM (MLT) to obtain active fire information, with data acquisition starting in July 2002. The coverage is global, the spatial resolution is 1 km, and the coordinate system is WGS 84. Although there are VIIRS V1 data, which are mainly passed by the VIIRS sensor mounted on the S-NPP satellite near the equator with a higher spatial resolution (375 m), they are a shorter time series (2012 to date) that cannot meet the research needs [33,34]. Therefore, they were not considered.
In the research on the influencing factors of active fires in the Chinese mainland, many factors affect the occurrence and spread of active fire, and the relationship between each factor is complex. Referring to relevant studies [35,36,37,38,39], nine indicators including temperature (QW), precipitation (JS), surface temperature (LST), elevation (GC), slope (PD), normalized vegetation index (NDVI), distance to the nearest path (DL), population density (POP), and GDP were selected as fire risk impact factors from four aspects: meteorology, topography, vegetation, and human activities. The sources and main purposes of the above data, which all have a spatial resolution of 1 km, can be found in Table 1.
The data processing are as follows: (1) The annual average temperature spatial interpolation dataset, China annual vegetation index (NDVI) spatial distribution dataset, China GDP spatial distribution kilometer grid dataset, and China population spatial distribution kilometer grid dataset are used to calculate the average value of 2000–2018 through the grid calculator in ArcGIS and to obtain the QW, GDP, and POP factors. (2) The DL factor is generated by calculating the Euclidean distance from the road spatial distribution data. (3) The GC factor is obtained from the national DEM data, and then the PD factor is generated by the ArcGIS slope calculation. JS and LST factors are calculated by ArcGIS from the monthly precipitation dataset in China and the surface temperature dataset in China. Finally, the raster data of all factors were projected and reclassified. The projection is “China Lambert Conformal Conic”.

3. Methodology

3.1. Spatial Statistical Analysis

3.1.1. Spatial Statistical Analysis Based on GIS Fishing Net

A grid of 1 km × 1 km was created using ArcGIS fishnet analysis tools in the Chinese mainland to calculate the probability and intensity of active fires in each grid. In this paper, Lambert projection was used to create a kilometer grid (projection coordinate is China North Lambert Conformal Conic, linear unit: m), and the grid that had more than one active fire event was defined as a “fire zone”; otherwise, it was “fire-free areas”. It was calculated that from 2001 to 2018, the total number of grids in “fire areas” in the Chinese mainland was 805,100, accounting for about 10.13% of the total area, and “fire-free areas” accounted for 89.87%.

3.1.2. Probability of Active Fire

The occurrence probability of active fire in the Chinese mainland from 2001 to 2018 refers to the proportion of the number of years in which active fire events occurred in a grid to the total number of years, which indicates the probability of active fires in each grid [40]. The formula is defined as:
P i = X 18  
where Pi represents the occurrence probability of active fire in a single grid, and X represents the year count of fire jumping events in each grid (X = 0, 1, ..., 18). For example, if there is only one active fire in a grid from 2001 to 2018, P1 = 1/18. According to the above results, the 18 occurrence probabilities were graded (Table 2) and divided into 3 groups according to the average principle: low-probability group, medium-probability group, and high-probability group.

3.1.3. Occurrence Intensity of the Active Fires

The occurrence intensity is used to represent the possible occurrence frequency of active fires in different grids each year, which reflects the possibility and possible frequency of active fires in each grid [40]. The formula is as follows:
I = F / X
where I represents the occurrence intensity of the active fire in a single grid, F refers to the cumulative occurrence frequency of active fire in the grid, and X represents the number of years in which an active fire occurred in a single grid from 2001 to 2018.
The intensity of active fire varies from 1 to 201 and is distributed discontinuously. To facilitate analysis, the number of corresponding grids was counted, and the occurrences (number, ten, hundred, etc.) in the intensity range were classified. For example, the total number of grids with 19 times/a is two digits, so grading was conducted with 19 as the discontinuous point to obtain a 6-level intensity of 20~201 times/a. Since the number of grids for once or twice/a was too large, it was divided into one grade separately so that the intensity of active fire occurrence was divided into 6 grades (Table 3).

3.2. Mathematical Analysis

3.2.1. Multiple Linearity Test

Before establishing the GWLR fire risk assessment model, it was necessary to conduct a multilinearity test on the fire risk impact factors that participate in the establishment of the model. According to the multilinearity test results, the qualified fire risk impact factors will participate in the establishment of the model. When exploring the relationship between their respective variables (fire risk impact factors) and dependent variables (whether there is a live fire jump event), the respective variables should be independent of each other, and then we can determine which independent variables have a significant impact on the dependent variables through the GWLR model regression analysis. However, when there is multiple linear regression between independent variables, it is indicated that there is a strong linear relationship between factors. Owing to some of the independent variables that can be approximately characterized by the linear function of other independent variables, which may make the standard error of the regression coefficient too large and seriously affect the fitting of the model, the accuracy of the model and results are thereby reduced.
Before the multivariate test, the participating factors should be standardized. Additionally, several evaluating indicators will help to judge whether there is multicollinearity, such as tolerance, variance inflation factor (VIF), eigenvalue, and condition index [41]. In this study, the VIF was used for multiple linearity tests. The tolerance factor is calculated as follows:
T O L = 1 R i 2
where Ri is the decisive coefficient of the linear regression model. Multicollinearity among independent variables is significant if TOL < 0.1. VIF is the inverse of TOL and is the ratio coefficient for estimating the variance of the regression coefficients when the independent variables are collinear and non-collinear. The greater the value of VIF, the greater the intensity of multicollinearity between independent variables. When 0 < VIF < 10, it indicates that there is no multicollinearity between independent variables; when 10 < VIF < 100, it indicates that there is strong multicollinearity among independent variables; when VIF > 100, it indicates that there is severe multicollinearity among the independent variables.

3.2.2. GWLR Fire Risk Assessment Model

Geographic weighted logistic regression (GWLR) is a type of geographically weighted regression model when y is binary. It is an extension of the binary logistic regression (BLR) model, which incorporates the geographic location of the data and makes the regression parameters a function of the geographic location of the observation point [42,43], namely:
y = e [ β 0 u i , v i + j = 1 k β k u i , v i x i j + ε ] 1 + e [ β 0 u i , v i + j = 1 k β k u i , v i x i j + ε ]
where y is whether an active fire event occurs in the dependent variable, xij is the observed value of the independent variable, β0 is the constant term of the regression equation, (ui, vi) is the spatial geographic location coordinate of the ith sampling point (as a geographic weight), βk (ui, vi) is the kth regression parameter on the ith sampling point, which is a function of geographic location, and ε is a random error term.
The method of establishing the GWLR model is to first obtain the bandwidth of each spatial weight function of the training samples in turn and select the optimal weight function by selecting specific criteria to determine the optimal bandwidth. Commonly used weight functions include the distance threshold method, the Gaussian function method, and the bi-square function method [42,43]. Among them, the different bandwidths of the Gaussian function method and the double square function method have a great influence on the modeling results, and the appropriate weight function can be selected through the optimal bandwidth. The methods to determine the bandwidth primarily involve cross-validation (CV), AIC criteria, AICC criteria, and so on. In this paper, the AIC and AICC values of the adaptive Gaussian function method, fixed Gaussian weight function method, adaptive double square function method, and fixed double square function method were calculated, respectively, and the optimal bandwidth and the final weight function of the model were selected and determined by utilizing AIC and AICC minimization criteria to establish the GWLR fire risk assessment mod.
The technical flow chart of this paper is shown in Figure 1.

4. Results

4.1. Distribution Characteristics of Active Fires in China

From 2001 to 2018, the total number of active fires in the Chinese mainland was 1.6525 million, and the average yearly frequency of active fires in 18 years was 91,800. In terms of period, first of all, there are great differences in the number of active fires in separate years. The highest year was 2014 with 150,500, accounting for 9.11% of the total number of active fires, and the lowest year was 2001 with 24,900, accounting for 1.51% of the total number. The peak year is about six times that of the lowest year. Moreover, it can be seen that the years of active fire are mainly concentrated in 2013–2015 (Figure 2), which are the years of the super El Niño. Secondly, the number of active fires varies in different months, mainly from February to April and October, which is during the Chinese New Year and National Day holidays. These four months account for 51.46% of the total. The highest month in March (250,900) is 3.72 times that of the lowest month in September (67,400).

4.2. Probability of Active Fire in China

The total number of fishing nets in the “fire zone” was 805,100, accounting for about 10.13% of the total area in the Chinese mainland. Among them, the number of grids with only one active fire event was 528,400, accounting for 65.63% of the total.
From the perspective of spatial distribution, the percentage of “fire areas” in each province’s total area is different (Figure 3). The largest percentage is Guangdong province, where the percentage of “fire areas” is as high as 35.36%. The area percentage of “fire areas” in the Tibet Autonomous Region is the smallest, at only 0.22%. The proportion of “fire areas” in Guangdong province is about 161 times that of the Tibet Autonomous Region. Through the natural breakpoint method, the percentage of “fire areas” in each province is divided into five grades. According to the four major geographical divisions in the country, the Qinghai–Tibet region and the northwest region have relatively small “fire areas”, and the percentage of “fire areas” is less than 5.4%, while the “fire areas” in the northern and southern regions account for less than 5.4%. The percentage increases gradually with the inland to the coastal areas, and the provinces with larger percentages are Guangdong, Heilongjiang, Guangxi, and Tianjin. The four provinces have differences in climate conditions, landforms, vegetation, and population density. Guangxi, Guangdong, and Heilongjiang provinces are rich in forest resources and are high-risk areas of forest fires. With the development of industrial infrastructure in Tianjin, the industrial area is also expanding in disorder and developing inappropriately, and industrial heat sources are increasing, which increases the risk of industrial fire. Industrial fire is the most frequent and harmful type of fire in Tianjin [16]. There are significant differences in the distribution of “fire-free areas” in China, among which the “fire-free areas” in the western region account for a vast area. The “fire zone” is dispersed, while the “fire-free areas” in the eastern region are comparatively few, which are spatially alternating with the “fire zone”.
From the point of view of occurrence probability, there are significant differences in the time and space distribution of “fire zones”. Active fires are mainly low probability, and the middle probability and high probability are close to 0 (Figure 4). The low-probability group accounted for 99.11% of the total number of grids in the “fire zone”, of which the grids with only one active fire event in 18 years accounted for 65.63%, and the grids with an occurrence probability of 1/18~3/18 accounted for the low probability. The majority of the probability group is 95.16%. The grid decreases with the increase in the probability of occurrence, and the grid with probability 17/18 has the least number at only 51. The low-probability grids are widely distributed and distributed in every province, but the number of grids in each province varies greatly. The medium-probability grids are distributed in the dense areas of the low-probability grids, and the high-probability grids are in the center of the medium-probability grids, advancing layer by layer (Figure 5).
As there are many provinces in China, there are many active fires in the eastern region based on the geographical location and the distribution of active fires. Consequently, Heilongjiang, Shandong, Fujian, and Guangxi provinces are selected from north to south, and then Henan and Qinghai provinces are selected from coastal to inland. Eventually, Heilongjiang, Guangxi, Henan, Shandong, Fujian, and Qinghai provinces are selected to specifically analyze the occurrence probability of active fires (Figure 6.). In terms of the proportion of grids with a probability of 1/18~3/18 in the low-probability group, Fujian province is the highest with 97.20% and Shandong province is the lowest with 92.25%, but both are close to 95.16% in the highest continent, and the amount difference is not significant. At the same time, it also reveals that the active fires in the low-probability group are widespread in the Chinese mainland, and the number of related grids decreases with the increase in occurrence probability. Among them, Qinghai province has the least high-probability group, which is almost zero.

4.3. Intensity of Active Fires in China

According to the statistics on the intensity of active fires from 2001 to 2018 (Table 4), the intensity of active fires ranges from 1 to 201 times/a, and an average of 201 active fire events have occurred every year in some regions in 18 years. The active fire intensity is mainly Grade 1, followed by Grade 2, and the sum of them reaches 98.62%, indicating that there are 794,000 km2 areas with active fire events occurring once or twice a year. The proportion of grids with Grades 3 to 4 intensities decreased sharply compared to Grades 1 and 2, and active fires occurred three to seven times a year, and the sum of the two accounted for only 1.32%. The last 5–6 intensity accounts for the smallest proportion, which is 0.07% (approximately 517 km2), of which the number of domestic fires in the area with Level 6 intensity (approximately 133 km2) is higher than 20 times a year, and fires occur frequently.
From the selected provinces, the proportion of the occurrence intensity groups in each province shows a significant downward trend with the increase in the intensity level, with Level 1 as the main, followed by Level 2, and the lowest Level 6. The fluctuation range of each province was about the proportion of the Chinese mainland. The provinces with the sum of 1–2 grid proportions from high to low are Guangxi (99.17%), Henan (99.05%), Fujian (98.96%), Shandong (98.46%), Heilongjiang (98.32%), and Qinghai (97.88%). Although more than 90% of the grids only have one to two active fires every year, if one-tenth of the grids are concentrated in a certain year, the total frequency will be as high as 89,500; this is 2.60 times higher than the total frequency in 2001, which shows that 90% of the active fires have a small intensity but a serious impact.
The intensity of active fire occurrence is unevenly distributed in space. The first-level intensity grids are spread across mainland China, and the second-level intensity grids are relatively scattered and are alternately distributed with the first-level intensity grids (Figure 7). The number of Grade 3–4 strength grids is small, but it is generally adjacent to Grade 2 grids distributed centrally. The number of Level 5–6 grids is minimal compared to Level 1–4, but most of them are distributed in the concentration points of other intensity grids, that is to say, the active fire intensity steadily decreases from the center to the periphery. In particular, the distribution of the Level 6 grid is similar to the probability of active fire, which is not distributed in many provinces, and the distribution is relatively scattered.
To more intuitively reflect the relationship between the occurrence probability and intensity of the fire, the proportion of its intensity is compared (Figure 8). In terms of occurrence intensity, the occurrence probability of grids with Grade 1 intensity is also low, mainly concentrated in the middle- and low-probability groups, and shows a decreasing trend with the increase in probability (with a few exceptions); Grade 2 intensity shows an inverted U-shaped curve, and the occurrence probability is 8/18 to 12/18, accounting for the largest proportion. Level 3–6 intensity is mainly concentrated in the categories with a high probability of occurrence from 11/18 to 18/18 and increases with the increase in probability. From the point of occurrence probability, over 70% of the grids in the low-probability group are Grade 1 intensity, followed by Grade 2 intensity, and other intensities account for very little. In the middle-probability group, the overall intensity was Grade 2, the intensity of Grade 1 gradually decreased, and the intensity of Grade 3 gradually increased. The number of grids of intensity 4–6 in the low-probability group and the medium-probability group is relatively small. Although the high-probability group grid covers all intensities, it is still mainly 2–3 intensities.

4.4. Relationship between Active Fire and Fire Risk Factors

4.4.1. Relationship between Active Fire and Meteorological Factors

Meteorological factors play an important role in the occurrence and spread of fire. They affect the moisture content of combustibles, and temperature is the key factor affecting the occurrence of active fire. The effect of temperature on active fire is significant. The high temperature will accelerate the evaporation of water and the drying of combustibles, which will easily cause fire and make the fire more violent [44]. Active fires in the Chinese mainland principally occur in the area of 14~19 °C (Figure 9a), which shows that the active fires are mainly concentrated in spring and autumn, which is similar to the monthly statistics of active fires (mainly distributed in February–April and October). The number of active fires in the areas with an annual average temperature of −11~−1 °C and 24~28 °C is less distributed. Above 24 °C and below −1 °C correspond to summer and winter, respectively, with more rainfall in summer and high vegetation humidity. In winter, the temperature is low, and it is not easy for active fire events to occur. Precipitation has a direct impact on vegetation moisture content and ground dryness, which affects the severity of fires. In areas with more precipitation, vegetation and other combustibles are easier to grow, but if there is too much precipitation, the moisture content of combustibles will increase and the probability of burning will decrease. The number of active fires in the Chinese mainland is concentrated in the area with precipitation of 400~800 mm. The precipitation in this area not only satisfies the existence of combustibles, but the water content of combustibles also meets the fire standard (Figure 9b). From the perspective of surface temperature, active fires are predominantly distributed in the area where the land surface temperature (LST) is 15~20 °C. When LST is lower than 20 °C, the number of active fires is positively correlated with LST, that is, the larger the LST, the more active fires. The number of active fires was negatively correlated with the LST when the LST was greater than 20 °C (Figure 9c).

4.4.2. Relationship between Active Fires and Topographic Factors

Topographic factors can directly affect the occurrence and spread of active fires by altering local microclimates and airflow. Elevation not only affects the climate, but also affects the zonal distribution of vegetation, which indirectly affects the occurrence of active fires. With the increase in altitude, the temperature gradually decreases, and there are less vegetation and combustibles; thus, it is not easy to cause a fire. The slope affects the speed and direction of fire spread, and the steeper the slope, the faster the fire spread [45]. Active fire spots in the Chinese mainland are mostly concentrated in areas with an altitude of 1000–3000 m and a slope of <15°. These areas have flat terrain and many combustible substances, an environment in which it is straightforward to cause fires (Figure 10).

4.4.3. Relationship between Active Fires and Vegetation Factors

The prerequisite for the occurrence of active fires is combustibles, and the quantity and nature of combustibles can be reflected by the normalized vegetation index. The lower the NDVI value, the less combustible materials and the less difficult to burn [39]. There is a positive correlation between active fires and NDVI values in the Chinese mainland. With the increase in the normalized vegetation index, the combustibles increase, and the greater the possibility of active fires, the more the number, which mainly occur in the areas with NDVI > 0.6 (Figure 11).

4.4.4. Relationship between Active Fires and Human Activity Factors

The sources of active fires are mainly divided into two categories: natural causes and man-made causes. Man-made causes are the main inducing factors of active fires at present. Man-made fire sources are mainly productive (“refining mountains”, straw burning, etc.) and non-productive (going to the grave, smoking, etc.). Hence, it is necessary to strengthen control and management [46]. This paper selects the distance from the road, population density, and GDP as human activity factors that affect the occurrence of active fires.
The number of active fires in the Chinese mainland is significantly negatively correlated with the distance from the road, population density, and GDP. The farther away from the road, the higher the population density, and the greater the GDP, the less the number of active fires. In scenarios on the contrary, the number of active fires is greater. There is an obvious negative correlation between the number of active fires and the distance from the road. The farther away from the road, the less the number of active fires. The farther away from the road, the fewer human activities, so the less likely an active fire will occur. Regions with a higher population density and higher GDP have a more developed economy, better fire prevention measures, and faster fire extinguishing, so the number of active fires is smaller.
Specifically, the number of active fires is mostly concentrated in areas with a distance of <60 km from the road, an average population density of <1200 people /km2, and a GDP of <30 million yuan/km2 (Figure 12).

4.5. Fire risk Assessment Model

4.5.1. Establishment of GWLR Model

Owing to the vast area of the Chinese mainland and the limited processing capacity of the GWR 4 software, random sampling of training samples was selected. The equal amounts of fire points and non-fire points (998 in total) were used as 60% of the total sample points to participate in fire modeling, and the remaining 40% (664) of them were used as test samples for model validation [11].
To judge the results of the collinearity test of fire risk factors, the significant collinearity between the surface temperature factor and the temperature factor, the population density factor, and the GDP factor, the surface temperature factor, the population density factor, and the GDP factor were combined. Three factors were not involved in GWLR model modeling. The final factors involved in modeling are shown in Table 4. From the collinearity diagnosis results of the selected factors (Table 5), the VIF values of temperature, precipitation, elevation, slope, normalized vegetation index, and distance from the road are 4.434, 4.162, 3.224, 1.448, 2.692, 1.514. The VIF value of each fire risk factor is below 5, indicating that there is no multicollinearity among the independent variables. The VIF value of temperature is the largest, which is only 4.434, so these six factors can all participate in the establishment of the GWLR model.
This paper uses GWR 4 software to determine the bandwidth based on the principle of AICC minimization and finally selects the adaptive Gaussian function method. The optimal bandwidth of this model is 73. The GWLR fire risk model is established as follows:
y = e 5.352 + 3.681 x 1 3.003 x 2 3.180 x 3 3.243 x 4 + 5.514 x 5 1.558 x 6 1 + e 5.352 + 3.681 x 1 3.003 x 2 3.180 x 3 3.243 x 4 + 5.514 x 5 1.558 x 6
The variables in the equation and their statistical values are as follows (Table 6).

4.5.2. Model Evaluation

The receiver operating characteristic curve (ROC) is also called the receptivity curve. The abscissa of the curve represents the variable specificity and the ordinate represents the sensitivity. This paper analyzes the prediction probability (PRE) as a test variable and sets “whether an active fire event occurs” as a state variable. The value 1 represents the positive class (active fire occurs), while 0 represents the negative class (active fire does not occur). The area under the ROC curve (AUC) is used to test the model’s ability to distinguish active fire spots [47]. The AUC value is between 0.5 and 0.7, indicating that the model’s distinguishing ability is poor. If the AUC value is between 0.7 and 0.9, this indicates that the model has good discrimination ability. If the AUC value is higher than 0.9, this means that the discrimination ability is excellent.
In this paper, SPSS software was used to calculate the AUC value by using 664 test samples. The area under the ROC curve is 0.844. It is between 0.7 and 0.9, indicating that the GWLR model can better distinguish the ignition point and non-ignition point with a good fitting effect (Figure 13), and the modeling formula is feasible.

4.5.3. Classification of Fire Risk Probability

Using the GWLR modeling constructed herein, the normalized fire risk influencing factor data was subjected to layer operation to obtain a fire risk probability diagram (Figure 14). According to the classification of fire risk probability, the Chinese mainland area is divided into five areas: extremely high fire risk area, high fire risk area, medium fire risk area, low fire risk area, and extremely low fire risk area (Table 7), and the fire risk level chart (Figure 15) is obtained. The percentage of active fires in each fire risk area and the total area of mainland China are counted (Table 7).
Matching the number of active fires in the Chinese mainland with fire risk areas, it is found that active fires are mainly distributed in high fire risk areas, accounting for 62.70%, followed by the medium fire risk area and the extremely high fire risk area; the total of the three is as high as 93.56%. The proportion of extremely low and low fire risk areas is only 6.44%, indicating that the GWLR model has a good fit.
From the area of fire risk zoning, extremely low fire risk areas account for the largest proportion, accounting for 46.91% of the total area of the Chinese mainland. They are mainly distributed on the northwest side of the Hu line (Heihe–Tengchong Line). The area is characterized by high terrain and sparse vegetation. Correspondingly, the function of economic development and population distribution is weak, meaning that fires hardly occur. The total proportion of extremely low, low, and medium risk areas is 67.13%, which is similar to 65.63% of the grid in the Chinese mainland, where only one active fire event has occurred. The middle- and high-risk areas are mainly distributed in the area east of the Hu Line. This area has a relatively large population, flat terrain, and a relatively developed economy, and its fertile land and abundant water resources are conducive to the development of the planting industry and forest growth; thus, it is prone to fire. Extremely high fire risk areas account for 5.19% of the total area of the Chinese mainland, mainly distributed in the North China Plain, the middle and lower reaches of the Yangtze River Plain, and the low-lying areas of Guangxi. From the coast to the inland and from the southeast to the northwest, the probability of fire danger gradually decreases, and the transition from the extremely high-risk area to the extremely low-risk area in turn.
The risk probability of fire in the Chinese mainland area and the influencing factors of active fire are analyzed. It is revealed that active fire is easy to occur in areas with low altitude, fertile land, and abundant water resources in spring and autumn. Active fires are mainly affected by both temperature and precipitation. The highest number of active fires is not in summer when the heat is unbearable with the precipitation is concentrated, but in spring and autumn, which proves that the number of active fires in the Chinese mainland is concentrated in February–April and October.
Nationwide, active fires are mainly distributed to the east of the Hu line, that is, the Northeast Plain and the south; they are rarely distributed in tablelands, hills, and low mountain areas, and almost no active fires occur in high mountain areas. Areas with lower slopes and higher vegetation cover are more likely to have active fires. The main reasons are that the plain area has a gentle slope, flat terrain, abundant rainfall, a large proportion of artificial young and middle-aged forests and high-fat trees in the forest types, as well as a large population density in the plain area, which increases the possibility of fire [11]. However, in urban areas, where the population is concentrated, the environment changes greatly, and there are more or less some fire prevention measures in cities or rural areas. The probability of active fire in urban areas with large population densities is low (Figure 14).
From the specific analysis of human activities, there are north–south differences in active fire production. The differences in climate conditions, forest vegetation, natural resources, and other aspects between the northern and southern regions lead to huge differences in people’s living habits. The northern provinces see mainly open-air burning of straw, with the peak period mainly concentrated in March to April and October. A large amount of CO2 produced by the burning of straw accelerates the rise of the surrounding temperature, leading to the occurrence of active fires. The southern region is rich in forest resources and high in vegetation coverage, which is prone to forest fires. In addition, there is a tradition of “burning the mountain” in most areas of the south. This activity mainly refers to the thorough clearing of logging residues, attachments, and weeds on the ground by burning, and then preparing the land for afforestation, so as to regulate the forest land and save labor and effort. Most of these activities are concentrated in February and March of each year (Lantern Festival), with the result that active fires occur in spring [48].
In particular, the number of active fires surged in the super El Niño years (2013–2015), which is a special factor affecting the number of active fires. El Niño is an important factor affecting the global atmospheric terrestrial ecosystem. It will cause temperature rise and continuous drought, resulting in the decline of regional precipitation, thus making the active fires in forests and farmland more serious [40].

4.5.4. Spatial Distribution of Fire Risk Influencing Factors and Fire Risk Zoning

Judging from the coefficients of the fire risk assessment factors of the GWLR model (Table 6), when the coefficient value is greater than one, it means that the factor influences the occurrence of fire. The impact of the normalized vegetation index, temperature, altitude, slope, precipitation, and distance from the road on the occurrence of active fires showed significant changes in space. Referring to Matthews’ local coefficient mapping method [49], the coefficient value of the prediction factor is between −1.96 and 1.96, which indicates that the influence of this factor in these areas is not obvious; thus, it is not displayed on the coefficient diagram. If the coefficient value of the predictor is 1.96 or <−1.96, it means that this factor has a strong influence on the region. When drawing the regression coefficient diagram, only the significant area (the area with a statistically significant impact on fire) is displayed, and the coefficient <0 is expressed in cold color, and the coefficient >0 is displayed in warm color. Because the significant area of precipitation and distance from the road factor is small, it is not shown here. Based on this, the spatial distribution map of the significant area of the fire risk influencing factor coefficients is obtained (Figure 16).
It can be seen from Figure 16a that NDVI has the greatest impact on active fire, with an area of 67.30%. With the exception of some high-lying areas in Northwest China, other areas are affected by NDVI. The impact of temperature on active fire is smaller than that of NDVI, but it covers a larger area, accounting for 77.31% of the Chinese mainland area. Except for the Qinghai–Tibet Plateau and the Great Khingan Mountains, it is distributed in other regions (Figure 16b). The impact of elevation on active fire is mainly concentrated in the Qinghai–Tibet Plateau (Figure 16c), while the impact of slope on active fire is mainly distributed around the elevation factor (Figure 16d).
Through ArcGIS overlay analysis, the normalized vegetation index, temperature, elevation, and slope were calculated by grid overlay to generate the zoning map of fire risk impact factors (Figure 17). The Chinese mainland area is divided into eight impact types. From the perspective of spatial distribution, Class a areas are concentrated in the east of Hu Line, with the largest area, accounting for 62.34%. The occurrence of active fires is mainly affected by temperature and NDVI. The Class b area is mainly distributed in the desert areas of China, which is consistent with the division of deserts in China, accounting for 22.5% of the total area. The main influencing factor of active fires is temperature. The Class c areas are mainly distributed in the Daxing’an Mountains and the eastern part of the Qinghai–Tibet Plateau, where the altitude is relatively low, accounting for 11.2% of the total area. The main influencing factor of active fires is NDVI. The Class d area is mainly distributed in the western Qinghai–Tibet Plateau, and the main influencing factor of active fire is elevation. The Class e, f, and g regions have small spatial distribution areas, mainly areas with high altitudes and large slopes.

5. Discussion

First of all, this study presents the spatial distribution characteristics of active fires in the Chinese mainland from 2001 to 2018 at different time scales (such as annual scale and monthly scale). The time distribution characteristics of active fires indicate that the number of active fires varies greatly in different years. The years of active fires are mainly concentrated in 2013–2015, which are the super El Niño years. El Niño is an important influencing factor in the global atmospheric terrestrial ecosystem. It will cause temperature rise and continuous drought, lead to regional precipitation reduction and the increase in land water storage capacity, and further aggravate the occurrence of active fires in forests and farmland [40]. The number of active fires varies in different months, mainly from February to April and October. Due to the changeable and windy weather, there are many combustibles in this period, and combustibles and waste plastic from branches are naturally piled up, making it very easy to cause fires due to the careless use of open fires. In addition, this period coincides with the Chinese New Year and National Day holidays, with frequent human activities and more man-made fires.
Additionally, taking the Chinese mainland as the whole research area, the temporal and spatial variation characteristics of various fire types, the temporal and spatial distribution of occurrence probability and intensity, and the influence factors are analyzed and discussed from shallow to deep. As a developing country with the largest population in the world, it has a vast territory with complex and diverse landforms, climate types, and vegetation types. For instance, the climate is relatively dry in the north and wet in the south. The climate is dominated by the East Asian monsoon in East China, where the summer is wet and hot while winter is dry and cold [50]. It is known that about 75% of the land areas of China are covered by different vegetation types, mainly including forests, savannas, croplands, and grasslands [51]. Therefore, it is reasonable and appropriate to take the Chinese mainland as the research area. On the one hand, it can provide a reference for relevant international research. On the other hand, it is helpful for the planning and implementation of fire risk-related policies. In addition, most scholars devote themselves to the study of a certain type of fire. For instance, Ma et al. [52] used a random forest algorithm to analyze and study forest fires in China; Mohammadi et al. [53] took Iran as an example and studied the modeling of forest fire hazard areas based on the methods of logistic regression and GIS. Moreover, more attention is paid to some areas with high fire incidences, such as Li et al.’s [54] analysis and research on the 16-year forest fire risk of typical subtropical regions in Zhejiang province. Therefore, there may be some problems, such as insufficient attention to the overall situation of active fires and insufficient overall grasp. This study also shows and analyzes the typical provinces of active fire in the Chinese mainland (Heilongjiang, Guangxi, Henan, Shandong, Fujian, and Qinghai). The results showed that the dynamic changes in the frequency and intensity of active fires in the above provinces were similar to those in the Chinese mainland as a whole. At the same time, Zhang et al. [55] used MODISC6 data from 2001 to 2019 and VIIRS V1 data from 2012 to 2019 to analyze the spatiotemporal characteristics of active fires in the Arctic region and establish a fire risk assessment model based on logistic regression. The results obtained from the two sets of active fire data are consistent, which further proves the scientificity of the research results in this paper. Chang et al. [56] used the data collected by from the Chinese Forestry Science Data Center to study the forest fires in Heilongjiang province from 1980 to 2009. Their research results are similar to the results of this study, which further explains the reliability of the results of this study.
The spatiotemporal distribution results of active fires further show that there are significant differences in the occurrence probability and intensity of active fires in various provinces of the Chinese mainland. This is because there is spatial heterogeneity in climatic conditions, topography, vegetation status, and population density in various regions. The slope of the plain is gentle, the terrain is flat, the precipitation is abundant, and among the forest types, the proportion of artificial young and middle-aged forests and high-fat tree species is large. It is easy to catch fire in arid and high-temperature environments, and the spread speed is fast, which increases the possibility of forest fires [11]. In addition, because of the large population density and frequent human activities in the plain area, fires occur very easily when smoking and burning wasteland, charcoal, graves, and paper in places with combustibles, and the fire is more difficult to extinguish due to the long rescue time.
In some northern provinces, straw burning in the open air is the leading cause of fire, especially in the three northeastern provinces. A large amount of CO2 generated by straw burning accelerates the rise of ambient temperature, leading to active fires [57]. The comprehensive utilization of straw resources in Northeast China is still in the primary extensive recycling stage. As the cost of returning straw to fields and leaving fields in Northeast China is higher compared to other regions, the rough treatment of open burning leads to an increase in the number of active fires. In addition, affected by snow cover, ground freezing, and other factors, the peak of active fire mainly occurs in March, April, and October. Heilongjiang province is located in the northeast of China, and there are many forest fires caused by lightning, agricultural fires, and outdoor smoking. Lightning fire is the most frequent and harmful fire source [56]. The southern region is rich in forest resources, high in vegetation coverage, and prone to forest fires. The provinces with the largest number of active fires in the south are Guangdong, Guangxi Zhuang Autonomous Region, and Jiangxi. Influenced by the tradition of “smelting mountains”, active fires are high in spring. The “Mountain Refining” activity is mainly carried out in February and March of each year (Lantern Festival), mainly to thoroughly clean up the cutting residues, attachments on the ground, and weeds, etc., by burning for afforestation, to achieve the goal of regulating the forest land at a low cost. Although many provinces in Southern China have successively promulgated the policy of forbidding mountain burning for afforestation, especially during the special forest fire prevention period, due to the deep-rooted traditional concept, the land preparation activities mainly based on “mountain burning” still occur frequently in forestry production [48]. In addition, Guangxi province has a subtropical humid monsoon climate with obvious dry and wet seasons. In the winter half year, it is mainly affected by the denatured polar continental air mass. The weather is cold, the humidity is low, and the temperature changes greatly, so forest fires occur easily [58]. Guangdong province is located in the coastal area of China, with a developed economy, high industrial level, and large population density. Due to many industrial heat sources, people use fire and electricity carelessly, which increases the possibility of fire.
Then, this study comprehensively explored the influencing factors of fire risk from four aspects: meteorology, topography, vegetation, and human activities. Based on the GWLR fire risk assessment model, this paper analyzes the fire risk influencing factors and their relationship in the Chinese mainland and draws the zoning map of fire risk influencing factors. When considering the influence factors of fire risk, the influence factors of human activities, such as distance to the nearest path, population density, and GDP, are considered and taken as important influence factors, which is also different from other literature. For example, Wang et al. [42] did not consider the population density and GDP factor data in the analysis due to their limited access. This may be the main reason for the difference between the results of this study and those of this paper. Wang et al. [44] reported that the frequency of active fires in Gansu province has an obvious negative correlation with the distance to the nearest path. The fire spots are concentrated in areas 0–20 km away from the road. However, we found that the number of active fires in the Chinese mainland is mostly concentrated in the area <60 km away from the road. Of course, differences in research scales may also lead to different research results. Tian et al. [44] studied the spatiotemporal distribution characteristics of forest fires in China from 2008 to 2012 and found that most forest fires occurred in spring (83%), with the highest incidence in March (60.0%), which is consistent with the results of this study. In short, compared with previous relevant studies, we have selected more comprehensive risk fire influencing factors. The multilinearity test not only improves the reliability of the GWLR fire risk assessment model but also makes the research results more reasonable.
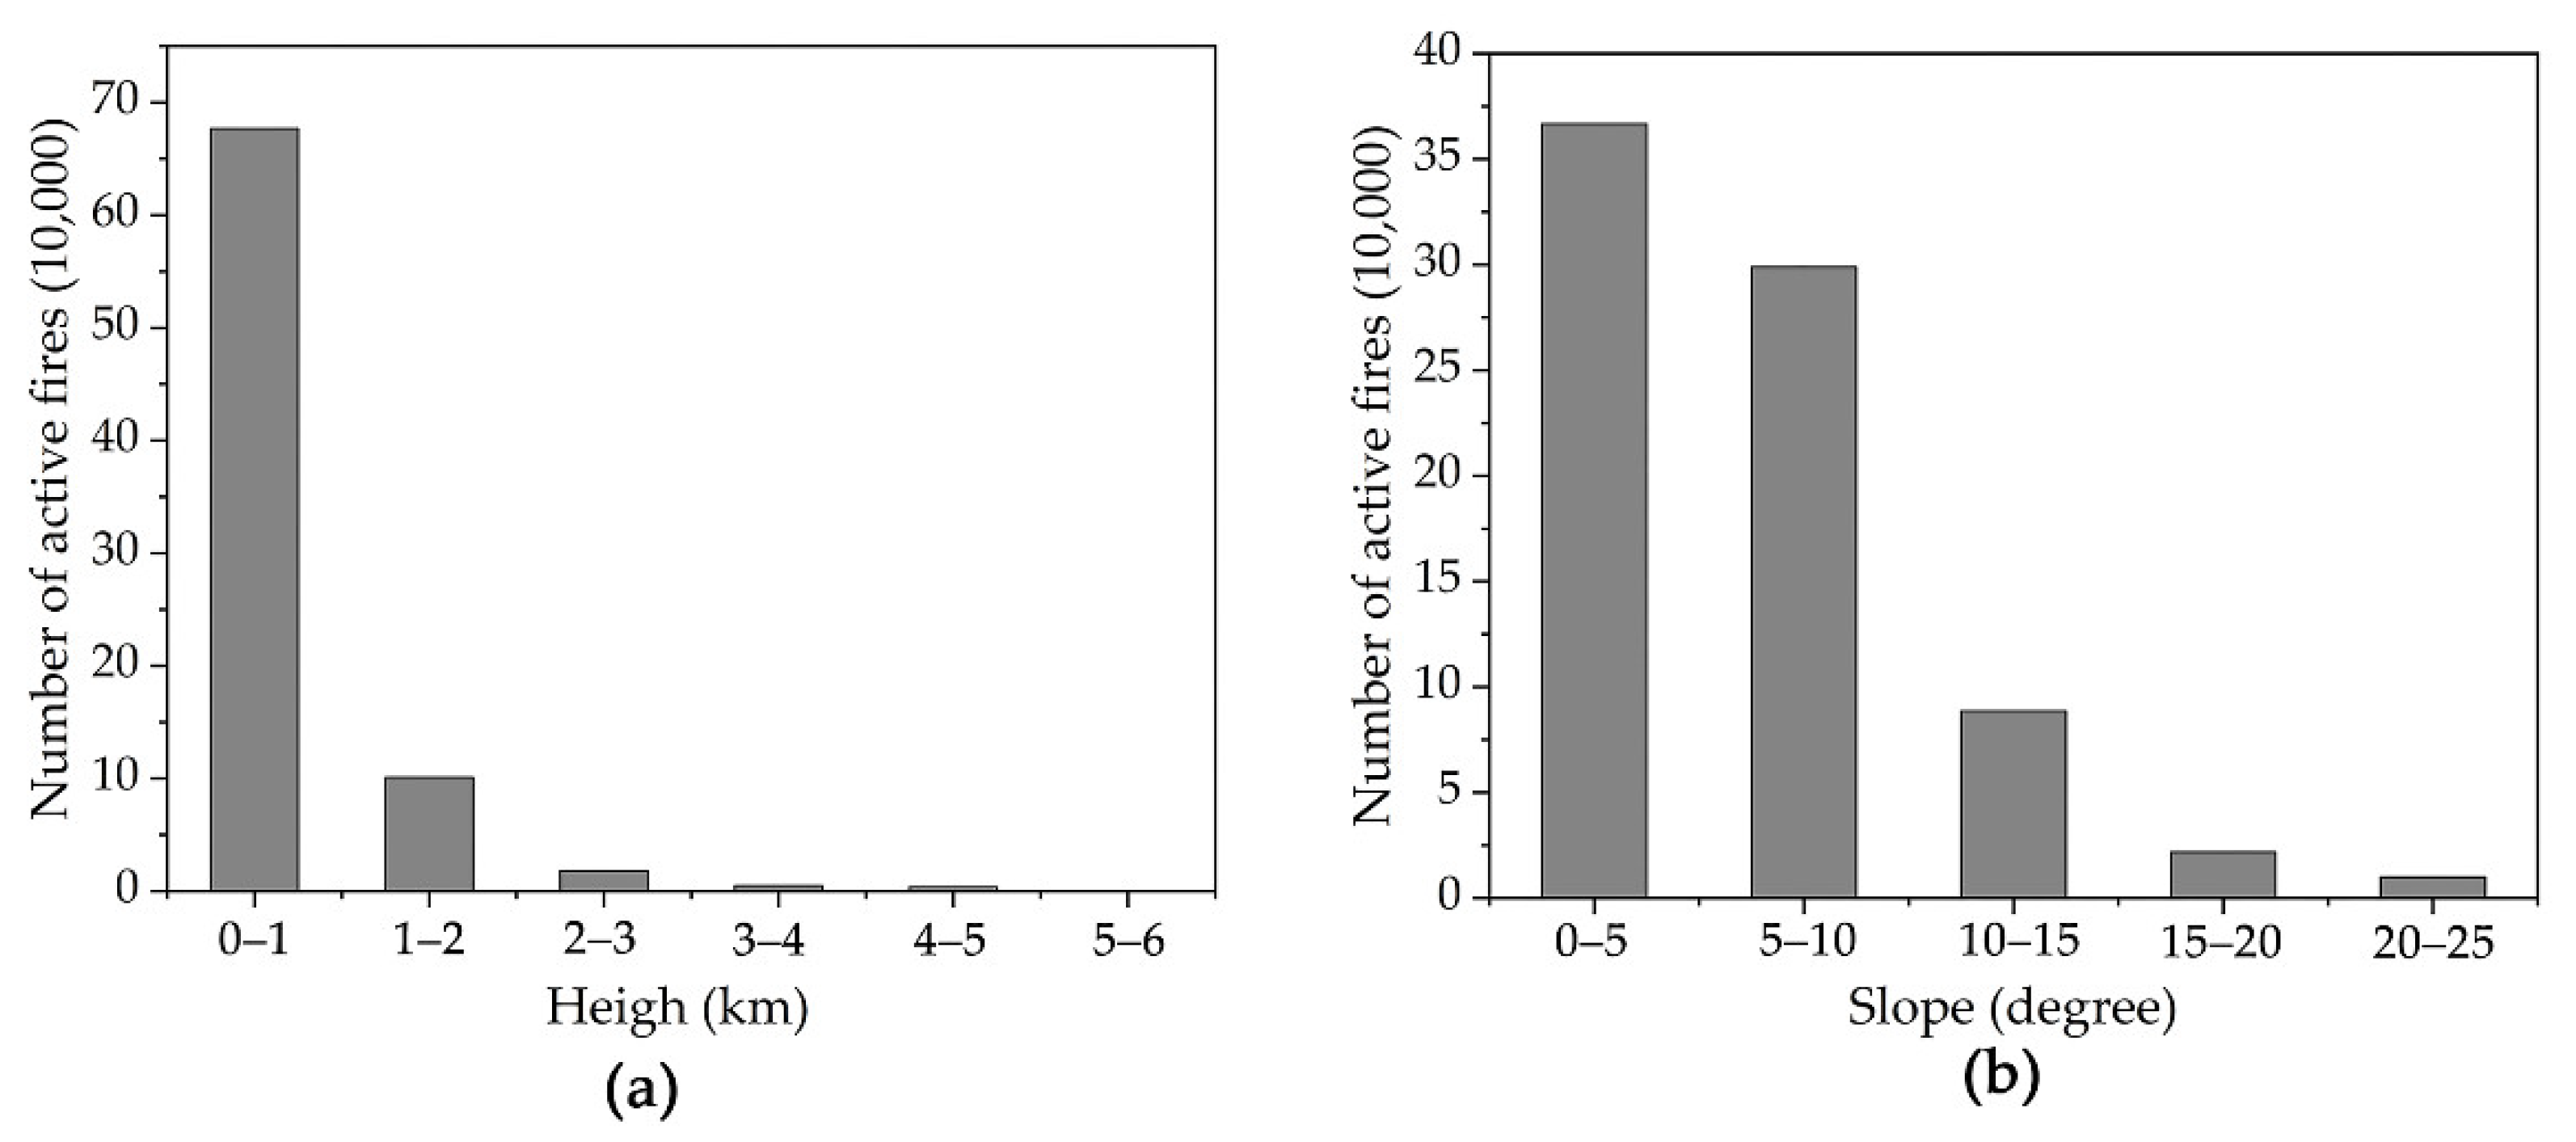
Furthermore, through the analysis of eight zones of fire risk influencing factors, it is found that different types of zones have different fire influencing factors. The vegetation cover is better in areas mainly affected by temperature and NDVI. In these areas, especially in the case of high-temperature weather and abnormal surface temperature, it is necessary to improve the protection awareness of areas with high vegetation coverage and increase the removal of forest combustibles. The region mainly affected by temperature has a dry climate, less precipitation, and low air humidity. When the temperature rises, the combustibles reach the ignition point, making it easy to cause fires. At present, the main countermeasures for desertification control in China are grass squares and planting sand-proof plants. If there is a fire in these places, it will have a serious impact on desertification control in China. These areas should strengthen the monitoring of extremely high-temperature weather to avoid fire. The areas mainly affected by NDVI are covered with vegetation, but the temperature is not high. Vegetation is the only factor that affects the occurrence of active fires. Therefore, attention should be paid to forest fire prevention to avoid man-made fires. The area mainly affected by elevation has a high elevation, which makes disaster relief and fire prevention more difficult. Areas mainly affected by NDVI, temperature, elevation, and slope, and areas with high elevation and gradients, have vegetation coverage. More attention should be paid to mountain fires in these areas, as well as to the vegetation growth status and temperature variation.
To sum up, this study takes the Chinese mainland as the research area and reveals and explores in detail the spatiotemporal distribution characteristics of the occurrence probability and intensity of active fires and their influencing factors from 2001 to 2018. In the process of exploring the influencing factors, the factors of meteorology, terrain, vegetation, and human activities were considered, and the GWLR model was reasonably constructed through multiple linear tests. When considering the influencing factors of human activities, we took population density and GDP factors into account, which makes our research results more scientific. Secondly, based on clarifying the relationship between active fire and impact factors, the fire risk impact factor zoning map was drawn. We put forward differentiated fire prevention suggestions for eight different types of fire risk impact factor zoning. Our work has enriched the research cases of active fires on different space–time scales. The research ideas and methods are suitable for expansion in different spatial scales (global or local). Taking the Chinese mainland as the research area not only helps to understand and grasp the temporal and spatial characteristics and development trends of active fires in the Chinese mainland, but also provides a scientific reference for the prevention of fire risks and the formulation and realization of the “double carbon” target plan with the country or province as a whole. In addition, the zoning map of fire risk impact factors can also provide a theoretical basis for the Chinese government to formulate differentiated fire prevention policies, which is of great significance for the protection of regional ecosystems.
Although the spatiotemporal distribution characteristics of active fires in China were revealed and its influencing factors were explored in this study, there are unavoidably several uncertainties. On the one hand, it is impossible to effectively monitor all regions with the MODIS instruments aboard the Terra and Aqua EOS satellites, owing to the influence of cloud shadow, thick smoke, forest shrubs, and rainy weather, which may result in the deviation of the spatial distribution pattern of active fires in some regions. In addition, the active fire data have a lower spatial resolution (1 km). The size of the fishing net grid (1 km × 1 km) and the small land area in a fishing net at the boundary of the study area may affect the accuracy of statistical results. However, for the entire research area, the Chinese mainland, its influence is almost negligible. Moreover, this study’s algorithm of the probability and intensity of active fires is more accurate. On the other hand, there are a few limitations in the construction of the fire risk assessment model. For instance, the quantity of randomly selected fire points for modeling and testing is less, which may affect the accuracy of the model. Moreover, the influencing factors of active fires and their relationships with each other are very complex. Although the influencing factors from four aspects—meteorology, topography, vegetation, and human activities—were considered, they are still not comprehensive enough. Additionally, fire risk influencing factor data with lower accuracy and spatial resolution may inevitably result in the deviation of results. Correspondingly, finding and exploring the spatiotemporal patterns, process evolution, and influence mechanism of various fire risks at different spatial and temporal scales by obtaining higher spatial resolution remotely sensed images of active fire and impact factors should be a focus of future work.

6. Conclusions

Based on MODIS C6 active fire data, this paper analyzes the spatial and temporal distribution characteristics of the probability and intensity of active fire in the Chinese mainland from 2001 to 2018 by creating spatial statistics of fishing nets. Nine fire risk factors were selected from meteorological, topographic, vegetation, and human activity factors to analyze the relationship between them and active fire. The factors affecting fire risk were selected by the multicollinearity test, the GWLR fire risk assessment model was established, and the modeling results were analyzed. The following conclusions are drawn:
  • There were 1,652,500 active fires in 18 years in the Chinese mainland area, with an average of 91,800 fires per year. There are great differences in the number of active fires in different years and months, mainly concentrated in 2013–2015 and February, April, and October of each year.
  • During the 18 years in the Chinese mainland, the number of grids in the “fire zone” accounted for 10.13% of the total area, and the distribution range of the “fire zone” was quite different. The proportion of “fire areas” varies greatly in different provinces. The occurrence of active fire is mainly low probability, with relatively few of medium and high probability. Low-probability grids are widely distributed, medium-probability grids are distributed in dense areas of low-probability grids, and high-probability grids are in the center of medium-probability grids, advancing layer by layer.
  • The occurrence intensity of active fires in the Chinese mainland is mainly Level 1, followed by Level 2. With the increase in intensity, the number of active fires decreases. The occurrence intensity of the active fire is unevenly distributed in space. The grids of Level 1 and Level 2 intensity are all over the Chinese mainland, and the intensity of 3~6 decreases from the center to the surroundings.
  • From the relationship between the frequency of active fires and fire risk impact factors, it can be seen that the frequency of active fires in the Chinese mainland from 2000 to 2018 was mainly concentrated in areas with an annual average temperature of 14~19 °C, precipitation of 400–800 mm, the surface temperature of 15~20 °C, elevation of 1000–3000 m, slope < 15°, and NDVI > 0.6. The farther the road distance, the higher the average population density, and the greater the GDP value meant the less the number of active fires.
  • Nine fire risk factors were selected from four aspects of meteorology, topography, vegetation, and human activities to build the GWLR fire risk assessment model. The fire risk probability of the Chinese mainland was obtained and divided into five fire risk probability regions. The main occurrence areas of active fires in China were concluded. Then, the spatial distribution of fire impact factors shows that QW and NDVI have a significant spatial impact on the occurrence of active fires in the Chinese mainland, and GC and PD factors have a small impact on the occurrence of active fires, which are only distributed in remote and high-elevation areas. Finally, it was divided into eight fire risk impact factor areas, and differentiated fire prevention suggestions have been put forward.

Author Contributions

Conceptualization, J.P.; methodology, L.Z. and J.P.; software, L.Z. and X.W.; data processing, L.Z.; writing—original draft preparation, L.Z., J.P. and X.W; writing—review and editing, J.P. and S.W.; project administration, J.P.; funding acquisition, J.P. All authors have read and agreed to the published version of the manuscript.

Funding

This research was funded by National Natural Science Foundation of China (Award Number: 42071216) and Natural Science Foundation of Gansu Province, China (Award Number: 21JR7RA145).

Institutional Review Board Statement

Not applicable.

Informed Consent Statement

Not applicable.

Data Availability Statement

The data and statistical analysis methods are available upon request from the corresponding author.

Conflicts of Interest

The authors declare that they have no known competing financial interest or personal relationships that could have appeared to influence the work reported in this paper.

References

  1. Kitzberger, T.; Tiribelli, F.; Barberá, I.; Gowda, J.H.; Morales, J.M.; Zalazar, L.; Paritsis, J. Projections of fire probability and ecosystem vulnerability under 21st-century climate across a trans-Andean productivity gradient in Patagonia. Sci. Total. Environ. 2022, 839, 156303. [Google Scholar] [CrossRef]
  2. Wang, X.; Swystun, T.; Flannigan, M.D. Future wildfire extent and frequency determined by the longest fire-conducive weather spell. Sci. Total. Environ. 2022, 830, 154752. [Google Scholar] [CrossRef]
  3. Cochrane, M.A.; Barber, C.P. Climate change, human land use and future fires in the Amazon. Glob. Chang. Biol. 2009, 15, 601–612. [Google Scholar] [CrossRef]
  4. Chen, A.; Tang, R.; Mao, J.; Yue, C.; Li, X.; Gao, M.; Shi, X.; Jin, M.; Ricciuto, D.; Rabin, S.; et al. Spatiotemporal dynamics of ecosystem fires and biomass burning-induced carbon emissions in China over the past two decades. Geogr. Sustain. 2020, 1, 47–58. [Google Scholar] [CrossRef]
  5. Gui, J.; Wang, D.; Jiang, Y.; Liu, J.; Yang, L. Study on the Protection Effect of Sprinklers on Glass by Fire Scale in Building Fires. Fire 2022, 5, 100. [Google Scholar] [CrossRef]
  6. Bowman, D.M.; Balch, J.K.; Artaxo, P.; Bond, W.J.; Carlson, J.M.; Cochrane, M.A.; Antonio, C.M.; Defries, R.S.; Doyle, J.C.; Harrison, S.P.; et al. Fire in the Earth system. Science 2009, 324, 481–484. [Google Scholar] [CrossRef] [PubMed]
  7. Da Silva, S.S.; Fearnside, P.M.; de Graça, P.M.L.A.; Brown, I.F.; Alencar, A.; de Melo, A.W.F. Dynamics of forest fires in the southwestern Amazon. For. Ecol. Manag. 2018, 424, 312–322. [Google Scholar] [CrossRef]
  8. Barreiro, A.; Díaz-Raviña, M. Fire impacts on soil microorganisms: Mass, activity, and diversity. Curr. Opin. Environ. Sci. Health 2021, 22, 100264. [Google Scholar] [CrossRef]
  9. Nichols, L.; Shinneman, D.J.; McIlroy, S.K.; Marie-Anne, G. Fire frequency impacts soil properties and processes in sagebrush steppe ecosystems of the Columbia Basin. Appl. Soil Ecol. 2021, 165, 103967. [Google Scholar] [CrossRef]
  10. Mantoni, C.; Musciano, M.D.; Fattorini, S. Use of microarthropods to evaluate the impact of fire on soil biological quality. J. Environ. Manag. 2020, 266, 110624. [Google Scholar] [CrossRef]
  11. Attorre, F.; Govender, N.; Hausmann, A.; Farcomeni, A.; Guillet, A.; Scepi, E.; Smit, I.P.J.; Vitale, M. Assessing the effect of management Changes and environmental features on the spatio-temporal pattern of fire in an African Savanna: Fire spatiotemporal pattern. J. Nat. Conserv. 2015, 28, 1–10. [Google Scholar] [CrossRef]
  12. Wooster, M.J.; Roberts, G.J.; Giglio, L.; Roy, D.; Freeborn, P.; Boschetti, L.; Justice, C.; Ichoku, C.; Schroeder, W.; Davies, D.; et al. Satellite remote sensing of active fires: History and current status, applications and future requirements. Remote Sens. Environ. 2021, 267, 112694. [Google Scholar] [CrossRef]
  13. Pérez-Cabello, F.; Montorio, R.; Alves, D.B. Remote sensing techniques to assess post-fire vegetation recovery. Curr. Opin. Environ. Sci. Health. 2021, 21, 100251. [Google Scholar] [CrossRef]
  14. Wang, K.; Jiang, Q.; Yu, D.; Yang, Q.; Li Wang, L.; Han, T.; Xu, X. Detecting daytime and nighttime land surface temperature anomalies using thermal infrared remote sensing in Dandong geothermal prospect. Int. J. Appl. Earth Obs. Geoinf. 2019, 80, 196–205. [Google Scholar] [CrossRef]
  15. Sirimongkonlertkul, N.; Phonekeo, V. Remote Sensing and GIS Application Analysis of Active Fire, Aerosol Optical Thickness and Estimated PM10 in the North of Thailand and Chiang Rai Province. APCBEE Procedia 2012, 1, 304–308. [Google Scholar] [CrossRef] [Green Version]
  16. Ma, C.; Sui, X.; Zeng, Y.; Yang, J.; Xie, Y.; Li, T.; Zhang, P. Classification of Industrial Heat Source Objects Based on Active Fire Point Density Segmentation and Spatial Topological Correlation Analysis in the Beijing–Tianjin–Hebei Region. Sustainability 2022, 14, 11228. [Google Scholar] [CrossRef]
  17. Liu, Q.; Shan, Y.; Shu, L.; Sun, P.; Du, S. Spatial and temporal distribution of forest fire frequency and forest area burnt in Jilin Province, Northeast China. J. For. Res. 2018, 29, 1233–1239. [Google Scholar] [CrossRef]
  18. Zhu, Z.; Deng, X.; Zhao, F.; Li, S.; Wang, L. How Environmental Factors Affect Forest Fire Occurrence in Yunnan Forest Region. Forests 2022, 13, 1392. [Google Scholar] [CrossRef]
  19. Guo, F.; Wang, G.; Su, Z.; Liang, H.; Wang, W.; Lin, F.; Liu, A. What drives forest fire in Fujian, China? Evidence from logistic regression and Random Forests. Int. J. Wildland Fire 2016, 25, 505–519. [Google Scholar] [CrossRef]
  20. Goldammer, J.G. History of equatorial vegetation fires and fire research in Southeast Asia before the 1997- 98 episode: A reconstruction of creeping environmental changes. Mitig. Adapt. Strateg. Glob. Chang. 2007, 12, 13–32. [Google Scholar] [CrossRef]
  21. Martín-Sanz, P.J.; Santiago-Martín, A.; Valverde-Asenjo, I.; Quintana-Nieto, J.R.; González-Huecas, C.; López-Lafuente, A.L. Comparison of soil quality indexes calculated by network and principal component analysis for carbonated soils under different uses. Ecol. Indic. 2022, 143, 109374. [Google Scholar] [CrossRef]
  22. Kerr, T.; Duncan, K.; Myers, L. Post fire materials identification by micro-Raman spectroscopy and principal components analysis. J. Anal. Appl. Pyrolysis 2013, 102, 103–113. [Google Scholar] [CrossRef]
  23. Döring, C.; Lesot, M.-J.; Kruse, R. Data analysis with fuzzy clustering methods. Comput. Stat. Data Anal. 2006, 51, 192–214. [Google Scholar] [CrossRef]
  24. Garcia-Prats, A.; Antonio, D.C.; Gualberto Fernandes, T.J.G.; Molina, A.J. Development of a Keetch and Byram—Based drought index sensitive to forest management in Mediterranean conditions. Agric. For. Meteorol. 2015, 205, 40–50. [Google Scholar] [CrossRef]
  25. Woo, T.H. Analysis of nuclear fire safety by dynamic complex algorithm of fuzzy theory and system dynamics. Ann. Nucl. Eng. 2018, 114, 149–153. [Google Scholar] [CrossRef]
  26. Cho, I.; Park, S.; Kim, J. A fire risk assessment method for high-capacity battery packs using interquartile range filter. J. Energy Storage 2022, 50, 104663. [Google Scholar] [CrossRef]
  27. Schroeder, W.; Oliva, P.; Giglio, L.; Csiszar, I.A. The New VIIRS 375m active fire detection data product: Algorithm description and initial assessment. Remote Sens. Environ. 2014, 143, 85–96. [Google Scholar] [CrossRef]
  28. Sharma, A.; Kumar, H.; Mittal, K.; Kauhsal, S.; Kaushal, M.; Gupta, D.; Narula, A. IoT and deep learning-inspired multi-model framework for monitoring Active Fire Locations in Agricultural Activities. Comput. Electr. Eng. 2021, 93, 107216. [Google Scholar] [CrossRef]
  29. Bera, B.; Saha, S.; Bhattacharjee, S. Forest cover dynamics (1998 to 2019) and prediction of deforestation probability using binary logistic regression (BLR) model of Silabati watershed, India. Trees For. People 2020, 2, 100034. [Google Scholar] [CrossRef]
  30. Nazarpour, A.; Paydar, G.R.; Mehregan, F.; Hejazi, S.J.; Jafari, M.A. Application of geographically weighted regression (GWR) and singularity analysis to identify stream sediment geochemical anomalies, case study, Takab Area, NW Iran. J. Geochem. Explor. 2022, 235, 106953. [Google Scholar] [CrossRef]
  31. Liu, Y.; Lam, K.F.; Wu, J.T.; Lam, T.T.Y. Geographically weighted temporally correlated logistic regression model. Sci. Rep. 2018, 8, 1417. [Google Scholar] [CrossRef] [Green Version]
  32. Giglio, L.; Schroeder, W.; Justice, C.O. The collection 6 MODIS active fire detection algorithm and fire products. Remote Sens. Environ. 2016, 178, 31–41. [Google Scholar] [CrossRef] [Green Version]
  33. Huesca, M.; Litago, J.; Palacios-Orueta, A.; Montes, F.; Sebastián-López, A.; Escribano, P. Assessment of forest fire seasonality using MODIS fire potential: A time series approach. Agric. For. Meteorol. 2009, 149, 1946–1955. [Google Scholar] [CrossRef]
  34. Bolaño-Díaz, S.; Camargo-Caicedo, Y.; Soro, T.D.; N’Dri, A.B.; Bolaño-Ortiz, T.R. Spatio-Temporal Characterization of Fire Using MODIS Data (2000–2020) in Colombia. Fire 2022, 5, 134. [Google Scholar] [CrossRef]
  35. Singh, M.; Sood, S.; Collins, C.M. Fire Dynamics of the Bolivian Amazon. Land 2022, 11, 1436. [Google Scholar] [CrossRef]
  36. Aldersley, A.; Murray, S.J.; Cornell, S.E. Global and regional analysis of climate and human drivers of wildfire. Sci. Total Environ. 2011, 409, 3472–3481. [Google Scholar] [CrossRef] [PubMed]
  37. Hantson, S.; Pueyo, S.; Chuvieco, E. Global fire size distribution is driven by human impact and climate. Glob. Ecol. Biogeogr. 2015, 24, 77–86. [Google Scholar] [CrossRef]
  38. Smit, I.P.; Smit, C.F.; Govender, N.; Linde MV, D.; MacFadyen, S. Rainfall, geology and landscape position generate large-scale spatiotemporal fire pattern heterogeneity in an African savanna. Ecography 2013, 36, 447–459. [Google Scholar] [CrossRef]
  39. Capece, P.; Ganga, A.; Dessy, C.; Delitala, A.M.S. NDVI Analysis for Monitoring the Spatial and Temporal Variability of the Vegetation Cover in Sardinia: A Proposal to Support Natural Hazard Management. Environ. Sci. Proc. 2022, 17, 121. [Google Scholar]
  40. Liu, J.; Liang, Y.; Li, P.; Xiao, C. Occurrence characteristics and response to El Niño of MODIS-based active fires in Indonesia during 2001–2018. Acta Geogr. Sin. 2020, 75, 1907–1920. (In Chinese) [Google Scholar]
  41. Kim, J.H. Multicollinearity and misleading statistical results. Korean J. Anesthesiol. 2019, 72, 558–569. [Google Scholar] [CrossRef] [PubMed] [Green Version]
  42. Wang, W.; Pan, J.; Feng, Y.; Li, Z.; Dong, L. Model and Zoning of Fire Risk in Gansu Province based on GWLR and MODIS Imagery. Remote Sens. Technol. Appl. 2017, 32, 514–523. (In Chinese) [Google Scholar]
  43. Indah Manfaati Nur, I.M.; Al Haris, M. Geographically Weighted Logistic Regression (GWLR) with Adaptive Gaussian Weighting Function in Human Development Index (HDI) in The Province of Central Java. J. Phys. Conf. Ser. 2021, 1776, 012048. [Google Scholar]
  44. Tian, X.; Zhao, F.; Shu, L.; Wang, M. Distribution characteristics and the influence factors of forest fires in China. For. Ecol. Manag. 2013, 310, 460–467. [Google Scholar] [CrossRef]
  45. Carmo, M.; Moreira, F.; Casimiro, P.; Vaz, P. Land use and topography influences on wildfire occurrence in northern Portugal. Landsc. Urban Plan. 2011, 100, 169–176. [Google Scholar] [CrossRef] [Green Version]
  46. Catry, F.X.; Rego, F.C.; Bação, F.L.; Moreira, F. Modeling and mapping wildfire ignition risk in Portugal. Int. J. Wildland Fire 2009, 18, 921–931. [Google Scholar] [CrossRef] [Green Version]
  47. Fawcett, T. An introduction to ROC analysis. Pattern Recognit. Lett. 2006, 27, 861–874. [Google Scholar] [CrossRef]
  48. Song, R.; Wang, T.; Han, J.; Xu, B.; Ma, D.; Zhang, M.; Li, S.; Zhuang, B.; Li, M.; Xie, M. Spatial and temporal variation of air pollutant emissions from forest fires in China. Atmos. Environ. 2022, 281, 119156. [Google Scholar] [CrossRef]
  49. Matthews, S.A.; Yang, T.C. Mapping the results of local statistics: Using geographically weighted regression. Demogr. Res. 2012, 26, 151–166. [Google Scholar] [CrossRef] [PubMed] [Green Version]
  50. Wang, Z.Y.; Ding, Y.H. Climatic Characteristics of Rainy Seasons in China. Chin. J. Atmos. Sci. 2008, 32, 1–13. [Google Scholar]
  51. Wei, X.K.; Wang, G.J.; Chen, T.X.; Hagan, D.F.T.; Ullah, W. A Spatio-Temporal Analysis of Active Fires over China during 2003–2016. Remote Sens. 2020, 12, 1787. [Google Scholar] [CrossRef]
  52. Ma, W.; Feng, Z.; Cheng, Z.; Chen, S.; Wang, F. Identifying Forest Fire Driving Factors and Related Impacts in China Using Random Forest Algorithm. Forests 2020, 11, 507. [Google Scholar] [CrossRef]
  53. Mohammadi, F.; Bavaghar, M.P.; Shabanian, N. Forest Fire Risk Zone Modeling Using Logistic Regression and GIS: An Iranian Case Study. Small-Scale For. 2014, 13, 117–125. [Google Scholar] [CrossRef]
  54. Li, X.Y.; Liu, L.J.; Qi, S.Z. Forest fire hazard during 2000–2016 in Zhejiang province of the typical subtropical region, China. Nat. Hazard. 2018, 94, 975–977. [Google Scholar] [CrossRef]
  55. Zhang, Z.; Wang, L.; Xue, N.; Du, Z. Spatiotemporal Analysis of Active Fires in the Arctic Region during 2001–2019 and a Fire Risk Assessment Model. Fire 2021, 4, 57. [Google Scholar] [CrossRef]
  56. Chang, Y.; Zhu, Z.; Bu, R.; Chen, H.; Feng, Y.; Li, Y.; Hu, Y.; Wang, Z. Predicting fire occurrence patterns with logistic regression in Heilongjiang Province, China. Landscape Ecol. 2013, 28, 10. [Google Scholar] [CrossRef]
  57. Cui, S.; Song, Z.; Zhang, L.; Shen, Z.; Hough, R.; Zhang, Z.; An, L.; Fu, Q.; Zhao, Y.; Jia, Z. Spatial and temporal variations of open straw burning based on fire spots in northeast China from 2013 to 2017. Atmos. Environ. 2021, 244, 117962. [Google Scholar] [CrossRef]
  58. Li, Y.D.; Feng, Z.K.; Chen, S.L.; Zhao, Z.Y.; Wang, F.G. Application of the Artificial Neural Network and Support Vector Machines in Forest Fire Prediction in the Guangxi Autonomous Region, China. Discrete Dyn. Nat. Soc. 2020, 2020, 5612650. [Google Scholar] [CrossRef]
Figure 1. Technical flow chart.
Fire 05 00200 g001
Figure 2. (a) Line chart of annual active fires in the Chinese mainland from 2001 to 2018; (b) line chart of monthly active fires in the Chinese mainland from 2001 to 2018.
Fire 05 00200 g002
Figure 3. Spatial distribution of percentage of “fire area” in each province of China.
Fire 05 00200 g003
Figure 4. Difference in the probability of active fires in the Chinese mainland from 2001 to 2018.
Fire 05 00200 g004
Figure 5. Occurrence probability of MODIS active fires in the Chinese mainland area from 2001 to 2018.
Fire 05 00200 g005
Figure 6. Difference in occurrence probability of active fire in different provinces from 2001 to 2018: (a) Heilongjiang; (b) Guangxi; (c) Henan; (d) Shangdong; (e) Fujian; (f) Qinghai.
Fire 05 00200 g006
Figure 7. Intensity map of MODIS active fire in Chinese mainland area from 2001 to 2018.
Fire 05 00200 g007
Figure 8. Difference diagram of active fire intensity of different probability groups in the Chinese mainland area from 2001 to 2018.
Fire 05 00200 g008
Figure 9. Relationship between active fires and meteorological factors: (a) relationship between active fires and air temperature factor; (b) relationship between actives fire and precipitation factor; (c) relationship between active fires and surface temperature factor.
Fire 05 00200 g009
Figure 10. Relationship between active fires and topographic factors: (a) relationship between active fires and elevation factor; (b) relationship between active fires and slope factor.
Fire 05 00200 g010
Figure 11. Relationship between active fires and vegetation factors.
Fire 05 00200 g011
Figure 12. Relationship between active fires and human activity factors: (a) relationship between active fires and distance to the nearest path; (b) relationship between active fires and population density factor; (c) relationship between active fires and GDP factor.
Fire 05 00200 g012
Figure 13. ROC curve analysis.
Fire 05 00200 g013
Figure 14. Fire risk probability map.
Fire 05 00200 g014
Figure 15. Fire risk grade zoning map.
Fire 05 00200 g015
Figure 16. Spatial distribution diagram of significant area of fire risk impact factor coefficient: (a) NDVI factor; (b) QW factor; (c) GC factor; (d) PD factor.
Fire 05 00200 g016
Figure 17. Zoning map of fire risk impact factors.
Fire 05 00200 g017
Table 1. Data Descriptions.
DataData SourcesPurpose
MODIS C6Fire Information for Resource Management System (https://firms.modaps.eosdis.nasa.gov, accessed on 12 November 2022)Temporal and spatial distribution of active fire
TemperatureNational Qinghai-Tibet Plateau Science Data Center (https://data.tpdc.ac.cn, accessed on 12 November 2022)Meteorological factor
Precipitation
Surface temperatureResource and Environmental Science Data Center of Chinese Academy of Sciences (http://www.resdc.cn, accessed on 12 November 2022)
DEMResource and Environmental Science Data Center of Chinese Academy of Sciences (http://www.resdc.cn, accessed on 12 November 2022)Terrain factor
NDVIResource and Environmental Science Data Center of Chinese Academy of Sciences (http://www.resdc.cn, accessed on 12 November 2022)Vegetation factor
Road vectorInstitute of Remote Sensing and Digital Earth, Chinese Academy of Sciences (http://www.radi.ac.cn/, accessed on 12 November 2022)Human activity factor
Population densityResource and Environmental Science Data Center of Chinese Academy of Sciences (http://www.resdc.cn, accessed on 12 November 2022)
GDP
Table 2. Grouping standard of active fire occurrence probability.
GroupingProbability of Occurrence
Low-probability group1/182/183/184/185/186/18
Medium-probability group7/188/189/1810/1811/1812/18
High-probability group13/1814/1815/1816/1817/1818/18
Table 3. Grading standard of active fire intensity.
LevelStrength Range (Times/a)Corresponding Grid Quantity Range
Level 11693,361
Level 22100,633
Level 33–49709
Level 45–7913
Level 58–9384
Level 620–201133
Table 4. Proportion of active fire intensity levels in Chinese mainland and different provinces from 2001 to 2018.
LevelIntensity Range
(Times/a)
Proportion of Different Strengths (%)
ChinaHeilongjiangGuangxiHenanShandongFujianQinghai
1186.1281.6388.0488.6387.1587.1288.33
2212.5016.6911.1310.4311.3211.849.56
33~41.211.580.790.851.380.991.67
45~70.110.090.030.070.110.050.19
58~190.050.010.020.020.030.000.26
620~2010.020.000.000.000.010.000.00
Table 5. Collinearity diagnosis.
Model VariableCollinearity Statistics
AllowanceVIF
Temperature0.2394.434
Precipitation0.2434.162
Elevation0.2963.224
Slope0.6861.448
Normalized vegetation index0.3712.692
Distance from road0.6261.514
Table 6. Variables in the equation and their statistical values.
VariableCoefficientStandard ErrorMinimumMaximum
Constant−5.3527.627−18.23516.940
Temperature x13.6819.533−22.18421.001
Precipitation x2−3.0039.143−45.8684.142
Elevation x3−3.18021.402−89.0017.852
Slope x4−3.2434.711−16.46310.128
Normalized vegetation index x55.5142.667−0.14811.466
Distance from road x6−1.5583.389−9.6204.741
Table 7. Proportion of active fire spots and areas in fire risk zones.
Fire Risk ZoningFire Risk Probability ValueActive Fire Point Proportion (%)Total Area Ratio (%)
Extremely high fire danger area0 < p < 0.215.605.19
High fire danger area0.2 < p < 0.462.7027.68
Middle fire danger area04 < p < 0.615.2611.63
Low fire danger area0.6 < p < 0.84.288.59
Extremely low fire danger area0.8 < p < 12.1646.91
Publisher’s Note: MDPI stays neutral with regard to jurisdictional claims in published maps and institutional affiliations.

