Article

Impact of Micropulse and Radio Frequency Coupling in an Atmospheric Pressure Plasma Jet on the Synthesis of Gold Nanoparticles

by
Tatiana Habib
1,2,
Ludovica Ceroni
3,
Alessandro Patelli
4,
José Mauricio Almeida Caiut
2 and
Bruno Caillier
1,*
1
Laboratoire Diagnostics des Plasmas Hors Equilibre (DPHE), Université de Toulouse, INU Champollion, 81000 Albi, France
2
Department of Chemistry-FFCLRP, University of Sao Paulo, Ribeirao Preto 14040-900, Brazil
3
Dipartimento di Scienze Chimiche, Università di Padova, Via Marzolo 1, 35131 Padova, Italy
4
Dipartimento di Fisica e Astronomia, Università di Padova, Via Marzolo 8, 35131 Padova, Italy
*
Author to whom correspondence should be addressed.
Plasma 2023, 6(4), 623-636; https://doi.org/10.3390/plasma6040043
Submission received: 8 August 2023 / Revised: 4 October 2023 / Accepted: 9 October 2023 / Published: 13 October 2023
(This article belongs to the Special Issue Dielectric Barrier Discharges 2023)

Abstract

:
Gold nanoparticles have been extensively studied due to their unique optical and electronic properties which make them attractive for a wide range of applications in biomedicine, electronics, and catalysis. Over the past decade, atmospheric pressure plasma jets in contact with a liquid have emerged as a sustainable and environmentally friendly approach for synthesizing stable and precisely controlled dispersions. Within the context of plasma jet/liquid configurations, researchers have explored various power sources, ranging from kHz frequencies to nanopulse regimes. In this study, we investigated the effects of coupling two distinct power supplies: a high-voltage micropulse and a radio frequency (RF) generator. The variations within the plasma induced by this coupling were explored by optical and electrical measurements. Our findings indicated a transition from a bullet plasma propagation mechanism to a capacitive coupling mechanism upon the introduction of RF energy. The impact on the production of metal nanoparticles was also examined as a function of the radio frequency power and of two distinct process gases, namely helium and argon. The characterization of gold nanoparticles included UV-visible spectroscopy, dynamic light scattering, and scanning electron microscopy. The results showed that the size distribution depended on the type of process gas used and on the power supplies coupling. In particular, the incorporation of RF power alongside the micropulse led to a decrease in both average particle size and distribution width. The comparison of the different set up suggested that the current density can influence the particle size distribution, highlighting the potential advantages of the use of a dual-frequency atmospheric pressure plasma jet configuration.

1. Introduction

Nanoparticles have emerged as a promising class of materials because their size awards novel physical, chemical, and optical properties to materials [1]. Gold nanoparticles have attracted significant attention due to their exceptional plasmonic properties which make them beneficial in a wide range of applications [2], including biomedical imaging [3], drug delivery [4], catalysis [5], and sensing [6,7]. Among the various methods for synthesizing gold nanoparticles, plasma treatment in contact with a metallic salt liquid solution has gained interest due to its ability to produce nanoparticles with controlled sizes, shapes, and tailored surface properties. This treatment requires the use of high-energy plasmas to induce chemical reactions and physical processes that result in the formation of nanoparticles [8,9]. Its main advantage is to synthesize stable nanoparticle solutions in a single step without the need for reducing agents and the potential for large-scale production [10,11].
However, the production process depends on many parameters such as environmental conditions, plasma design and configuration [12], and on the treated solution [13]. Xuan et al. (2021), for example, obtained controlled, nearly -monodisperse-sized, distributions acting on the plasma-to-surface distance, generator frequency, gas flow, salt concentration, treatment duration, and also on environmental temperature and humidity [14]. A full understanding of the process is still challenging due to its complexity including the role of plasma, which probably enables the chemical route involving gold chloride and hydrogen peroxide supplying hydroxide ions. In addition, the use of different plasma sources and process conditions can lead to variations in nanoparticle properties. Generally, in the context of plasma jets in contact with a liquid surface, several plasma regimes were used, from nanopulse [15] to radiofrequency [16], aiming to maximize synthesis control and stability. However, a clear correlation between the plasma parameters and the synthesis is far from being drawn, highlighting the need for further studies to fully understand the mechanisms and optimize the synthesis process.
In this study, we explore the possibility that the coupling of micropulse (µPulse) [17,18] and radio frequency (RF) [19] excitations in an atmospheric pressure plasma jet can influence the synthesis of gold nanoparticles. Process conditions were changed as a function of RF power levels, process gas, and treatment time. The resulting plasma/liquid interaction is not due to the µPulse only, nor RF excitation, but differs from both. In terms of its impact on nanoparticle production, this dual-frequency atmospheric pressure plasma jet (DF-APPJ) configuration may allow an enhancement in spherical shape control and smaller size relative to the µPulse only. The obtained results showed that DF-APPJ may be a promising configuration to optimize production efficiency and process control for monodispersed nanoparticle solutions.

2. Materials and Methods

2.1. Materials

Gold (III) chloride hydrate (HAuCl4 xH2O, 99.995%, MW: 339.79 g mol−1, Sigma-Aldrich, Burlington, MA, USA) was dissolved in ultrapure water (Direct-Q UV, Millipore, Burlington, MA, USA) to obtain a 1 mmol L−1 solution and stored as a stock solution. Polyvinylpyrrolidone (PVP, MW: 40,000 g mol−1) was also purchased from Sigma-Aldrich and used as a capping agent to inhibit agglomerations. These two products were used as purchased with no further purification.

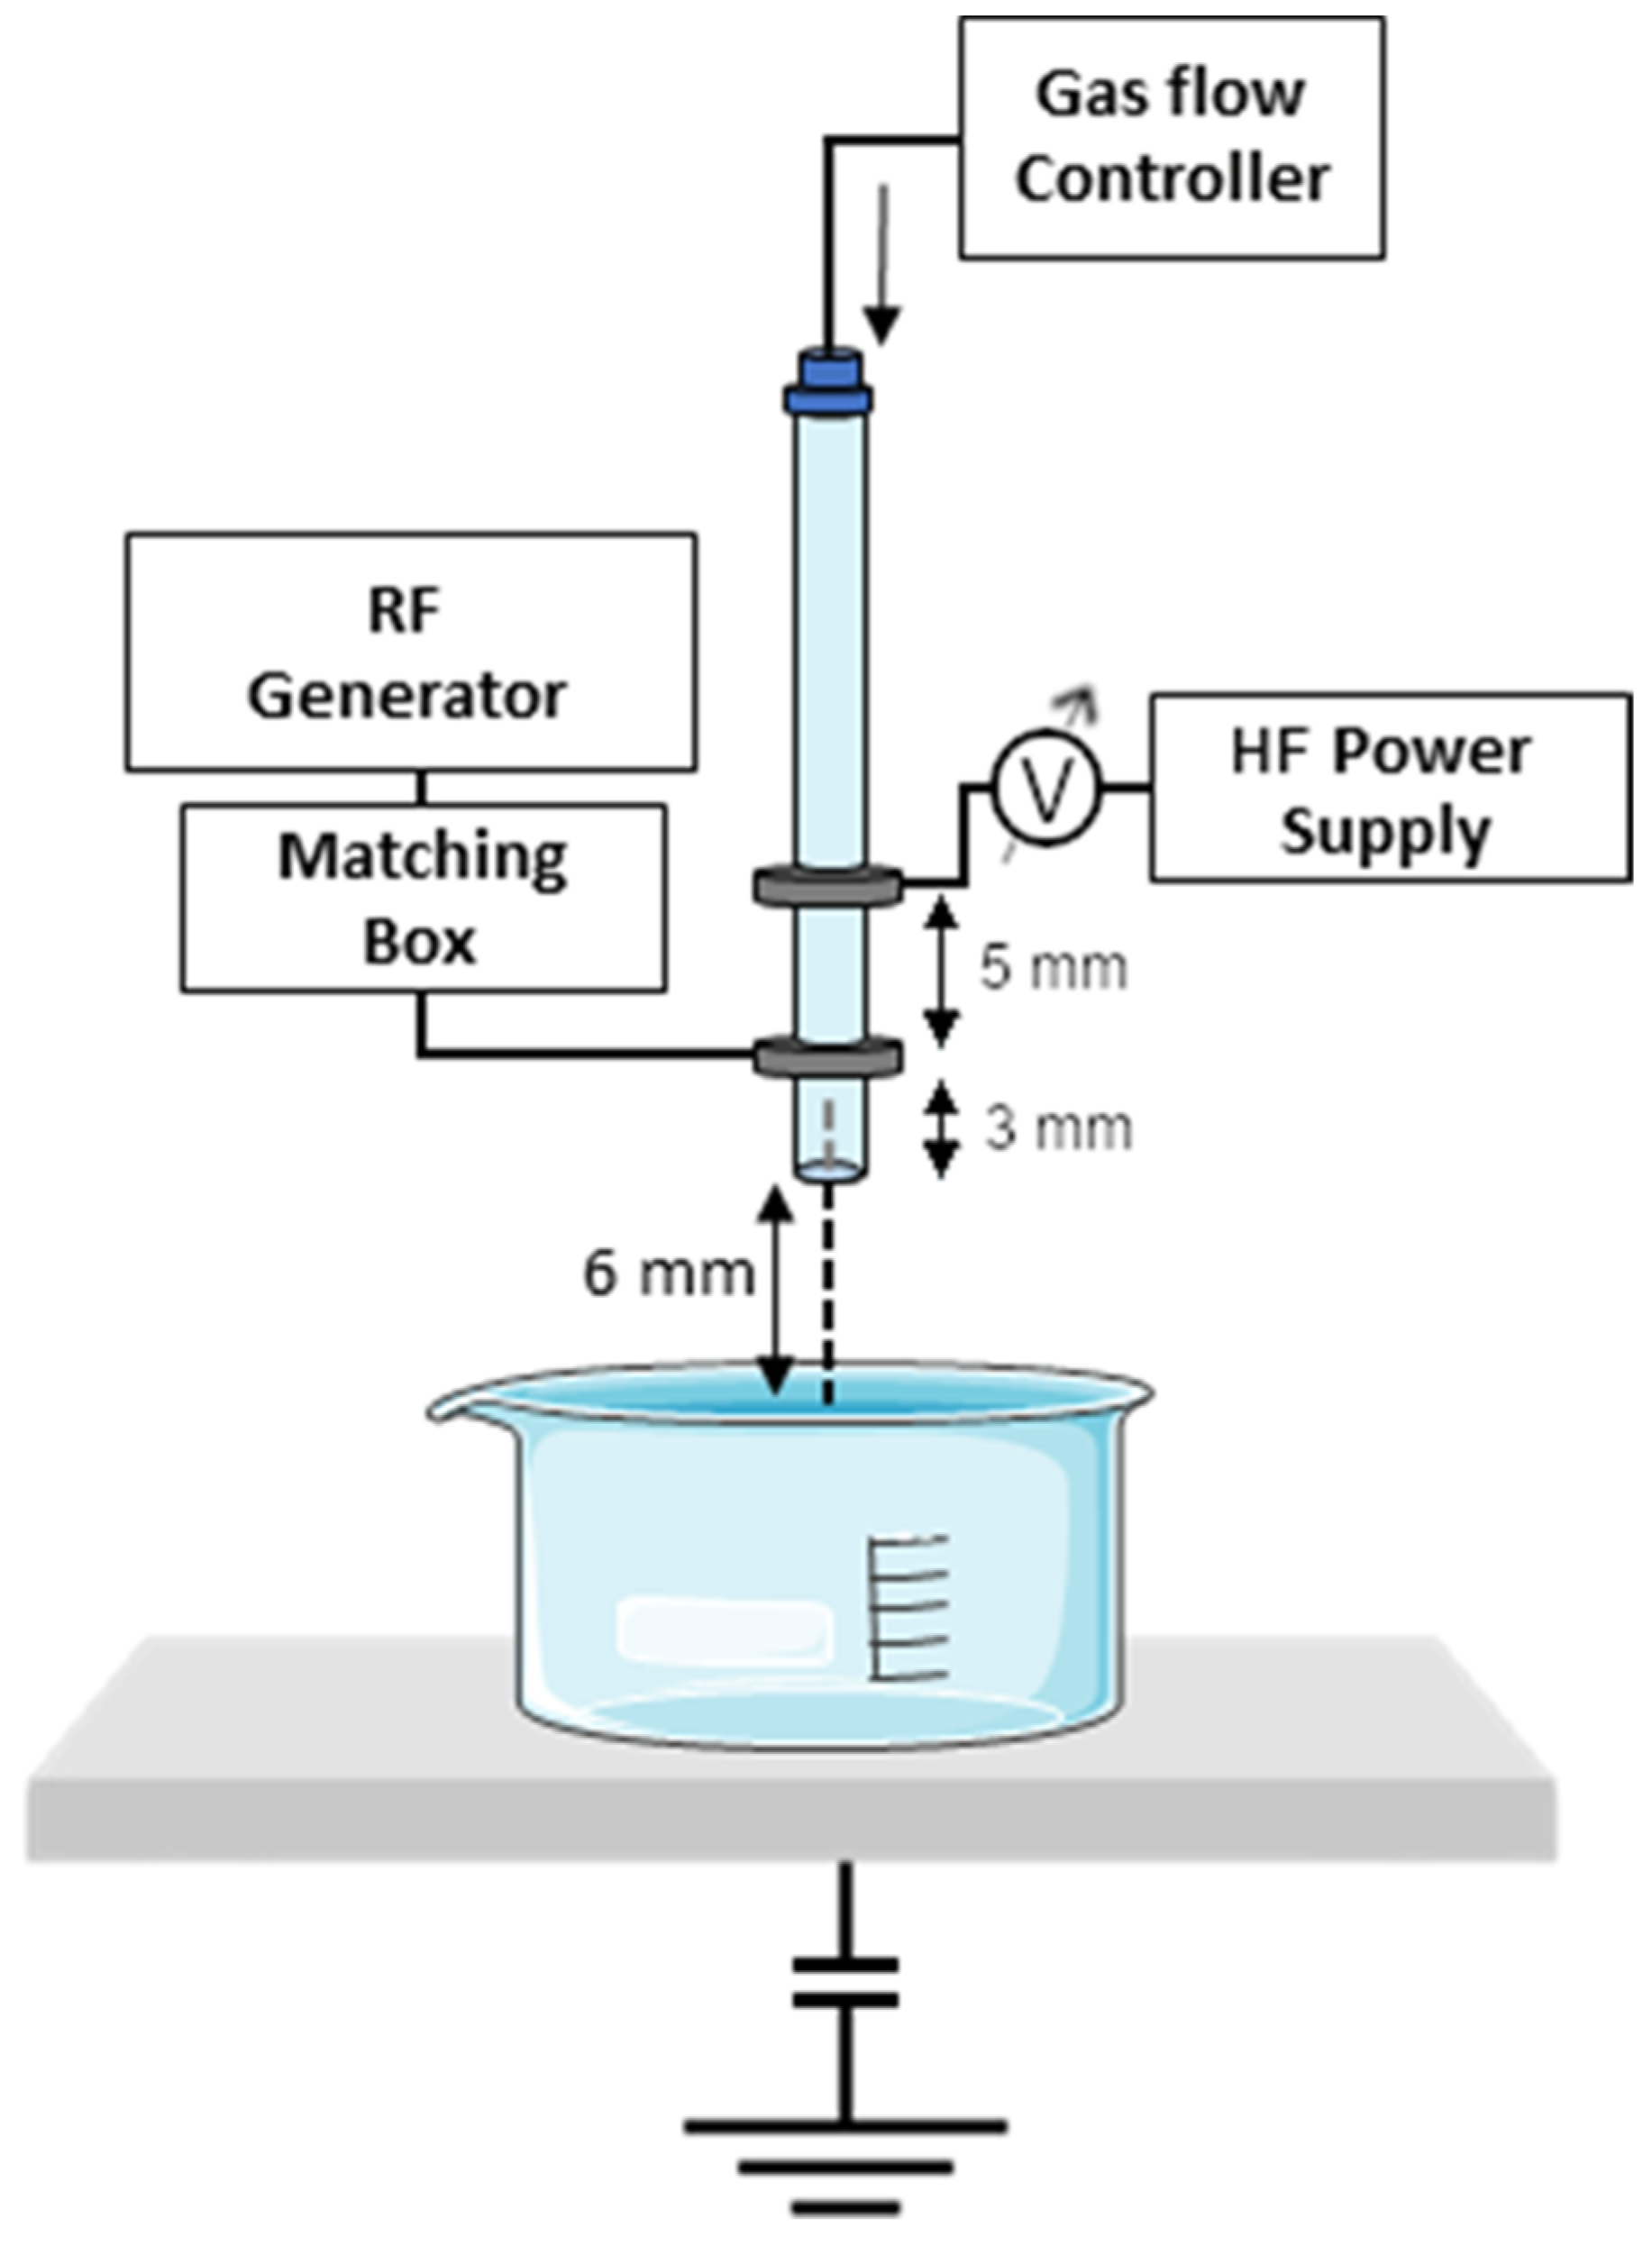
2.2. Experimental Setup

A schematic representation of the experimental device used to generate the plasma jet is shown in Figure 1 and consisted of two ring electrodes separated by approximately 5 mm, with each one of these electrodes connected to a different power supply. The plasma tube was composed of alumina and has an outer diameter of 1 cm and an inner diameter of 9 mm. The upstream electrode was connected to a power supply purchased from OLISCIE company (Martres-Tolosane, France), which uses a patented technology to apply fast voltage pulses on a capacitive load [18]. The pulse frequency was set to 25 kHz and the input pulse current to 8 A. The downstream electrode was connected to an RF generator (27.12 MHz, Seren R301, SEREN Industrial Power Systems, Vineland, NJ, USA) over a matching network [19]. The process gas was introduced in the alumina tube through a mass flow controller set at 3.0 L min−1. The gases utilized included helium (He) with a purity of 99.999% and argon (Ar) with a purity of 99.995%. Air was fluxed to cool the electrodes and to control the atmosphere around the plasma plume.

2.3. Synthesis of Gold Nanoparticles

Using plasma reduction, only one step was needed to synthesize gold nanoparticles from HAuCl4 and PVP aqueous solution. Different samples were prepared, with a HAuCl4 concentration ranging from 0.1 to 2 mmol L−1 and PVP concentration ranging from 0 to 0.1 mmol L−1 to determine the optimal chemical conditions to obtain well separated and homogeneous nanoparticles. This study was already performed and the resulting optimal concentrations proved to be 0.1 mmol L−1 for HAuCl4 and 0.05 mmol L−1 for PVP. In this work, 10 mL of each resulting reaction medium was treated by the plasma jet at a power supply current of 8 A, a frequency of 25 kHz, 3 L·min−1 of gas flow rate, and an RF power varying from 0 W to 30 W, and the distance between the exit of the plasma from the tube and the liquid was fixed at 6 mm, making sure that the plasma plume touches the surface of the liquid.

2.4. Characterization Techniques

UV-visible spectrophotometer V-670 from Jasco (Oklahoma City, OK, USA) with a Halogen lamp (330 to 2700 nm) as the light source was used for characterizing the optical properties of the nanoparticles, such as their plasmon resonance absorption band, which is sensitive to the size, shape, and surface properties of the nanoparticles. UV-visible absorbance simulations were performed using PyMieScatt package and room temperature refractive index [20]. Dynamic Light Scattering (DLS) measurements were carried out on a Zetasizer Nano S (Malvern Instruments, Malvern, UK), setting the material as polystyrene latex (RI = 1.590, Abs = 0.010) and the measurement angle at 173° backscatter (NIBS default). The analyses were carried out at 25 °C in a water dispersant using low-volume disposable plastic cuvettes with a 1 cm optical path and an equilibration time of 120 s. The resulting value is an average of 3 measurements of 11 runs each, with the run duration set at 10 s. Scanning electron microscopy (FESEM ZEISS Sigma HD, ZEISS, Baden-Württemberg, Germany) was used to obtain high resolution images of the synthesized nanoparticles, providing information on their size, shape, and morphology. The samples were prepared by placing a drop of the plasma-treated solution on a silicon (100) wafer and spin coated for 30 s. The silicon surface was cleaned beforehand by a base piranha etch. The average size of the nanoparticles was obtained using ImageJ software 1.49v over 100 particles per each condition. To electrically characterize the plasma discharge, the voltage of the pulsed electrode was measured by means of a capacitive voltage divider (Le Croy PPE6KV-A, Ramapo, NY, USA) and the charge through the sample was measured with a 22 pF capacitor in series to the ground below the beaker containing the solution [20]. In addition, a multi-channel spectrometer AvaSpec from Avantes (Apeldoorn, The Netherlands) was used to measure the plasma’s optical emission spectrum. A fiber optic cable with a parallel beam condensing lens was placed perpendicular to the plasma at a 10 cm distance. The diameter of the parallel beam was about 5 mm; therefore, the fiber was collecting a spatially integrated signal of the whole plasma plume between the liquid surface and the outlet of the jet. The integration time was of the order of 200 ms. Plasma gas temperatures were obtained by fitting OH, N2, and NH spectral bands by means of MassiveOES code [21]. The OH (A-X) transition was used to determine the rotational temperature and the fitting was performed in the 303–320 nm interval with a Lorentzian HWHM of 0.03 nm. The vibrational temperature was obtained by the N2 (C-B) bands fitting in the interval 300–355 nm, also considering in the fitting the OH (A-X) and the NH (A-X) bands.

3. Results and Discussions

To evaluate the effect of a dual-frequency atmospheric pressure plasma jet (DF-APPJ) source on the gold nanoparticle production, we kept fixed the geometrical configuration of the setup, the power of the µPulse, and the flow of the gases. The only scanned parameters were the RF power (0–30 W), the time of the treatment (10 min, 20 min), and the process gas species (He, Ar). First, we will present a characterization highlighting the differences of the instrumental set-up through the parameter changes, and following, we will focus on the nanoparticle production.

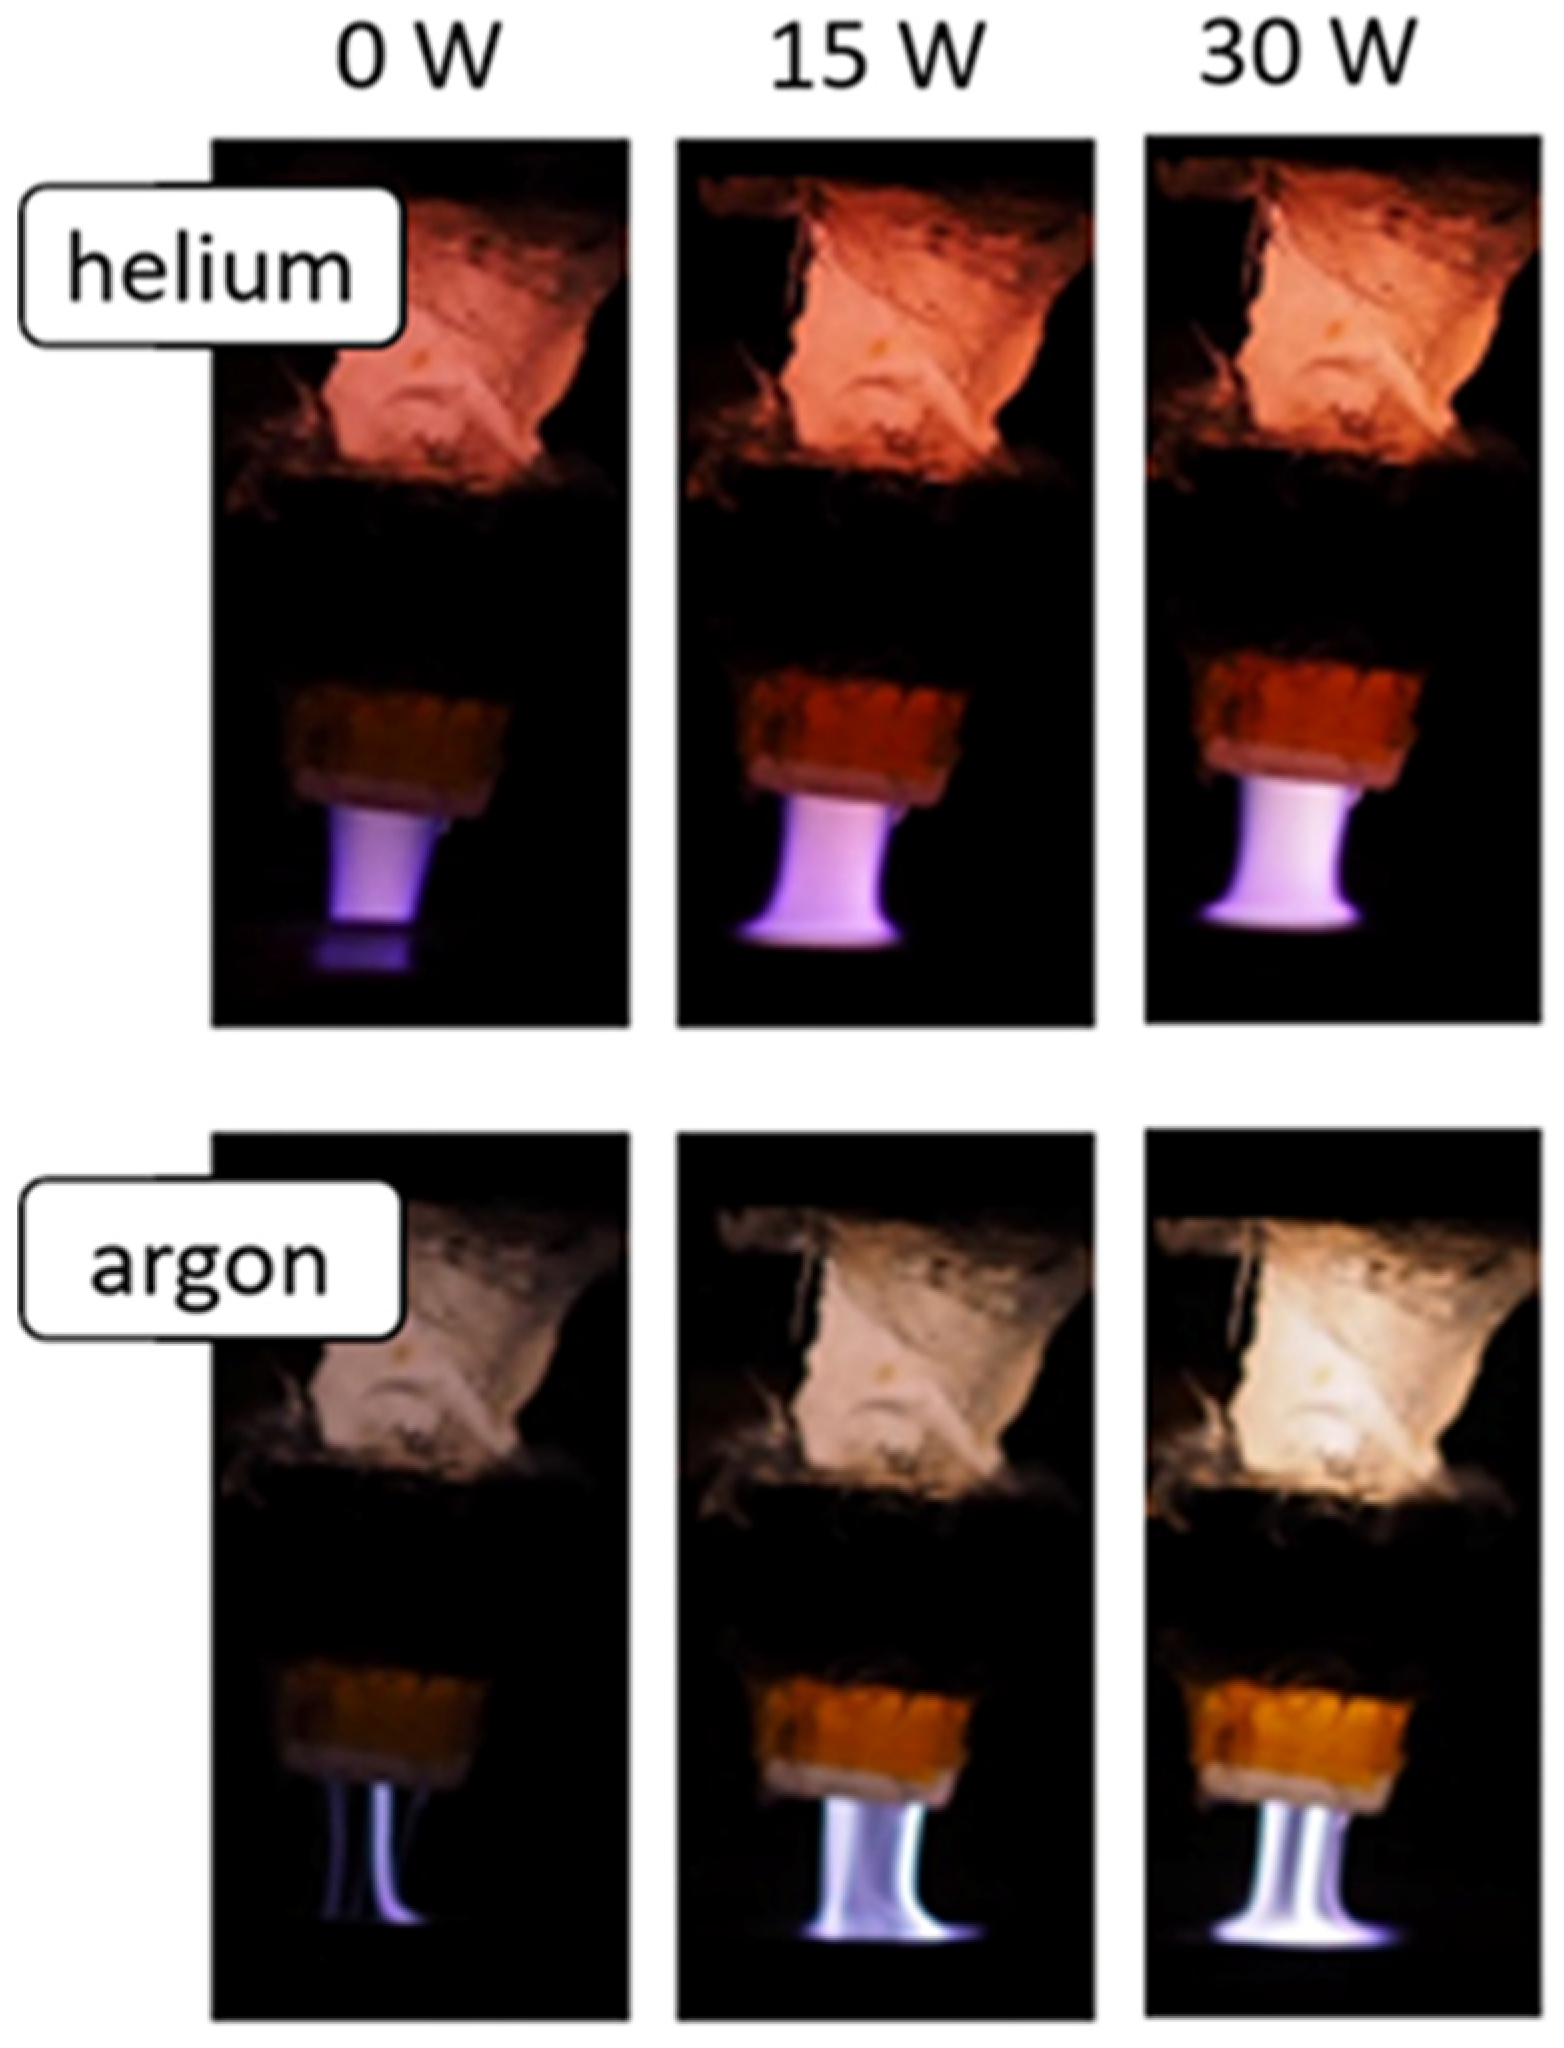
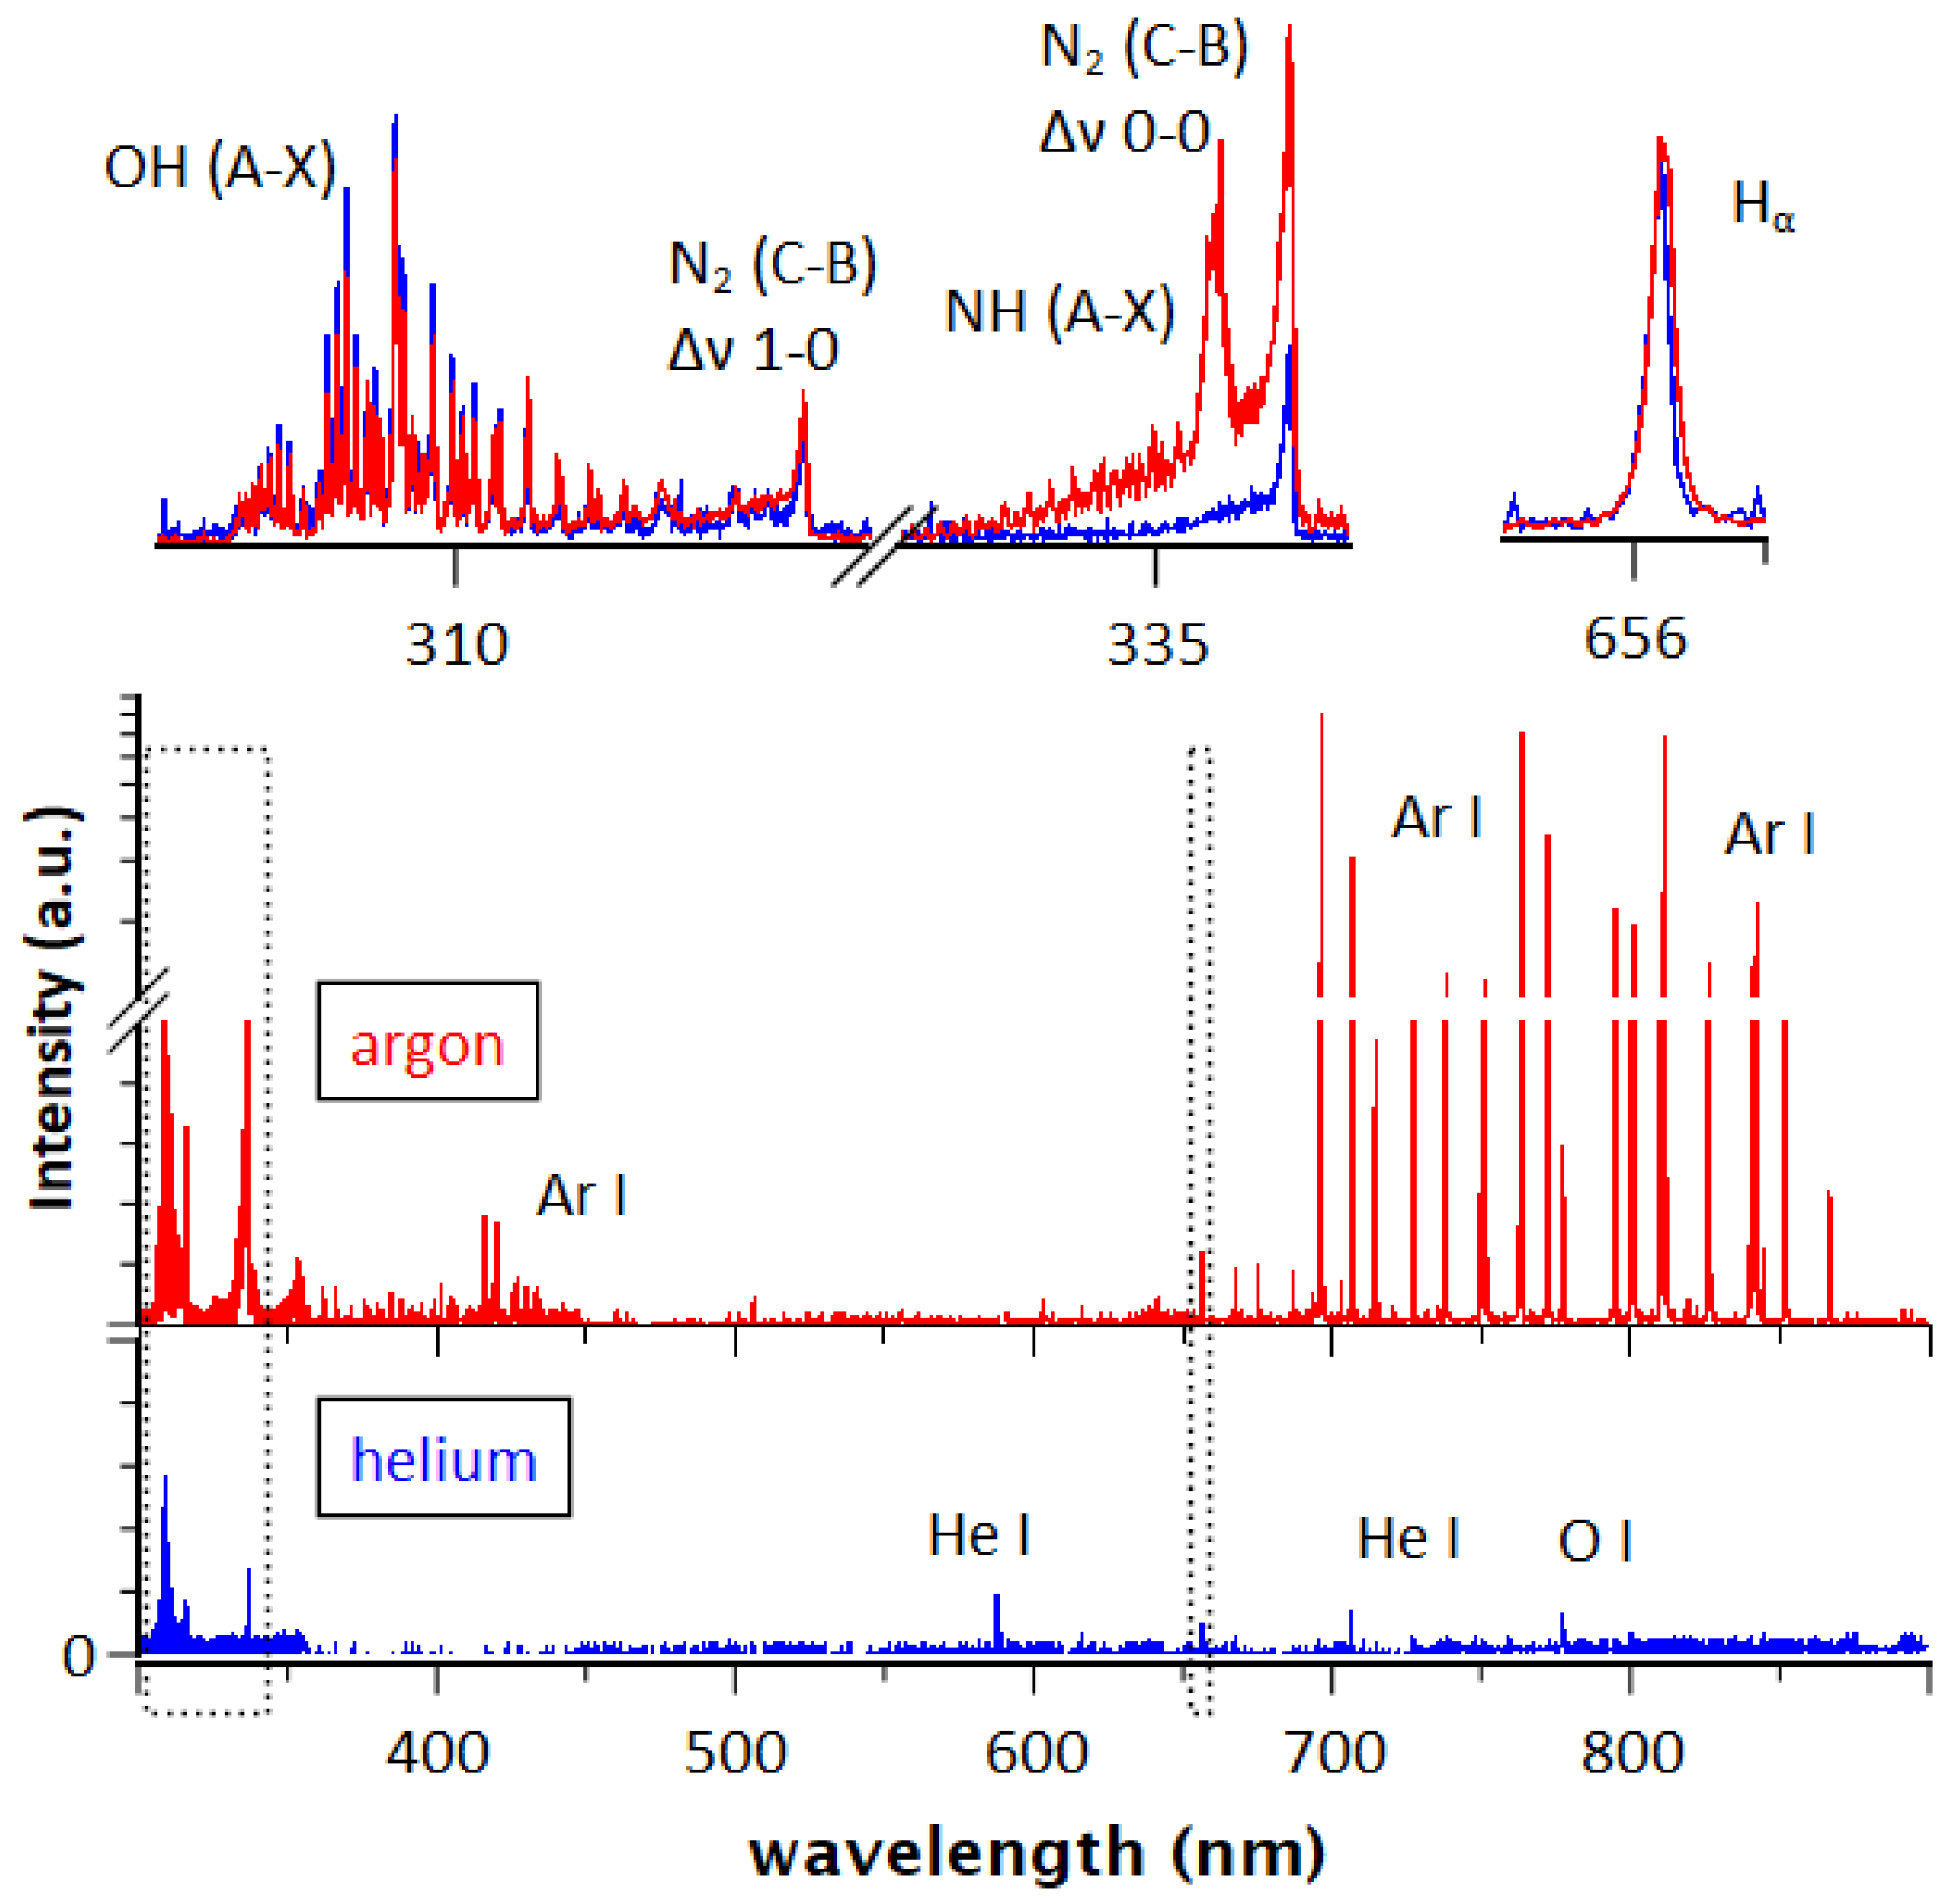
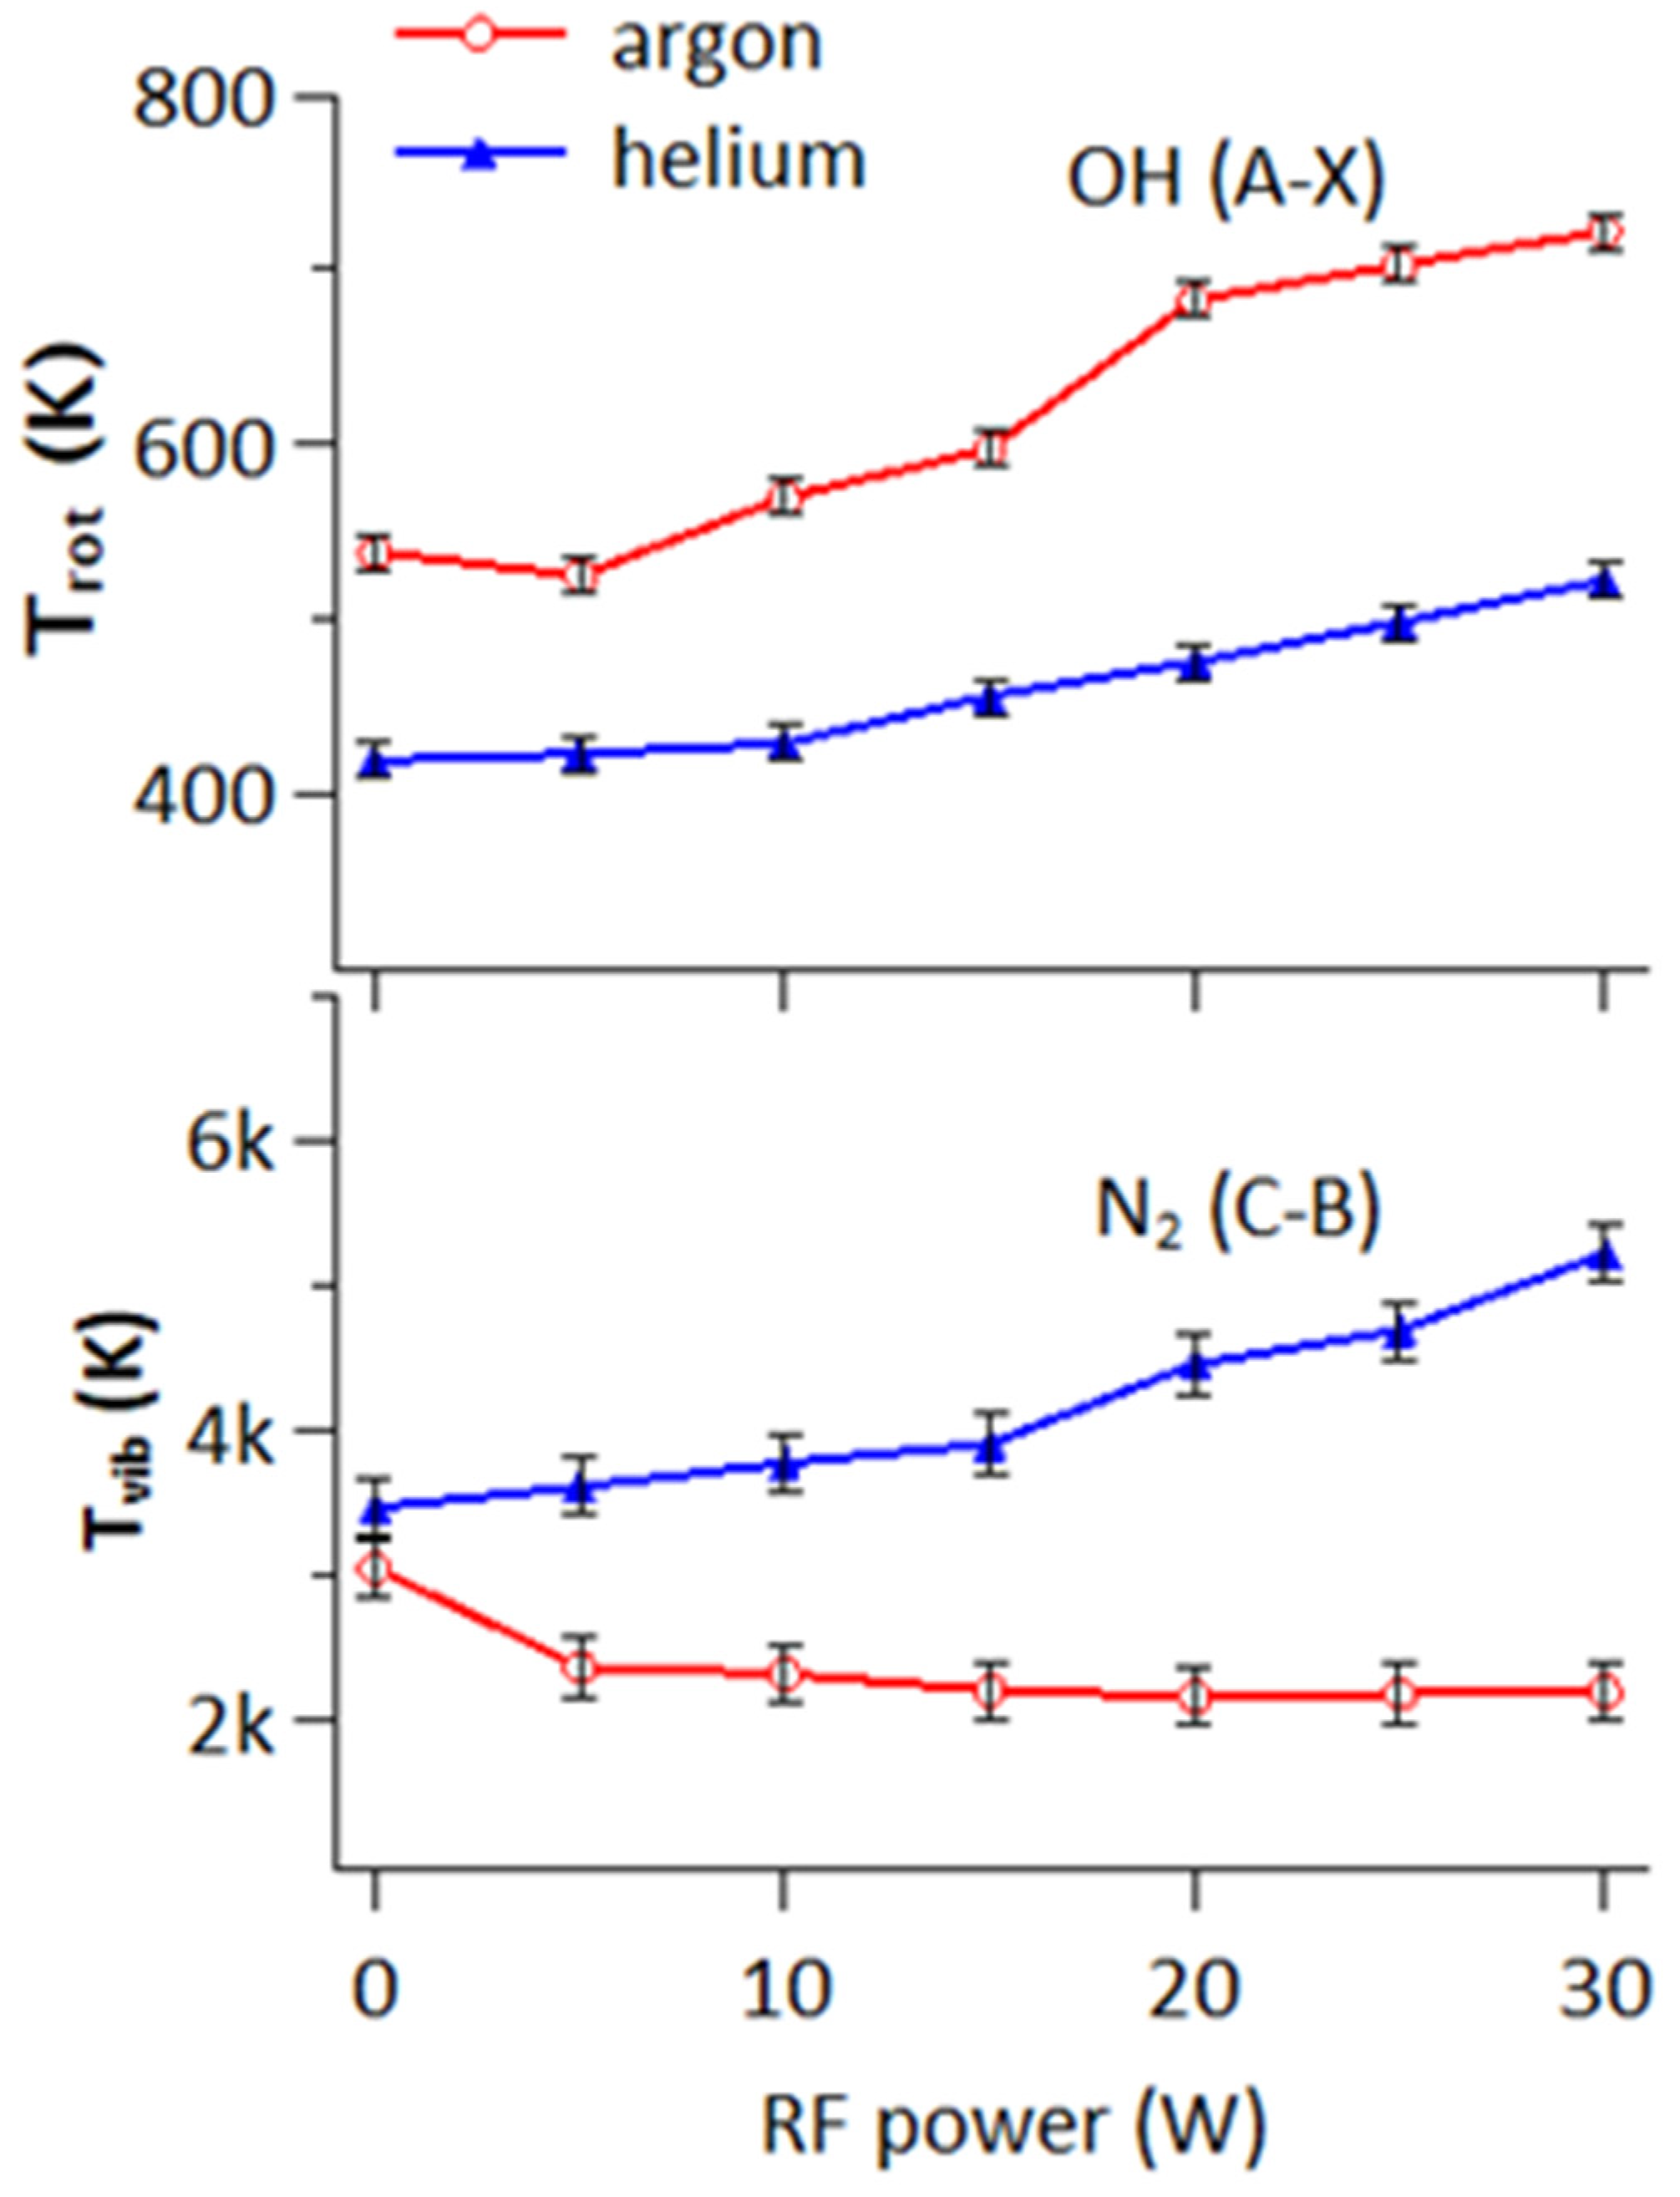
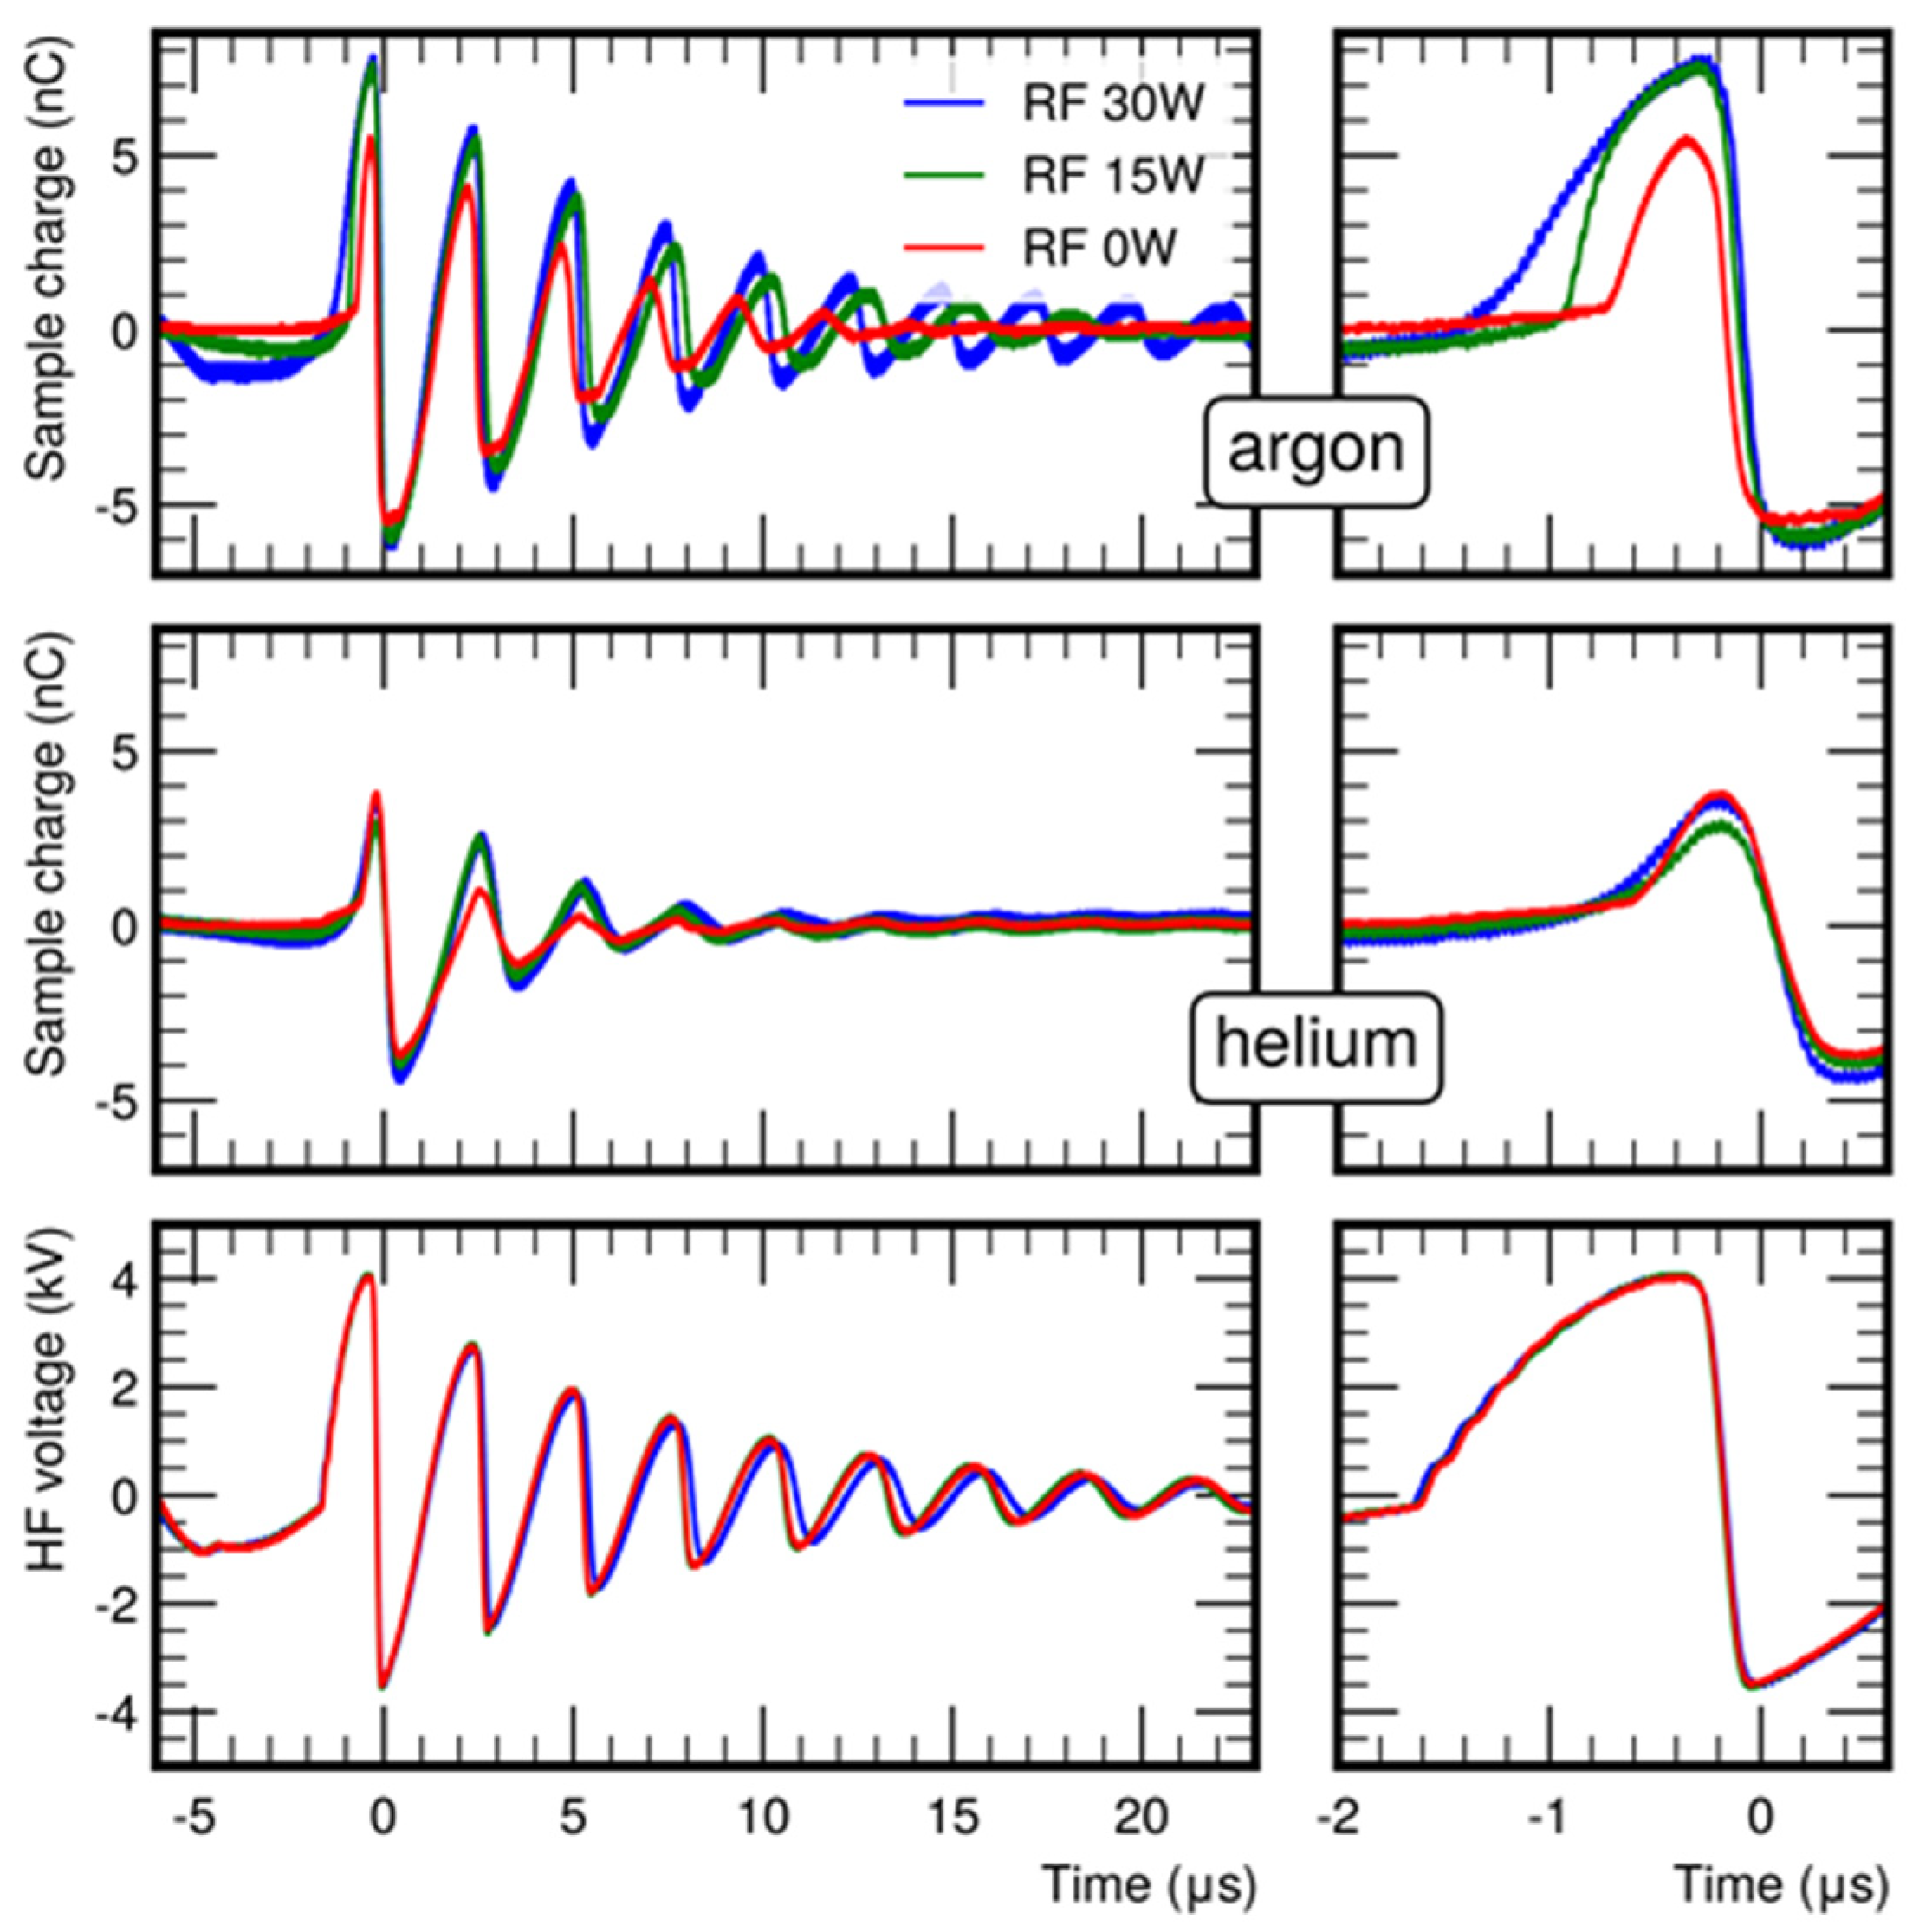
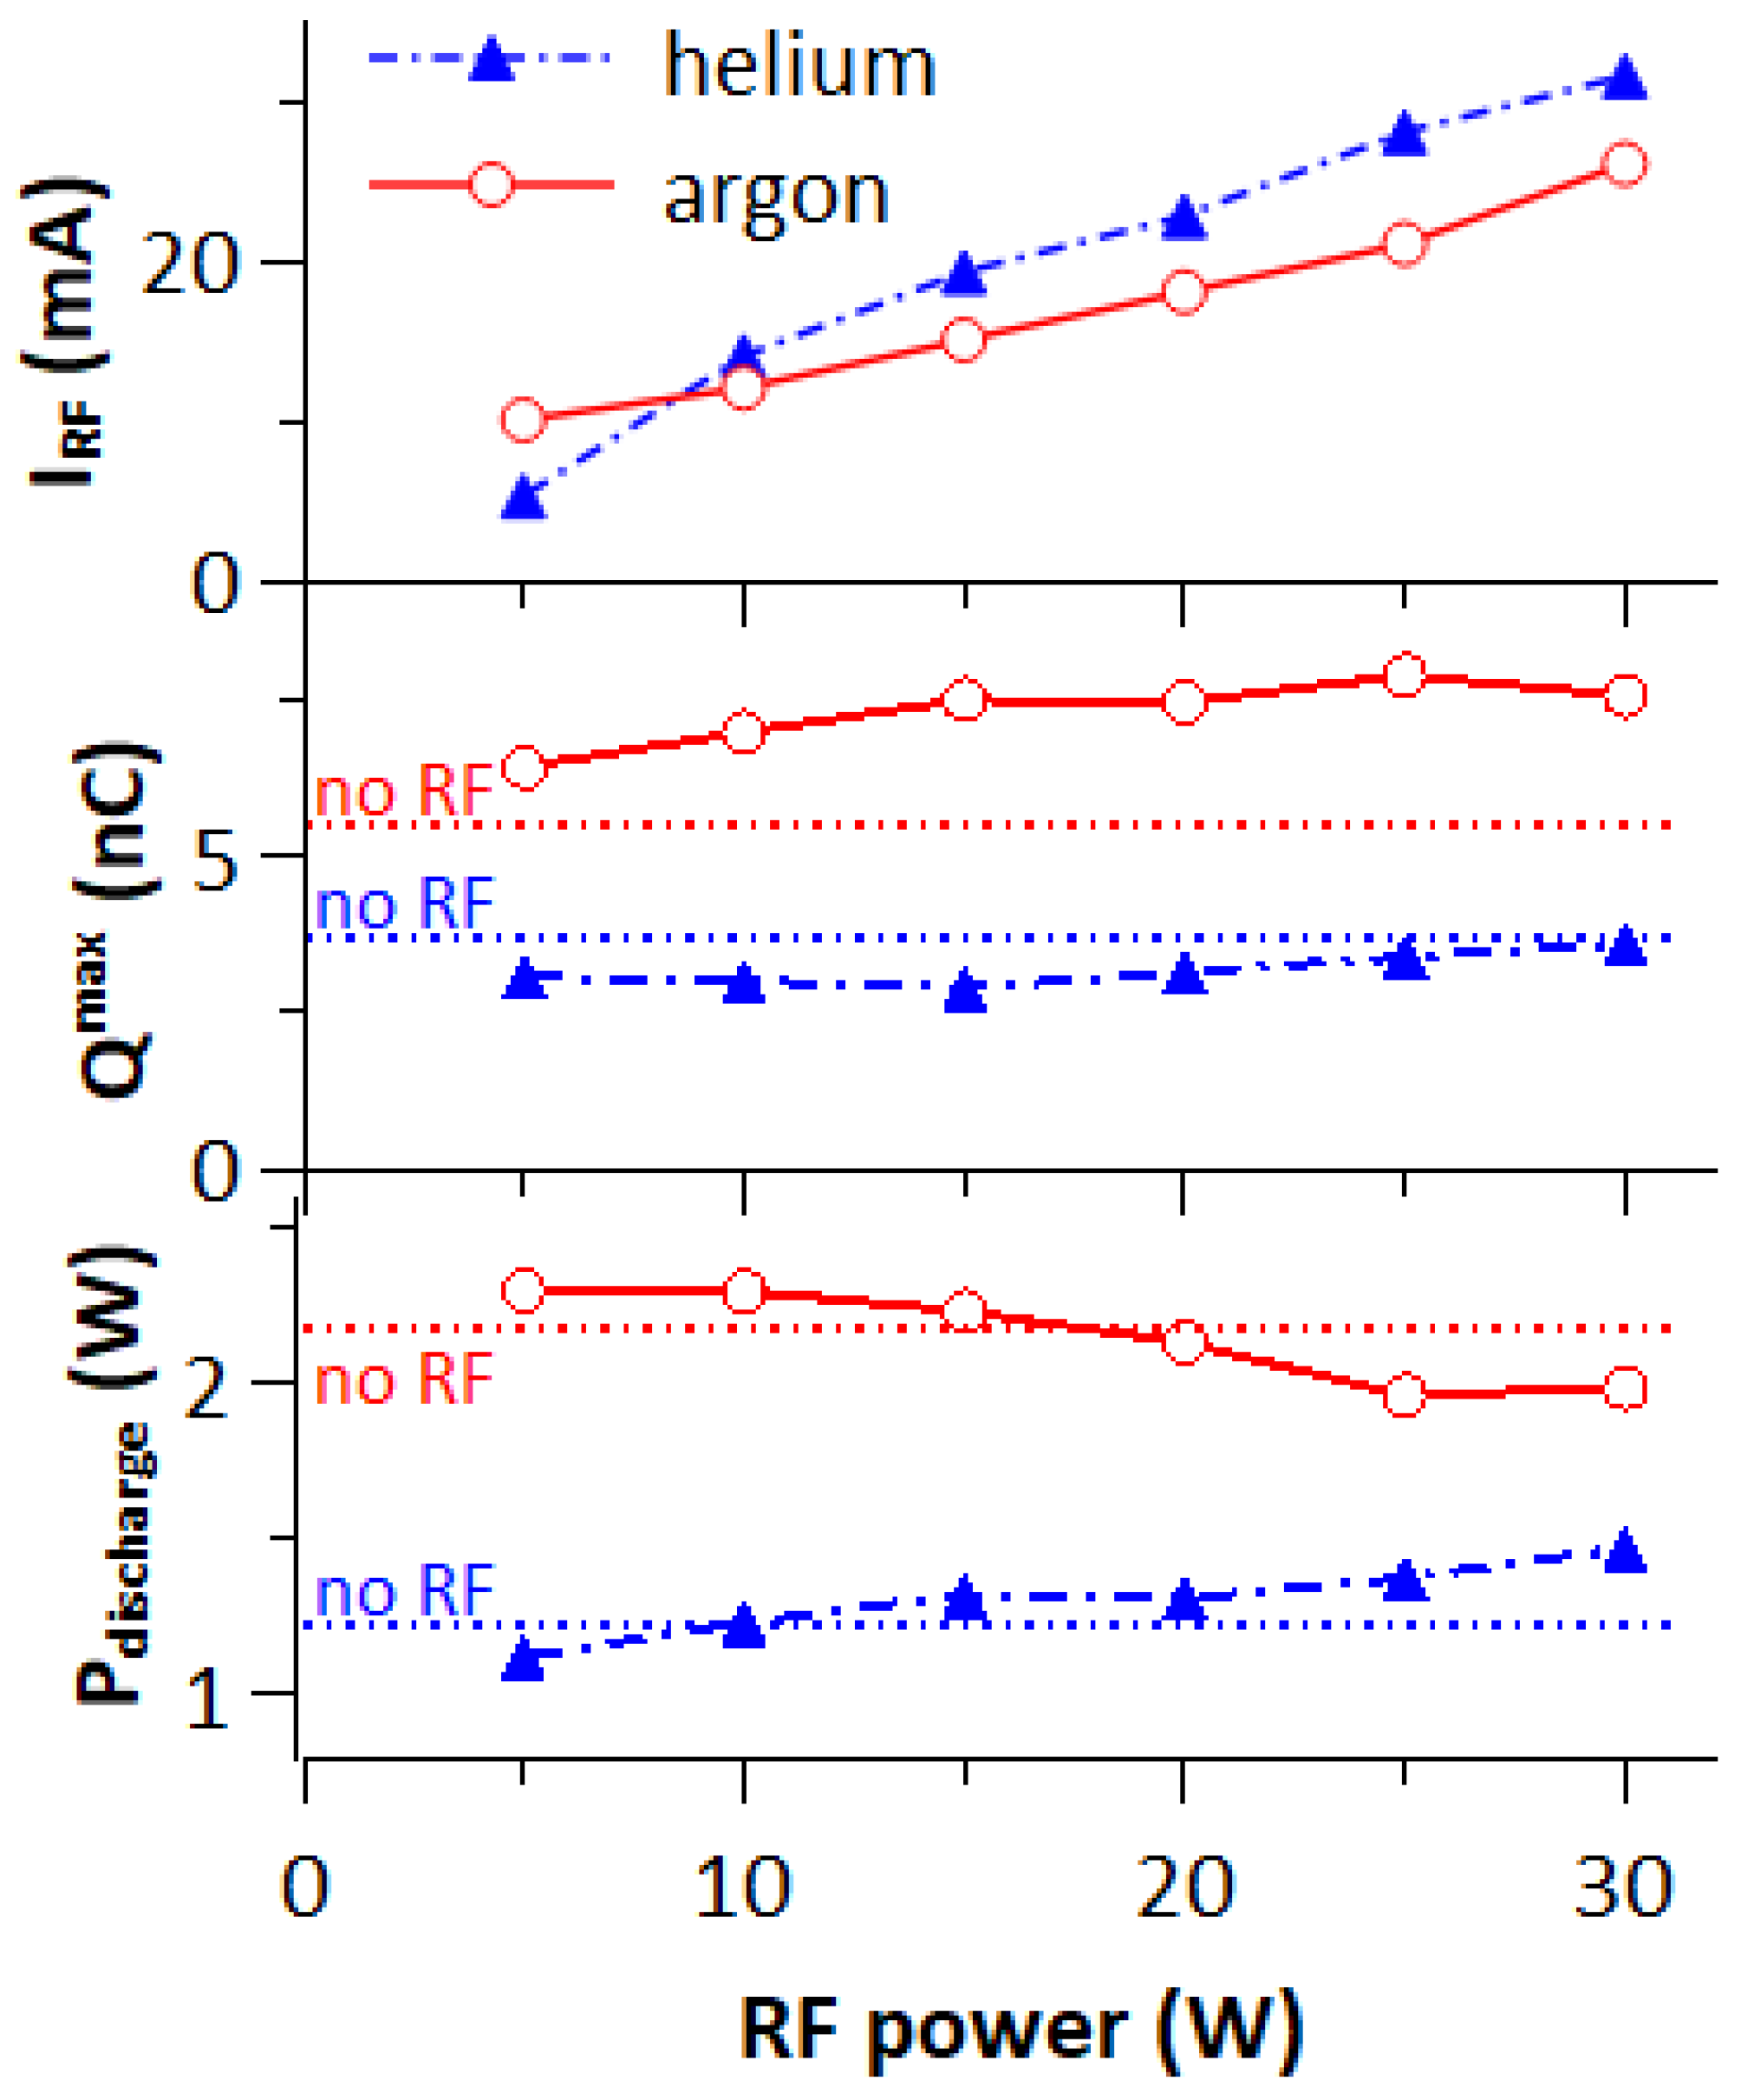
3.1. Plasma Characterization

The visual appearance of the DF-APPJ on the liquid surface is presented in Figure 2. When helium gas was used, the plasma exhibited uniformity over a 30 ms exposure time, while with argon, it displayed a filamentary structure. In both cases, the plasma extended across the liquid surface and the overall brightness intensified as a function of RF power.
With argon as the process gas, the filaments exhibited random movement following the annular outlet of the dielectric tube. To account for this plasma instability, Optical Emission Spectroscopy (OES) was conducted, collecting light from a 5 mm circular parallel beam that encompassed the entire plasma area, spanning from the jet outlet to the liquid surface.
In Figure 3, the spectra relative to the condition of 30 W RF power for the two gas species are shown. The main spectral lines are indicated in the graphs [22,23,24]. The argon plasma appeared with a generally more intense emission than helium; in both cases, we detected the nitrogen second positive system (N2 SPS), the OH band, the atomic oxygen, and hydrogen lines. In Figure 4 and the upper part of Figure 3, the OH (A-X) transition and the N2 (C-B) bands for argon and helium at 30 W RF are shown, while in Figure 4, the results of the rotational temperature (Trot) derived by the OH and of the vibrational temperature (Tvib) derived by the N2 SPS as a function of the RF power are presented. Both discharges exhibit an increase in Trot as a function of RF power levels, although for helium gas, this variation remains confined within a range of 100 K. Furthermore, the Trot for helium consistently remains below 500 K, aligning with expectations and remaining approximately 100–200 K lower compared to argon [25]. This lower temperature is also highlighted by the absence of the NH emission at 336 nm [26]. The increase in NH formation may be also due to a higher evaporation of the solution, as highlighted by a stronger increase in the OH band and the O I and Hα emissions in argon.
The higher plasma temperature in argon is also due to its lower thermal conductivity, which also contributes to its filamentary structure formation [27]. The formation of higher density plasma channels in argon is also suggested by the higher stark broadening of the Hα line, with respect to helium conditions (Figure 3). While the Trot can usually be linked to gas temperature and, therefore, also to the power delivered in the discharge, the Tvib is more linked to a direct electron energy transfer to the molecules. In the helium discharge, the Tvib is higher than in argon, which is consistent with its outer equilibrium condition, but also increases as a function of the RF power applied. This increase may be due to the higher power dissipated in the discharge but can also suggest enhanced electron heating or a change in the plasma regime. The plasma generated in argon does not show the same trend; however, this information, at the same time, may be affected by the moving filamentary structure.
To highlight further differences related to the dual frequency coupling applied to the µPulse, a temporally resolved characterization is required. The pulse voltage applied to the upper electrode is shown in Figure 5. It was characterized by a pre-pulse negative bias which lasted a few microseconds. Then, the pulse itself came from an impulse current charging an RLC network and the pulse peak had a risetime in the order of 100 ns. The oscillations last a few tens of microseconds and, therefore, do not overlap between the 25 kHz cycles. In Figure 5, the charge collected below the solution to the ground for both process gases at different RF power levels are also shown. When no RF was applied and only the µPulse was working, the plasma plume reached the liquid surface, and the corresponding charge could, therefore, be collected in the capacitor to ground below the solution. It can be observed that in the pre-pulse no charge is collected, indicating that there is no residual ionization among the pulses repetition. As the upper electrode became positive the electrons were attracted, leaving a positive spatial charge behind. These positive charges drifted to the liquid, generating a self-propagating head. Its propagation is quite fast, of the order of a few tens of nanoseconds. An ionized channel was then formed between the liquid and the µPulse electrode; therefore, the following oscillations led to a capacitive coupling, as can be observed by the similar shape of the voltage and charge oscillations. It can be easily observed that the charge collected using helium is nearly half that in argon, which coherently reflects the differences in plasma density observed by OES. As a conclusion, the main part of plasma generation is centered in the first pulse, which is zoomed in in Figure 5.
When adding the RF power, the voltage at the RF electrode reaches 500 V at 30 W; however, the HF electrode does not record significant coupling. Therefore, plasma changes cannot be ascribed to any electrical resonance effect. We can observe an increase in the maximum charge collected by the liquid, with a very low dependence on the RF power. This increase is probably due to the shift of a denser plasma region from inside the tube to the outlet where the RF electrode is located. It is mainly as if the µPulse electrode gets closer to the liquid surface, leading to stronger electric fields. Moreover, this effect is more evident in the case of argon gas due to its higher plasma density and filamentary structure. This higher plasma density also allows the persistence of the plasma channel between two consecutive µPulses. This stable electrical connection between the HF and the liquid surface improves the capacitive coupled character of the discharge, and the surface charge on the liquid more closely matches the supplied voltage at HF.
On the other side, three distinct differences are linked to the coupling of the RF. The first is the presence of an oscillating sample charge with the frequency of the RF through the whole duration of the pulse. The second is the negative current through the liquid in the pre-pulse. And the third is the change in slope of the collected positive charge on the capacitor, consequently affecting the ion current through the liquid during the pulse. With both gas species, as the RF power increases, the current decreases due to the influence of the high-frequency (HF) voltage, while the duration of the current pulse elongates, similar to where the self-propagating head becomes less dense, larger, or slower in its propagation. All three of these effects can be attributed to a common source: the introduction of RF, which establishes a plasma region hindering the bullet’s propagation but facilitating capacitive coupling of the pulse electrode voltage with the liquid.
As aforementioned, the RF addition reduces the current due to the HF electrode; however, the RF current induced through the liquid is not negligible. It is recorded through the capacitor to ground and exhibited an increase from 10 to 30 mA as a function of power (Figure 6 top). Notably, the maximum current attributed to the µPulse in the absence of RF stands at approximately 120 mA for the case of Ar gas and around 45 mA for helium. This underscores the significance of the induced RF current.
However, it is intriguing to note that the maximum charge collected at the capacitor registered only a moderate increase in response to the varying RF power (Figure 6 center). In addition, considering the power dissipated in the discharge as the integral between the pulse electrode voltage and the charge collected at the capacitor (Figure 6 bottom), the addition of the RF power does not change drastically; showing moderate trends. It is imperative to acknowledge that even at maximum RF power, if the µPulse is deactivated, the RF currents flowing through the liquid remain below 1 mA. These observations suggest that the HF voltage is the main factor responsible for the plasma interaction with the liquid, governing delivered power and ion flow. On the other side, the RF power generates a pre-ionized region, transitioning plasma propagation from a streamer mode to capacitive coupling. This phenomenon aligns with the existing literature findings on dual-frequency plasma in parallel plates configuration, where the lower frequency regulates ion drift and influences the transition from bulk ionization in Ω-mode to secondary electron-driven ionization, as in Penning mode [28,29,30]. The presence of the Penning mode, where electrons are accelerated in the sheath and electric fields are stronger, may be responsible for the increased Tvib in helium.

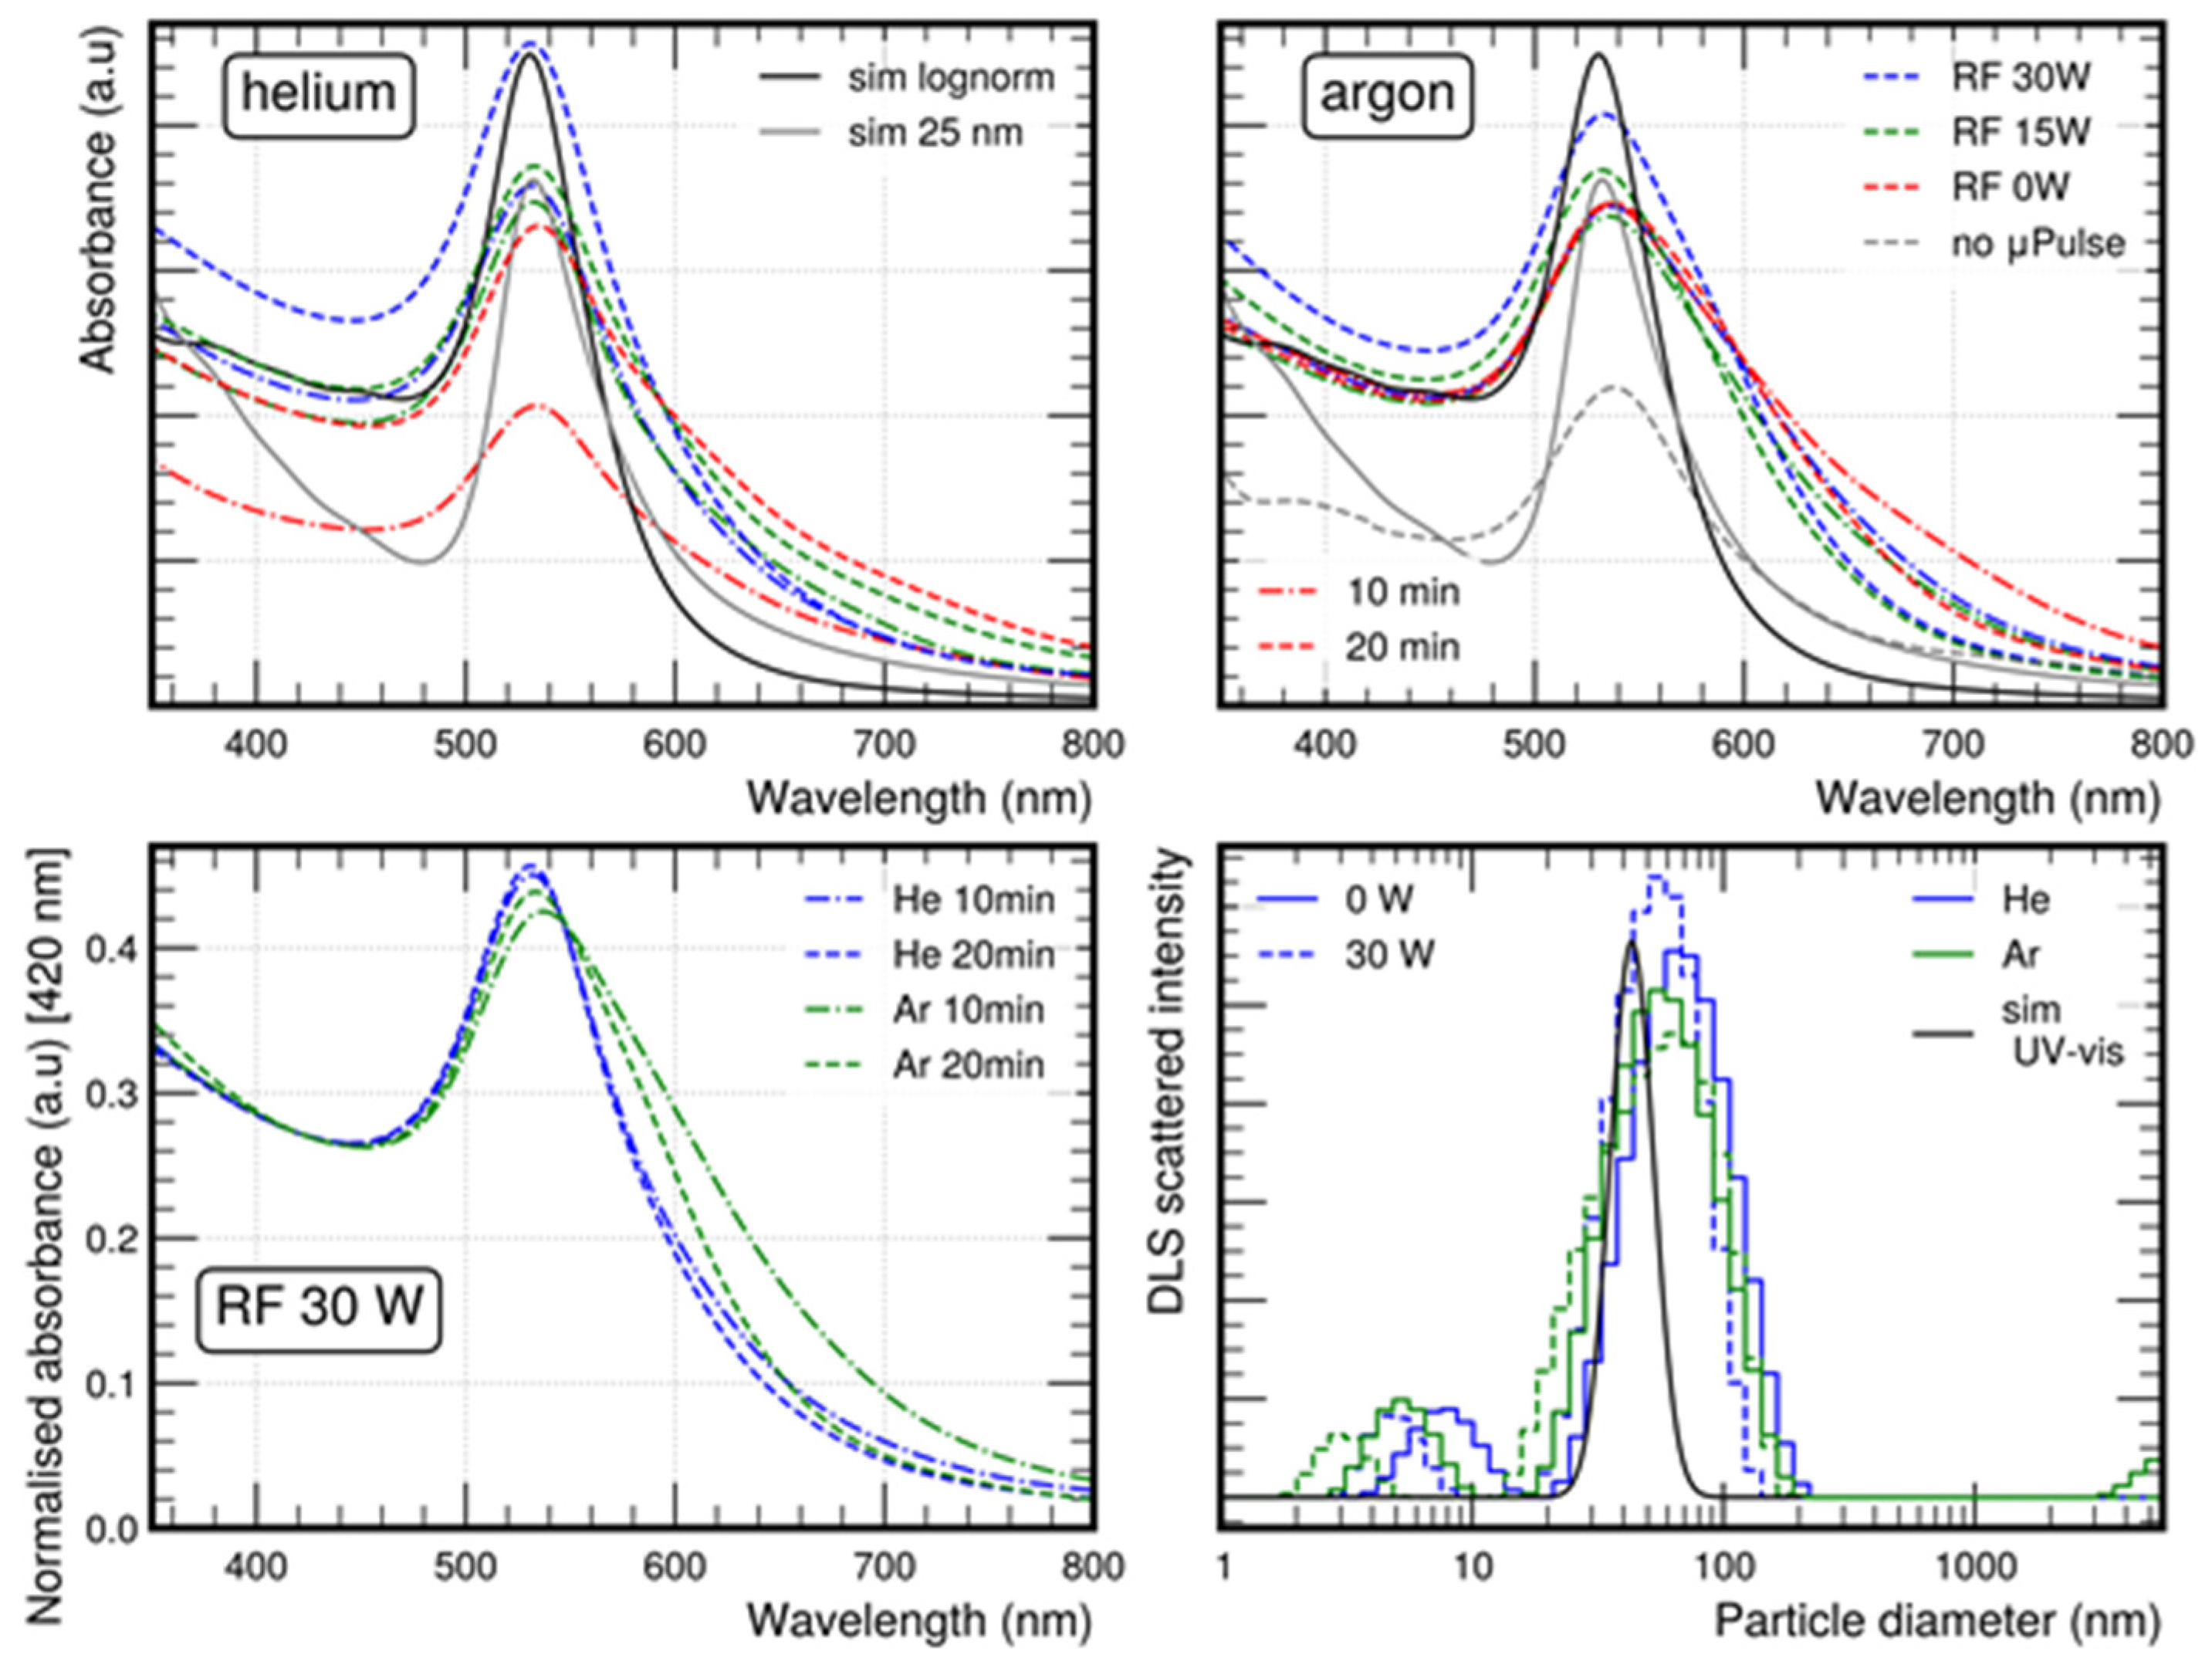
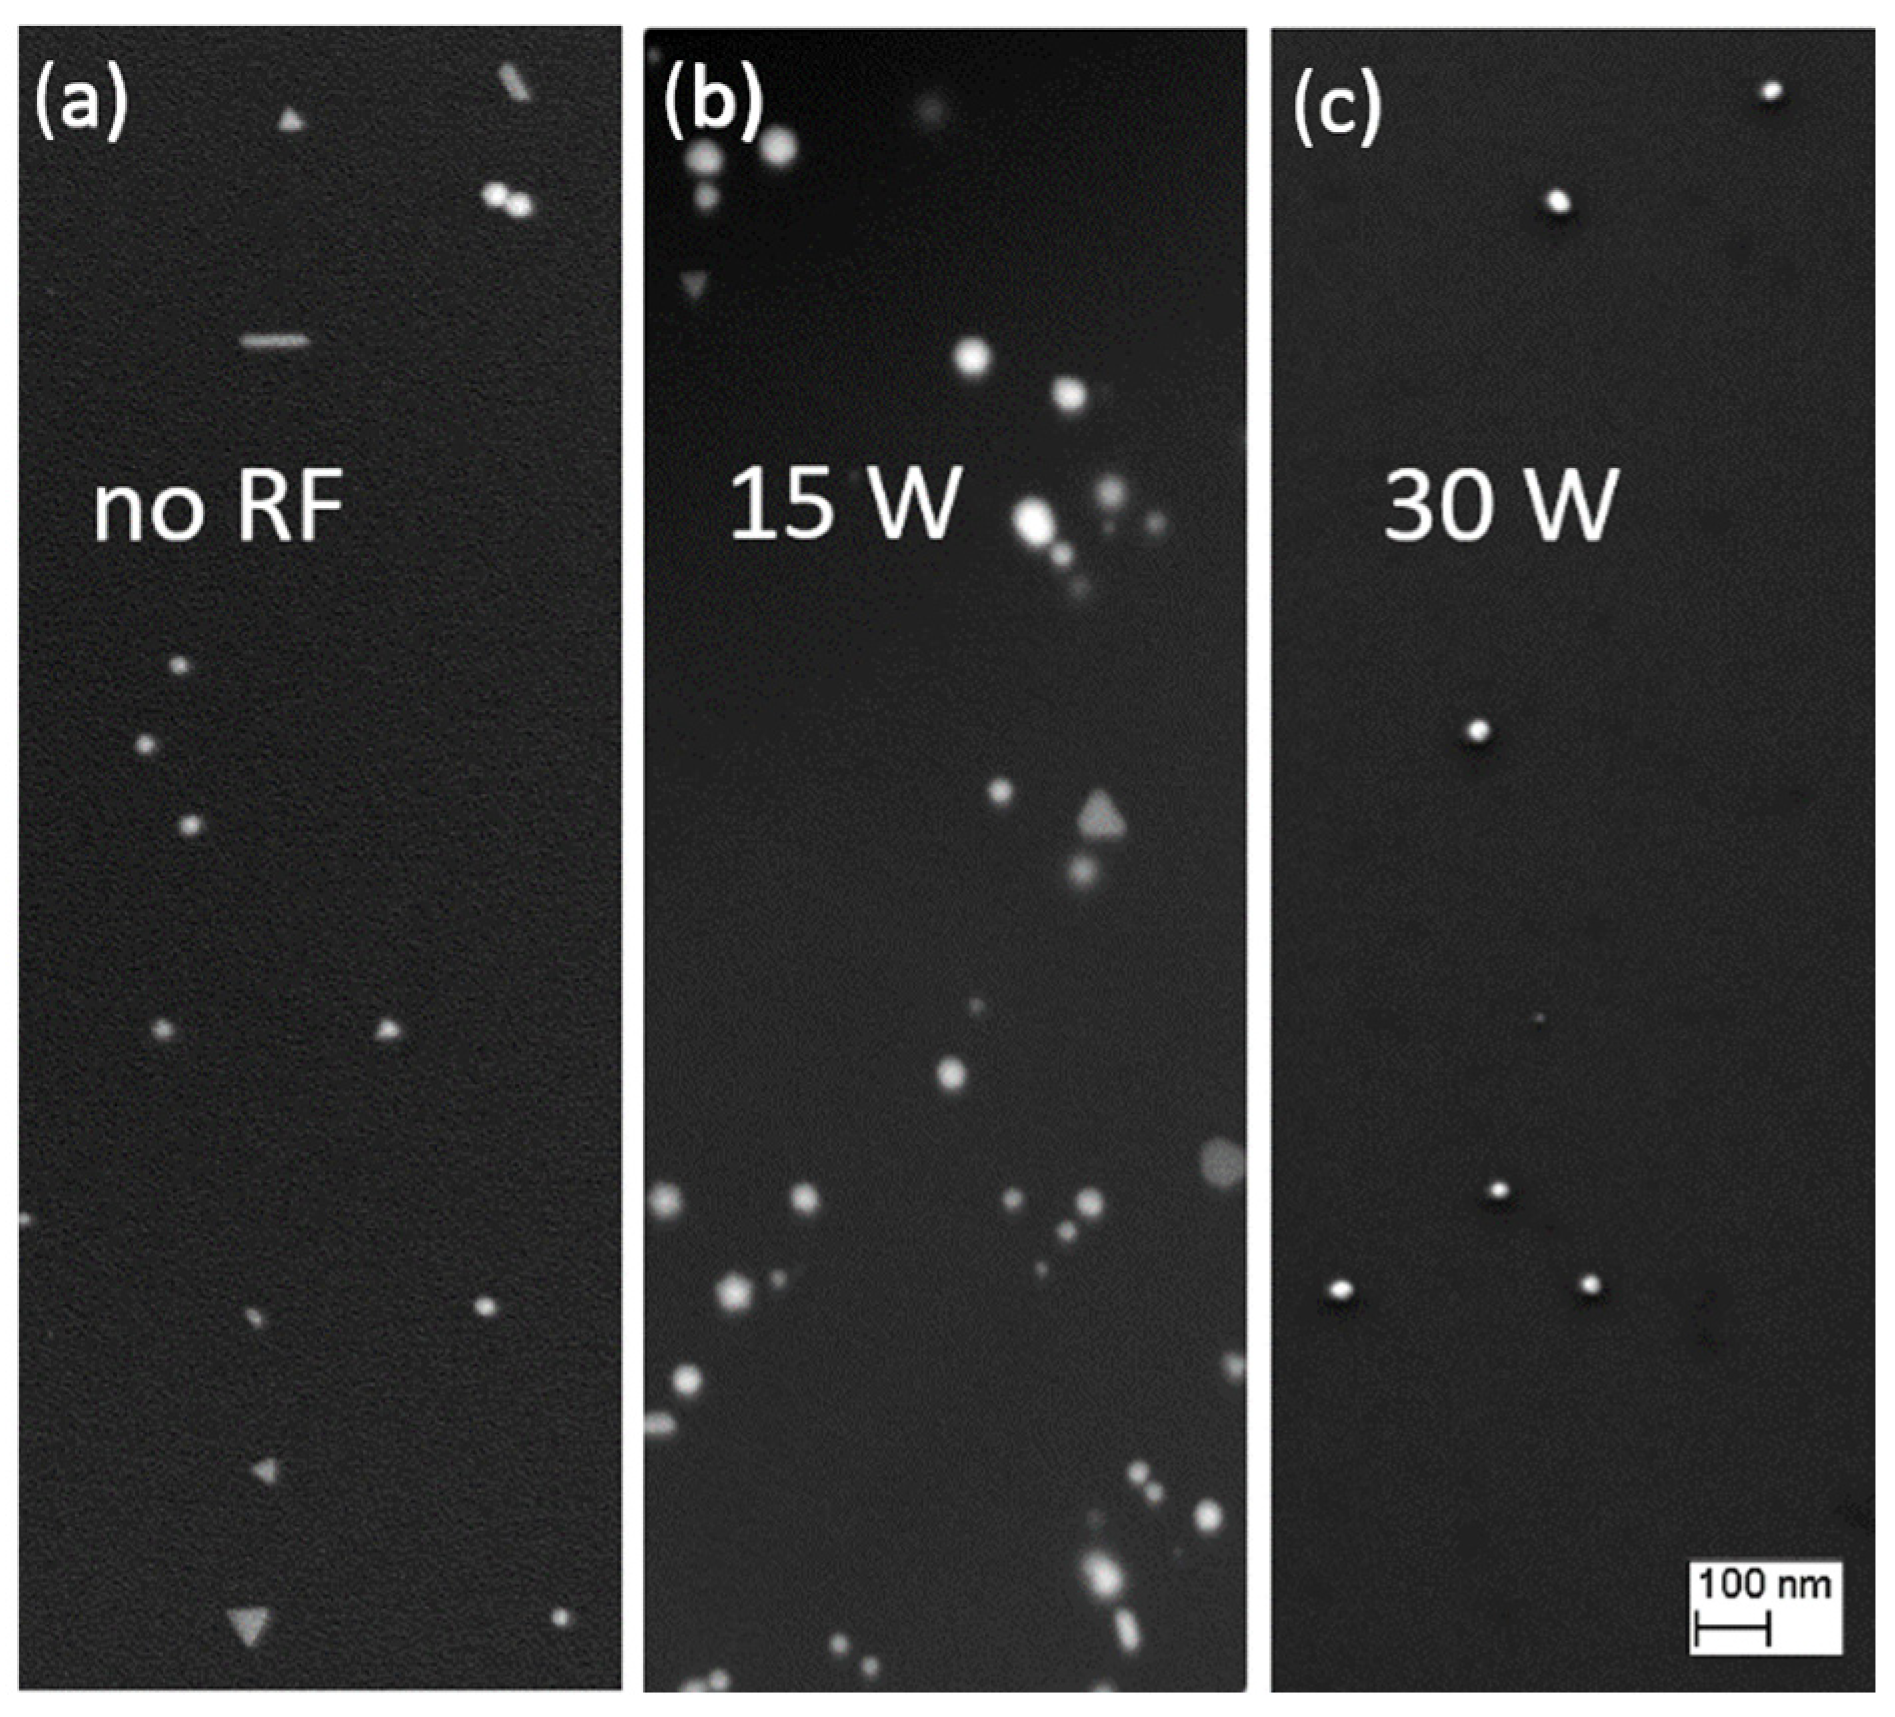
3.2. Influence of Process Conditions on Gold Nanoparticles Size and Shape

The size and shape of gold nanoparticles can be influenced by various parameters during their synthesis. A solution with 0.1 mM of HAuCl4 as a precursor and 0.05 mM of PVP as a capping agent was used to prepare several samples of 10 mL each, which were then treated by plasma with helium and argon as process gases and at different conditions, RF powers (0, 15, 30 W), and plasma exposure durations (10, 20 min). The resulting samples were characterized firstly by UV-vis spectrophotometry and the results were compared to determine the influence of the conditions on the size and shape of the obtained gold nanoparticles.
In Figure 7, the absorbance spectra of the treated gold nanoparticle solutions are presented for different RF powers and treatment durations. As can be observed from the integrated plasmon absorption, a longer treatment time and higher RF power led to a higher particle concentration. The time effect is more evident in helium discharge than in argon, highlighting the nonlinear production rate which is probably linked to the evolving conditions of the solutions as pH and conductivity.
The samples produced with no RF power showed a shoulder band at longer wavelengths, which could be associated with a different particle size or shape [10]. As the treatment time increases, this shoulder increases in intensity relative to the plasmon maximum absorption. Using argon, the shoulder is more pronounced, suggesting an even wider number of shapes and sizes of nanoparticles. The deconvolution of the particle size and shape profile from the plasmon band feature is challenging since additional preliminary information on particle distribution is required. However, in order to draw a guideline for the spectra comparison, in Figure 7 a simulation of the absorbance spectrum due to a gold nanosphere lognormal distribution centered at 45 nm and 0.2 of standard deviation is added. The maximum absorption band wavelength of the simulation is in the range of the experimental data, suggesting an average size of the same order. This maximum band shifted to lower wavelengths when RF power was introduced, decreasing from 535 nm without RF power to 531 nm in helium and at 532 nm in argon with 30 W power. While this shift could potentially be the result of a decrease in the nanoparticle size [31], it might also result from the addition of RF power, causing a transition from asymmetric shapes, as depicted in Figure 8a, to more spherical configurations, as illustrated in Figure 8c.
Since the interband part of the spectra nearly overlaps with the simulation, indeed, the shoulder band at higher wavelengths is probably due to the particle shape. The shoulder starts to decrease with the addition of RF power at both treatment times. At 30 W RF power, the spectra get closer to the simulated one. In addition, there is nearly no change in the spectrum shape as a function of the treatment time, especially in helium, suggesting stable production conditions (Figure 7). When argon is used as the process gas, the nanoparticle distribution exhibits a wider range compared to the helium scenario. However, with increased treatment duration, the UV-vis spectra tend to converge.
DLS measurements were performed to confirm the suggestions on the nanoparticle’s distribution obtained by the UV-vis spectra. The scattered intensity distribution as a function of particle size is presented in Figure 7. The size obtained is higher than with UV-Vis because DLS measures the hydrodynamic diameter of nanoparticles in a liquid solution, accounting for the surrounding solvent molecules and their movement, resulting in a slightly larger apparent size. However, the results obtained confirmed the tens nanometer range lognormal distribution, and a higher average size and broader distribution in argon relative to helium. In argon with no RF, the DLS measurement also shows the presence of bigger size agglomerates. As the RF is switched on, the average diameter in both the argon and helium gases showed a relevant decrease that was in agreement with the UV-vis observations.
To further confirm this analysis, scanning electron microscopy (SEM) was used to visualize the formed nanoparticles. Figure 8a shows the nanoparticles synthesized with the µPulse power supply without the addition of RF power for 10 min and reveals some exotic shapes other than spheres, such as rods, triangles, and pentagons, with an average diameter of 28 ± 10 nm. Also, Figure 8b with an added 15 W RF power presents nanoparticles of different shapes but with less variation than the previous samples. In Figure 8c, the particles are spherical and well separated with no agglomerations seen in the images, with an average diameter of 22 ± 10 nm calculated by measuring random nanoparticles in the SEM images Additional SEM micrographs can be found in Supplementary Figures S2 and S3. The observed decrease in average size and the reduction in the asymmetric particle shapes as the RF power was introduced support the analysis performed. AFM measurements also supported the SEM data and can be found in Supplementary Figures S4 and S5.

3.3. Implications of Dual Frequency on Gold Nanoparticle Production

Given that the shape and size of synthesized gold nanoparticles are influenced by many factors, an analysis of the dual-frequency impact on production synthesis needs the examination of all altered parameters, for example, the processing gas, which has a substantial influence on plasma conditions. The use of helium ensures a lower processing temperature and lower plasma density and, therefore, also a lower current density. Even in the configuration where no RF power is applied, helium allows the production of gold nanoparticles with a lower spread of shapes and sizes with respect to argon.
Helium consistently enables the production of gold nanoparticles with narrower variations in shapes and sizes compared to argon. The exact cause of this discrepancy remains undetermined. Nonetheless, with both gas species, the introduction of RF coupling results in a reduction in the higher wavelength shoulder, as observed in the UV-vis absorption spectra. Notably, the production rate of nanoparticles does not exhibit a linear correlation with RF power, aligning with the notion that the processes induced in the liquid are primarily driven by the plasma–liquid interaction, rather than the plasma itself. Furthermore, even the charge collected on the liquid surface does not demonstrate a linear dependence on RF power.
In order to understand such phenomena, we have to consider how the generator coupling may affect the production process. A major effect of the introduction of RF, certainly, is the generation of a continuous RF current through the liquid comparable to the µPulse one. This RF current can cause electrolysis of water molecules or an increase in the solution temperature. The solution temperature after 20 min of argon plasma treatment at maximum RF power increased by 5 °C. Therefore, the increased evaporation rate recorded with the RF addition has to be attributed more to electrolysis, which also depends on solution conductivity. An additional cause of the increased evaporation rate can be sought in the induced capacitive coupling, which enables faster electrolyte dissociation by the Wien Onsager effect. The separation of a water molecule into its proton and hydroxide ions can be achieved through the influence of an electric field, which essentially pulls these constituents apart. In theory, more potent electric fields should result in accelerated rates of dissociation. This phenomenon is known as the Wien effect [32].
In general, an increase in temperature typically leads to an increase in nanoparticle size, with multimodal distributions due to the acceleration of the reaction processes [33], to agglomeration, or to the Ostwald ripening effect [34]. Ostwald ripening is a process in which small nanoparticles tend to dissolve and redeposit on larger particles, resulting in the growth of larger particles over time. This effect occurs due to differences in the solubility of nanoparticles at different sizes and surface energies. Smaller particles dissolve more readily, and their material is redeposited onto larger particles, causing the overall size distribution to evolve towards larger particles [35]. This effect likely contributes to the more pronounced shoulder observed in the UV-visible spectra when using argon gas as compared to helium.
On the other side, electrolysis during the process results in the generation of hydrogen ions within the solution. In the literature, the presence of H+ ions is commonly associated with a faster reduction process, often leading to the formation of larger nanoparticles [36]. Thus, both temperature elevation and electrolysis would typically lead to an increase in particle size. However, this does not align with the experimental evidence.
Another effect of RF introduction may be the production of a liquid flow during the process. The plasma-induced currents through the liquid are known to generate electrodynamic forces [37], which lead to a flow depending on the ion conductivity. When the liquid is moved at low speed during the particle production process, such as during magnetic stirring, the size distribution of Au nanoparticles is almost the same [38]. With ultrasound stirring, the average size strongly decreases as a function of time; however, the size distribution broadens. Indications from the literature on the liquid flow effect do not support our results, and the RF used is highly relative to the ion mobility, so its impact may have to be further investigated.
On the other side, we showed that the coupling of the RF is mainly changing the plasma from a self-propagating regime to a capacitive coupled configuration. In this change, there is not a variation in the total ion flux into the liquid; however, there is an evident decrease in the current density. This more gradual release of the charges to the liquid may be responsible for the increased control of the synthesis process. In Figure 7, we also added the UV-vis spectrum of nanoparticles obtained in argon with only the RF power at 30 W and no µPulse. In order to obtain the nanoparticle’s production, the jet outlet was set closer to the surface, at 6 mm, to ensure the contact between the plasma plume and the liquid. The only RF condition is capacitive coupled, and the plasma is in the Ω-mode; however, the production rate is far from the analogous conditions when µPulse is on. The explication may have to be sought in the direct coupling of the liquid surface in the hybrid Ω-Penning mode already found in the literature [28,29,30], which controls the ion flow and electron temperatures close to the surface liquid.

4. Conclusions

In this study, a dual-frequency atmospheric pressure plasma jet (DF-APPJ) configuration, coupling a 25 kHz micropulse generator with a 27 MHz RF power supply, was used to synthesize gold nanoparticles. The coupling effect on the morphology of the nanoparticles was investigated as a function of helium or argon species as process gases, of plasma exposure duration, and of RF power applied.
The different plasma configurations were investigated by OES and electrical measurements. The helium plasma is less dense and colder compared to argon, as was expected. The increase in RF power in both cases increases the power delivered to the discharge. However, the main effect of the coupling is the transition from a self-propagating plasma to a capacitive coupling, with lower current densities and, at the same time, an RF current passing through the solution.
The main effect of coupling on the synthesis is the reduction in the spread in size and shapes of the distribution of the gold nanoparticles. The temperature increase due to the RF addition is limited and the electrolysis process led to bigger particles. Therefore, this size control is probably due to the different coupling of the liquid surface with the plasma which reduces ion current densities.
Further investigations are required to understand the overall process; however, the results obtained can provide insight into the control of gold nanoparticles’ sizes and shapes during their synthesis, which can have important implications in the design and optimization of nanoparticle synthesis protocols, from catalysis to biosensing and drug delivery.

Supplementary Materials

The following supporting information can be downloaded at: https://www.mdpi.com/article/10.3390/plasma6040043/s1, Figure S1: Pictures of the plasma jet in contact with a solution at different RF powers; Figure S2: SEM micrographs of the one gold nanoparticles synthesized with a 10 min argon plasma jet exposure at different RF powers; Figure S3: SEM micrographs of gold nanoparticles synthesized by plasma jet at different RF powers and at different plasma exposure duration with helium gas; Figure S4: AFM topographical images in 2D and 3D of the synthesized gold nanoparticles with a 10 min helium plasma jet exposure at different RF powers; Figure S5: AFM topographical images in 2D and 3D of the synthesized gold nanoparticles with a 10 min argon plasma jet exposure at different RF powers.

Author Contributions

Conceptualization, T.H., B.C., J.M.A.C. and A.P.; methodology, T.H., B.C., J.M.A.C. and A.P.; software, T.H., B.C., J.M.A.C. and A.P.; validation, T.H., B.C., J.M.A.C. and A.P.; formal analysis, T.H., B.C., J.M.A.C. and A.P.; investigation, T.H. and L.C.; resources, L.C., B.C., J.M.A.C. and A.P.; data curation, T.H. and A.P.; writing—original draft preparation, T.H.; writing—review and editing, B.C., J.M.A.C. and A.P.; visualization, T.H. and A.P.; supervision, B.C., J.M.A.C. and A.P.; project administration, B.C. and J.M.A.C.; funding acquisition, B.C., J.M.A.C. and A.P. All authors have read and agreed to the published version of the manuscript.

Funding

The authors acknowledge the Brazilian agencies FAPESP (Grants No. 2018/10172-7 and 2019/18828-1) and CAPES (Finance Code 001), CNPq (Grant No. 303580/2021-6), the National Institute of Photonics—INFO (INCTs program), Universidade de São Paulo (USP), as well as Ministère de l’Enseignement Supérieur de la Recherche et de l’Innovation (France), the Physics and Astronomy Department (UNIPD) (FUN-FACE (SID2019)), European Union Next-GenerationEU (iNEST—PNRR—Missione 4-2-1.5—ECS_00000043, the CAPES and the COFECUB as part of the Ph-C965/20 programme (Nanothermometer based on lanthanide ions. Applications in biology and microfluidics) for financial support.

Institutional Review Board Statement

Not applicable.

Informed Consent Statement

Not applicable.

Data Availability Statement

The data that support the findings of this study are available from the corresponding author upon request.

Conflicts of Interest

The authors declare no conflict of interest. The funders had no role in the design of the study; in the collection, analyses, or interpretation of data; in the writing of the manuscript; or in the decision to publish the results.

References

  1. Ealia, S.A.M.; Saravanakumar, M.P. A review on the classification, characterisation, synthesis of nanoparticles and their application. IOP Conf. Ser. Mater. Sci. Eng. 2017, 263, 032019. [Google Scholar] [CrossRef]
  2. Das, M.; Shim, K.H.; An, S.S.A.; Yi, D.K. Review on gold nanoparticles and their applications. Toxicol. Environ. Health Sci. 2011, 3, 193–205. [Google Scholar] [CrossRef]
  3. García-Álvarez, R.; Chen, L.; Nedilko, A.; Sánchez-Iglesias, A.; Rix, A.; Lederle, W.; Pathak, V.; Lammers, T.; von Plessen, G.; Kostarelos, K.; et al. Optimizing the Geometry of Photoacoustically Active Gold Nanoparticles for Biomedical Imaging. ACS Photonics 2020, 7, 646–652. [Google Scholar] [CrossRef]
  4. Siddique, S.; Chow, J.C.L. Gold Nanoparticles for Drug Delivery and Cancer Therapy. Appl. Sci. 2020, 10, 3824. [Google Scholar] [CrossRef]
  5. Priecel, P.; Salami, H.A.; Padilla, R.H.; Zhong, Z.; Lopez-Sanchez, J.A. Anisotropic gold nanoparticles: Preparation and applications in catalysis. Chin. J. Catal. 2016, 37, 1619–1650. [Google Scholar] [CrossRef]
  6. Zhang, G. Functional gold nanoparticles for sensing applications. Nanotechnol. Rev. 2013, 2, 269–288. [Google Scholar] [CrossRef]
  7. Huang, X.; Lan, T.; Zhang, B.; Ren, J. Gold nanoparticle–enzyme conjugates based FRET for highly sensitive determination of hydrogen peroxide, glucose and uric acid using tyramide reaction. Analyst 2012, 137, 3659–3666. [Google Scholar] [CrossRef] [PubMed]
  8. Chen, Q.; Li, J.; Li, Y. A review of plasma–liquid interactions for nanomaterial synthesis. J. Phys. D Appl. Phys. 2015, 48, 424005. [Google Scholar] [CrossRef]
  9. Bruggeman, P.J.; Kushner, M.J.; Locke, B.R.; Gardeniers, J.G.E.; Graham, W.G.; Graves, D.B.; Hofman-Caris, R.C.H.M.; Maric, D.; Reid, J.P.; Ceriani, E.; et al. Plasma–liquid interactions: A review and roadmap. Plasma Sources Sci. Technol. 2016, 25, 053002. [Google Scholar] [CrossRef]
  10. Kim, S.M.; Kim, G.S.; Lee, S.Y. Effects of PVP and KCl concentrations on the synthesis of gold nanoparticles using a solution plasma processing. Mater. Lett. 2008, 62, 4354–4356. [Google Scholar] [CrossRef]
  11. Chen, Q.; Kaneko, T.; Hatakeyama, R. Rapid synthesis of water-soluble gold nanoparticles with control of size and assembly using gas–liquid interfacial discharge plasma. Chem. Phys. Lett. 2012, 521, 113–117. [Google Scholar] [CrossRef]
  12. Saito, G.; Akiyama, T. Nanomaterial synthesis using plasma generation in liquid. J. Nanomater. 2016, 2015, 123696. [Google Scholar] [CrossRef]
  13. Treesukkasem, N.; Chokradjaroen, C.; Theeramunkong, S.; Saito, N.; Watthanaphanit, A. Synthesis of Au Nanoparticles in Natural Matrices by Liquid-Phase Plasma: Effects on Cytotoxic Activity against Normal and Cancer Cell Lines. ACS Appl. Nano Mater. 2019, 2, 8051–8062. [Google Scholar] [CrossRef]
  14. Xuan, L.T.Q.; Nguyen, L.N.; Dao, N.T. Synthesis of stabilizer-free, homogeneous gold nanoparticles by cold atmospheric-pressure plasma jet and their optical sensing property. Nanotechnology 2022, 33, 105603. [Google Scholar] [CrossRef] [PubMed]
  15. Liguori, A.; Gallingani, T.; Padmanaban, D.B.; Laurita, R.; Velusamy, T.; Jain, G.; Macias-Montero, M.; Mariotti, D.; Gherardi, M. Synthesis of Copper-Based Nanostructures in Liquid Environments by Means of a Non-equilibrium Atmospheric Pressure Nanopulsed Plasma Jet. Plasma Chem. Plasma Process. 2018, 38, 1209–1222. [Google Scholar] [CrossRef]
  16. Kondeti, V.S.S.K.; Gangal, U.; Yatom, S.; Bruggeman, P.J.; Mogab, C.J.; Adams, A.C.; Flamm, D.L.; Laroussi, M.; Lu, X.; Keidar, M.; et al. Ag+ reduction and silver nanoparticle synthesis at the plasma–liquid interface by an RF driven atmospheric pressure plasma jet: Mechanisms and the effect of surfactant. J. Vac. Sci. Technol. A 2017, 35, 061302. [Google Scholar] [CrossRef]
  17. Habib, T.; Caiut, J.M.A.; Caillier, B. Synthesis of silver nanoparticles by atmospheric pressure plasma jet. Nanotechnology 2022, 33, 325603. [Google Scholar] [CrossRef]
  18. Meyer, S.A. Electrical Pulse Generator. U.S. Patent US4613779A, 23 September 1986. Available online: https://patents.google.com/patent/US4613779A/en (accessed on 22 August 2023).
  19. Patelli, A.; Falzacappa, E.V.; Scopece, P.; Pierobon, R.; Vezzu, S. Method for Generating an Atmospheric Plasma Jet and Atmospheric Plasma Minitorch Device. U.S. Patent WO2015071746A1, 21 May 2015. Available online: https://patents.google.com/patent/WO2015071746A1/en (accessed on 22 August 2023).
  20. Johnson, P.B.; Christy, R.W. Optical Constants of the Noble Metals. Phys. Rev. B 1972, 6, 4370–4379. [Google Scholar] [CrossRef]
  21. Voráč, J.; Synek, P.; Potočňáková, L.; Hnilica, J.; Kudrle, V. Batch processing of overlapping molecular spectra as a tool for spatio-temporal diagnostics of power modulated microwave plasma jet. Plasma Sources Sci. Technol. 2017, 26, 025010. [Google Scholar] [CrossRef]
  22. Wang, R.; Shen, Y.; Zhang, C.; Yan, P.; Shao, T. Comparison between helium and argon plasma jets on improving the hydrophilic property of PMMA surface. Appl. Surf. Sci. 2016, 367, 401–406. [Google Scholar] [CrossRef]
  23. Rezaei, F.; Gorbanev, Y.; Chys, M.; Nikiforov, A.; Van Hulle, S.W.H.; Cos, P.; Bogaerts, A.; De Geyter, N. Investigation of plasma-induced chemistry in organic solutions for enhanced electrospun PLA nanofibers. Plasma Process. Polym. 2018, 15, 1700226. [Google Scholar] [CrossRef]
  24. Xiong, Q.; Nikiforov, A.Y.; González, M.; Leys, C.; Lu, X.P. Characterization of an atmospheric helium plasma jet by relative and absolute optical emission spectroscopy. Plasma Sources Sci. Technol. 2012, 22, 015011. [Google Scholar] [CrossRef]
  25. Nascimento, F.D.; Kostov, K.G.; Machida, M.; Flacker, A. Properties of DBD plasma jets using powered electrode with and without contact with the plasma. IEEE Trans. Plasma Sci. 2021, 49, 1293–1301. [Google Scholar] [CrossRef]
  26. Nakajima, J.; Sekiguchi, H. Synthesis of ammonia using microwave discharge at atmospheric pressure. Thin Solid Films 2008, 516, 4446–4451. [Google Scholar] [CrossRef]
  27. Bruggeman, P.J.; Iza, F.; Brandenburg, R. Foundations of atmospheric pressure non-equilibrium plasmas. Plasma Sources Sci. Technol. 2017, 26, 123002. [Google Scholar] [CrossRef]
  28. Bischoff, L.; Hübner, G.; Korolov, I.; Donko, Z.; Hartmann, P.; Gans, T.; Held, J.; der Gathen, V.S.-V.; Liu, Y.; Mussenbrock, T.; et al. Experimental and computational investigations of electron dynamics in micro atmospheric pressure radio-frequency plasma jets operated in He/N2 mixtures. Plasma Sources Sci. Technol. 2018, 27, 125009. [Google Scholar] [CrossRef]
  29. Robert, R.; Hagelaar, G.; Sadeghi, N.; Magnan, R.; Stafford, L.; Massines, F. Role of excimer formation and induced photoemission on the Ar metastable kinetics in atmospheric pressure Ar–NH3 dielectric barrier discharges. Plasma Sources Sci. Technol. 2022, 31, 065010. [Google Scholar] [CrossRef]
  30. Magnan, R.; Hagelaar, G.J.M.; Chaker, M.; Massines, F. Atmospheric pressure dual RF–LF frequency discharge: Transition from α to α–γ-mode. Plasma Sources Sci. Technol. 2020, 30, 015010. [Google Scholar] [CrossRef]
  31. Pimpang, P.; Choopun, S. Monodispersity and stability of gold nanoparticles stabilized by using polyvinyl alcohol. Chiang Mai J. Sci. 2011, 38, 31–38. [Google Scholar]
  32. Cai, J.; Griffin, E.; Guarochico-Moreira, V.H.; Barry, D.; Xin, B.; Yagmurcukardes, M.; Zhang, S.; Geim, A.K.; Peeters, F.M.; Lozada-Hidalgo, M. Wien effect in interfacial water dissociation through proton-permeable graphene electrodes. Nat. Commun. 2022, 13, 5776. [Google Scholar] [CrossRef]
  33. Zhang, B.; Xu, Y.; Zheng, Y.; Dai, L.; Zhang, M.; Yang, J.; Chen, Y.; Chen, X.; Zhou, J. A Facile Synthesis of Polypyrrole/Carbon Nanotube Composites with Ultrathin, Uniform and Thickness-Tunable Polypyrrole Shells. Nanoscale Res. Lett. 2011, 6, 431. [Google Scholar] [CrossRef] [PubMed]
  34. Belmonte, T.; Nominé, A.V.; Noël, C.; Gries, T.; Milichko, V.; Belmahi, M.; Awaji, M.Y. Submerged Discharges in Liquids for Nanoobject Synthesis: Expectations and Capabilities. Plasma Chem. Plasma Process. 2023, 1–56. [Google Scholar] [CrossRef]
  35. Yamashita, Y.; Miyahara, R.; Sakamoto, K. Chapter 28—Emulsion and Emulsification Technology. In Cosmetic Science and Technology; Sakamoto, K., Lochhead, R.Y., Maibach, H.I., Yamashita, Y., Eds.; Elsevier: Amsterdam, The Netherlands, 2017; pp. 489–506. [Google Scholar] [CrossRef]
  36. Xu, Y.-Z.; Zhang, Y.-R.; Zheng, J.-F.; Guo, C.; Niu, Z.-J.; Li, Z.-L. Assembly of Aggregated Colloidal Gold Nanoparticles on Gold Electrodes by In Situ Produced H+ Ions for SERS Substrates. Int. J. Electrochem. Sci. 2011, 6, 664–672. [Google Scholar] [CrossRef]
  37. Park, S.; Choe, W.; Lee, H.; Park, J.Y.; Kim, J.; Moon, S.Y.; Cvelbar, U. Stabilization of liquid instabilities with ionized gas jets. Nature 2021, 592, 49–53. [Google Scholar] [CrossRef]
  38. Wang, R.; Zuo, S.; Wu, D.; Zhang, J.; Zhu, W.; Becker, K.H.; Fang, J. Microplasma-Assisted Synthesis of Colloidal Gold Nanoparticles and Their Use in the Detection of Cardiac Troponin I (cTn-I). Plasma Process. Polym. 2015, 12, 380–391. [Google Scholar] [CrossRef]
Figure 1. Experimental setup of the plasma jet coupled with two power supplies.
Plasma 06 00043 g001
Figure 2. Photographs of the DF-APPJ in contact with the liquid surface as a function of power and process gas, exposure time 30 ms. Additional photographs can be found in Supplementary Figure S1.
Plasma 06 00043 g002
Figure 3. Optical emission spectra of the helium and argon plasma jet at 30 W RF power. In the upper part the spectral zoom of the signals relative to the OH(A-X), NH(A-X), N2(C-B), and Hɑ emissions are shown.
Plasma 06 00043 g003
Figure 4. OES analysis results as a function of the RF power for helium (blue) and argon (red) gases: (top) rotational temperature of OH from OH (A-H) band; and (bottom) vibrational temperature of N2 from N2 SPS.
Plasma 06 00043 g004
Figure 5. Charge collected by the sample in argon (top) and in helium (center) as a function of the electrode pulse polarization (bottom). Charge is recorded in three RF power conditions 0 W, 15 W, and 30 W. On the right is a time zoom of the pulse.
Plasma 06 00043 g005
Figure 6. (top) RF current through the liquid as a function of the RF power applied, (center) maximum charge collected at the capacitor, and (bottom) power dissipated in the plasma discharge.
Plasma 06 00043 g006
Figure 7. (Top) UV-vis absorbance spectra of the resulting gold nanoparticles following helium and argon plasma treatments for 10 and 20 min under varying RF power settings (0 W, 15 W, and 30 W). Simulated absorbance spectra are included for reference, showcasing a gold nanosphere lognormal distribution centered at 45 nm and a monodispersed 25 nm solution. Additionally, for argon plasma treatment, we provide the spectrum corresponding to a 20 min treatment solely with RF at 30 W, excluding µPulse, with a 6 mm separation between the jet outlet and the liquid. (Bottom Left) A comparison of the UV-vis spectra at 30 W RF power, normalized to the 420 nm wavelength absorbance, is presented. (Bottom Right) The distribution used for simulation is compared with the distributions obtained through scattered intensity measurements.
Plasma 06 00043 g007
Figure 8. SEM micrographs of the synthesized gold nanoparticles with a 10 min helium plasma jet exposure at (a) 0 W, (b) 15 W, and (c) 30 W RF power.
Plasma 06 00043 g008
Disclaimer/Publisher’s Note: The statements, opinions and data contained in all publications are solely those of the individual author(s) and contributor(s) and not of MDPI and/or the editor(s). MDPI and/or the editor(s) disclaim responsibility for any injury to people or property resulting from any ideas, methods, instructions or products referred to in the content.

