Article

Red and Black Paints on Prehistoric Pottery of the Southern Russian Far East: An Archaeometric Study

by
Irina S. Zhushchikhovskaya
1,*,
Igor Yu Buravlev
2,
Aleksander A. Karpenko
3,
Anastasia A. Lazina
2 and
Aleksander N. Fedorets
2
1
Institute of History, Archaeology & Ethnology of Peoples of the Far East, Far Eastern Branch of the Academy of Sciences, 89 Pushkinskaya Str., 690001 Vladivostok, Russia
2
Far Eastern Federal University, 10 Ajax Bay, Russky Island, 690922 Vladivostok, Russia
3
A.V. Zhirmunsky National Scientific Center of Marine Biology, Far Eastern Branch, Russian Academy of Sciences, 17 Palchevskogo Street, 690041 Vladivostok, Russia
*
Author to whom correspondence should be addressed.
Ceramics 2023, 6(2), 1078-1099; https://doi.org/10.3390/ceramics6020064
Submission received: 31 March 2023 / Revised: 22 April 2023 / Accepted: 29 April 2023 / Published: 2 May 2023

Abstract

:
This paper considers the results of an examination of painted pottery from prehistoric sites of the Prmor’ye region (Southern Russian Far East) in the northwestern part of the Sea of Japan basin. Red-painted and black-painted ceramic wares occur here only in the remains of the Yankovskaya archaeological culture dated to the 1st mil. BCE. Red painting appears as a colored surface coating, and black painting is represented by very simple drawn patterns. Until recently painting decorations have not been intentionally studied. The objects of our investigation are a small series of red-painted and black-painted ceramic fragments originated from archaeological sites. The methods of optical microscopy, SEM-EDS, and Raman spectroscopy were applied to the study of research materials. As a result, the data on characteristics of texture and composition of red and black paints were obtained. Both were determined to be pre-firing paints. Red paint is a clayish substance mixed with natural ochre pigment containing the hematite coloring agent. Black paint is carbon-based. Black carbon and burnt bone are recognized as colorants. The presented materials are new evidence of pottery paint technologies in prehistoric Eurasia.

1. Introduction

Pottery decorated by paint has a long history, and archaeological records of the global past provide evidence of significant diversity in technological and artistic experiences. If the esthetic aspects of painted pottery can be described and explained without sophisticated equipment, the essential features of painting technologies need to be recognized through special methods of physical and chemical sciences. Modern archaeometry reveals a broad spectrum of interesting and important results in the identification of compositions, origins, and processing of paints, pigments, and colorants used in ancient ceramics decoration [1,2,3,4,5,6,7,8,9,10,11,12,13,14,15].
This article presents the phenomenon of painted pottery in an archaeological context of the prehistoric period at the extreme eastern continental edge of Eurasia. The research area is the southernmost territory of the Russian Far East, that is, the Primor’ye region, which borders Northeast China and lies north of the Korean Peninsula (Figure 1). The evidence of pottery decoration with red and black paints is represented in the excavated remains of the Yankovskaya archaeological culture of the Paleometal period, 1st mil. BCE [16,17]. This study set, for the first time, the task of studying red and black paint on pottery of the Yankovskaya archaeological culture, using the methods of archaeometry. Our focus was on the technological aspect of paints used in prehistoric pottery-making.

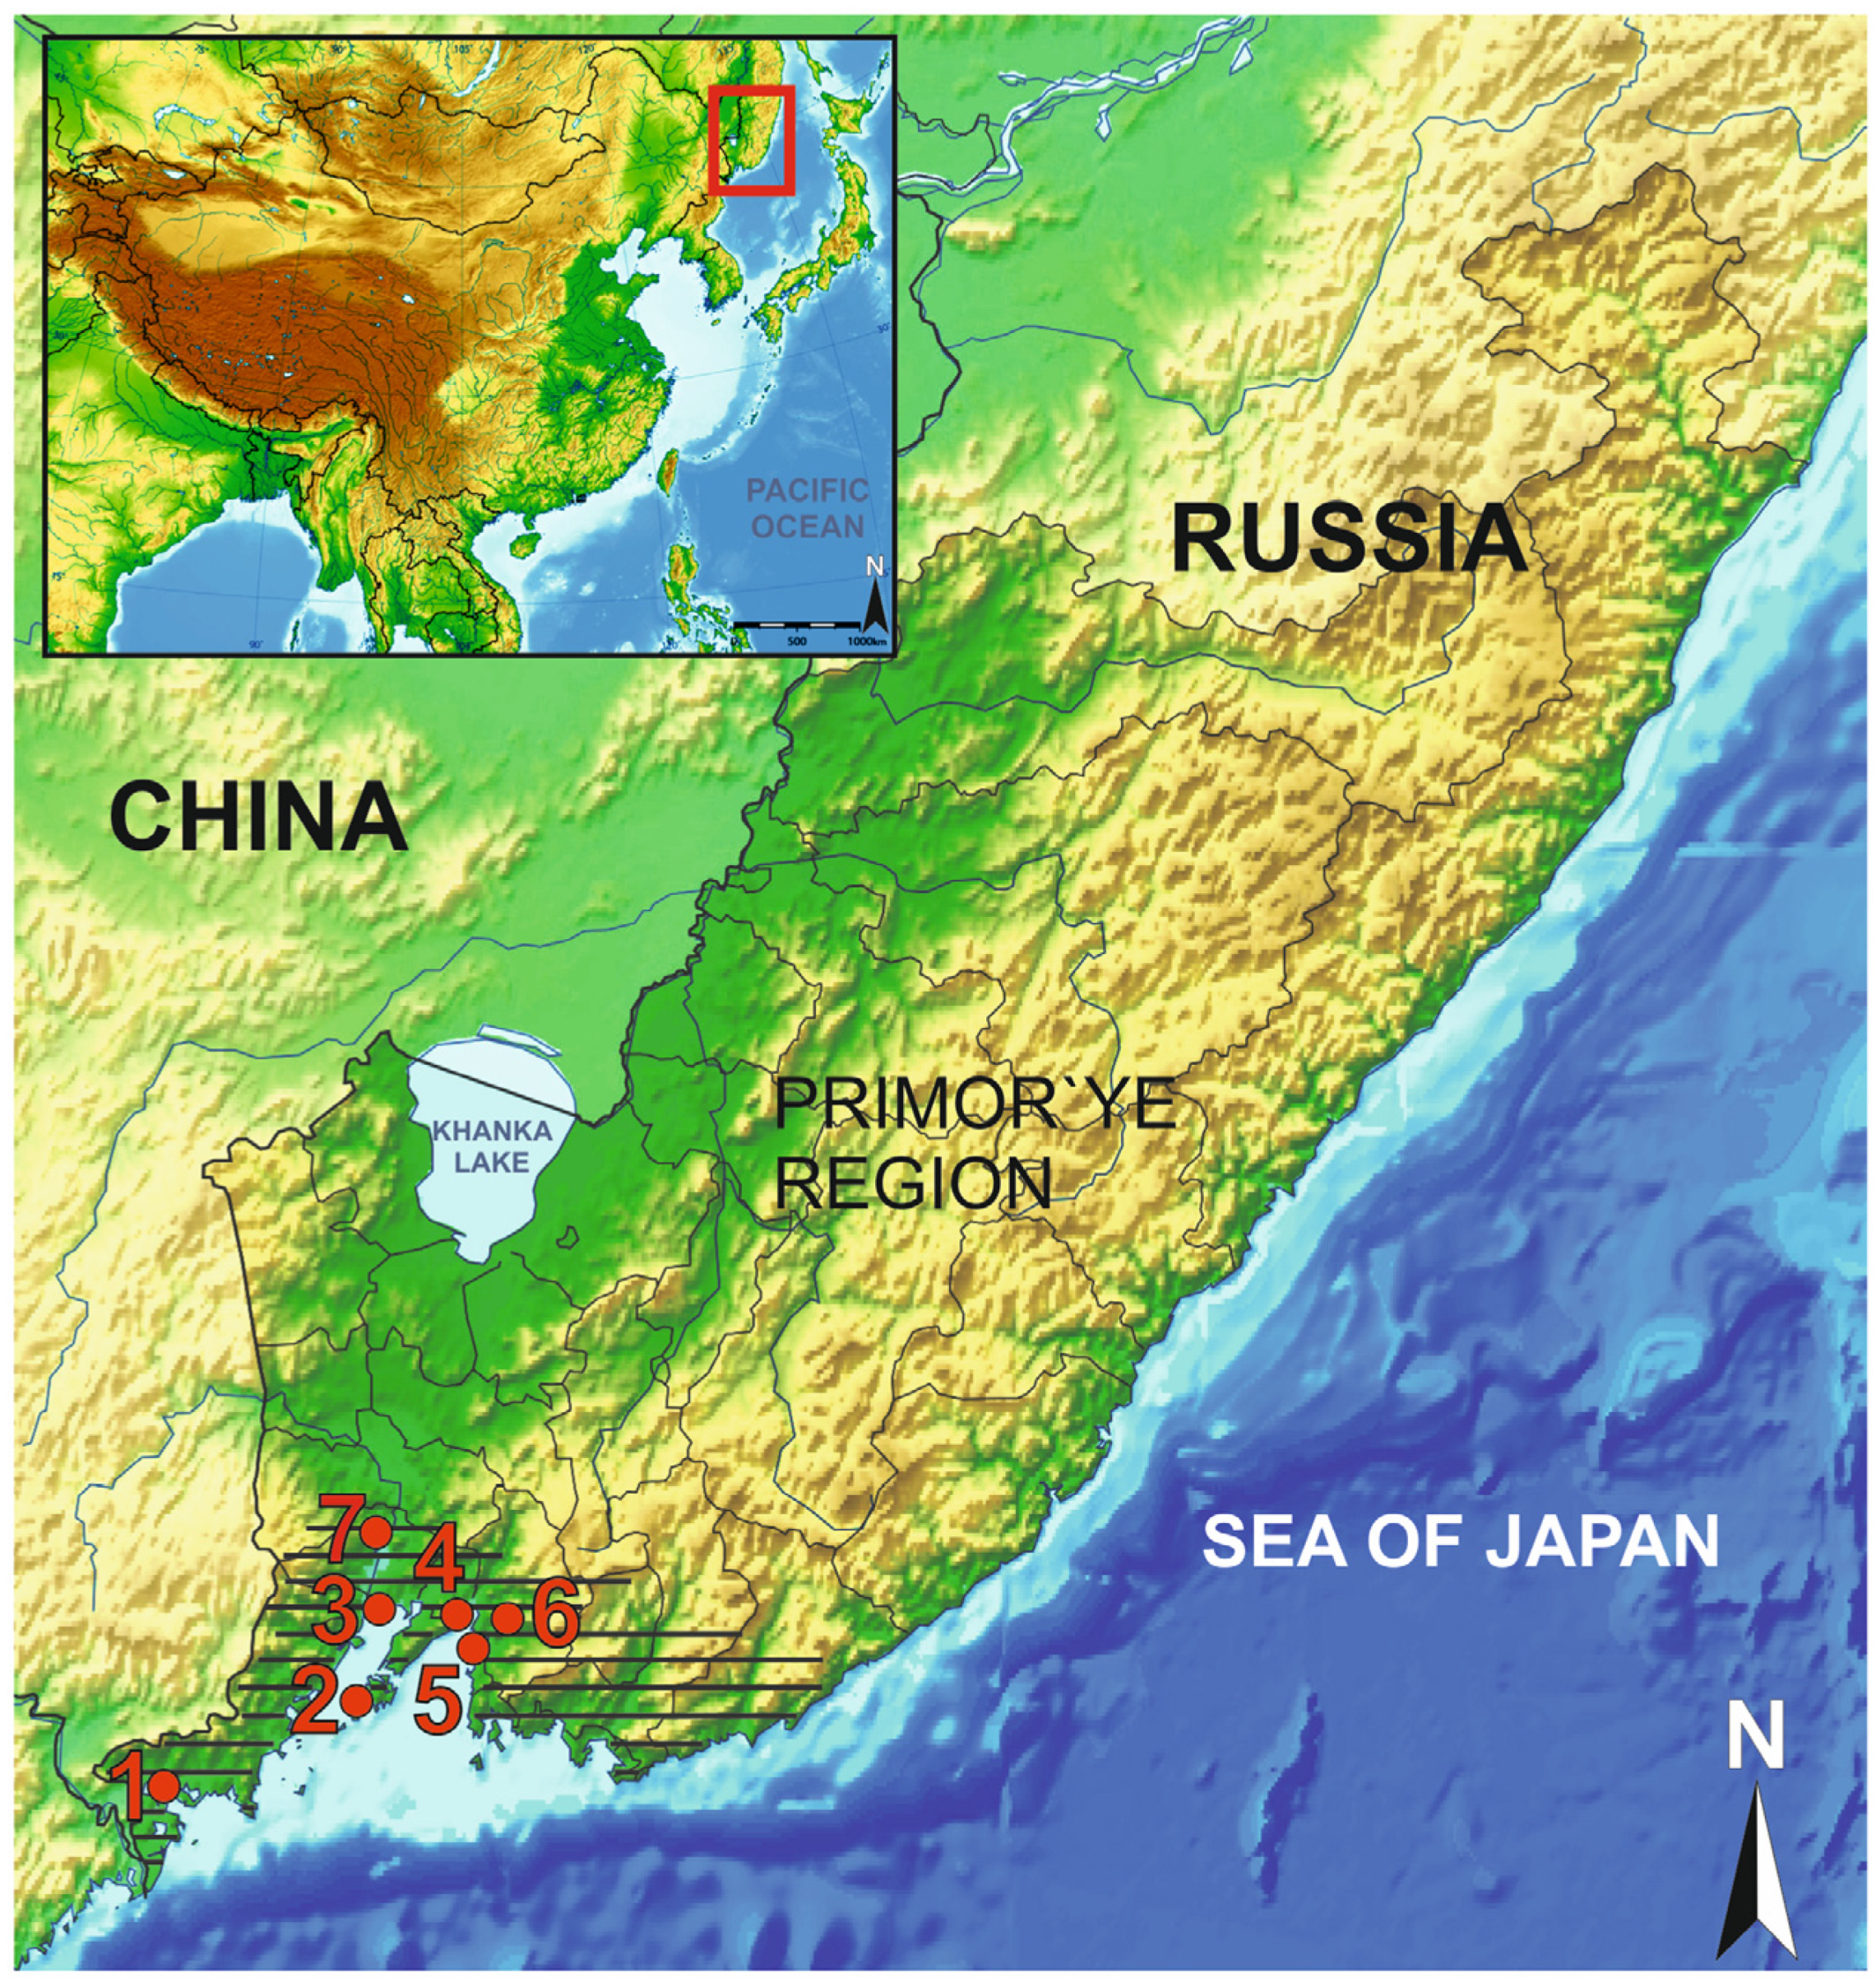
2. Archaeological Background

The research materials originated from the sites of the Yankovskaya archaeological culture of the Southern Primor’ye region (Figure 1). The total number of discovered sites exceeds 100, while the number of sites excavated at the large scale is fewer than ten. The series of sites, mostly with damaged cultural deposits, were investigated on a small scale. A majority of radiocarbon dates from the sites fall within the interval 990–120 BCE [17]. The subsistence pattern of Yankovskaya culture is reconstructed as a complex, combining the foraging and producing branches. Exploiting diverse marine resources played a significant role in the economy. Yankovskaya culture is associated with the earliest appearance of iron in Southern Russian Far East [16,17].
Ceramic ware represented by numerous fragments or sherds and a restricted series of complete vessels is one of the main artefact categories at all sites of the Yankovskaya culture. It is possible to distinguish pots, jars, flat-bottomed and footed bowls, dishes, and plates. The pottery was produced from local raw materials, shaped by hand-coiling method, slipped, and fired mostly in the oxidizing regime [16] (pp. 141–144). Approximate firing temperatures are estimated in the interval 750–850 °C after the results of SEM examination and petrography analyses. The evidence of initial vitrification of ceramic paste is registered very rarely. There is a known single case of the discovery of the remains of the simplest kiln-like structure for pottery firing [18]. Wares of different functions such as cooking needs, storage, table serving, and ritual serving are distinguished. The last two categories are represented by a diversity of bowls, dishes, plates, and sometimes pots. In many cases, these wares demonstrate evidence of especially careful paste preparation, surface treatment, and decoration [17,19].
The examples of red and black painting are connected mostly with the tableware discovered at sites located at southwestern and partially southern seacoast areas of the Primor’ye region. Red-painted specimens of bowls, dishes, and sometimes necked pots and jars, mostly fragmented, comprise from 5% to 15% in pottery assemblages (Figure 2). The red paint looks like some kind of surface covering that is similar to a slip. The quality and color hue of red paint differs greatly.
Previously, it was supposed that natural ochre served as the main component in red paint. At present, there are two known cases of ochre material discovered at the Yankovskaya archaeological culture sites. The first case occurred at the seacoast settlement of Chapaevo in 1975. At this site, a pit of 25 cm diameter and 30 cm depth, filled with pieces of red-colored ochre, was unearthed in the area between pit-dwellings [16] (pp. 33, 127). Several pieces of ochre material were unearthed at the Cherepakha-7 settlement excavated recently [17].
Black-painted specimens occur only rarely and comprise 0.1–0.3% of the site’s pottery assemblage. Usually, these are quite simple, mostly amorphous patterns consisting of narrow vertical or slanting strips and roundish spots, and they are located in restricted zones of the ware’s surface. These patterns look like some kind of sign or mark rather than a certain ornamental scheme. In only a few cases are there more complicated zigzag-like or meander-like patterns recognized (Figure 3). Black patterns occur on the red-painted surfaces, as well as on the usual slipped surfaces fired in an oxidizing regime and colored in light brownish-yellow or brownish-orange hues. A distinctive feature of black patterns on the Yankovskaya culture ceramic ware is that they look very faded and poorly preserved. Previous studies of black-painted patterns were restricted by their artistic aspect, without any technological insights [16] (pp. 111, 115,120,121).
At present, the opportunity to examine painted pottery is determined by the availability of artifact collections from studied archaeological sites of the Yankovskaya culture. Our pilot investigation is based on the restricted series of available pottery samples from several sites located in various parts of the occupied area of the Yankovskaya culture (Figure 1). Cherepakha-7 and Solontsovaya-2 are settlement sites with stratified cultural deposits excavated at a large scale [17]. Shelekh Cape, Stark, and Solnechny Bereg are sites with disturbed cultural deposits containing only the remnants of the Yankovskaya culture [20,21,22]. These sites were studied on a testing scale.

3. Materials and Methods
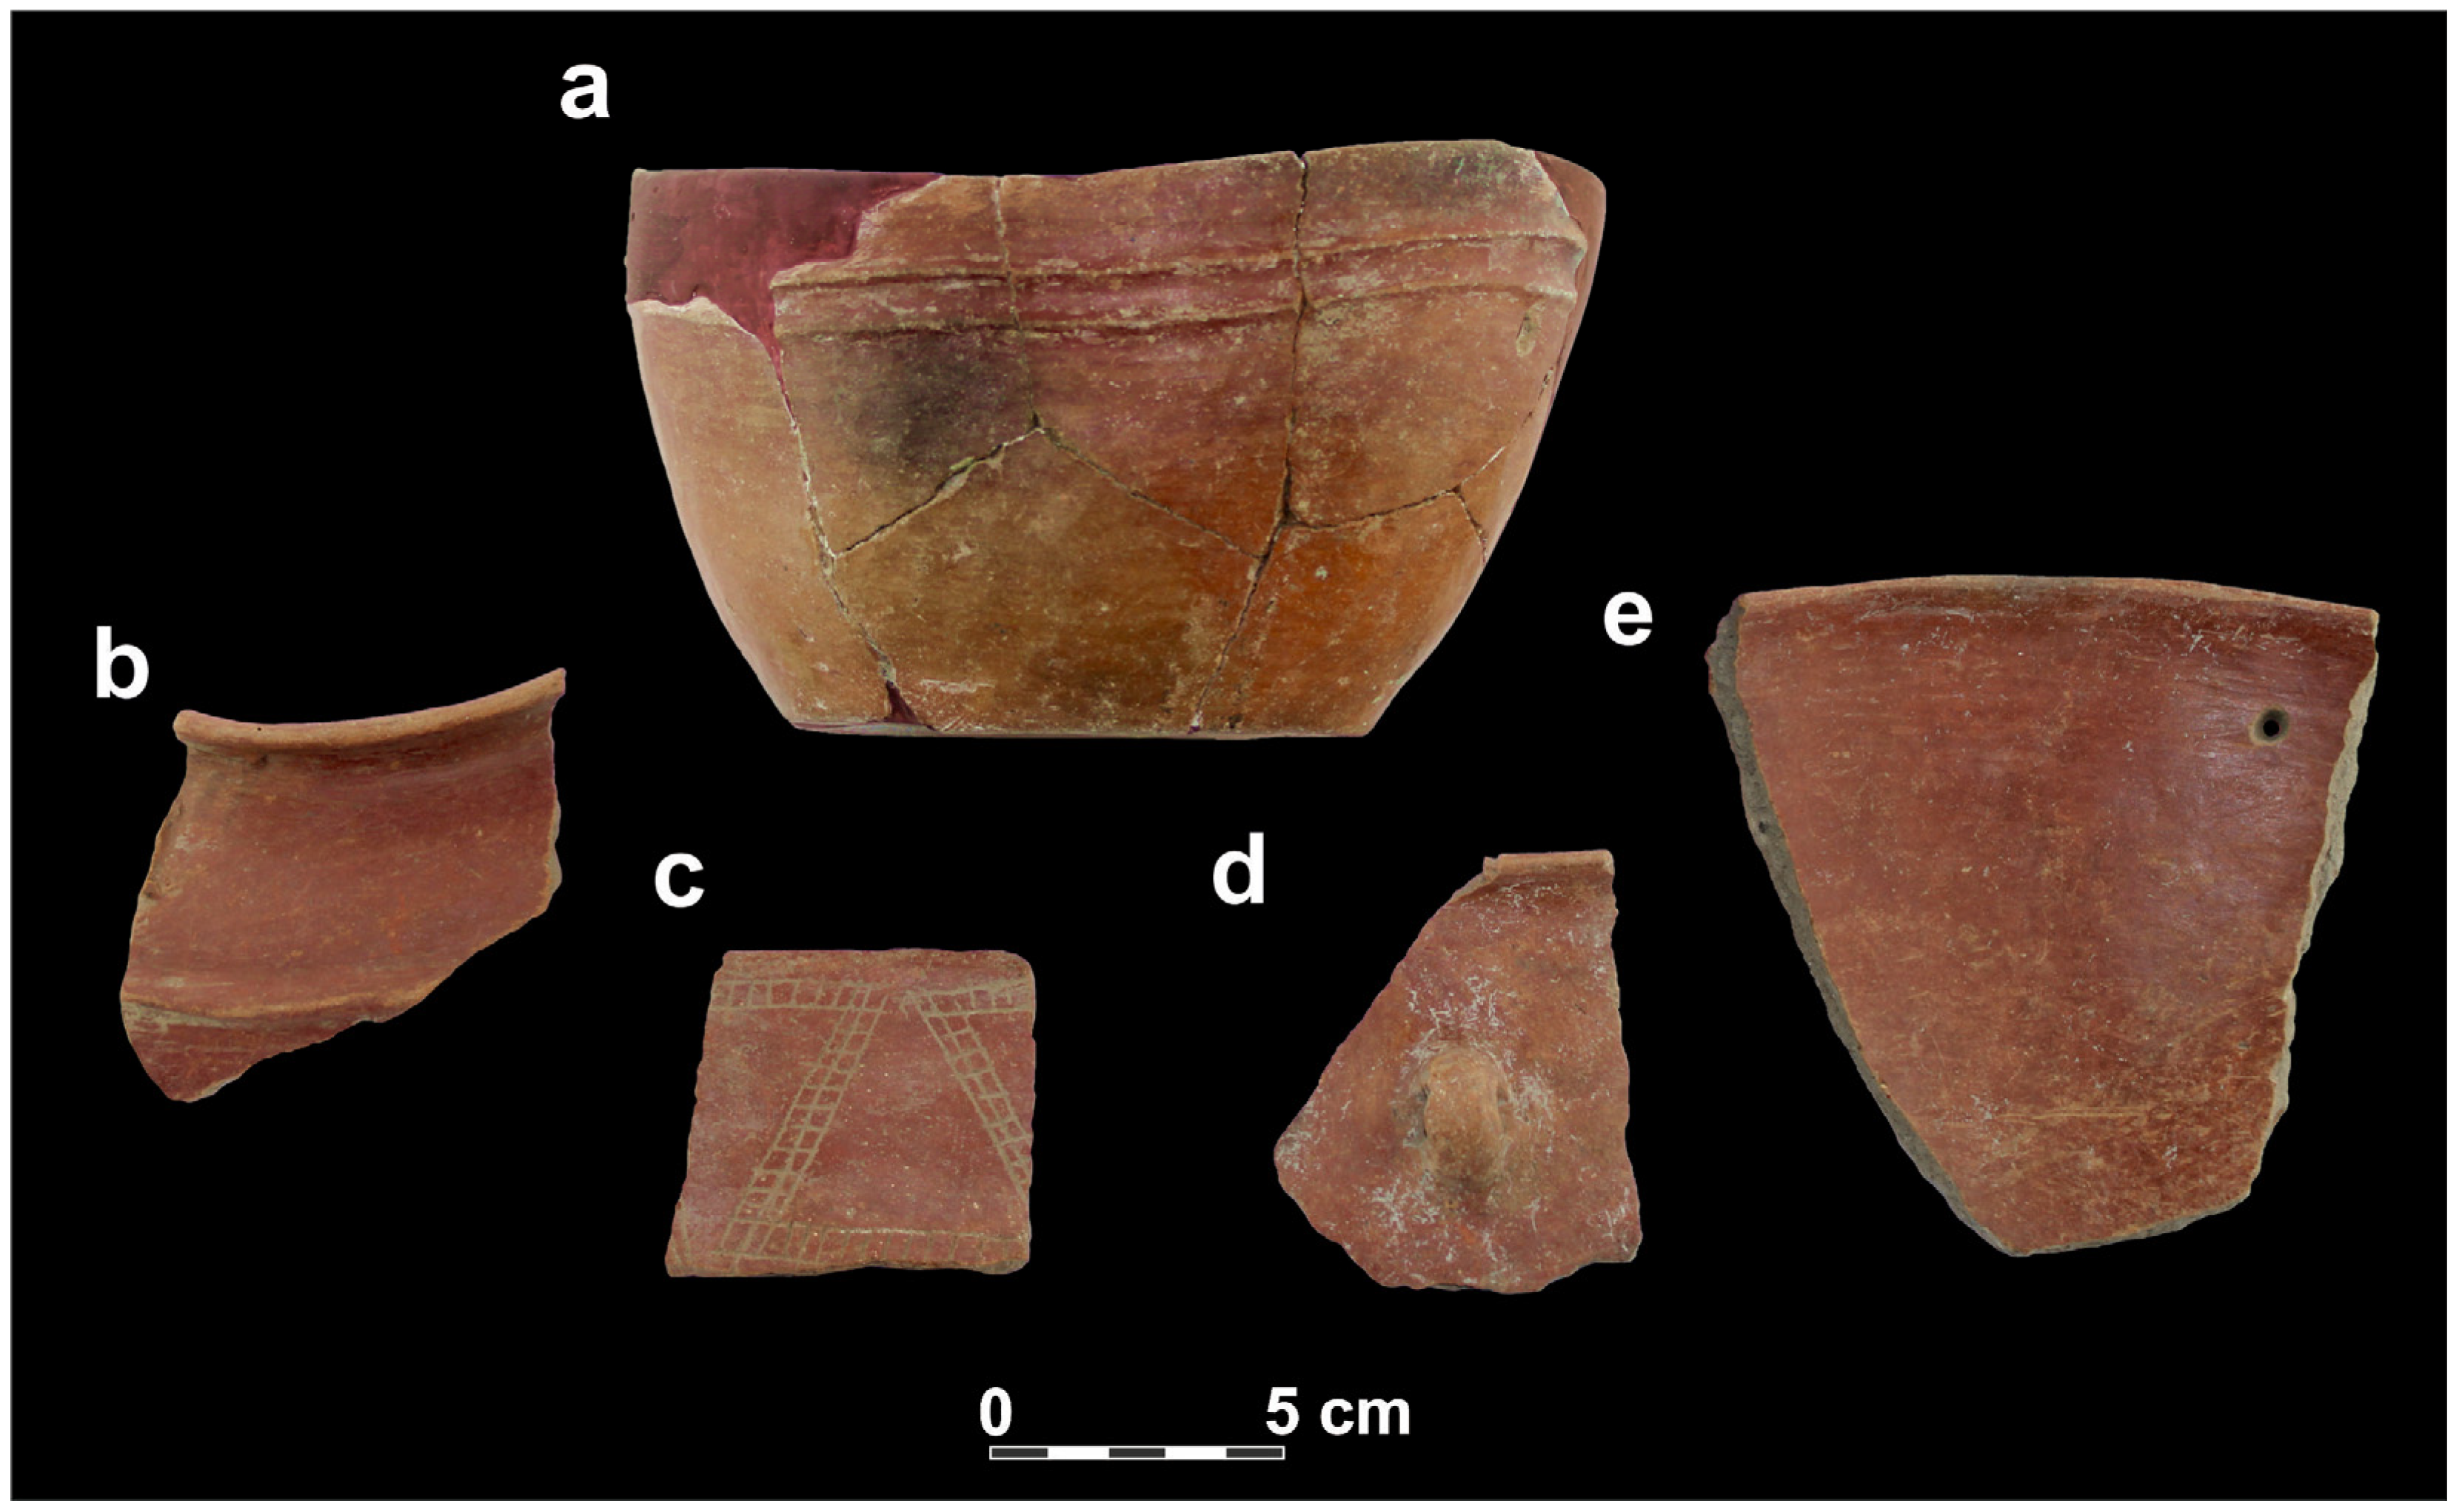
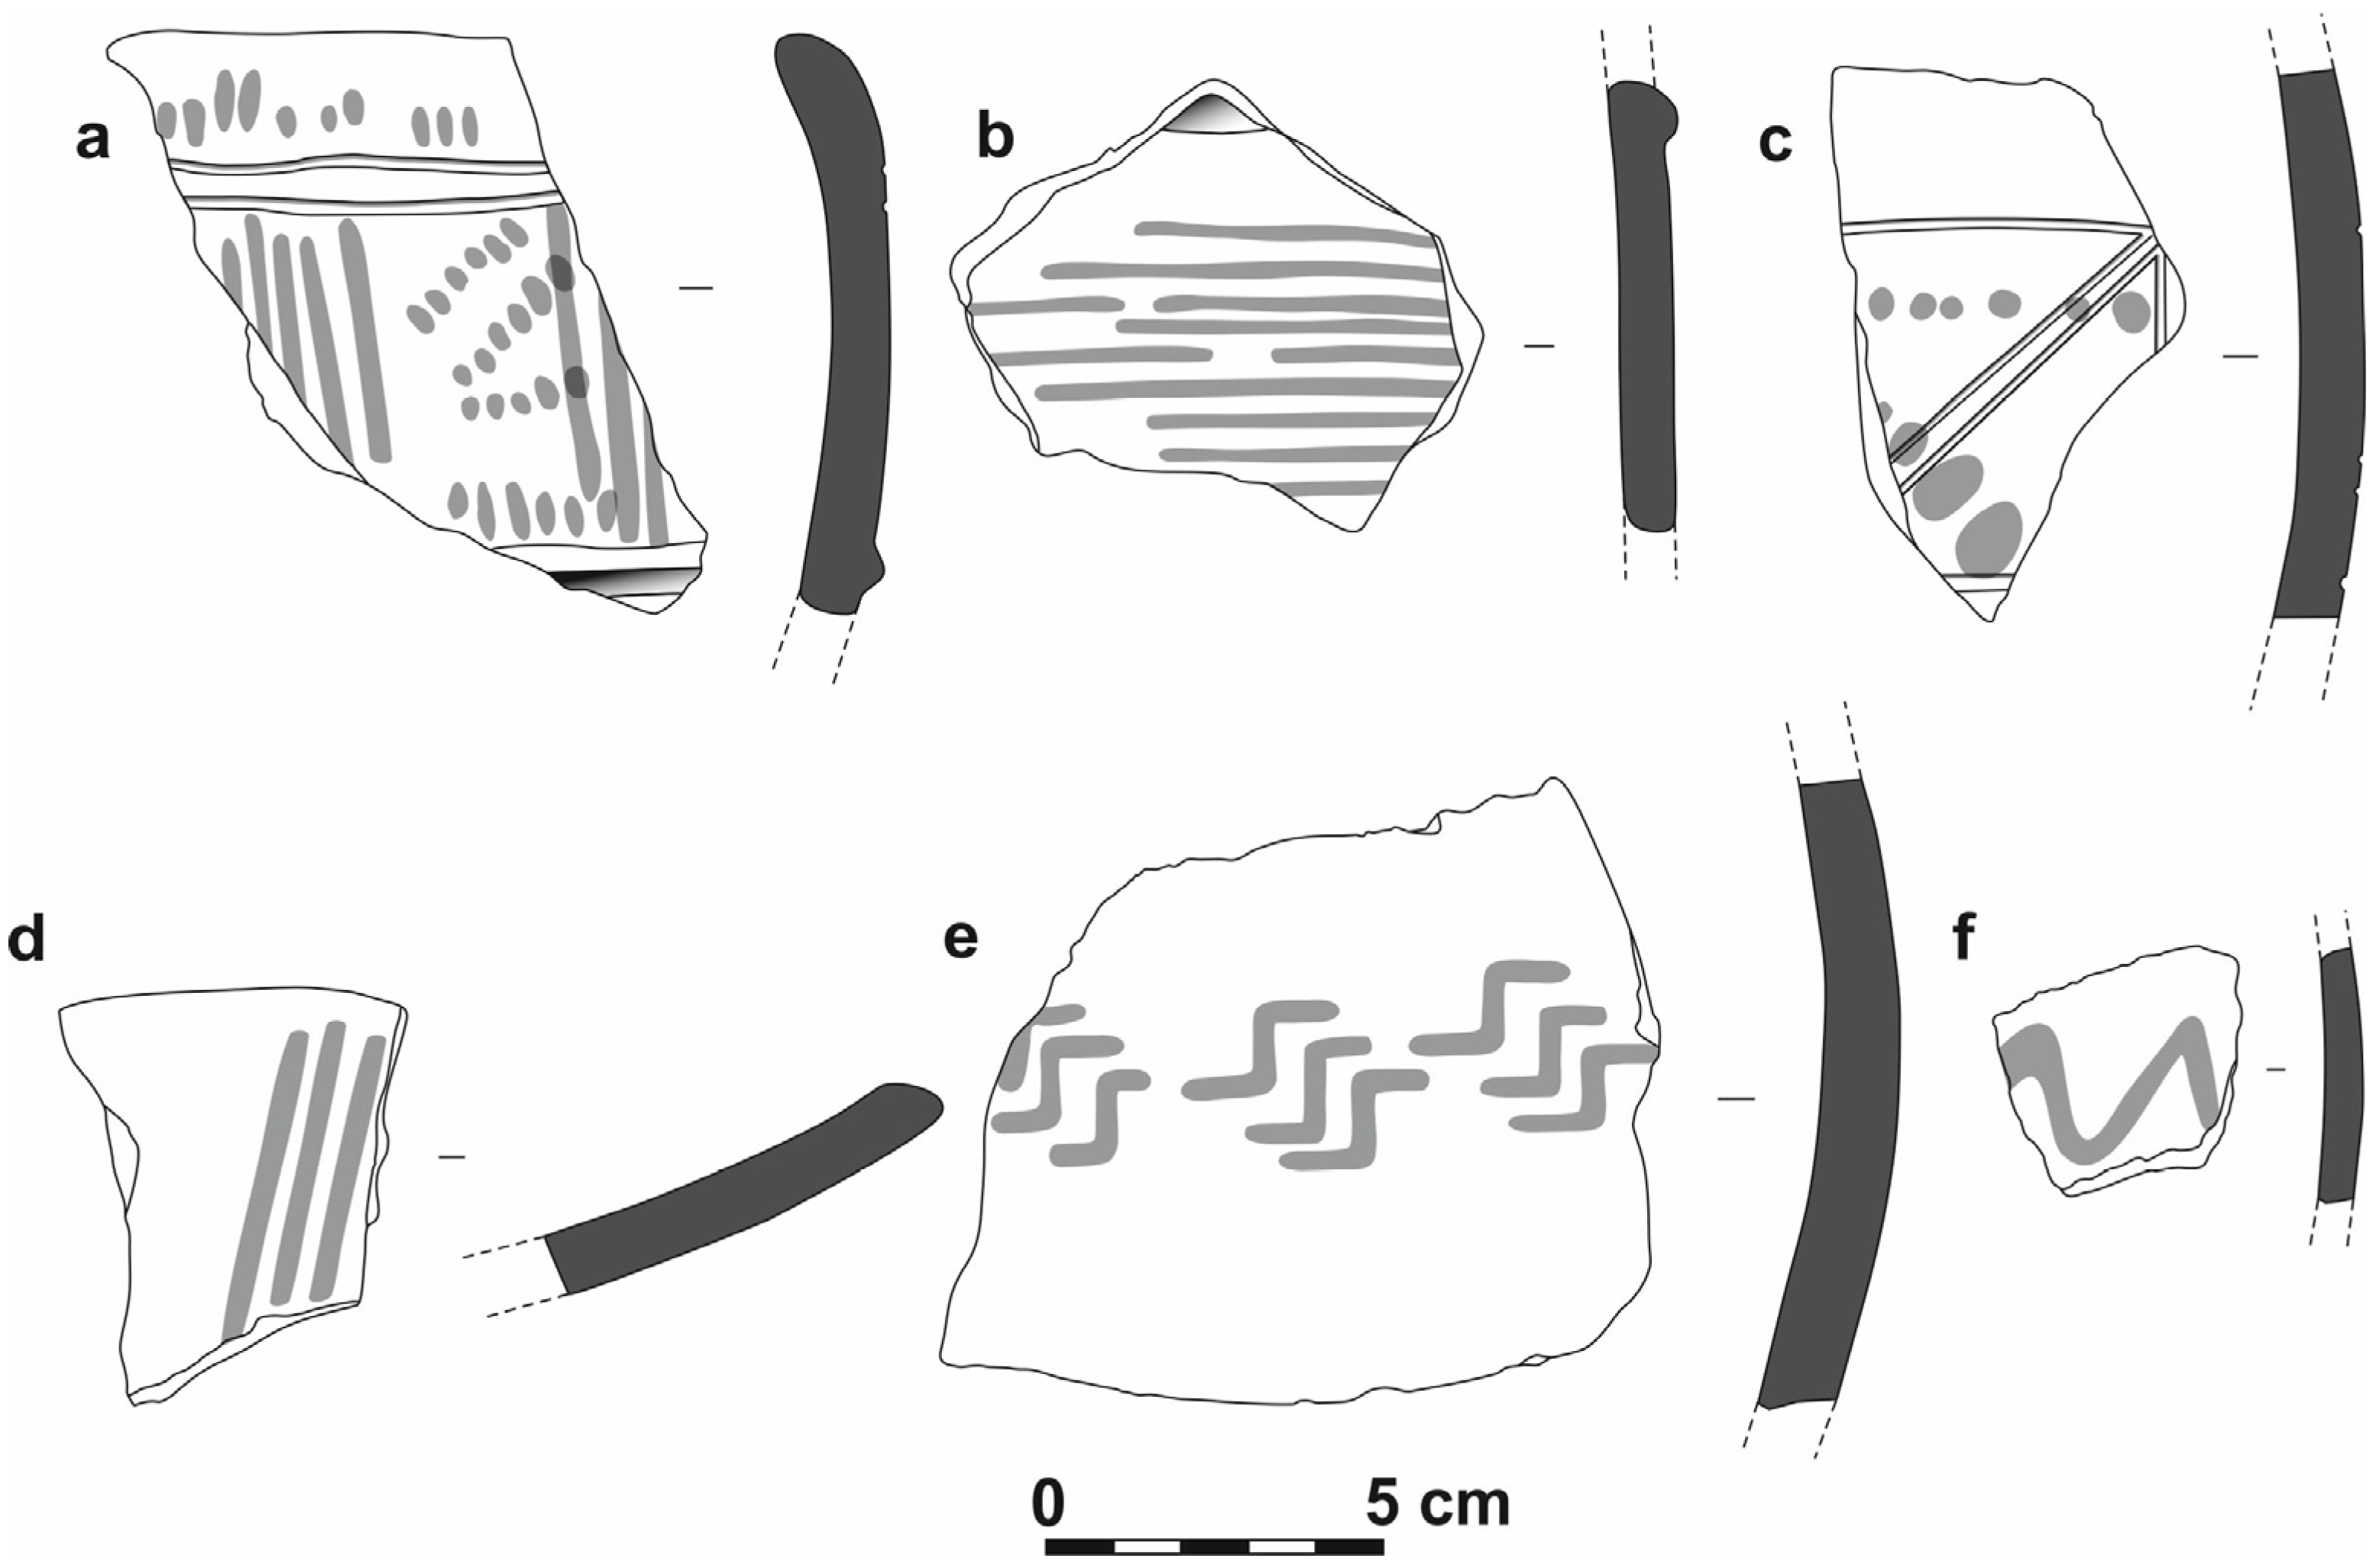
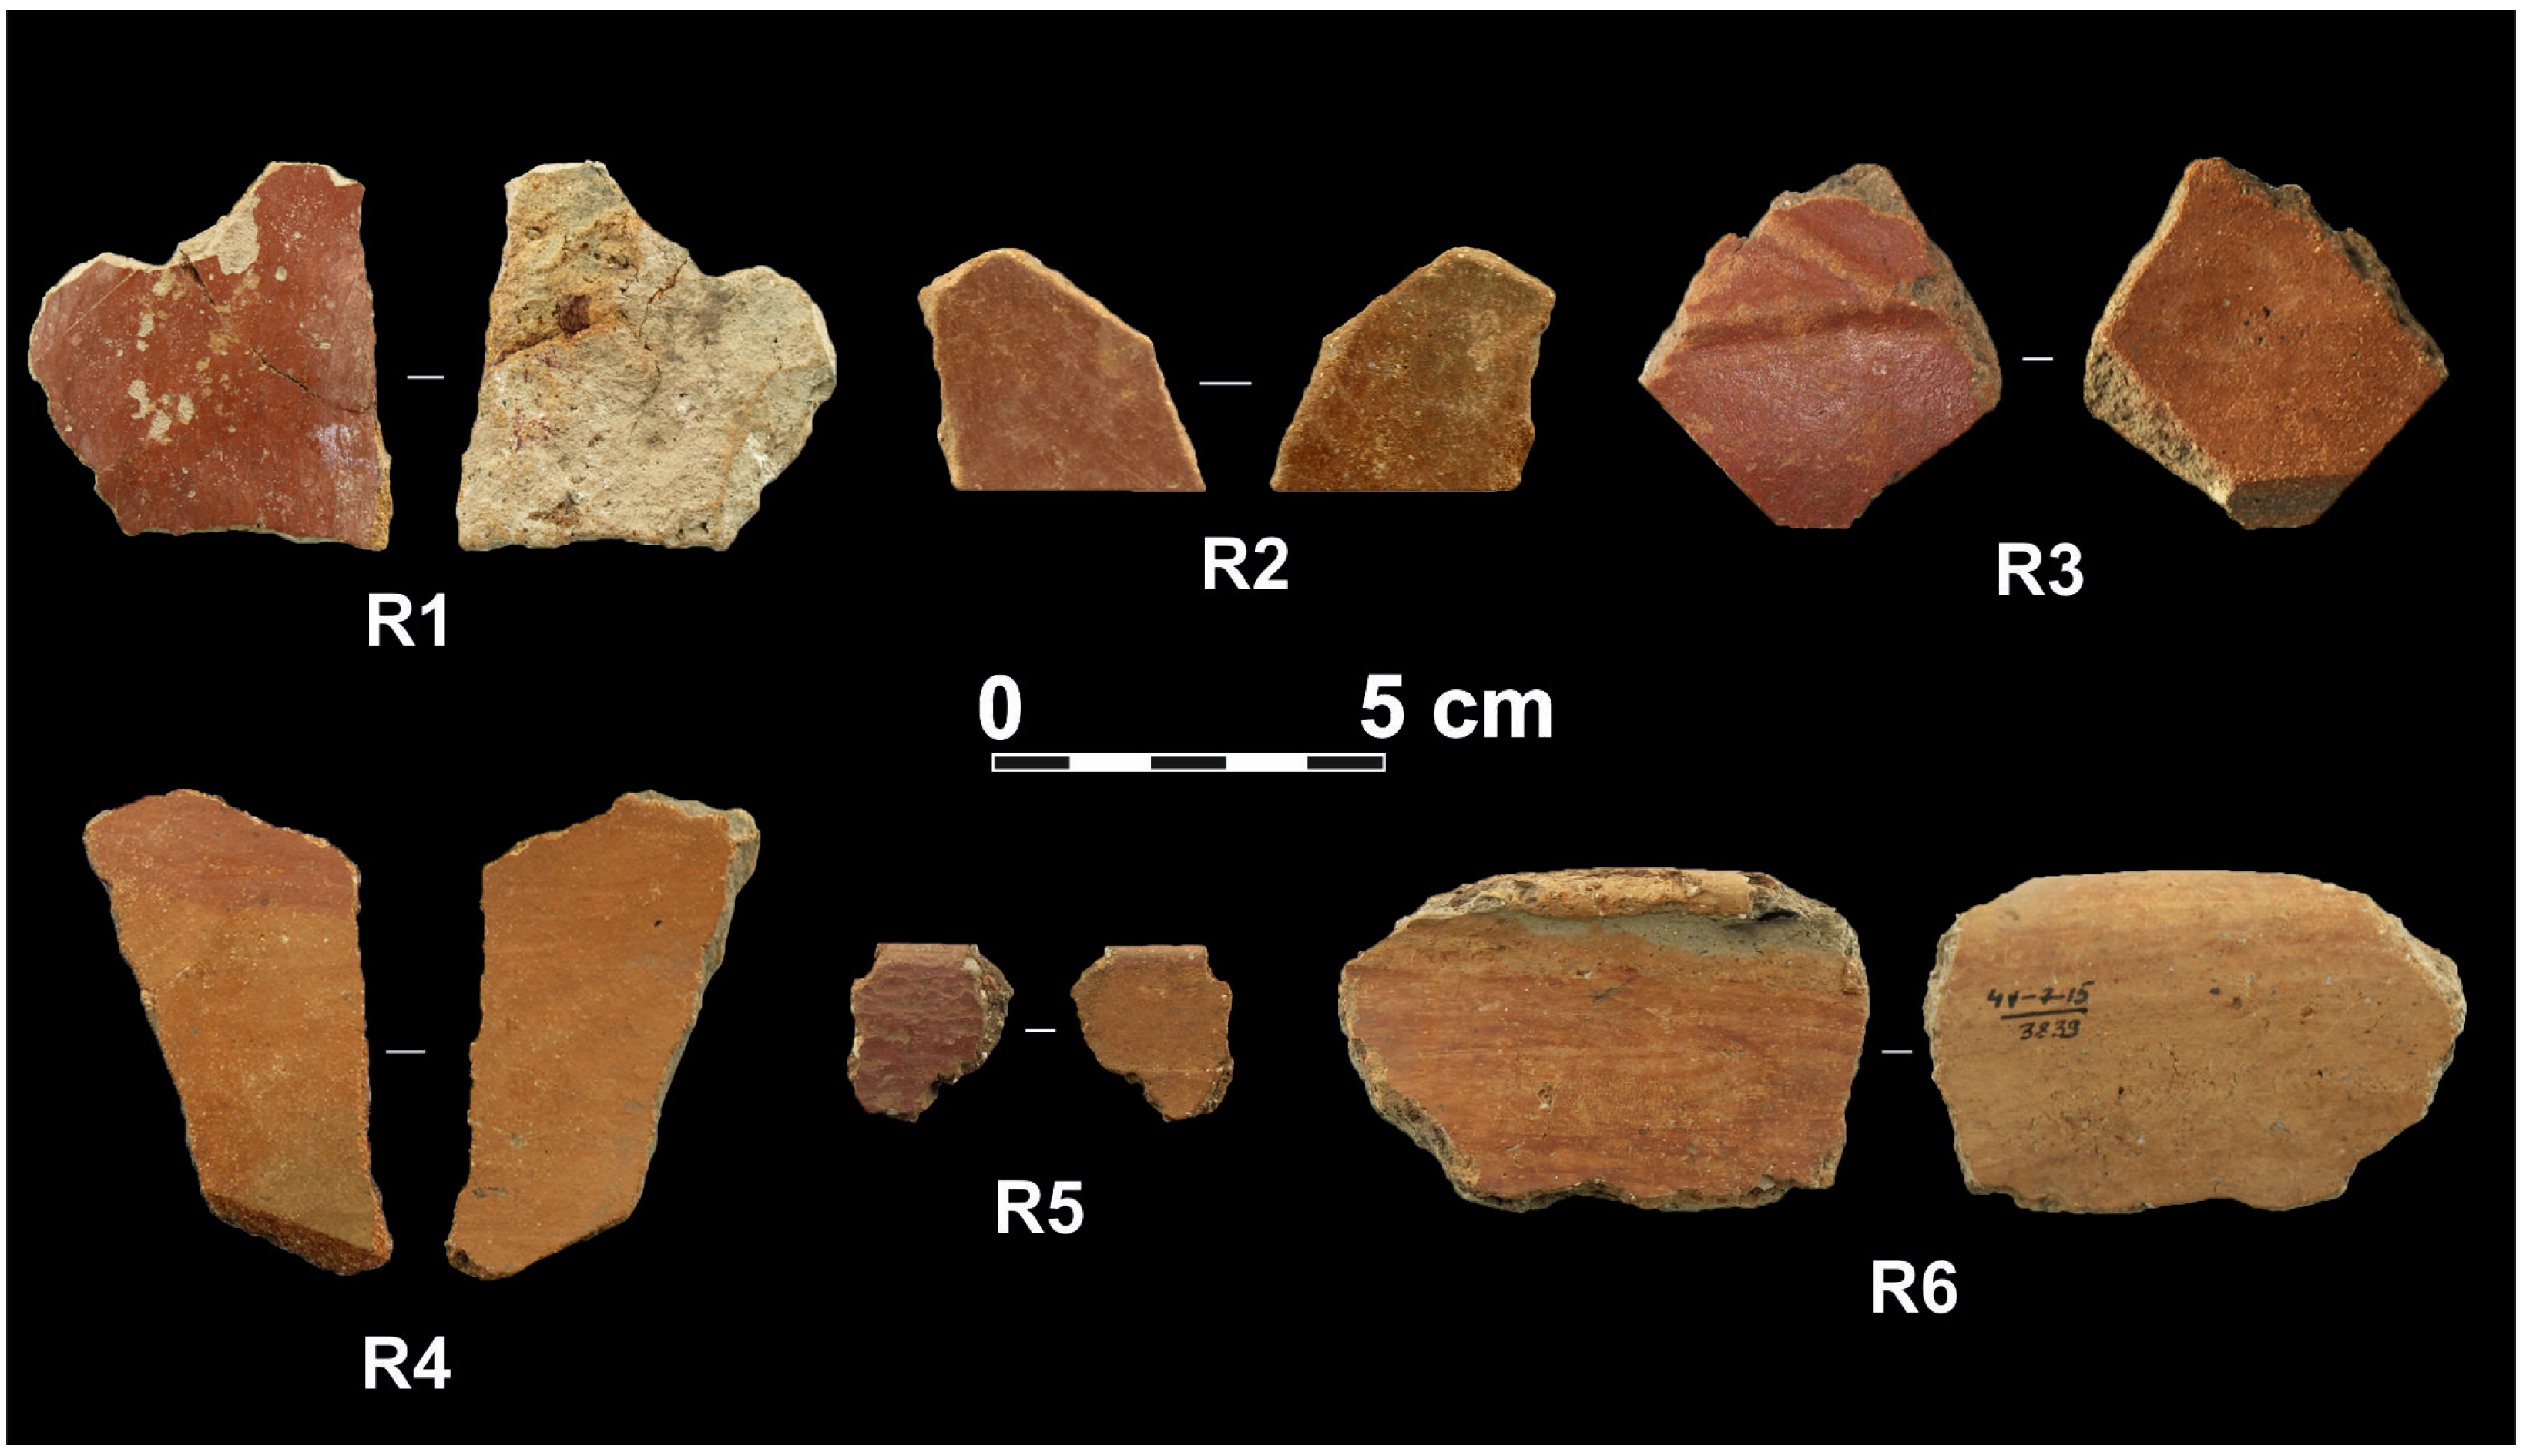
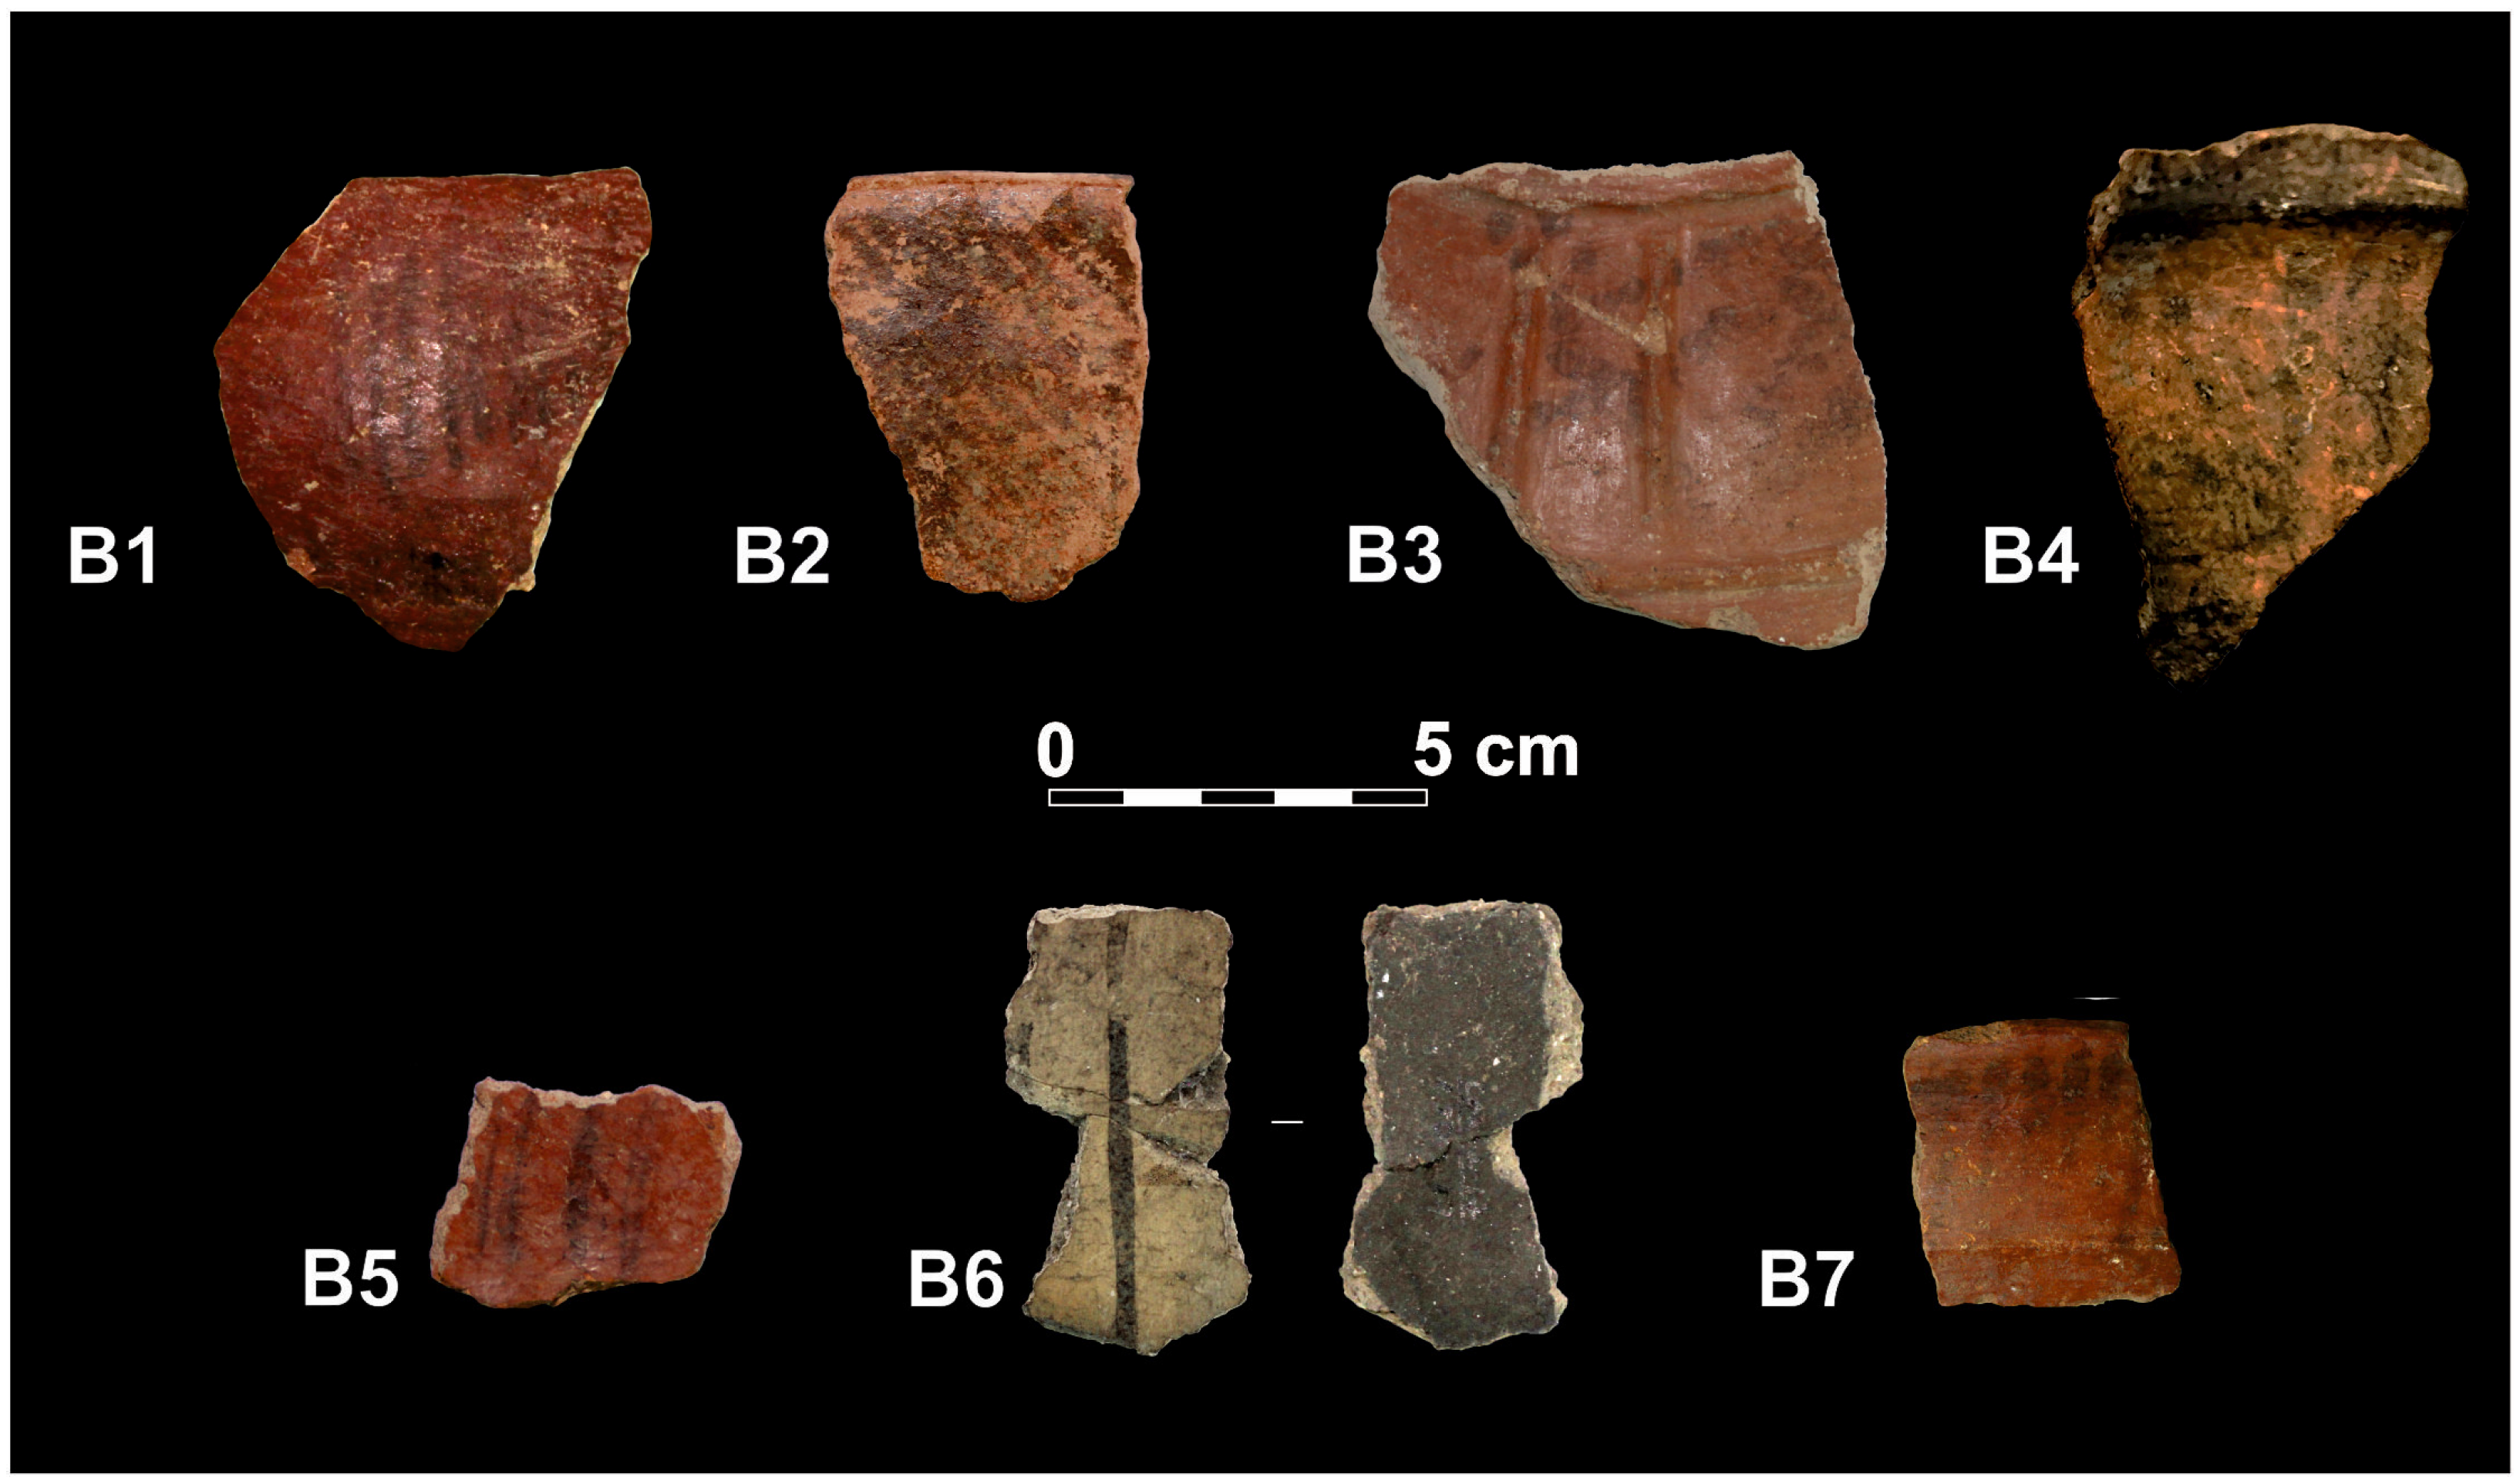
3.1. Samples

Six red-painted samples, R1–R6, came from the sites of Shelekh Cape, Stark, and Cherepakha-7 (Figure 4). The samples are represented by small fragments of ceramic vessels with single-sided red painting. On Sample R1, the opposite side is flaking, exposing the ceramic paste texture. The opposite sides of samples R2–R6 are covered with a brownish-yellow matte slip. Researchers recognize slip as special clayish coating which may or may not be contrasting in color with the ceramic body depending on its composition [13,23] (pp. 67–69). In the context of our investigation, the slip is determined as a surface clayish coating not contrasting in color with the body but characterized by a thinner texture. The slip layer at Yankovskaya culture pottery varies significantly in thickness and density. In many cases, the thin coating layer looks like clayish film produced by surface washing after vessel shaping rather than true slip prepared and applied intendedly.
Seven black-painted samples came from the Shelekh Cape, Stark, Solnechny Bereg, Solontsovaya-2, and Cherepakha-7 sites (Figure 5). There are several small fragments of walls, a fragment of a bowl’s rim, a fragment of the rim of dish-shaped or plate-shaped ware, and a fragment of a necked pot’s rim. Black patterns were applied above the red-painted background on Samples B1, B2, B5, and B7 and above the usual slip coating on Samples B3, B4, and B6. On all samples except B6, both surfaces fall in the “warm” color spectrum, indicating oxidizing firing, and the black patterns look faded. Sample B6 is different: the surface with a black pattern is gray in color with a light yellowish shade, the opposite surface is black in color, and the core in a dark gray color. The stripe pattern is of a saturated black color.
Samples O1 and O2 represent red ochre-like material that were found at different places in the Cherepakha-7 site. Sample O1 came from the cultural deposits inside the remains of one of the excavated pit-houses. Sample O2 was unearthed, together with several other ochre pieces, inside a small pit filled with ash and charred remains and located in the inter-housing space of the site. These samples are of a dark red hue and of a relatively compact texture (Figure 6).

3.2. Methods

The set of methods applied to examine the research materials contains visual observation, optical microscopy (OM), scanning electron microscopy (SEM), energy-dispersive spectroscopy (EDS), and Raman spectroscopy. All methods are non-destructive, which is an important condition for the study of rarely occurring archaeological artifacts that demand not being damaged.
Visual observation: Visual examination, particularly with a 10× magnifying glass, allows one to see some details of paint coverage and surface treatment technologies, such as smoothing, burnishing, or polishing [12,13].
Optical microscopy (OM): This method is used to detail observations of the textural characteristics of different kinds of coverings on archaeological ceramics, in particular, paints [11,14,15]. We used an inverted Carl Zeiss Axiovert 40 MAT microscope, assembled with a digital AxioCam ERc 5 s camera (Carl Zeiss Microimaging GmbH production Germany), with a magnification range of 10–1000×. The equipment is fitted for work with objects or samples with flat relief of tested areas. The morphology of the selected samples made it possible to provide only a few observations for red-paint and black-paint areas in the horizontal surface position. For red-painted Samples R1, R2, and R3, the observations of cross-sections were provided.
Electron scanning microscopy and energy-dispersive spectroscopy (SEM-EDS): The SEM-EDS method is applied widely in order to identify the microstructural patterns and elemental chemical compositions of paints and pigments on archaeological ceramics [1,4,7,11,13,14]. Due to the organizational and technical conditions of the research project, two different SEM-EDS instruments were employed. A SEM-EDS equipment ZEISS scanning electron microscope EVO-40 (Oberkochen, Germany) was used for the examination of red-painted Samples R1–R4 and black-painted Samples B1–B7. The SEM device is fitted with the energy-dispersive spectrometer (EDS) of the Oxford Instruments INCA-x sight. The acceleration voltage of SEM examination was kept at 20 kV, the working distance was held at 13.0–16.5 mm, and the magnifications were from 300–500× to 1000×. The examination of red paint Samples R5 and R6 and ochre Samples O1 and O2 was provided by the equipment of the ULTRA 55+ (ZEISS, Germany) scanning electron microscope with a field emission cathode (FE-SEM) with an X-Max 80 EDS system (Oxford Instruments, UK) at 20 kV, working distance at 6.2 mm, and magnification 1000×. Preliminary preparation of sherds before analysis consisted of cleaning the studied surfaces by carefully removing dust pollution from the surface with a tissue wet with ethyl alcohol. No special films or coatings (carbon, chromium, and gold) were applied to the samples’ surfaces before examination.
EDS measurements were provided for Samples R2–R6 on red-painted surfaces and on non-painted surfaces coated with a clay slip. For Sample R1, measurements were provided on the red-painted surface, and on the opposite flaked surface, the ceramic paste texture was exposed (see Figure 4). The measurements for Samples B1–B7 were provided on black-painted areas and background areas. At each tested area, from 14 to 22 EDS spectra were recorded. We present the EDS measurements data in elemental form by following the research of [14,24]. Taking into account that the EDS method determines the content of chemical elements (in percent of the weight composition) at a semi-quantitative level, values ≥ 1.0% were most considered for the correct interpretation of elemental compositions data. The results of elemental composition measurements are summarized as the set of box-and-whiskers diagrams.
Raman spectroscopy: This technique is considered the most sensitive one for recognizing ancient pigment compositions [2,3,6,7,9,12]. The Raman spectra were recorded on an InVia Reflex Raman microspectrometer (Renishaw, United Kingdom) coupled with a Leica DM2500 M universal microscope (at incident light mode: Leica Microsystems, Germany). For excitation, a 532 nm diode pumped laser at a power of 1.0 mW and exposure time of 0.1 s was used, and 100–200 scans were used. A laser spot with a diameter of ~2 μm on the sample was formed with a lens (20×, NA = 0.4, Leica). Laser power, total measuring time, and number of accumulations were set to obtain good signal-to-noise ratios. The spectra were processed using a smooth baseline subtraction and peak fit functions in the WiRE 4.4 software. The spectrum of each sample at each location (three locations per sample) was measured over a range of 170 to 1800 cm–1. This is just first experience of Raman spectroscopy usage for the study of archaeological ceramics of the Russian Far East. Great attention was paid to the application of this method to the examination of pottery designed with black patterns. Six black-painted samples (B1–B3 and B5–B7) and one red-painted sample (R1) were studied.

4. Results and Discussion
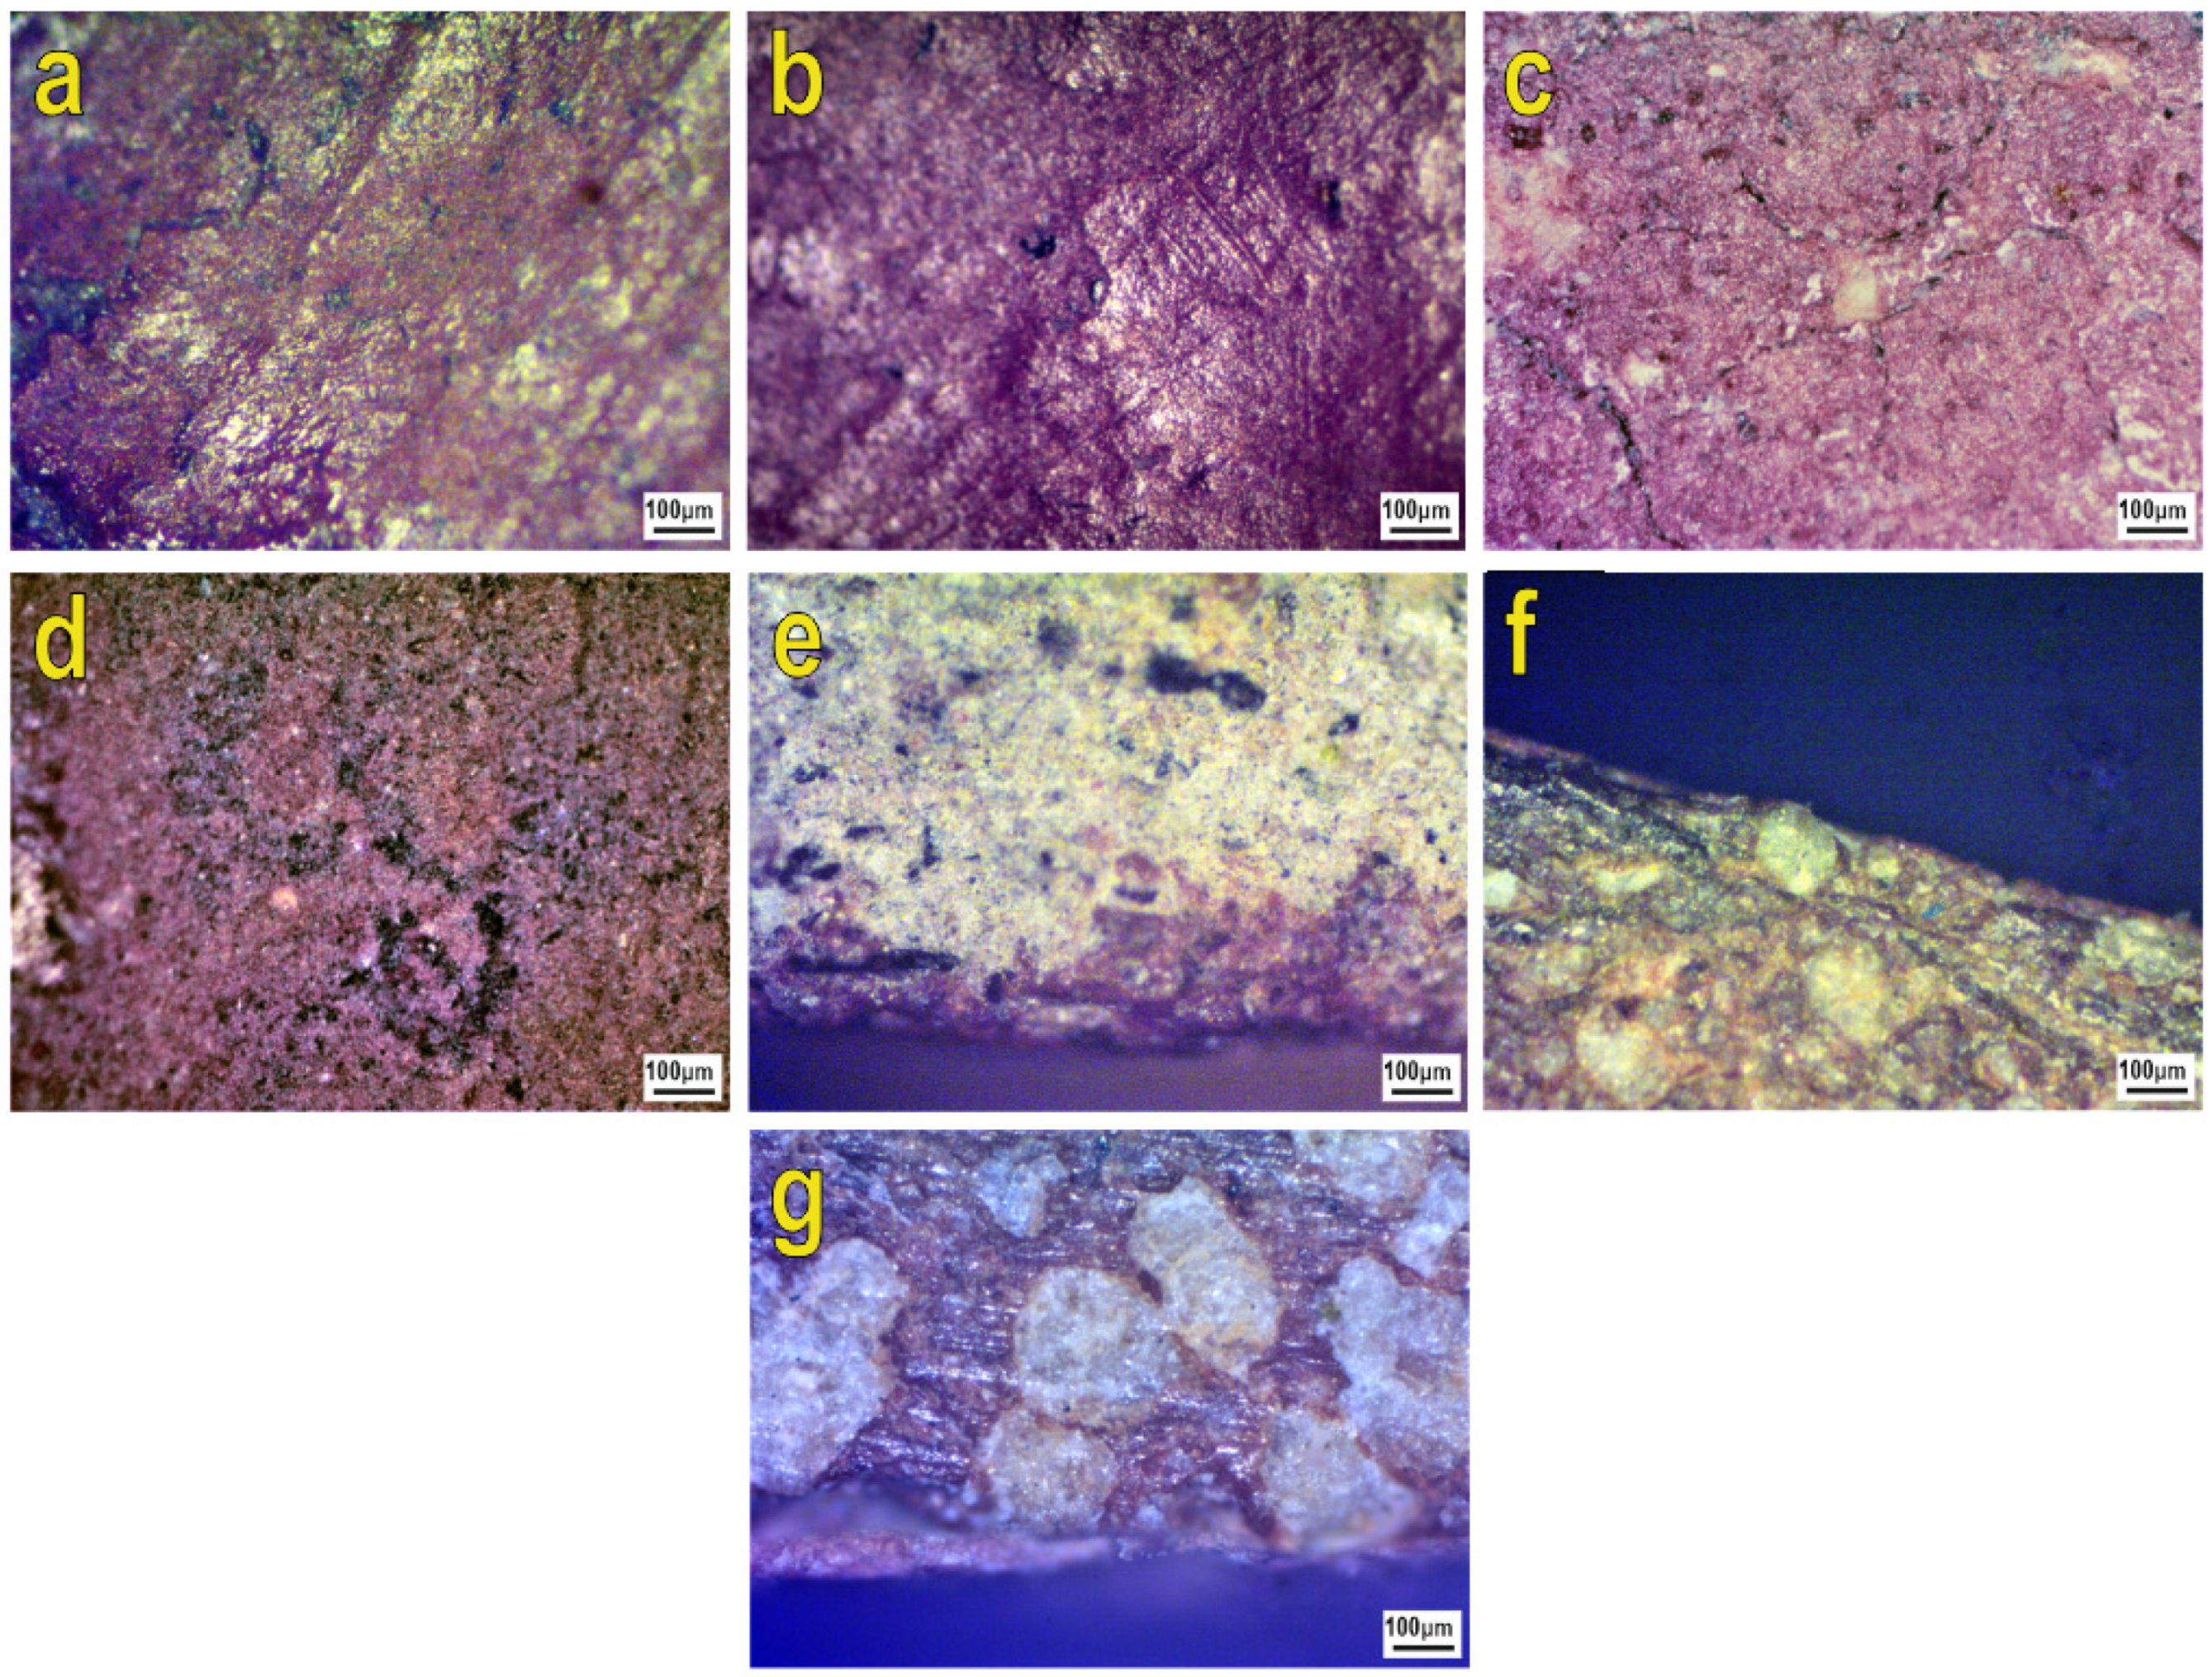
4.1. Red Paint

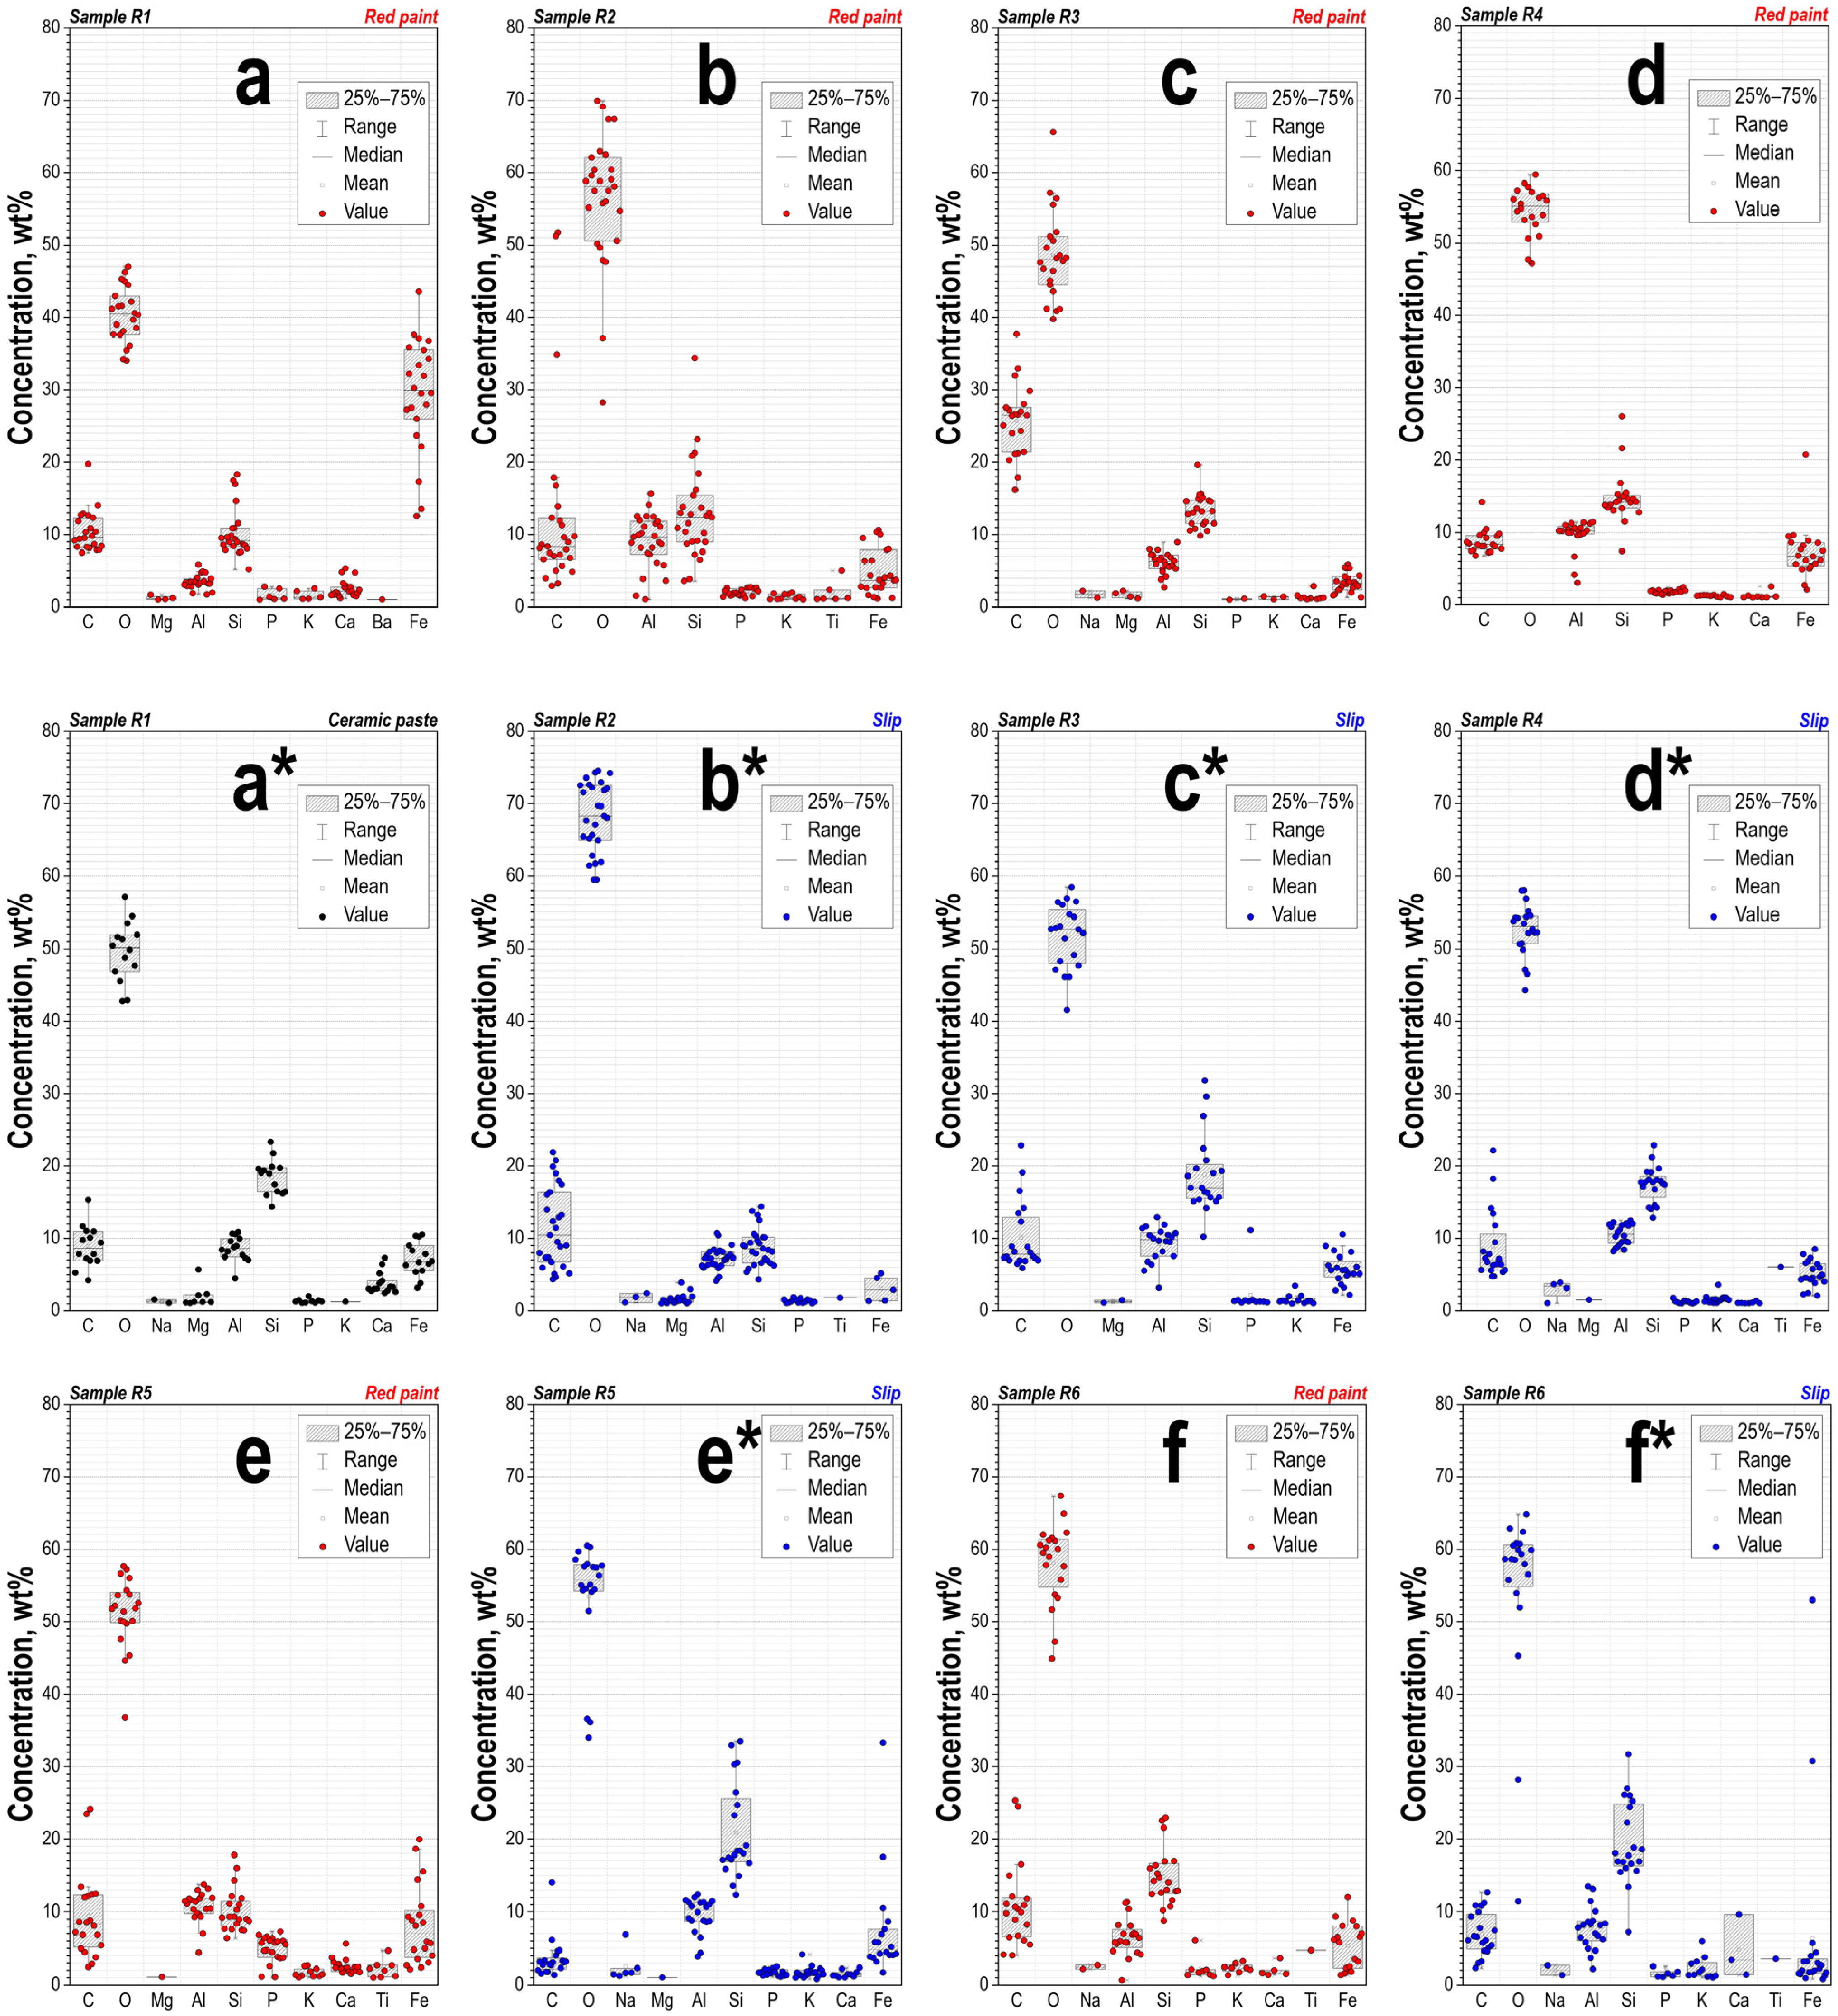
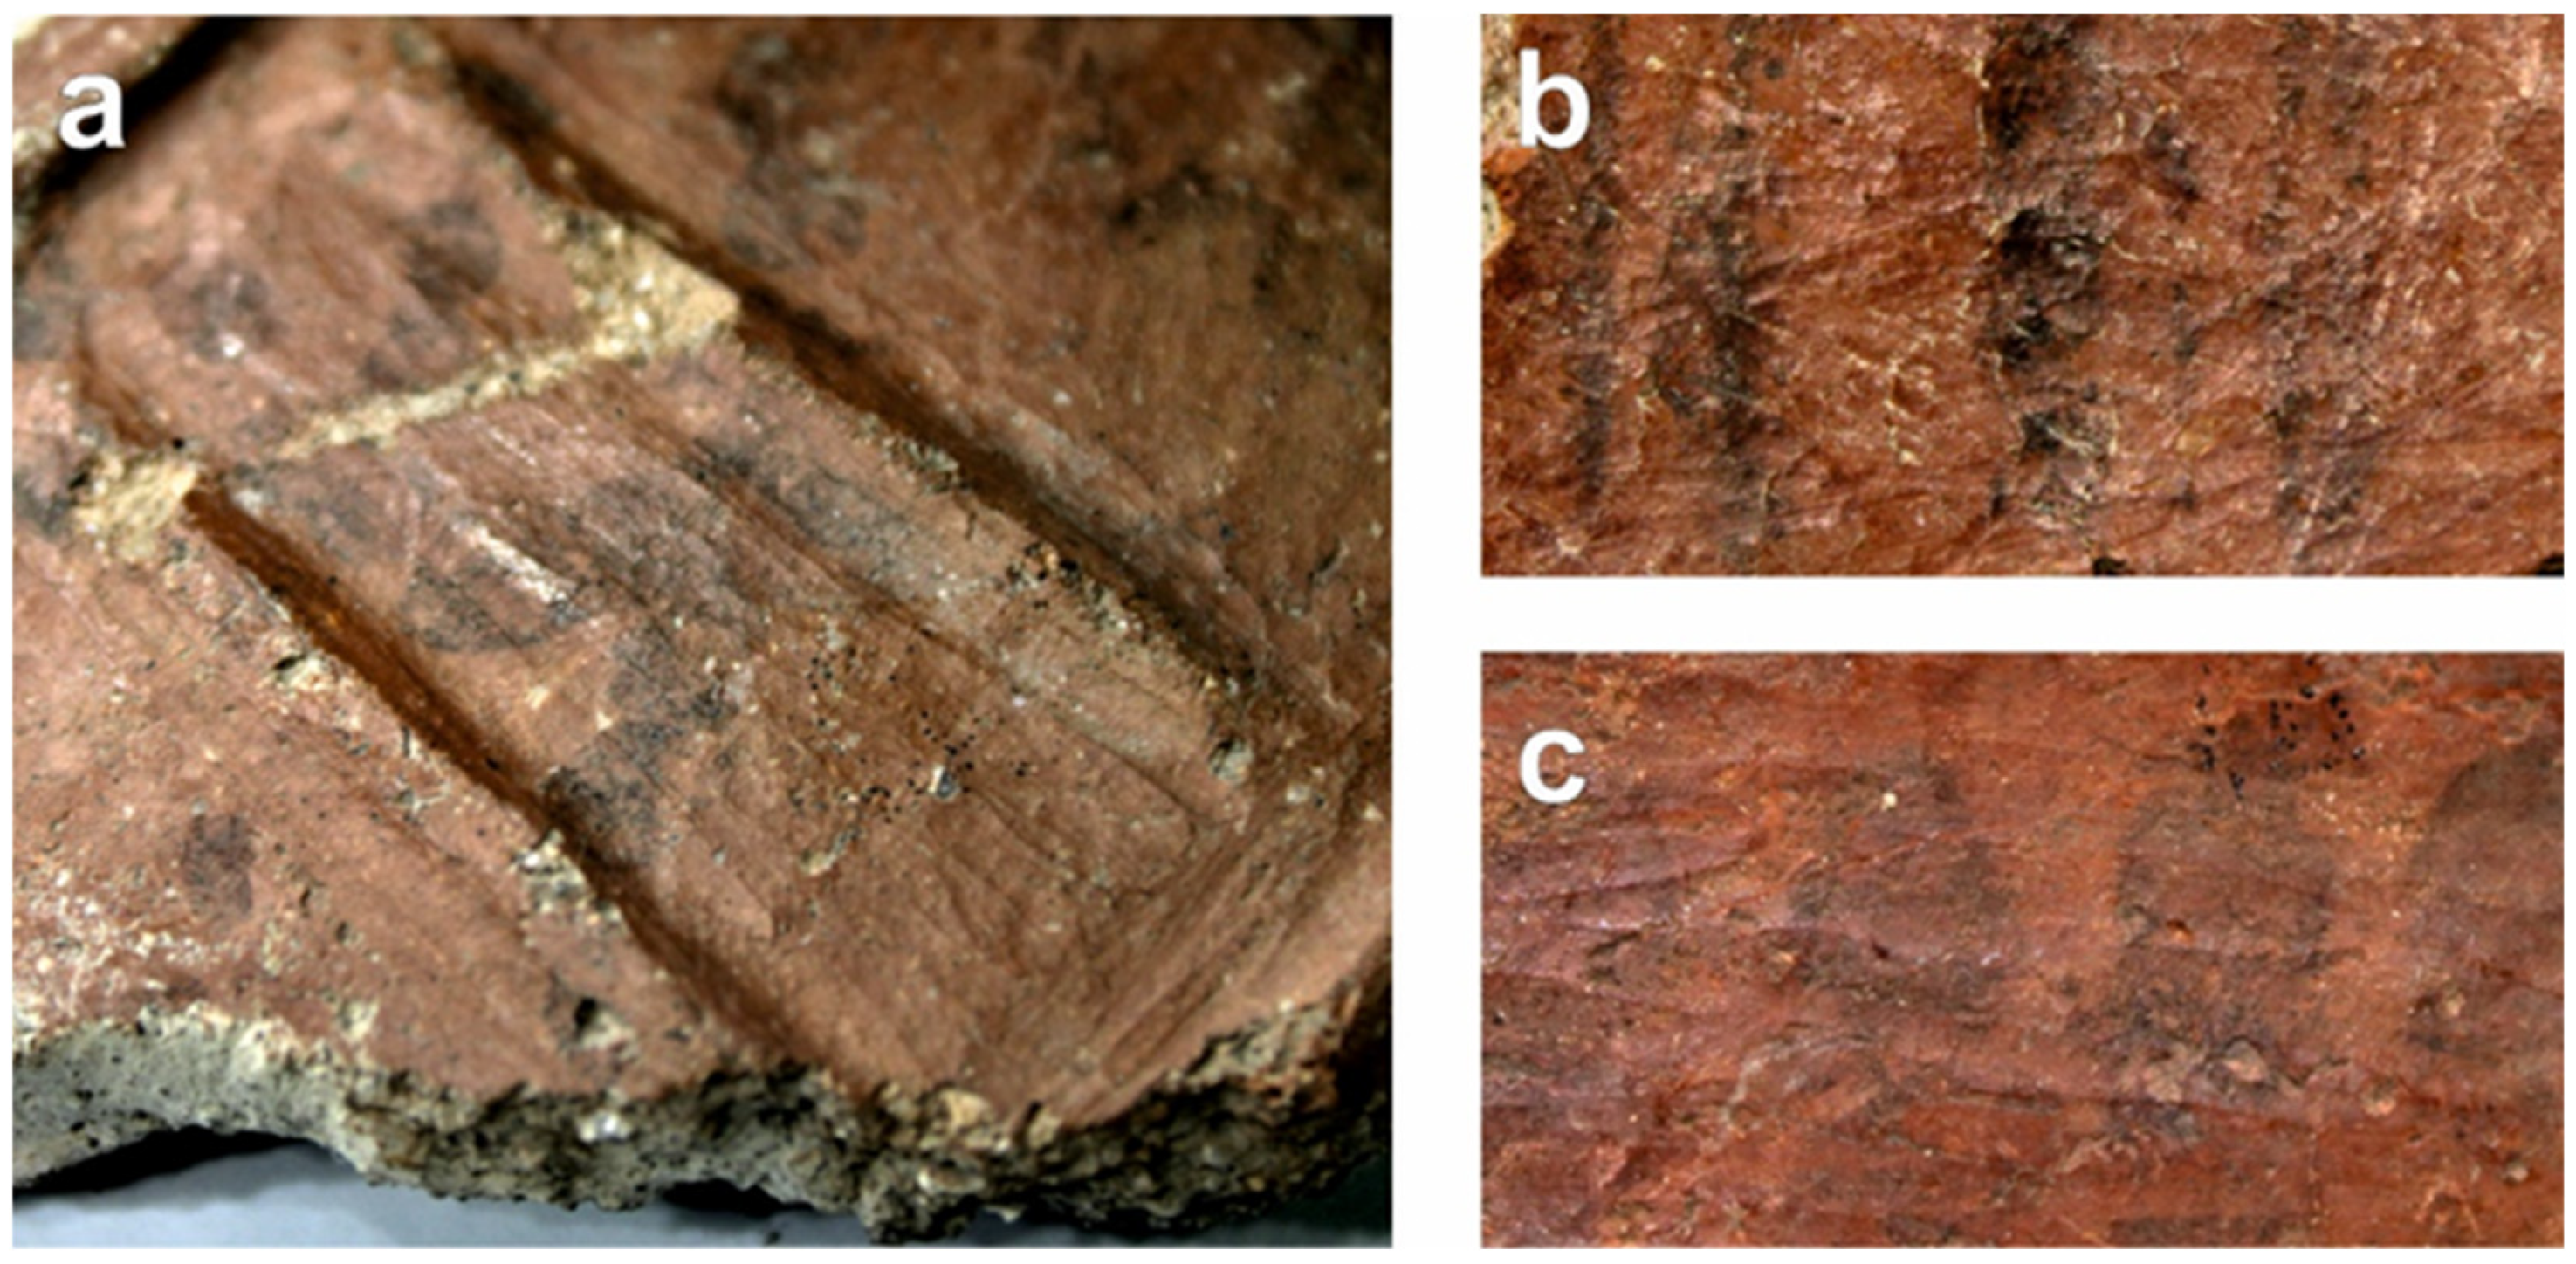
4.1.1. Samples R1–R6

Macroscopically, by naked eye, and with a 10 × magnifying glass, Samples R1, R2, R3, and R5 are characterized by a relatively dense, compact paint layer with evidence of glossy burnishing (Figure 4). The traces of burnishing indicate that the paint was applied and treated before the firing process [12]. On Samples R4 and R6, the paint layer applied above the yellow slip is very thin and dull.
The optical microscopy of Sample R1 reveals that the red paint layer relief is of uneven appearance. As it may be thought, fine, closely spaced, hairy-like traces are provided by brushing, and more pronounced groove-like traces are produced by the burnishing treatment (Figure 7a,b). The red paint layer on Samples R4 and R5 has a crackled texture (Figure 7c,d). At cross-sections, the red paint is visible as a separate layer, differing in color and with a relatively “thin” texture from the coarse ceramic paste matrix. The thickness of the red paint layer varies from about 30 μm for Sample R2 (Figure 7f) to 100–200 μm for Sample R1 (Figure 7e). No intermediate layer between the red paint and ceramic body was detected for these samples. The thickness of the paint layer on Sample R3 seems to be very uneven (Figure 7g).
The SEM examination of the red paint and slip areas at the same samples’ surfaces reveals that, in some cases, such as on Sample R2, the paint and slip textures differ (Figure 8a,b). However, in other cases, such as on sample R3, they are very similar (Figure 8c,d). The SEM images of the red paint layer on different samples show significant variability of textural homogeneity (Figure 8a,c,e). Sample R1 is interesting because of the presence of clearly visible crystal-like inclusions that are very similar in shape and size to hematite crystals [25,26].
The results of EDS examination are presented in the diagrams in Figure 9. In the chemical compositions of the red paint samples, the elements that predominate, besides O and C, are silica (Si), alumina (Al), and iron (Fe). A permanent element present in low concentrations in all samples is potassium (K). The red paint substance may be determined as some kind of iron-containing aluminosilicate. Based on the iron concentration values, it seems possible to tentatively distinguish three variants of red paint composition. Variant 1, represented by Sample R1, is distinctive because of its very wide range of values, from 12.54 to 43.56%; most of the values fall within the interval 22.18–37.61%. Eight EDS spectra were recorded intendedly at sites of hematite crystal-like inclusions. The ranges of elements’ concentration are as follows: Fe, 29.51–43.56%; Si, 5.20–14.66%; Al, 1.98–4.0%; and Ca, 0.87–2.90%. Obviously, the iron predominates significantly, indicating the ferruginous origin of these inclusions.
Variant 2, represented by Sample R6, shows an iron concentration of 14.43–19.93% in certain spectra. Variant 3, represented by Samples R2, R3, R4, and R5, shows relatively low iron concentration values, 10.0–12.0%, with a certain tendency toward homogeneity. Iron is the only element present in samples of chemical compositions that might be considered the main coloring agent.
As shown in the diagrams, elemental compositions of red paint and brownish-yellow slip on Samples R2–R6 have no significant differences in their iron concentrations. There is no evidence that the iron content in red paint is higher than in the slip. Moreover, the cases of Samples R3 (Figure 9c,c*) and R5 (Figure 9e,e*) show that the upper values of iron content in the slip composition exceed the ones in the red paint composition. In the case of Sample R1, the iron concentration in the red paint layer is significantly higher in comparison with the iron concentration in the paste. The paste composition of R1 is characterized by a tendency toward higher concentrations of alumina and silica, correspondingly (Figure 9a,a*).
Sample R1, characterized by its highest iron content, is distinguished also by the presence of barium (Ba) registered in a single spectrum in a concentration of 1.03%. This element may be preliminarily considered an impurity in the raw material used for the paint. Barium occurs in clay deposits and ochres [27,28]. Manganese (Mn) was traced episodically in minor concentrations, <1.0%, in Samples R1, R2, and R3. No probable trace elements, such as Zr, Zn, Ni, V, Cu, or Ce, were recognized in the samples.
Certain possibilities may be suggested based on the presence of phosphorous in the paint composition. P is a permanent element, together with Al, Si, Fe, and K. P is also a permanent element in the slip composition of the samples. In all cases, except for Sample R5, the concentrations of P are relatively the same for the paint and the slip, not exceeding the mean values 1.0–2.0.%. It is well-known that the presence of some amount of phosphorous in the chemical composition in archaeological ceramics is the usual situation caused by the penetration of this element from cultural soil deposits rich in phosphates [29]. In the red paint of R5, the P content is from 1.07 to 7.27%, with a mean value of 4.92%. In the elemental composition of the slip on the sample’s reverse side, the P content is 1.09–2.51%, with a mean value of 1.68%. Therefore, the increased P content in red paint cannot be explained by probable penetration of the element from soil deposits. In this case, the P content in the red paint and slip compositions might be equal or almost equal.
The Raman spectroscopy examination provided for Sample R1 showed that all recorded Raman spectra are of similar characteristics, except for the small frequency shifts and different fluorescence backgrounds (Figure 10). The Raman spectra have strong noise and fluorescence. As a result, seven bands at 1315, 608, 497, 409, 292, 246, and 225 cm−1 were recorded as identifying the hematite (α-Fe2O3). This corresponds to the Raman bands diagnostic for hematite as the crystalline phase of iron [30]. Similar Raman spectra patterns are registered for red ochres [31] and red pigments on archaeological ceramics [3,10,32]. Moreover, in the Raman spectra of Sample R1, the quartz (Q) is identified with the main band at 465 cm−1 [33]. This indicates the presence of quartz as a mineralogical component of red paint, together with hematite. Similar is the case of the hematite and quartz present in red paint detected by Raman examination that is noted for pottery from the Iron Age in a local archaeological site in Southwestern Iberia [11].

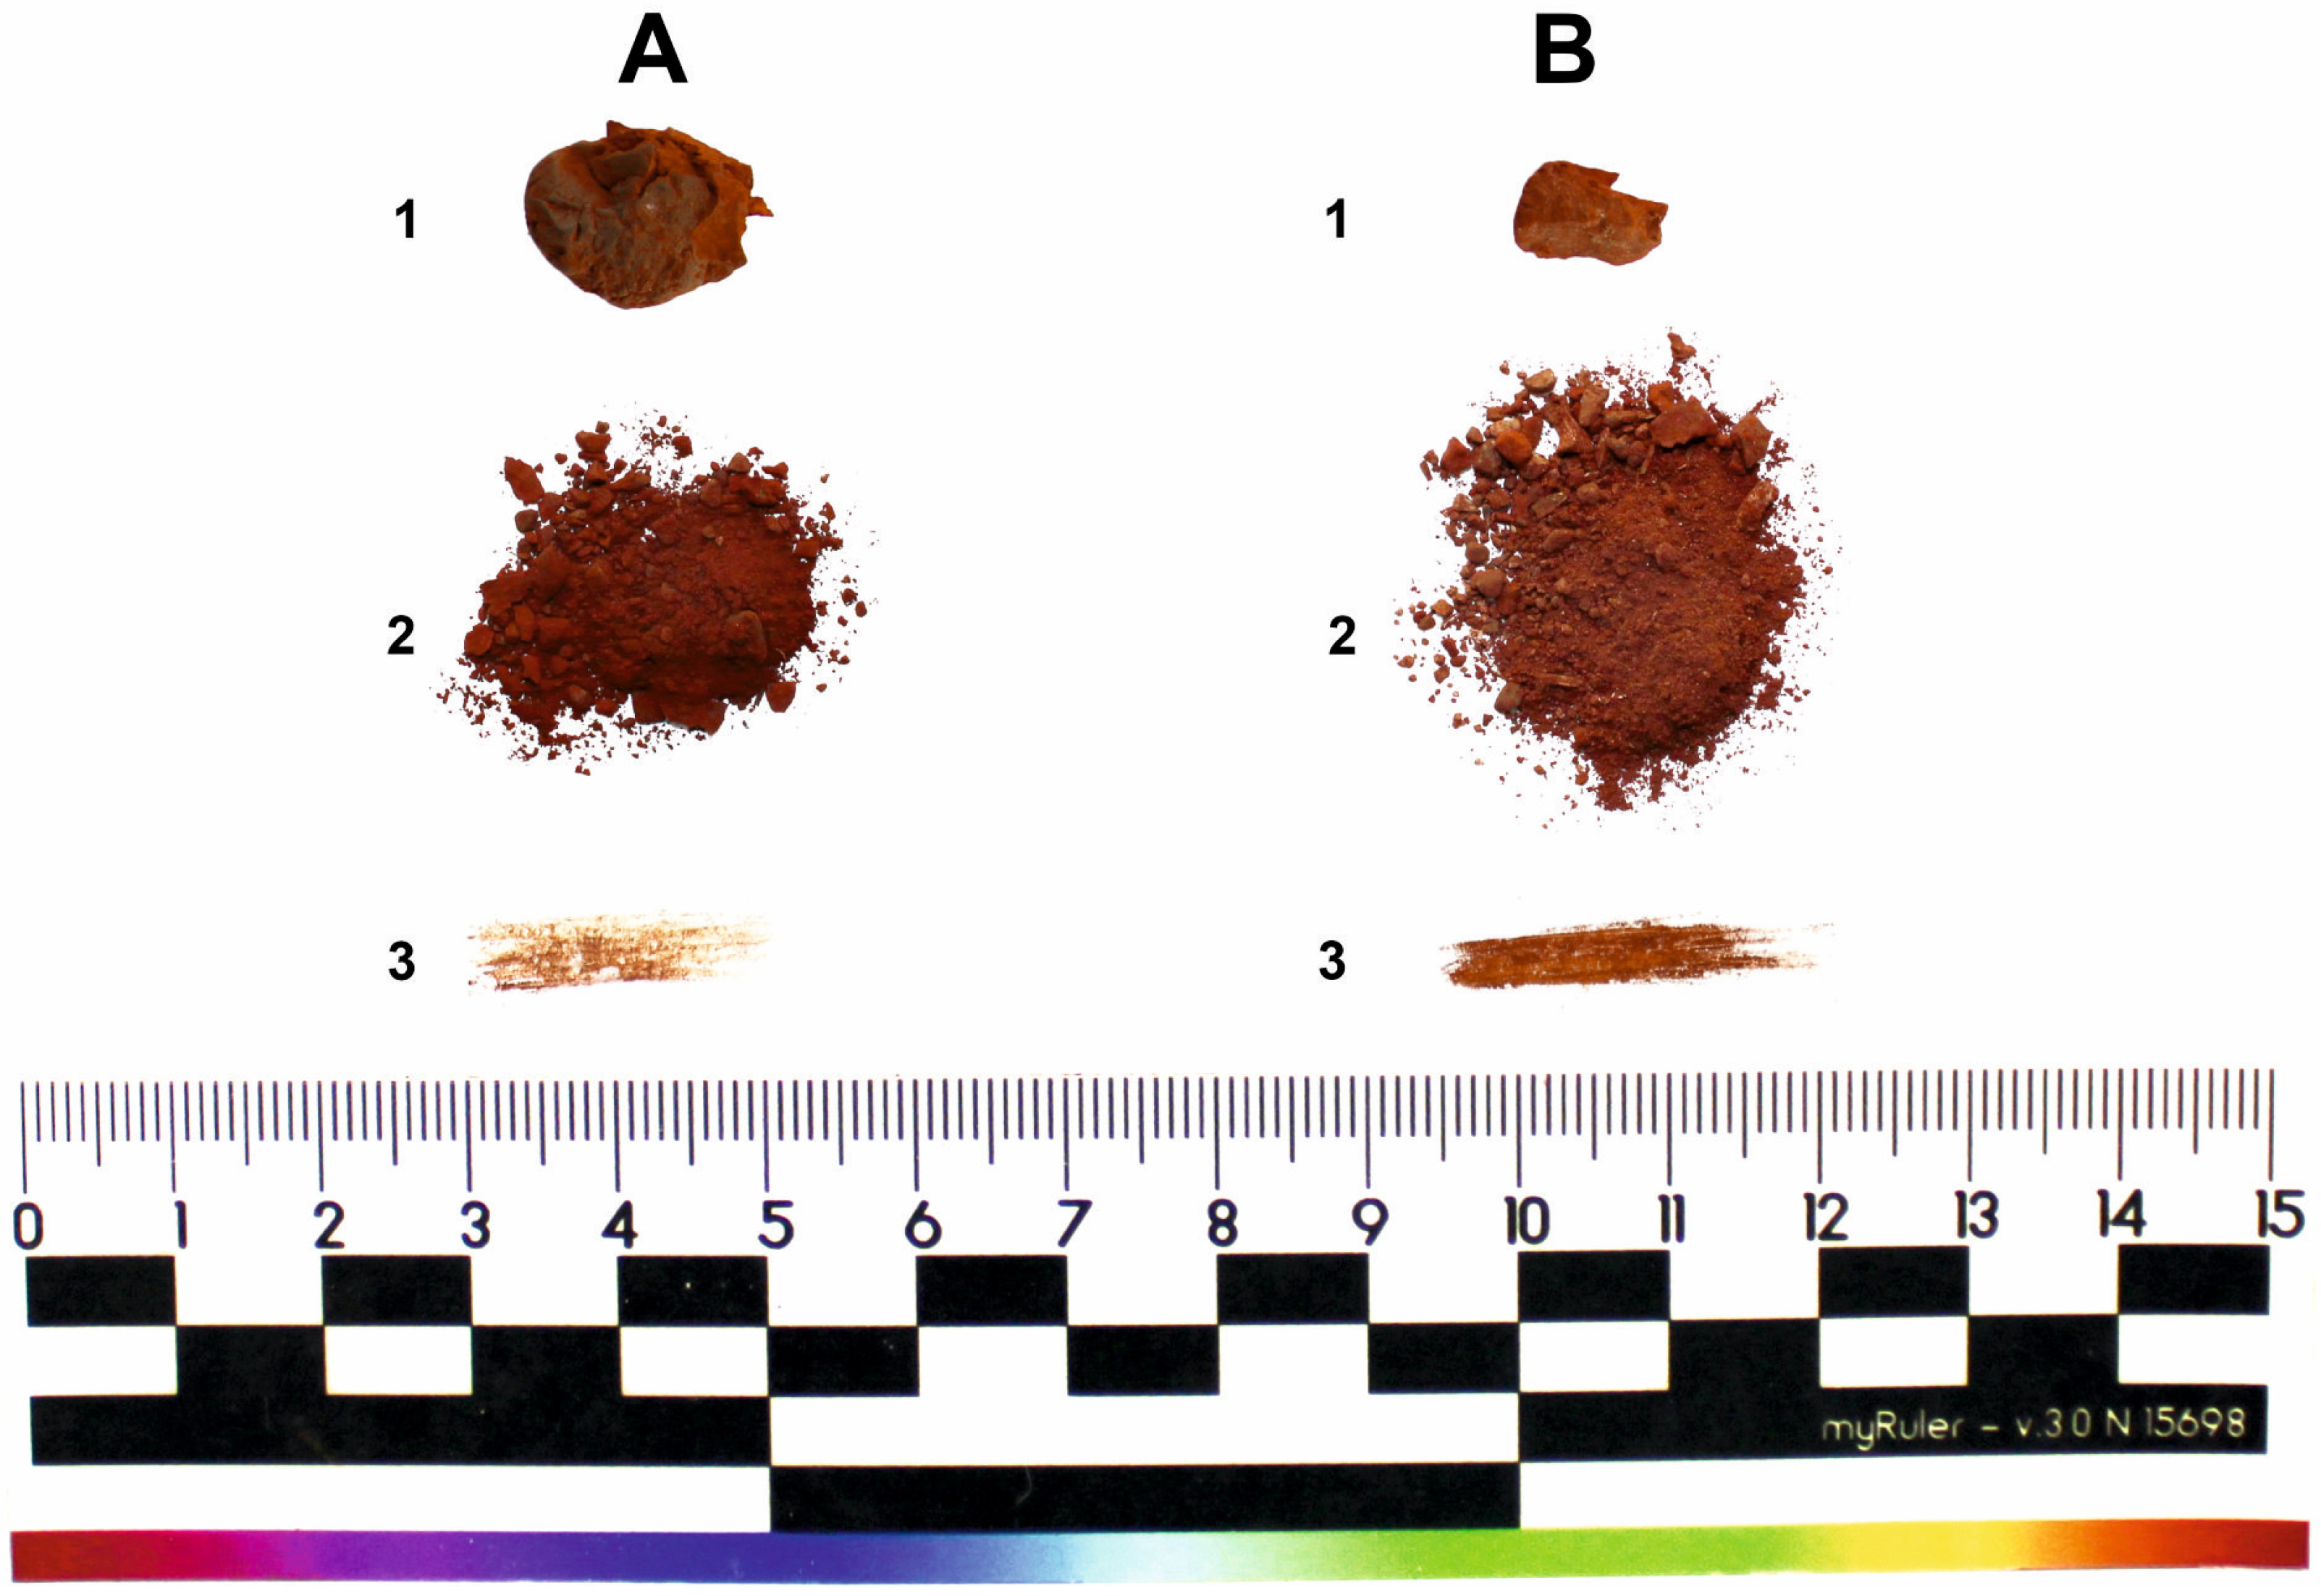
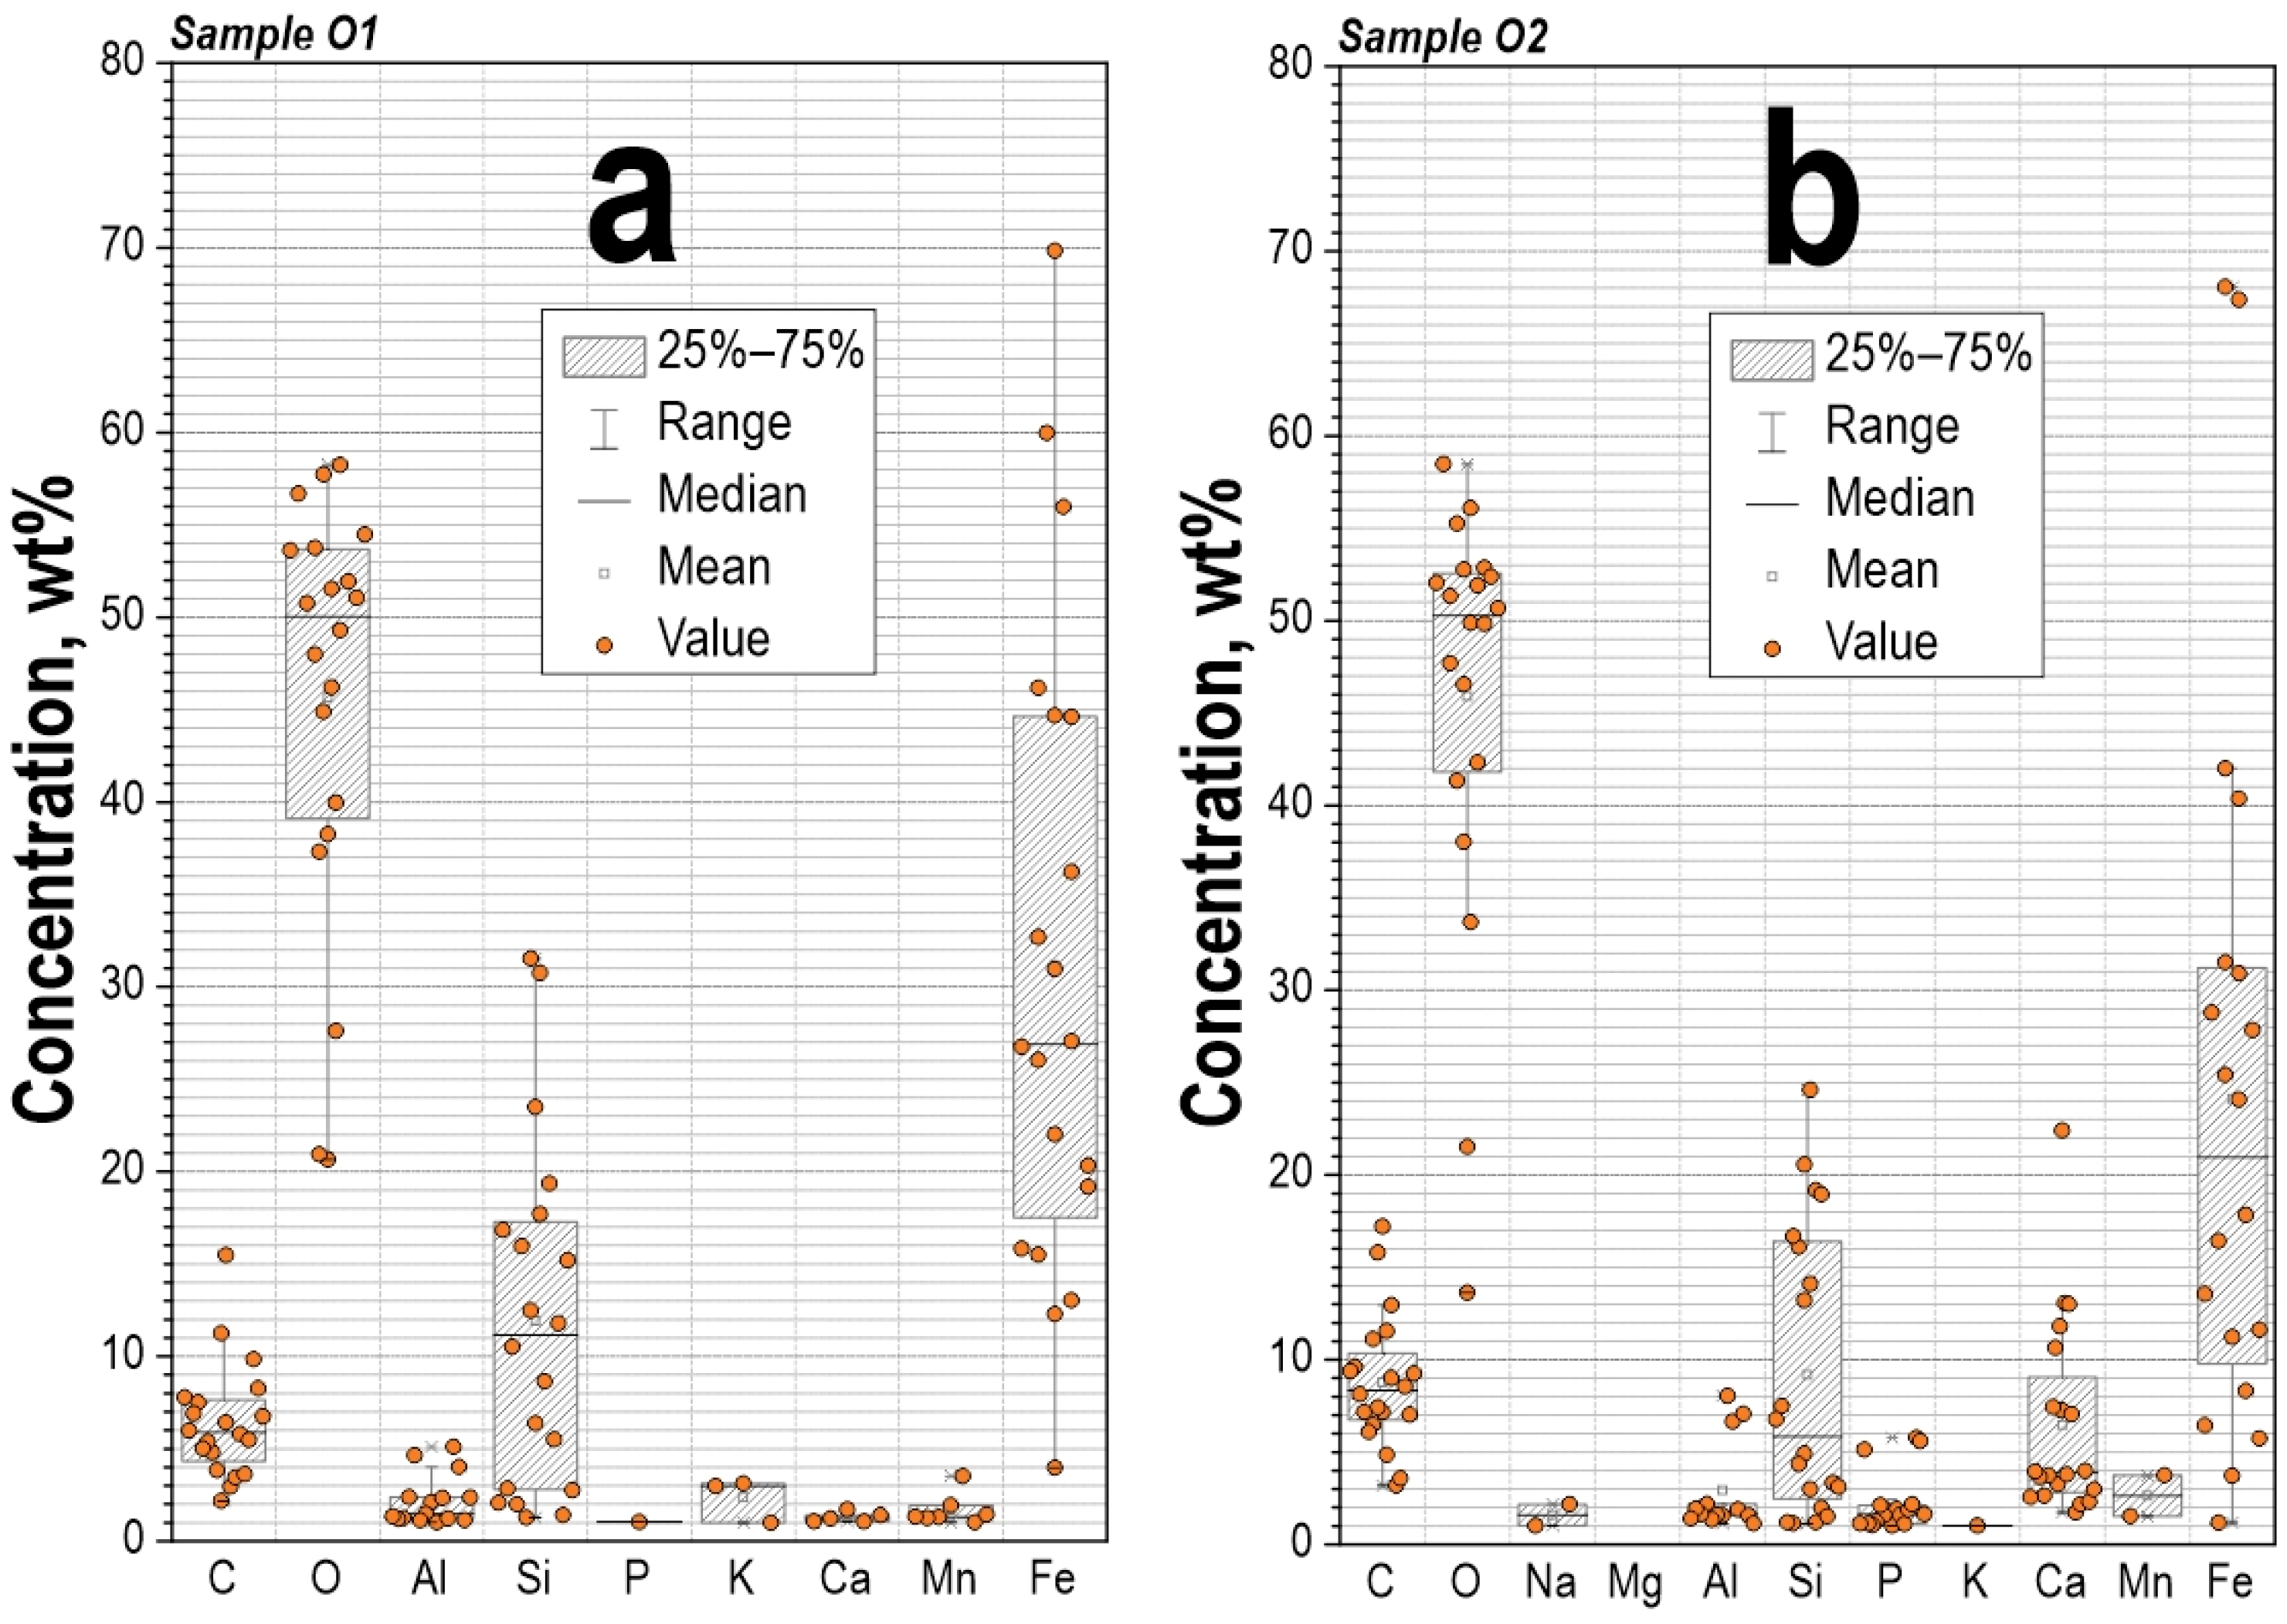
4.1.2. Ochre Samples O1, O2
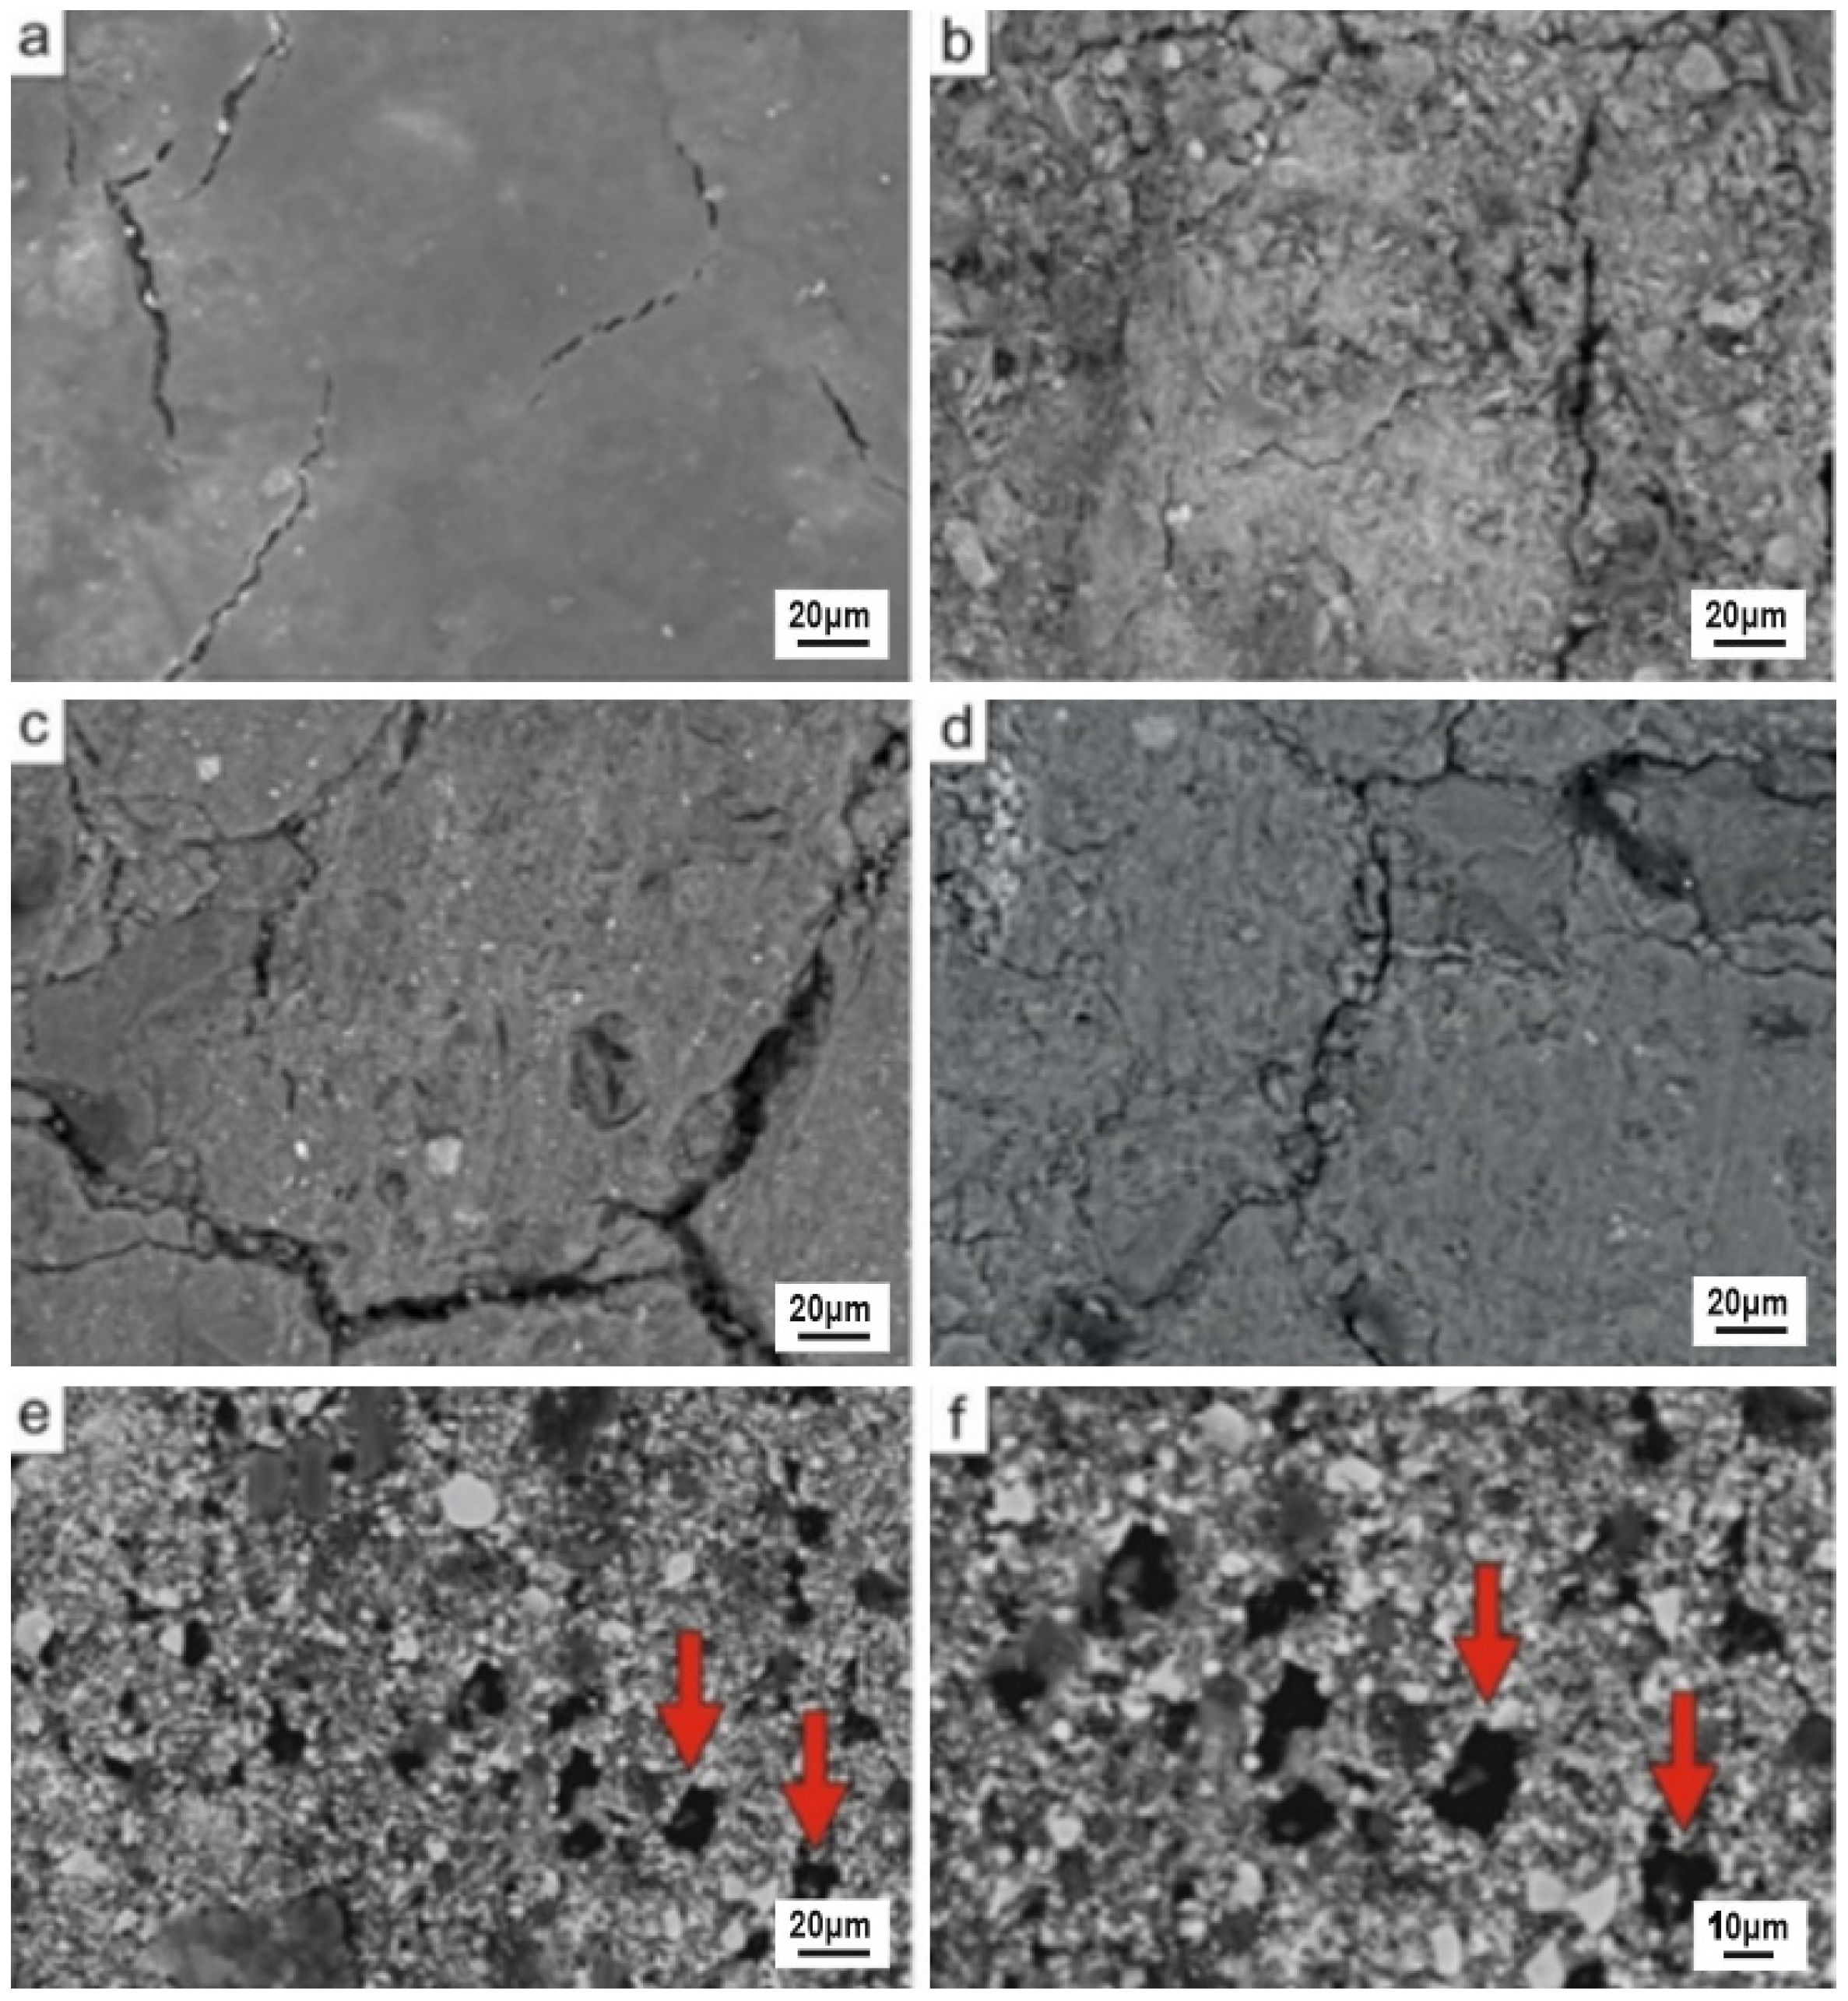
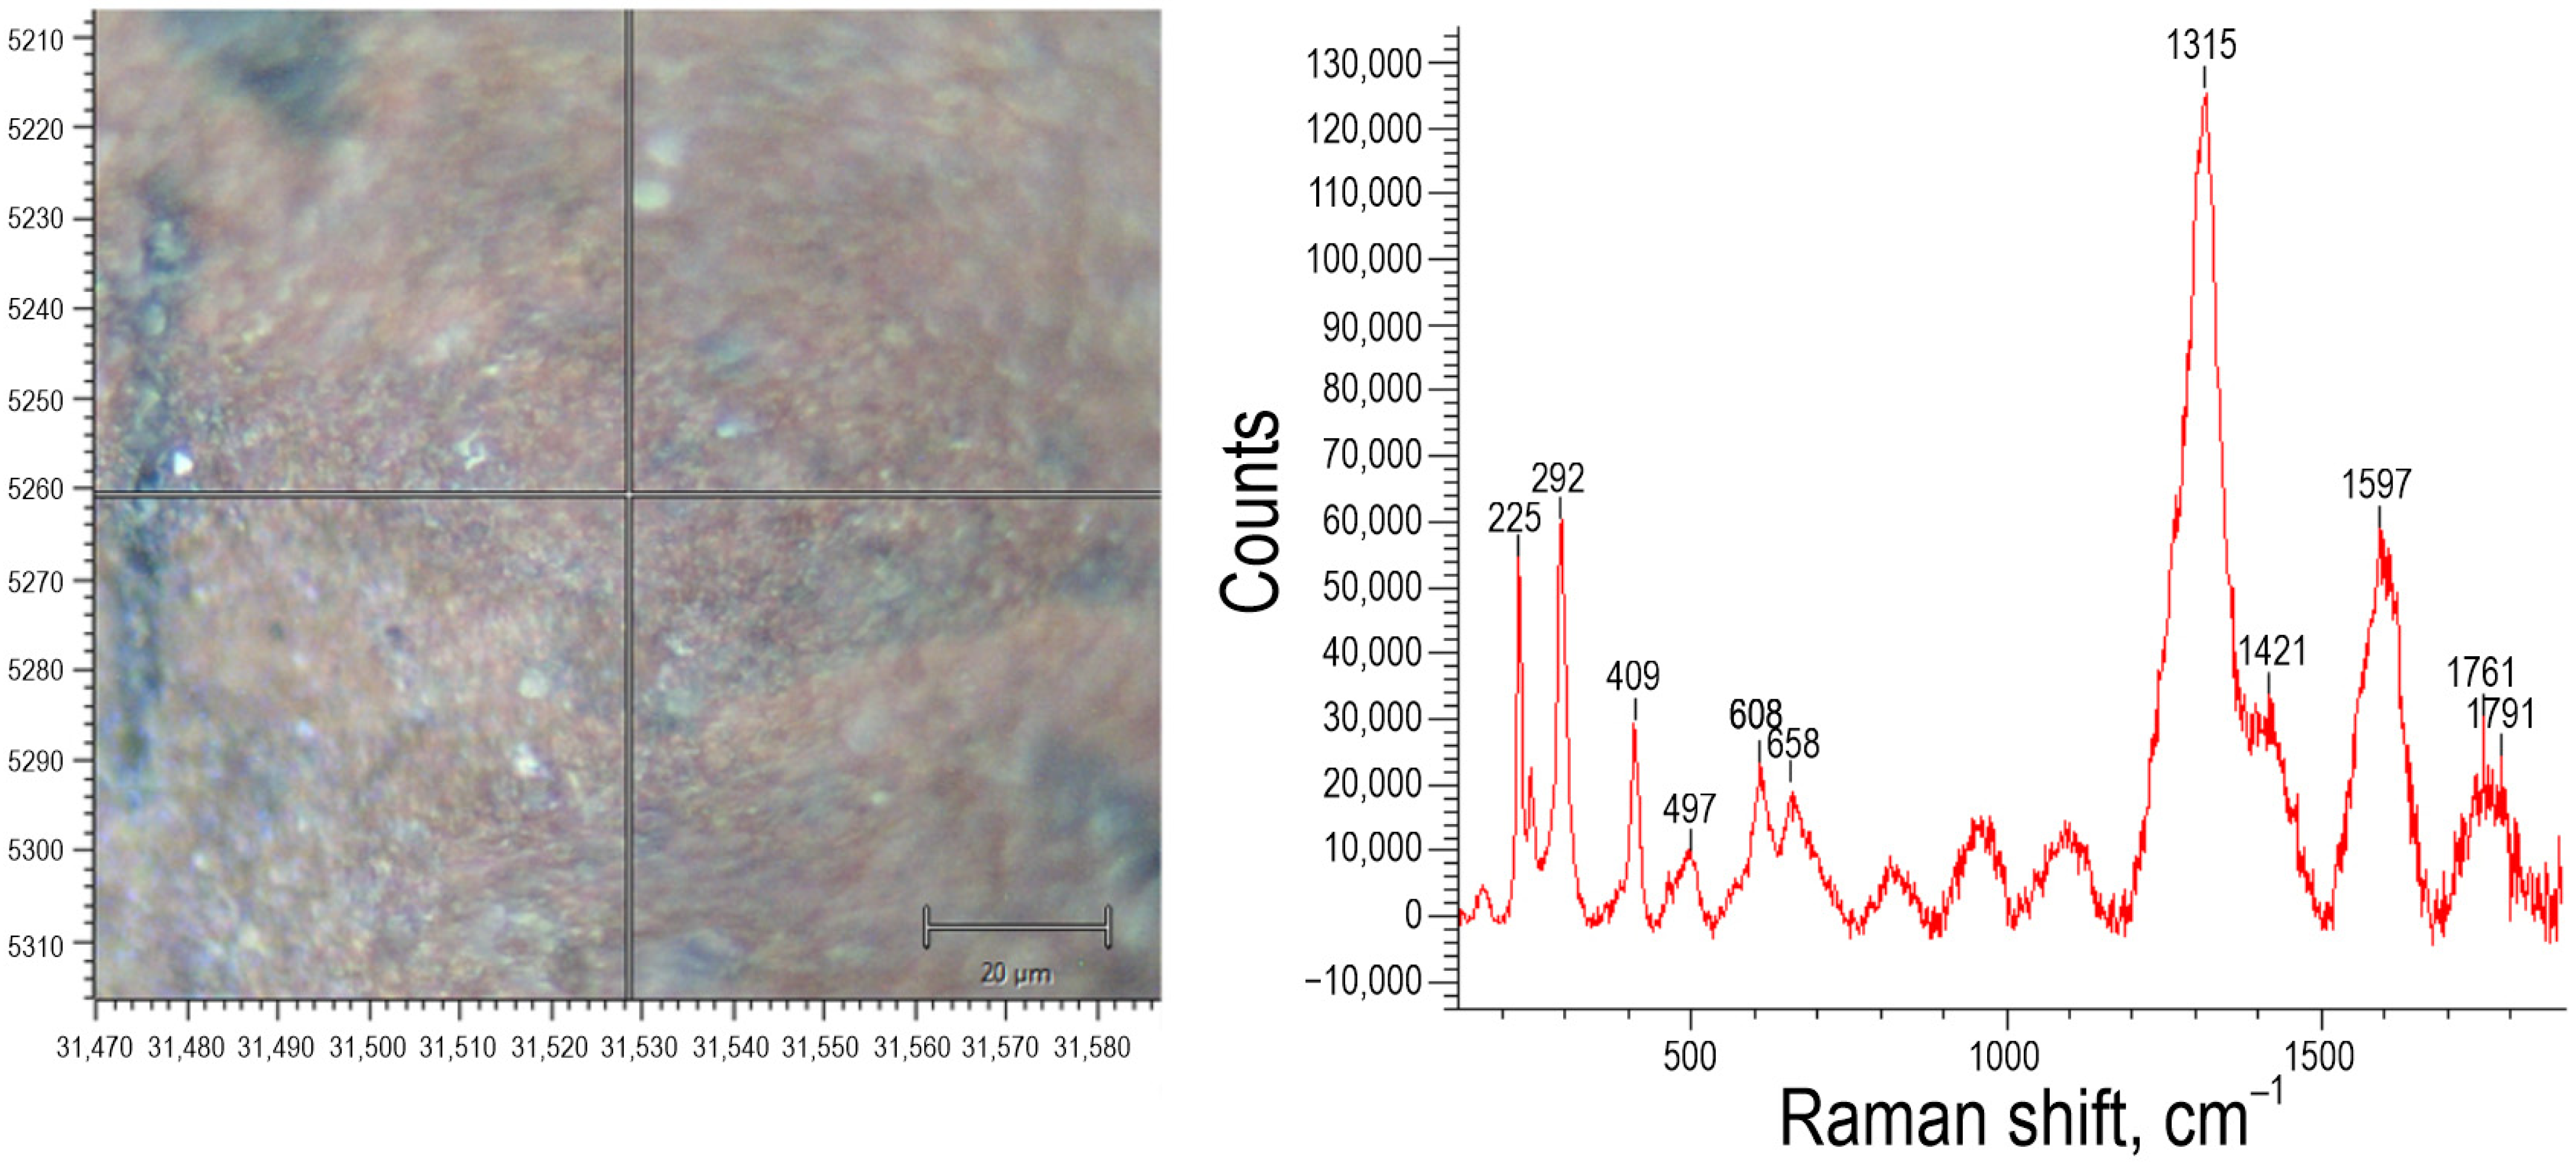
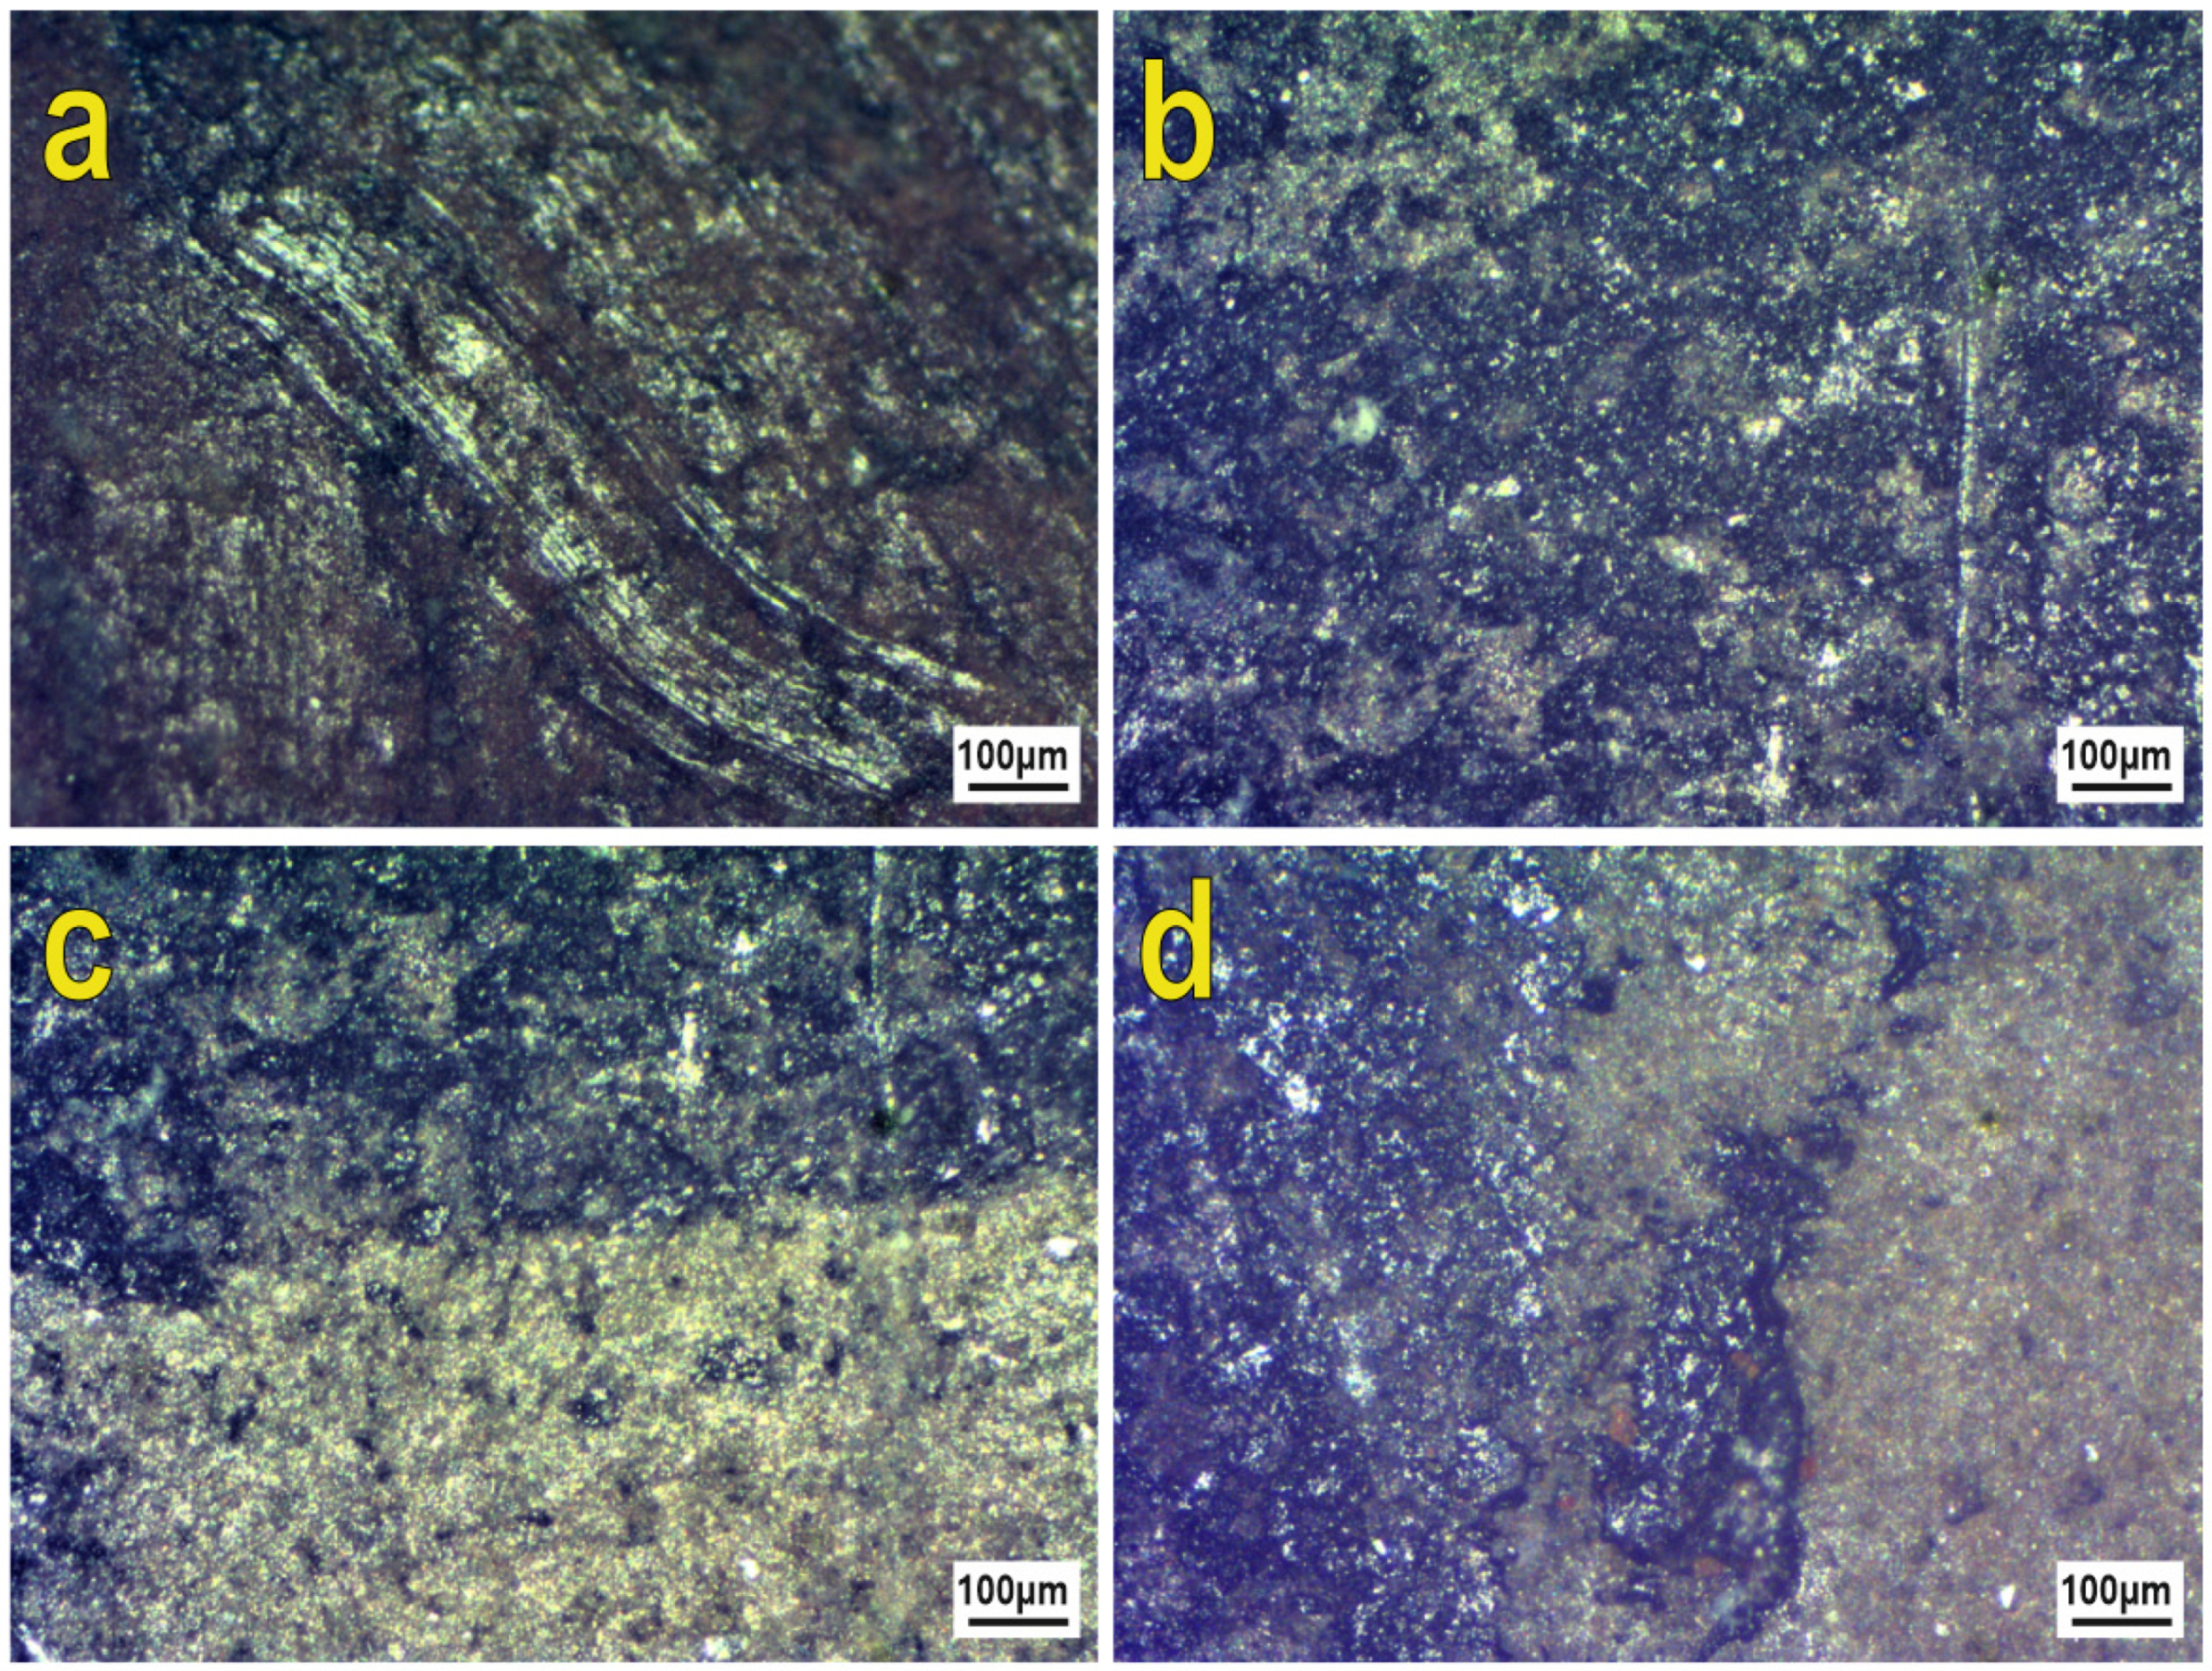
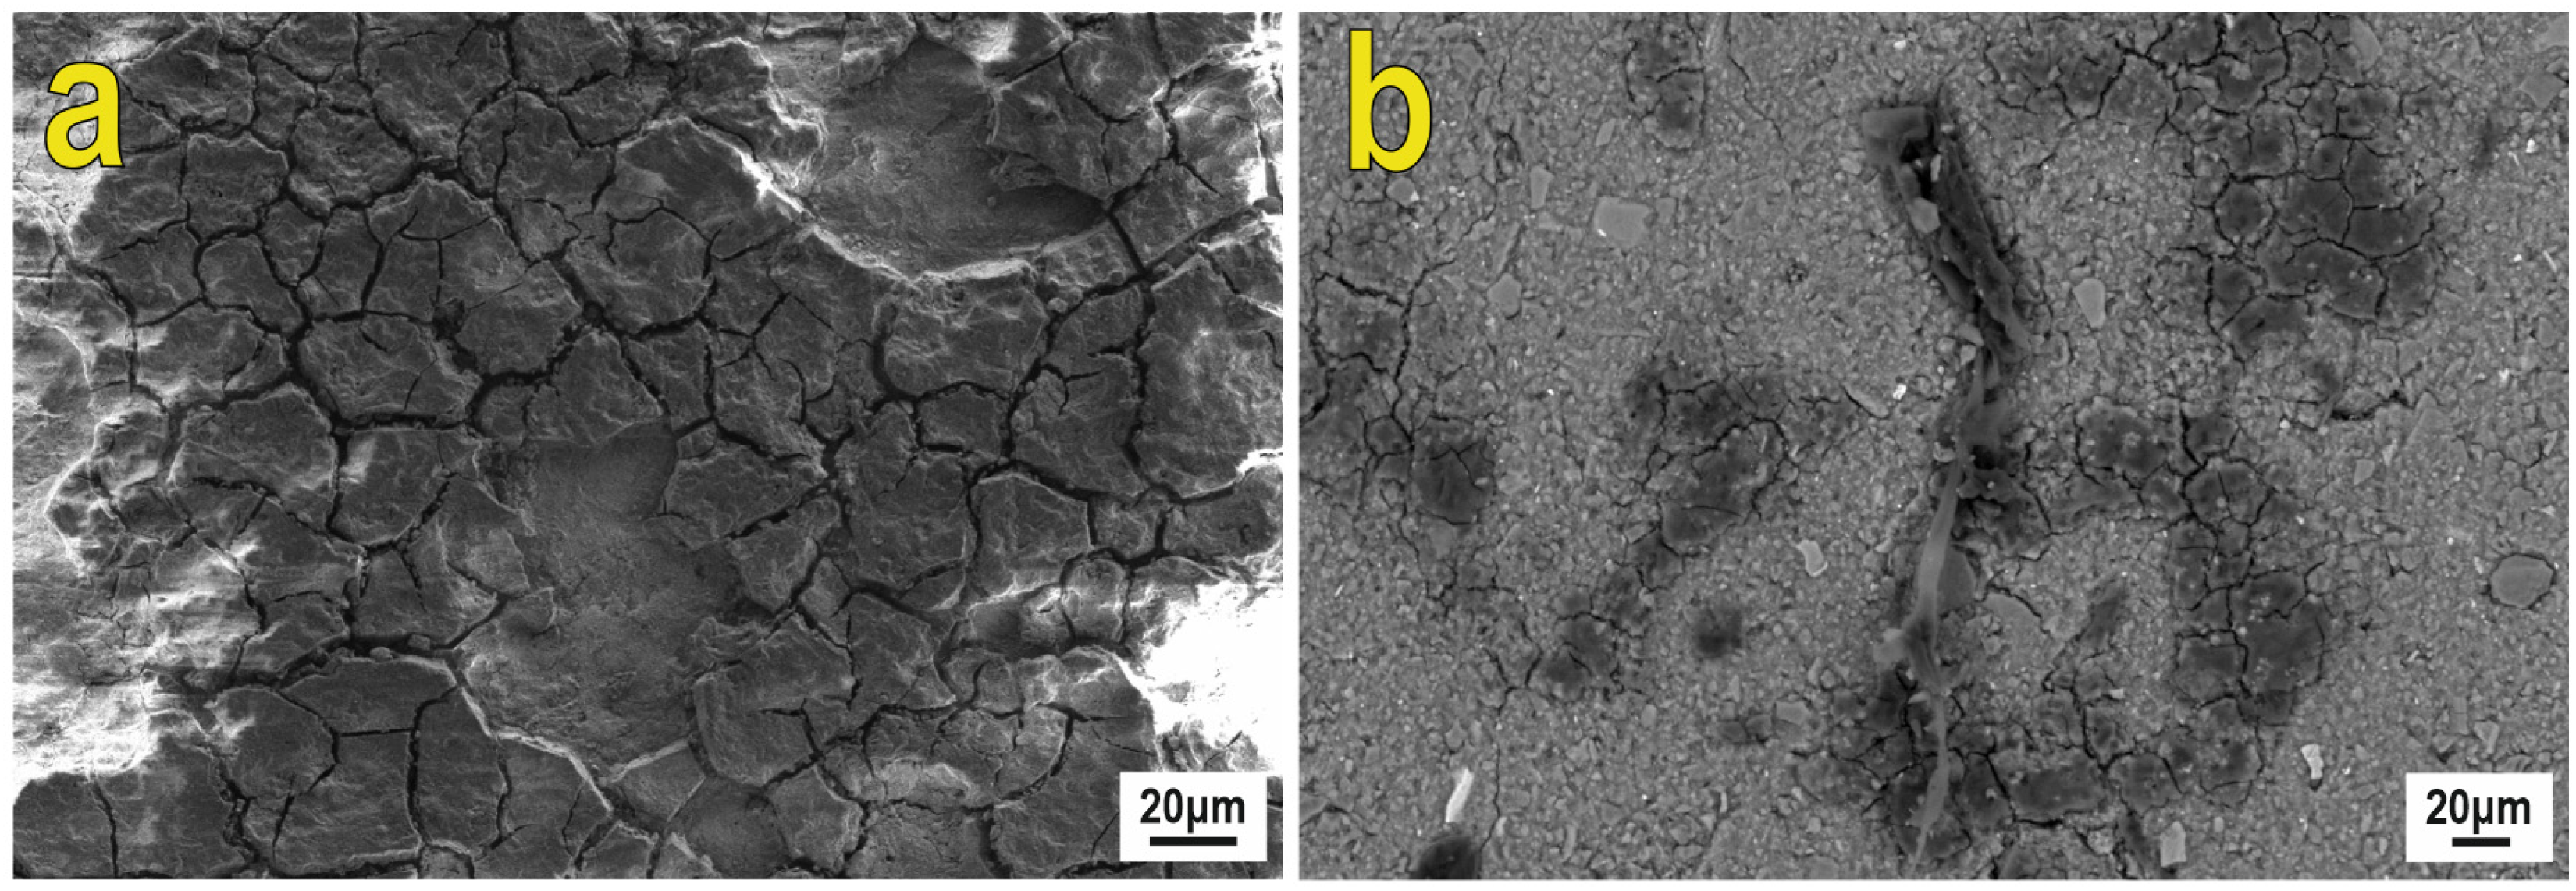
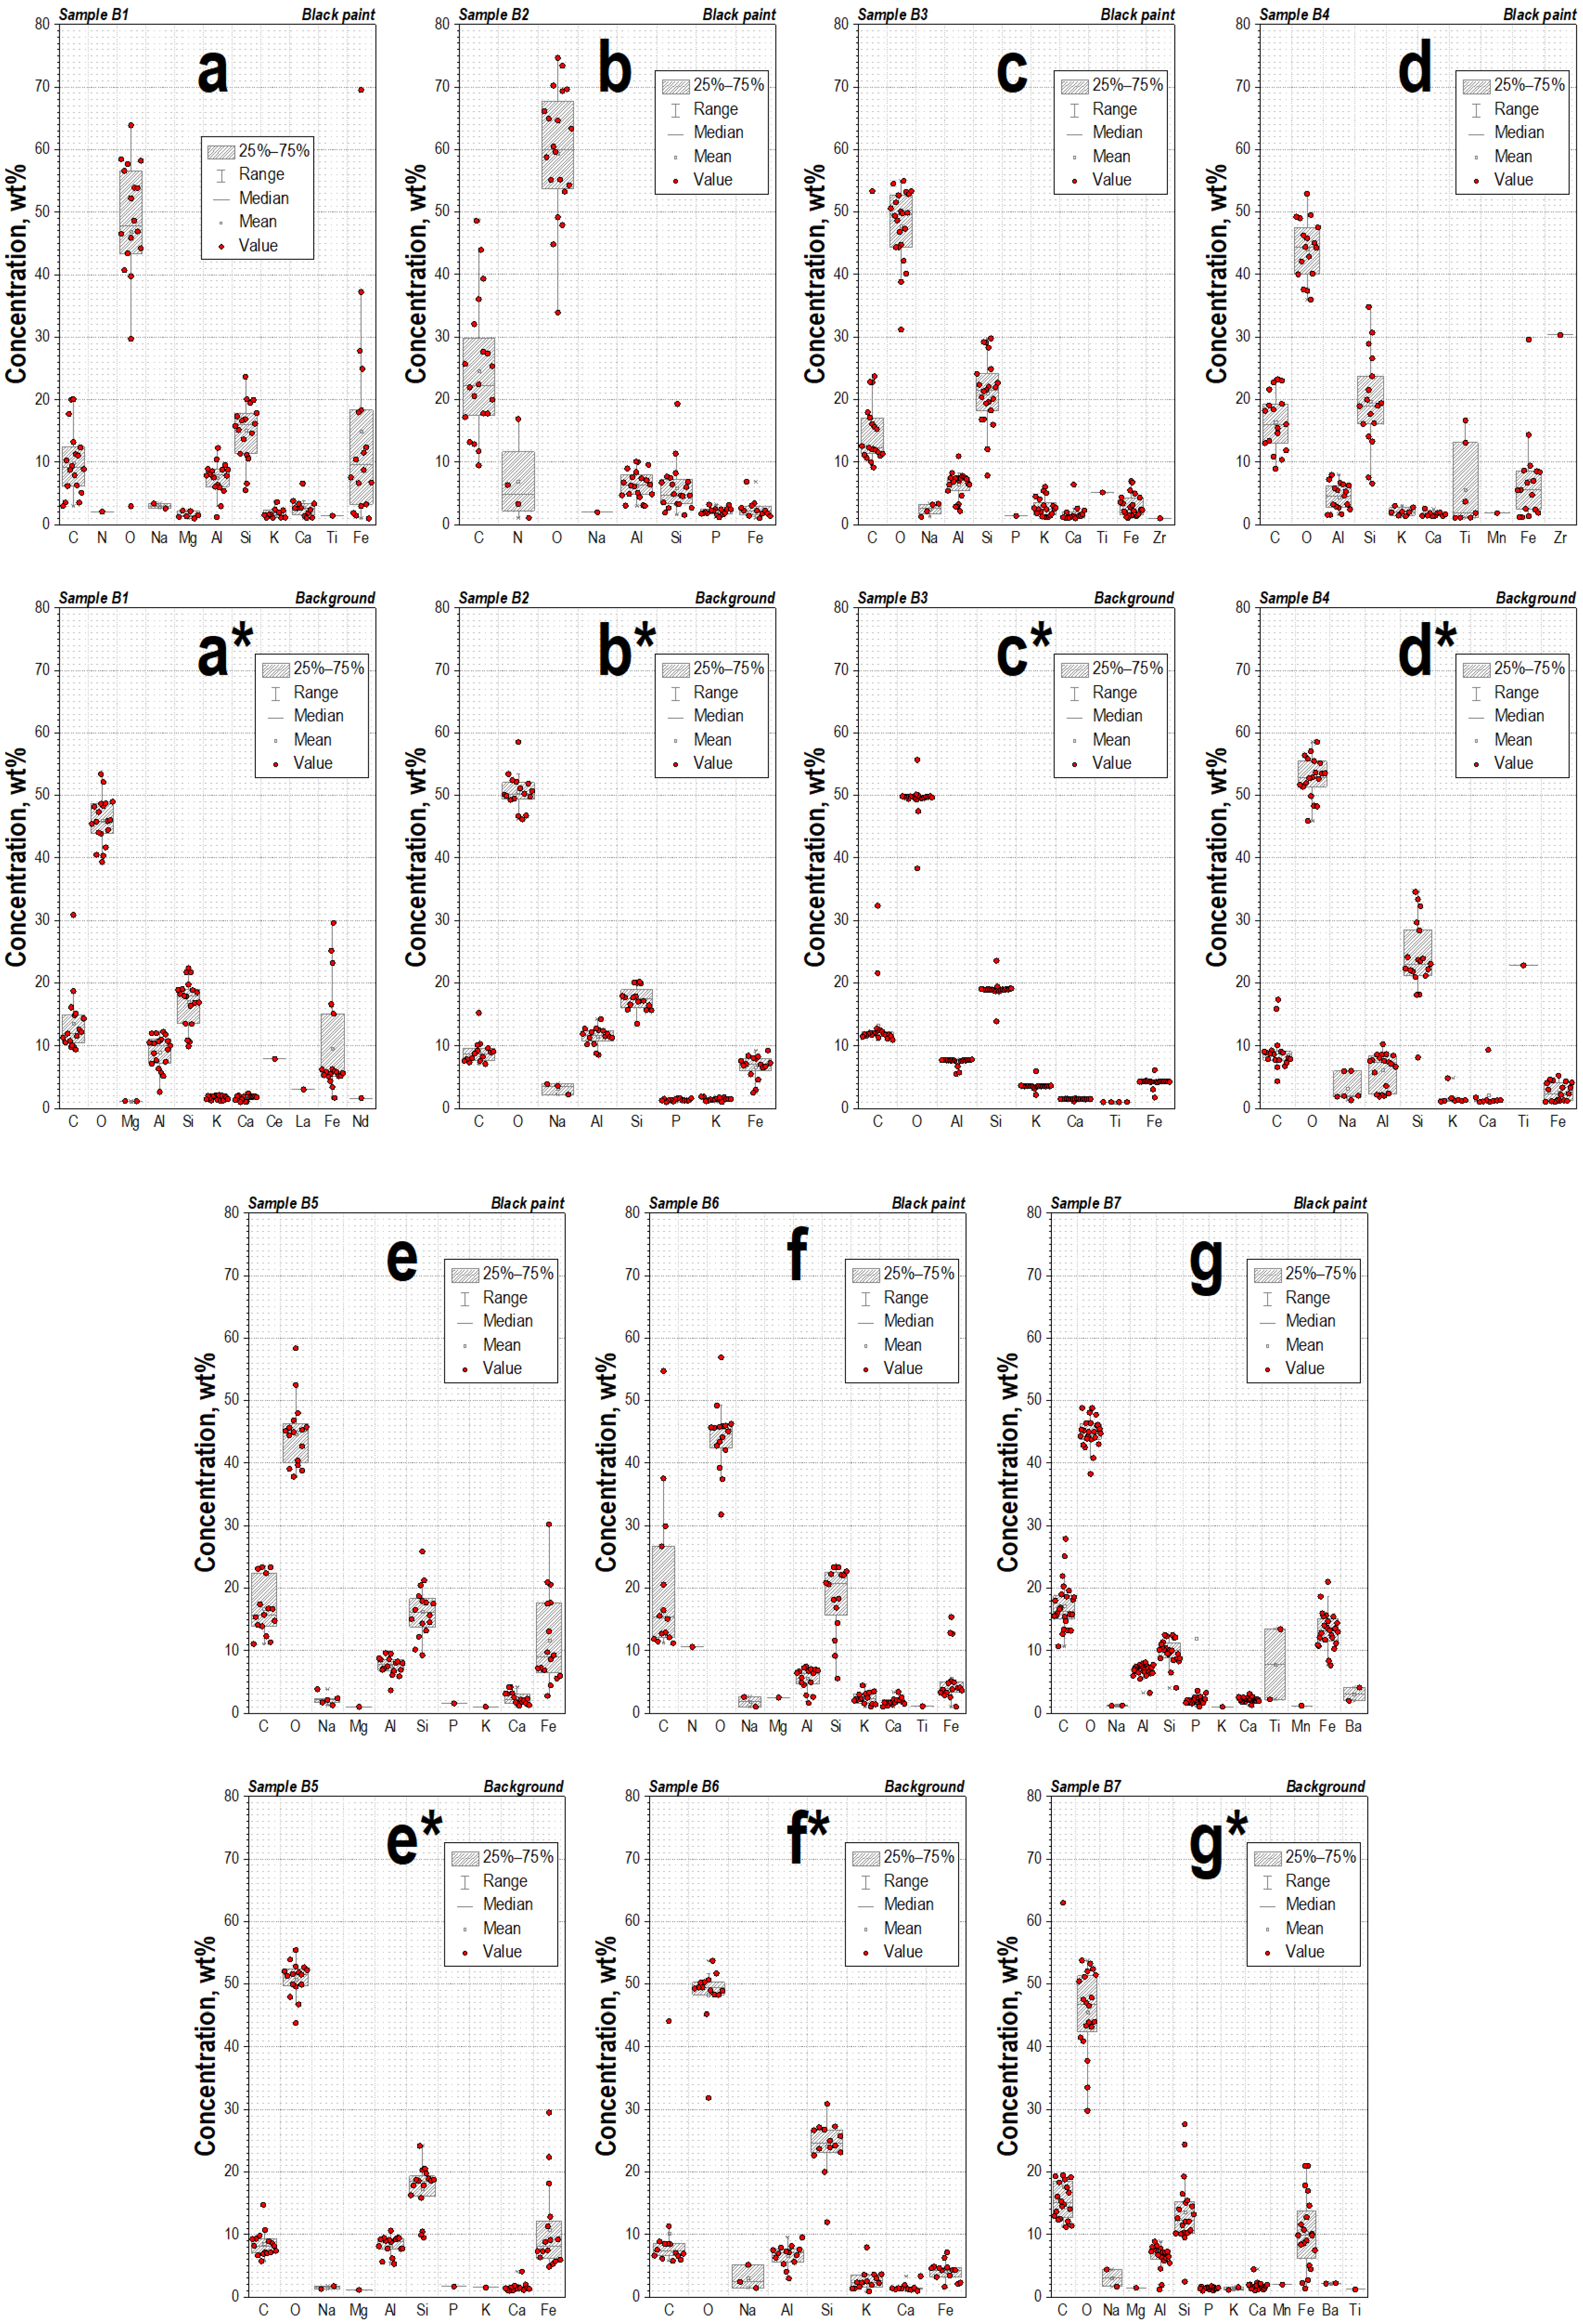
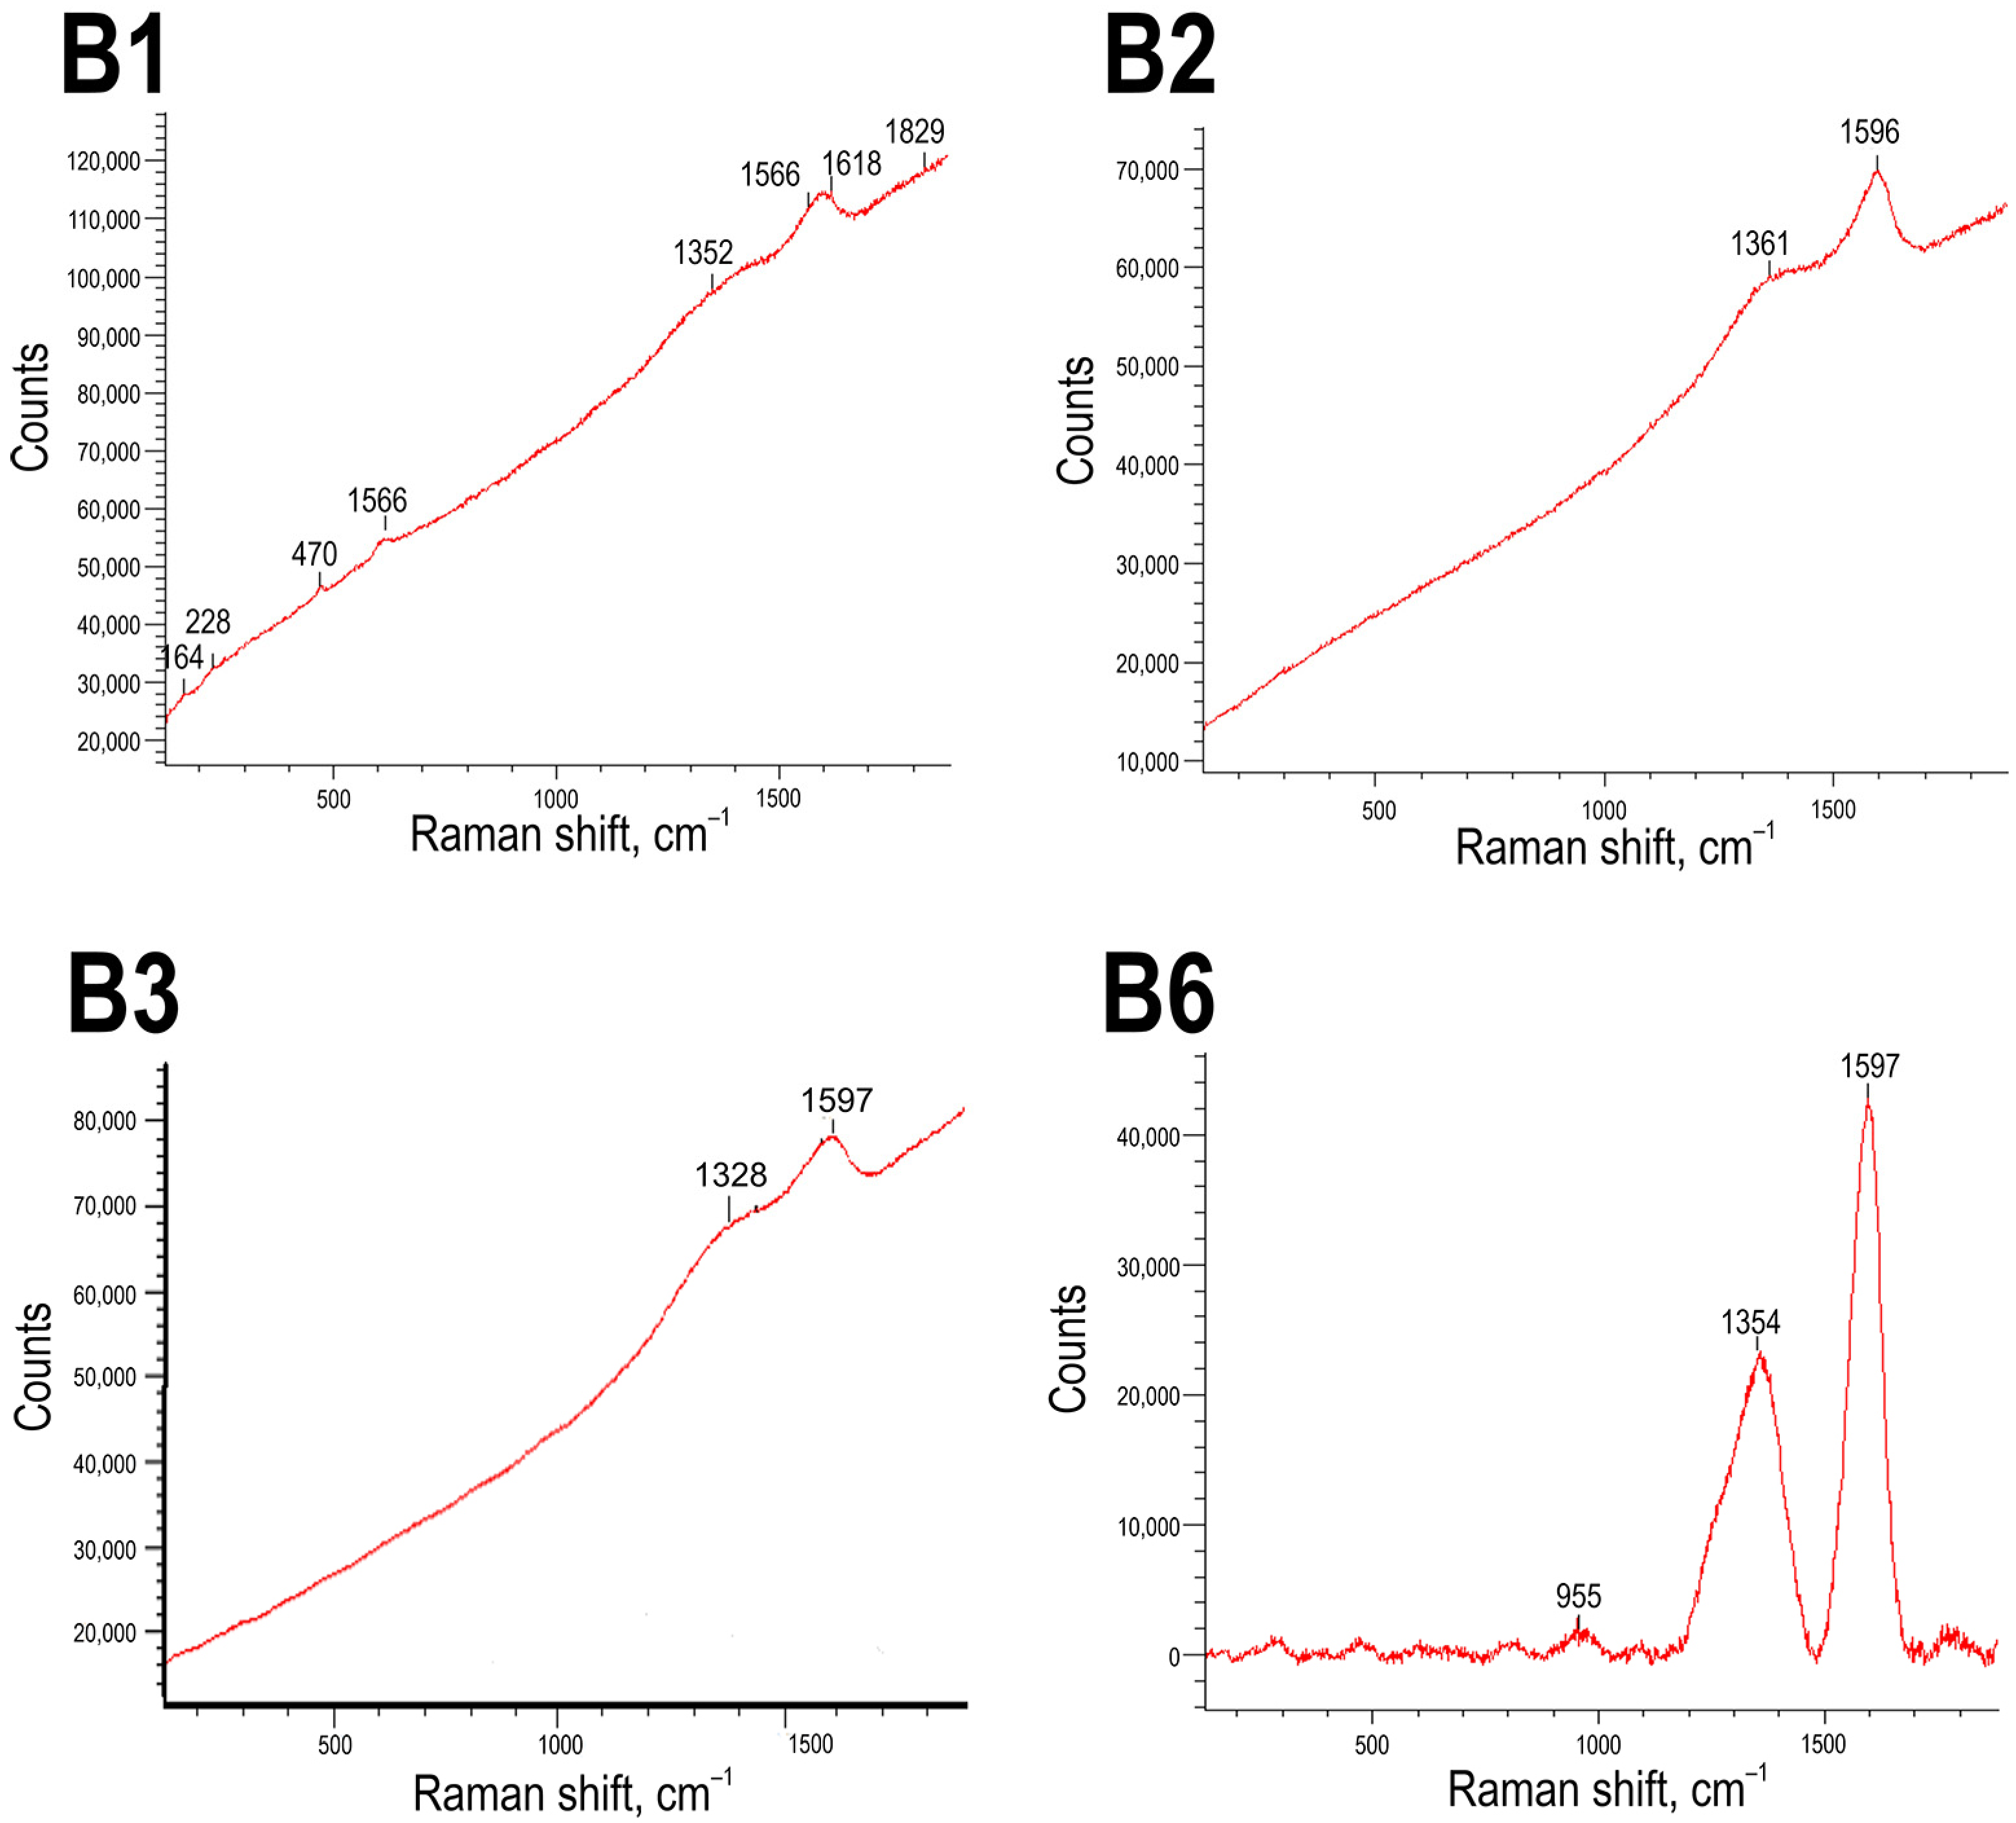
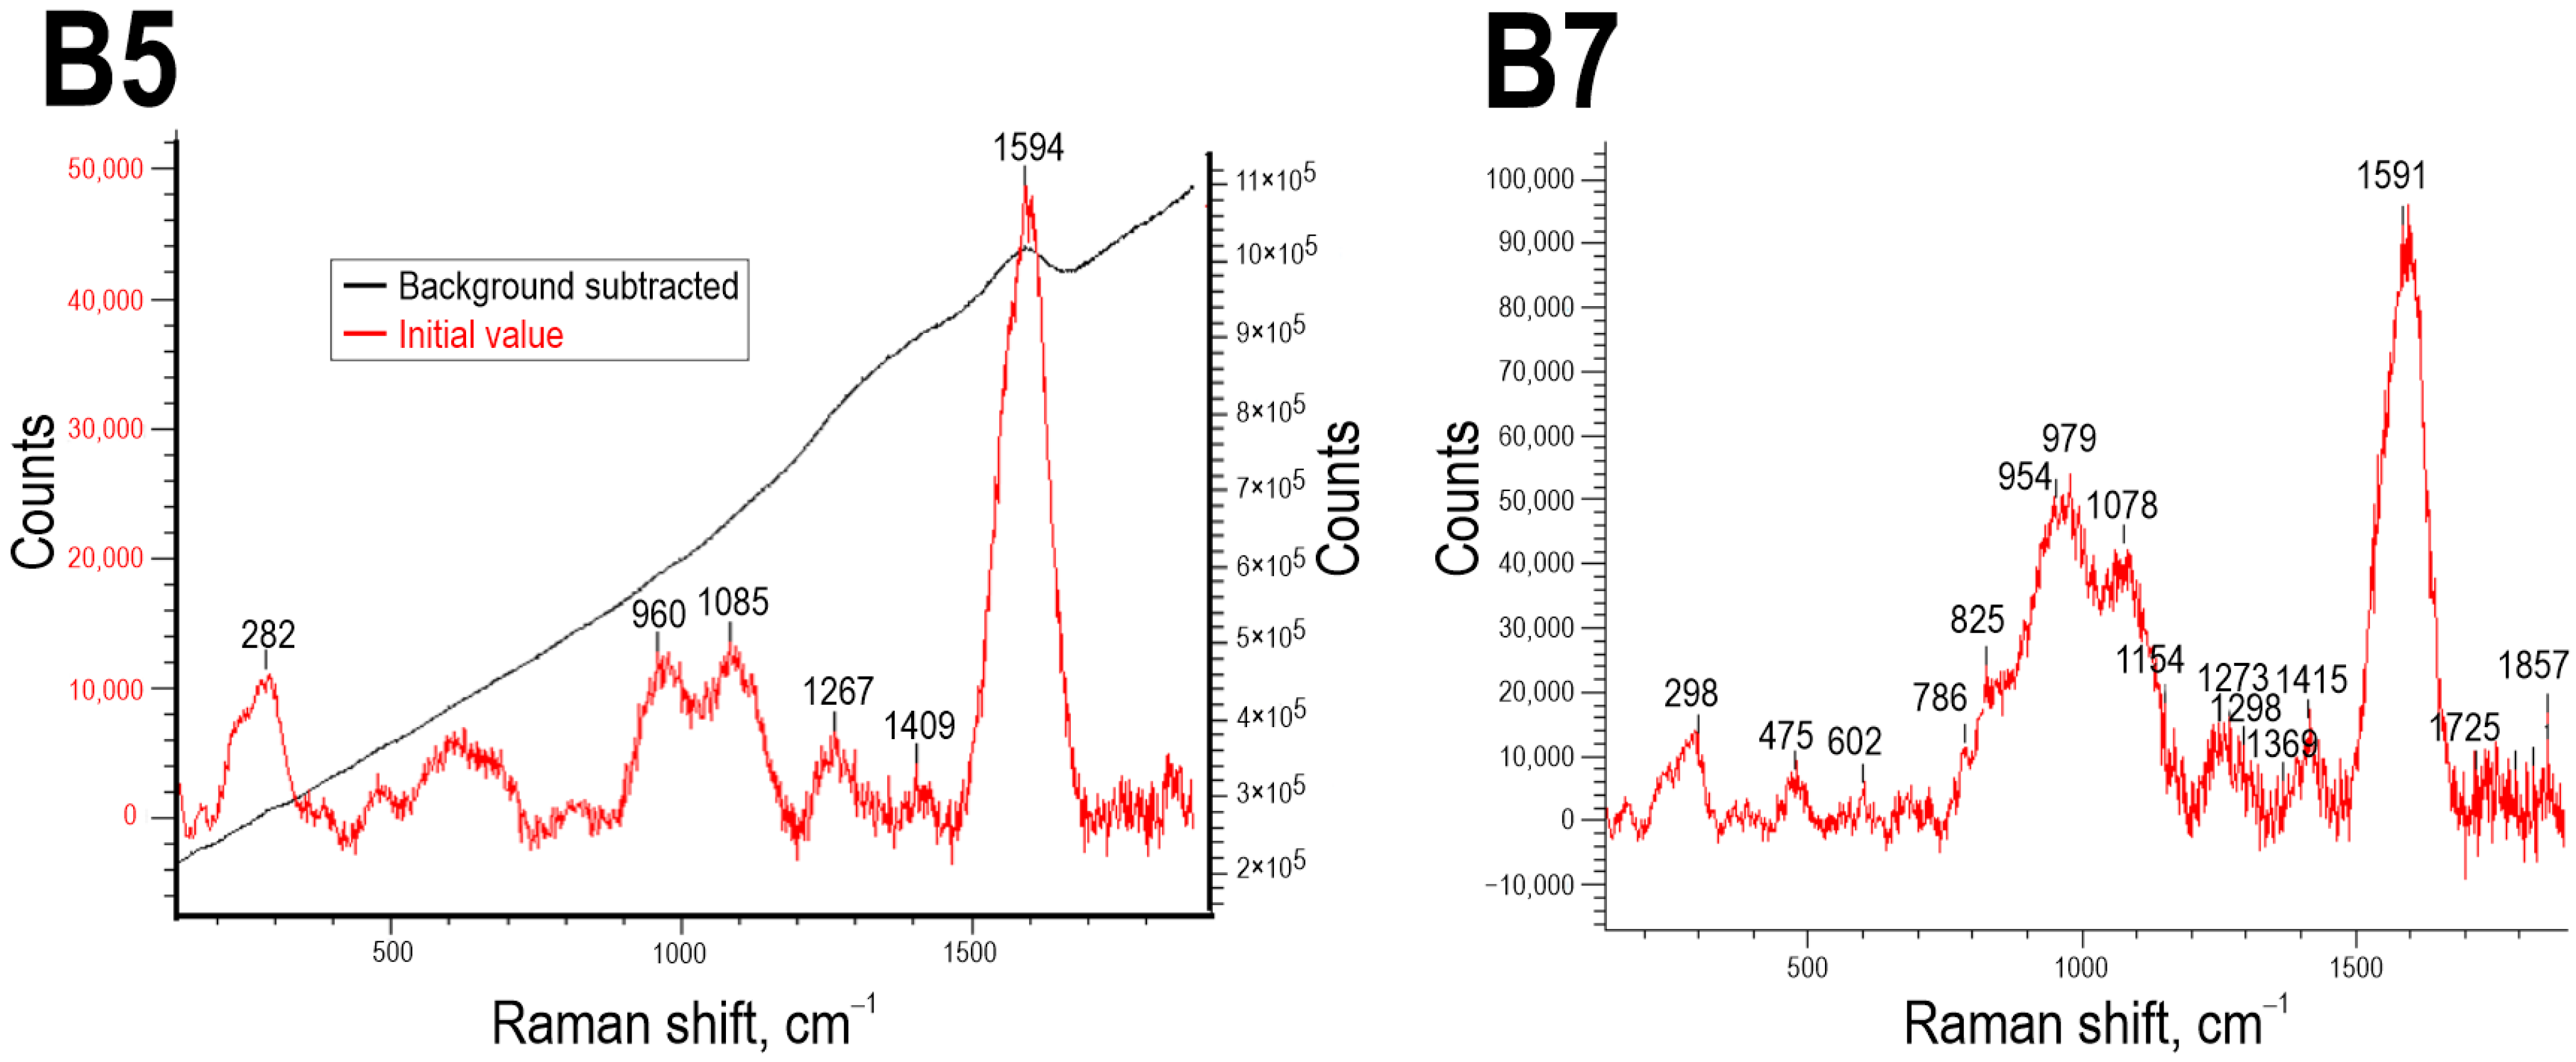
Experimental testing of samples O1 and O2 revealed their good coloring ability. They leave on the paper a stroke of saturated reddish hue (see Figure 6). The results of EDS examination indicate that the main elements of mineral composition are Fe, Si, and Al (Figure 11). The concentrations of iron are very high, up to almost 70.0% in certain spectra, with mean values of 31.15% in O1 and 24.11% in O2. The concentrations of Al are significantly low in comparison with the concentrations of Si. A characteristic trait is the presence of manganese (Mn) in the compositions of both samples. Based on these similarities, it may be hypothesized that both ochre pieces unearthed in two different places of Cherepakha-7 settlement’s area are from the same mineral origin. It is worth noting that Sample O2, which was unearthed in the ash-filled pit, is distinguished by increased concentrations of calcium (Ca) and phosphorous (P) in comparison with Sample O1. This may be the result of long and close contact between the ochre material and ashes/char remains that are rich in calcium and phosphorous [34].
A comparison of elemental compositions of ochre samples and red paint samples from the Cherepakha-7 site makes it possible to emphasize certain differences. Ochre sample compositions are characterized by the presence of Mn, as noted above, and the absence of Ti. In contrast, the red paint compositions of Samples R5 and R6 show the absence of Mn and the presence of Ti (Figure 9e,f and Figure 11). These data do not allow us to interpret unearthed ochres as possible raw material used for red paint on the examined samples.
Thus, it is important to note that ochre and red paint compositions differ greatly according to their Al: Si ratio (Figure 9e,f and Figure 11; Table 1). The proportion of Al is much higher in the paint composition. Based on the mean values, the Al: Si ratios are 0.13 and 0.20 for O1 and O2, respectively, and 1.04 and 0.43 for R5 and R6. This seemingly indicates a significant clay or plastic component in the red paint composition in comparison with the natural ochre content.
Some possibilities are suggested based on the obtained data. The Raman spectroscopy results for Sample R1 permit us to speculate that the iron content proposed is the coloring agent of red paint with hematite. The most probable source of red pigments, in particular, for pottery painting, are natural hematite-containing ochres and red clays [35,36].
Natural ochres are available and relatively common raw material in the research area. According to geological records of the 1970s in the research area (Primor’ye region), mostly in its southern part, about 40 locations of ochre pigments connected mainly with volcanic rocks are known, sometimes with clay deposits. The color of ochres varies from orange-red to dark-cherry hues. The average content of iron oxides in ochres varies from 8.0 to 25.0% [37] (p. 48). The largest deposit is located at the slopes of the dormant and disturbed Baranovskii volcano (Figure 1). Open deposits of ochre developed at basaltic rocks occupy a huge area at the right bank of Razdol’naya River, which surely must have attracted the attention of prehistoric people. The Baranovskii ochre deposit is located at a distance of 25 km north along the river from the seacoast settlement of Chapaevo, of the Yankovskaya culture, where, as referenced above, the stock of ochre pieces was unearthed. According to the research data, the chemical and mineralogical compositions of the ochre specimens from the Chapaevo site and the Baranovskii ochres have similar characteristics ([16] p. 127; [38] pp. 38,40). Supposedly, ochre pieces unearthed in the Chapaevo prehistoric settlement were mined at the Baranovskii ochre deposit. However, the case of the Cherepakha-7 site considered above shows that the coexistence of red-painted pottery and natural ochre material in the same archaeological context does not necessarily indicate their interconnection.
At present, it is not possible to identify certain ochres’ sources for red paints on examined ceramic samples. At least, based on EDS data for the red paint samples, compositions from different sources of ochre pigment may be supposed. As researchers note, the ochres, in general, vary greatly in their mineralogical and chemical compositions, and the identification of certain sources or deposits is quite difficult [35].
According to the research records, the iron oxide concentration, as such, is not the main factor influencing the coloring properties of the ochres and other earth pigments. A more important role is played by the mineral phase of the iron presence: hematite provides the red coloration of the substrate, unlike the goethite, which causes yellow spectra colors [35,36,39]. Our observations on iron contents in red paint compositions and in unpainted clayish slips of brownish-yellow hues on the examined samples seem to indirectly support this statement. As determined, iron concentrations in red paint and slip on the same sample in all cases do not show significant differences that are worthy of attention.
Judging from the obtained results, the red paint may be interpreted as an iron-containing clayish mass applied to the ware’s surface and treated before firing. Probably, in some cases, the red paint may be determined as red slip, taking into account the observations of Samples R1, R2, and R3, which show the application of red-colored mass directly on the ceramic body. The term “red slip” is used for the description of red-colored clayish coatings [13,40]. The thickness of the red-colored layer and quality of burnishing treatment varied significantly, influencing the external performance of red decoration on the ceramic ware’s surface. Obviously, the technological skills might have varied from potter to potter.
The case of Sample R5, noted above, is interesting because of its increased concentration of phosphorous in the paint composition. It may be interpreted, possibly, as the result of the presence of some organic substance of animal origin playing the role of paint binder. It is known from ethnographic records that, in traditional ceramic paint technologies, there are various organic matters, mostly of plant origin, that are used to serve as binders [23] (pp. 70–72). Notably, the native people of the Southern Russian Far East in the 19th to the beginning of the 20th centuries used fish eggs as the binder when preparing paints for decorating clothes, leather, and wooden objects [41] (pp. 231–232). Taking into account the significant role of sea resources in the Yankovskaya culture subsistence, it is obvious that a wide range of phosphate-rich marine organics was available. The assumption about the intentional addition of phosphorous-containing organic matter to red paint is only preliminary and needs to be verified based on more representative analytical data.

4.2. Black Paint

Visual observation with a magnifying glass of 10× shows that the black paint layer on Samples B1–5 and B7 is faded, blurred, and uneven in appearance—exposing an underlying slip coating in places. The borders of black-painted stripes and spots are poorly defined. Only Sample B6 is distinguished by the darkest hue of black color, relatively compact texture, and clearly defined borders of the black-painted stripe (see Figure 5). The relief of black-painted areas is at the same level as the relief of the background (Figure 12). These external features are very similar to the characteristics determined for carbon-based paints of plant origin [1,23] (pp. 169, 170, 385–387). It is important to note that striped and linear traces produced by burnishing overlap the black-painted areas and background surfaces (Figure 12). This is evidence that black paint patterns were treated by burnishing simultaneously on the surface. Researchers explain similar cases of burnishing traces on top of black-painted patterns on archaeological pottery as evidence of pre-firing paint application [12].
Optical microscopy provides more information on textural features of black-painted areas on the samples’ surfaces. In some cases, evidence of a relief pattern not visible with a magnifying glass of 10× may be recognized. One type is a wave-lined relief that looks very similar to the traces of brushing (Figure 13a). Another kind is a streak-like relief on the background surface (Figure 13d). It seems to be possible to interpret these images as evidence that paint was applied in a semi-fluid paste-like consistency. Sample B6’s black layer is not as dense as it seems with the naked eye—the underlying background emerges through the paint (Figure 13b). However, the borderline of the black pattern appears well defined on the background surface (Figure 13c).
The SEM examination of the black-painted areas on samples’ surfaces allows us to make some observations on the microtextural level. In most cases, a well-pronounced crackling pattern is visible, indicating a paint layer of a certain thickness lying on top of the background surface (Figure 14).
As was noted in Section 3.2, the EDS measurements for Samples B1–B7 were provided on painted areas and unpainted surfaces (background) to compare the elemental compositions of both and determine probable specific traits of the black paint composition [8,15]. Taking into account that black paints or black pigments are divided, generally, into carbon-based and mineral-based chemical elements as supposed indicators of black coloring agents, or chromatophores, is a subject of primary interest. They are carbon (C), iron (Fe), and manganese (Mn) [1,2,4,11,12,13]. Concerning the carbon as the indicator of organic chromatophore, researchers emphasize that the adequate interpretation of EDS data on carbon concentration in black paint on archaeological ceramics is problematic because of the various origins of contamination on samples’ surfaces [2]. The iron and manganese are considered main mineral black chromatophores, particularly for ceramics painting. There are studies showing the effectiveness of the SEM-EDS method for indicating Fe and Mn concentrations in the black-paint composition [8,13,14].
The EDS data for Samples B1–B7 are presented in box-and-whiskers diagrams (Figure 15). Summarizing ideas are as follows.
At first, one can state the absence of Mn in the black-paint elemental composition. Only in Samples B4 and B7 do single spectra show Mn in a concentration of more than 1.0%. This is certainly not a reason to consider this element as a probable coloring agent. Then, the concentrations of iron in the elemental compositions of black-painted areas and an unpainted background surface show no notable evidence of any significant increase of iron content in the paint composition.
The data on carbon concentration in black paint areas are of some interest. Samples B2 (Figure 9b,b*) and B5 (Figure 9e,e*) show considerably increased carbon content in black paint areas in contrast with background composition. A similar tendency toward increasing carbon in the paint area is seen in Samples B4 (Figure 9d,d*) and B6 (Figure 9f,f*).
It may be noted that Samples B1, B2, and B6 are characterized by the presence of nitrogen (N) in paint composition from 2.10% to 16.88%, supposedly indicating any component of organic origin (Figure 9a,b,f).
A Raman spectroscopy examination was carried out for black-painted areas of Samples B1–B3 and B5–B7. Based on the obtained results, two groups of samples can be preliminarily distinguished. The spectra of Samples B1, B2, B3, and B6 clearly indicate the presence of black carbon (soot and lampblack) based on the positions of the D and G bands [42]. The D band centered at 1328–1370 cm−1 and the G band at 1594–1597 cm−1 are characteristic for black carbon and can be observed when focusing on some surface points, despite the significant background fluorescence (Figure 16). Note that, in Sample B6, which shows strong carbon peaks at 1354 cm−1 and 1597 cm−1, a weak shift is registered at 955 cm−1. This feature seems to be associated with the Raman band of apatite phosphates formed in bone tissue [43]. A similar case of the weak organic apatite peak together with strong carbon bands is noted by the researchers [44]. Sample B1 shows weak peaks at 226, 407 and 615 cm−1 that are very similar to the features of hematite [33]. Obviously, in this case, Raman signals of hematite were received from the red-painted background under the black pattern (see Figure 5).
Samples B5 and B7, comprising another group, are distinctive because of the presence of a broad P–O-stretching band at around 960 cm−1 (Figure 17). This is characteristic of organic apatite, or phosphate originating from bone material [45]. The carbon band is registered for Sample R5 at 1591 cm−1 and for Sample R7 at 1599 cm−1. The calcium carbonate peaks are registered at 1085 cm−1 in Sample B5’s spectrum and at 1078 in B7’s spectrum. The peaks at 298 cm−1 and 602 cm−1 in Sample B5 and at 240 cm−1, 291 cm−1, and 600 cm−1 in Sample B7 are associated with the hematite. An interesting feature is the peaks at 475 cm−1 in Sample B5 and at 476 cm−1 in Sample B7. These data are very close to the peak at 480 cm−1 diagnostics for the goethite iron-containing mineral [30]. As in the case of Sample B1, Raman signs of the hematite and goethite presence were observed from a red-painted background.
As a whole, the Raman spectroscopy examination indicates the carbon content of black paint. The result is, to some degree, consistent with the EDS data on black-paint elemental composition. This concerns, first, the absence of EDS evidence on manganese and iron as probable coloring agents. The cases of significant excess of C content in the paint composition over the C content in the background cannot be explained by a factor of contamination, and the cases of nitrogen presence in the black-paint composition, with a high probability, point to an organic component in the black paint. The Raman data indicate that it is possible to distinguish different carbon materials used as coloring agents. In Samples B1–B3, this is black carbon, probably of plant origin. Samples B5 and B7 show Raman spectra patterns corresponding to organic apatite that allows us to suppose the usage of carbon material from burnt or charred bone. The specific trait of Sample B6 is probably a combination of black carbon and burnt bone materials.
The obtained results concur with published materials on the identification of carbon-based pigments on archaeological ceramics, using Raman spectroscopy. Black carbon, based on the positions of the D and G bands, is recognized as a relatively common coloring material known from the past to present times [2,6,7,9]. In some cases, researchers suggest a plant origin of black-carbon pigment based on the fact that there is a lack of a Raman band at 960 cm−1 to indicate charred bone material [2,32].
As a whole, black paints used for the decoration of Yankovskaya culture pottery fall into the category of carbon-based or organic-based paints defined separately of mineral-based black paints containing the iron or/and manganese as main coloring agents [1,2,13,23] (pp. 31–43). Note that ethnographical records from various regions of the Russian Far East give the evidence of the use of carbon-based black paints to decorate leather, wood, and cloth materials. At the end of the XIX century to the first half of the XX century, native people of Northern Primor’ye and the lower Amur River territories prepared black paint from soot mixed with fresh or dried fish eggs, or from bird cherry berries [41] (p. 232). The Eskimo people of Chukotka used the soot removed from their ceramic lamp’s inner surface as black paint. The soot was a mixture of carbonized seal grease and tundra moss, which served for the making of candlewick [46].
The faded look and bad preservation of carbon-based paint on examined samples and on most of the Yankovskaya culture’s pottery with black patterns seem to be explained by firing conditions. As noted above, the observations of surface treatment traces on examined samples indicate the pre-firing application of black-painted patterns. The appearance of pre-firing black paints, both carbon-based and mineral-based, on a pottery surface is determined significantly by the firing’s atmospheric regime [7,11,12,23] (pp. 33–36). Firing in a reducing atmosphere, at low temperatures, is required for the achievement of a saturated and stable black color. In contrast, oxidizing firing initiates the burning of carbon, although not complete, and a decrease in the black color’s intensity. Light colors on the surface background of black-painted pottery of the Yankovskaya culture was usually affected by an oxidizing atmosphere during firing, at least in its final stage. Sample B6 represents a very rare case of a relatively well-preserved black pattern showing evidence of a reducing firing atmosphere (see Figure 5). However, this was not common practice in prehistoric pottery-making, given the cultural context.
It is interesting to note that there is some correspondence between the spatial reference of examined samples and the distinguished variants of the carbon-based paints. Samples B1, B2, and B3, showing black carbon as a colorant, come from the Stark site. Samples B5, B6, and B7, showing the presence of burnt bone material, come from the sites of Cherepakha-7, Solontsovaya-2, and Solnechny Bereg, located not far from one another and in a direction northeast of the Stark site (see Figure 1). This situation probably reflects local technological differences of black-paint preparation by the bearers of the Yankovskaya cultural tradition.

5. Conclusions

The main results of this research are the data obtained for the first time on the technology of pottery painting that was practiced by the prehistoric population of the Southern Russian Far East in the northwestern part of the basin of the Sea of Japan. It was revealed that, during the Paleometal period, 1st mil. BCE, mineral and organic materials were used for paint preparation. For the composition of red-paint, natural ochre is assumed to be the main pigment. For black paint, two kinds of organic carbon-containing colorants are identified preliminarily—carbon black, presumably of plant origin, and burnt or charred bone. Painting technologies based on these mineral and organic pigments and colorants were developed in prehistory, in various world regions.
This study shows the effectiveness of an archaeometric approach to the examination of painted pottery in archaeological contexts. The applied methods allowed recognition of some technological features of paints—from textural pattern to chemical and mineralogical composition. The perspectives of further investigations may be outlined with a view to increase the samples base and provide new experimental data. Concerning the red paint, it seems to be interesting to undertake the identification of local sources of pigments—ochres or, probably, red clays—used for the painting of the pottery discovered at specific archaeological sites. Such a study might contribute to our knowledge of raw material resources exploited by prehistoric inhabitants in the research area. Then, special attention may be paid to the study of phosphorous content in red paint elemental composition as a probable indicator of animal organic component. Further studies of black-painted pottery might be focused on the obtainment of new data to confirm the determination of carbon-based colorants associated with different kinds of organic materials that are probably of plant and animal origin.

Author Contributions

Conceptualization, I.S.Z.; methodology, I.S.Z.; investigation, I.S.Z., I.Y.B., A.A.K., A.N.F. and A.A.L.; writing—original draft preparation, I.S.Z.; visualization, I.Y.B. and A.A.L.; project administration, I.S.Z. All authors have read and agreed to the published version of the manuscript.

Funding

The research was financially supported by the Russian Science Foundation (project No. 20-18-00081).

Informed Consent Statement

Not applicable.

Data Availability Statement

Not applicable.

Acknowledgments

Optical microscopy of samples carried out on the equipment of the Engineering-Technological Center (Institute of Chemistry FEB RAS, Vladivostok, Russia). The SEM-EDS examination of Samples R1–R4 and B1–B7 and Raman examination of Samples R1, B1–B3, B5–B7 were executed in the Electron Microscopy Centre (A.V. Zhirmunsky National Scientific Center of Marine Biology, FEB RAS, Vladivostok, Russia). The authors thank the Head of the Electron Microscopy Centre, Denis V. Fomin, for the technical assistance and support. SEM-EMS studies of Samples R5, R6, O1, and O2 from site Cherepakha-7 were made using the equipment of the Far Eastern Federal University. The authors are grateful to Alexander N. Popov, Evgeny Yu. Nikitin (Far Eastern Federal University), and Nadezhda G. Artemieva (Institute of History, Archaeology and Ethnology of Peoples of the Far East) for their kind permission to examine the archaeological objects from the Cherepakha-7, Solontsovaya-2, and Solnechny Bereg sites. The authors are very grateful to Richard Bland (Oregon University, USE) for his kind assistance in English language improving.

Conflicts of Interest

The authors declare no conflict of interest.

References

  1. Stewart, J.D.; Adams, K.R. Evaluating visual criteria for identifying carbon- and iron-based paints from the Four Corner region using SEM-EDS. Am. Antiq. 1999, 64, 675–696. [Google Scholar] [CrossRef]
  2. Van der Weerd, J.; Smith, G.D.; Firth, S.; Clark, R.J.H. Identification of black pigments on prehistoric Southwest American potsherds by infrared and Raman microscopy. J. Archaeol. Sci. 2004, 31, 1429–1437. [Google Scholar] [CrossRef]
  3. Pérez, J.M.; Esteve-Tébar, R. Pigment identification in Greek pottery by Raman microspectroscopy. Archaeometry 2004, 46, 607–614. [Google Scholar] [CrossRef]
  4. Tsirtsoni, Z.; Malamidou, D.; Kilikoglou, V.; Karatasios, I.; Lespez, L. Black-on-red painted pottery production and distribution in Late Neolithic Macedonia. In Archaeometric and Archaeological Approaches to Ceramics; BAR International Series 1691; Waksman, S.Y., Ed.; BAR Publishing: London, UK, 2007; pp. 57–62. [Google Scholar]
  5. Bugoi, R.; Constantinescu, B.; Pantos, E.; Popovicí, D. Investigation of Neolithic ceramic pigments using synchrotron radiation X-ray diffraction. Powder Diffr. 2008, 23, 195–199. [Google Scholar] [CrossRef]
  6. Buzgar, N.; Bodi, G.; Aştefanei, D.; Buzatu, A. The Raman study of white, red and black pigments used in Cucuteni Neolithic painted ceramics. An. Ştintifice Ale Univ. Al. Cuza IAŞI Geol. 2010, 56, 5–14. [Google Scholar]
  7. Iordanidis, A.; Garcia-Guinea, J. A preliminary investigation of black, brown and red coloured potsherds from ancient Upper Macedonia, Northern Greece. Mediterranean Archaeol. Archaeom. 2011, 11, 85–97. [Google Scholar]
  8. Pendleton, M.W.; Washburn, D.K.; Ellis, E.A.; Pendleton, B.B. Distinguishing between Mineral Paint and Carbon Paint on Ancestral Puebloan Pottery. Microsc. Today 2012, 20, 32–36. [Google Scholar] [CrossRef]
  9. Liu, Z.; Han, Y.; Han, L.; Cheng, Y.; Ma, Y.; Fang, L. Micro-Raman analysis of the pigments on painted pottery figurines from two tombs of the Northern Wei Dynasty in Luoyang. Spectrochima Acta Part A Mol. Boimolecular Spectrosc. 2013, 109, 42–46. [Google Scholar] [CrossRef]
  10. Jadot, E.; Schiavon, N.; Manso, M. The ceramics of Malpaís of Zacupu, Michoacán, Mexico, during the Early and Middle Postclassic periods (900-1450 AD): Micro-chemical characterization of surface painting. Specrochimica Acta Part B At. Spectrosc. 2016, 119, 10–16. [Google Scholar] [CrossRef]
  11. Rosado, L.; Van Pevenage, J.; Vandenabeele, P.; Candeias, A.; Lopes, M.D.C.; Tavares, D.; Alfenim, R.; Schiavon, N.; Mirão, J. Multi-analytical study of ceramic pigments application in the study of Iron Age decorated pottery from SW Iberia. Measurement 2018, 118, 262–274. [Google Scholar] [CrossRef]
  12. Puente, V.; Porto López, J.M.; Desimone, P.M.; Botta, P.M. The persistence of the black colour in magnetite-based pigments in prehistoric ceramics of the Argentine north-west. Archaeometry 2019, 61, 1066–1080. [Google Scholar] [CrossRef]
  13. Spataro, M.; Cubas, M.; Craig, O.E.; Chapman, J.C.; Boronent, A.; Bonsall, C. Production and function of Neolithic black-painted pottery from Schela Cladovei (Iron Gates, Romania). Archaeol. Anthropol. Sci. 2019, 11, 6287–6304. [Google Scholar] [CrossRef]
  14. Oliveira, L.S.S.; Abreu, C.M.; Ferreira, F.C.L.; Lopes, R.C.A.; Almeida, F.O.; Tamanaha, E.K.; Belletti, J.S.; Machado, R.; Rizzutto, M.A.; Souza, D.N. Archeometric study of pottery shards from Conjunto Vilas and Sāo Joāo, Amazon. Radiat. Phys. Chem. 2020, 167, 108303. [Google Scholar] [CrossRef]
  15. Li, Y.; Wu, S.; Yang, J. Multi-analytical investigation of decorative coatings on Neolithic Yangshao pottery from Ningxia, China (4000–3000 BCE). J. Eur. Ceram. Soc. 2021, 41, 6744–6755. [Google Scholar] [CrossRef]
  16. Andreeva, Z.V.; Zhushchikhovskaya, I.S.; Kononenko, N.A. Yankovskaya Culture; Len`kov, V.D., Ed.; Nauka Publishing: Moscow, Russia, 1986. (In Russian) [Google Scholar]
  17. Popov, A.N.; Zhushchikhovskaya, I.S.; Nikitin, Y.G. Paleometal Epoch in the Primorye (south of the Far East of Russia). World Archaeol. 2019, 51, 382–407. [Google Scholar] [CrossRef]
  18. Zhushchikhovskaya, I. Ceramics-Firing Kilns of the Southern Russian Far East: Technological and Temporal Dynamics. In Kilns in East and North Asia: The Adoption of Ceramic Industries; BAR International Series 3082; Nagatomo, T., Shinoto, M., Nakamura, D., Eds.; BAR Publishing: Oxford, UK, 2022; Volume 7, pp. 133–150. [Google Scholar]
  19. Zhushchikhovskaya, I. A non-ordinary goods complex of the paleometal period in the southern Russian Far East. Archaeol. Res. Asia 2018, 16, 34–45. [Google Scholar] [CrossRef]
  20. Obata, H.; Vostretsov, Y.E.; Miyamoto, K.; Shiba, R.; Furusawa, Y.; Kamikawa, M.; Kim, E. Archaeological collections in the Posiet Bay; Shimoda Print Joint Stock Company Publishing: Kumamoto, Japan, 2007. [Google Scholar]
  21. Gulbina, A.A.; Zhushchikhovskaya, I.S. The Museum “The Sea Nature and Its Protection”. Bull. Far East. Branch Russ. Acad. Sci. 2003, 4, 175–179. (In Russian) [Google Scholar]
  22. Zhushchikhovskaya, I.S.; Artemieva, N.G.; Korovnik, M.; Nikitin, Y.G. Ceramics assemblages of sites of Yankovskaya culture at eastern seacoast of Ussuriisky Bay. In Russias Far East and Ecuador: Finds and Problems. Pacific Archaeology Series; Brodyanskiy, D.L., Ed.; FEFU Publishing: Vladivostok, Russia, 2013; Volume 27, pp. 81–116. (In Russian) [Google Scholar]
  23. Shepard, A.O. Ceramics for the Archaeologist; Carnegie Institution Publishing: Washington, DC, USA, 1985. [Google Scholar]
  24. Ortega, M.; Ascencio, J.A.; Reza, C.; Fernández, M.E.; López, L.; José-Yacamán, M. Analysis of prehistoric pigments from ‘Templo Mayor’ of Mexico City. J. Mater. Sci. 2001, 36, 751–756. [Google Scholar] [CrossRef]
  25. Pomiés, M.-P.; Menu, M.; Vignaud, C. Red Palaeolithic pigments: Natural hematite or heated goethite? Archaeometry 1999, 41, 275–285. [Google Scholar] [CrossRef]
  26. Goldman, A.R.; Asenath-Smith, E.; Estroff, L.A. Mosaic anisotropy model for magnetic interactions in mesostructured crystals. APL Mater. 2017, 5, 104901. [Google Scholar] [CrossRef]
  27. Hall, M.; Amraatuvshin, C.; Erdenbat, E. X-ray fluorescence analysis of pottery from Northern Mongolia. J. Radioanal. Nucl. Chem. 1999, 240, 763–773. [Google Scholar] [CrossRef]
  28. Rosso, D.E.; Pitarch Martí, A.; d’Errico, F. Middle Stone Age Ochre Processing and Behavioural Complexity in the Horn of Africa: Evidence from Porc-Epic Cave, Dire Dawa, Ethiopia. PLoS ONE 2016, 11, e0164793. [Google Scholar] [CrossRef] [PubMed]
  29. Holliday, V.T.; Gartner, W.G. Methods of soil P analysis in archaeology. J. Archaeol. Sci. 2007, 34, 301–333. [Google Scholar] [CrossRef]
  30. Hanesch, M. Raman spectroscopy of iron oxides and (oxy)hydroxides at low laser power and possible applications in environmental magnetic studies. Geophys. J. Int. 2009, 177, 941–948. [Google Scholar] [CrossRef]
  31. Needham, A.; Croft, S.; Kröger, R.; Robson, H.K.; Rowley, C.C.A.; Taylor, B.; Gray Jones, A.; Conneller, C. The application of micro-Raman for the analysis of ochre artefacts from Mesolithic palaeo-lake Flixton. J. Archaeol. Sci. Rep. 2018, 17, 650–656. [Google Scholar] [CrossRef]
  32. Goodall, R.A.; Hall, J.; Viel, R.; Fredericks, P.M. A Spectroscopic Investigation of Pigment and Ceramic Samples from Copán, Honduras. Archaeometry 2009, 51, 95–109. [Google Scholar] [CrossRef]
  33. Hernanz, A.; Bratu, I.; Marutoiu, O.F.; Marutoiu, C.; Gavira-Vallejo, J.M.; Edwards, H.G.M. Micro-Raman spectroscopic investigation of external wall paintings from St. Dumitru’s Church, Suceava, Romania. Anal. Bioanal. Chem. 2008, 392, 263–268. [Google Scholar] [CrossRef]
  34. Braadbaart, F.; Poole, I.; Huisman, H.D.J.; Van Os, B. Fuel, Fire and Heat: An experimental approach to highlight the potential of studying ash and char remains from archaeological contexts. J. Archaeol. Sci. 2012, 39, 836–847. [Google Scholar] [CrossRef]
  35. Hradil, D.; Grygar, T.; Hradilová, J.; Bezdička, P. Clay and iron oxide pigments in the history of painting. Appl. Clay Sci. 2003, 22, 223–236. [Google Scholar] [CrossRef]
  36. Gil, M.; Carvalho, M.L.; Seruya, A.; Candeias, A.E.; Mirāo, J.; Queralt, I. Yellow and red ochre pigments from southern Portugal: Elemental composition and characterization by WDXRF and XRD. Nucl. Instrum. Methods Phys. Res. Sect. A Accel. Spectrometers Detect. Assoc. Equip. 2007, 580, 728–731. [Google Scholar] [CrossRef]
  37. Sidorenko, A.V. (Ed.) Geology of USSR; Nedra Publishing: Moscow, Russia, 1974. (In Russian) [Google Scholar]
  38. Zhushchikhovskaya, I.S. Prehistoric Pottery-Making of the Russian Far East; BAR International Series 1434; Bland, R.L., Aikens, C.M., Eds.; Archaeopress: Oxford, UK, 2005. [Google Scholar] [CrossRef]
  39. Siddall, R. Mineral Pigments in Archaeology: Their Analysis and the Range of Available Materials. Minerals 2018, 8, 201. [Google Scholar] [CrossRef]
  40. Li, T.; Li, G.; Li, Z.; Wu, T.; Tian, H.; Shan, S.; Wang, L. Surface treatment of red painted and slipped wares in the middle Yangtze River valley of Late Neolithic China: Multi-analytical case analysis. Herit. Sci. 2022, 10, 188. [Google Scholar] [CrossRef]
  41. Turaev, V.A. (Ed.) History and Culture of the Nanai People; Nauka Publishing: Saint-Petersburg, Russia, 2003; ISBN 5-02-027073-3. (In Russian) [Google Scholar]
  42. Bokobza, L.; Bruneel, J.-L.; Couzi, M. Raman Spectra of Carbon-Based Materials (from Graphite to Carbon Black) and of Some Silicone Composites. J. Carbon Res. 2015, 1, 77–94. [Google Scholar] [CrossRef]
  43. Tarnowski, C.P.; Ignelzi, M.A., Jr.; Morris, M.D. Mineralization of Developing Mouse Calvaria as Revealed by Raman Microspectroscopy. J. Bone Miner. Res. 2002, 17, 1118–1126. [Google Scholar] [CrossRef] [PubMed]
  44. Tomasini, E.P.; Halac, E.B.; Reinoso, M.; Di Lisciab, E.J.; Maiera, M.S. Micro-Raman spectroscopy of carbon-based black pigments. J. Raman Spectrosc. 2012, 43, 1671–1675. [Google Scholar] [CrossRef]
  45. Burgio, L.; Clark, R.J.H. Library of FT-Raman spectra of pigments, minerals, pigment media and varnishes, and supplement to existing library of Raman spectra of pigments with visible excitation. Spectrochima Acta Part A Mol. Biomol. Spectrosc. 2001, 57, 1491–1521. [Google Scholar] [CrossRef] [PubMed]
  46. Menovshchikov, G.A. Eskimo Tales and Legends; Nauka Publishing: Moscow, Russia, 1988. (In Russian) [Google Scholar]
Figure 1. The research area with Yankovskaya archaeological culture occupied zone (hatched). Sites referenced in article: 1—Shelekh Cape; 2—Stark; 3—Chapaevo; 4—Cherepakha-7; 5—Solnechny Bereg; 6—Solontsovaya-2; 7—Baranovskii ochre deposit.
Ceramics 06 00064 g001
Figure 2. Red-painted pottery of the Yankovskaya archaeological culture: (a) bowl, (bd) fragments of necked pots, and (e) fragment of dish.
Ceramics 06 00064 g002
Figure 3. Drawing images of black-painted patterns on the pottery of the Yankovskaya archaeological culture. (a)—fragment of bowl: black-painted strips and spots are combining with horizontal incised lines (above) and applique strip (beneath); (b)—wall fragment: black-painted strips; (c)—wall fragment: black-painted spots combining with incised geometric pattern; (d)—fragment of dish: black-painted strips; (e,f)—walls fragments: zigzag-like black-painted patterns.
Ceramics 06 00064 g003
Figure 4. Examined samples of red-painted pottery. Sites of sample origins: R1—Shelekh Cape; R2, R3, and R4—Stark; R5 and R6—Cherepakha-7.
Ceramics 06 00064 g004
Figure 5. Examined samples of black-painted pottery. Sites of sample origins: B1, B2, and B3—Stark; B4—Shelekh Cape; B5—Solnechny Bereg; B6—Solontsovaya-2; and B7—Cherepakha-7.
Ceramics 06 00064 g005
Figure 6. Ochre samples from Cherepakha-7 site. (A) Sample O1: 1—original piece; 2—powdered material, 3—color stroke. (B) Sample O2: 1—original piece; 2—powdered material; and 3—color stroke.
Ceramics 06 00064 g006
Figure 7. OM images (50×) of red paint texture at sherds’ surface and cross-sections. Surfaces: (a,b) Sample R1, (c) Sample R4, and (d) Sample R5. Cross-sections: (e) Sample R1 (unpolished), (f) Sample R2 (polished), and (g) Sample R3 (polished).
Ceramics 06 00064 g007
Figure 8. SEM images of samples’ surfaces: (a) Sample R2, red paint layer; (b) Sample R2, slip layer; (c) Sample R3, red paint layer; (d) Sample R3, slip layer; (e) Sample R1, red paint layer; and (f) Sample R1, red paint layer, enlarged area. Arrows pointing to supposed hematite crystal inclusions.
Ceramics 06 00064 g008
Figure 9. Box-and-whiskers diagrams of EDS measurements of elemental composition of samples R1–R6: (af) red paint composition, (a*) ceramic paste composition, and (b*f*) slip composition.
Ceramics 06 00064 g009
Figure 10. Raman spectra of the red pigment. Sample R1, reflex micro-spectrometer screen snapshots. Crossed lines indicate the probe point. Right panel: Raman spectrum at this point. Scale bar: 20 μm. Numerals indicate peaks characteristic for hematite. Fluorescent backgrounds in spectra were subtracted for clarity. Q—the quartz peak registered at 465 cm−1.
Ceramics 06 00064 g010
Figure 11. Box-and-whiskers diagrams of EDS measurements of elemental composition of ochre samples from site Cherepakha-7. (a)—Sample O1; (b)—Sample O2.
Ceramics 06 00064 g011
Figure 12. Macro-photo of burnishing traces above black-painted patterns: (a) Sample B3, (b) Sample B5, and (c) Sample B7.
Ceramics 06 00064 g012
Figure 13. OM images (50×) of black paint texture: (a) Sample B4; (b) Sample B6; (c) Sample B6, contacting zone of black-painted pattern and background; and (d) Sample B3.
Ceramics 06 00064 g013
Figure 14. SEM image of black pattern texture: (a) Sample B6 and (b) Sample B5. Magnification = 1.000×.
Ceramics 06 00064 g014
Figure 15. Box-and-whiskers diagrams of EDS measurements of elemental composition of Samples B1–B7: (ag) black paint and (a*g*) background composition.
Ceramics 06 00064 g015
Figure 16. Raman spectra of Samples B1, B2, B3, and B6. Fluorescent backgrounds in spectra were subtracted for clarity.
Ceramics 06 00064 g016
Figure 17. Raman spectra of Samples B5 and B7. Raman spectrum of Sample B5 is designed with initial value (black) and line after subtracting of luminescence background (red). The band at 960 cm−1 corresponds to the phosphate ion (PO4)3−. The band at 1085 cm−1 indicates the calcium carbonate, CaCO3. The band at 1594 is corresponding to carbon. In the spectrum of B7, fluorescent backgrounds in spectra were subtracted for clarity.
Ceramics 06 00064 g017
Table 1. Data on Al and Si mean and range values concentrations in elemental compositions of ochre and red paint samples from the Cherepakha-7 site.
SampleAl Concentration (wt.%)Si Concentration (wt.%)
RangeMeanRangeMean
O1 (ochre)1.02–4.651.631.26–31.5411.92
O2 (ochre)1.13–8.031.901.14–24.609.17
R5 (paint)4.41–13.7810.726.41–17.7910.21
R6 (paint)3.54–11.376.468.78–22.9214.84
Disclaimer/Publisher’s Note: The statements, opinions and data contained in all publications are solely those of the individual author(s) and contributor(s) and not of MDPI and/or the editor(s). MDPI and/or the editor(s) disclaim responsibility for any injury to people or property resulting from any ideas, methods, instructions or products referred to in the content.

