1. Introduction
The interposition of phases in composite materials strongly affects their properties; however, for crystalline materials, it is possible to determine such structural parameters, for example, the coordination number, type of lattice, interatomic distance, etc., whereas in such cases as the analysis of particle distribution in ceramics and non-metallic inclusions in steel or filler in a binder, such parameters cannot be determined. These things considered, the structural characteristics of such materials can be analyzed using approaches of digital materials science [
1], particularly based on the determination of numerical indicators characterizing the structure of the material by analyzing statistical information from a large space, for example, from a micrograph of a thin section of a material sample. Obviously, for a highly ordered system like a perfect crystal structure, a minimum amount of information is required to characterize the relative position of its elements, since the information about one element can be sufficient to determine the location of the others. On the contrary, for a highly disordered structure, information about all its elements is required to determine the state of the system. The microstructure of materials greatly affects their properties. The investigation of the “composition–structure–properties” relationships involves the study of effects caused by changes in the composition of a material upon its properties. The determination of numerical characteristics of the structure makes it possible to study the effect of the composition (for example, fractional) on the uniformity of the distribution of different fractions in the material and analyze the relationships between the composition of the material, parameters of its microstructure and target properties. The study of statistical homogeneity of the structural elements distribution uniformity on the basis of the results of an experimental study of the microstructure of materials in conjunction with their macroscopic properties makes it possible to develop approaches to the prediction and adjustment of their target performances [
2]. This approach is particularly useful for composite materials, the properties of which depend not only on the quantitative ratio of the components (e.g., content of a filler introduced into a binder matrix), but also on their mutual arrangement, i.e., uniformity of the filler distribution in the matrix, taking into account the possible aggregation of its particles, fibers or layers [
3]. One of the considered approaches, described in detail [
2,
3,
4,
5,
6,
7,
8,
9,
10,
11,
12], is based on the calculation of the fractal dimension characterizing the geometric complexity of an object and determined according to the rate of increment of new elements of the structure with increasing scale. In some cases, a more informative parameter is lacunarity characterizing the spatial non-uniformity of the distribution of the studied objects [
13,
14,
15,
16]. In [
1], a new parameter, “scale invariance,” characterizing the variation of lacunarity of the studied structure depending on the scale was proposed. According to the concept of information entropy, structural characteristics of disordered materials can be also described using Voronoi entropy as a parameter describing the amount of information required to determine the state of the system, namely the relative position of the elements of the structure in the considered materials [
17,
18,
19].
In [
20], the above methods were applied to the study of the structure of polymer-inorganic composites. Thus, the considered approaches to quantitative description of the structure are applicable to the study of a wide range of materials.
In this research similar methods are applied to composites comprising diamonds distributed in a silicon carbide matrix. V.Ya. Shevchenko [
21] demonstrated the possibility for the synthesis of a new class of materials with a regular (periodic) interconnected microstructure. Among them, the highest mechanical properties are achieved for a diamond–silicon carbide composite “Ideal” [
22,
23]. These materials are close to diamond in their characteristics, but their outstanding properties are determined not only by the high performance of their components but also by the structure of the composite synthesized according to optimized technology.
Table 1 presents the physical and mechanical characteristics of reaction-sintered silicon carbide, boron carbide, liquid-phase sintered silicon carbide [
24] and the composite material “Ideal” [
25,
26]. According to all mechanical characteristics, the composite material “Ideal” is better than other materials.
From
Table 1, it can be concluded that the high mechanical properties of the “Ideal” composite make it possible to increase the protection class with an equal thickness of the protective layer or to reduce the weight of ceramic plates while maintaining their level of protection. Silicon carbide grains formed on diamond surface yield triply periodic structures filling the space between the diamond particles, thus providing an increase in the interfacial adhesion and growth of the Young’s modulus to a level close to that of diamond. Thus, this composite is close to diamond in terms of basic mechanical characteristics.
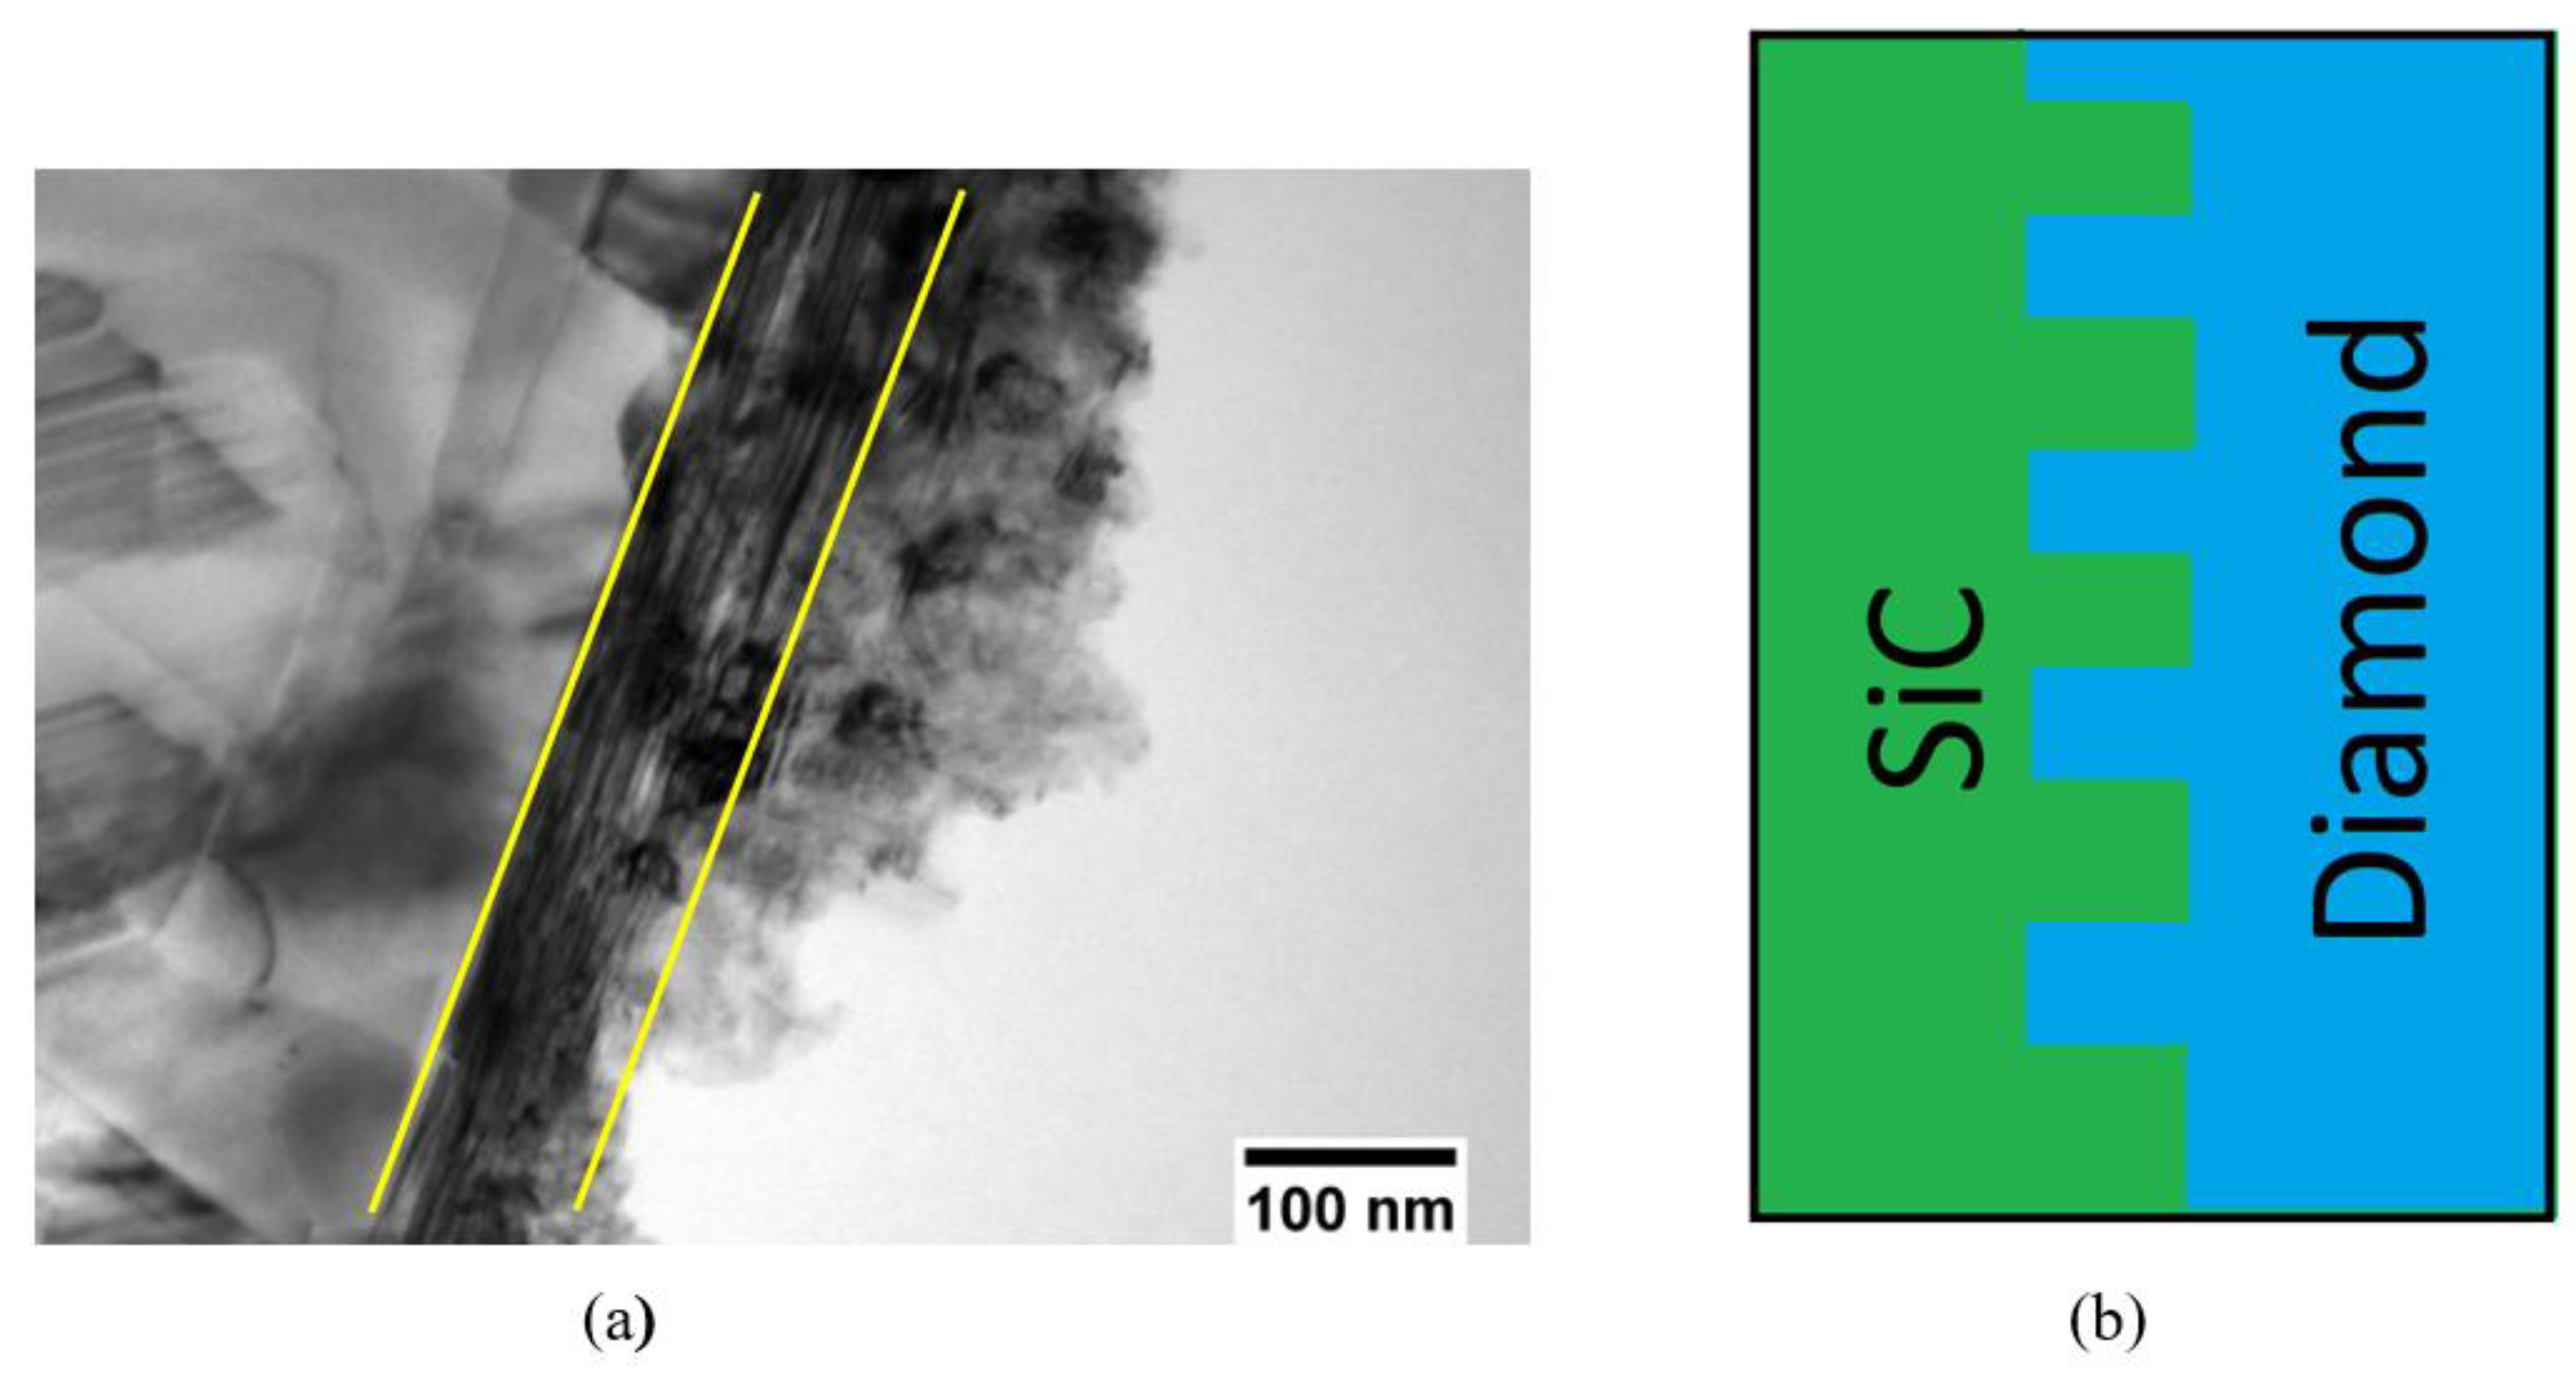
As shown in [
27], these materials are nanocomposites with the diamond–SiC interface formed by interpenetrating phases (
Figure 1) providing exceptionally high mechanical properties due to the high adhesion between the phases. The destruction of such material occurs via a transcrystalline mechanism.
The aim of this study is the characterization of the microstructure of these materials and the analysis of the obtained data in terms of the above approaches. The study of the structure and properties of composite materials of the diamond–silicon carbide composition is of great interest, since triply periodic structures of silicon carbide on diamond particles formed during the reaction–diffusion synthesis fill the pore space between the diamond particles, thus providing dense diamond–silicon carbide composite. Since these structures are formed predominantly along the (111) diamond crystallographic facet, the nucleation and growth of silicon carbide grains during siliconization occur mainly at the sites of defects on the diamond surface. Hence, the fractional composition of the initial diamond powders and the surface properties of their particles can significantly affect the properties of such composite materials. Thus, variation in the amount, shape and size of diamond particles can lead to different properties of the triply periodic structures of silicon carbide formed on diamond particles and, consequently, result in the variation of interparticle space-filling behavior and mutual arrangement of these particles, eventually affecting the properties of such materials. The characterization and quantitative analysis of the microstructure of such materials can provide a promising approach to the improvement of their target properties since they often strongly depend on the microstructure. Particularly, obtaining a more homogeneous structure can result in the improvement of protective properties for the considered material since inhomogeneities can act as concentrators of various defects, deteriorating the target strength performances. Digital materials science methods can make it possible to evaluate the influence of these factors on the structure and properties of the considered composites.
2. Materials and Methods
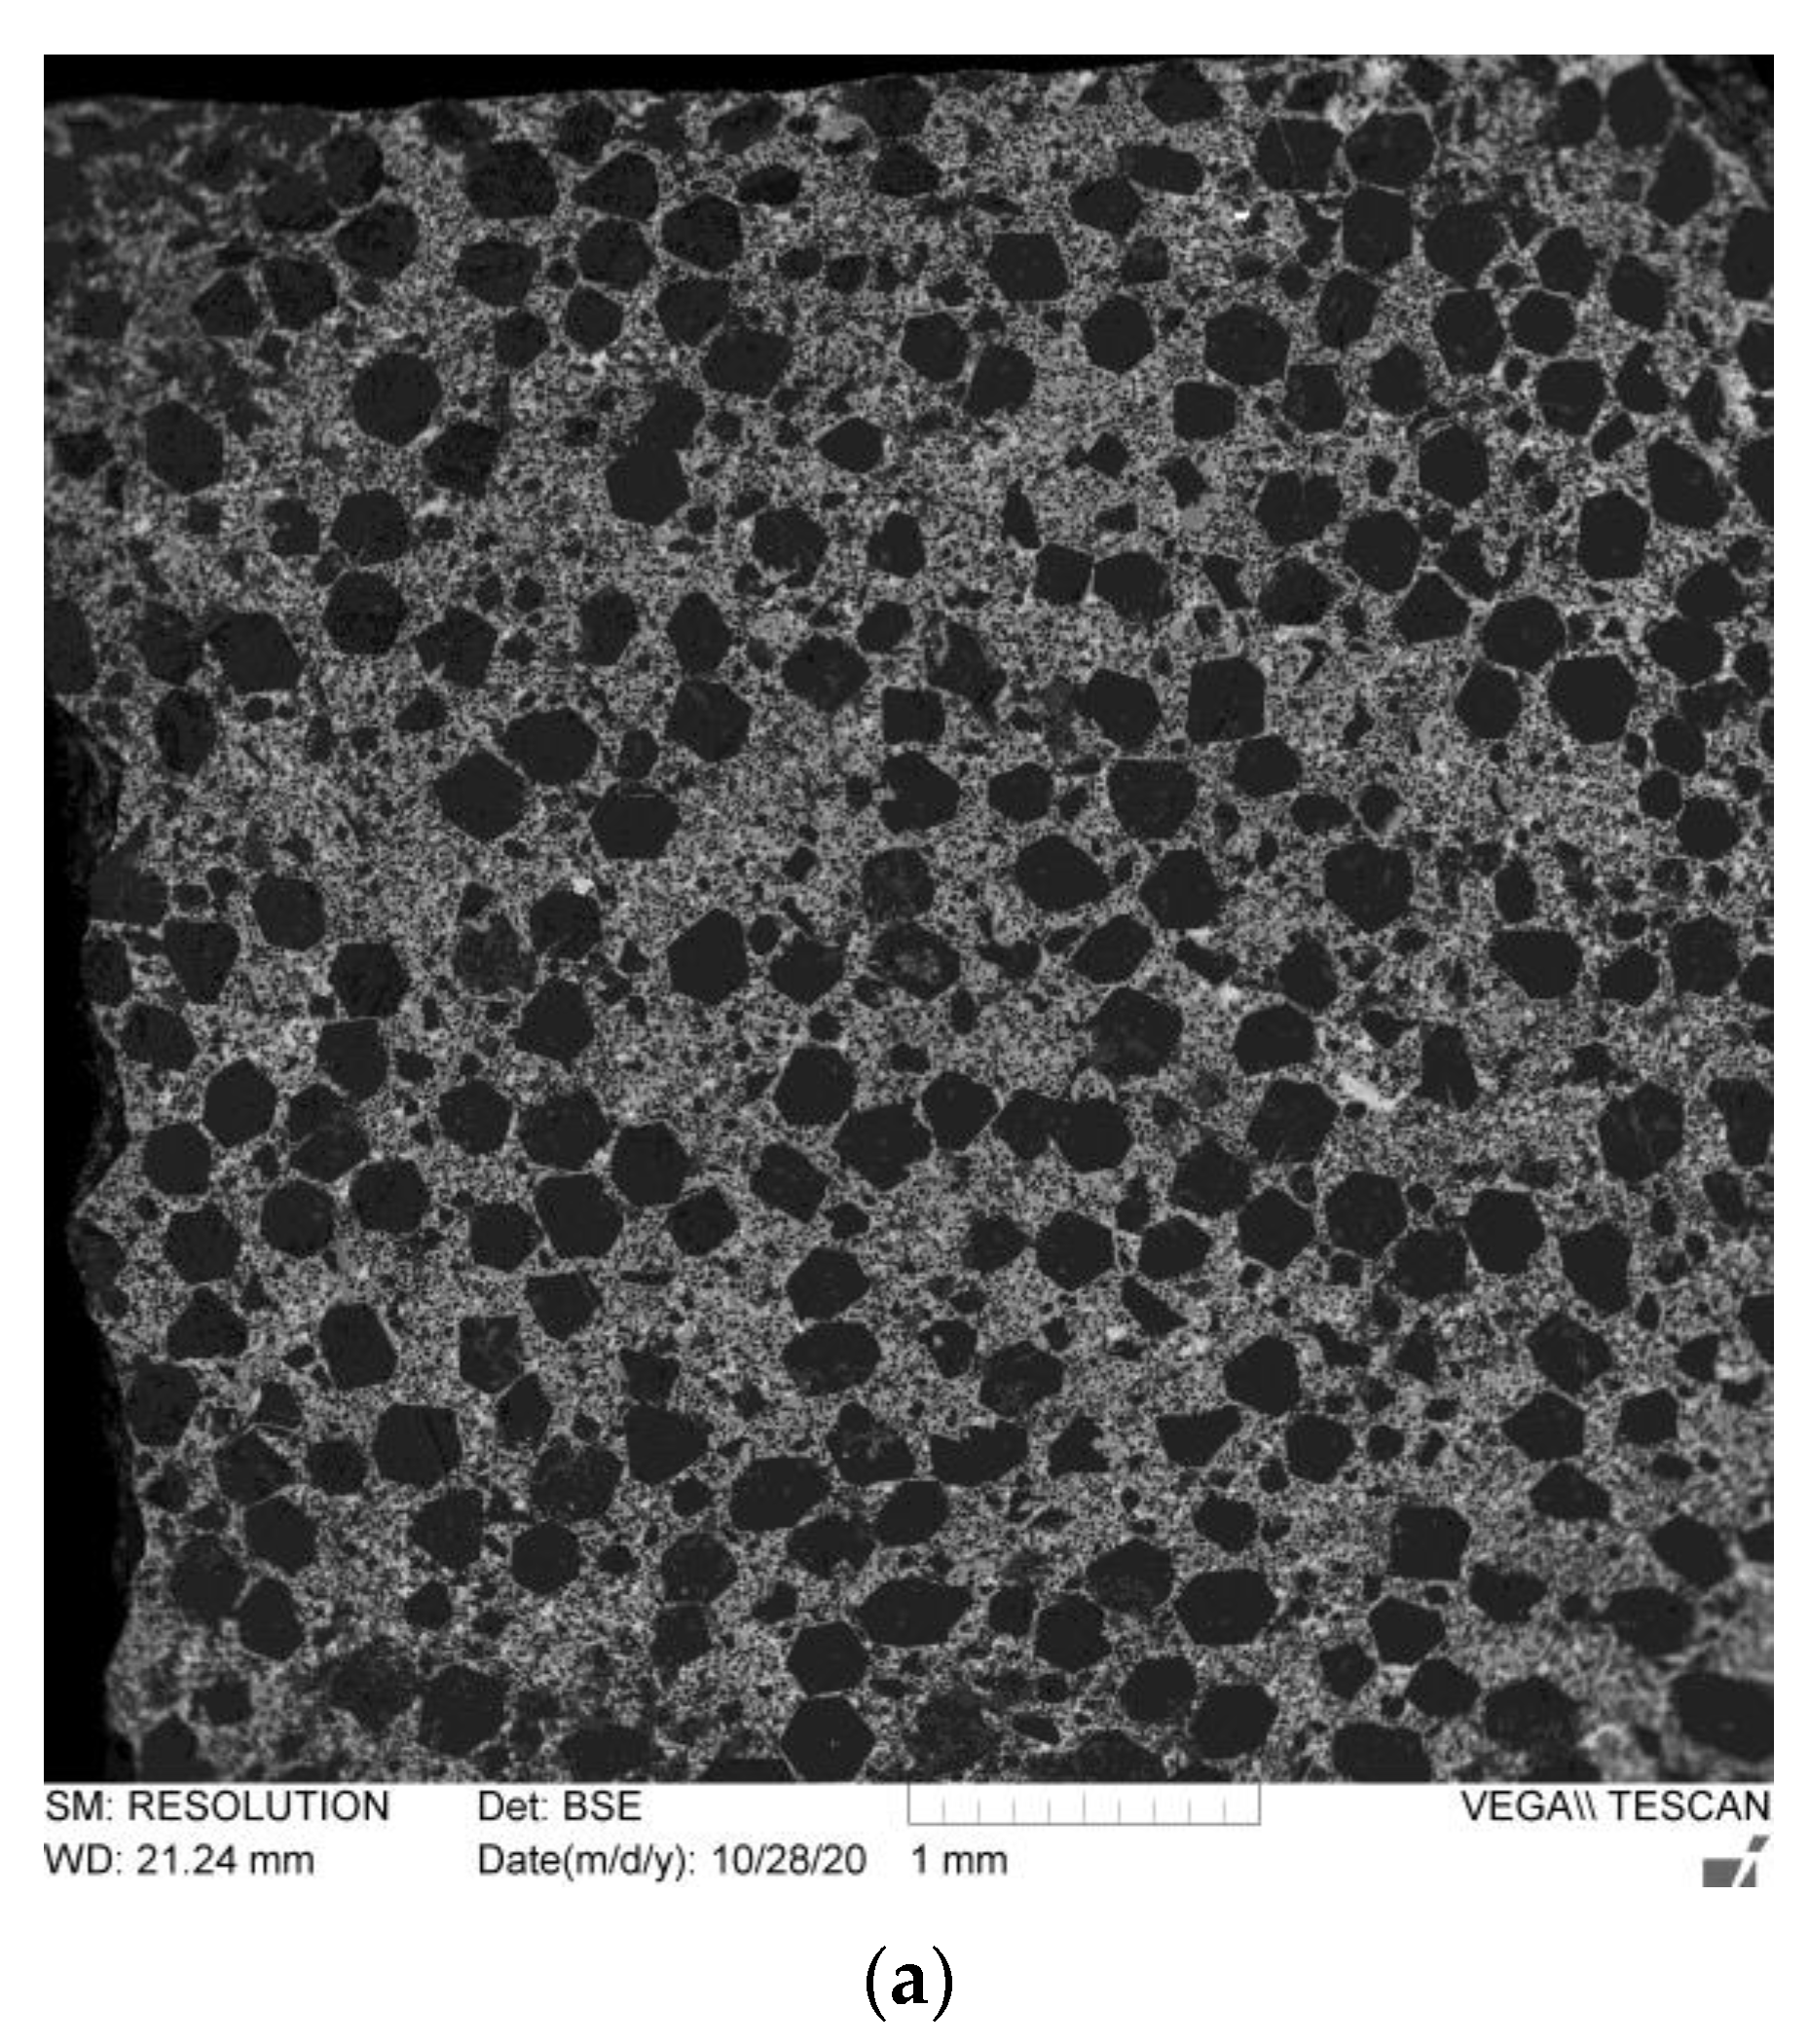
The experiments were carried out using AC160 diamond powder (diamond) containing fractions 250/200, 28/20 and 10/3 µm in various ratios. The particles of the largest fraction are mainly represented by crystals of the “regular” shape (
Figure 2). Smaller fractions were added to the main (large) fraction to provide the maximum filling of the space with diamond parts. The content of impurities in the powders did not exceed 0.2 vol. %.
Diamond–silicon carbide ceramic samples obtained according to the procedure involving the following stages [
23]:
- (1)
Dry mixing of diamond powders, followed by mixing with an alcohol solution of phenol–formaldehyde resin, drying of the charge in air and homogenization of the charge by granulation.
The diamond powders were mixed in a ball mill with corundum grinding bodies for 2 h. The resulting charge powders were mixed with a phenol–formaldehyde resin solution. Drying of the homogenized mixture was carried out in air for 30 min.
- (2)
Formation of ceramic tile blanks by weighing the required amount of charge, placing it in a mold, compression, removing it from the mold and placing it on a substrate (plate) for subsequent movement between technological sections. The molding of the samples was carried out using a hydraulic press at a pressure of 100 MPa within 10 s.
- (3)
Drying of the blanks in air for 8 h at a maximum temperature of 120 °C.
- (4)
Siliconization of the blanks by placing them into graphite containers. Before the procedure, in order to protect the graphite equipment of the furnace from liquid silicon leakage, the walls of the graphite containers were coated with a 10% suspension of boron nitride in ethanol and dried in air to provide a protective gasket. Then, the required amount of silicon (40% of the processed workpiece weight) was placed on the surface of the workpieces. The workpieces were placed in a furnace and subjected to high-temperature treatment, after which the parts were removed from the furnace. The siliconization process was carried out at 1600 °C under vacuum. Then, the containers were removed from the vacuum oven.
- (5)
Cleaning of the prepared samples from technological impurities (remains of silicon, slag, substrate) by sandblasting (jet-abrasive) treatment with white electro-corundum in the abrasive-blasting chamber.
The average values of open porosity measured for all the studied samples did not exceed 0.1%.
The apparent density was determined according to the Russian standard GOST 2409-95.
The speed of sound were determined by the acoustic oscillation frequency resonance method using the “Sound-130” device. Based on the measured sound propagation speed in the material, the modulus of elasticity can be determined according to the Equation (1) shown below, thus characterizing one of the most important mechanical properties of the material. The applied technique is based on the appearance of a standing wave in the studied sample taking place only at the frequency of forced oscillations corresponding to the frequency of the intrinsic oscillations in the material. The peak values on the resonance plot correspond to frequencies that are multiples of the intrinsic frequency of the sample with a coefficient of multiplicity k = 0, 1, 2, 3... At a frequency f = f
0 (k = 0), the maximum amplitude of the steady-state forced oscillations is observed. By setting the frequency of intrinsic oscillations (along the resonance curve), the speed of sound and the elasticity modulus are determined according to Equation (1):
where ρ is the apparent density of the studied material, V is the speed of sound, and E is the elasticity (Young) modulus.
The microstructure characterization and elemental analysis of the samples were performed using a scanning electron microscope (SEM) Tescan Vega 3 SBH with an attachment for X-ray microanalysis (MRSA) AZtec X—Act.
To explore the considered digital materials science approaches, a high-resolution micrograph of the studied material structure is required. As discussed above, the study of a structure without a long-range order requires a high amount of statistical information. Since the microstructure of the studied composites contains fractions of particles with a size of 10 μm or more, it is quite difficult to isolate them by optical microscopy. Thus, for a qualitative and accurate analysis of the microstructure of a fine-grained material, high-resolution SEM images indicating dense diamond particles standing out against the background of the silicon carbide phase are required.
The lacunarity parameter Λ was determined by the box-counting method based on splitting the obtained SEM image into square cells and calculating the number of diamond-particle-mass centers in each of the cell, followed by the calculation of the average value among all the cells and standard deviation from this value [
13,
14,
15,
16]. The lacunarity was determined according to the Equation (2):
where σ is the standard deviation, and μ is the average number of particles in a cell.
A growth of lacunarity corresponds to an increase in non-uniformity of the particle distribution, i.e., an increase in the amount of irregularly distributed areas free of the filler particles.
The box-counting method implies that only particles falling into these cellular “boxes” are taken into account in the calculation. In the case the studied image dimensions differ from an ideal square, some particle falling out of the square grid are discarded from the analysis, but such excluded areas are relatively small and do not deteriorate the statistical processing of the data.
In order to determine the scale invariance, the lacunarity calculation procedure was carried at splitting the SEM image into cells with different size from 10 to 100 μm. Based on these results, a lacunary spectrum was obtained representing the lacunarity as a function of the cell size approximated by the power expressions (3) and (4):
or in logarithmic form:
where Λ is the lacunarity, x is the cell size, A is the pre-power coefficient, and n is the scale invariance indicating the intensity of the lacunarity change depending on the cell size (a decrease in the absolute value of n corresponds to an increase in the scale invariance).
Another interesting method for quantifying microstructures is the calculation of information entropy as an estimate of the amount of information to determine the state of the system according to the concept suggested by K. Shannon in [
19], allowing for the determination of a probability
Pi for the appearance of a system in the state
i. Based on this concept, SEM images of the studied composites were used to plot Voronoi diagrams involving centers of mass of the filler particles as a finite set of points S. Then, the analyzed image was subjected to a partition into fragments involving a set of points located closer to one of the points of the set overall S than to any other point of the set [
18].
After constructing the Voronoi diagram, we obtain data on the number of sides of the polygon built around each point, thus we can subdivide the image into different classes of cells according to the number of sides (equal to the number of neighbors). The information entropy is determined as Equation (5):
where p
i is the probability that the considered Voronoi polygon has a certain number of sides. Generally, the Voronoi entropy indicates the amount of information required to determine the location of objects relative to each other and grows with the increase in the system disorder.
In this study, Voronoi diagrams were plotted using Matlab software [
15,
16] involving the “voronoi” function. Additionally, using the “delaunayTriangulation” function, a Delaunay triangulation was arranged for a given set of points on a plane in such a way that all the circles circumscribed of any triangle contain no inside points except the triangle vertices. Based on this triangulation arrangement, Voronoi entropy was determined according to the procedure described in [
17]. Matlab displays the coordinates of the vertices of all Voronoi cells for each center of mass, indicating the number of sides in the corresponding polygon is displayed as well as the coordinates of the start and end points of all triangulation lines.
Furthermore, the applied software allows the determination of the number of nearest neighbors (coordination number) for each particle as the number of vertices of the sides in the Voronoi cell corresponding to this particle.
3. Results and Discussion
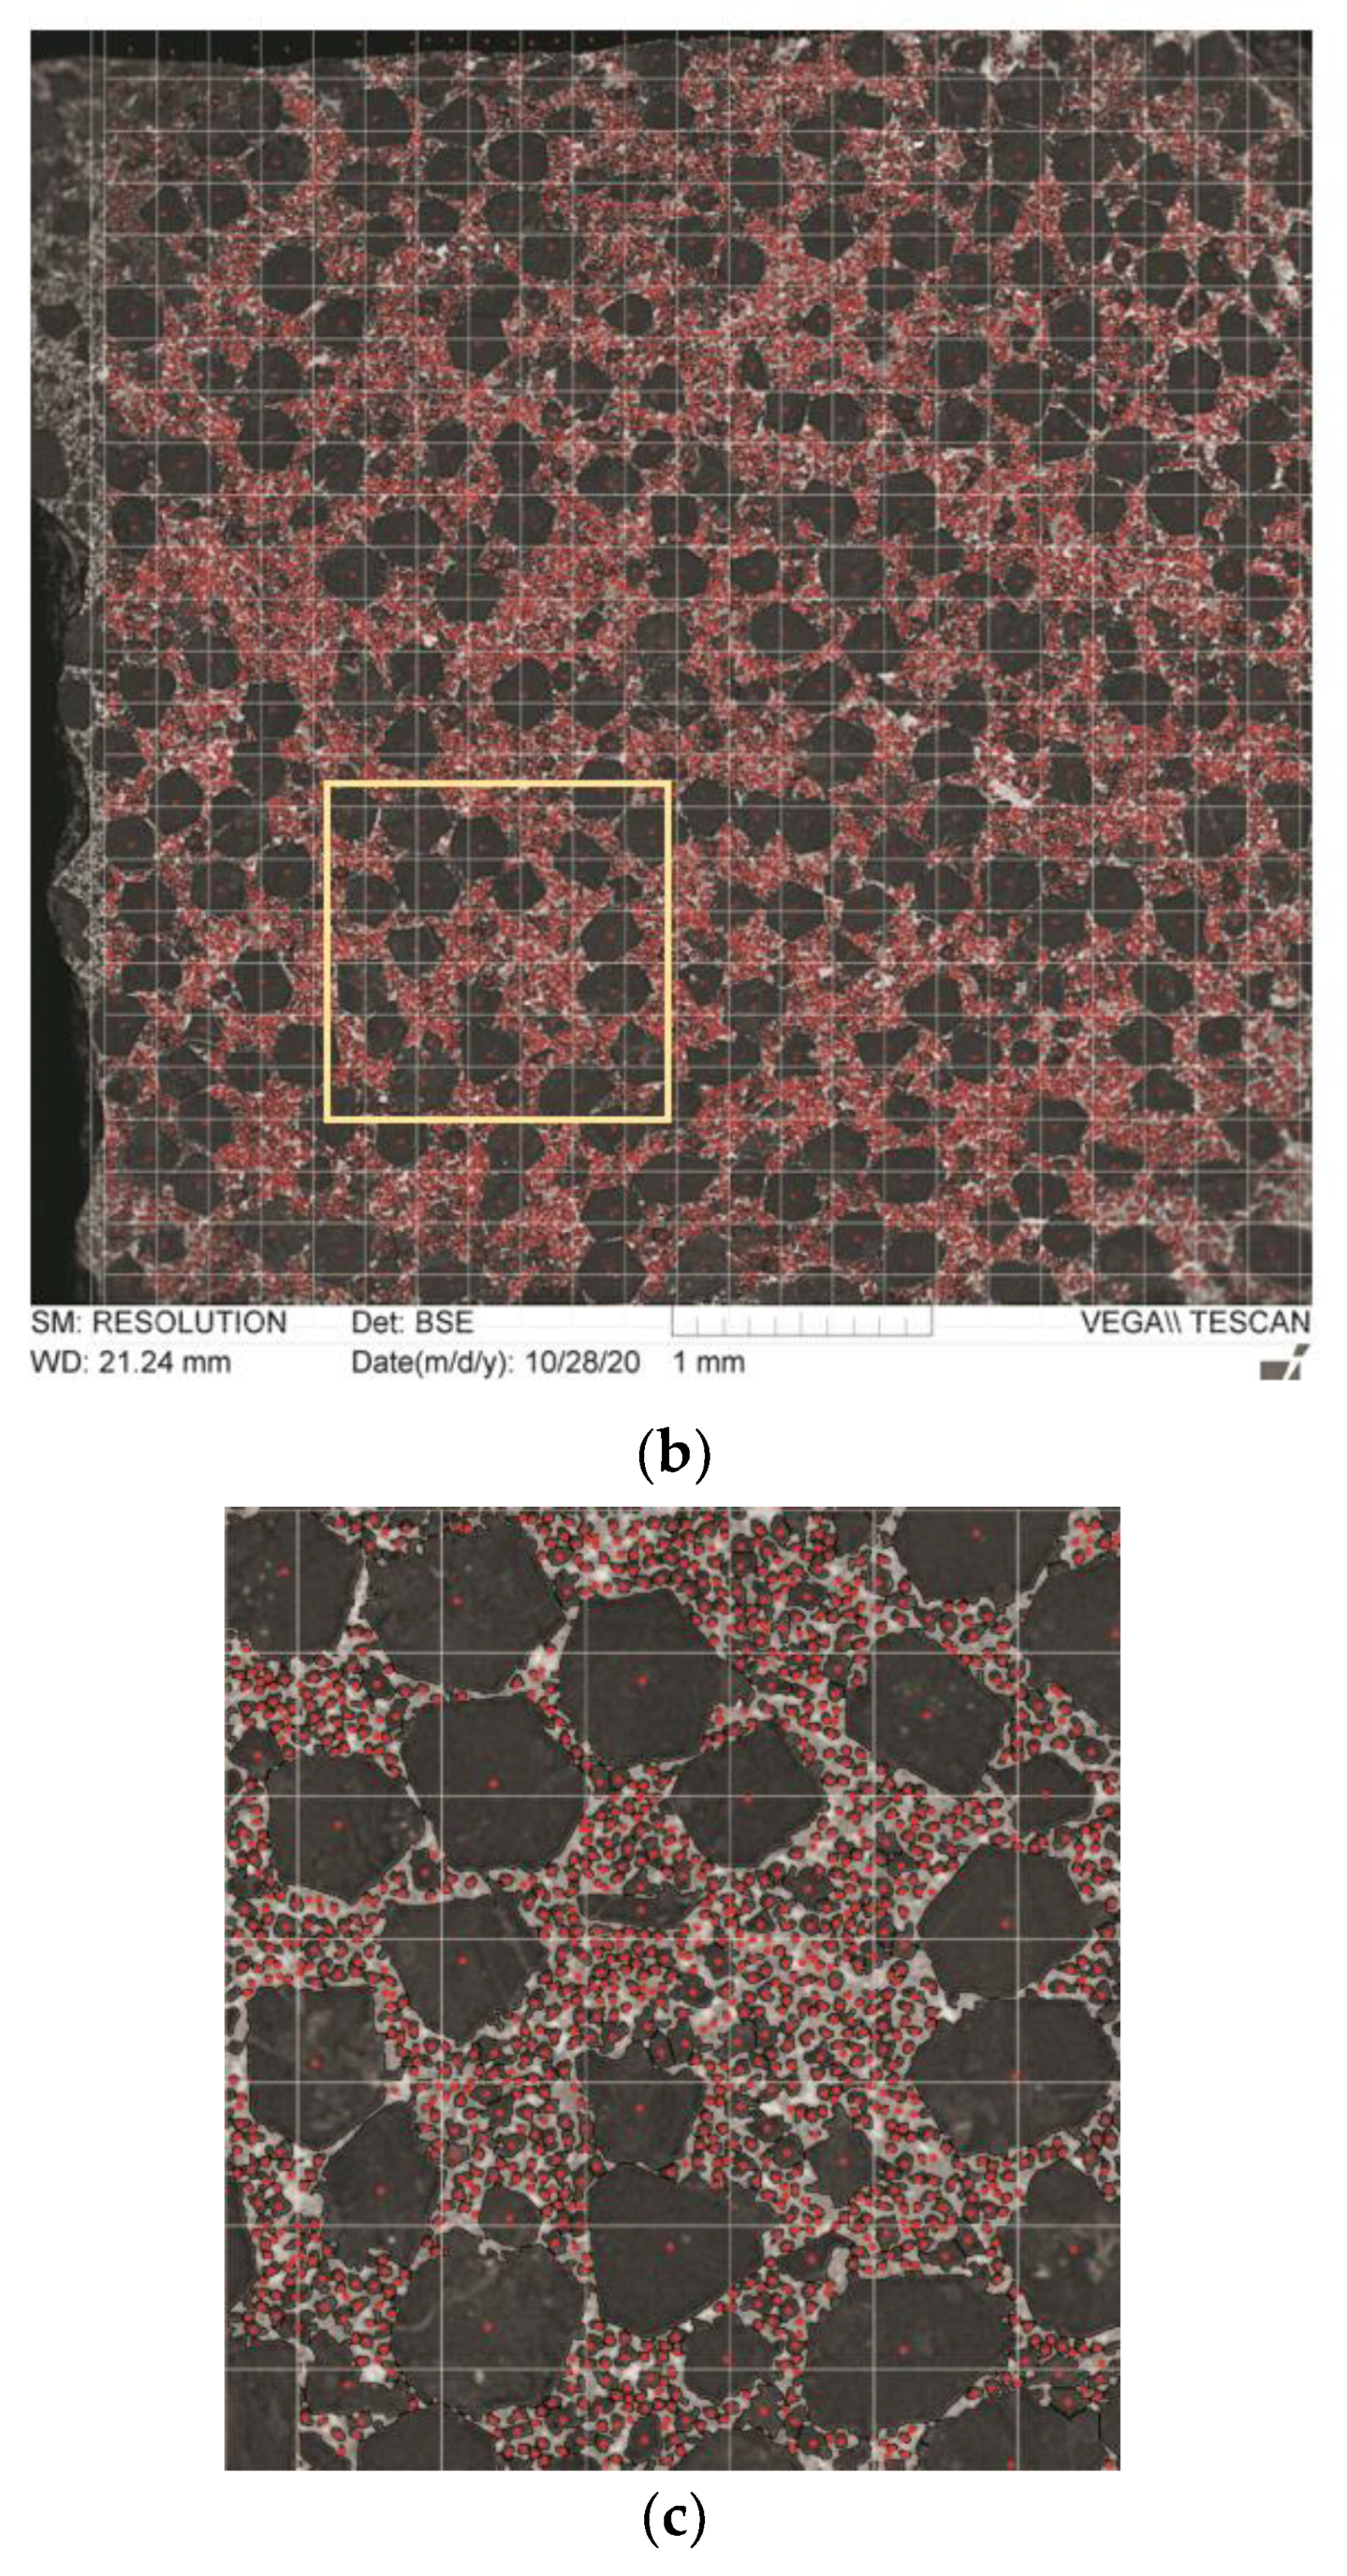
The results of the obtained material microstructure characterization and processing are summarized in
Figure 2. A SEM image of the obtained diamond–silicon carbide composite “Ideal” is shown in
Figure 2a, and its splitting into 200 µm square cells involving the small particles centers of mass is illustrated in
Figure 2b with an enlarged area shown in
Figure 2c. For large particles, splitting was carried out in a similar way.
The lacunarity was calculated both for all the selected particles and separately for either only large (about 200–250 μm) or only small (below 28 μm) particle fractions. To calculate the structure parameters, it is first required to collect information about the structure of the material in the studied area, for which the photo was binarized using the ImageJ software [
28,
29] (the particles corresponded to black pixels and the space between them to white pixels), and the center of mass was calculated for each particle (
Figure 2b).
The calculated lacunarity values Λ are summarized in
Table 2.
The calculation data indicate that the largest lacunarity is observed for the system of large particles (2.58), most likely due to a small number of such particles that cannot occupy all the cells, thus leaving many empty cells free of the particles, in turn, causing a significant inhomogeneity. Probably, to study only large particles, it is necessary to consider images with a much larger coverage in order to obtain more reliable statistical information.
For the system involving only small particles the lacunarity is much lower (0.38) indicating a more uniform distribution. Despite the presence of inhomogeneous regions in the place of eliminated large particles, the number of empty cells is significantly reduced, and the difference in particle filling density between different cells is less prominent.
The system involving both large and small particles features the lowest lacunarity (0.36) (slightly below the value for the system of small particles), which reflects the filling of some empty cells with large particles, suggesting the maximum uniformity.
There is a tendency that a relatively small number of large particles distributed over a large area are less homogeneous than a much larger number of small particles in the same area, despite the fact that, visually, the system including only small particles involves more prominent empty areas. Furthermore, for the system including all the particles, the addition of even a small number (about 200) of centers of mass of large particles to about 11 thousand selected centers of mass of small particles resulted in a certain decrease in lacunarity, indicating the sensitivity of the applied method.
Thus, the calculation of lacunarity parameter is a highly sensitive method providing a quantitative characterization of the homogeneity for the distribution of any objects in space. This approach can be applied to various systems such as composites, steels and alloys.
The scale invariance values calculated according to Equation (3) are shown in
Figure 3.
The scale invariance values for the systems involving only small and only large particles are −1.29 and −2.32, respectively. This difference indicates that the system of smaller particles features a higher scale invariance compared with a set of larger particles due to the random nature of the particle distributions. The smaller particles, the more statistically uniform and less scale-dependent the systems.
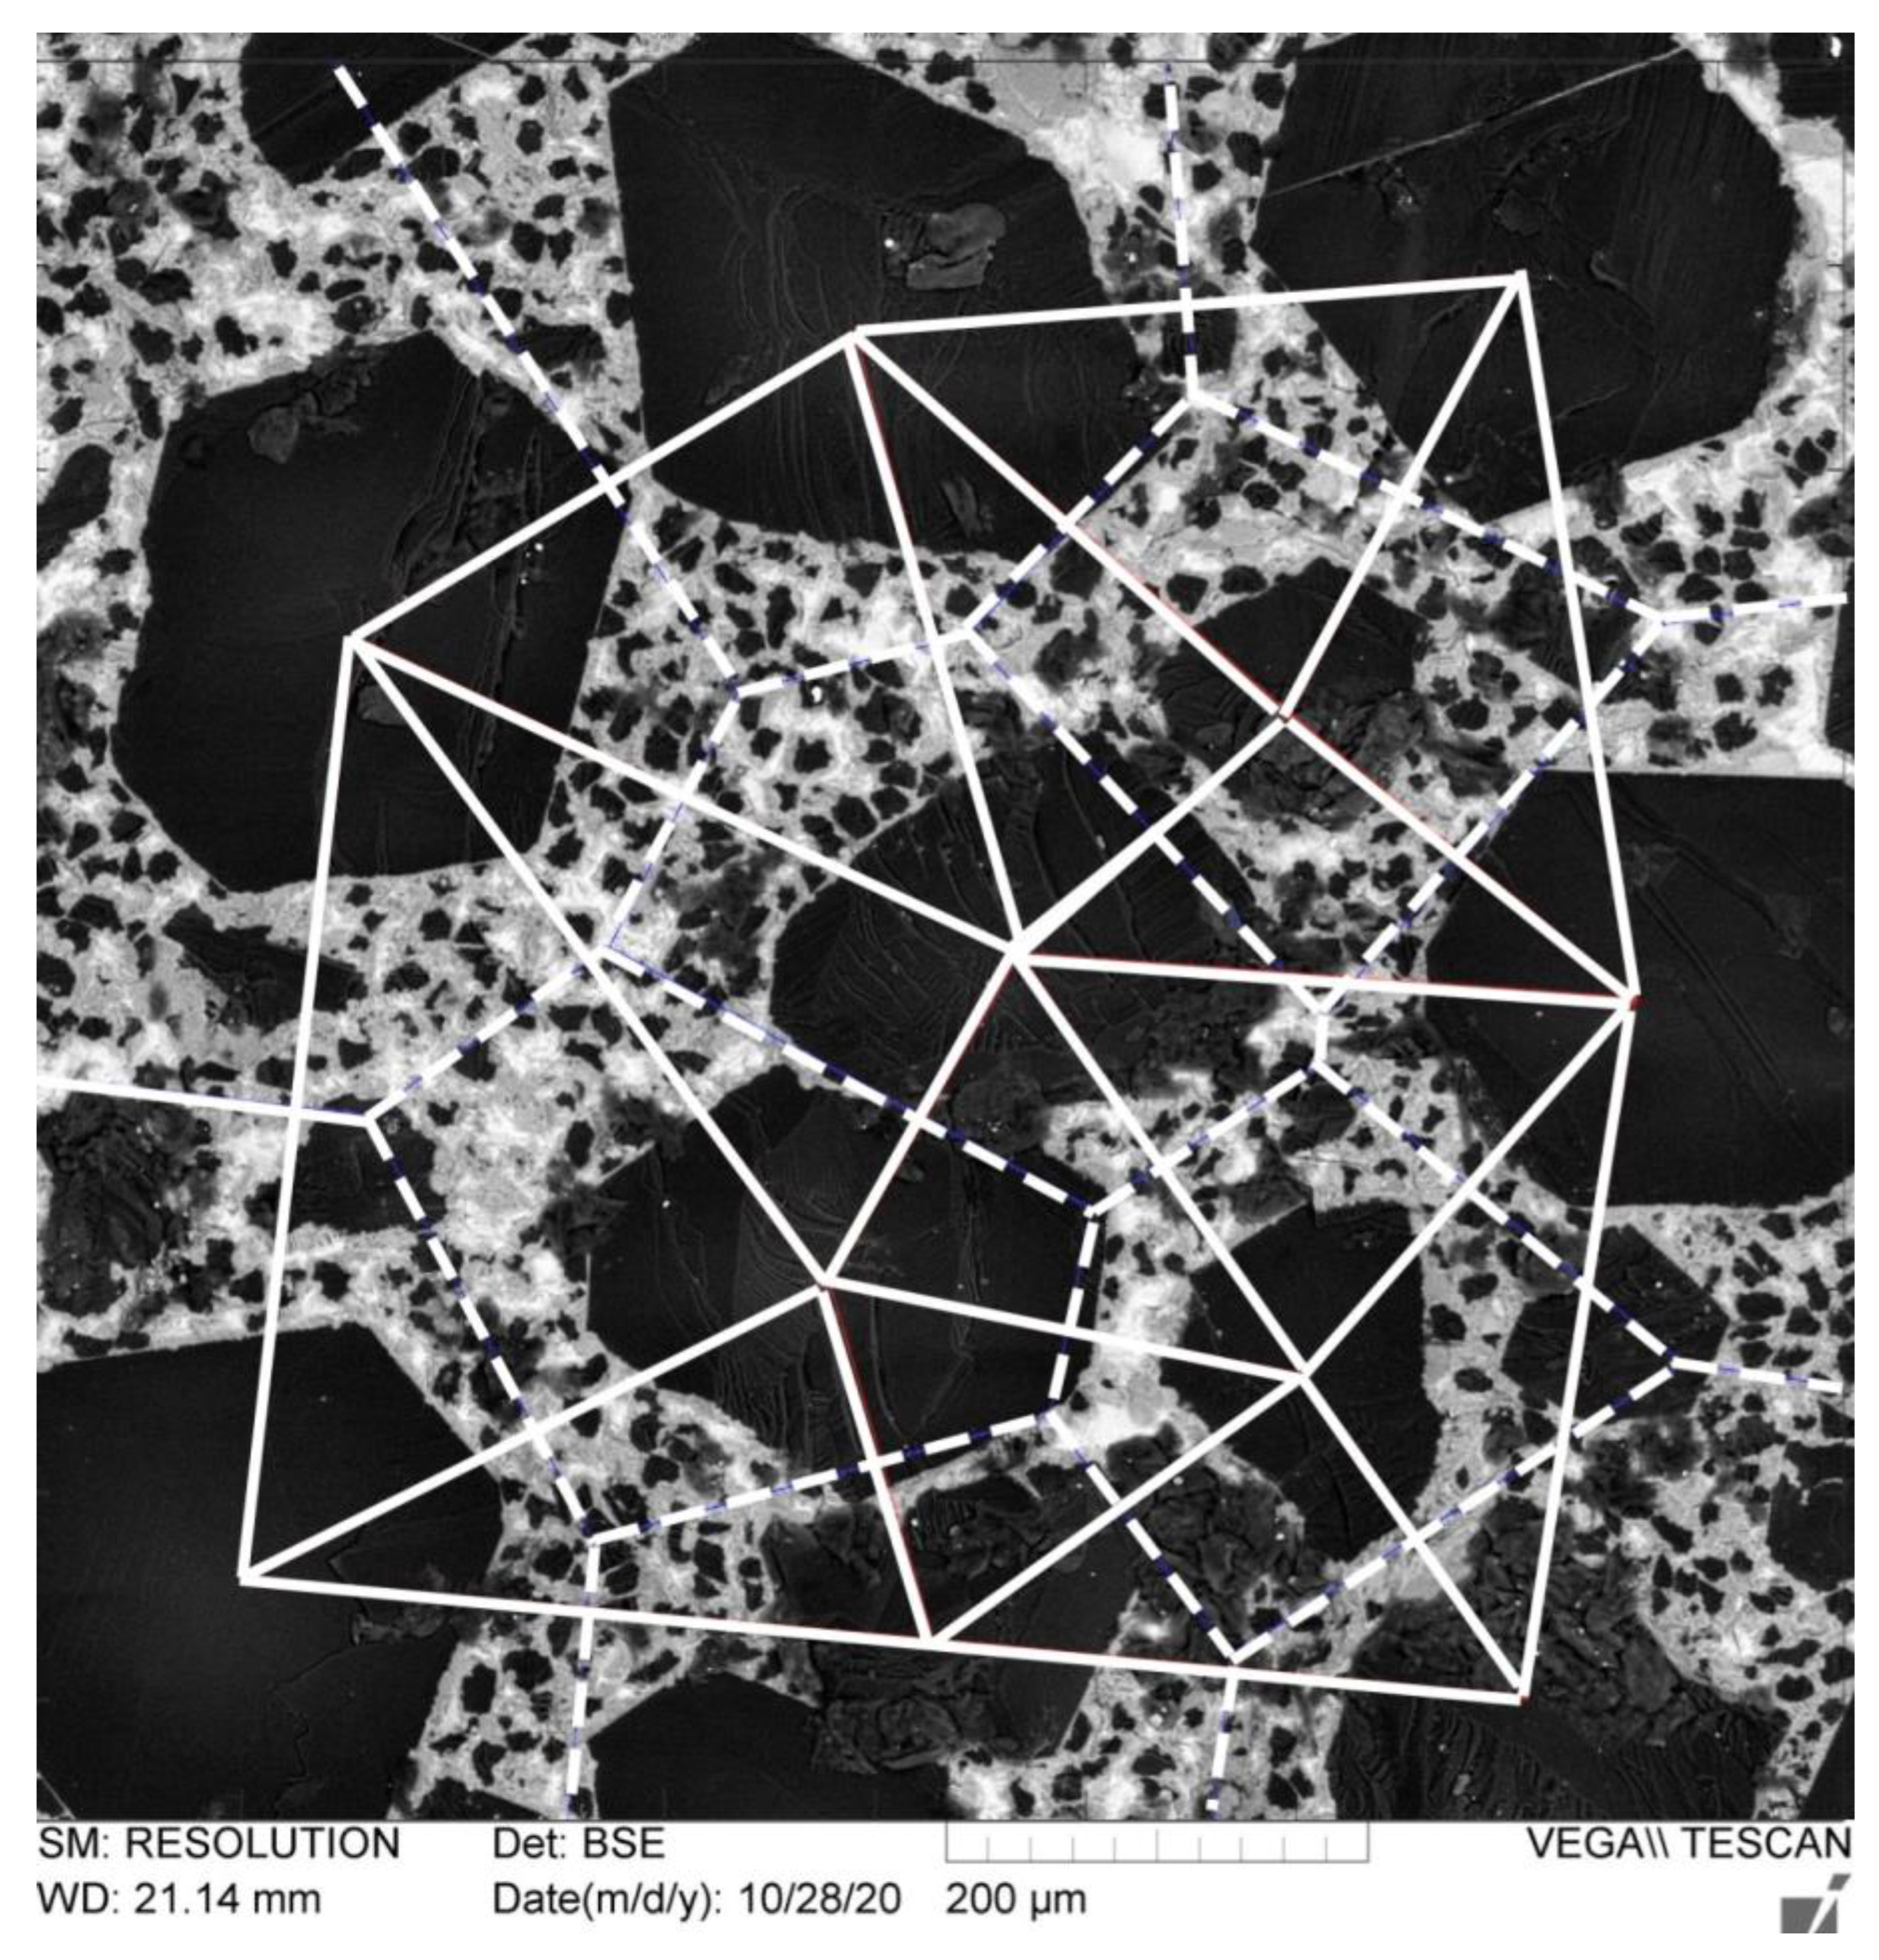
An exemplary Voronoi diagram for the system of large particles with triangulation of the particles centers of mass corresponding to the original image is shown in
Figure 4.
As a result, Matlab outputs the coordinates of the vertices of all Voronoi cells, for each center of mass, and a set of vertices of the Voronoi cell is output to which it corresponds (the number of sides). You can also get the coordinates of the starting and ending points of all triangulation lines.
The calculated Voronoi entropy values are summarized in
Table 3.
The obtained data show that the lowest Voronoi entropy is observed for the system of large particles, the highest value is calculated for small particles and the system involving all the particles features slightly lower entropy. The entropy minimum in the case of only large particles is determined by the decreased number of Voronoi polygon variants in terms of the number of sides in the absence of small particles. The increase in entropy in the case of a system including only small particles can be caused by an increase in the number of sides of the polygons associated with particles located next to the voids that were occupied by excluded large particles. The appearance of a point in the center of a large void forms a Voronoi cell and the “extra” sides from the nearest small cells are “cut off”.
Thus, the Voronoi entropy can be used for a comparative characterization of systems differing in the content of a filler (discrete phase distributed in a continuous phase) or structural order.
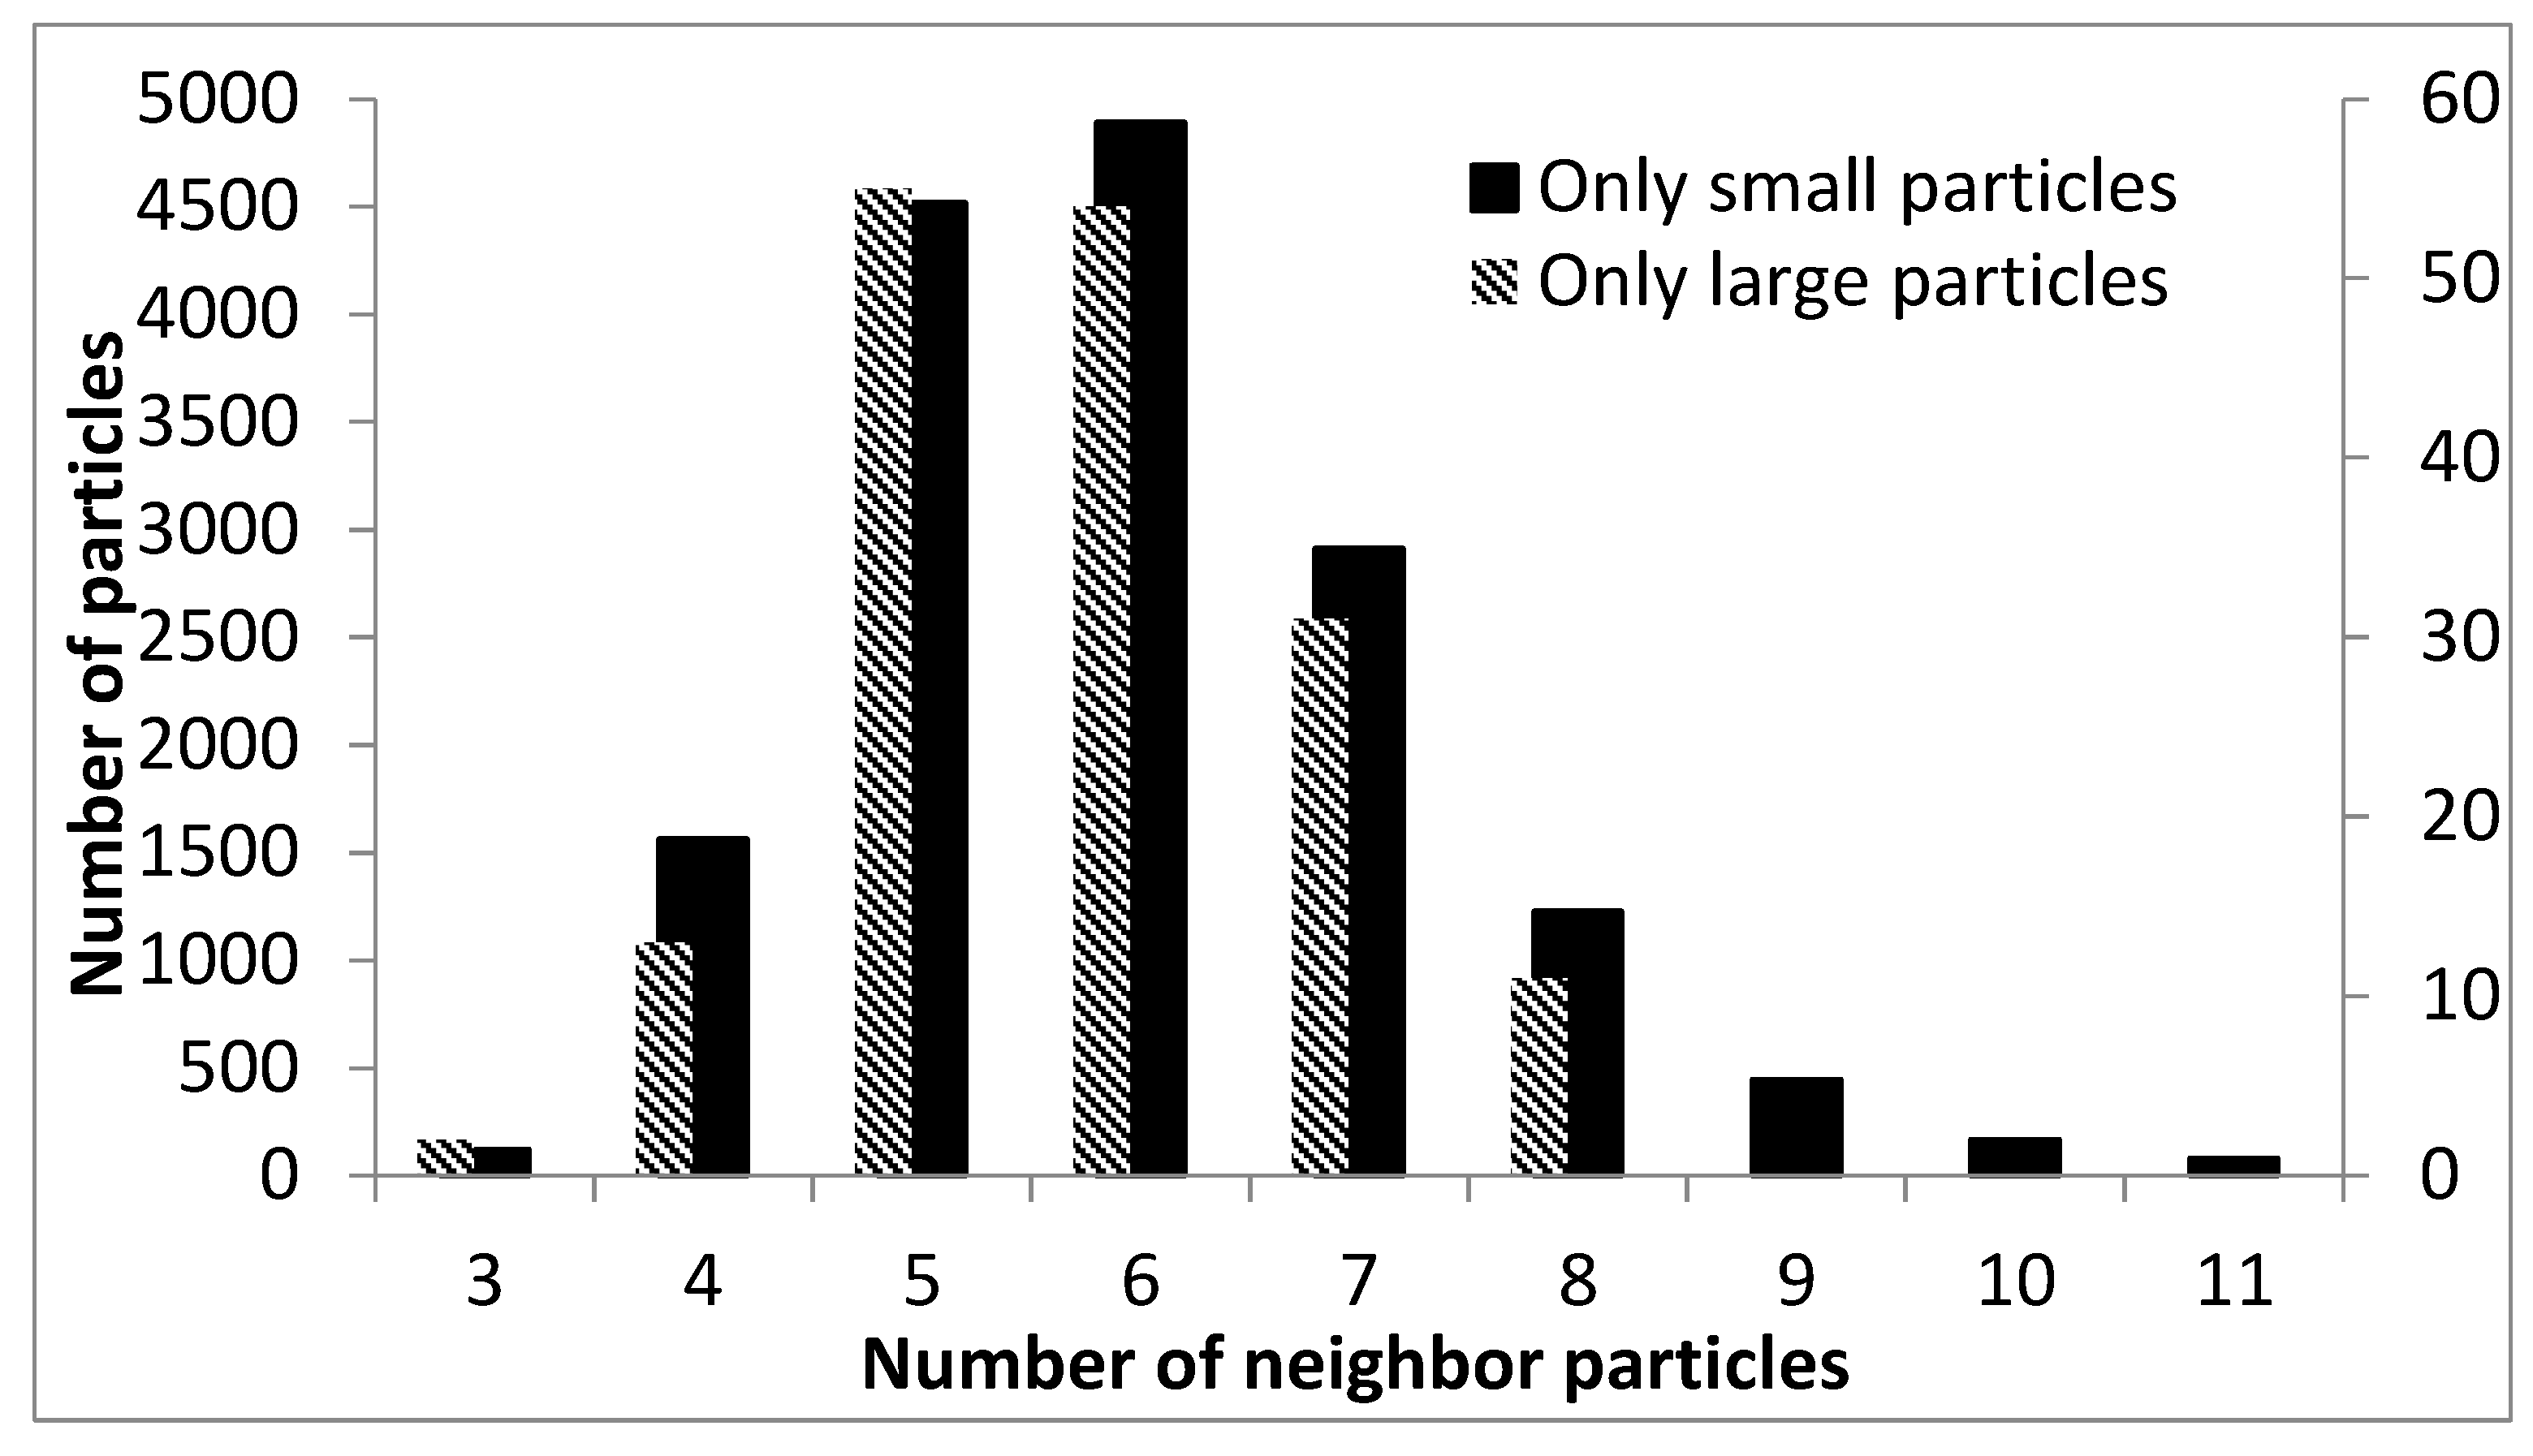
The number of nearest neighboring particles calculated for the systems of large and small particles is summarized in
Figure 5 as a histogram indicating the distribution of the number of particles with certain number of neighbors.
The maximum in this distribution for all particles and for the small fraction is six corresponding to the closest package. For the system of only large particles, the most probable number of neighbors is five, and no values larger than eight is observed.
Thus, besides the calculation of the amount of information characterizing a system, the determination of Voronoi entropy provides additional information such as the number of neighbors for each particle and distances between the neighboring particles, which is promising for the analysis of the structure of various materials.
4. Conclusions
The application of digital materials science approaches is shown to provide a numerical parametrization of the structure of composite materials. Particularly, the calculation of lacunarity makes it possible to numerically compare the inhomogeneity of particle distribution in composites. Furthermore, the scale invariance as a measure of scale independence of lacunarity affording the estimation of self-similarity of the material structure and Voronoi entropy characterizing the system randomness and other relating parameters, including the average coordination number, are determined based on the statistical analysis of the SEM images of the studied composite material. The considered parameters are shown to strongly depend on the filler particle size.
The analysis of this set of structural characteristics makes it possible to quantify the degree of inhomogeneity and self-similarity of the distribution of particles in the studied composites.
The applied methods are quite sensitive and respond even to small changes in the filler particle distribution. Particularly, the number of nearest neighbors of particles in composites is found to approach six, indicating an almost maximum density.
Generally, the considered approaches are shown to be promising for a comparative analysis and prediction of the target properties of various composites.

 ,
, 


