Article

Predicting Road Traffic Collisions Using a Two-Layer Ensemble Machine Learning Algorithm

by
James Oduor Oyoo
*,
Jael Sanyanda Wekesa
and
Kennedy Odhiambo Ogada
School of Computing and Information Technology, Jomo Kenyatta University of Agriculture and Technology, Nairobi P.O. Box 62000-00200, Kenya
*
Author to whom correspondence should be addressed.
Appl. Syst. Innov. 2024, 7(2), 25; https://doi.org/10.3390/asi7020025
Submission received: 2 October 2023 / Revised: 7 November 2023 / Accepted: 14 March 2024 / Published: 18 March 2024

Abstract

:
Road traffic collisions are among the world’s critical issues, causing many casualties, deaths, and economic losses, with a disproportionate burden falling on developing countries. Existing research has been conducted to analyze this situation using different approaches and techniques at different stretches and intersections. In this paper, we propose a two-layer ensemble machine learning (ML) technique to assess and predict road traffic collisions using data from a driving simulator. The first (base) layer integrates supervised learning techniques, namely k- Nearest Neighbors (k-NN), AdaBoost, Naive Bayes (NB), and Decision Trees (DT). The second layer predicts road collisions by combining the base layer outputs by employing the stacking ensemble method, using logistic regression as a meta-classifier. In addition, the synthetic minority oversampling technique (SMOTE) was performed to handle the data imbalance before training the model. To simplify the model, the particle swarm optimization (PSO) algorithm was used to select the most important features in our dataset. The proposed two-layer ensemble model had the best outcomes with an accuracy of 88%, an F1 score of 83%, and an AUC of 86% as compared with k-NN, DT, NB, and AdaBoost. The proposed two-layer ensemble model can be used in the future for theoretical as well as practical applications, such as road safety management for improving existing conditions of the road network and formulating traffic safety policies based on evidence.

1. Introduction

Globally, road traffic crashes take the lives of nearly 1.35 million people every year, more than two every minute, with more than nine in ten of all deaths occurring in low- and middle-income countries. Road traffic collisions have become the leading cause of death for people aged 15–29 years, and the World Health Organization (WHO) estimates that crashes will cause another 13 million deaths and 500 million injuries around the world by 2030 if urgent action is not taken [1]. A 2018 WHO research report revealed Kenya as having one of the world’s worst collision records, accounting for a fatality rate of 27.8 per 100,000 of the population [2], with the city of Nairobi recording the highest share of the total road crashes in Kenya. In addition, road traffic collisions in Nairobi cause significant losses of human life and economic resources. According to a National Transport and Safety Authority (NTSA) report, 4690 people lost their lives to road collisions between 1 January and 13 December in 2022 [3]. Additionally, the report notes that pedestrians and riders are dying at much higher rates because of car collisions from time to time in Kenya. The WHO recently announced a “Decade of Action for Road Safety 2021–2030”, setting the target of preventing at least 50% of road traffic deaths and injuries by 2030 [4]. Significant attention is required to minimize road collisions and as a result, research into building prediction models (PMs) and traffic collision prevention is critical to improve road safety policies and to reduce fatalities on roads [5].
Since road traffic collisions are random, traditional techniques, such as logit and probit models, have been widely used to predict these collisions [6]. Although statistical models have good mathematical interpretation and provide a better understanding of the role of individual predictor variables, they have some limitations [7].These traditional approaches are built on assumptions, such as requiring a predefined mathematical form, the presence of outliers, and missing values in the dataset. Such inferences may be untrue and can negatively affect the outcome of the prediction model [8]. With advancements in soft computing methods, machine learning techniques have emerged as promising road safety collision research tools to overcome the limitations of statistical methods. In contrast to traditional techniques, machine learning (ML) techniques can manage outliers and missing values in the dataset. To predict road collisions, ML techniques have been applied to primary and secondary road collision datasets for different road networks [9,10]. Data unavailability in low- and middle-income countries impedes road safety improvements. Access to data is crucial for scientific research on identifying the factors that cause high road risk and assessing the effectiveness of interventions [11].
Our main objective in this study is to develop and evaluate a crash prediction model that can predict road traffic collisions and their patterns. We perform accident analysis by applying a two-layer ensemble stacking method using logistic regression as a meta-classifier, and the four most popular supervised machine learning algorithms (NB, k-NN, DT, and AdaBoost) because of their proven accuracy in this field [12,13,14]. Datasets for this study were acquired from a fixed-base driving simulator [15]. The prediction accuracy, precision, recall, and F1-score of each ML technique were compared and measured to highlight the best fit. Our contribution through this paper is the development of a crash prediction model that can predict the outcome of a collision, as this can help emergency centers to estimate the possible impacts, provide better appropriate medical treatment, enable policymakers to formulate better policies for road safety based on evidence, and enable better road traffic safety management.
The article is structured as follows. Section 2 focuses on the research methodology and explains data preprocessing, feature selection, and building the ensemble model. Section 3 gives the analysis outcomes. Section 4 discusses the key findings of this research. Lastly, in Section 5, we conclude the paper and address future works.

2. Materials and Methods

In this study, we developed an ensemble model with two layers using four base classifiers and a meta-classifier that integrates the base layer models to improve performance. The four supervised ML algorithms employed to predict road collisions and their patterns are k-NN, DT, AdaBoost, and Naïve Bayes. Subsequently, the logistic regression was integrated as a meta-classifier in the second layer of the model by integrating the outputs of the four first-layer models. Figure 1 presents the flowchart adopted in this study. The research methodology has been structured into the following steps: data collection, data preprocessing, building the ensemble model, and performance evaluation of the model.

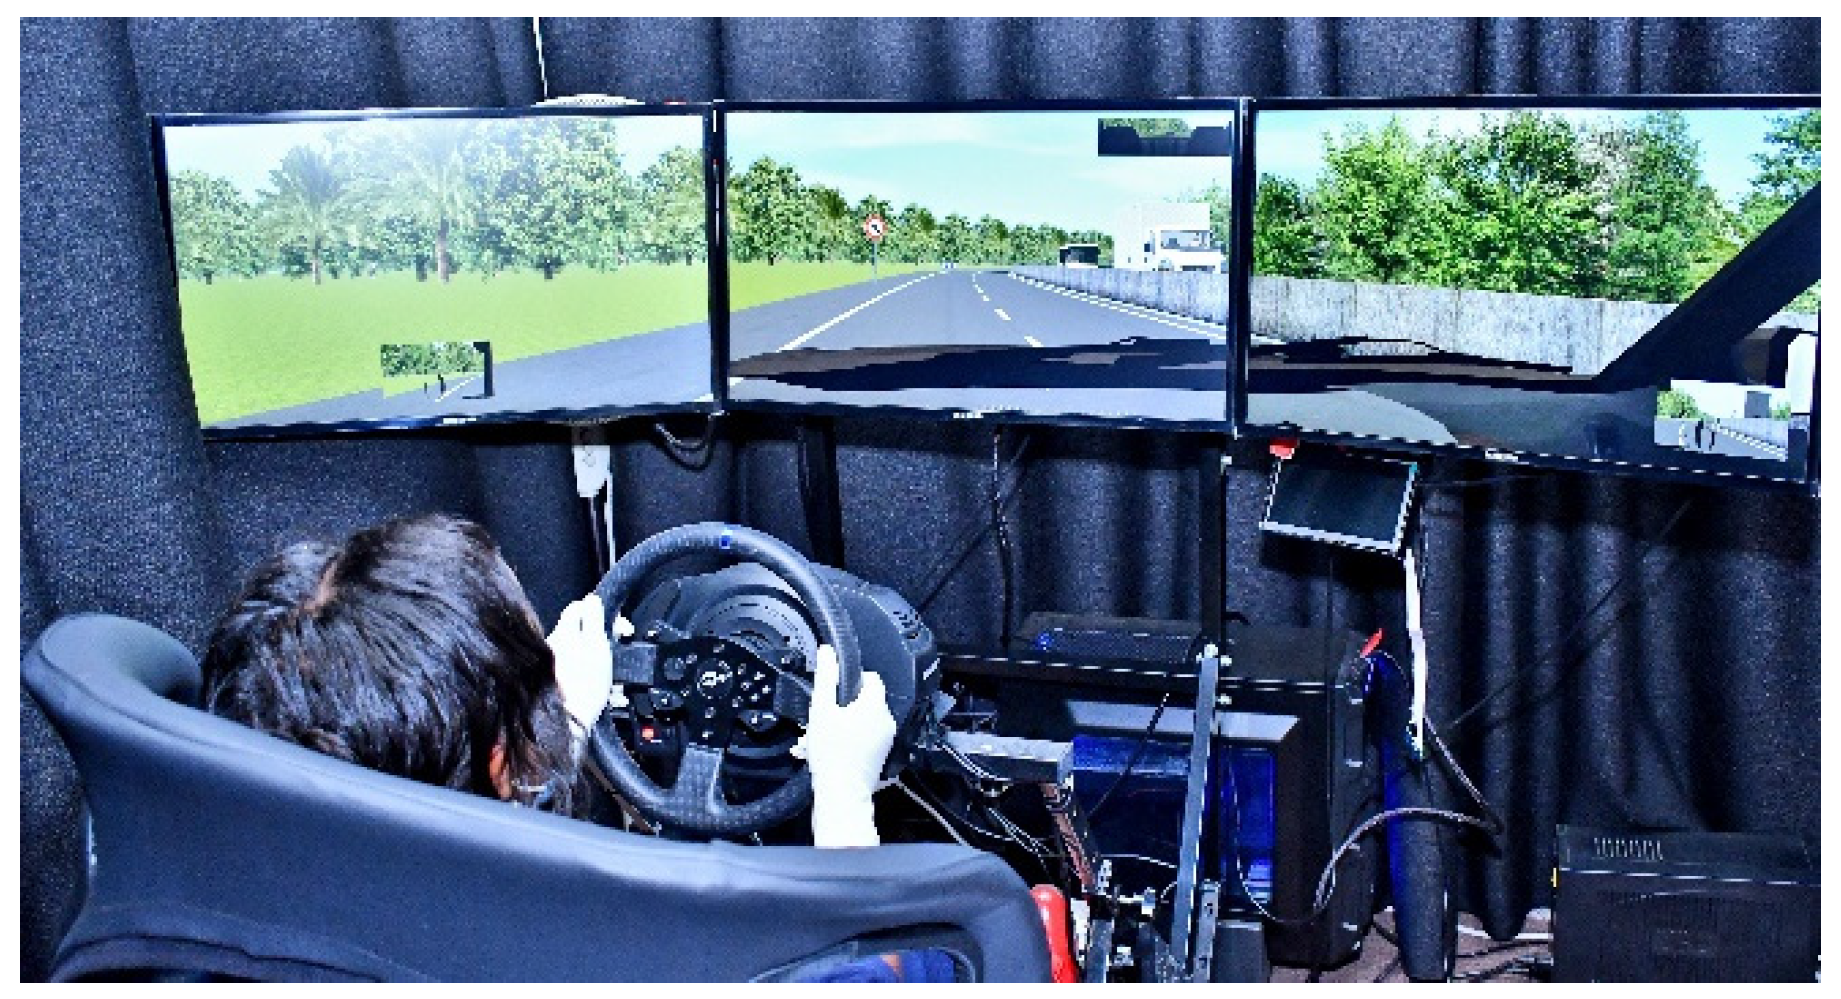
2.1. Study Population and Data Description

A driving simulator was used to collect data for this study. It is very dangerous to conduct trials in a real-world environment, but a driving simulator provides an excellent tool for collecting data in a safe environment [16,17]. The 3.5 km Mbagathi way in Nairobi, Kenya, was modeled in the driving simulator at the Strathmore University Business School’s Institute of Healthcare Management. The simulations included 80 participants who were selected using the snowball approach. The participants were required to hold a valid driver’s license and to have more than two years of driving experience. An informed consent form was administered to each participant, and they were briefed on why they were selected and informed of the importance of participating in the study. Weather, speed limit, lane width, and road layout served as the primary determinants of the scenarios. The driving simulator has a driving seat, a powerful simulation computer, three screens that display the driving scenarios, an observer screen, a 7″ tablet that displays the speedometer, a steering wheel, a clutch, a gear stick, an accelerator, and brakes. Figure 2 shows a participant driving along the simulated road during the experiment. The simulations were based on two scenarios that included before and after treatments.

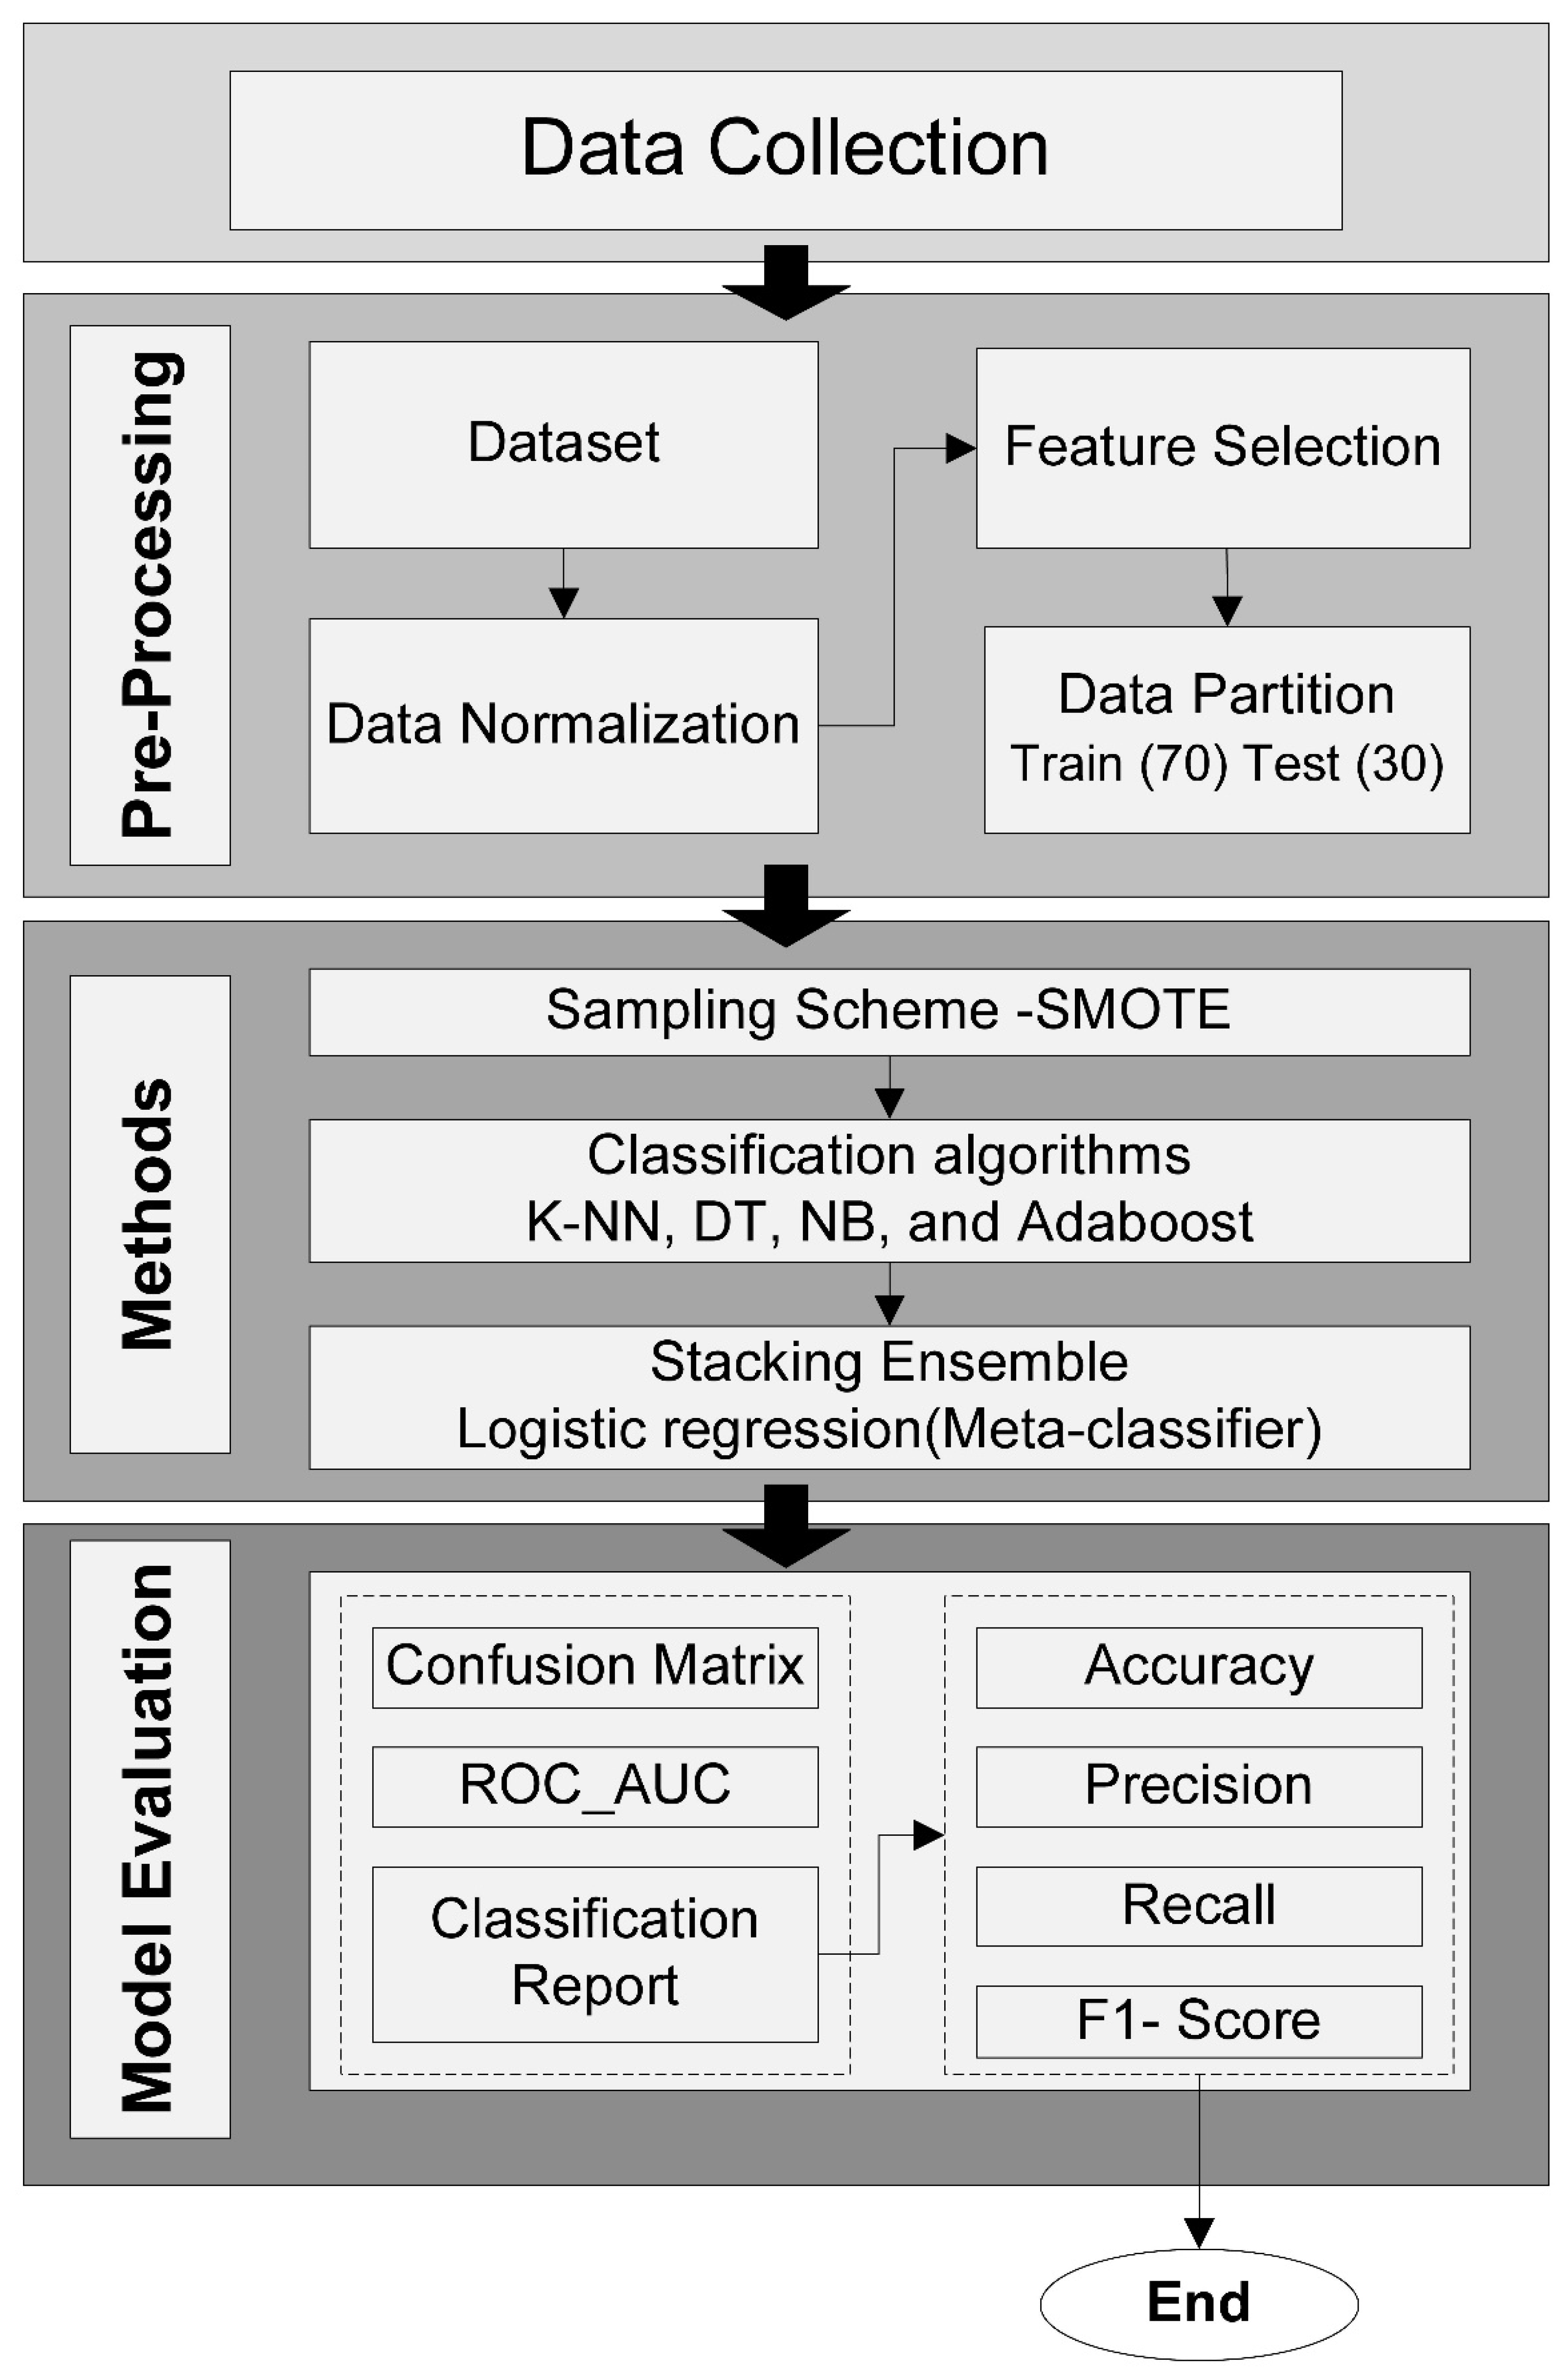
2.2. Data Preprocessing

The data with 15 features were loaded into the panda dataframe object to facilitate various preprocessing procedures. First, the data set was normalized using 15 features, after which missing values were discovered in some of the fields. Since the missing values would affect the performance of the model, we replaced the blank and null feature values by applying the mean value of the relevant feature column [18,19]. The mean values that were used to fill the missing feature records presented no extreme values that could have affected the mean.

Feature Selection

Feature selection is a critical factor in obtaining an accurate prediction. Using all the features leads to an inefficient model because, as the number of features increases, models struggle for accuracy, and hence model performance is reduced [20]. In this study, we used Sklearn, a Python library, to select the features. To obtain the most important features for this study, we employed four algorithms: particle swarm optimization (PSO), univariate feature selection, recursive feature elimination, and feature importance.
  • Particle swarm optimization (PSO) algorithm: This technique works by searching for the optimal subset of features. It locates the minimum of a function by creating several ‘particles’. These particles store their best position, as well as the global position. It is this combination of local and global information that gives rise to ‘swarm intelligence’ [21]. In our study, we implemented XGBoost and linear regression algorithms to select the best features.
  • Recursive feature elimination: This technique works by selecting the optimal subset of features for estimation by iteratively reducing 0 to N features [22]. The best subset is then chosen based on the model’s accuracy, cross-validation score, or Roc-Auc curve.
  • Univariate feature selection: This approach works by selecting the optimal features using univariate statistical tests. It might be considered a stage in the estimator’s preprocessing process [23]. In our study, we implemented the chi-squared statistical test using the SelectKBest method.
  • Feature importance: This works by classifying and evaluating each attribute to create splits. Decision tree models that are developed on ensembles; for example, extra trees and random forests can be used to rank the relevance of certain features [24]. In our study, we employed the extra trees classifier for feature selection.
After performing the feature selection algorithms, we selected the top six features, as shown in Table 1, based on the selected features algorithms.
Three techniques, univariate feature selection, recursive elimination method, and feature importance had the top six common features, while the PSO algorithm had four features in common with the other three techniques. For this study, we employed the PSO feature selection method because the performance of the model was not affected when evaluating the model using the features selected by the other three techniques.

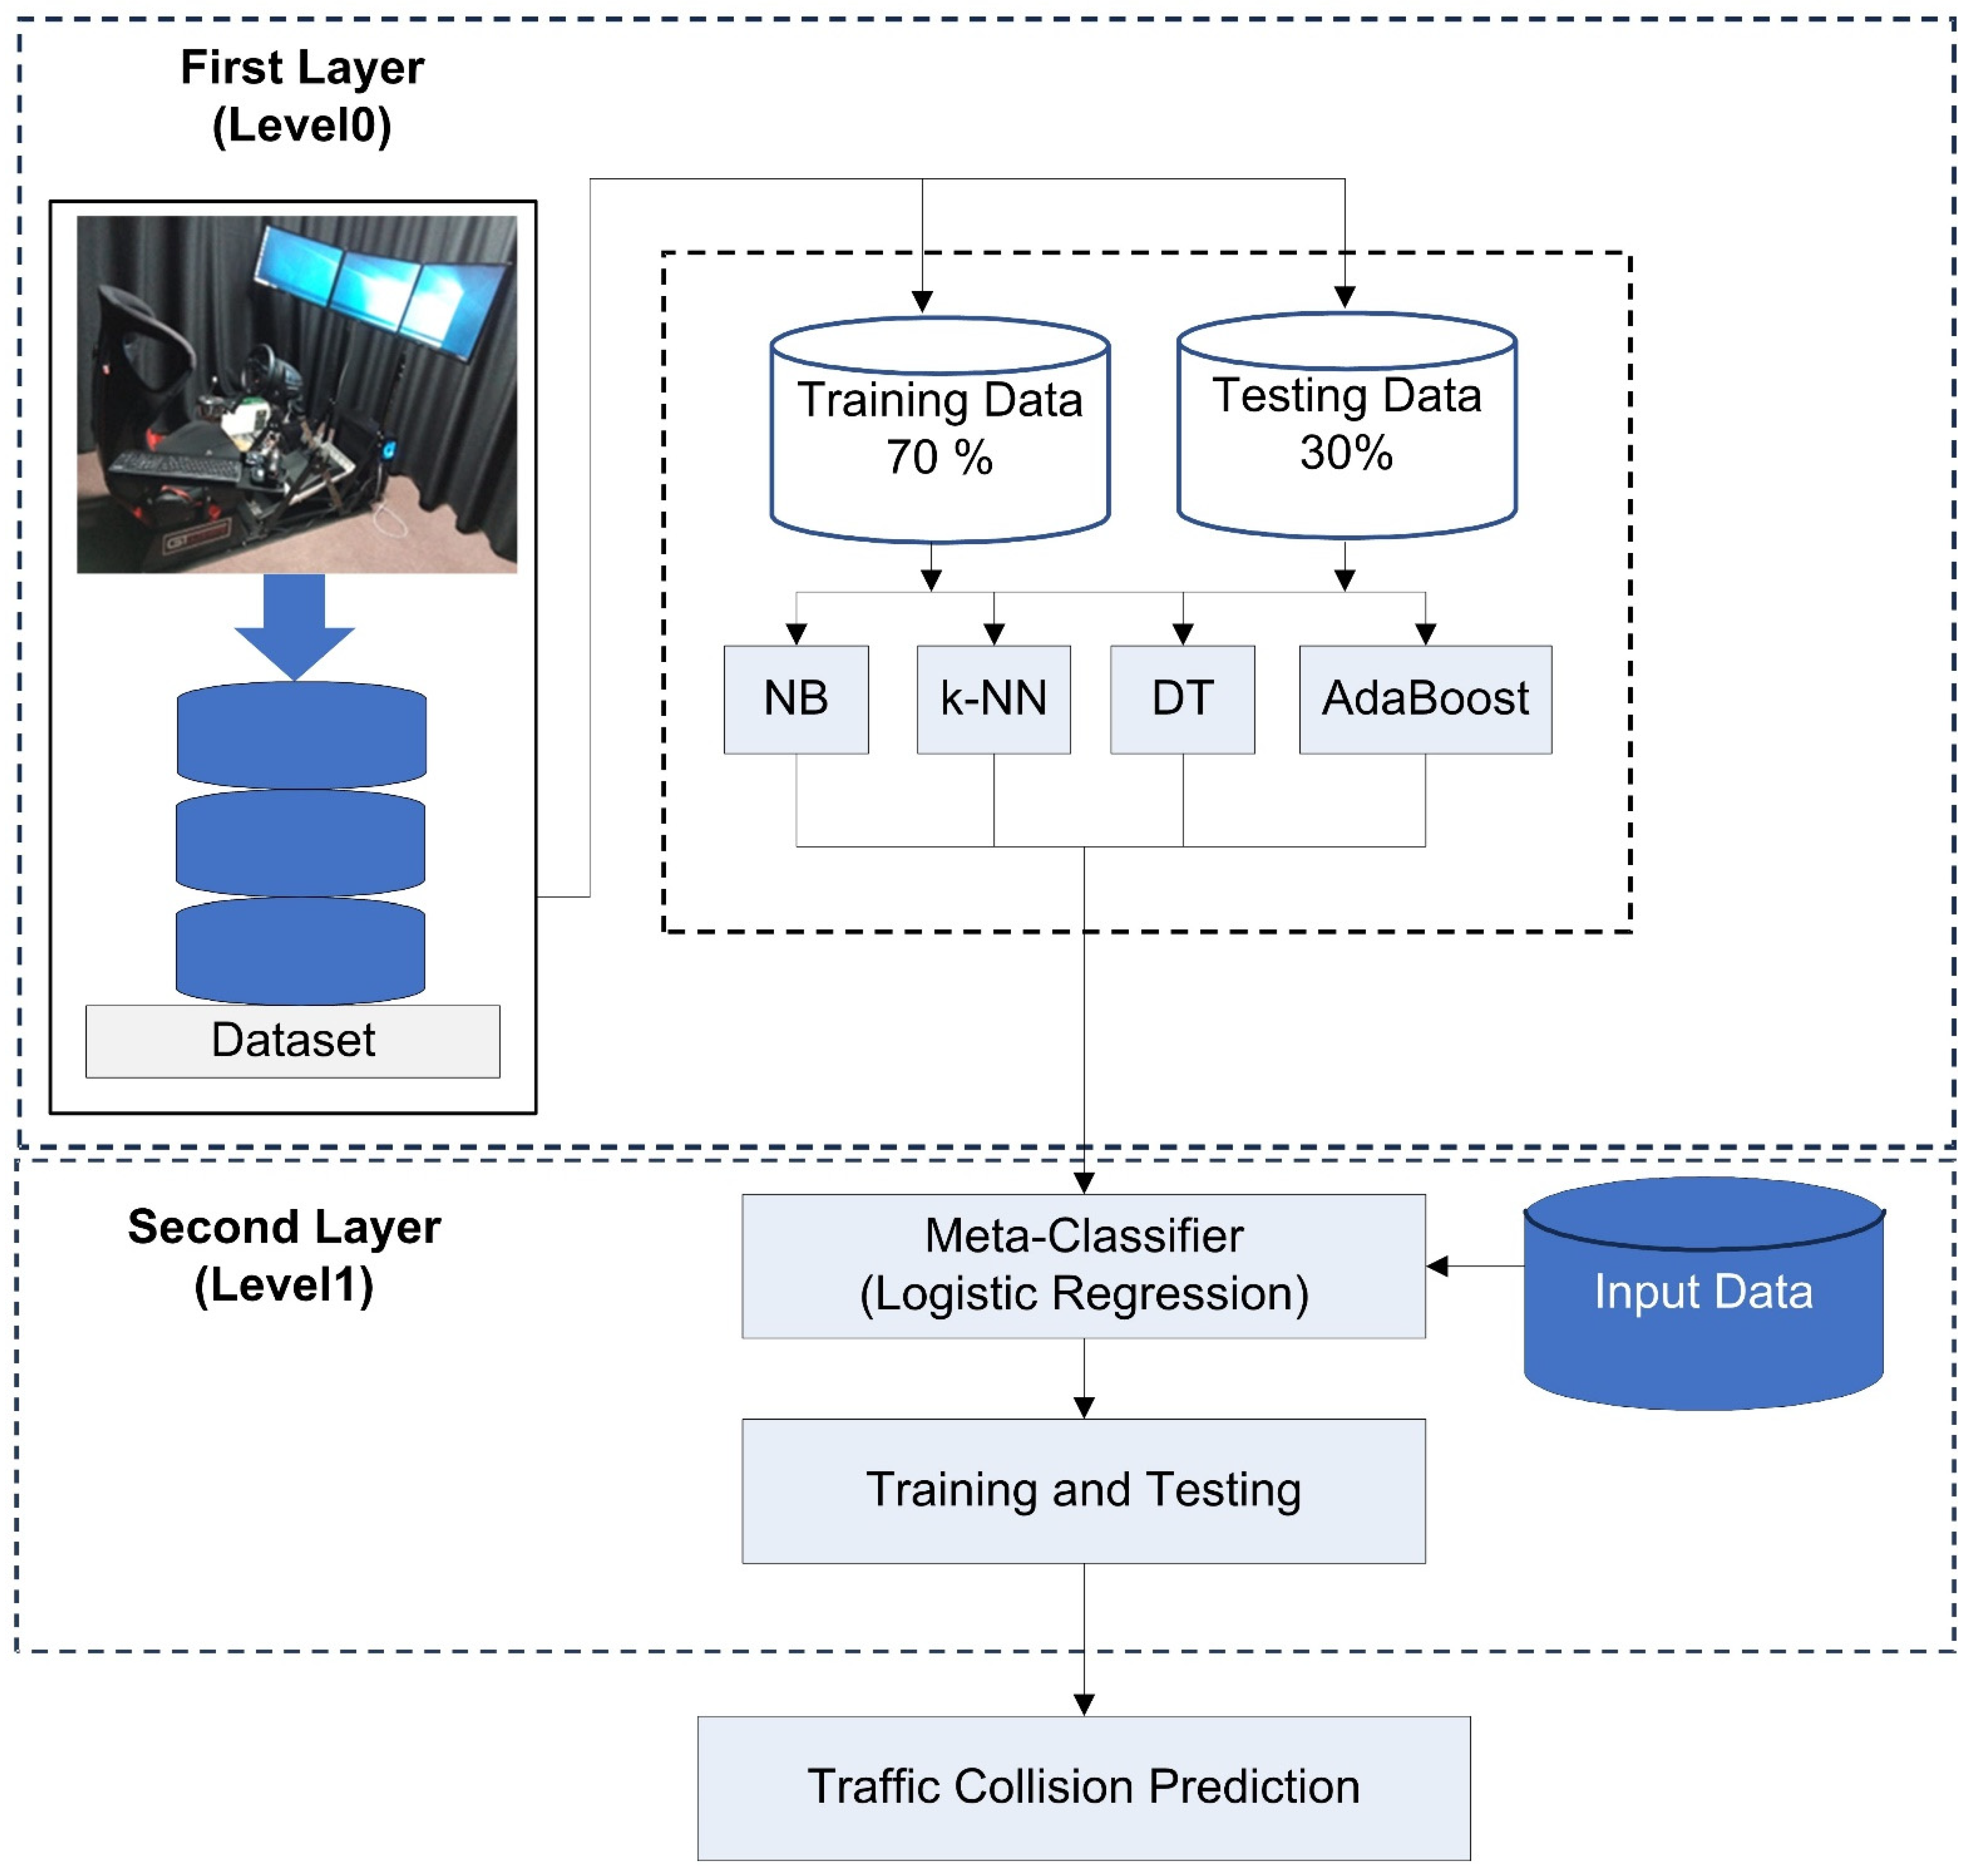
2.3. Building the Two-Layer Ensemble Model

We evaluated the performance of machine learning approaches by splitting the dataset in the ratio of 70% training dataset and 30% testing dataset. In our research, we employed four well-known classification algorithms (previously used to predict road traffic collisions) and the stacking ensemble method to predict road traffic collisions. Stacking is an ensemble method for integrating numerous models with a meta-classifier. Following the development of the base models, the four base models (level-0)—k-NN, AdaBoost, DT, and Naïve Bayes—were integrated using a stacking framework for road collision prediction. We selected the four base models because of their proven diversity in predicting road collisions. In the second layer, logistic regression was employed as a meta-classifier to classify road collisions from the outputs of the base models. A 10-fold cross-validation technique was used to evaluate how well the models predicted traffic collisions [25]. The proposed two-layer ensemble model is shown in Figure 3. The following section expounds on the four supervised machine learning techniques and the stacking method employed in our study.
(i) Naïve Bayesian Classifier (NBC): This algorithm employs the theorem of Bayes. It works by estimating the probability of various classes based on a variety of features and allocates the new class to the class with the highest probability [26]. In our study, Gaussian NB was chosen because the feature set contained continuous variables. The NB is represented by the following formula:
P H E = P E H P H P E
where P(H|E) is the posterior probability of the hypothesis given that the evidence is true, P(E|H) is the likelihood of the evidence given that the hypothesis is true, P(H) is the prior probability of the hypothesis, and P(E) is the prior probability that the evidence is true. The posterior probability is mainly the probability of H being true given that E is true.
(ii) k-Nearest Neighbors (k-NN): This method can be considered a voting system in which the majority class determines the class label of a new data point among its nearest neighbors [27]. It then analyzes datasets, calculates the distance function and similarities between them, and groups them based on k values. In our study, the k value was obtained by performing several tests with values ranging from 1 to 50, and the prediction performance was compared to the k value. We plotted the accuracies for both training and test datasets, as shown in Figure 4. The performance of k-NN showed a drop in both the test and training datasets after adding neighbors; the drop continued for both until the point at which they converged. The test dataset improved with an increase in the number of neighbors from iteration 33 until they converged with the training dataset at neighbor 42. In the proposed model, we set the k value at 42 because this yielded the best results, and Euclidean distance was selected as the distance function [28].
The distance between the clusters is used to classify the new input data, and the closest cluster is allocated. The following formula illustrates the k-NN approach:
d x , y = i = 1 n ( y i x i ) 2
where x ,   y , are the two points in n-space, n is the number of input samples, and y i ,   x i   are the distance vectors starting from the original point.
(iii) Decision Trees (DT): This methodology is a nonparametric supervised learning method for classification and regression. The goal is to build a model that predicts the target variable’s value by learning simple decision rules based on data attributes [29]. This is shown by the mathematical formula below:
E n t r o p y :   i = 1 p l o g 2 p i
E n t r o p y S = p + l o g 2 p + p   l o g 2 p
Given that S is the sample of training examples and p+ is the proportion of the positive training examples, while p− is the proportion of the negative training examples. DT has an overfitting problem, and to overcome it, we used a pruning technique to remove splits with little information gained (DT). This simplifies the DT by reducing the time cost of training and testing; it also eliminates the problem of overfitting [30]. In our study, increasing the tree depth in the early stages resulted in a corresponding improved performance of the training dataset and reduced performance of the test dataset. As the tree depth grows, a corresponding improvement is noted on both the training and test datasets up to the depth of 4. Depth 5 reveals that the model overfits the training dataset at the expense of the test dataset. as shown in Figure 5. In our study, we set the maximum tree depth at 4.
(iv) Adaptive Boosting (AdaBoost): AdaBoost is a classification method that repeatedly calls a given weak learner algorithm over a number of rounds. In the training dataset, each instance is weighed, and overall errors are calculated. More weight is given when it is difficult to predict, and less weight is given when it is simple to predict [31,32]. The AdaBoost approach has a weight that is represented as a vector for each weak learner. The input samples are illustrated in the following equation:
W e i g h t , w i = 1 n
where wi is the ith training instance weight and n is the number of training instances.
(v) Stacking ensemble method: Stacking is a method of integrating predictions from various machine learning models into the same dataset, such as bagging and boosting [33]. The stacking technique’s architecture consists of two or more models, known as base models or level-0, and meta-models that combine the predictions of the base models, known as level-1 models [34]. For our study, stacking was selected because the employed models are often distinct and fit the same dataset. Then, a single model was trained to integrate the outputs of the base as best as possible [35]. In our study, we implemented logistic regression as a meta-model to provide a seamless interpretation of the base models’ predictions.

2.4. Validation and Performance Measurement

We performed some steps in our experiment to develop the accident prediction model. The first step was to partition the dataset in the ratio of 70% training and 30% testing data. The accuracy was assessed using a 10-fold cross-validation technique during the second stage. The entire dataset was divided into 10 subsets at random, with each subset being used as testing data along with the other nine subsets.

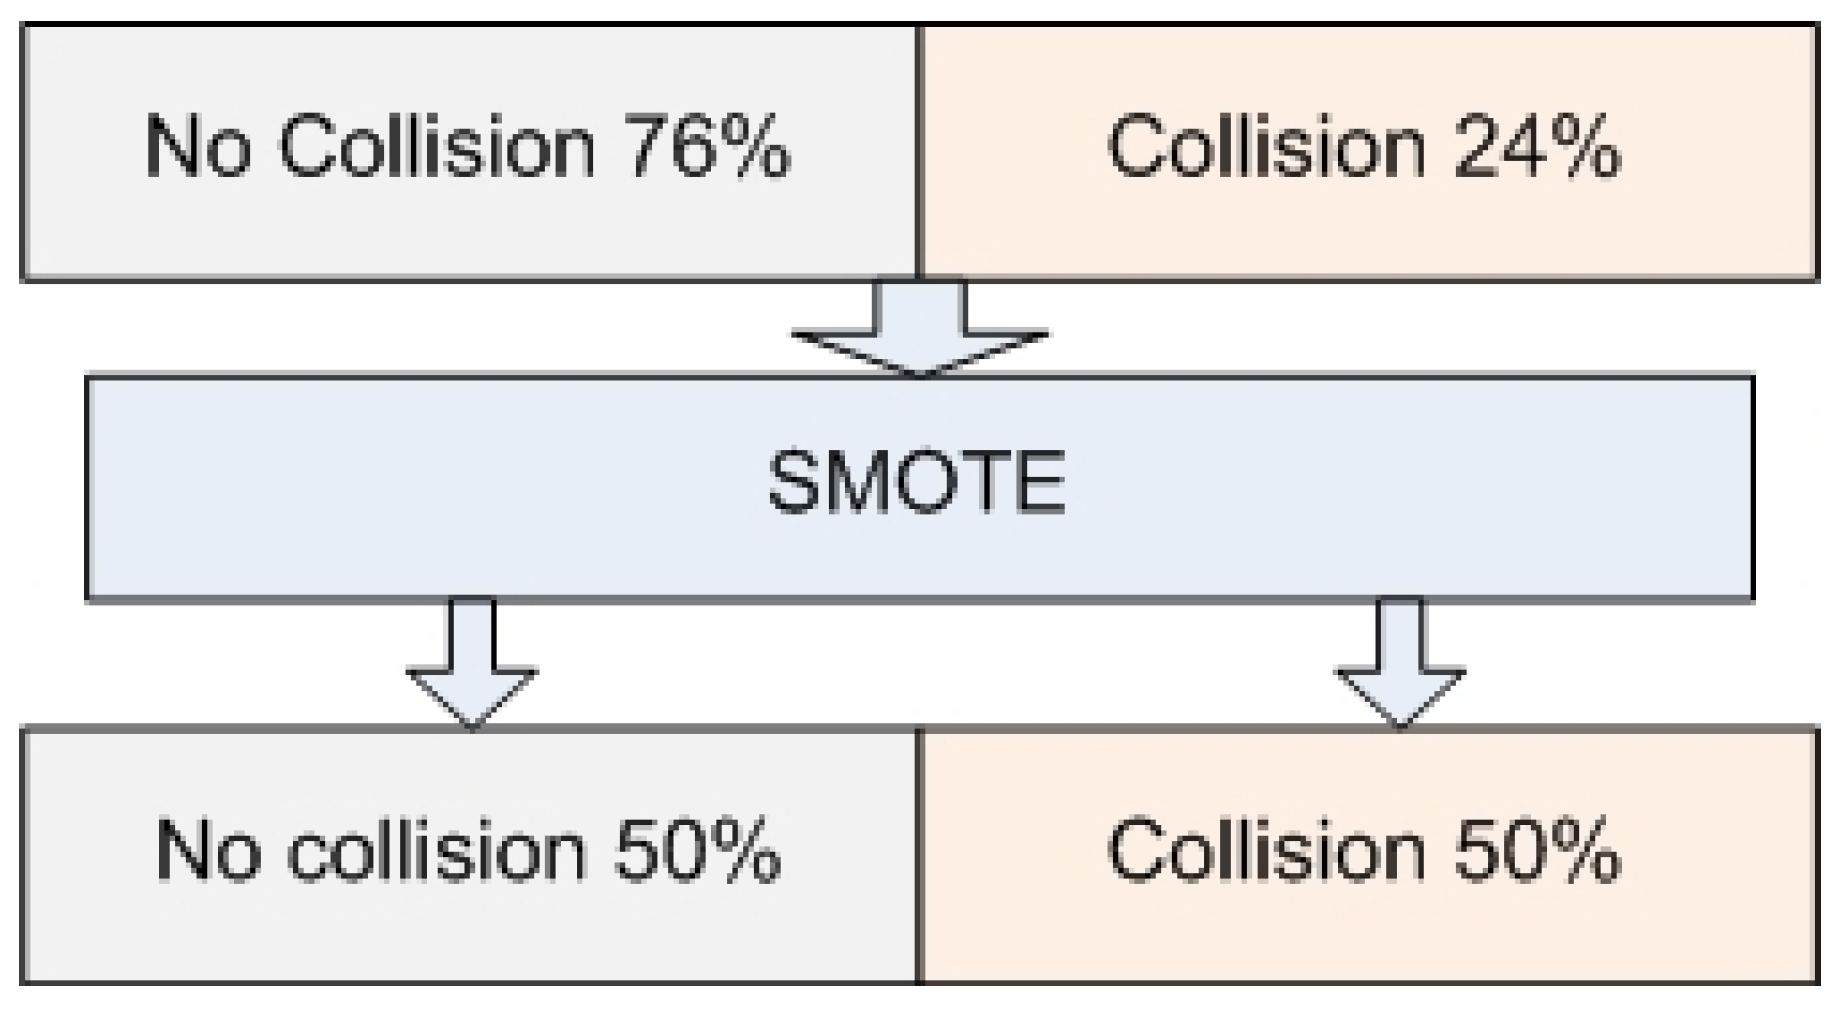
2.5. Data Oversampling

There are limitations associated with working with a binary classification when dealing with imbalanced datasets [36]. Oversampling was chosen to mitigate the effect of any underlying samples with underrepresentation. Across most of the datasets considered to be imbalanced, sampling strategies have been implemented to improve the overall model’s accuracy [37,38]. One of the most important aspects to note is that oversampling is not considered to create any new data instances, as this can result in overfitting; conversely, undersampling may exclude important samples from the learning process, meaning that the most useful data instances may be overlooked by the model [39].
In this study, our dataset was imbalanced, and we therefore performed a synthetic minority oversampling technique (SMOTE) resampling strategy to handle the data imbalance [40]. The SMOTE algorithm develops synthetic positive cases to enhance the proportion of the minority class [41]. In our scenario, the data had 76% instances of no collision and 24% instances of collision, as shown in Figure 6.
The dataset before SMOTE is illustrated in Figure 7 as a scatter plot with many points spread for the majority class and a small number of points scattered for the minority class. Majority class 0 represents no collisions, and 1 represents collisions.
The transformed dataset was balanced after SMOTE, as shown in the scatter plot in Figure 8, in the ratio of 1:1.
The crash prediction model’s performance was evaluated using a classification report that included computed values of accuracy, precision, recall, and the F1 score of the algorithms. Our model suffered from underfitting because the outputs of the base layer model were used in the second layer, and to overcome the problem of underfitting in our model, some input features from Table 1 that were used in the base layer models were reduced and used together with the output of the base layer models. The reason for this approach was to improve the model. Logistic regression was used to train the level-1 input features as a meta-classifier. The test data set was then used to evaluate the two-layer ensemble model. The model with the highest values of the metrics was considered the best prediction model.
The data generated by the confusion matrix were used to test each model’s performance metric. The outcomes of the initial and predicted classifications generated by a classification model comprise the confusion matrix (CM) [42]. Table 2 shows a representation of a confusion matrix.
The confusion matrix layout shown above displays the actual classes in the rows and the predicted class observations in the columns.
The following defines each entity in CM:
In TN, the entities that are originally negative are appropriately classified as negative.
In FN, the entities that are originally positive are wrongly classified as negative.
In TP, the entities that are originally positive are appropriately classified as positive.
In FP, the entities that are originally negative are incorrectly classified as positive.
The observations of the confusion matrix for every model were used to calculate the following performance metrics and evaluate model performance based on these metrics:
Accuracy represents the percentage of the total number of instances that were correctly classified, as shown by the equation below:
A c c u r a c y   A C = T P + T N T P + T N + F P + F N
Recall represents the percentage of positive events that were correctly classified, as shown by the following equation:
R e c a l l R = T P T P + T N
Precision represents the percentage of correctly predicted positive instances, as shown by the equation below:
P r e c i s i o n P = T P T P + P
F1 measure: The performance of the model is measured using the F1 measure that represents the harmonic mean of Recall and Precision. Its value is in the range of 0 to 1, with 1 denoting the best model and 0 denoting the poorest model. F1 is represented by the equation below:
F 1 = 2 R P R + P
Error rate represents the frequency of miscalculation of the predictions, as depicted in the equation below.
E r r o r r a t e E R = 1 A c c u r a c y

3. Results

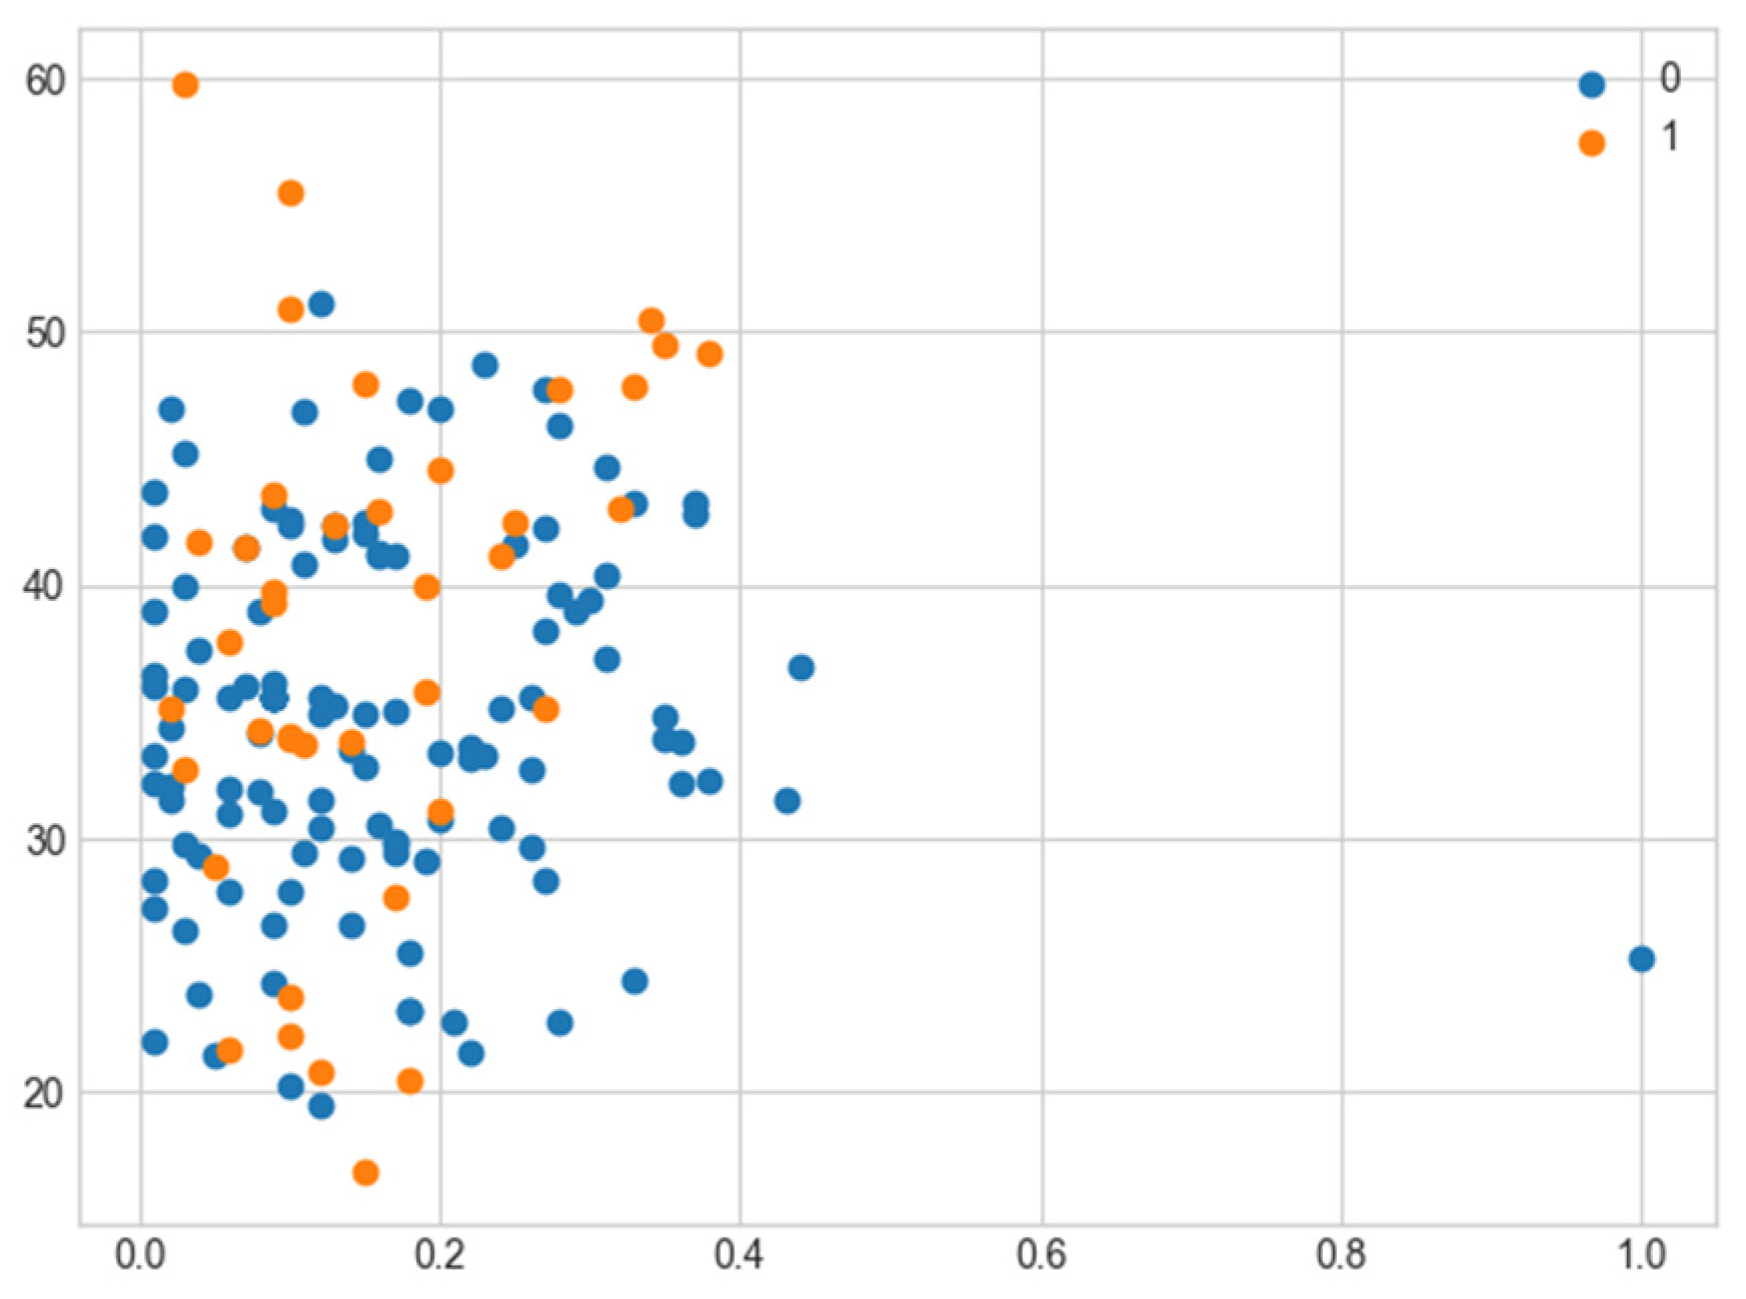
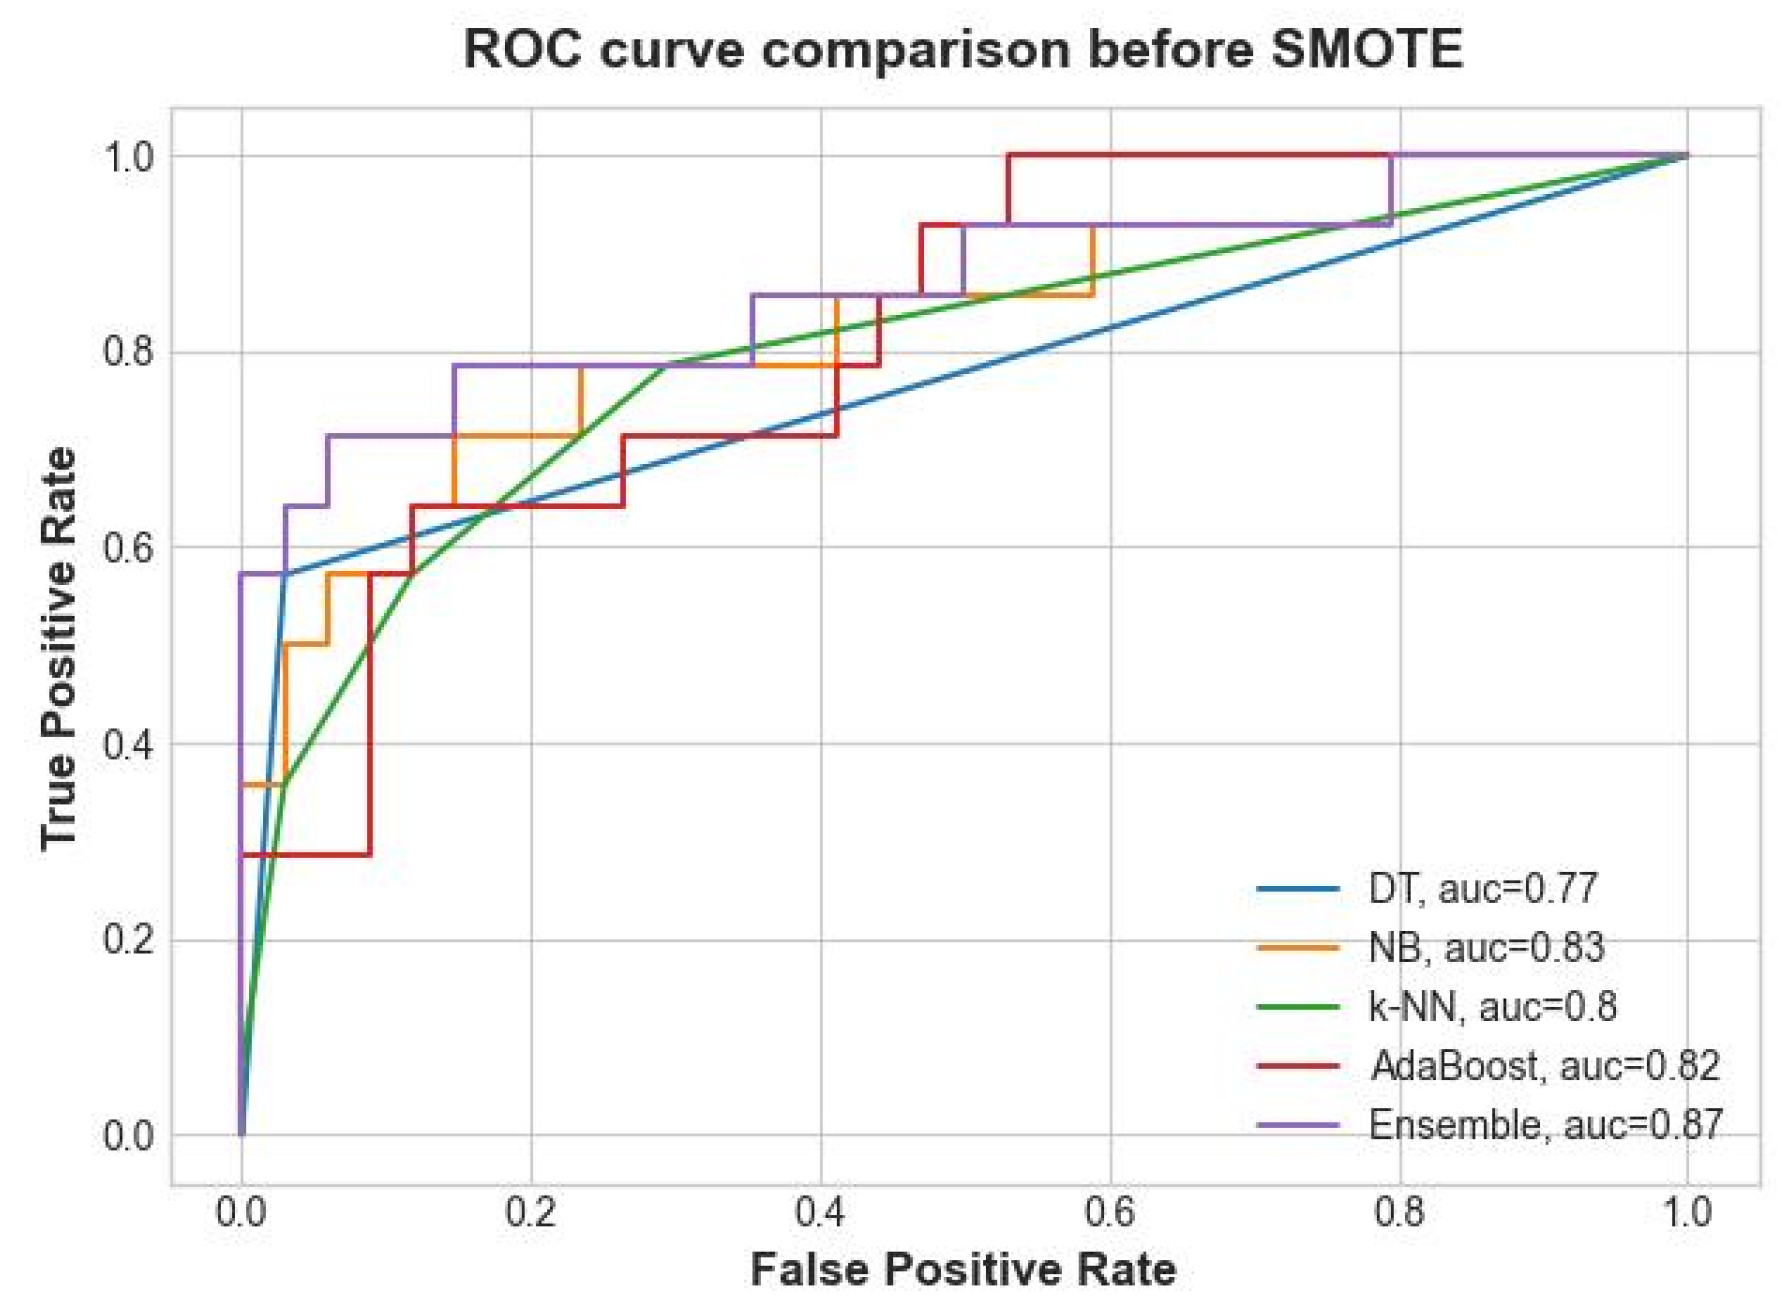
3.1. Results of the Classification before SMOTE

Since we wanted to predict the occurrence or absence of a road traffic collision, our problem was a binary classification [43]. In this study, the data sample from the driver simulation was split into 30% training data and 70% test data. The model’s predictive performance on the test dataset was evaluated by comparing accuracy, precision, and F1 scores. The effectiveness of each algorithm has been determined from the simulation driver data by employing AdaBoost, DT, NB, and k-NN as base models using the same selected feature set, then employing the stacking ensemble method using logistic regression as a meta-classifier to improve the model’s accuracy. We performed two scenarios: the first without SMOTE, and the second with SMOTE. Before pruning DT and setting the k value for k-NN, DT achieved the highest accuracy of 87%, followed by the two-layer ensemble with 85%, and Naïve Bayes with 83%. AdaBoost and k-NN achieved a similar score of 79% before the SMOTE technique, as illustrated in Table 3.
The robustness of the ML model is largely assessed and validated using the area under the receiver operator curve (AUC). When the AUC is higher than 0.7, the developed model is said to have good predictive power. Before SMOTE, the two-layer ensemble had an area of about 0.87%, followed by the NB algorithm at 0.83%, AdaBoost at 0.82%, k-NN at 0.8%, and DT at 0.77%, as shown in Figure 9. The experiment was conducted before implementing pruning on DT and setting the k value on k-NN.

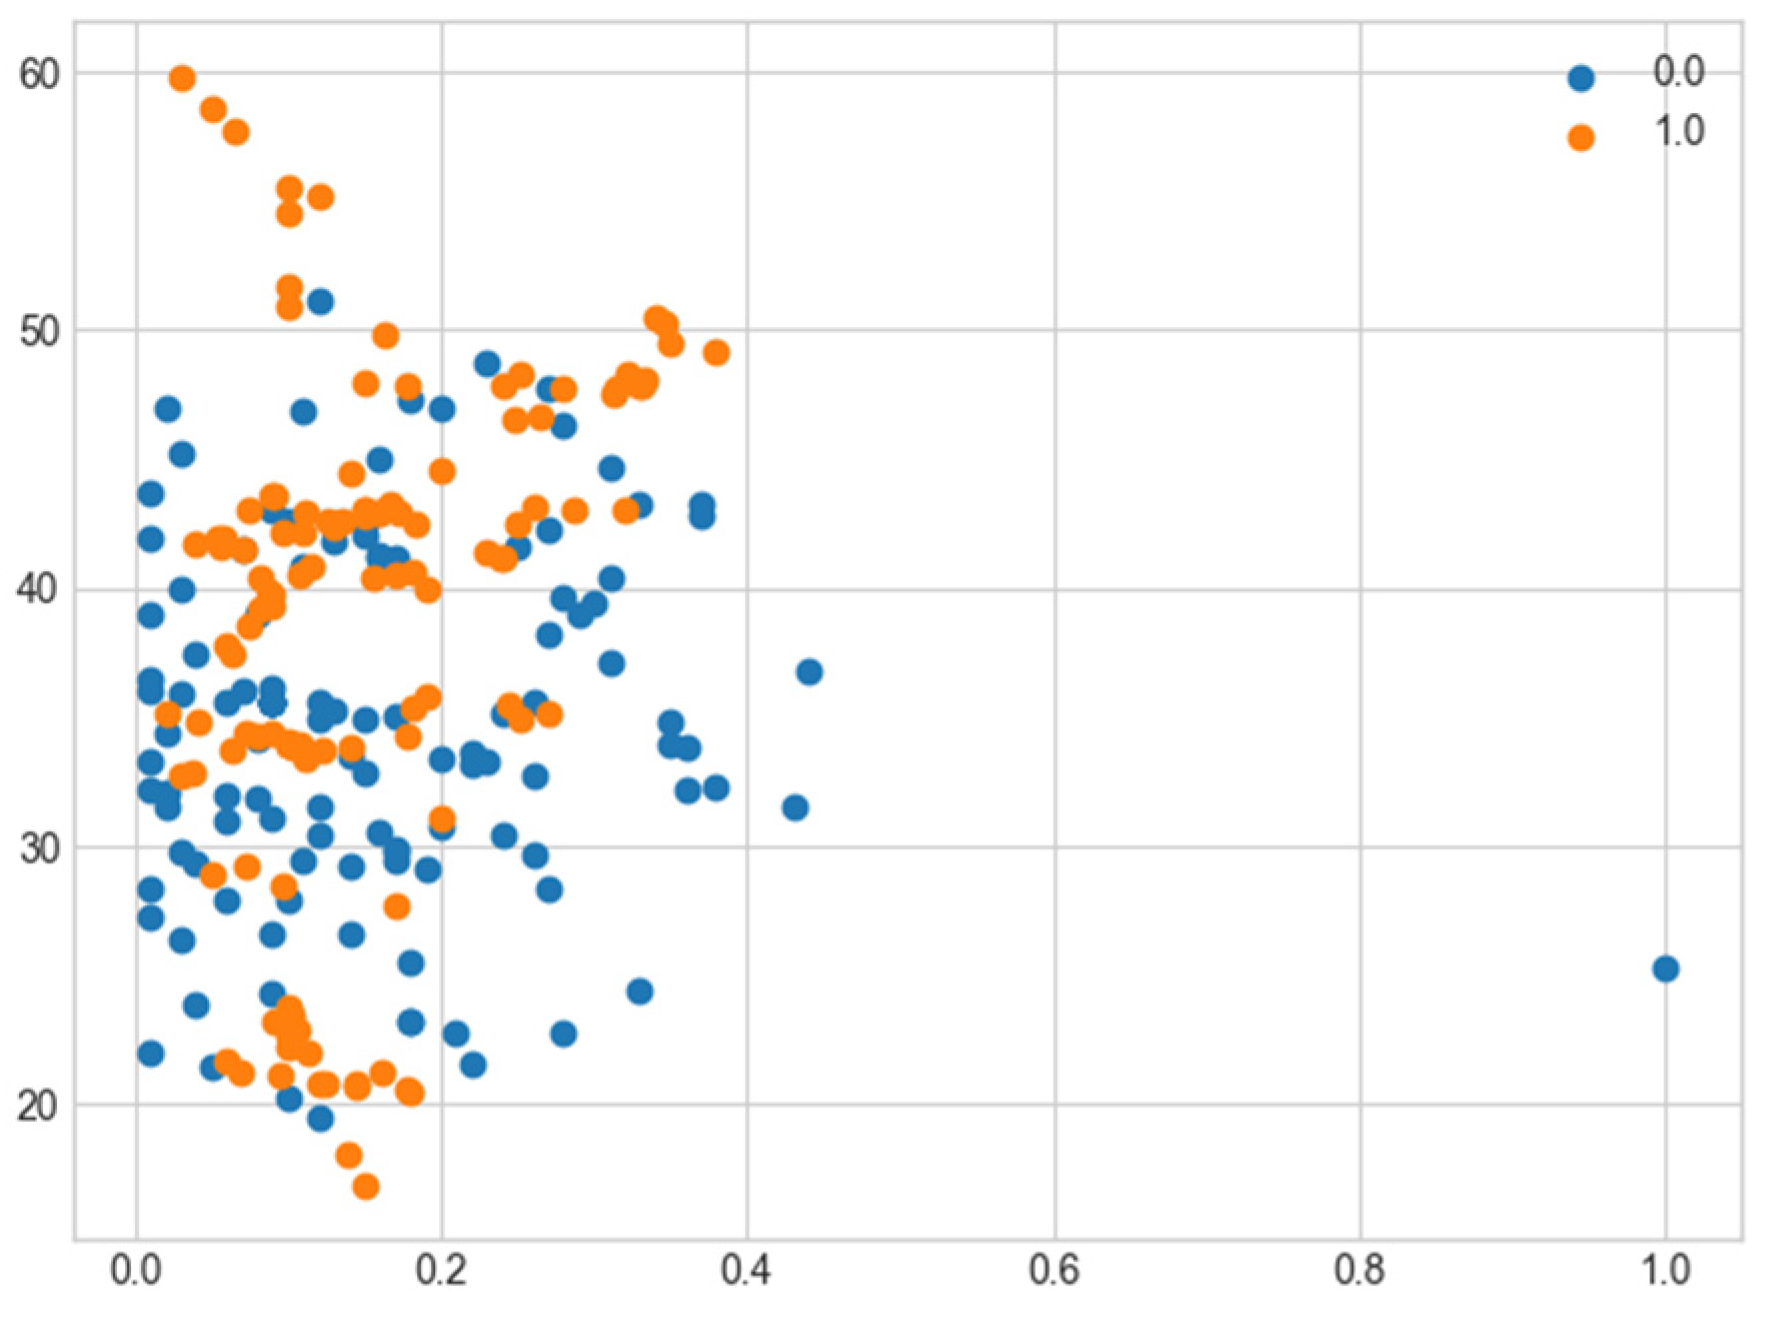
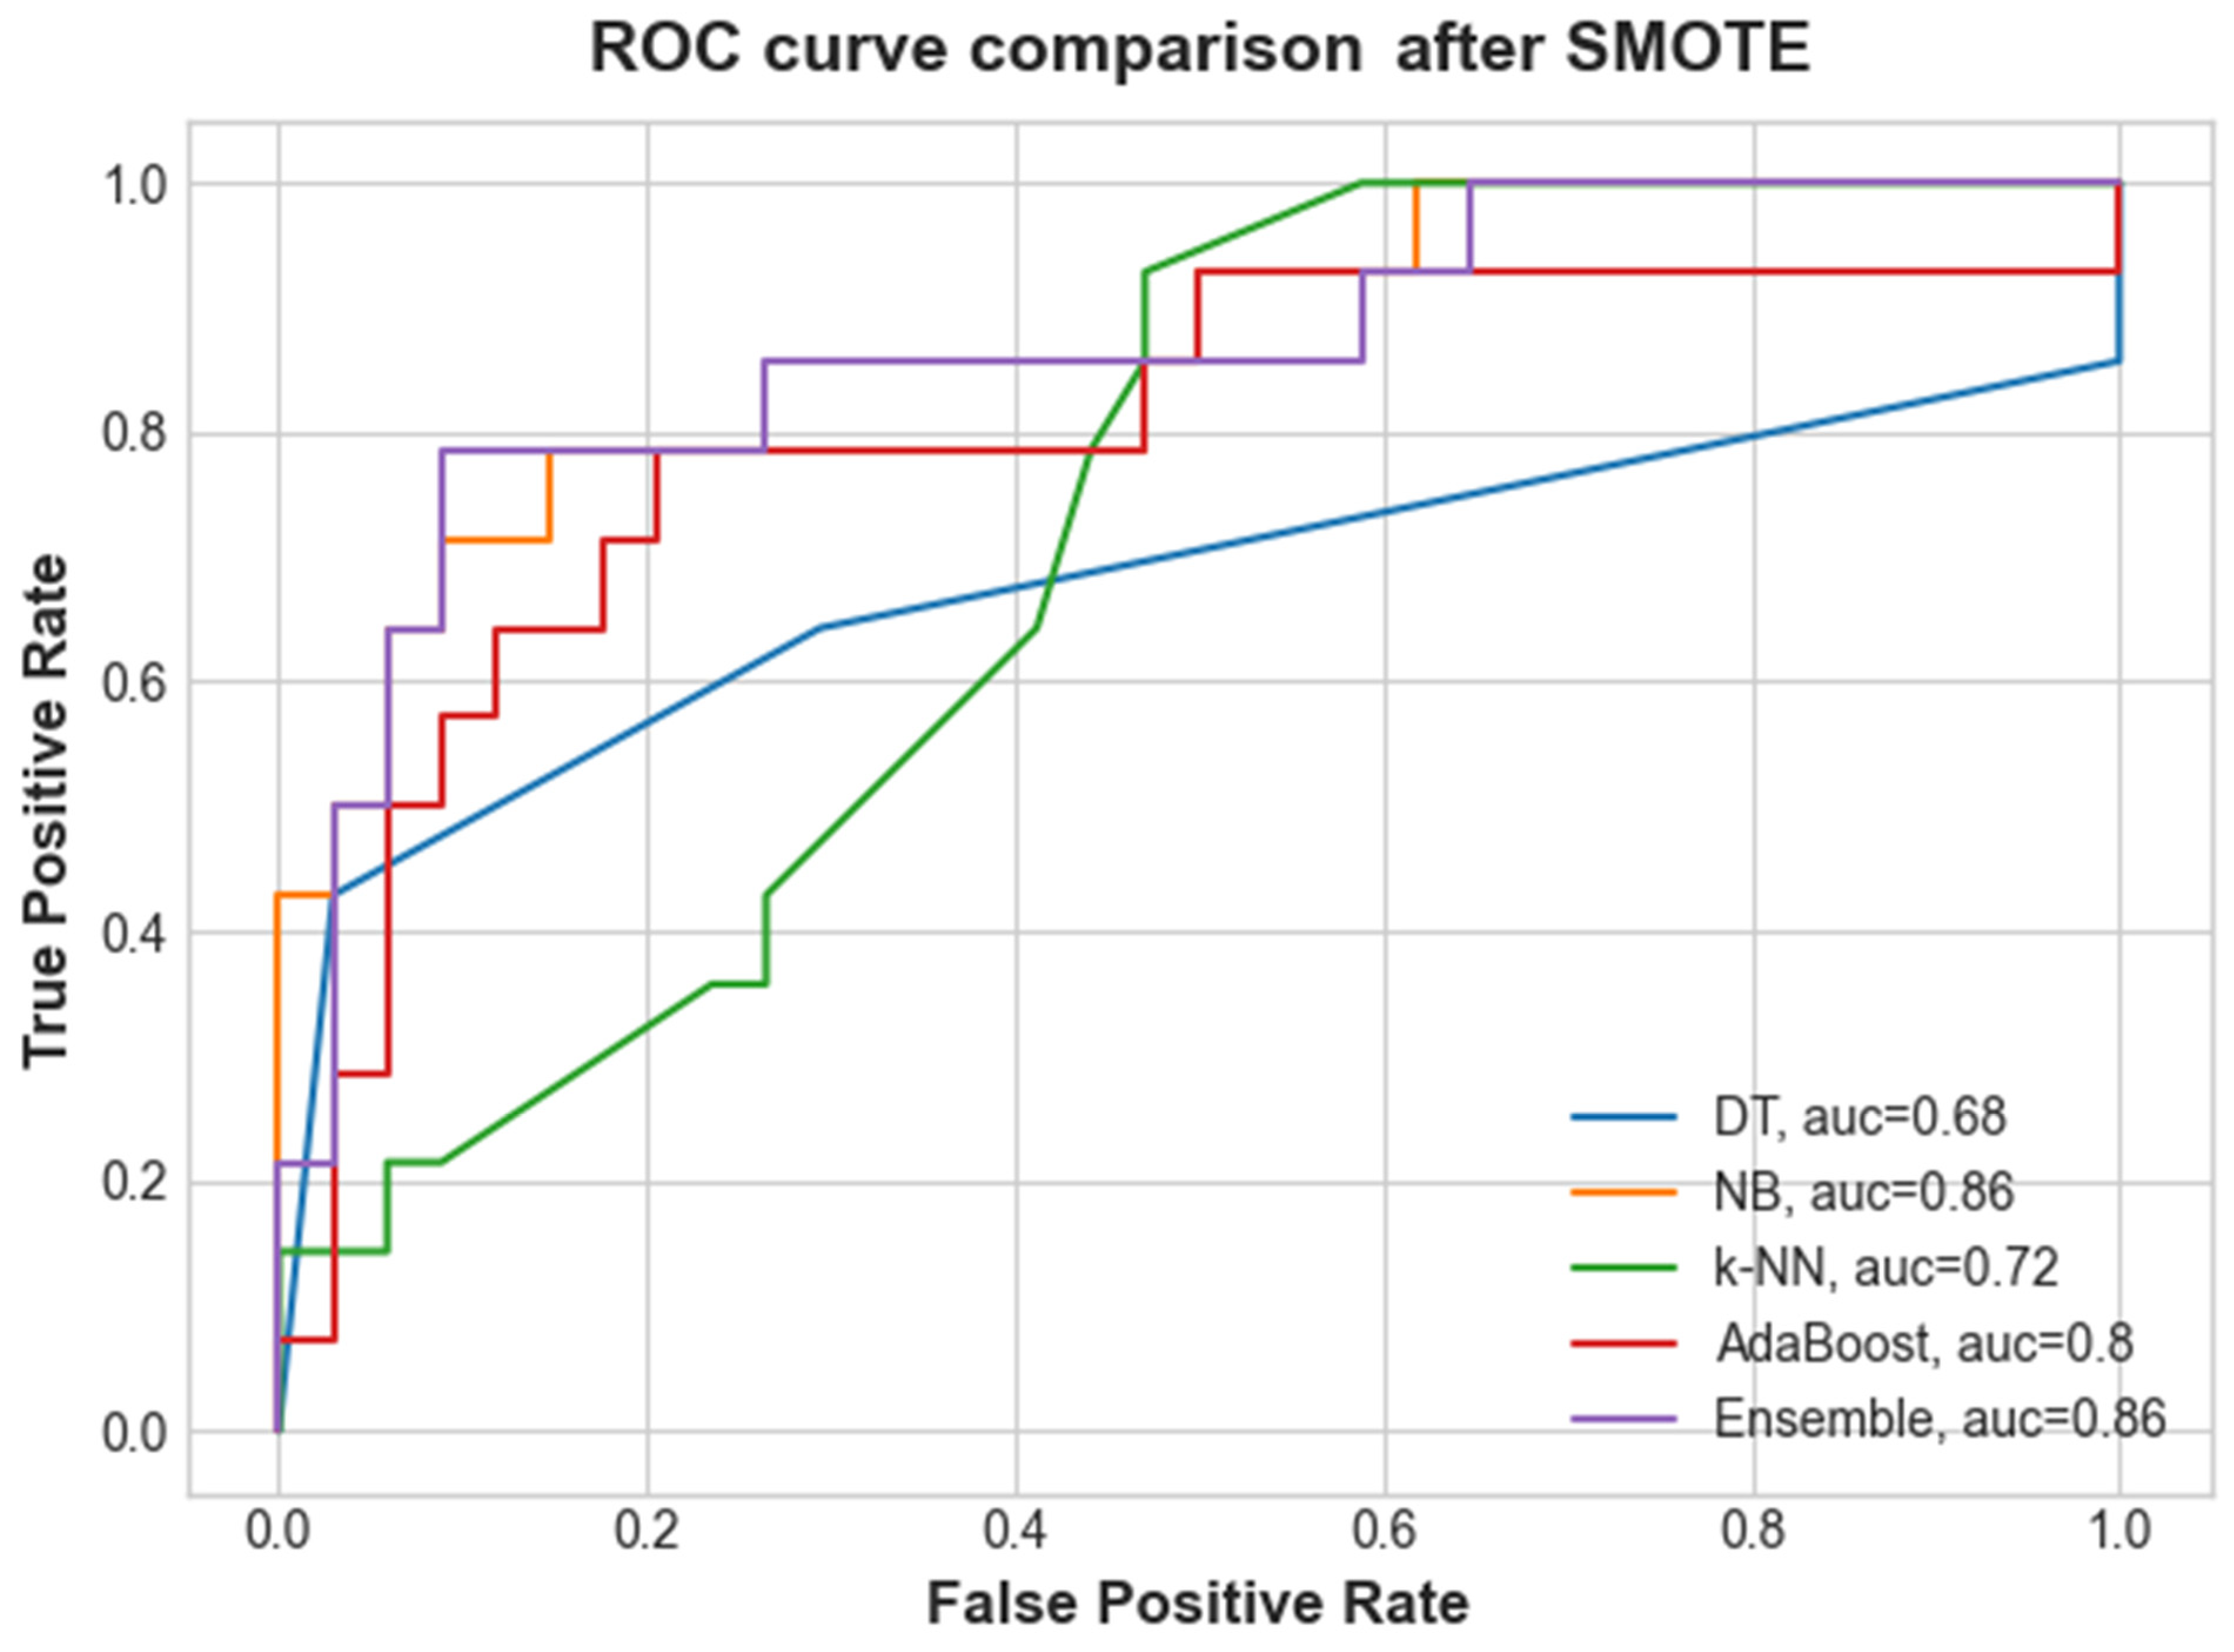
3.2. Results of the Classification after SMOTE

The AUC scenarios were also compared: one without any resampling technique and one with a resampling strategy applied. However, after the SMOTE resampling strategy, pruning DT due to overfitting, and setting the k value for k-NN, NB had an improved AUC of about 0.86%. AdaBoost remained unchanged, while a decrease was noted in the two-layer ensemble, DT, and k-NN, as shown in Figure 10.
Overall, among all the base models, the recall value was improved in AdaBoost and the proposed two-layer ensemble when applying SMOTE, while a decrease was noted in DT, k-NN, and NB, as shown in Table 4. The precision of the model after applying SMOTE was reduced on DT, k-NN, NB, AdaBoost, and the two-layer ensemble model. Based on the F1 score, a noticeable increase was noted in the two-layer ensemble model and AdaBoost, while the same was reduced in NB, DT, and k-NN. NB and AdaBoost achieved the highest accuracies of 81% and 79%, respectively, followed by DT at 77%, while k-NN achieved the lowest accuracy of 72% among the base models after SMOTE, as shown in Table 4. Looking at overall accuracy performance, the two-layer ensemble model achieved 85% accuracy.

3.3. Results of the Proposed Ensemble Model

Accuracy is a measure of the effectiveness of a single algorithm, but relying solely on accuracy as a measure of performance index can lead to erroneous conclusions, as the model may be biased toward specific collision classes [44]. To solve this limitation in our study, other performance measurement metrics, such as recall, F1 score, and precision, were evaluated. These performance indicators demonstrate the performance of individual collisions and allow better insights for the model. The outcomes of the “no collisions” and “with collisions” performance measurements are shown in Table 5 and Table 6, respectively.
The definition of precision and recall states that the optimum model is one that optimizes both performance measurements. The F1 score is also a good performance indicator because it interprets model performance using both precision and recall. In our study, all the models performed well for no collision, while k-NN, DT, and AdaBoost performed poorly for collisions. The two-layer ensemble and NB performed well for collisions, as shown in Table 5 and Table 6.
After evaluating the model using the stacking ensemble method with reduced features, there was a significant improvement in the predictive performance of the models. Table 7 shows the classification accuracy of each model. The two-layer ensemble achieved the highest accuracy of 0.88%, while NB had 0.81%, DT 0.81%, and AdaBoost 0.79%. k-NN achieved the lowest score of 0.65%.
Among the base models, NB had the highest F1 score performance, while k-NN had the lowest. Overall, the best F1 score was achieved by the two-layer ensemble model. Similarly, the proposed two-layer ensemble model had the best recall, while NB had the best recall among the base models, AdaBoost and DT had similar scores, and k-NN had the lowest recall score. The two-layer ensemble model had superior precision when compared with the other models, as shown in Table 7. The objective of the ensemble method is to predict road collisions by utilizing a minimal feature set, which may be acquired within a short period from the collision scene. Based on this prediction, policy makers, road constructors, and health facilities would be able to predict road traffic collisions at any given site and thus take all the measures required to avert collisions and save lives. The improved two-layer ensemble model demonstrates that it is the most effective method for predicting road collisions.

4. Discussion

The increase in road traffic collisions necessitates effective analysis and control of these collisions. The study adopted a unique methodological approach to propose a model that predicts road traffic collisions based on a dataset from a driving simulator. In the knowledge that it is very dangerous to conduct trials in a real-world environment, a driving simulator provides an excellent tool for collecting data in a safe environment devoid of life-threatening risks and damage to property. The dataset from the simulator was downloaded and normalized using 15 features. We then performed feature selection engineering techniques to select the best features, thus reducing the likelihood of overfitting for our model. The best parameters of each model were determined by a 10-fold cross validation. The training set was partitioned into 10 equal subsets, with one subset serving as testing data and the remaining nine serving as training data. The process was then repeated using the entire 10 subsets, so that the whole dataset was used for validation. Our problem was one of binary classification, since our study focused on predicting the occurrence or not of a collision [45]. Given the stochastic nature of collisions, which tend to be underrepresented in the dataset, a synthetic minority oversampling technique (SMOTE) was used to balance the classes in the training dataset. Crash prediction offers a proactive approach to increasing road safety adherence and saving lives. Research into road safety has been of great interest to researchers, industry, and policy makers. Crash prediction remains complex and requires high dimensionality and large datasets to develop models that can effectively predict road traffic collisions [46].
Although depending on accuracy as a measure of a model’s performance can be misleading, the model might be biased toward one class. In the present study, to overcome these limitations, we determined other performance measures, such as precision, recall, and F1 score. To demonstrate the effectiveness of the proposed model, we compared it with existing works in the literature. Notably, the authors are aware of few works that have focused on crash prediction models based on a dataset from a driving simulator [47]. A comparison between the proposed two-layer ensemble approach and other works in the literature is presented in Table 8. The strategy was to include similar, closely related works that deployed the same methodologies. Our study findings align with the existing literature, but if a standard data collection format and a standard feature selection approach were to be standardized across the globe, the transferability, comparison, and usability of these models would be easy.

5. Conclusions

In this paper, we propose a two-layer ensemble model for predicting road traffic collisions. The two-layer ensemble method employed was created by combining the outputs of k-NN, DT, AdaBoost, NB, and logistic regression as a meta-classifier in the two levels. The models were compared in terms of accuracy, precision, recall, and F1 score. With the unique combination of the ML classifiers, the two-layer ensemble method achieved a remarkable accuracy of 88% in a 10-fold cross-validation, with precision at 86%, recall at 83%, and F1 score at 84%. Since traffic collisions are random, a model that can predict road traffic collisions in a timely manner by using a few input features is required. In practice, crash prediction is an important aspect for emergency services and trauma centers to estimate the potential risks resulting from collisions and accordingly equip the centers and other units with appropriate post-crash care equipment. For policy makers, the findings of this research can be implemented to formulate evidence-based policies, as opposed to the cause-and-effect approach that is common in most low- and middle-income countries. The two-layer ensemble model can then be used to predict road collisions and therefore save lives and prevent socioeconomic losses. Through validation, the proposed two-layer ensemble had the highest accuracy. One limitation of the proposed approach is the time it takes to run the model, which can be comparatively longer than individual models. Additionally, the dataset in this study was imbalanced; therefore, we applied SMOTE resampling strategy, although other advanced approaches could have been used to solve the issue of an imbalanced dataset. The dataset in this study was based on simulated crash data. We highly advocate for a common road collision data collection format to be used by traffic and policy enforcers worldwide.
The results in this study further show that the two-layer ensemble method not only provides practical solutions to improve predictive accuracy but also contributes to the theoretical understanding of machine learning concepts, such as bias–variance trade-off, model diversity, and statistical consistency. For future work, in order to improve prediction accuracy and road safety, we propose performing sensitivity analysis to select the best features, developing ensemble methods that can effectively integrate diverse sources of data, developing ensemble methods that can make real-time predictions and support decision making for drivers, traffic management systems, and emergency centers, and developing ensemble methods for anonymizing and securing sensitive road safety data.

Author Contributions

The authors confirm contributions to the paper as follows: study conception and design: J.O.O., K.O.O. and J.S.W.; methodology and data collection: J.O.O., K.O.O. and J.S.W.; findings analysis and interpretation: J.O.O., K.O.O. and J.S.W.; draft manuscript preparation: J.O.O., J.S.W. and K.O.O.; manuscript revision: K.O.O., J.S.W. and J.O.O. All authors have read and agreed to the published version of the manuscript.

Funding

This research received no external funding.

Data Availability Statement

The datasets analyzed during the current study are available from the corresponding author upon reasonable request.

Acknowledgments

We would also like to thank the NTSA, Kenha, KURA, Gilbert Kokwaro, Brenda Bunyasi, Annette Murunga, Kevin Otieno, and the Institute of Healthcare Management at Strathmore University Business School for their support during scenario modeling and development.

Conflicts of Interest

The authors declare no conflicts of interest.

References

  1. WHO. Death on Roads. Available online: https://extranet.who.int/roadsafety/death-on-the-roads/#deaths/per_100k (accessed on 16 December 2023).
  2. Road Traffic Injuries. Available online: https://www.who.int/news-room/fact-sheets/detail/road-traffic-injuries (accessed on 16 December 2023).
  3. NTSA. Report on Road Safety. 2022. Available online: https://www.the-star.co.ke/news/2023-01-18-4690-people-died-in-road-accidents-in-2022-report/ (accessed on 25 July 2023).
  4. Decade of Action for Road Safety. Available online: https://www.who.int/teams/social-determinants-of-health/safety-and-mobility/decade-of-action-for-road-safety-2021-2030 (accessed on 10 May 2023).
  5. Al Mamlook, R.E.; Ali, A.; Hasan, R.A.; Kazim, H.A.M. Machine Learning to Predict the Freeway Traffic Accidents-Based Driving Simulation. In Proceedings of the 2019 IEEE National Aerospace and Electronics Conference (NAECON), Dayton, OH, USA, 15–19 July 2019; pp. 630–634. [Google Scholar] [CrossRef]
  6. Li, Z.; Liao, H.; Tang, R.; Li, G.; Li, Y.; Xu, C. Mitigating the impact of outliers in traffic crash analysis: A robust Bayesian regression approach with application to tunnel crash data. Accid. Anal. Prev. 2023, 185, 107019. [Google Scholar] [CrossRef]
  7. Jamal, A.; Zahid, M.; Rahman, M.T.; Al-Ahmadi, H.M.; Almoshaogeh, M.; Farooq, D.; Ahmad, M. Injury severity prediction of traffic crashes with ensemble machine learning techniques: A comparative study. Int. J. Inj. Control. Saf. Promot. 2021, 28, 408–427. [Google Scholar] [CrossRef]
  8. Zheng, L.; Sayed, T.; Mannering, F. Modeling traffic conflicts for use in road safety analysis: A review of analytic methods and future directions. Anal. Methods Accid. Res. 2021, 29, 100142. [Google Scholar] [CrossRef]
  9. Bokaba, T.; Doorsamy, W.; Paul, B.S. Comparative Study of Machine Learning Classifiers for Modelling Road Traffic Accidents. Appl. Sci. 2022, 12, 828. [Google Scholar] [CrossRef]
  10. AlMamlook, R.E.; Kwayu, K.M.; Alkasisbeh, M.R.; Frefer, A.A. Comparison of Machine Learning Algorithms for Predicting Traffic Accident Severity. In Proceedings of the 2019 IEEE Jordan International Joint Conference on Electrical Engineering and Information Technology (JEEIT), Amman, Jordan, 9–11 April 2019; pp. 272–276. [Google Scholar] [CrossRef]
  11. Berhanu, Y.; Alemayehu, E.; Schröder, D. Examining Car Accident Prediction Techniques and Road Traffic Congestion: A Comparative Analysis of Road Safety and Prevention of World Challenges in Low-Income and High-Income Countries. J. Adv. Transp. 2023, 2023, 6643412. [Google Scholar] [CrossRef]
  12. Al-Nashashibi, M.; Hadi, W.; El-Khalili, N.; Issa, G.; AlBanna, A.A. A New Two-step Ensemble Learning Model for Improving Stress Prediction of Automobile Drivers. Int. Arab. J. Inf. Technol. 2021, 18, 819–829. [Google Scholar] [CrossRef]
  13. Ameksa, M.; Mousannif, H.; Al Moatassime, H.; Elassad, Z.E.A. Crash Prediction using Ensemble Methods. In Proceedings of the 2nd International Conference on Big Data, Modelling and Machine Learning, Kenitra, Morocco, 5–6 June 2021; SCITEPRESS—Science and Technology Publications: Kenitra, Morocco, 2021; pp. 211–215. [Google Scholar] [CrossRef]
  14. Amiri, P.A.D.; Pierre, S. An Ensemble-Based Machine Learning Model for Forecasting Network Traffic in VANET. IEEE Access 2023, 11, 22855–22870. [Google Scholar] [CrossRef]
  15. Yang, K.; Al Haddad, C.; Yannis, G.; Antoniou, C. Classification and Evaluation of Driving Behavior Safety Levels: A Driving Simulation Study. IEEE Open J. Intell. Transp. Syst. 2022, 3, 111–125. [Google Scholar] [CrossRef]
  16. Zhang, X.; Yan, X. Predicting collision cases at unsignalized intersections using EEG metrics and driving simulator platform. Accid. Anal. Prev. 2023, 180, 106910. [Google Scholar] [CrossRef]
  17. Xiao, W.; Luo, X.; Xie, S. Feature semantic space-based sim2real decision model. Appl. Intell. 2022, 53, 4890–4906. [Google Scholar] [CrossRef]
  18. Crowder, M.J.; Kimber, A.C.; Smith, R.L.; Sweeting, T.J. Statistical Analysis of Reliability Data, 1st ed.; Routledge: London, UK, 2017. [Google Scholar] [CrossRef]
  19. Shakil, F.A.; Hossain, S.M.; Hossain, R.; Momen, S. Prediction of Road Accidents Using Data Mining Techniques. In Algorithms for Intelligent Systems, Proceedings of International Conference on Computational Intelligence and Emerging Power System, Ajmer, India, 31 January 2021; Bansal, R.C., Zemmari, A., Sharma, K.G., Gajrani, J., Eds.; Springer: Singapore, 2022; pp. 25–35. [Google Scholar] [CrossRef]
  20. Remeseiro, B.; Bolon-Canedo, V. A review of feature selection methods in medical applications. Comput. Biol. Med. 2019, 112, 103375. [Google Scholar] [CrossRef]
  21. Cao, Y.; Liu, G.; Sun, J.; Bavirisetti, D.P.; Xiao, G. PSO-Stacking improved ensemble model for campus building energy consumption forecasting based on priority feature selection. J. Build. Eng. 2023, 72, 106589. [Google Scholar] [CrossRef]
  22. Zhang, A.; Patton, E.W.; Swaney, J.M.; Zeng, T.H. A Statistical Analysis of Recent Traffic Crashes in Massachusetts. arXiv 2019, arXiv:1911.02647. [Google Scholar] [CrossRef]
  23. Ascensión, A.M.; Ibáñez-Solé, O.; Inza, I.; Izeta, A.; Araúzo-Bravo, M.J. Triku: A feature selection method based on nearest neighbors for single-cell data. GigaScience 2022, 11, giac017. [Google Scholar] [CrossRef] [PubMed]
  24. Mittal, M.; Gupta, S.; Chauhan, S.; Saraswat, L.K. Analysis on road crash severity of drivers using machine learning techniques. Int. J. Eng. Syst. Model. Simul. 2022, 13, 154. [Google Scholar] [CrossRef]
  25. Seraj, A.; Mohammadi-Khanaposhtani, M.; Daneshfar, R.; Naseri, M.; Esmaeili, M.; Baghban, A.; Eslamian, S. Cross-validation. In Handbook of Hydroinformatics; Elsevier: Amsterdam, The Netherlands, 2023; pp. 89–105. [Google Scholar] [CrossRef]
  26. Santos, D.; Saias, J.; Quaresma, P.; Nogueira, V.B. Machine Learning Approaches to Traffic Accident Analysis and Hotspot Prediction. Computers 2021, 10, 157. [Google Scholar] [CrossRef]
  27. Xiao, J. SVM and KNN ensemble learning for traffic incident detection. Phys. A Stat. Mech. Its Appl. 2019, 517, 29–35. [Google Scholar] [CrossRef]
  28. Liu, L.; Özsu, M.T. (Eds.) k-Nearest Neighbor Classification. In Encyclopedia of Database Systems; Springer: Boston, MA, USA, 2009; p. 1590. [Google Scholar] [CrossRef]
  29. Abdullah, P.; Sipos, T. Drivers’ Behavior and Traffic Accident Analysis Using Decision Tree Method. Sustainability 2022, 14, 11339. [Google Scholar] [CrossRef]
  30. Lu, Y.; Ye, T.; Zheng, J. Decision Tree Algorithm in Machine Learning. In Proceedings of the 2022 IEEE International Conference on Advances in Electrical Engineering and Computer Applications (AEECA), Dalian, China, 20–21 August 2022; pp. 1014–1017. [Google Scholar] [CrossRef]
  31. Wang, C.; Wang, Y.; Zhang, X. A Study of Fatigue Driving Detection System Based on AdaBoost Algorithm. In Proceedings of the 2022 4th International Conference on Artificial Intelligence and Advanced Manufacturing (AIAM), Hamburg, Germany, 7–9 October 2022; pp. 32–35. [Google Scholar] [CrossRef]
  32. Zhao, H.; Yu, H.; Li, D.; Mao, T.; Zhu, H. Vehicle Accident Risk Prediction Based on AdaBoost-SO in VANETs. IEEE Access 2019, 7, 14549–14557. [Google Scholar] [CrossRef]
  33. Yang, L.; Zhao, Q. An aggressive driving state recognition model using EEG based on stacking ensemble learning. J. Transp. Saf. Secur. 2023. [Google Scholar] [CrossRef]
  34. Tang, J.; Liang, J.; Han, C.; Li, Z.; Huang, H. Crash injury severity analysis using a two-layer Stacking framework. Accid. Anal. Prev. 2019, 122, 226–238. [Google Scholar] [CrossRef] [PubMed]
  35. Wu, P.; Meng, X.; Song, L. A novel ensemble learning method for crash prediction using road geometric alignments and traffic data. J. Transp. Saf. Secur. 2020, 12, 1128–1146. [Google Scholar] [CrossRef]
  36. Ishaq, A.; Sadiq, S.; Umer, M.; Ullah, S.; Mirjalili, S.; Rupapara, V.; Nappi, M. Improving the Prediction of Heart Failure Patients’ Survival Using SMOTE and Effective Data Mining Techniques. IEEE Access 2021, 9, 39707–39716. [Google Scholar] [CrossRef]
  37. Jiang, Z.; Yang, J.; Liu, Y. Imbalanced Learning with Oversampling based on Classification Contribution Degree. Adv. Theory Simul. 2021, 4, 2100031. [Google Scholar] [CrossRef]
  38. Chawla, N.V.; Bowyer, K.W.; Hall, L.O.; Kegelmeyer, W.P. SMOTE: Synthetic Minority Over-sampling Technique. J. Artif. Intell. Res. 2002, 16, 321–357. [Google Scholar] [CrossRef]
  39. Lee, D.; Kim, K. An efficient method to determine sample size in oversampling based on classification complexity for imbalanced data. Expert Syst. Appl. 2021, 184, 115442. [Google Scholar] [CrossRef]
  40. Elassad, Z.E.A.; Mousannif, H.; Al Moatassime, H. Class-imbalanced crash prediction based on real-time traffic and weather data: A driving simulator study. Traffic Inj. Prev. 2020, 21, 201–208. [Google Scholar] [CrossRef]
  41. Sağlam, F.; Cengiz, M.A. A novel SMOTE-based resampling technique trough noise detection and the boosting procedure. Expert Syst. Appl. 2022, 200, 117023. [Google Scholar] [CrossRef]
  42. Theissler, A.; Thomas, M.; Burch, M.; Gerschner, F. ConfusionVis: Comparative evaluation and selection of multi-class classifiers based on confusion matrices. Knowl.-Based Syst. 2022, 247, 108651. [Google Scholar] [CrossRef]
  43. Mokoatle, M.; Vukosi Marivate, D.; Michael Esiefarienrhe Bukohwo, P. Predicting Road Traffic Accident Severity using Accident Report Data in South Africa. In Proceedings of the 20th Annual International Conference on Digital Government Research, Dubai, United Arab Emirates, 18 June 2019; ACM: Dubai, United Arab Emirates, 2019; pp. 11–17. [Google Scholar] [CrossRef]
  44. Mansoor, U.; Ratrout, N.T.; Rahman, S.M.; Assi, K. Crash Severity Prediction Using Two-Layer Ensemble Machine Learning Model for Proactive Emergency Management. IEEE Access 2020, 8, 210750–210762. [Google Scholar] [CrossRef]
  45. Aldhari, I.; Almoshaogeh, M.; Jamal, A.; Alharbi, F.; Alinizzi, M.; Haider, H. Severity Prediction of Highway Crashes in Saudi Arabia Using Machine Learning Techniques. Appl. Sci. 2022, 13, 233. [Google Scholar] [CrossRef]
  46. Yang, L.; Aghaabbasi, M.; Ali, M.; Jan, A.; Bouallegue, B.; Javed, M.F.; Salem, N.M. Comparative Analysis of the Optimized KNN, SVM, and Ensemble DT Models Using Bayesian Optimization for Predicting Pedestrian Fatalities: An Advance towards Realizing the Sustainable Safety of Pedestrians. Sustainability 2022, 14, 10467. [Google Scholar] [CrossRef]
  47. Luo, T.; Wang, J.; Fu, T.; Shangguan, Q.; Fang, S. Risk prediction for cut-ins using multi-driver simulation data and machine learning algorithms: A comparison among decision tree, GBDT and LSTM. Int. J. Transp. Sci. Technol. 2023, 12, 862–877. [Google Scholar] [CrossRef]
Figure 1. Study workflow diagram.
Asi 07 00025 g001
Figure 2. A participant driving on the simulated road scenario at Strathmore University.
Asi 07 00025 g002
Figure 3. The proposed two-layer ensemble model.
Asi 07 00025 g003
Figure 4. Line plot illustrating k-NN accuracy on training and test datasets for different neighbors.
Asi 07 00025 g004
Figure 5. Line plot illustrating DT accuracy on training and test datasets at different tree depths.
Asi 07 00025 g005
Figure 6. SMOTE methodology diagram.
Asi 07 00025 g006
Figure 7. Scatter plot of imbalanced dataset before SMOTE.
Asi 07 00025 g007
Figure 8. Scatter plot of the balanced dataset after SMOTE.
Asi 07 00025 g008
Figure 9. Comparison of the Area Under the Curve (ROC) for the models before SMOTE.
Asi 07 00025 g009
Figure 10. Comparison of the Area Under the Curve (ROC) for the models after SMOTE.
Asi 07 00025 g010
Table 1. Features having a strong relationship with road collisions.
Univariate Feature SelectionRecursive Elimination MethodFeature ImportanceParticle Swarm Optimization (PSO)
Lane gapLane gapLane gapLane gap
SpeedSpeedSpeedSpeed
BrakeBrakeBrakeBrake
Education levelEducation levelEducation levelDriver Experience
Driver ExperienceDriver ExperienceDriver ExperienceSurface condition
Driver AgeDriver AgeDriver AgeGender
Table 2. The architecture of the confusion matrix.
Total InstancesPredicted
NegativePositive
ActualNegativeTrue Negative (TN)False Positive (FP)
PositiveFalse Negative (TN)True Positive (TP)
Table 3. Results before performing SMOTE analysis.
ModelAccuracyPrecisionRecallF1 Score
AdaBoost0.79 ± 0.110.76 ± 0.130.71 ± 0.120.72 ± 0.14
k-NN0.79 ± 0.080.81 ± 0.410.66 ± 0.190.68 ± 0.25
DT0.85 ± 0.120.87 ± 0.270.77 ± 0.220.80 ± 0.19
NB0.83 ± 0.050.82 ± 0.200.76 ± 0.180.78 ± 0.10
Two-layer ensemble0.83 ± 0.060.91 ± 0.250.75 ± 0.190.79 ± 0.11
Table 4. Results after SMOTE analysis for each model.
ModelAccuracyPrecisionRecallF1 Score
AdaBoost0.79 ± 0.090.75 ± 0.120.73 ± 0.130.74 ± 0.08
k-NN0.72 ± 0.130.66 ± 0.120.64 ± 0.080.65 ± 0.06
DT0.77 ± 0.080.69 ± 0.900.68 ± 0.080.68 ± 0.10
NB0.81 ± 0.060.72 ± 0.100.73 ± 0.120.73 ± 0.07
Two-layer ensemble0.85 ± 0.080.86 ± 0.090.82 ± 0.090.83 ± 0.08
Table 5. Outcomes of the models for no collisions.
ModelPrecisionRecallF1 Score
k-NN0.790.970.87
Decision Trees0.830.860.85
AdaBoost0.830.860.85
Naïve Bayes0.850.940.90
Two-layer ensemble0.870.970.92
Table 6. Outcomes of the models for collisions.
ModelPrecisionRecallF1 Score
k-NN0.800.310.44
Decision Trees0.580.540.56
AdaBoost0.580.540.56
Naïve Bayes0.800.620.70
Two-layer ensemble0.890.620.73
Table 7. Outcomes of the models.
ModelAccuracyPrecisionRecallF1 Score
k-NN0.65 ± 0.090.56 ± 0.120.56 ± 0.100.56 ± 0.09
Decision Trees0.81 ± 0.740.83 ± 0.120.70 ± 0.780.73 ± 0.72
AdaBoost0.79 ± 0.080.76 ± 0.100.71 ± 0.100.72 ± 0.09
Naïve Bayes0.81 ± 0.100.77 ± 0.120.76 ± 0.110.77 ± 0.09
Two-layer ensemble0.88 ± 0.080.86 ± 0.090.83 ± 0.110.84 ± 0.79
Table 8. Comparison of the proposed two-layer ensemble model with works in the literature.
WorkDataset SourceMethodPrecisionRecallF1-ScoreAccuracy
Aldhari et al. [44]CollectedEnsemble
XGBoost
RF
LR

94%
91%
65%

94%
90%
65%

94%
90%
65%

94%
90%
65%
Yang et al. [45]Australia road deaths database (ARDD)Ensemble
SVM
k-NN
DT

88%
87%
88%
Luo et al. [46]Driving SimulatorClassification
DT
Gradient boosting decision tree (GBDT)
Long–short-term memory (LSTM)

77%
80%
87%
Mansoor et al. [43]Canadian DatasetEnsemble
k-NN
DT
AdaBoost
FNN
SVM
Two-Layer Ensemble

62%
68%
72%
70%
72%
73%

70%
70%
72%
70%
69%
77%

66%
69%
72%
70%
71%
75%

67%
69%
71%
69%
68%
76%
ProposedDriving SimulatorEnsemble
k-NN
DT
AdaBoost
NB
Two-Layer Ensemble

56%
83%
76%
83%
86%

56%
70%
71%
76%
83%

56%
73%
72%
77%
84%

65%
81%
79%
81%
88%
Disclaimer/Publisher’s Note: The statements, opinions and data contained in all publications are solely those of the individual author(s) and contributor(s) and not of MDPI and/or the editor(s). MDPI and/or the editor(s) disclaim responsibility for any injury to people or property resulting from any ideas, methods, instructions or products referred to in the content.

