
Performance Analysis of a Zero-Energy Building Using Photovoltaics and Hydrogen Storage


Abstract
:1. Introduction
2. Material and Methods
2.1. Building Description
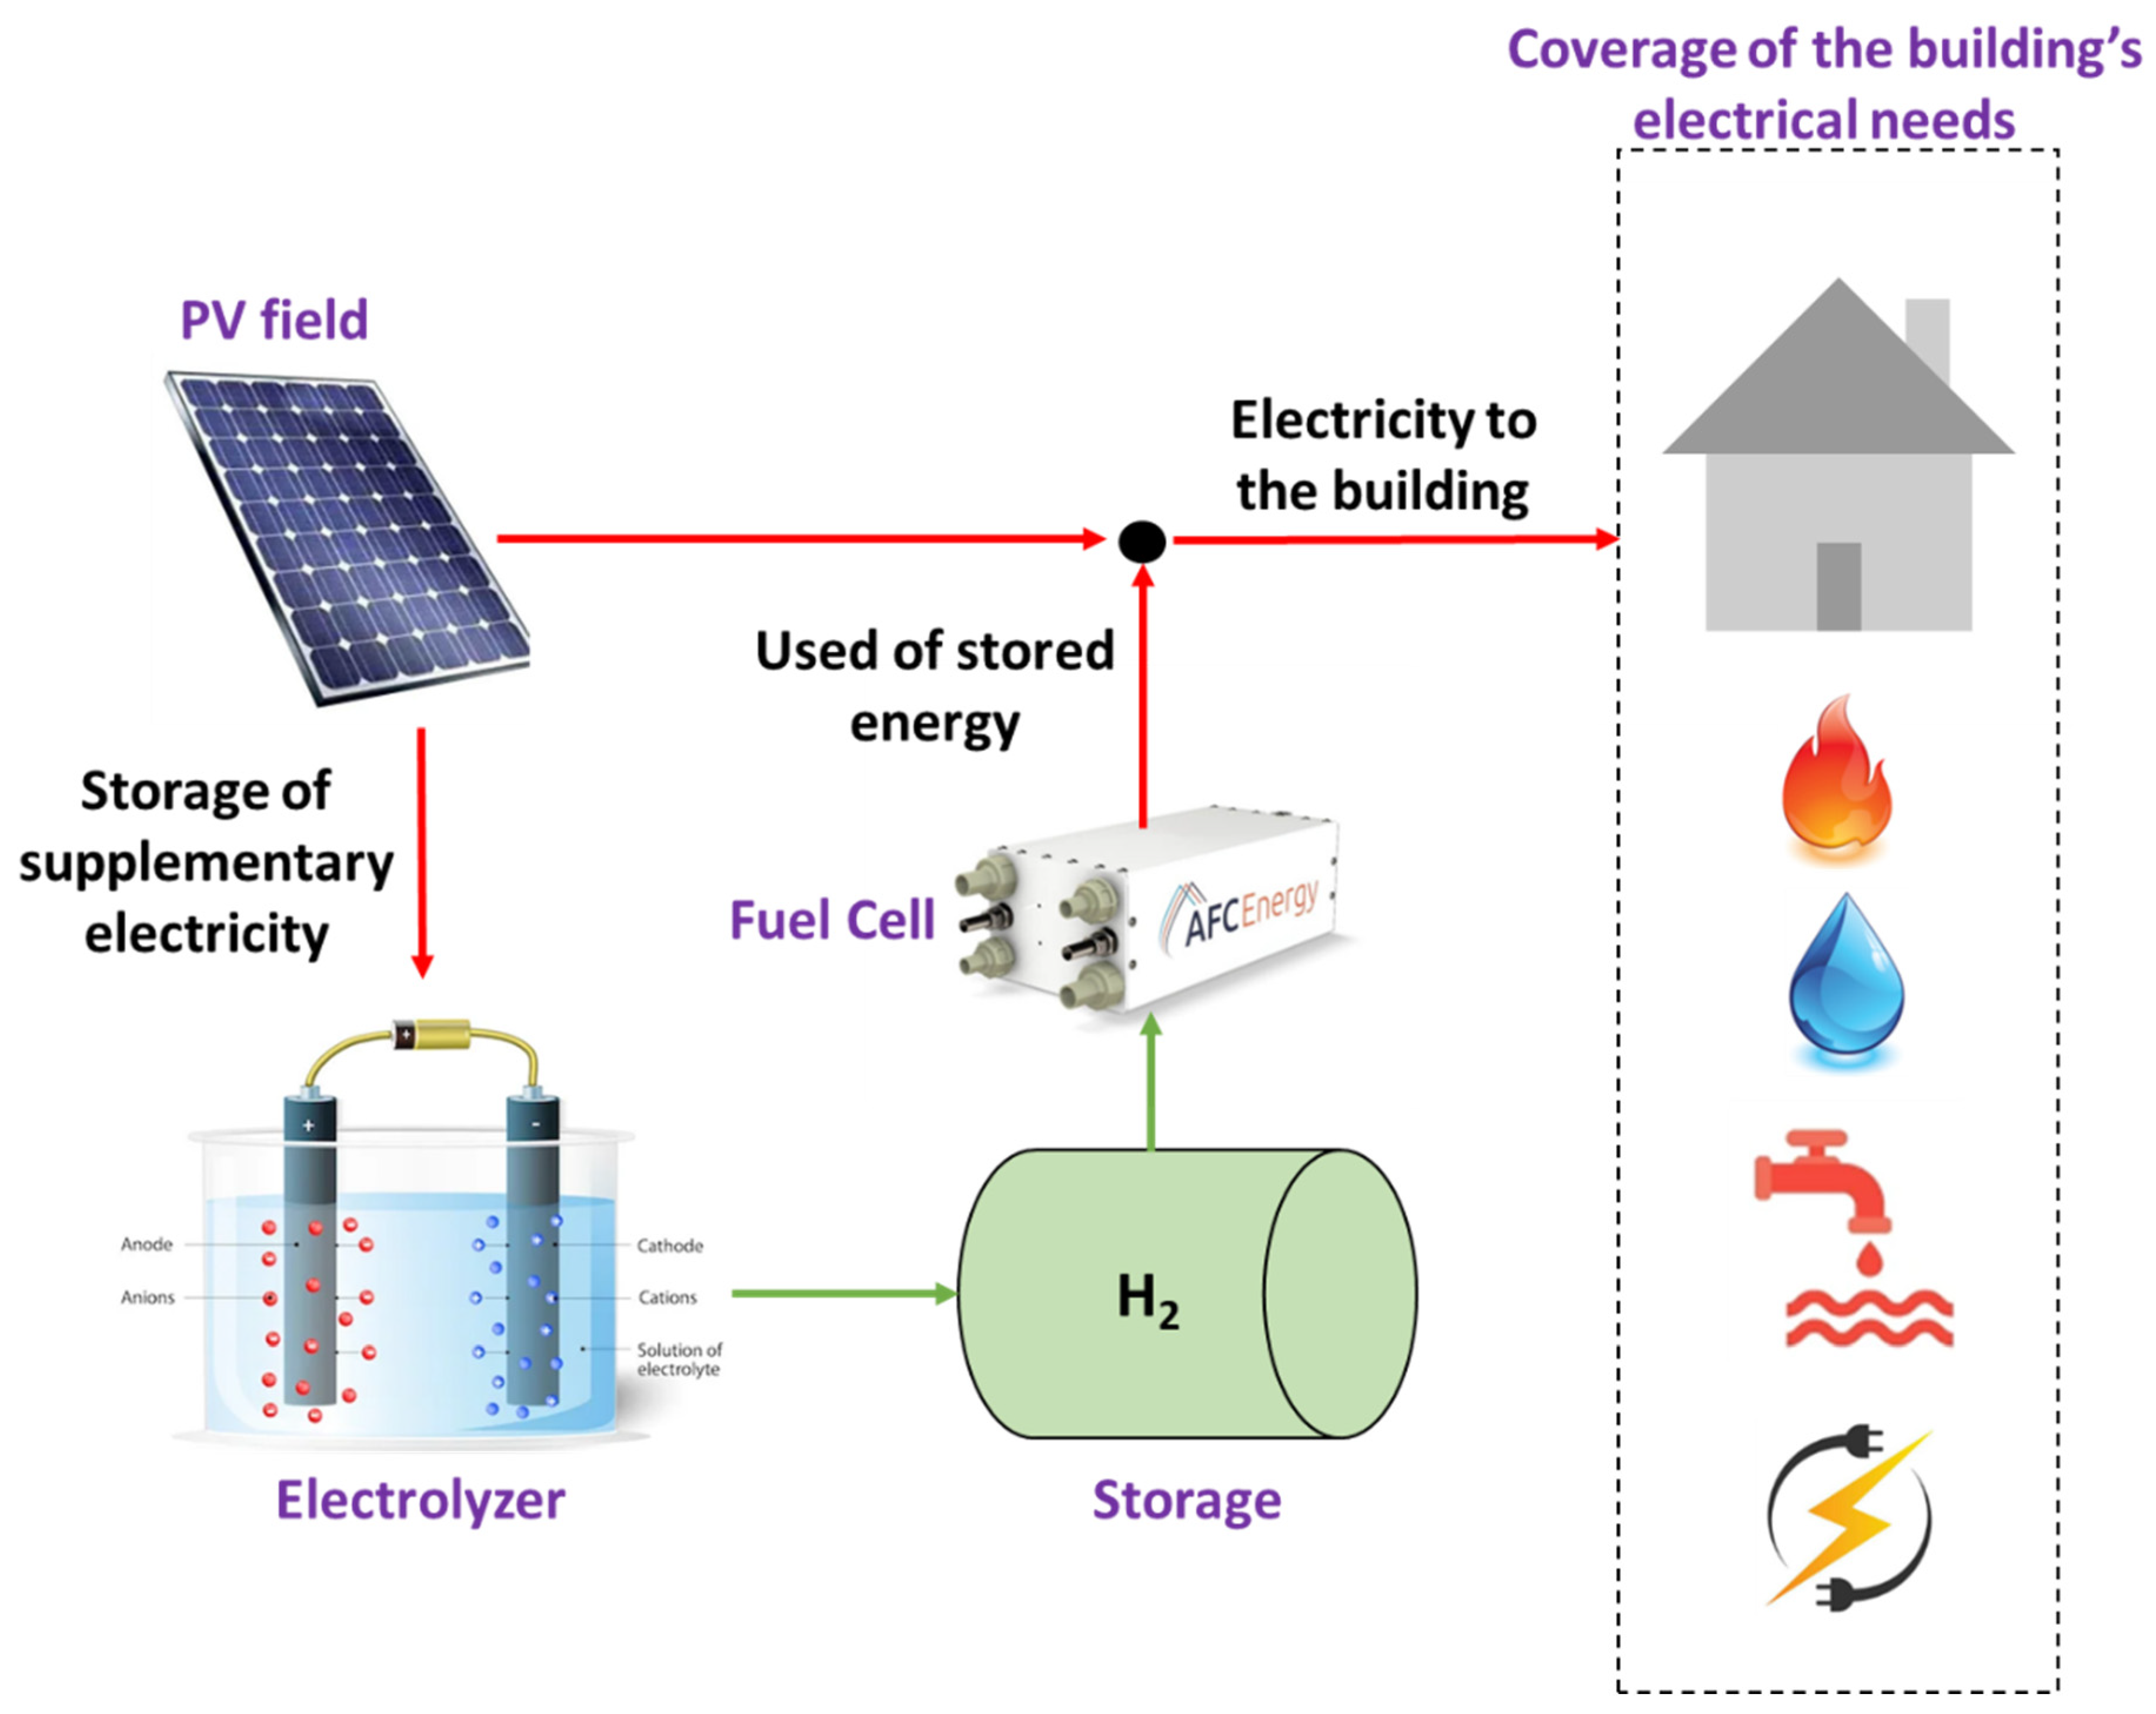
2.2. System Description
2.3. Basic Mathematical Part
2.4. Summary of the Followed Methodology
3. Results and Discussion
3.1. Results for the Building Energy Needs
3.2. Performance Analysis of the Total Configuration
4. Conclusions
- -
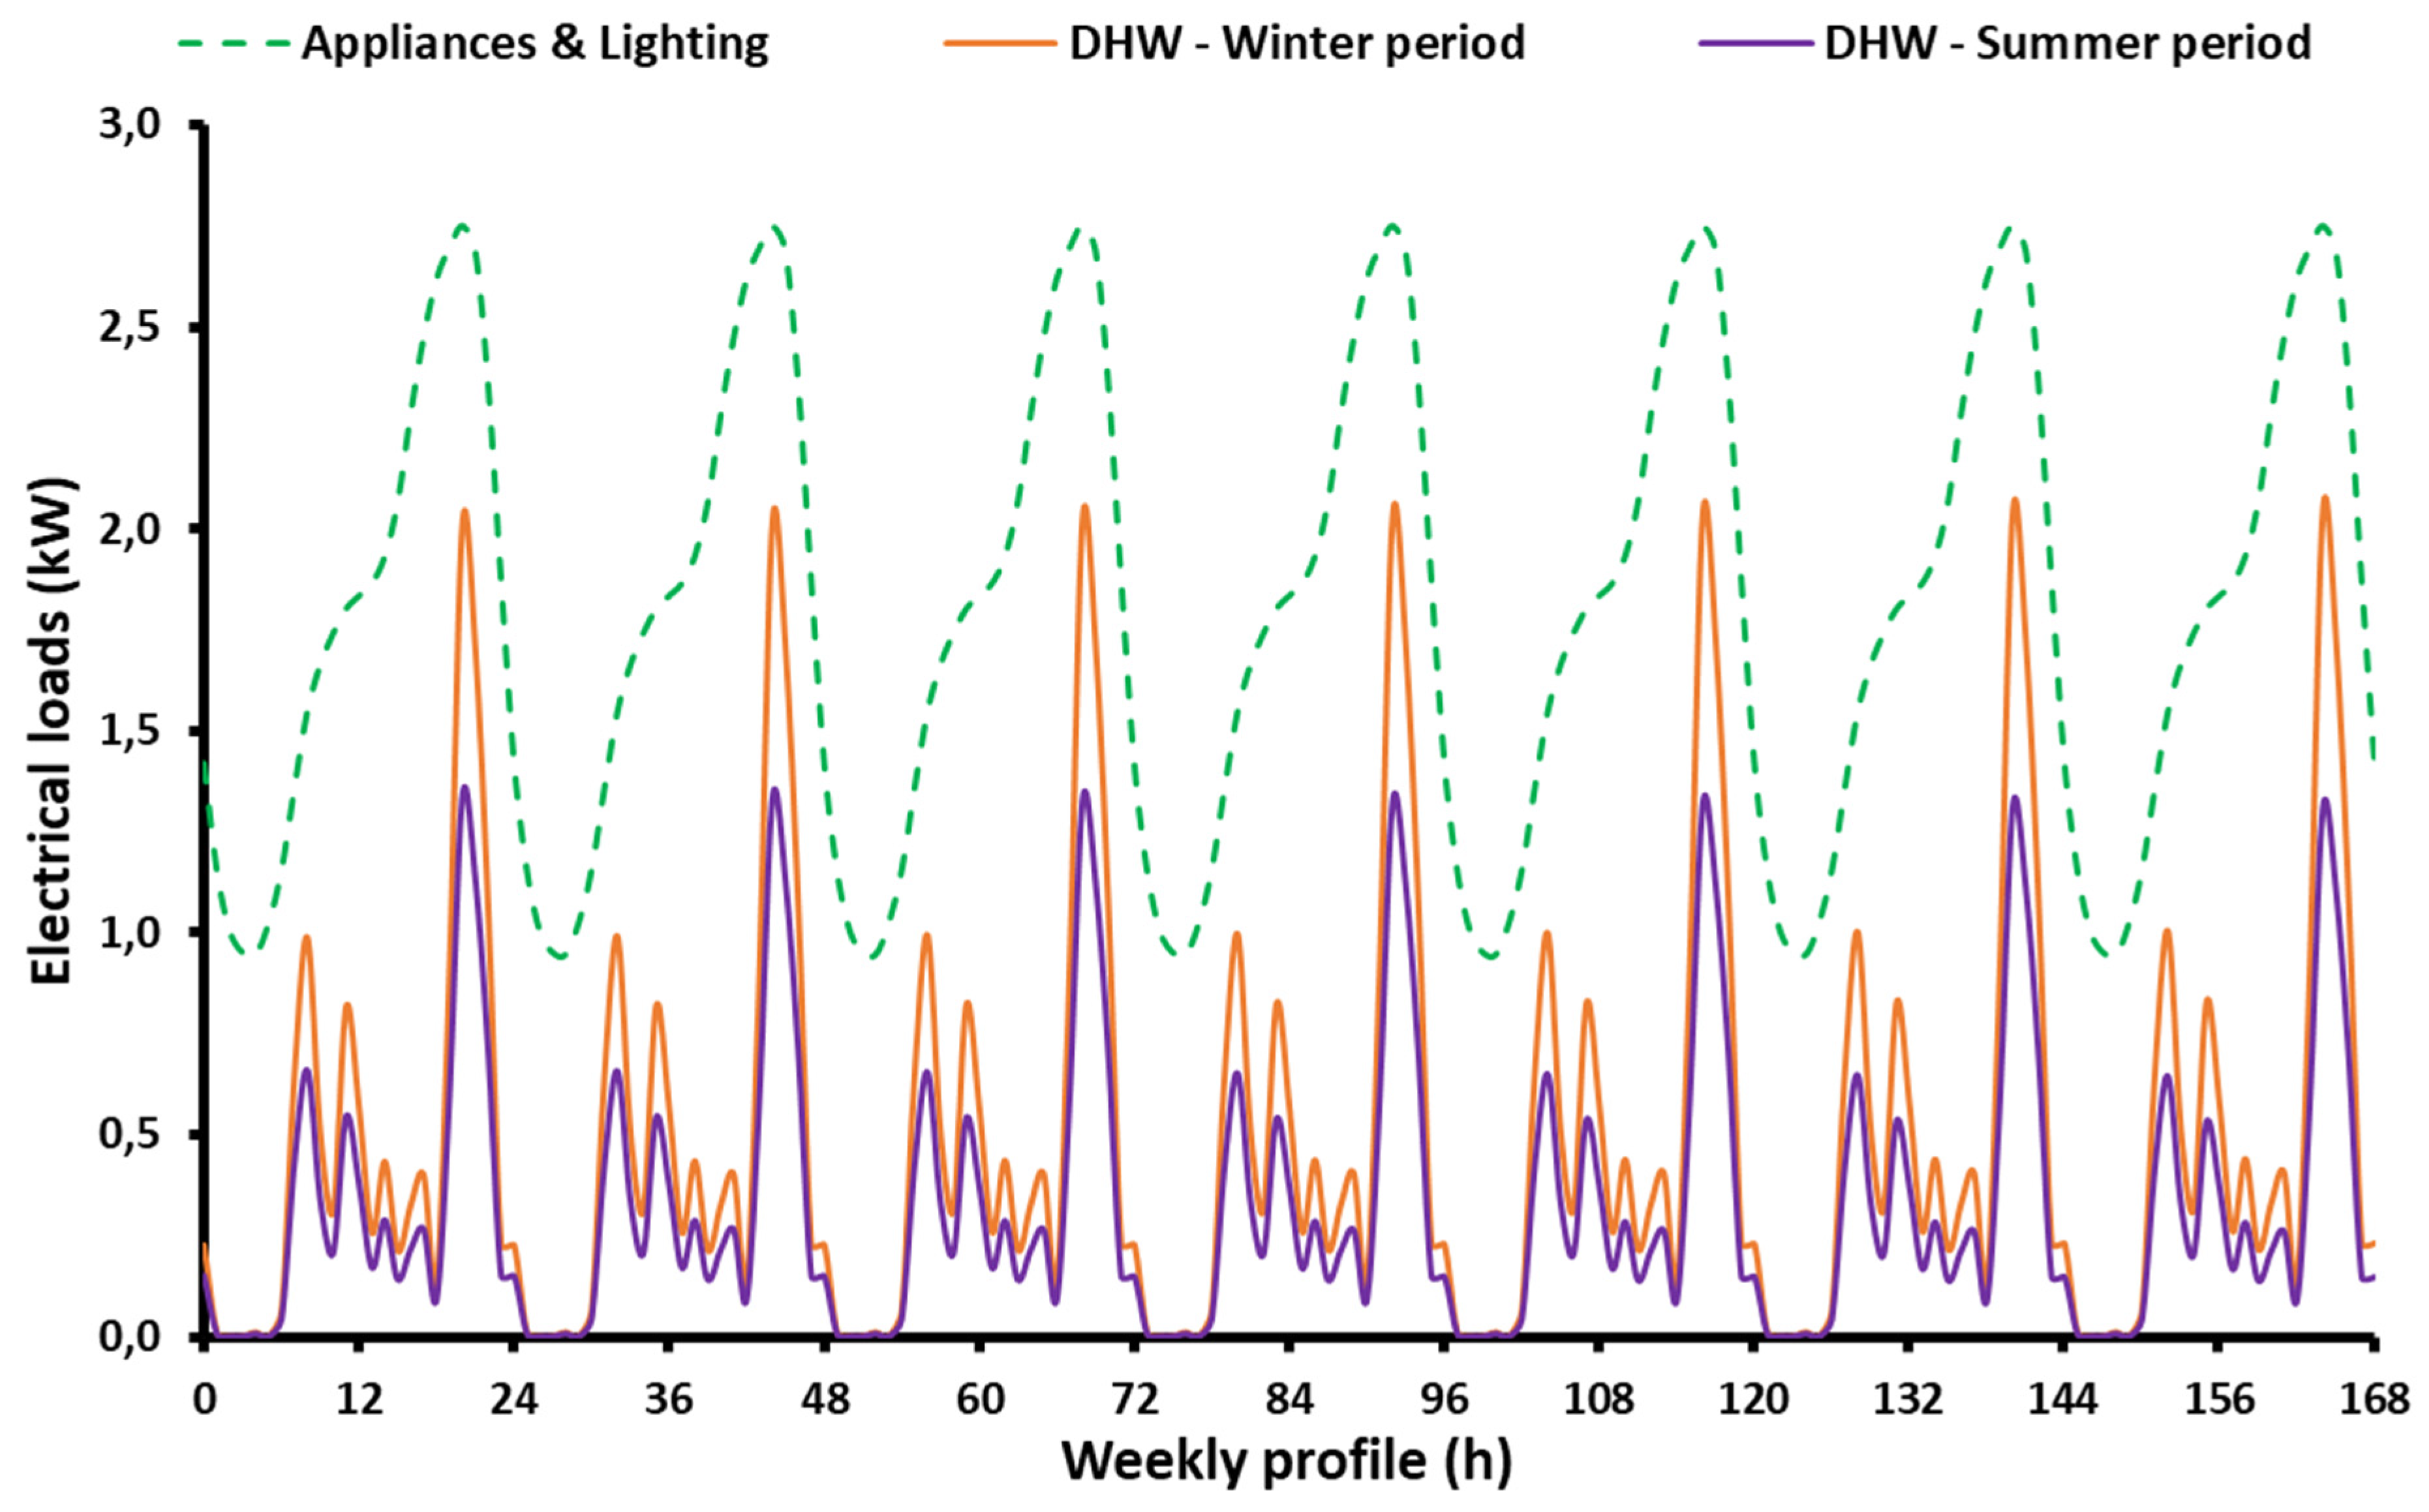
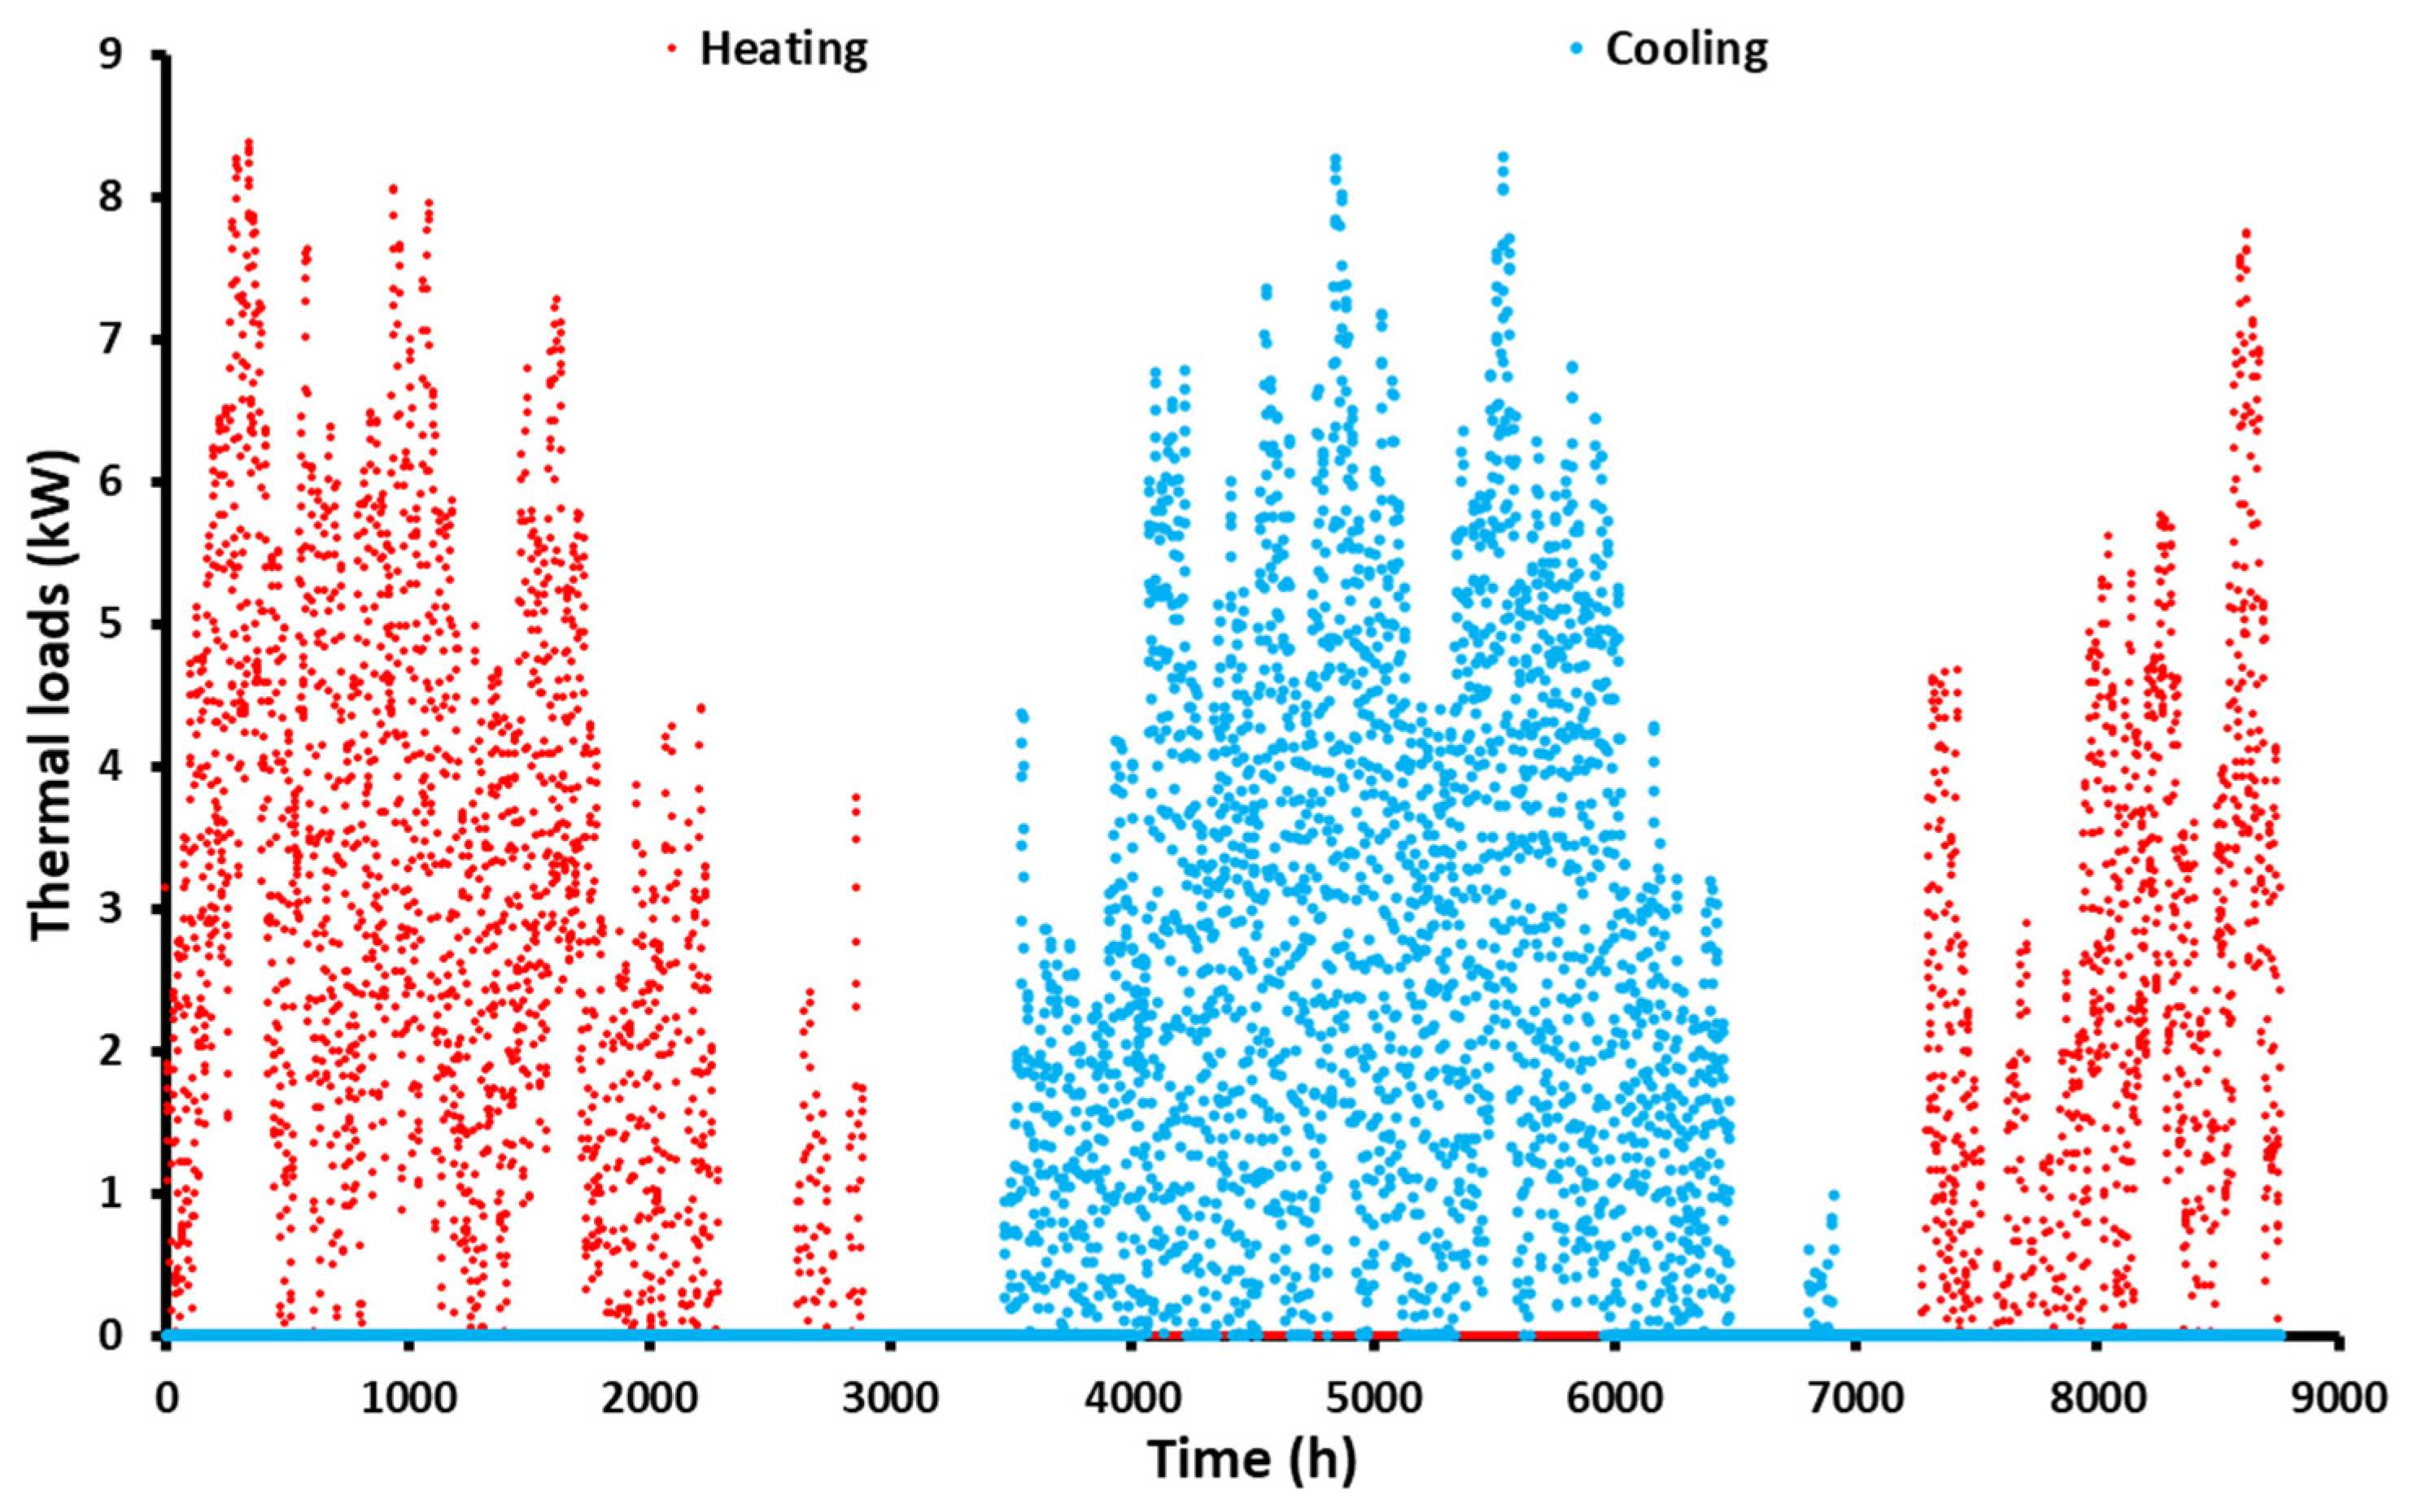
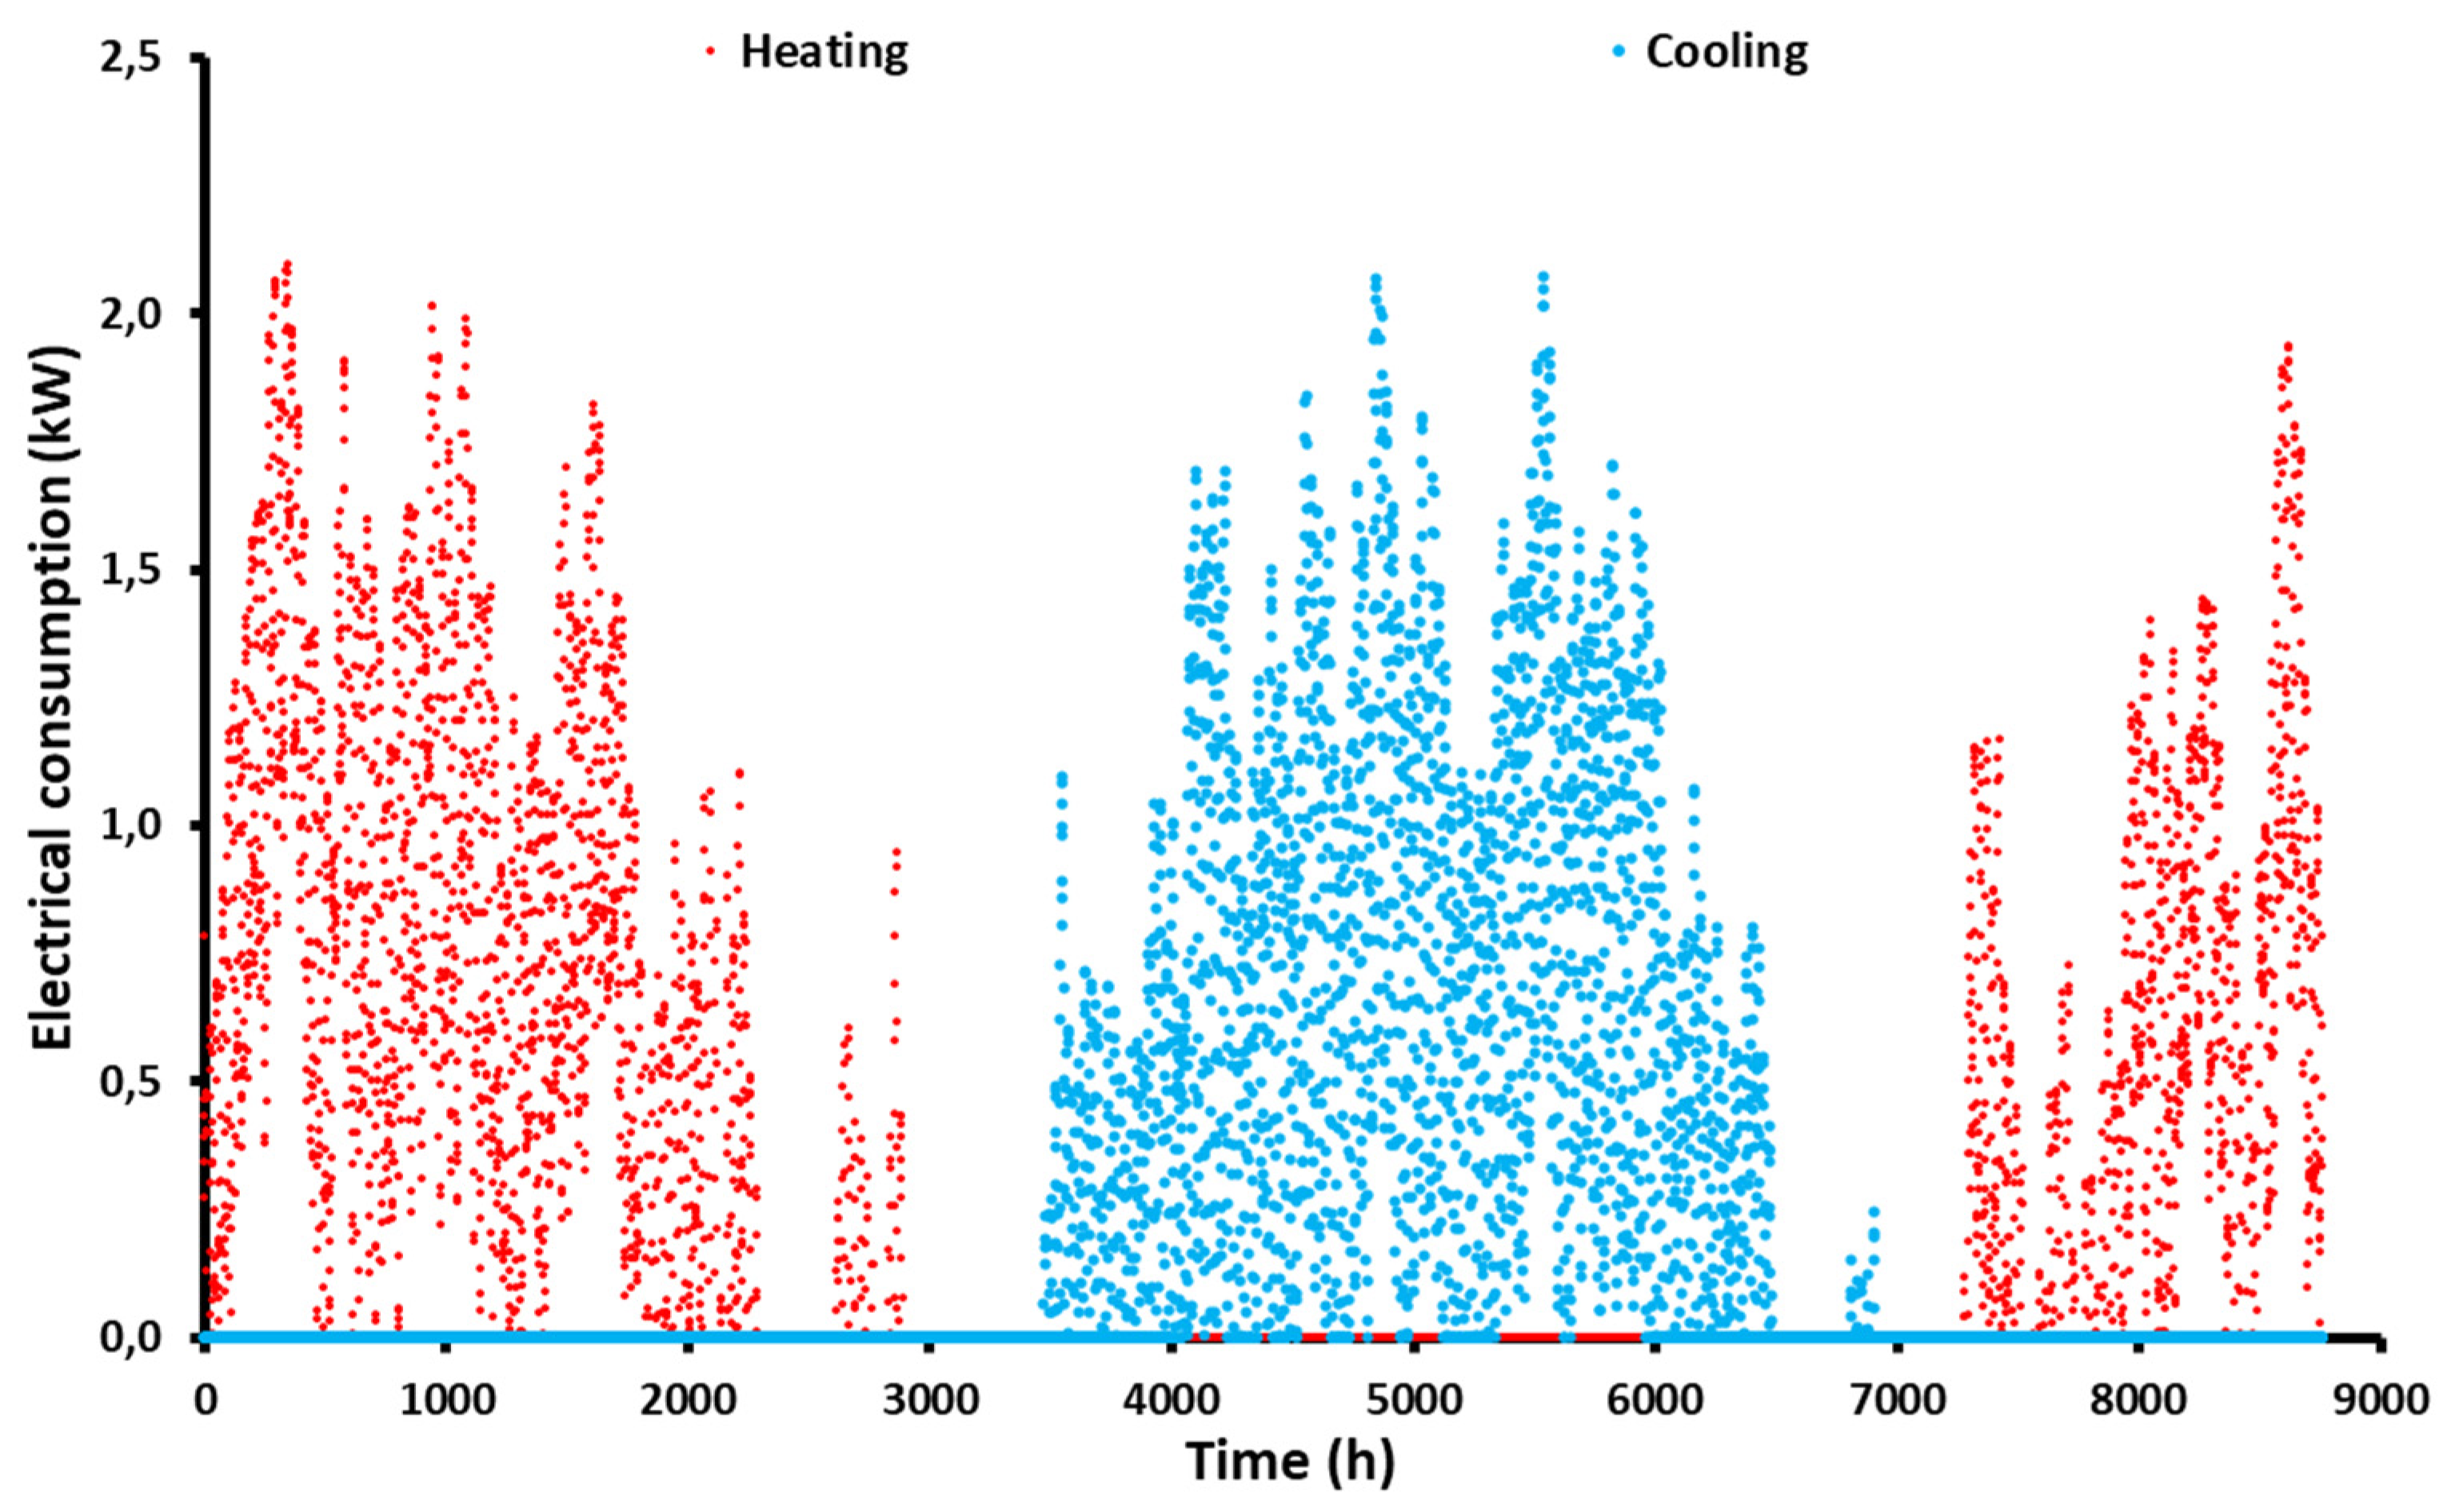
- The specific heating thermal loads of the building per floor area are found at 24.44 kWh/m2, while for cooling at 18.09 kWh/m2. The thermal load of the domestic hot water was found at 8.63 kWh/m2, while the electrical demand for appliances & lighting was at 39.42 kWh/m2.
- -
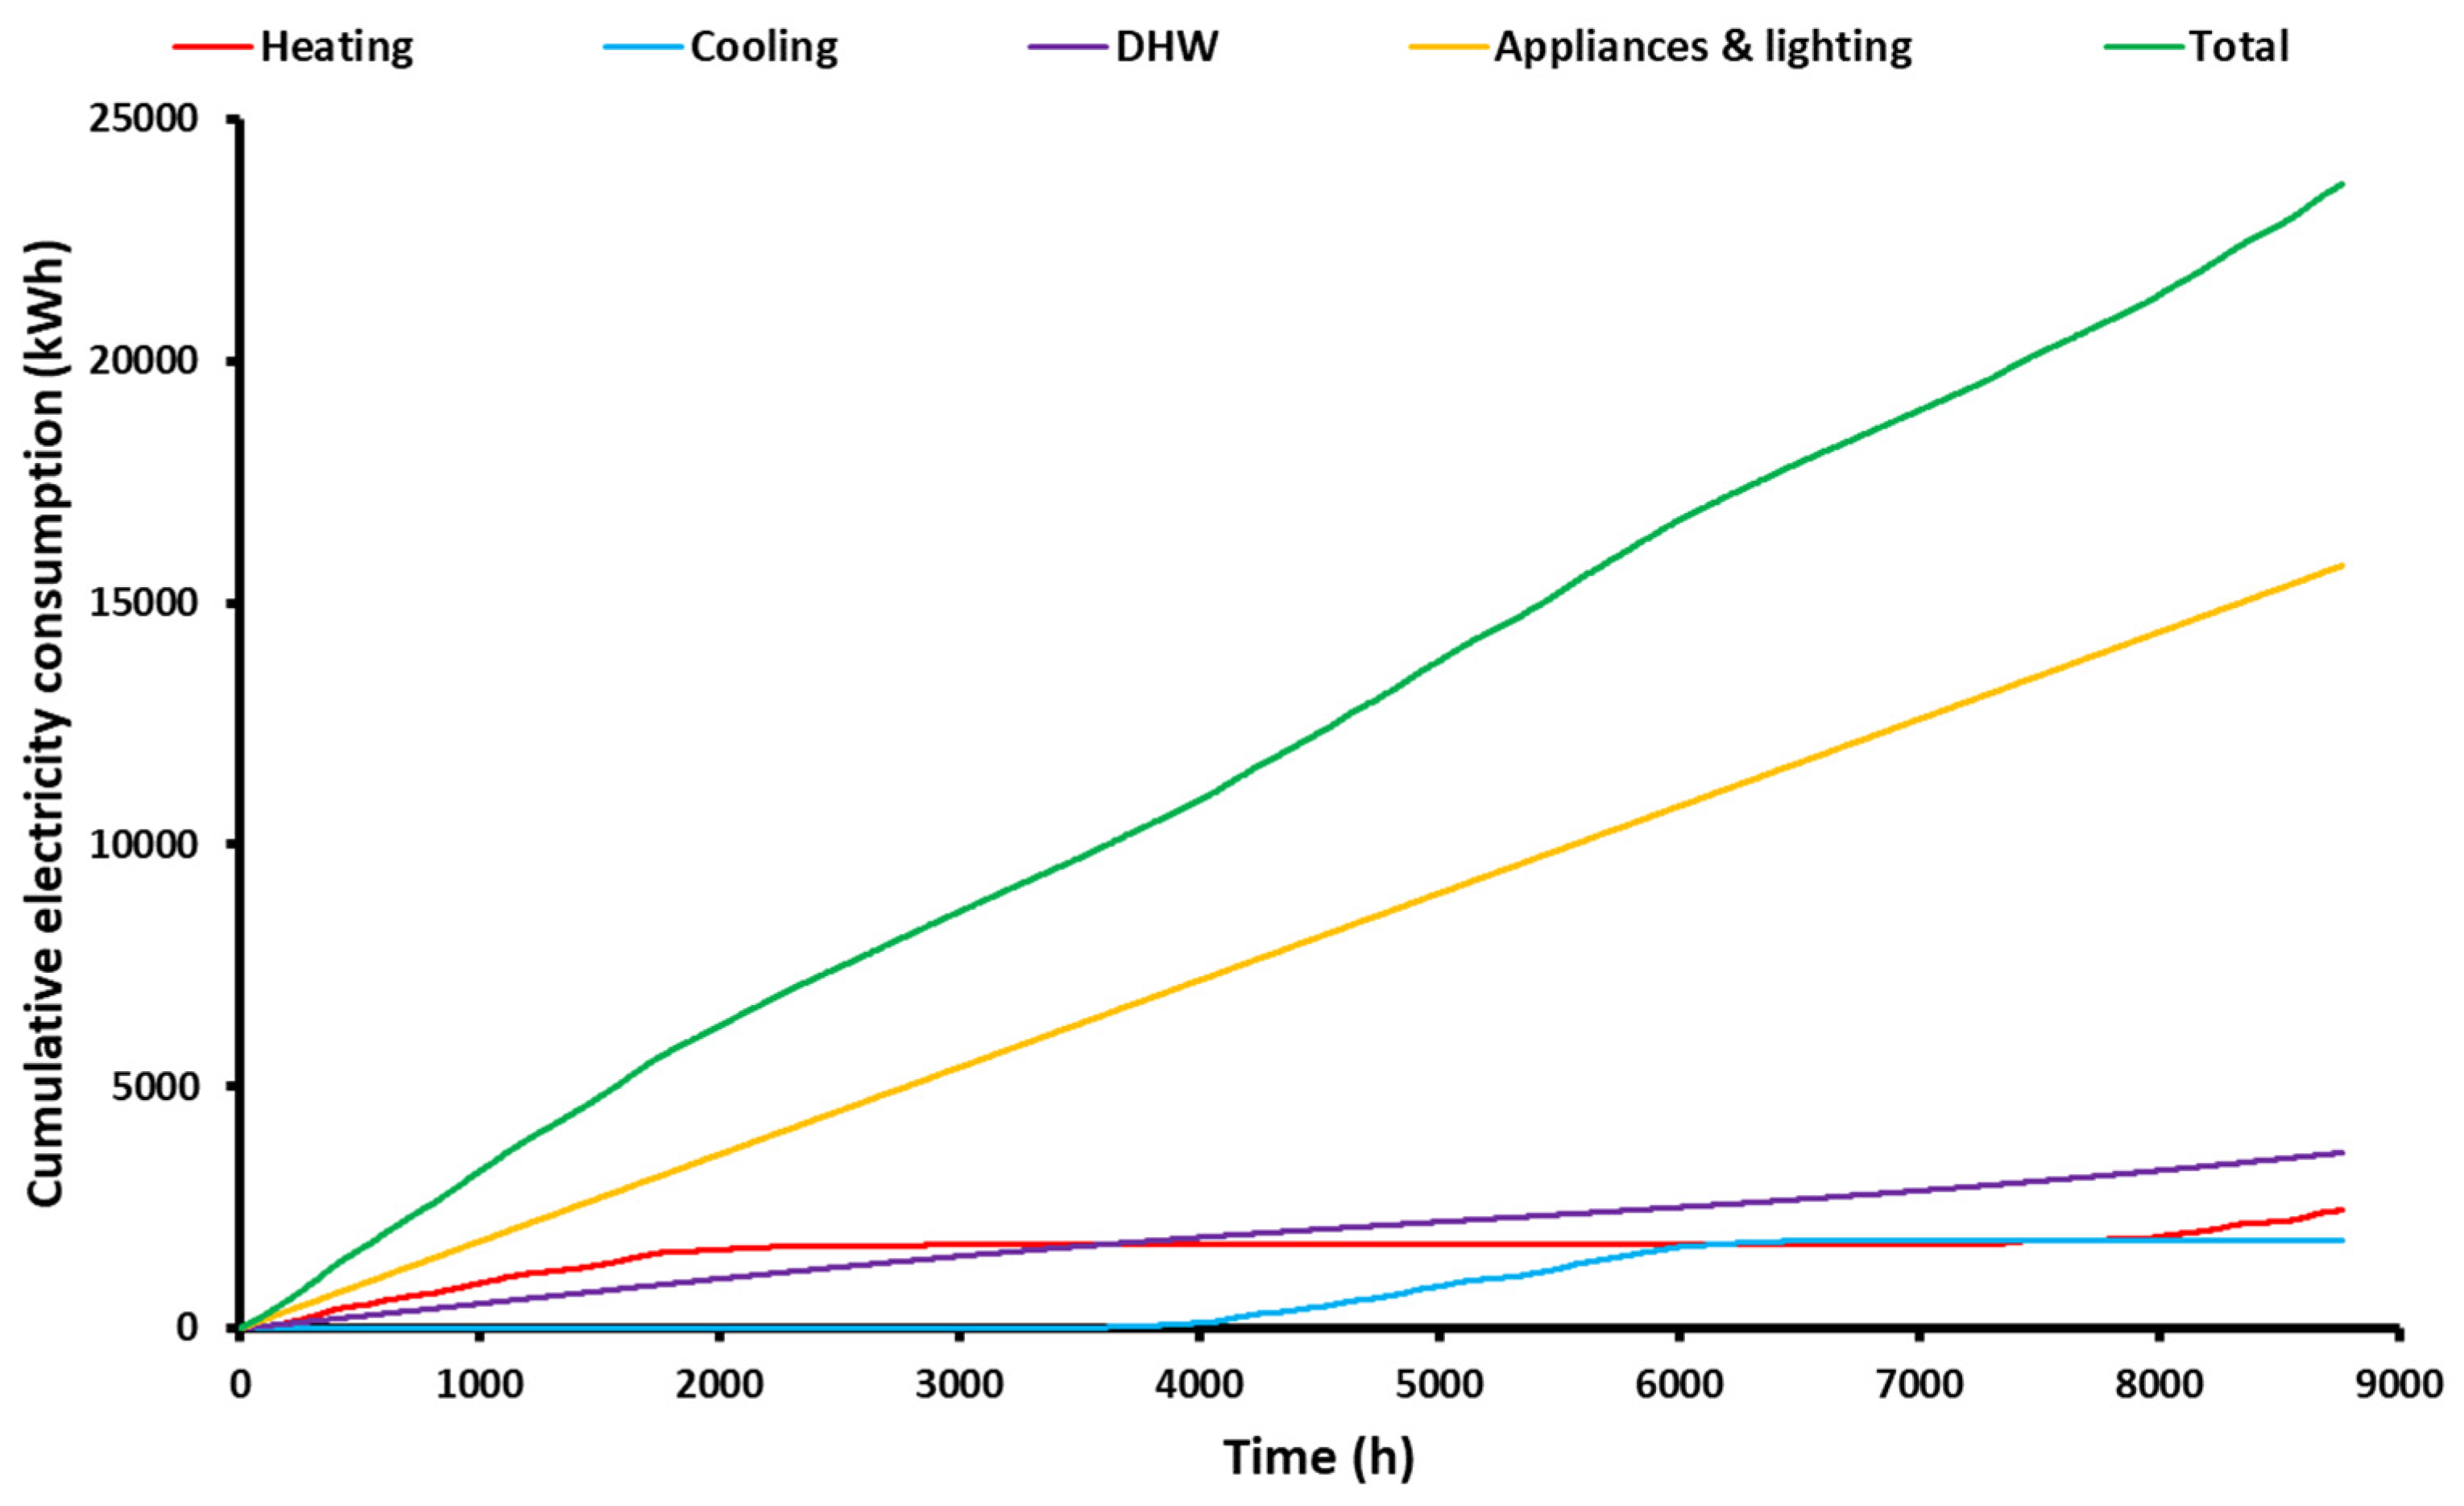
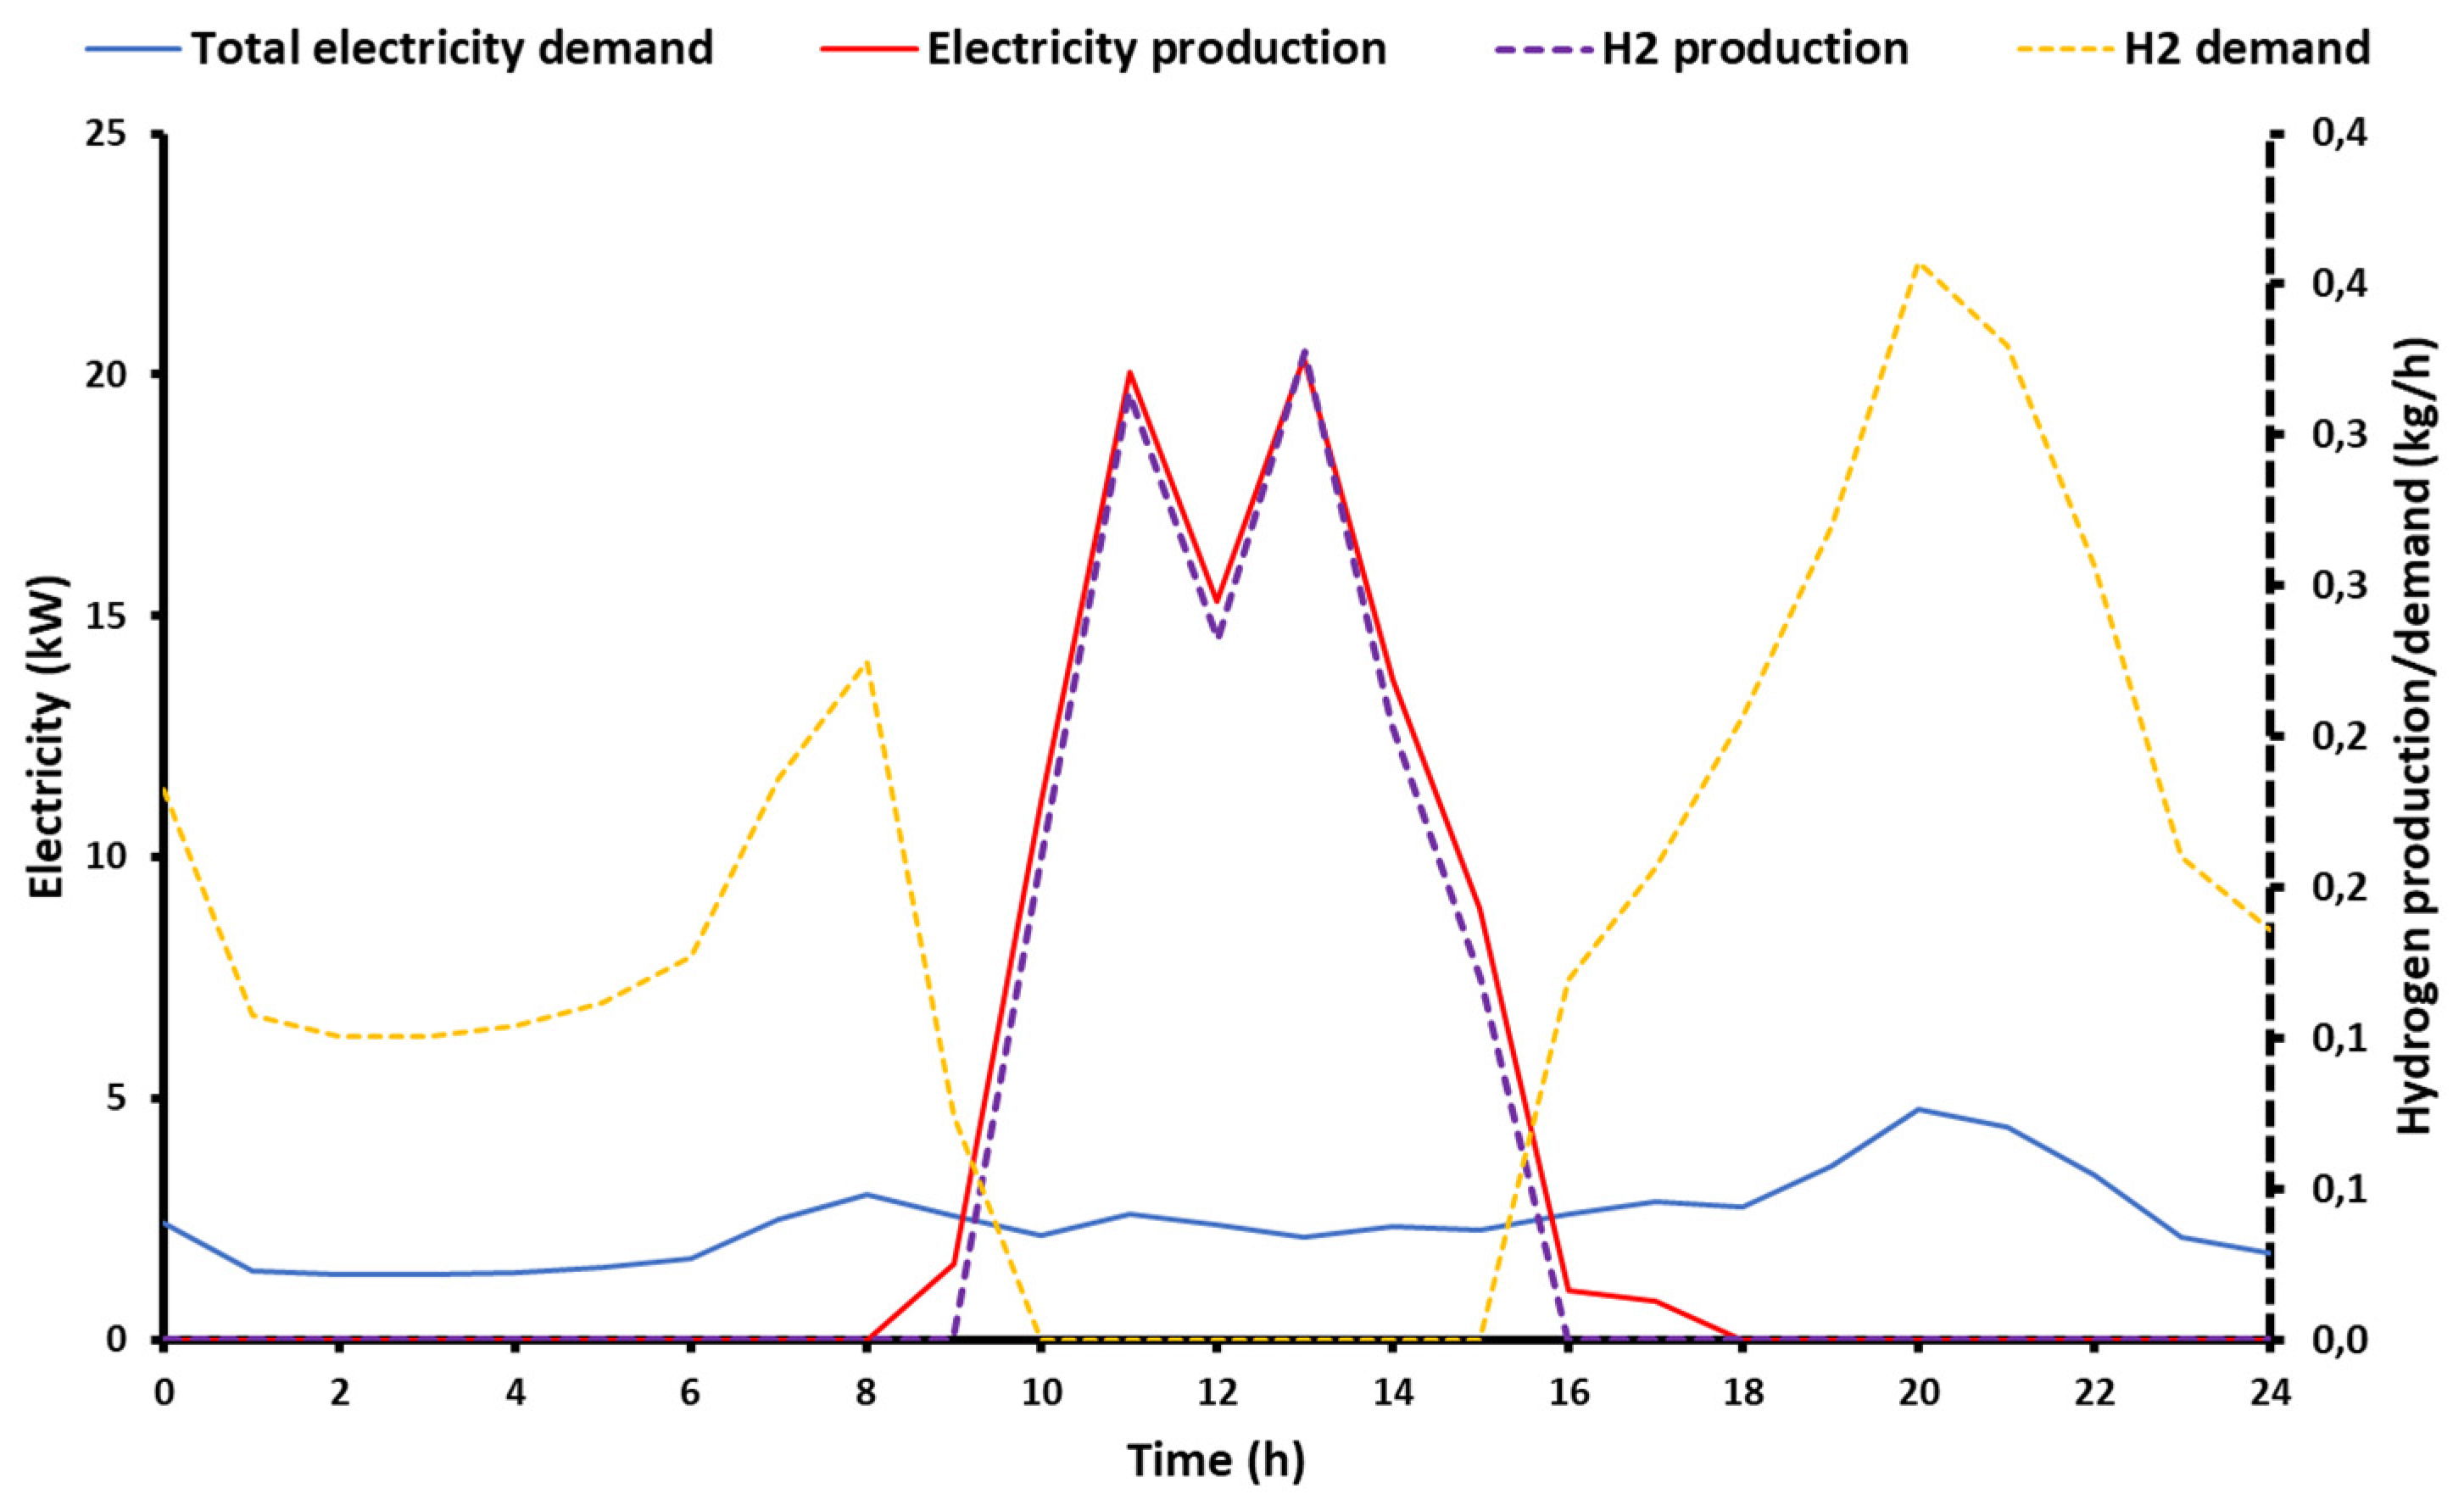
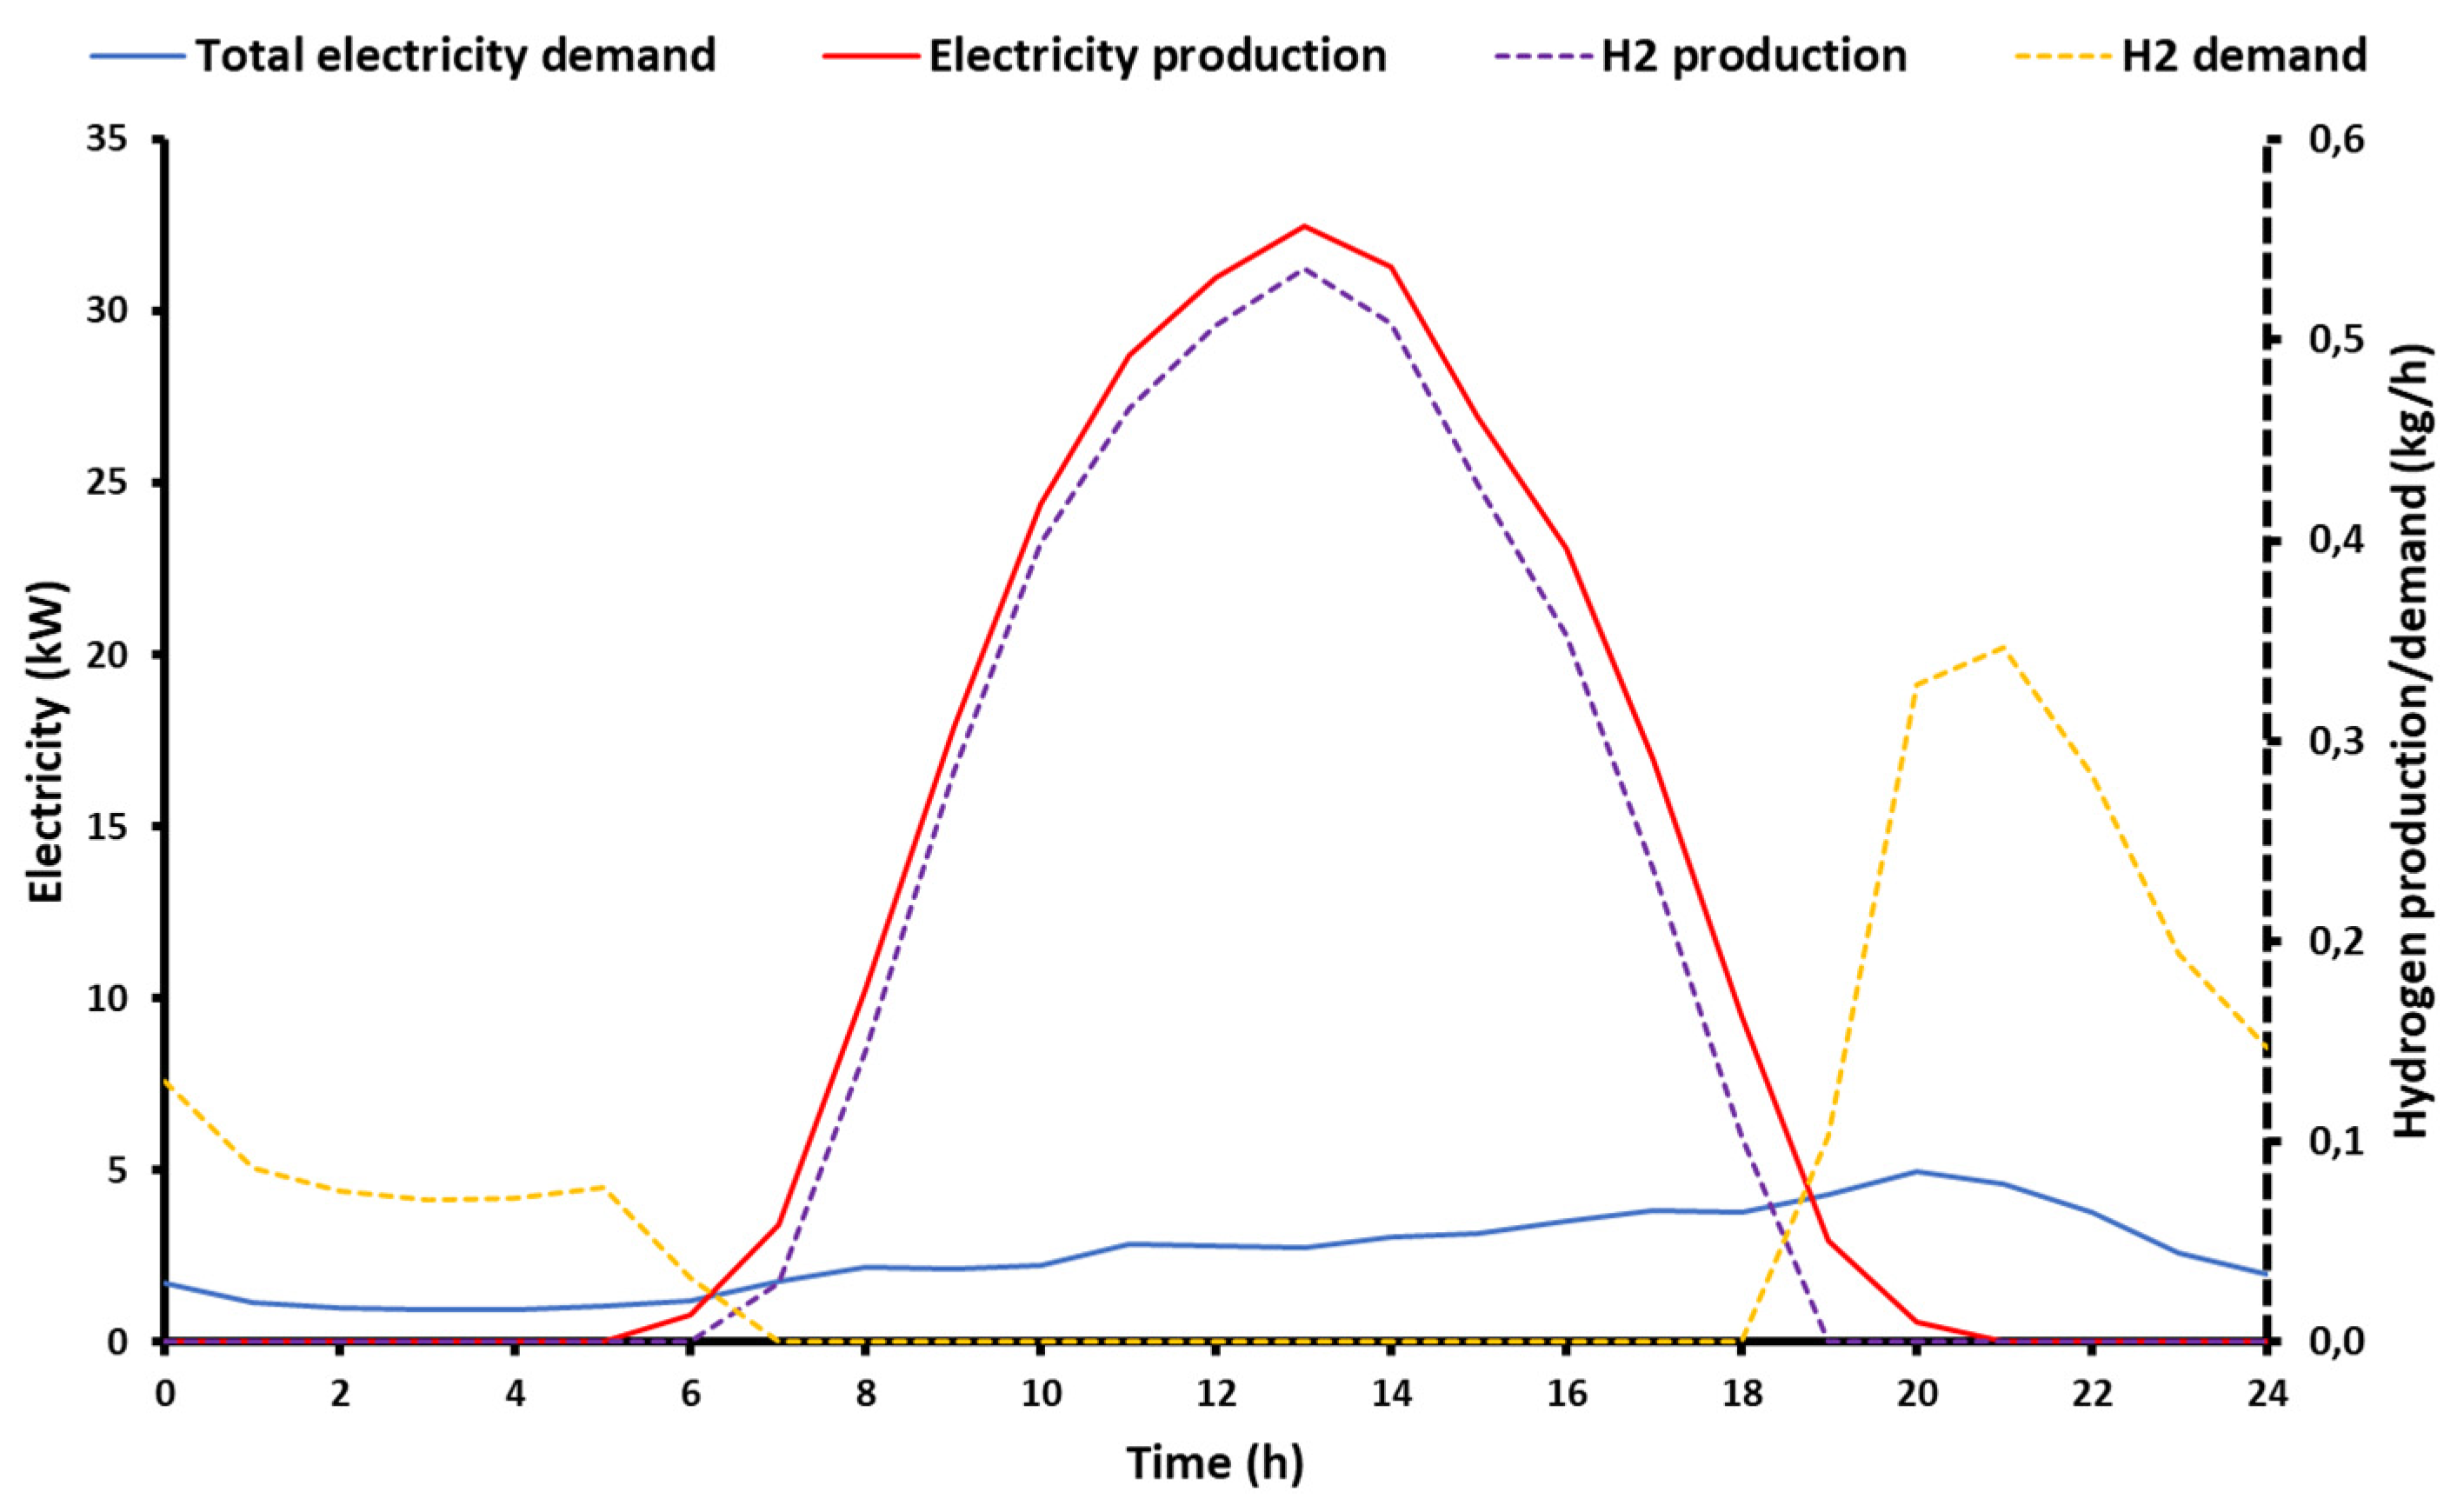
- The global electrical demand for satisfying all the building’s needs was estimated at 59.14 kWh/m2. This quantity is separated into 10.3% for heating, 7.6% for cooling, 15.4% for DHW, and 66.7% for appliances and lighting. So, it was found that the appliances and lighting demand are the major contributors to the total electricity demand.
- -
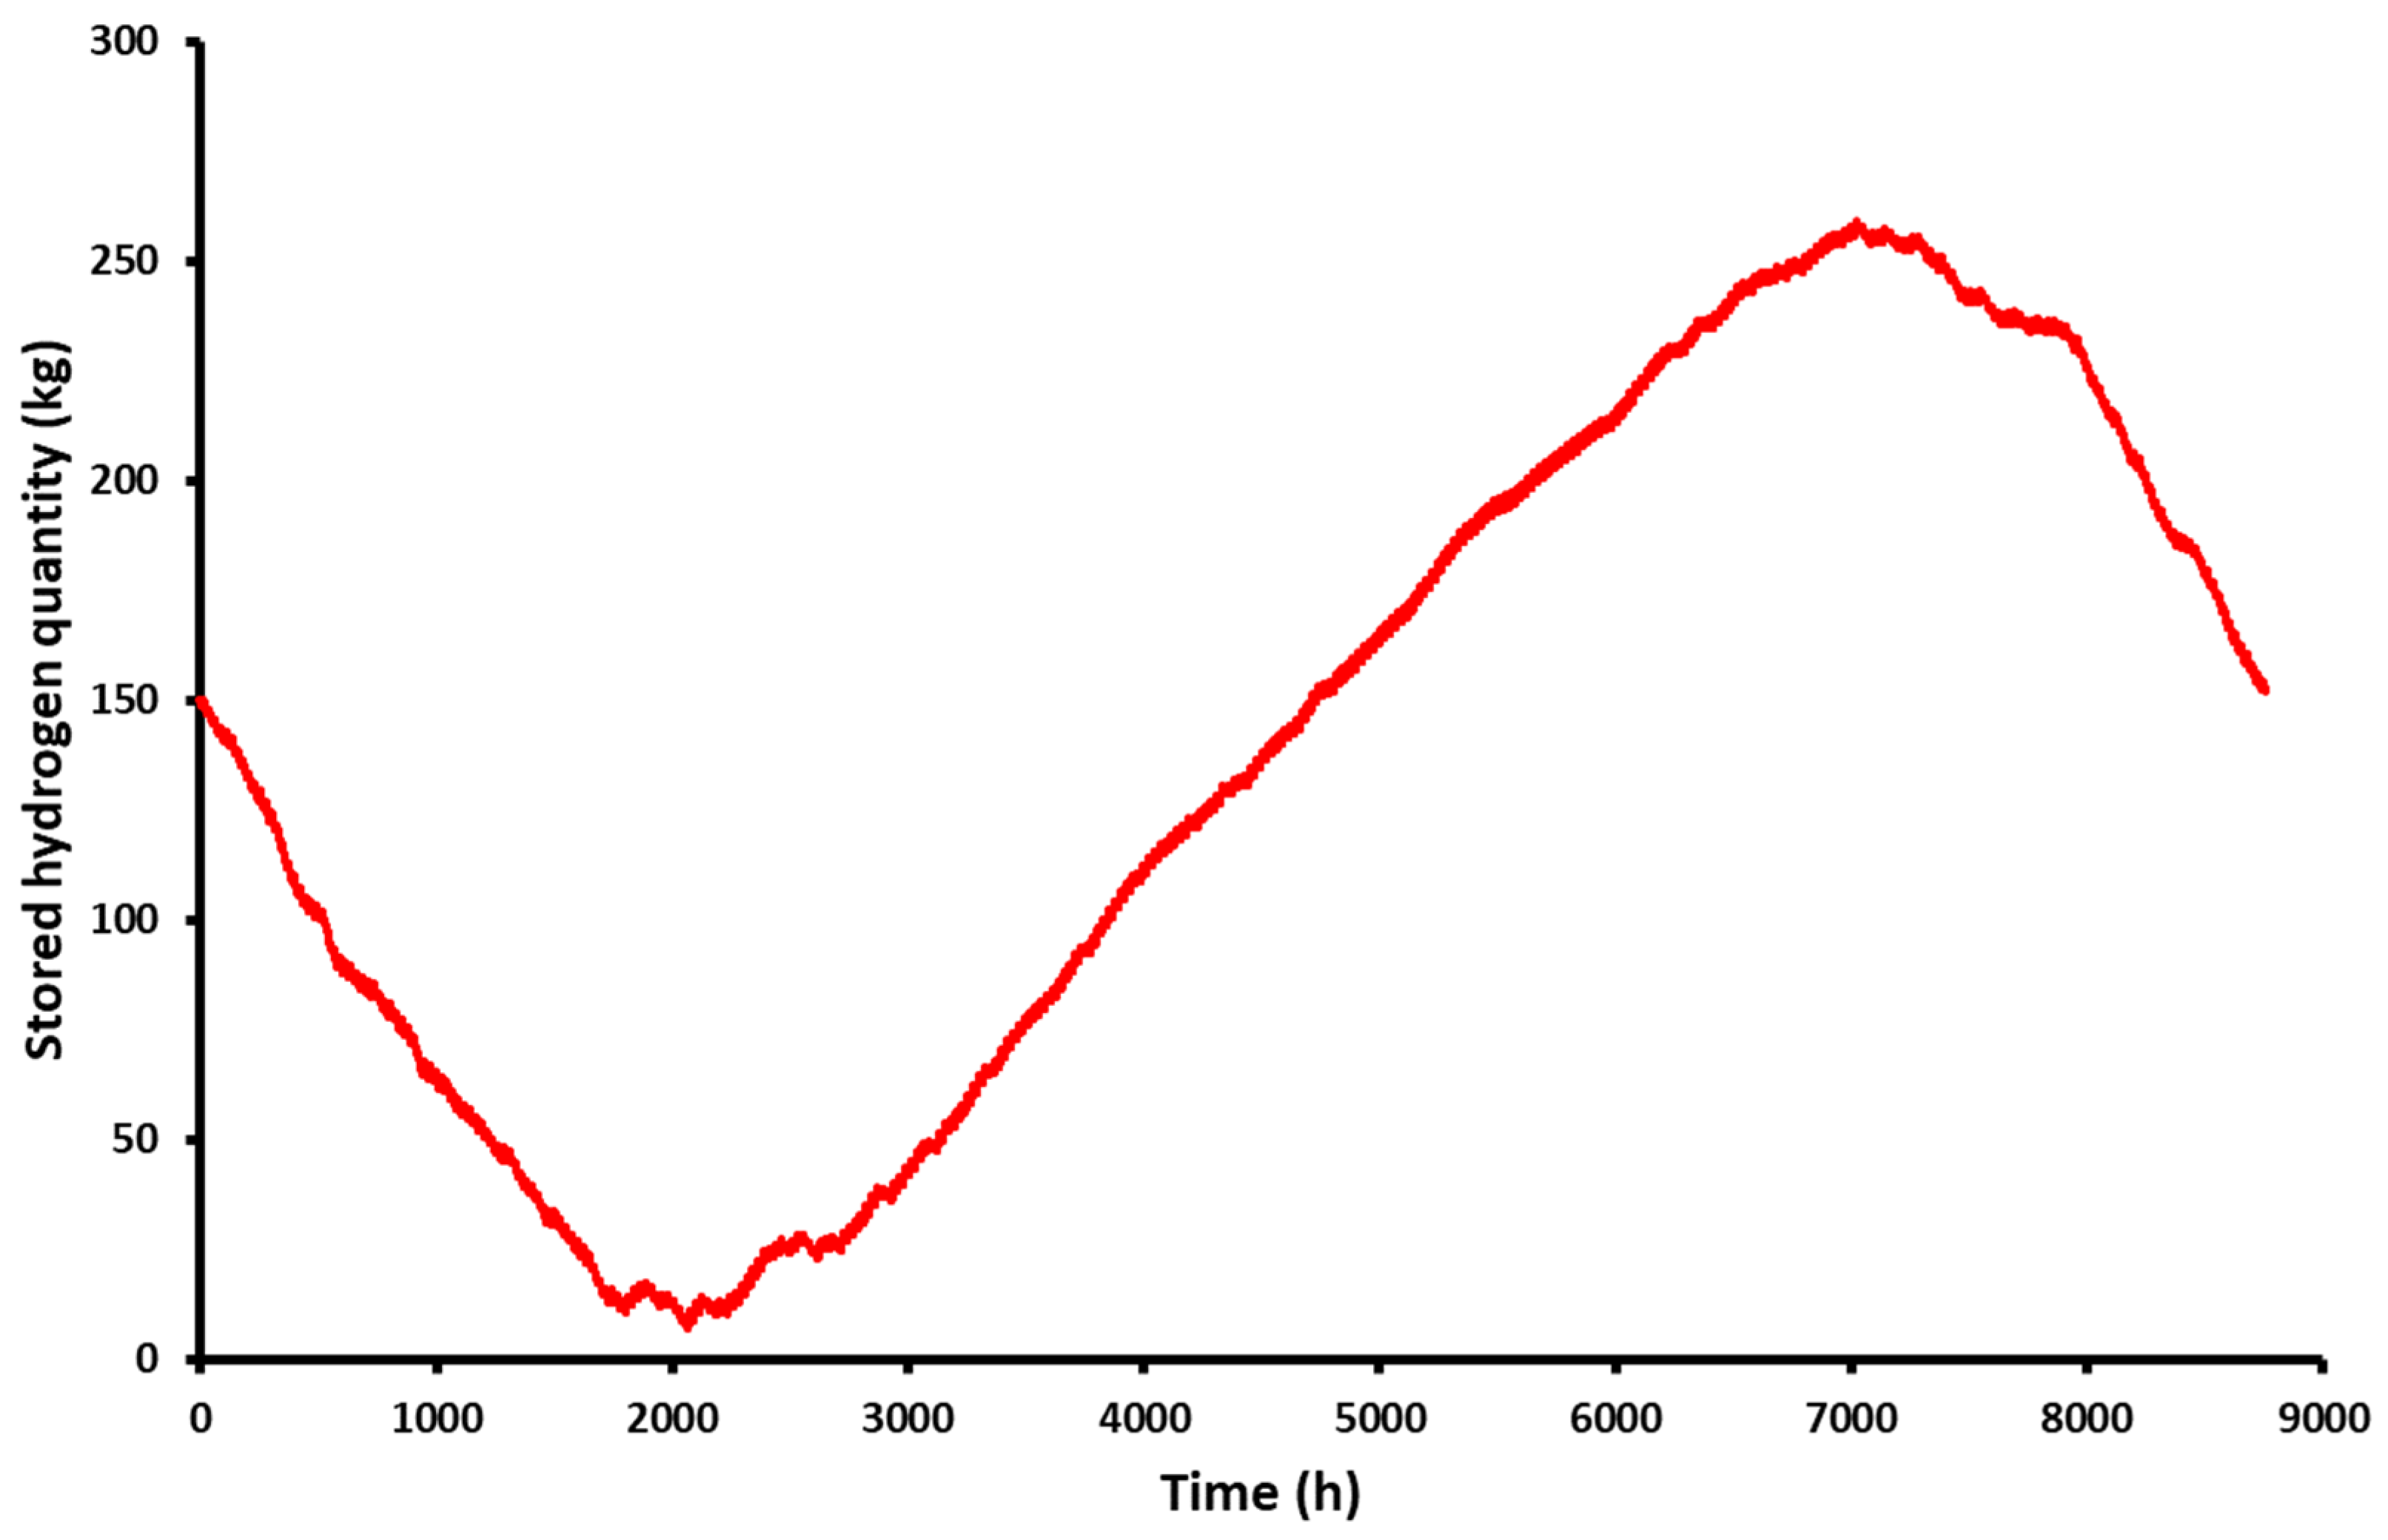
- The PV area was determined at 203 m2 which is about half of the roof area. The storage capacity for the hydrogen was determined at 258 kg which means a tank of about 34 m3. Regarding the building loads, the PV covers directly 46.8% of the building loads, while 53.2% is covered by the fuel cell.
- -
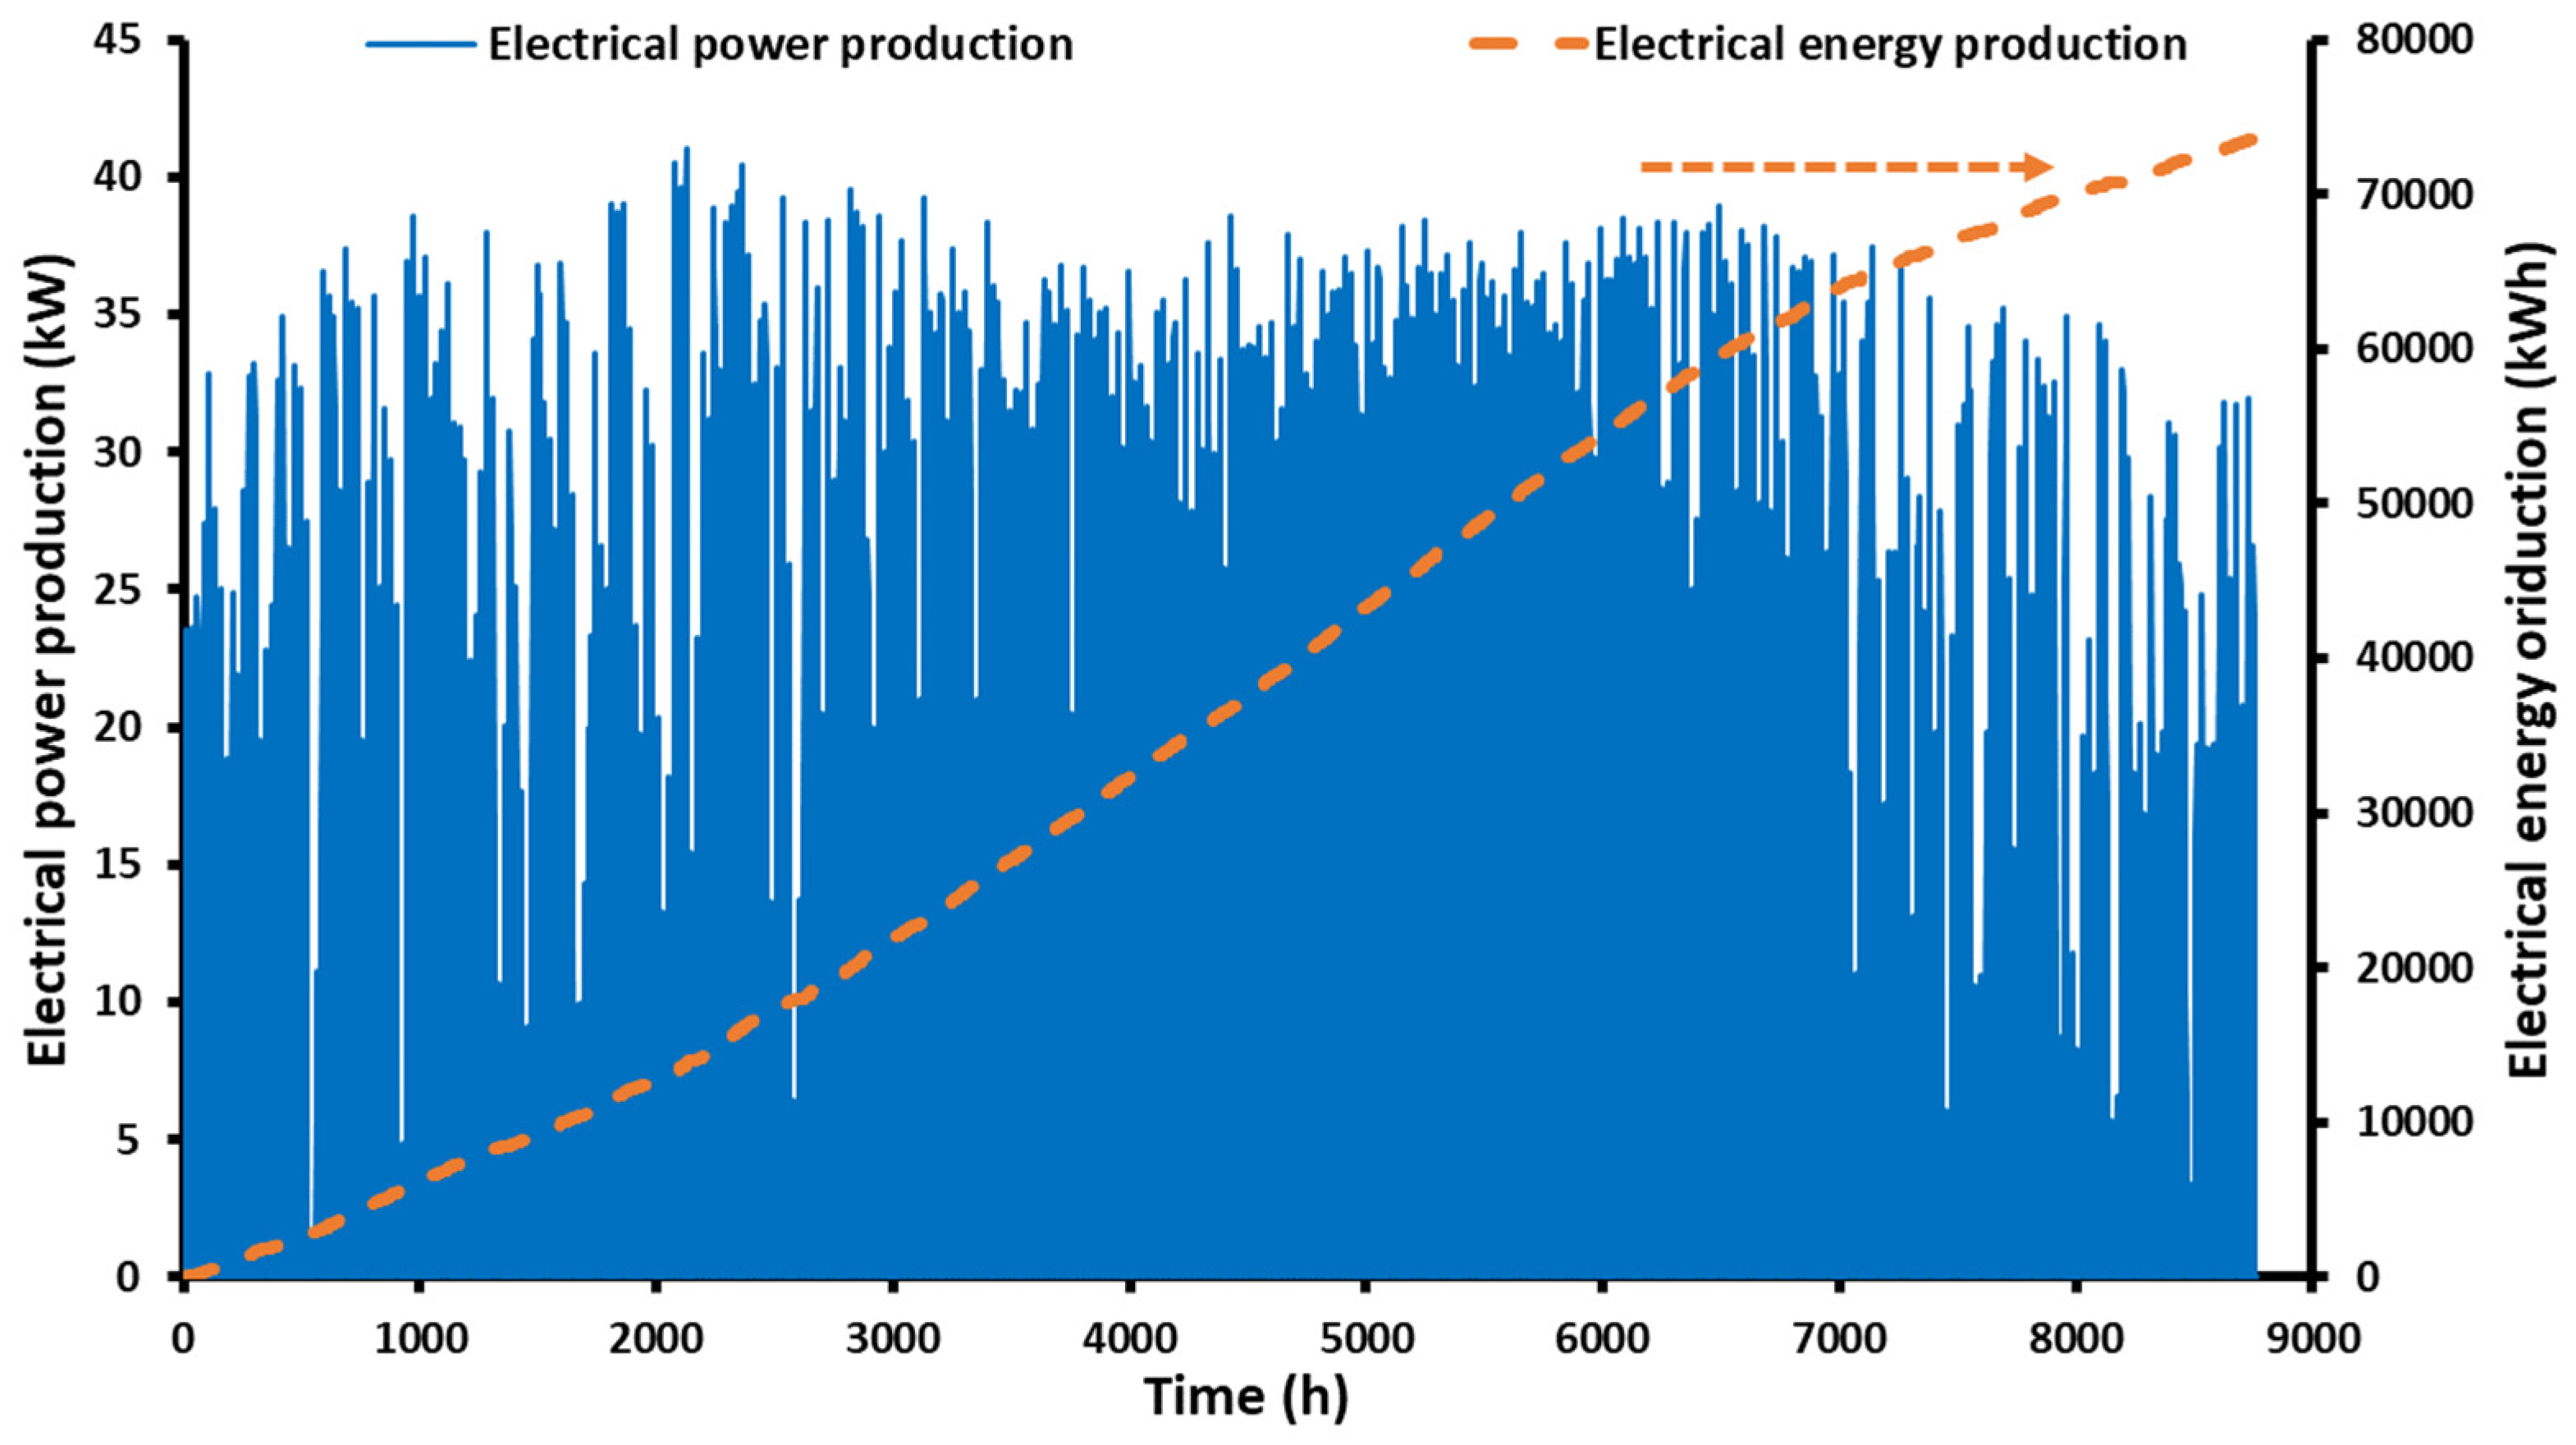
- The PV performance is found at 18.03% and it corresponds to a produced electricity of 63,637 kWh or 313.5 kWhel/m2 of the PV field. From the produced quantity, only the 11,062 kWh are directly absorbed by the building, which is about 17.4% of the produced energy, while the remaining quantity feeds the electrolyzer device.
- -
- The minimum stored quantity was observed on 27 March and it corresponds to 2.6% of the maximum stored quantity, while the maximum charge (100%) was found on 21 October.
Author Contributions
Funding
Data Availability Statement
Conflicts of Interest
Nomenclature
| A | Area, m2 |
| COP | Coefficient of performance |
| cp | Specific heat capacity, kJ/kgK |
| EER | Energy efficiency ratio |
| f | Cell temperature coefficient, Km2/W |
| fr | Fraction of the operation, % |
| GT | Global solar irradiation on the tilted surface, W/m2 |
| LHV | Lower heating value, MJ/kg |
| SCOP | Seasonal coefficient of performance |
| SEER | Seasonal energy efficiency ratio |
| Pel | Electricity rate, kW |
| Q | Heat rate, kW |
| qa-l | Specific load for appliances and lighting, W/m2 |
| T | Temperature, °C |
| U | Structural element thermal transmittance, W/m2K |
| Greek Symbols | |
| β | Temperature reduction coefficient of the photovoltaic cell, K−1 |
| ηel | Electrical efficiency of the PV |
| ηel,ref | Reference electrical efficiency of the PV |
| ηelect | Electrolyzer conversion efficiency |
| ηfc | Fuel cell conversion efficiency |
| Subscripts and Superscripts | |
| am | Ambient |
| cell | Photovoltaic cell |
| cool | Cooling |
| DHW | Domestic hot water |
| floor | Building floor |
| el, a-l | Electricity for appliances & lighting |
| el, DHW | Electricity for domestic hot water |
| el, elect | Electricity in the electrolyzer |
| el, fc | Electricity in the fuel cell |
| el, tot | Electricity total |
| grid | Grid |
| heat | Heating |
| hp, cool | Heat pump, cooling |
| hp, heat | Heat pump heating |
| H2,cons | Hydrogen consumption |
| H2,prod | Hydrogen production100 |
| PV | Photovoltaic |
| ref | Reference |
| Abbreviations | |
| DHW | Domestic Hot Water |
| PV | Photovoltaics |
| TMY | Typical Meteorological Year |
References
- Ince, A.C.; Colpan, C.O.; Hagen, A.; Serincan, M.F. Modeling and simulation of Power-to-X systems: A review. Fuel 2021, 304, 121354. [Google Scholar] [CrossRef]
- Incer-Valverde, J.; Patiño-Arévalo, L.J.; Tsatsaronis, G.; Morosuk, T. Hydrogen-driven Power-to-X: State of the art and multicriteria evaluation of a study case. Energy Convers. Manag. 2022, 266, 115814. [Google Scholar] [CrossRef]
- Dumont, O.; Frate, G.F.; Pillai, A.; Lecompte, S.; De paepe, M.; Lemort, V. Carnot battery technology: A state-of-the-art review. J. Energy Storage 2020, 32, 101756. [Google Scholar] [CrossRef]
- Burre, J.; Bongartz, D.; Brée, L.; Roh, K.; Mitsos, A. Power-to-X: Between Electricity Storage, e-Production, and Demand Side Management. Chem. Ing. Tech. 2020, 92, 74–84. [Google Scholar] [CrossRef] [Green Version]
- Koj, J.C.; Wulf, C.; Zapp, P. Environmental impacts of power-to-X systems—A review of technological and methodological choices in Life Cycle Assessments. Renew. Sustain. Energy Rev. 2019, 112, 865–879. [Google Scholar] [CrossRef]
- Cholewa, T.; Semmel, M.; Mantei, F.; Güttel, R.; Salem, O. Process Intensification Strategies for Power-to-X Technologies. ChemEngineering 2022, 6, 13. [Google Scholar] [CrossRef]
- Frate, G.F.; Ferrari, L.; Desideri, U. Rankine Carnot Batteries with the Integration of Thermal Energy Sources: A Review. Energies 2020, 13, 4766. [Google Scholar] [CrossRef]
- Wulf, C.; Zapp, P.; Schreiber, A. Review of Power-to-X Demonstration Projects in Europe. Front. Energy Res. 2020, 8, 191. [Google Scholar] [CrossRef]
- Ullah, M.; Gutierrez-Rojas, D.; Inkeri, E.; Tynjälä, T.; Nardelli, P.H.J. Operation of Power-to-X-Related Processes Based on Advanced Data-Driven Methods: A Comprehensive Review. Energies 2022, 15, 8118. [Google Scholar] [CrossRef]
- Poluzzi, A.; Guandalini, G.; d’Amore, F.; Romano, M.C. The Potential of Power and Biomass-to-X Systems in the Decarbonization Challenge: A Critical Review. Curr. Sustain. Energy Rep. 2021, 8, 242–252. [Google Scholar] [CrossRef]
- Rego de Vasconcelos, B.; Lavoie, J.-M. Recent Advances in Power-to-X Technology for the Production of Fuels and Chemicals. Front. Chem. 2019, 7, 392. [Google Scholar] [CrossRef] [PubMed] [Green Version]
- Genovese, M.; Schlüter, A.; Scionti, E.; Piraino, F.; Corigliano, O.; Fragiacomo, P. Power-to-hydrogen and hydrogen-to-X energy systems for the industry of the future in Europe. Int. J. Hydrogen Energy 2023, in press. [Google Scholar] [CrossRef]
- Chakraborty, S.; Dash, S.K.; Elavarasan, R.M.; Kaur, A.; Elangovan, D.; Meraj, S.T.; Kasinathan, P.; Said, Z. Hydrogen Energy as Future of Sustainable Mobility. Front. Energy Res. 2022, 10. [Google Scholar] [CrossRef]
- Sun, K.; Chen, X.; Maleki Dastjerdi, S.; Yang, Q. Dynamic simulation of hydrogen-based off-grid zero energy buildings with hydrogen storage considering Fanger model thermal comfort. Int. J. Hydrogen Energy 2022, 47, 26435–26457. [Google Scholar] [CrossRef]
- Temiz, M.; Dincer, I. Design and assessment of a solar energy based integrated system with hydrogen production and storage for sustainable buildings. Int. J. Hydrogen Energy 2023, in press. [Google Scholar] [CrossRef]
- Hai, T.; Ashraf Ali, M.; Dhahad, H.A.; Alizadeh, A.; Sharma, A.; Fahad Almojil, S.; Almohana, A.I.; Alali, A.F.; Wang, D. Optimal design and transient simulation next to environmental consideration of net-zero energy buildings with green hydrogen production and energy storage system. Fuel 2023, 336, 127126. [Google Scholar] [CrossRef]
- Guo, P.; Musharavati, F.; Dastjerdi, S.M. Design and transient-based analysis of a power to hydrogen (P2H2) system for an off-grid zero energy building with hydrogen energy storage. Int. J. Hydrogen Energy 2022, 47, 26515–26536. [Google Scholar] [CrossRef]
- Zhou, L.; Zhou, Y. Study on thermo-electric-hydrogen conversion mechanisms and synergistic operation on hydrogen fuel cell and electrochemical battery in energy flexible buildings. Energy Convers. Manag. 2023, 277, 116610. [Google Scholar] [CrossRef]
- Zhang, X.; Yan, R.; Zeng, R.; Zhu, R.; Kong, X.; He, Y.; Li, H. Integrated performance optimization of a biomass-based hybrid hydrogen/thermal energy storage system for building and hydrogen vehicles. Renew. Energy 2022, 187, 801–818. [Google Scholar] [CrossRef]
- Nikitin, A.; Deymi-Dashtebayaz, M.; Baranov, I.V.; Sami, S.; Nikitina, V.; Abadi, M.K.; Rumiantceva, O. Energy, exergy, economic and environmental (4E) analysis using a renewable multi-generation system in a near-zero energy building with hot water and hydrogen storage systems. J. Energy Storage 2023, 62, 106794. [Google Scholar] [CrossRef]
- Khoshgoftar Manesh, M.H.; Mousavi Rabeti, S.A.; Nourpour, M.; Said, Z. Energy, exergy, exergoeconomic, and exergoenvironmental analysis of an innovative solar-geothermal-gas driven polygeneration system for combined power, hydrogen, hot water, and freshwater production. Sustain. Energy Technol. Assess. 2022, 51, 101861. [Google Scholar] [CrossRef]
- Welcome|TRNSYS: Transient System Simulation Tool n.d. Available online: https://www.trnsys.com/ (accessed on 19 February 2023).
- Bellos, E.; Lykas, P.; Tzivanidis, C. Theoretical Analysis of a Biomass-Driven Single-Effect Absorption Heat Pump for Heating and Cooling Purposes. Appl. Syst. Innov. 2022, 5, 99. [Google Scholar] [CrossRef]
- Technical Chamber of Greece. TOTEE_20701-1_2017_TEE_1st_Edition.pdf n.d. Available online: https://www.andrianos.gr/images/documents/nomothesia/TOTEE_20701-1_2017_TEE_1st_Edition.pdf (accessed on 19 February 2023).
- Paatero, J.V.; Lund, P.D. A model for generating household electricity load profiles. Int. J. Energy Res. 2006, 30, 273–290. [Google Scholar] [CrossRef] [Green Version]
- 14:00-17:00. ISO 7730:2005. ISO n.d. Available online: https://www.iso.org/standard/39155.html (accessed on 19 February 2023).
- Bellos, E.; Papavasileiou, L.; Kekatou, M.; Karagiorgas, M. A Comparative Energy and Economic Analysis of Different Solar Thermal Domestic Hot Water Systems for the Greek Climate Zones: A Multi-Objective Evaluation Approach. Appl. Sci. 2022, 12, 4566. [Google Scholar] [CrossRef]
- Technical Chamber of Greece. TOTEE-20701-3-Final-TEE 2nd.pdf n.d. Available online: https://eclass.teiwm.gr/modules/document/file.php/GETA200/TOTEE-20701-3-Final-TEE%202nd.pdf (accessed on 19 February 2023).
- Ahmed, K.; Pylsy, P.; Kurnitski, J. Hourly consumption profiles of domestic hot water for different occupant groups in dwellings. Sol. Energy 2016, 137, 516–530. [Google Scholar] [CrossRef]
- X63_333-345W_EN_web.pdf n.d. Available online: https://www.aleo-solar.com/ (accessed on 19 February 2023).
- JRC Photovoltaic Geographical Information System (PVGIS)—European Commission n.d. Available online: https://re.jrc.ec.europa.eu/pvg_tools/en/tools.html#PVP (accessed on 19 February 2023).
- Ni, M.; Leung, M.K.H.; Leung, D.Y.C. Energy and exergy analysis of hydrogen production by a proton exchange membrane (PEM) electrolyzer plant. Energy Convers. Manag. 2008, 49, 2748–2756. [Google Scholar] [CrossRef]
- Lykas, P.; Georgousis, N.; Kitsopoulou, A.; Korres, D.N.; Bellos, E.; Tzivanidis, C. A Detailed Parametric Analysis of a Solar-Powered Cogeneration System for Electricity and Hydrogen Production. Appl. Sci. 2023, 13, 433. [Google Scholar] [CrossRef]
- Lykas, P.; Bellos, E.; Caralis, G.; Tzivanidis, C. Dynamic Investigation and Optimization of a Solar-Based Unit for Power and Green Hydrogen Production: A Case Study of the Greek Island, Kythnos. Appl. Sci. 2022, 12, 11134. [Google Scholar] [CrossRef]
- Lower and Higher Heating Values of Fuels|Hydrogen Tools n.d. Available online: https://h2tools.org/hyarc/calculator-tools/lower-and-higher-heating-values-fuels (accessed on 19 February 2023).
- Montazerinejad, H.; Fakhimi, E.; Ghandehariun, S.; Ahmadi, P. Advanced exergy analysis of a PEM fuel cell with hydrogen energy storage integrated with organic Rankine cycle for electricity generation. Sustain. Energy Technol. Assess. 2022, 51, 101885. [Google Scholar] [CrossRef]
- Skoplaki, E.; Boudouvis, A.G.; Palyvos, J.A. A simple correlation for the operating temperature of photovoltaic modules of arbitrary mounting. Sol. Energy Mater. Sol. Cells 2008, 92, 1393–1402. [Google Scholar] [CrossRef]
- Skoplaki, E.; Palyvos, J.A. Operating temperature of photovoltaic modules: A survey of pertinent correlations. Renew. Energy 2009, 34, 23–29. [Google Scholar] [CrossRef]
- Al-Badi, A.; Al Wahaibi, A.; Ahshan, R.; Malik, A. Techno-Economic Feasibility of a Solar-Wind-Fuel Cell Energy System in Duqm, Oman. Energies 2022, 15, 5379. [Google Scholar] [CrossRef]
- Houchins, C.; James, B.D.; Acevedo, Y. Hydrogen Storage Cost Analysis n.d. Available online: https://www.hydrogen.energy.gov/pdfs/review22/st235_houchins_2022_p.pdf (accessed on 19 February 2023).
- Sens, L.; Neuling, U.; Wilbrand, K.; Kaltschmitt, M. Conditioned hydrogen for a green hydrogen supply for heavy duty-vehicles in 2030 and 2050—A techno-economic well-to-tank assessment of various supply chains. Int. J. Hydrogen Energy 2022, in press. [Google Scholar] [CrossRef]


| Parameter | Value |
|---|---|
| Temperature comfort limit in winter | 20 °C |
| Temperature comfort limit in summer | 26 °C |
| Building’s net floor area | 400 m2 |
| Side width (South, West, North, East) | 20 m |
| Height | 3.1 m |
| Area of the south window | 12 m2 |
| Area of the west window | 6 m2 |
| Area of the east window | 6 m2 |
| Infiltration and natural ventilation | 0.8 air change per hour |
| Appliances and lighting specific load | 9 W/m2 |
| Residents | 6 occupants in the rest |
| Specific thermal load per person | 100 W/person (ISO 7730) |
| Ground U-value | 0.304 W/m2K |
| Roof U-value | 0.318 W/m2K |
| Wall U-value | 0.365 W/m2K |
| Window U-value | 1.4 W/m2K |
| Windows g-value | 0.59 |
| Parameter | Value |
|---|---|
| SCOP of the heat pump | 4.0 |
| SEER of the heat pump | 4.0 |
| DHW electrical heater efficiency | 95% |
| DHW daily demand | 50 L/person |
| DHW temperature | 45 °C |
| Water mean grid temperature | 18 °C |
| Electrolyzer mean conversion efficiency | 60% |
| Fuel cell mean conversion efficiency | 40% |
| Density of the stored hydrogen | 7.7 kg/m3 |
| Hydrogen lower heating value | 120 MJ/kg |
| Photovoltaic nominal electrical efficiency | 19.7% |
| Temperature reduction coefficient | −0.004 K−1 |
| Tilt angle of the photovoltaic panels | 30° |
| Azimuth angle of the photovoltaic panels | 0° |
| Energy Parameter | Value (kWh) |
|---|---|
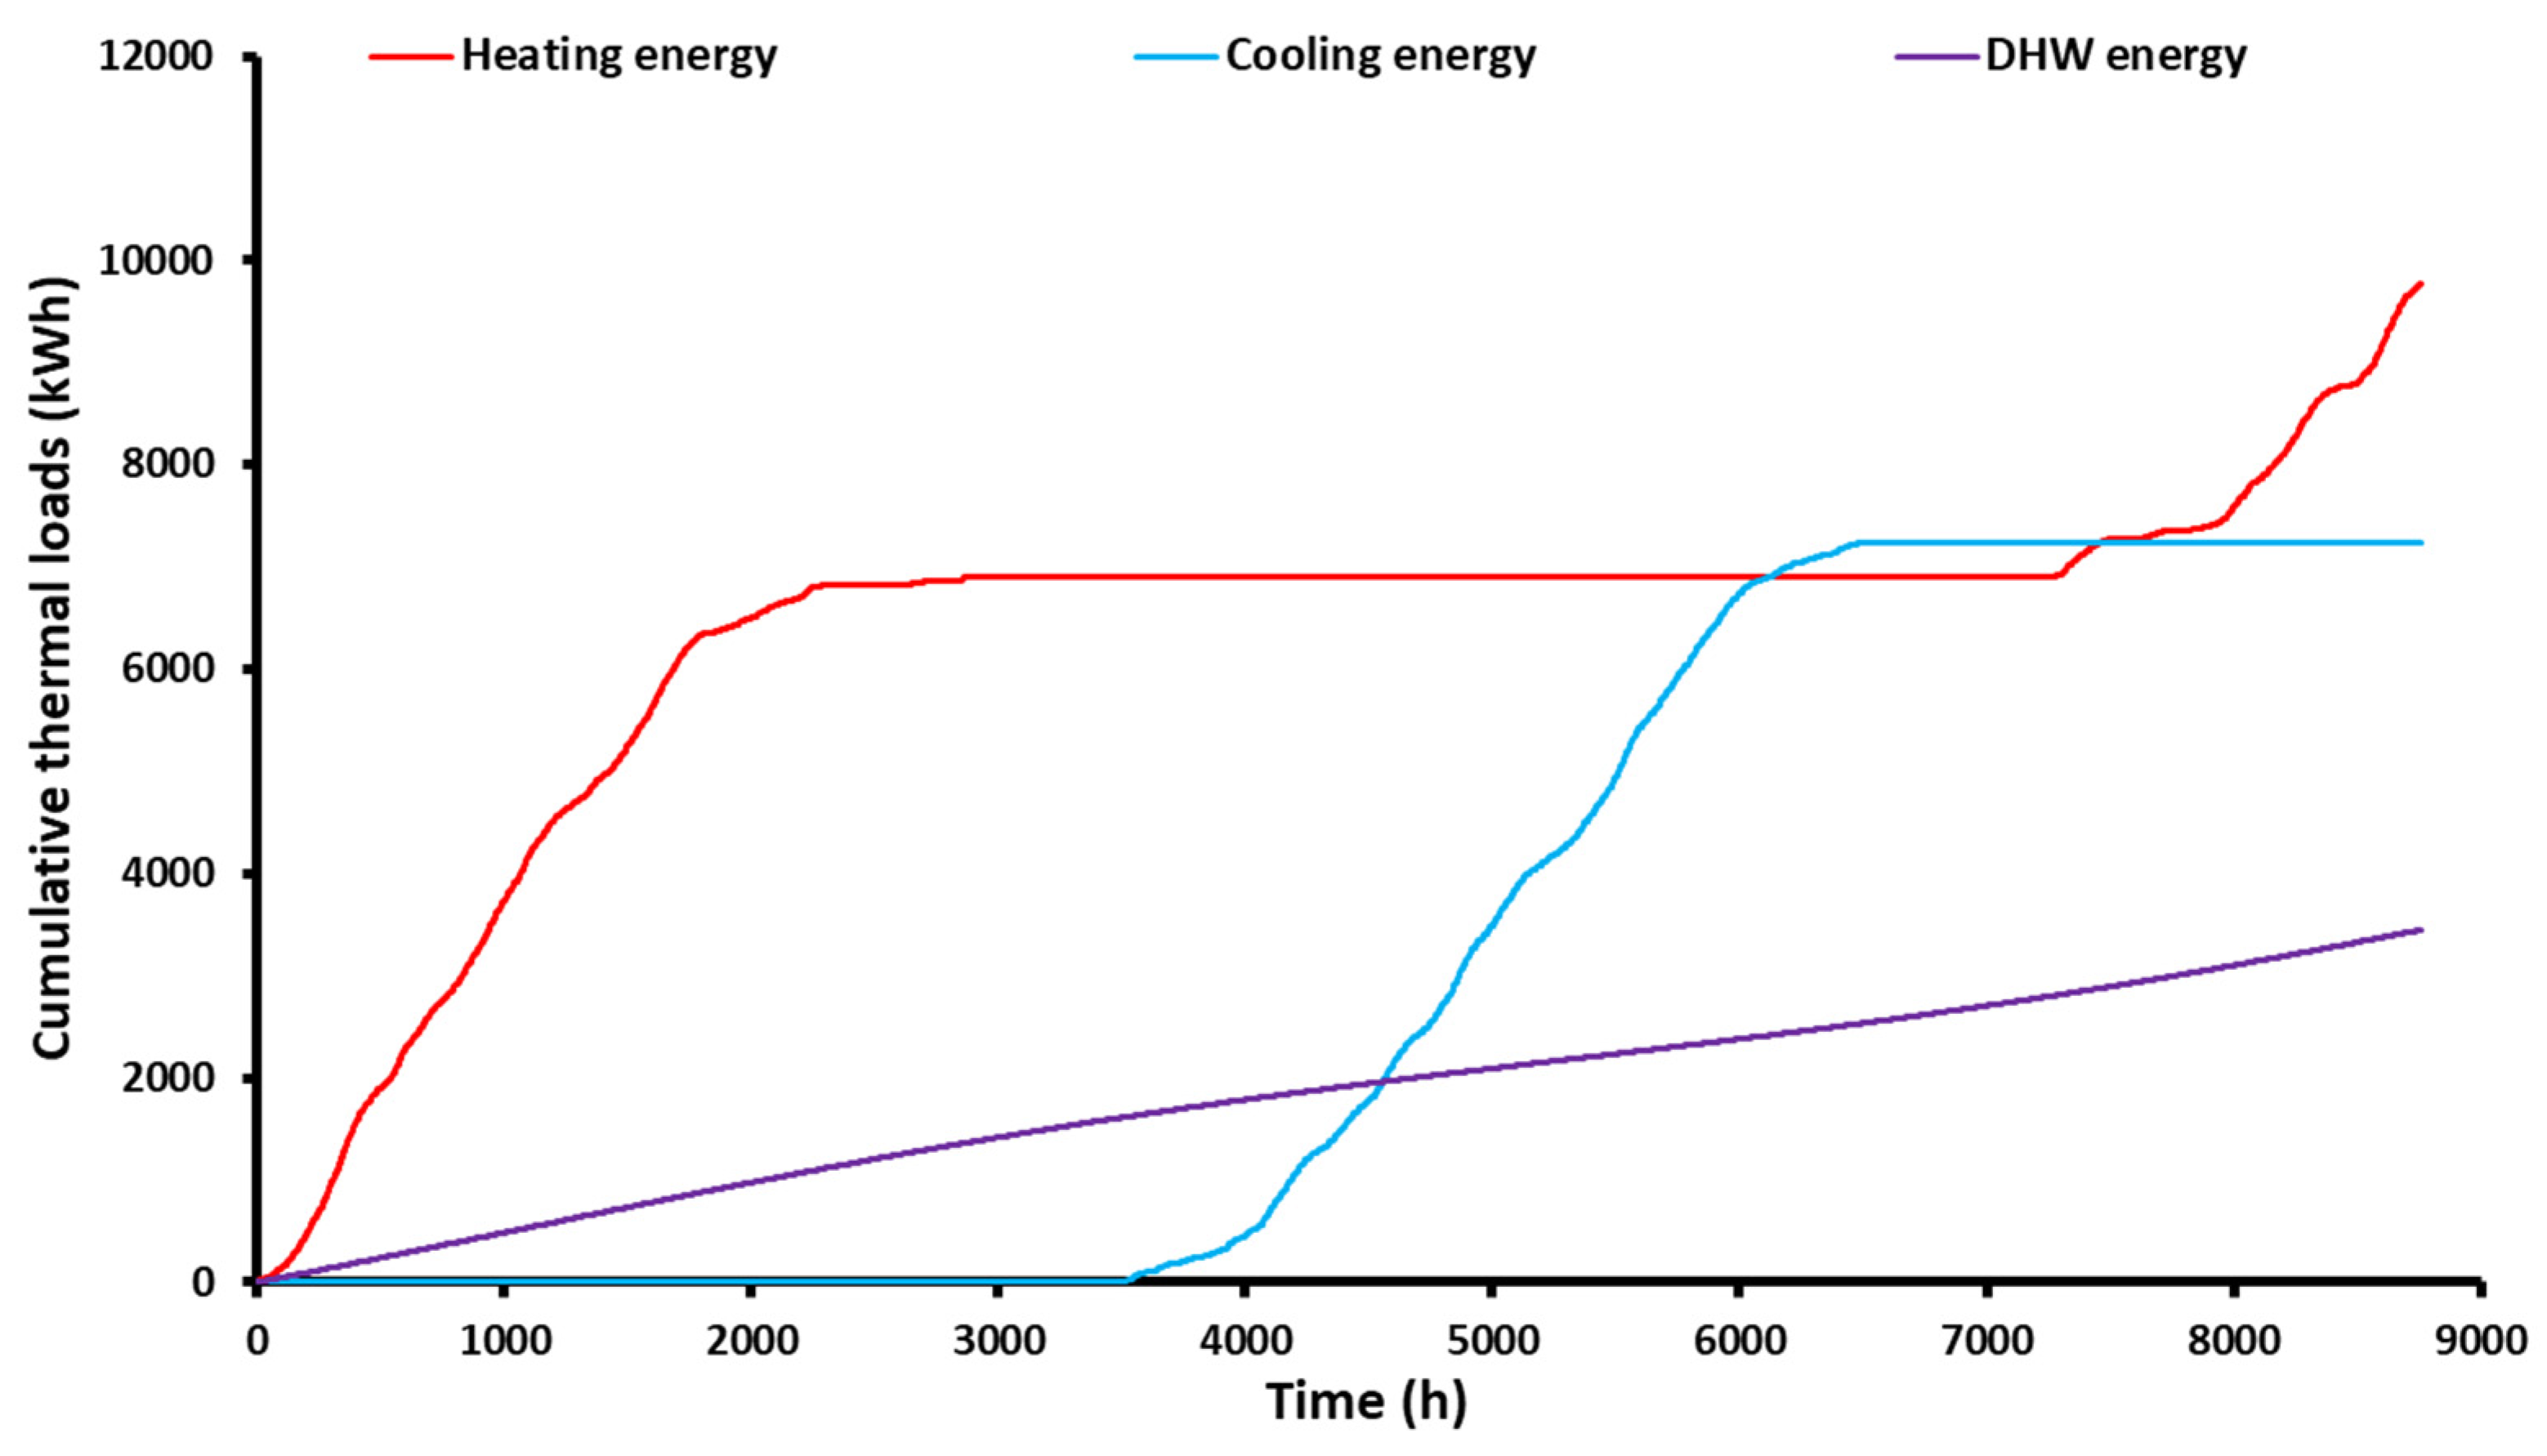
| Heating thermal energy demand | 9777 |
| Cooling thermal energy demand | 7237 |
| DHW thermal energy demand | 3452 |
| Electricity demand for heating | 2444 |
| Electricity demand for cooling | 1809 |
| Electricity demand for DHW | 3634 |
| Electricity demand for appliances and lighting | 15,769 |
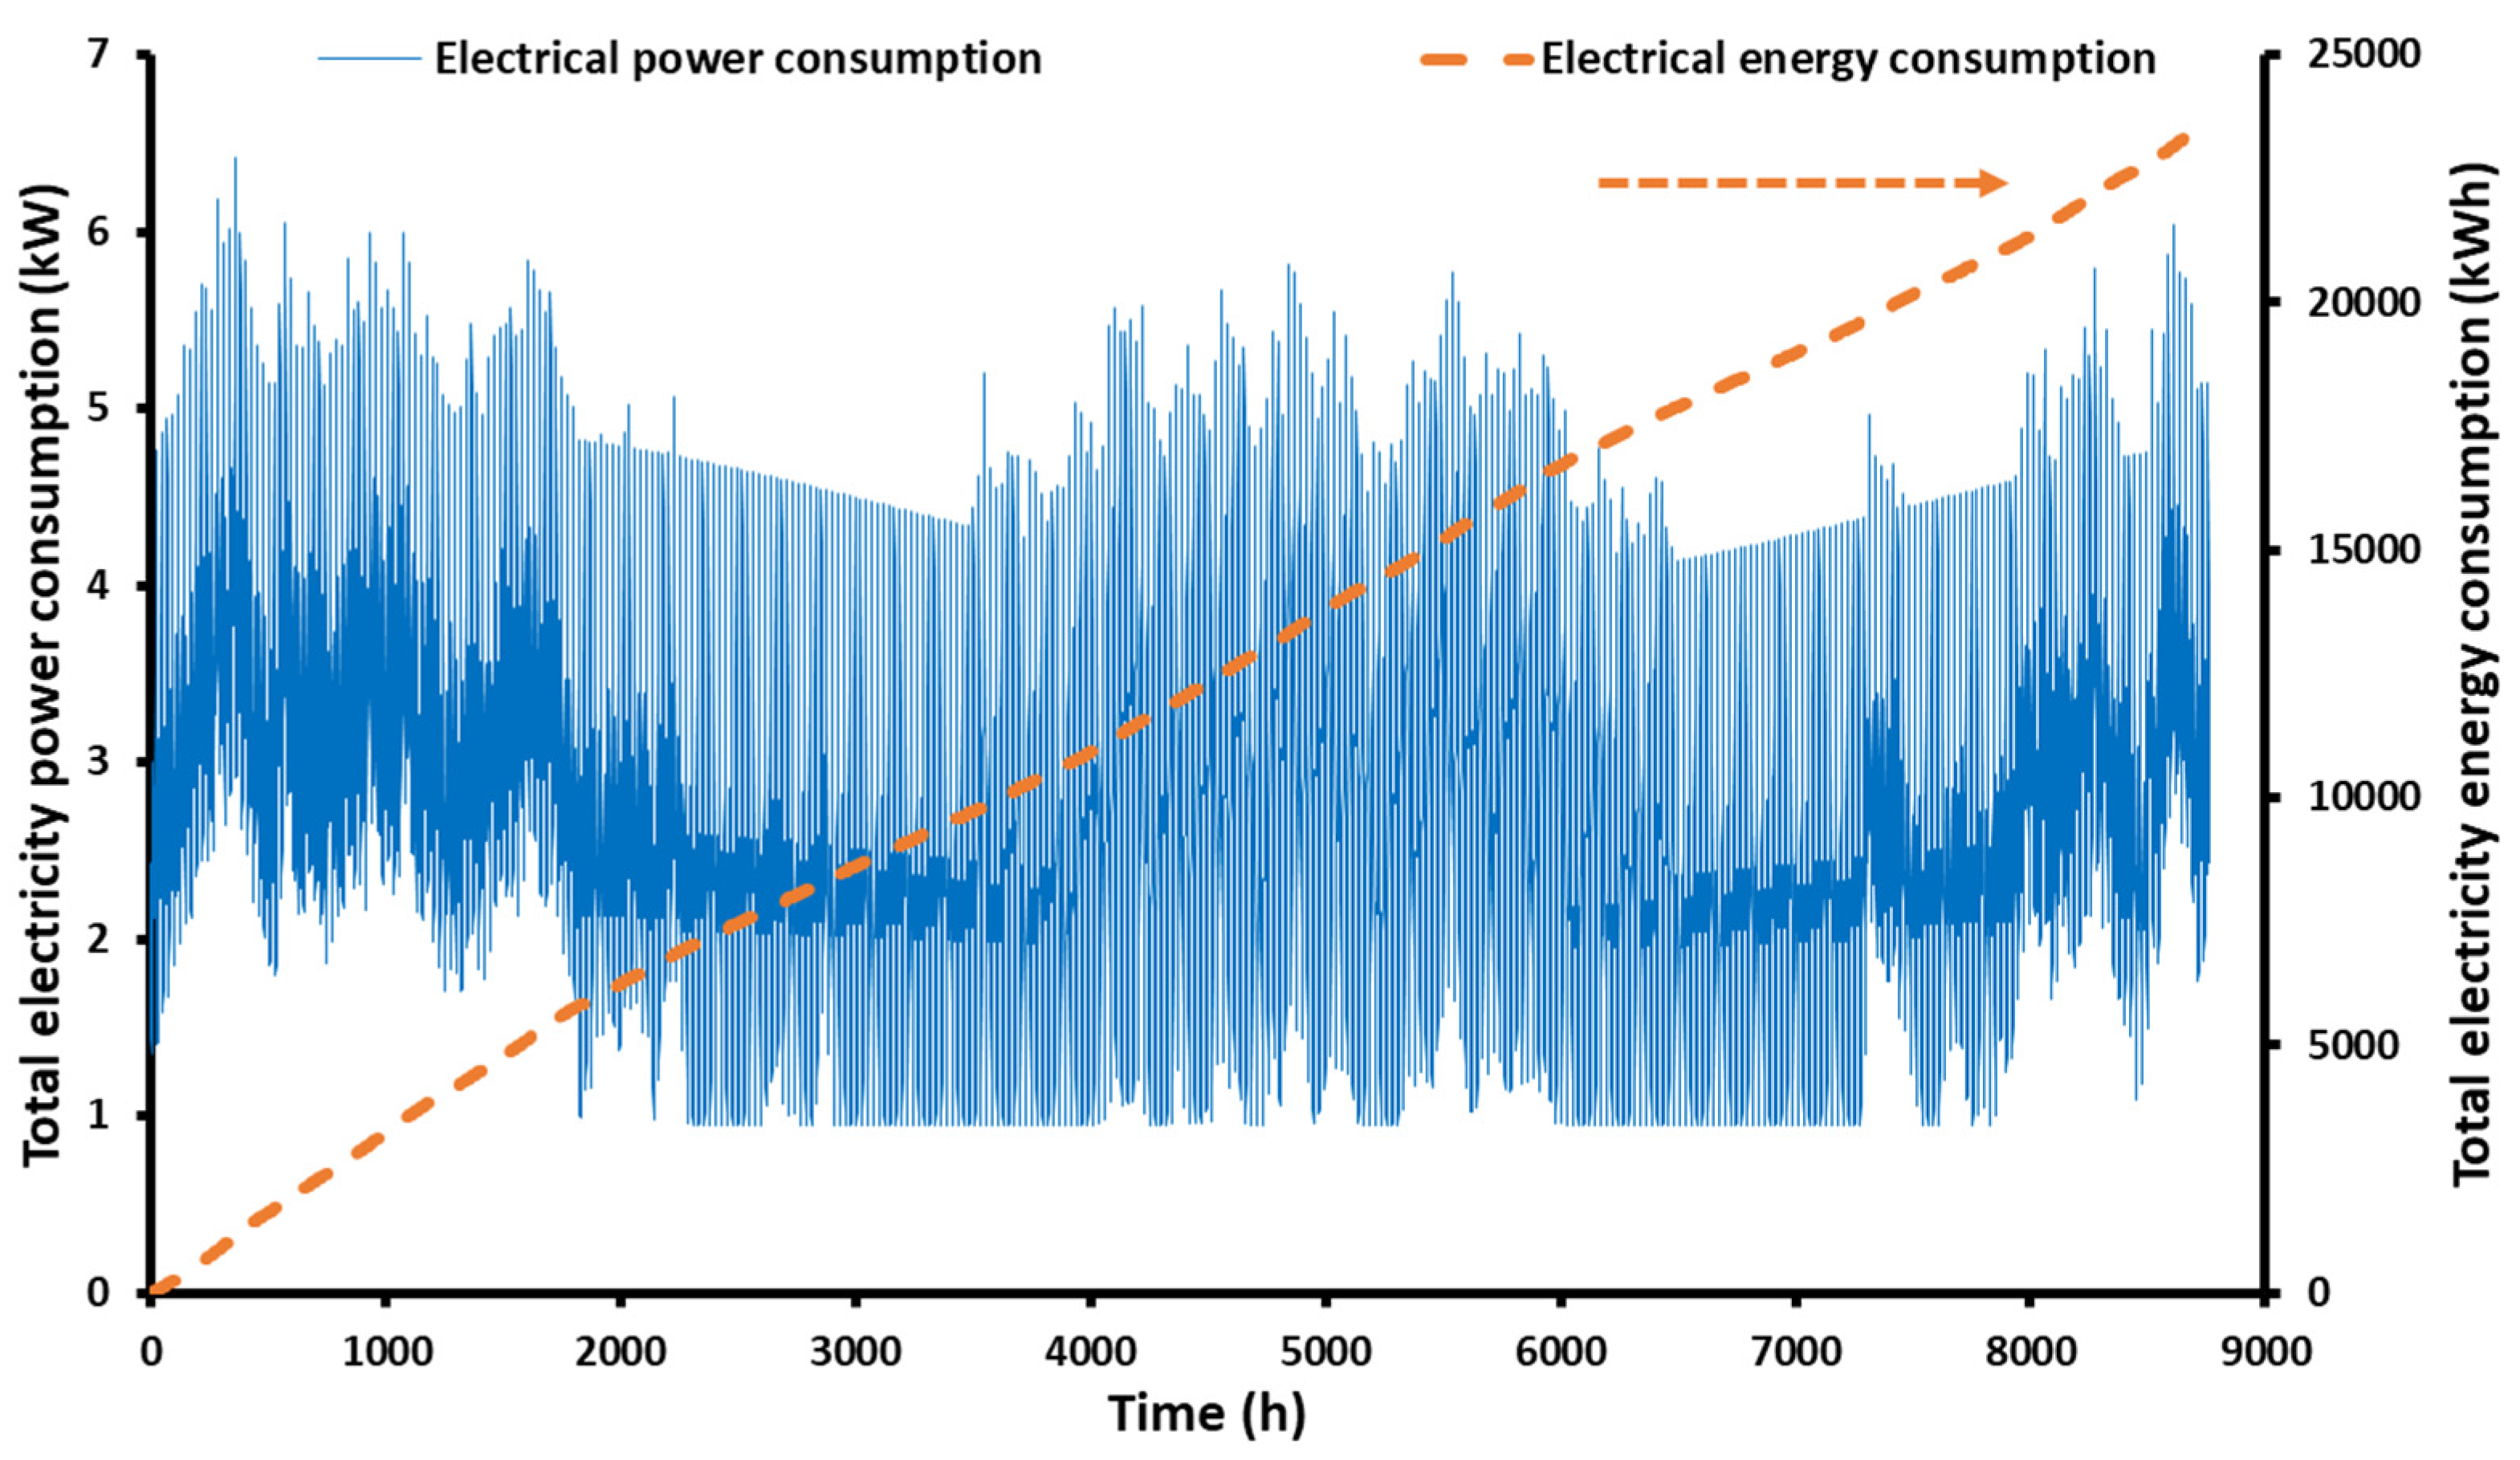
| Total electricity demand | 23,656 |
| Electricity production by the PV | 63,637 |
| Available solar energy | 352,971 |
| Directly absorbed electricity from the PV | 11,062 |
| Electricity input in the electrolyzer | 52,575 |
| Electricity production by the fuel cell | 12,594 |
Disclaimer/Publisher’s Note: The statements, opinions and data contained in all publications are solely those of the individual author(s) and contributor(s) and not of MDPI and/or the editor(s). MDPI and/or the editor(s) disclaim responsibility for any injury to people or property resulting from any ideas, methods, instructions or products referred to in the content. |
© 2023 by the authors. Licensee MDPI, Basel, Switzerland. This article is an open access article distributed under the terms and conditions of the Creative Commons Attribution (CC BY) license (https://creativecommons.org/licenses/by/4.0/).
Share and Cite
Bellos, E.; Lykas, P.; Tzivanidis, C. Performance Analysis of a Zero-Energy Building Using Photovoltaics and Hydrogen Storage. Appl. Syst. Innov. 2023, 6, 43. https://doi.org/10.3390/asi6020043
Bellos E, Lykas P, Tzivanidis C. Performance Analysis of a Zero-Energy Building Using Photovoltaics and Hydrogen Storage. Applied System Innovation. 2023; 6(2):43. https://doi.org/10.3390/asi6020043
Chicago/Turabian StyleBellos, Evangelos, Panagiotis Lykas, and Christos Tzivanidis. 2023. "Performance Analysis of a Zero-Energy Building Using Photovoltaics and Hydrogen Storage" Applied System Innovation 6, no. 2: 43. https://doi.org/10.3390/asi6020043