1. Introduction
Certification tests are one of the most important tests during the design and implementation of a new product for public transport. This is due to the requirements of the standards and the need to conduct them in strictly defined conditions by a recognized certification laboratory. This path also applies to gondolas to overhead cableways [
1,
2]. In the case of fatigue testing of gondolas for cableways, the most important standards are: “Safety requirements for passenger cableways. After-driving. Part 3: Fatigue tests”—EN 13796-3:2017 [
3], “Safety requirements for cableway installations designed to carry persons—Carriers—Part 1: Grips, carrier trucks, on-boards brakes, cabins, chairs, carriages, maintenance carriers, tow-hangers”—EN 13796-1:2017 [
4] and “General requirements for the competence of testing and calibration laboratories”—EN ISO/IEC 17025 [
5]. The gondola design process itself is complex [
6]. The preconditions [
7] (number of people, method of support, materials) as well as working conditions and safety regulations must be taken into account [
8]. In the design process, it is also necessary to take into account the possibility of dynamic loads [
9], hence the need to extend the calculations and experimental tests with appropriate safety factors [
10]. The design of the gondola should also take into account the strength of the load-bearing ropes [
11,
12] and intermediate elements [
13]. Rope damage can cause an accident [
14]. About the testing of trolleys, it is important to select the appropriate methods of connecting elements (welding, riveting, etc.) and their fatigue life [
15,
16,
17,
18,
19]. Concerning the wagons and the vehicles themselves, risk management in the event of overloading is introduced [
6], which also translates into the level of safety factors. Due to the limited information contained in the normative documents [
3,
4,
5], it is necessary to make several decisions based on experience and interpretation of the regulations. The biggest problems in designing and carrying out fatigue tests of cableway gondolas are:
method of attachment;
the method of receiving the degrees of freedom;
method of load distribution on the ground;
a method of smoothly generating a sinusoidal load of a satisfactory frequency;
correct verification of deformation of structures with relatively large dimensions.
An important aspect of the conducted research is an effective, precise, and repeatable measurement of structural deformation [
20]. As already mentioned, according to the standard, the construction should be verified every 500,000 load cycle. One of the best tools for this type of activity is digital image correlation (DIC), which is based on a series of photos and spatial shift of specific points (from a cloud of points) in space during the study [
21], which is recorded by the software for processing the results. The accuracy of such systems depends on the dimensions of the tested object [
22,
23] and in the case of small objects it reaches values below 1 μm (the resolution of the measuring system has a large impact). These systems are based on a similar principle of operation as 3D scanners. The dissemination of the aforementioned research method also results from the development of optical and digital technologies [
23,
24], which, combined with the development of appropriate software, allows for obtaining and processing a large number of results. In the case of fatigue tests of relatively large elements, it is crucial to accurately measure the permanent deformations of the structure.
This work shows the details of the discussed problems and suggested ways to solve them, while maintaining all the requirements of the EN 13796-3 standard and other standards taken into account in material, fatigue and certification tests.
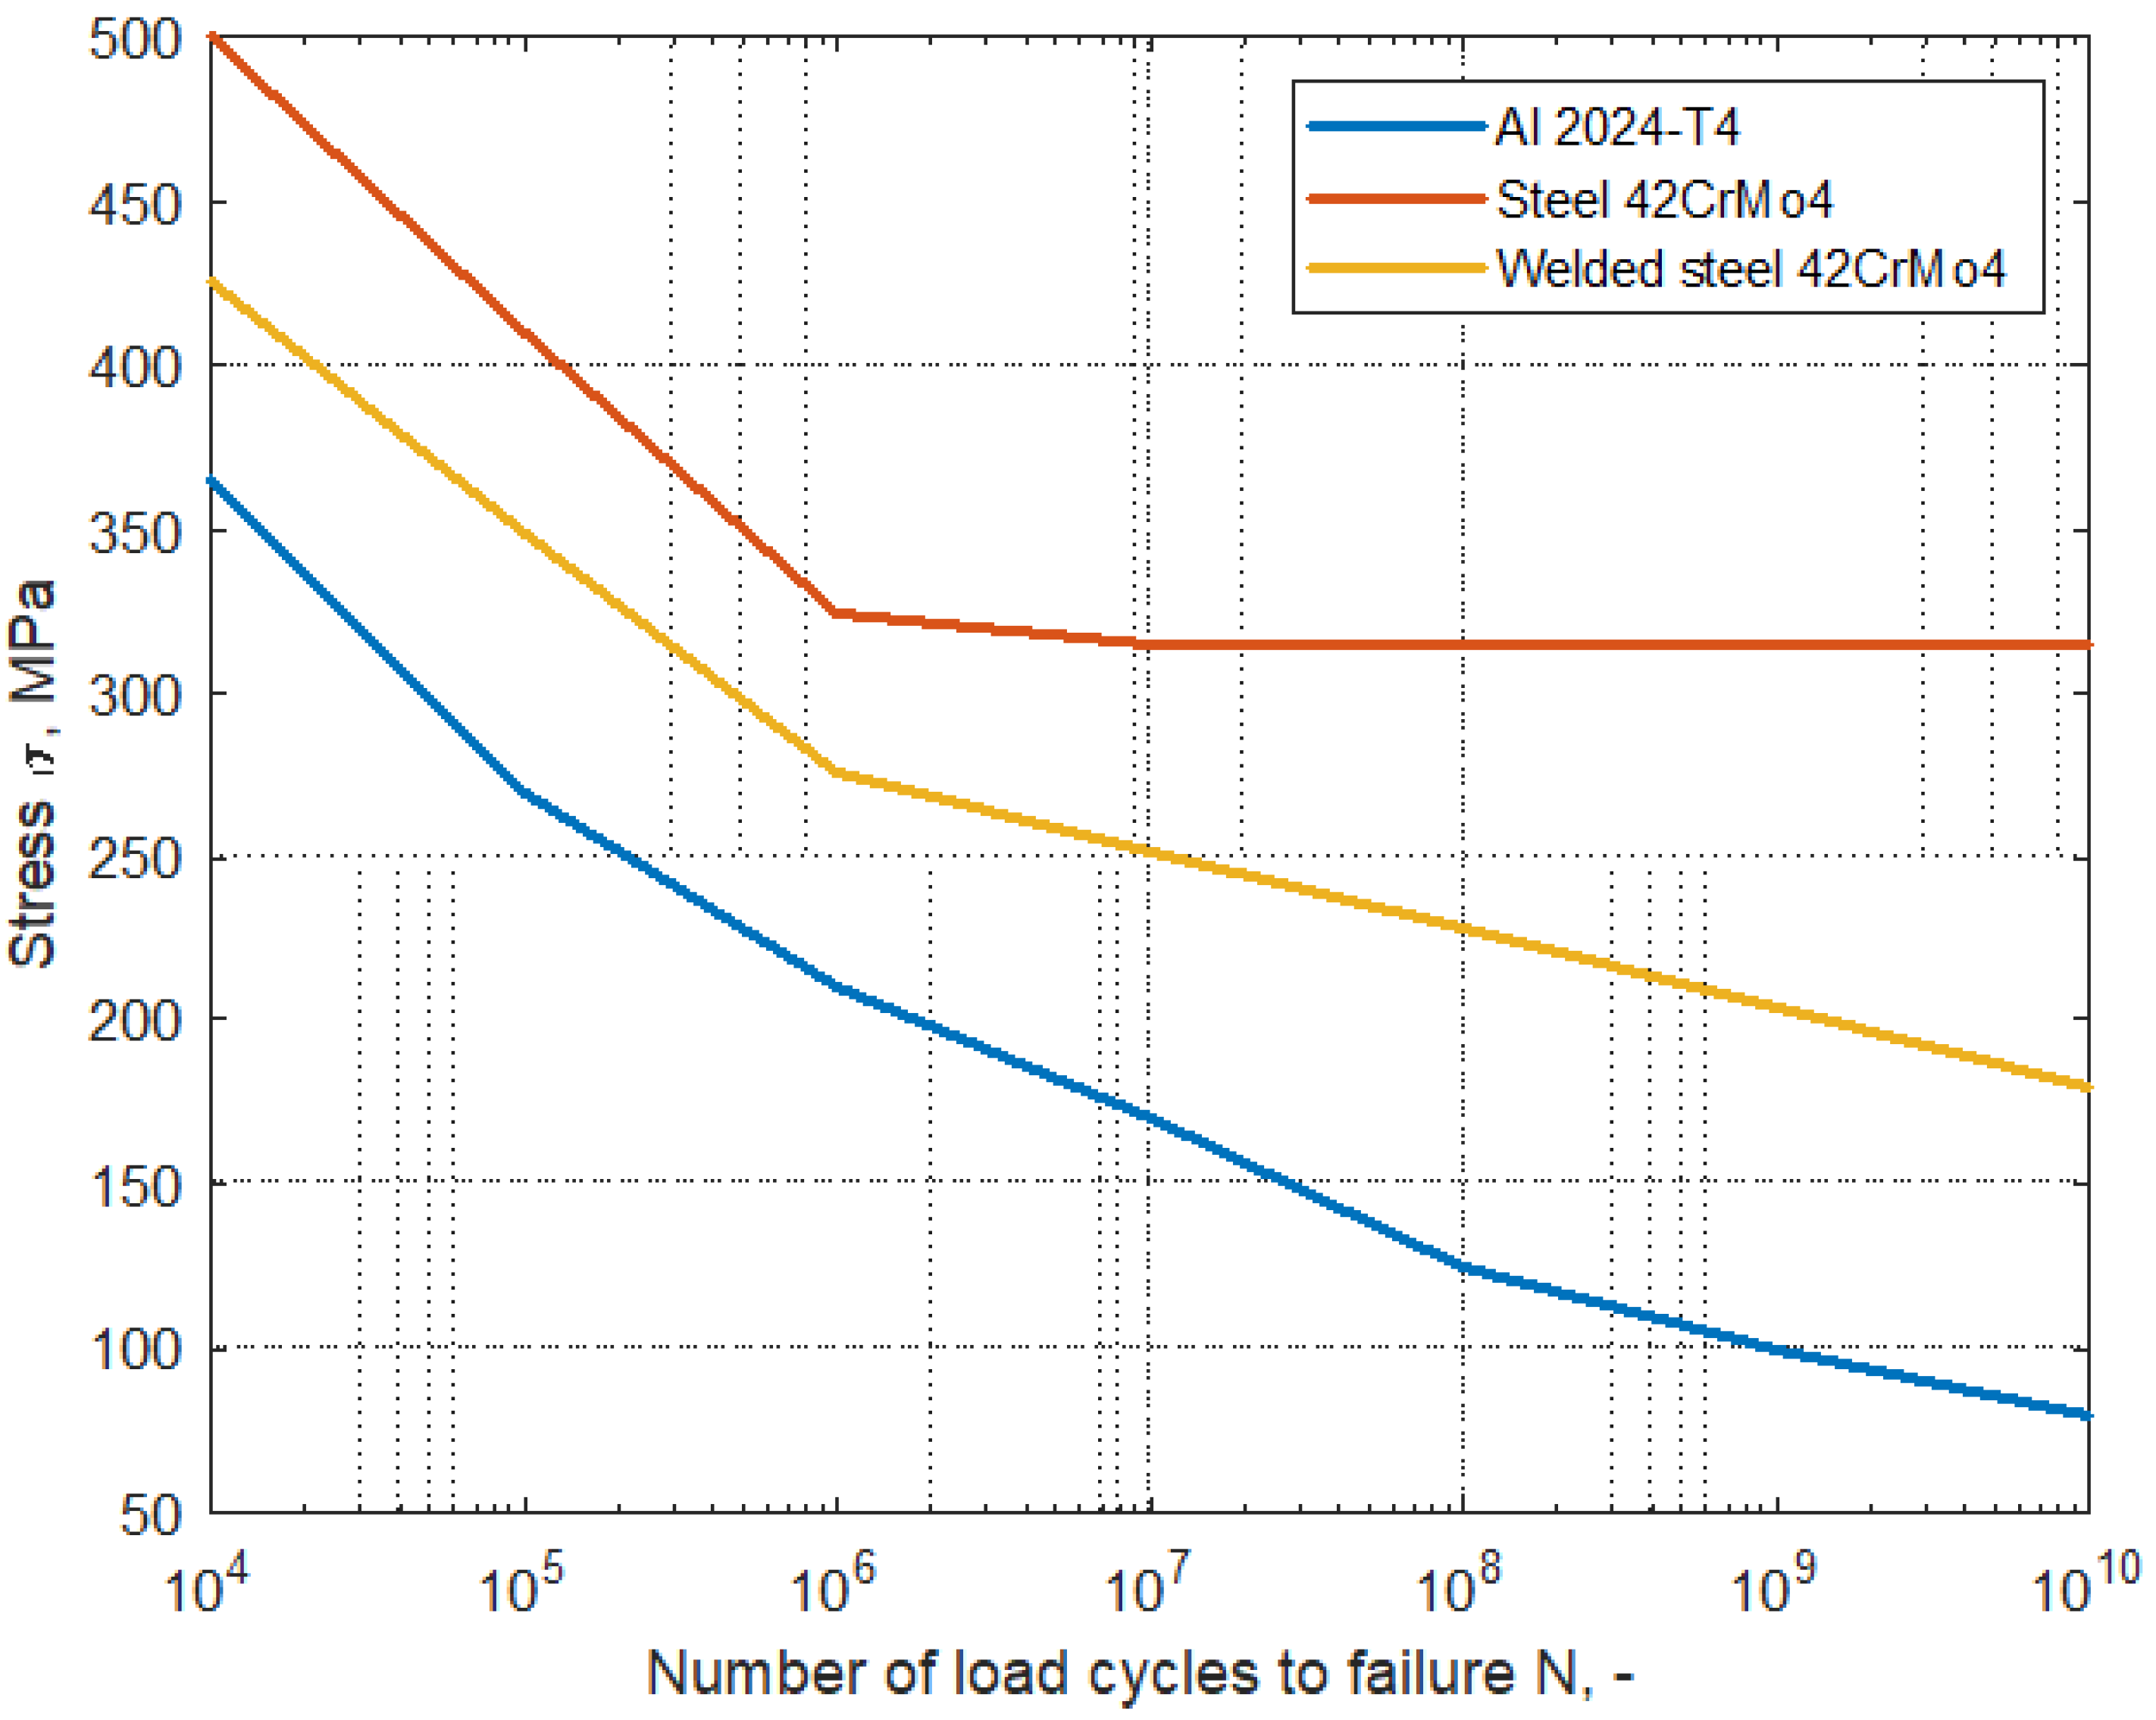
An important aspect of the conducted research is the knowledge of the phenomenon of material fatigue. The construction of the gondola, as mentioned earlier, combines aluminum (Al 2024-T4) and steel (welded) elements made of 42CrMo4 alloy. Depending on the mechanical properties, these materials are characterized by different fatigue strengths caused by a different internal structures and mechanical properties of the materials. Examples of Wőhler plots (S-N curve) are presented in
Figure 1.
In general, 2024-T4 aluminum alloy has a lower fatigue strength [
25] than 42CrMo4 alloy steel. In turn, this steel is also characterized by stability in the range above
cycles (no decrease in durability)—endurance limit. In turn, welding the above alloy reduces its fatigue strength, resulting in lower levels of stress to failure, with the same number of cycles.
Due to the above, as well as the complex state of stresses and complex geometry combined with the complex state of fastening the elements together, it is not possible to select a single curve that would represent fatigue for the above-mentioned materials that could be used for the production of the gondola. Therefore, it is necessary to carry out overall fatigue tests and to verify the structure as a whole, and not its individual parts in fragmentary tests. The above-mentioned statement is the foundation of the proposed and discussed fatigue tests of gondolas for cableways.
The discussed solutions, taking into account additional suggestions and good practices, will be presented on the example of fatigue tests carried out on a gondola for cableways, by TRANSSYSTEM S.A. (Wola Dalsza 367, 37-100 Łańcut, Poland). Following the presented solutions and suggestions allows you to significantly shorten the research time. In the discussed case, it took only 8 weeks, during which 5 million load cycles were generated and 11 DIC tests and visual inspections were carried out.
2. Standards Background
The most important provisions regarding the fatigue tests of cableway gondolas are contained in the following regulations and standards:
The basic quantities characterizing the cyclical fatigue loads are:
The above-mentioned values are intended to characterize the operating conditions of the gondola. The Q size is responsible for the weight of passengers and their equipment, the G value is the empty weight of the gondola without loading. The EN 13796-1 standard defines only the Q value, while the G value is provided by the manufacturer and should take into account the total equipment, i.e., not only the structure of the gondola itself, but also the weight of the chairs, walls and all additional equipment planned to be installed in the gondola.
According to requirements presented in
Table 1, due to the lack of coupling, i.e., testing only the cabin, the load factor was reduced from
to
. The tests are carried out as a function of the intensity of the load (the standard allows for implementation as a function of the elongation that the given load will cause). The generated load should be sinusoidal. In addition, the EN 13796-3 standard assumes that the construction should be verified every 500,000 cycles.
The levels presented in
Figure 2 and in
Table 1 refer to the state of the test. The EN 13796-3 standard assumes testing at two load levels (Level 1 and Level 2, respectively). In practice, level 1 applies to each test, while the values in level 2 depend on the method of attaching the gondola (hence the entered value
a in
Table 1). In total, Level 1 and Level 2 give 5 million load cycles.
Additionally, standard EN 13796-1 [
4], point 6.3.3.2.2, indicates the method of load application. According to the mentioned point “the load equivalent to a standing or semi-seated passenger shall be distributed on the floor”, which means that the load equivalent (by default in
Figure 2) should be distributed on the floor.
The payload values defined by TRANSSYSTEM S.A. are kg, i.e., N (acceleration of gravity m/s). The specified dead weight of the vehicle was defined as kg, i.e., N.
3. Materials and Methodology
3.1. Research Object
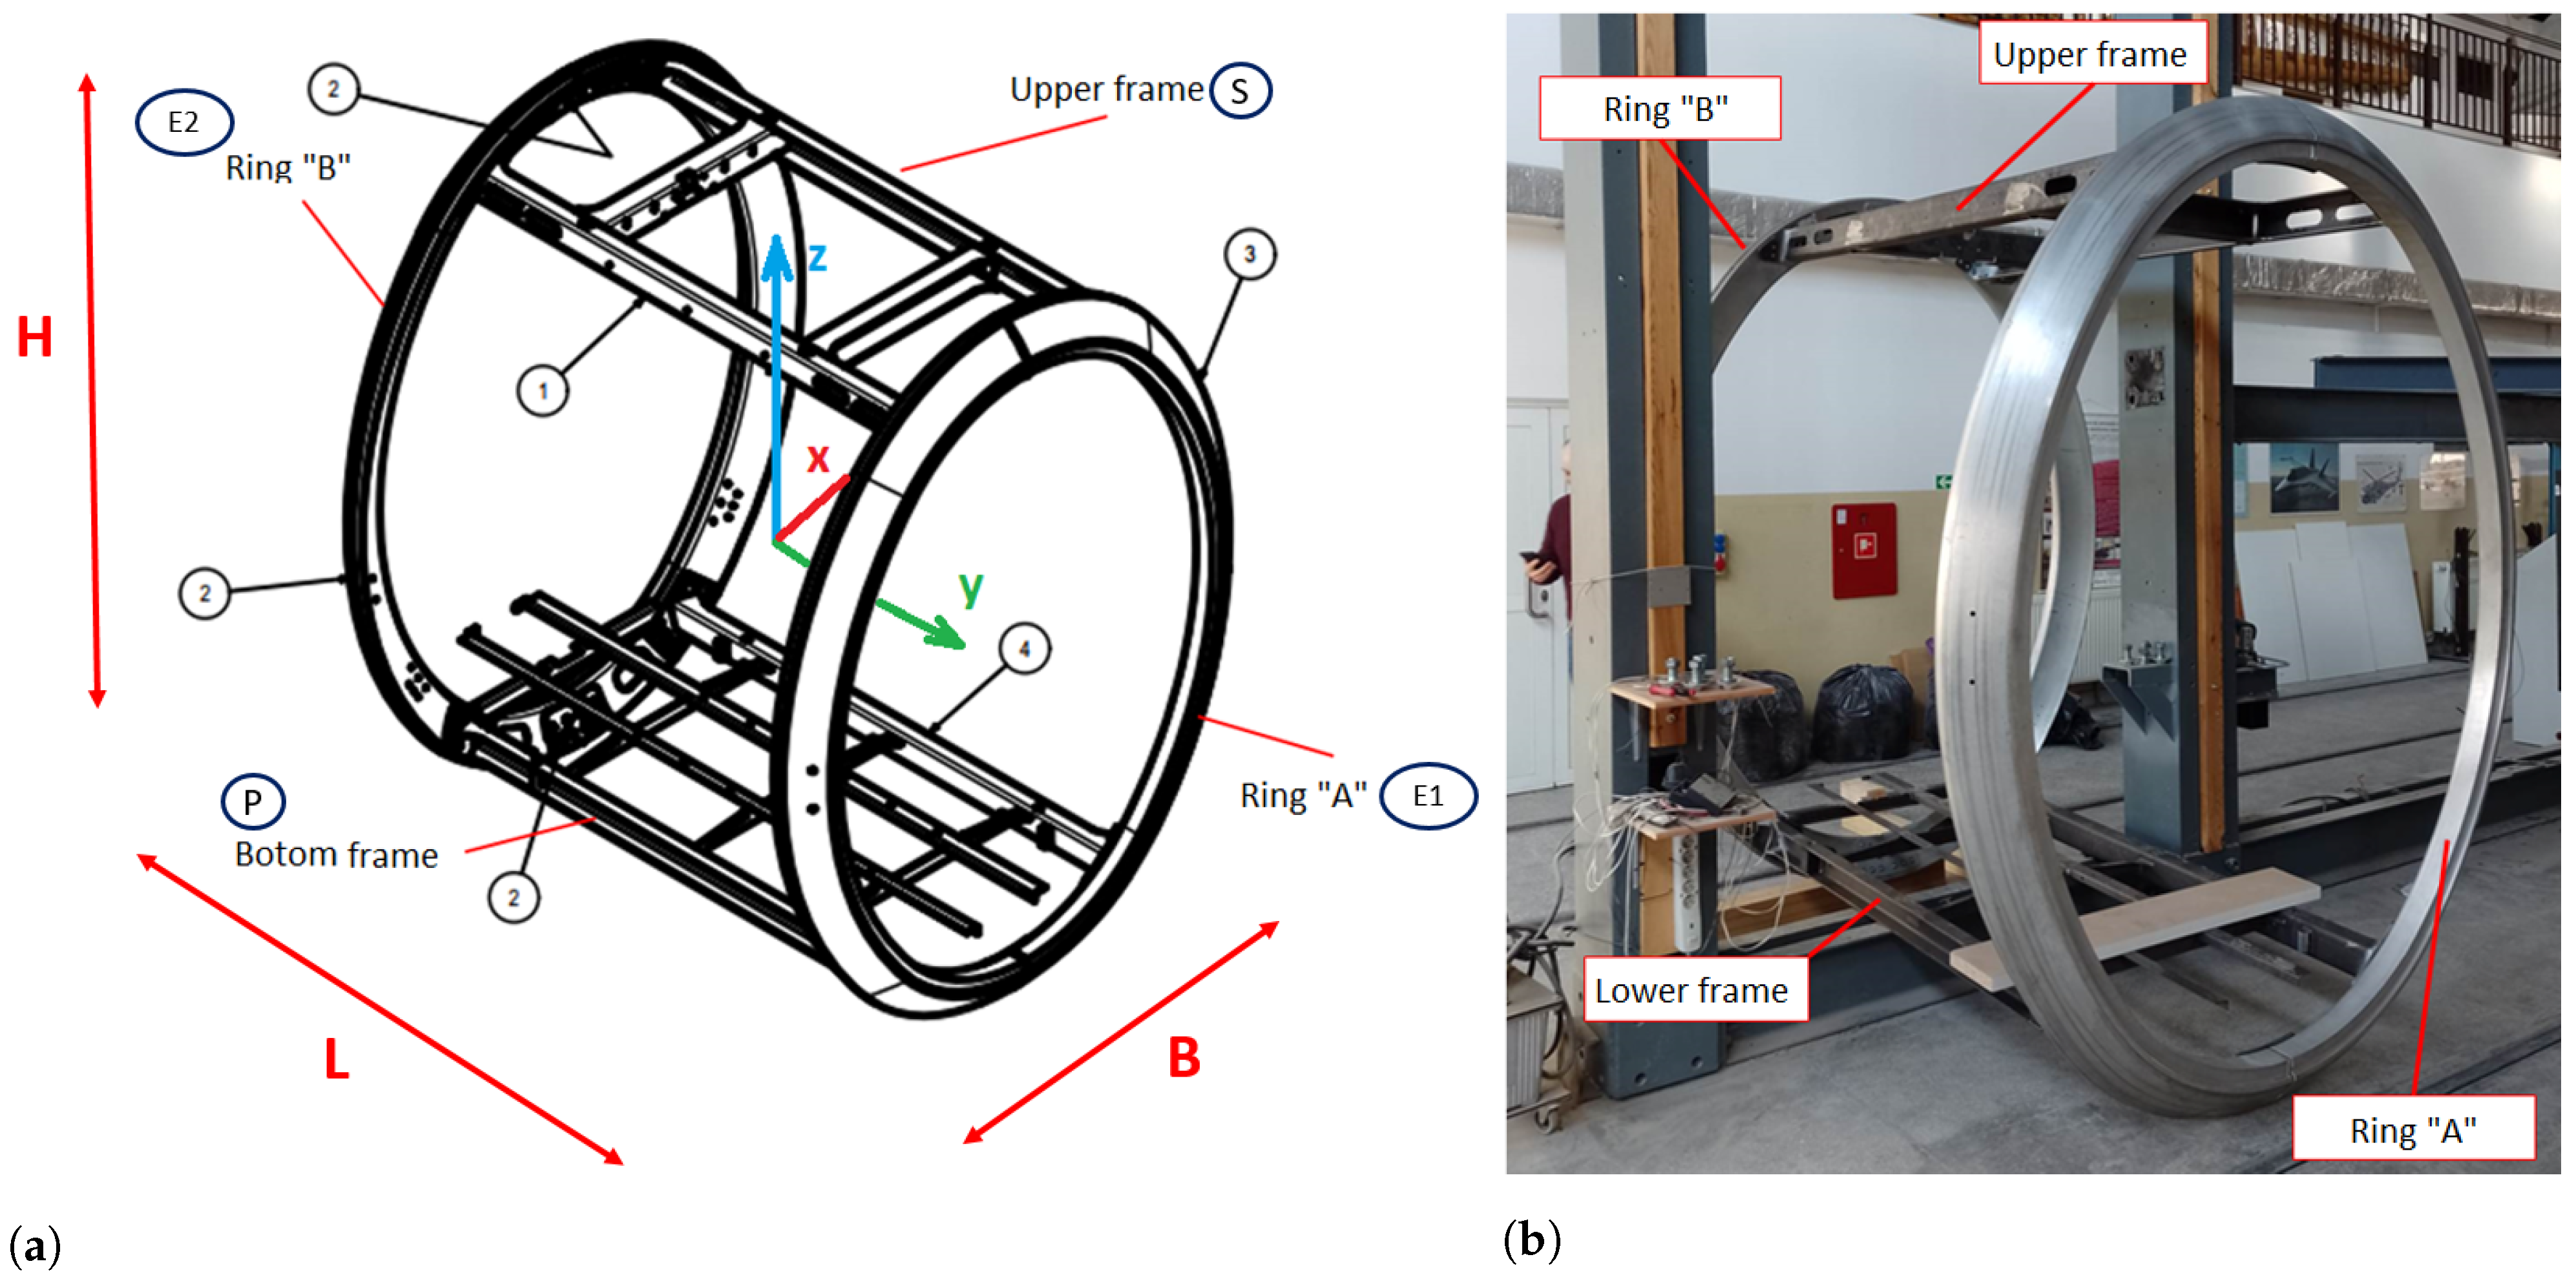
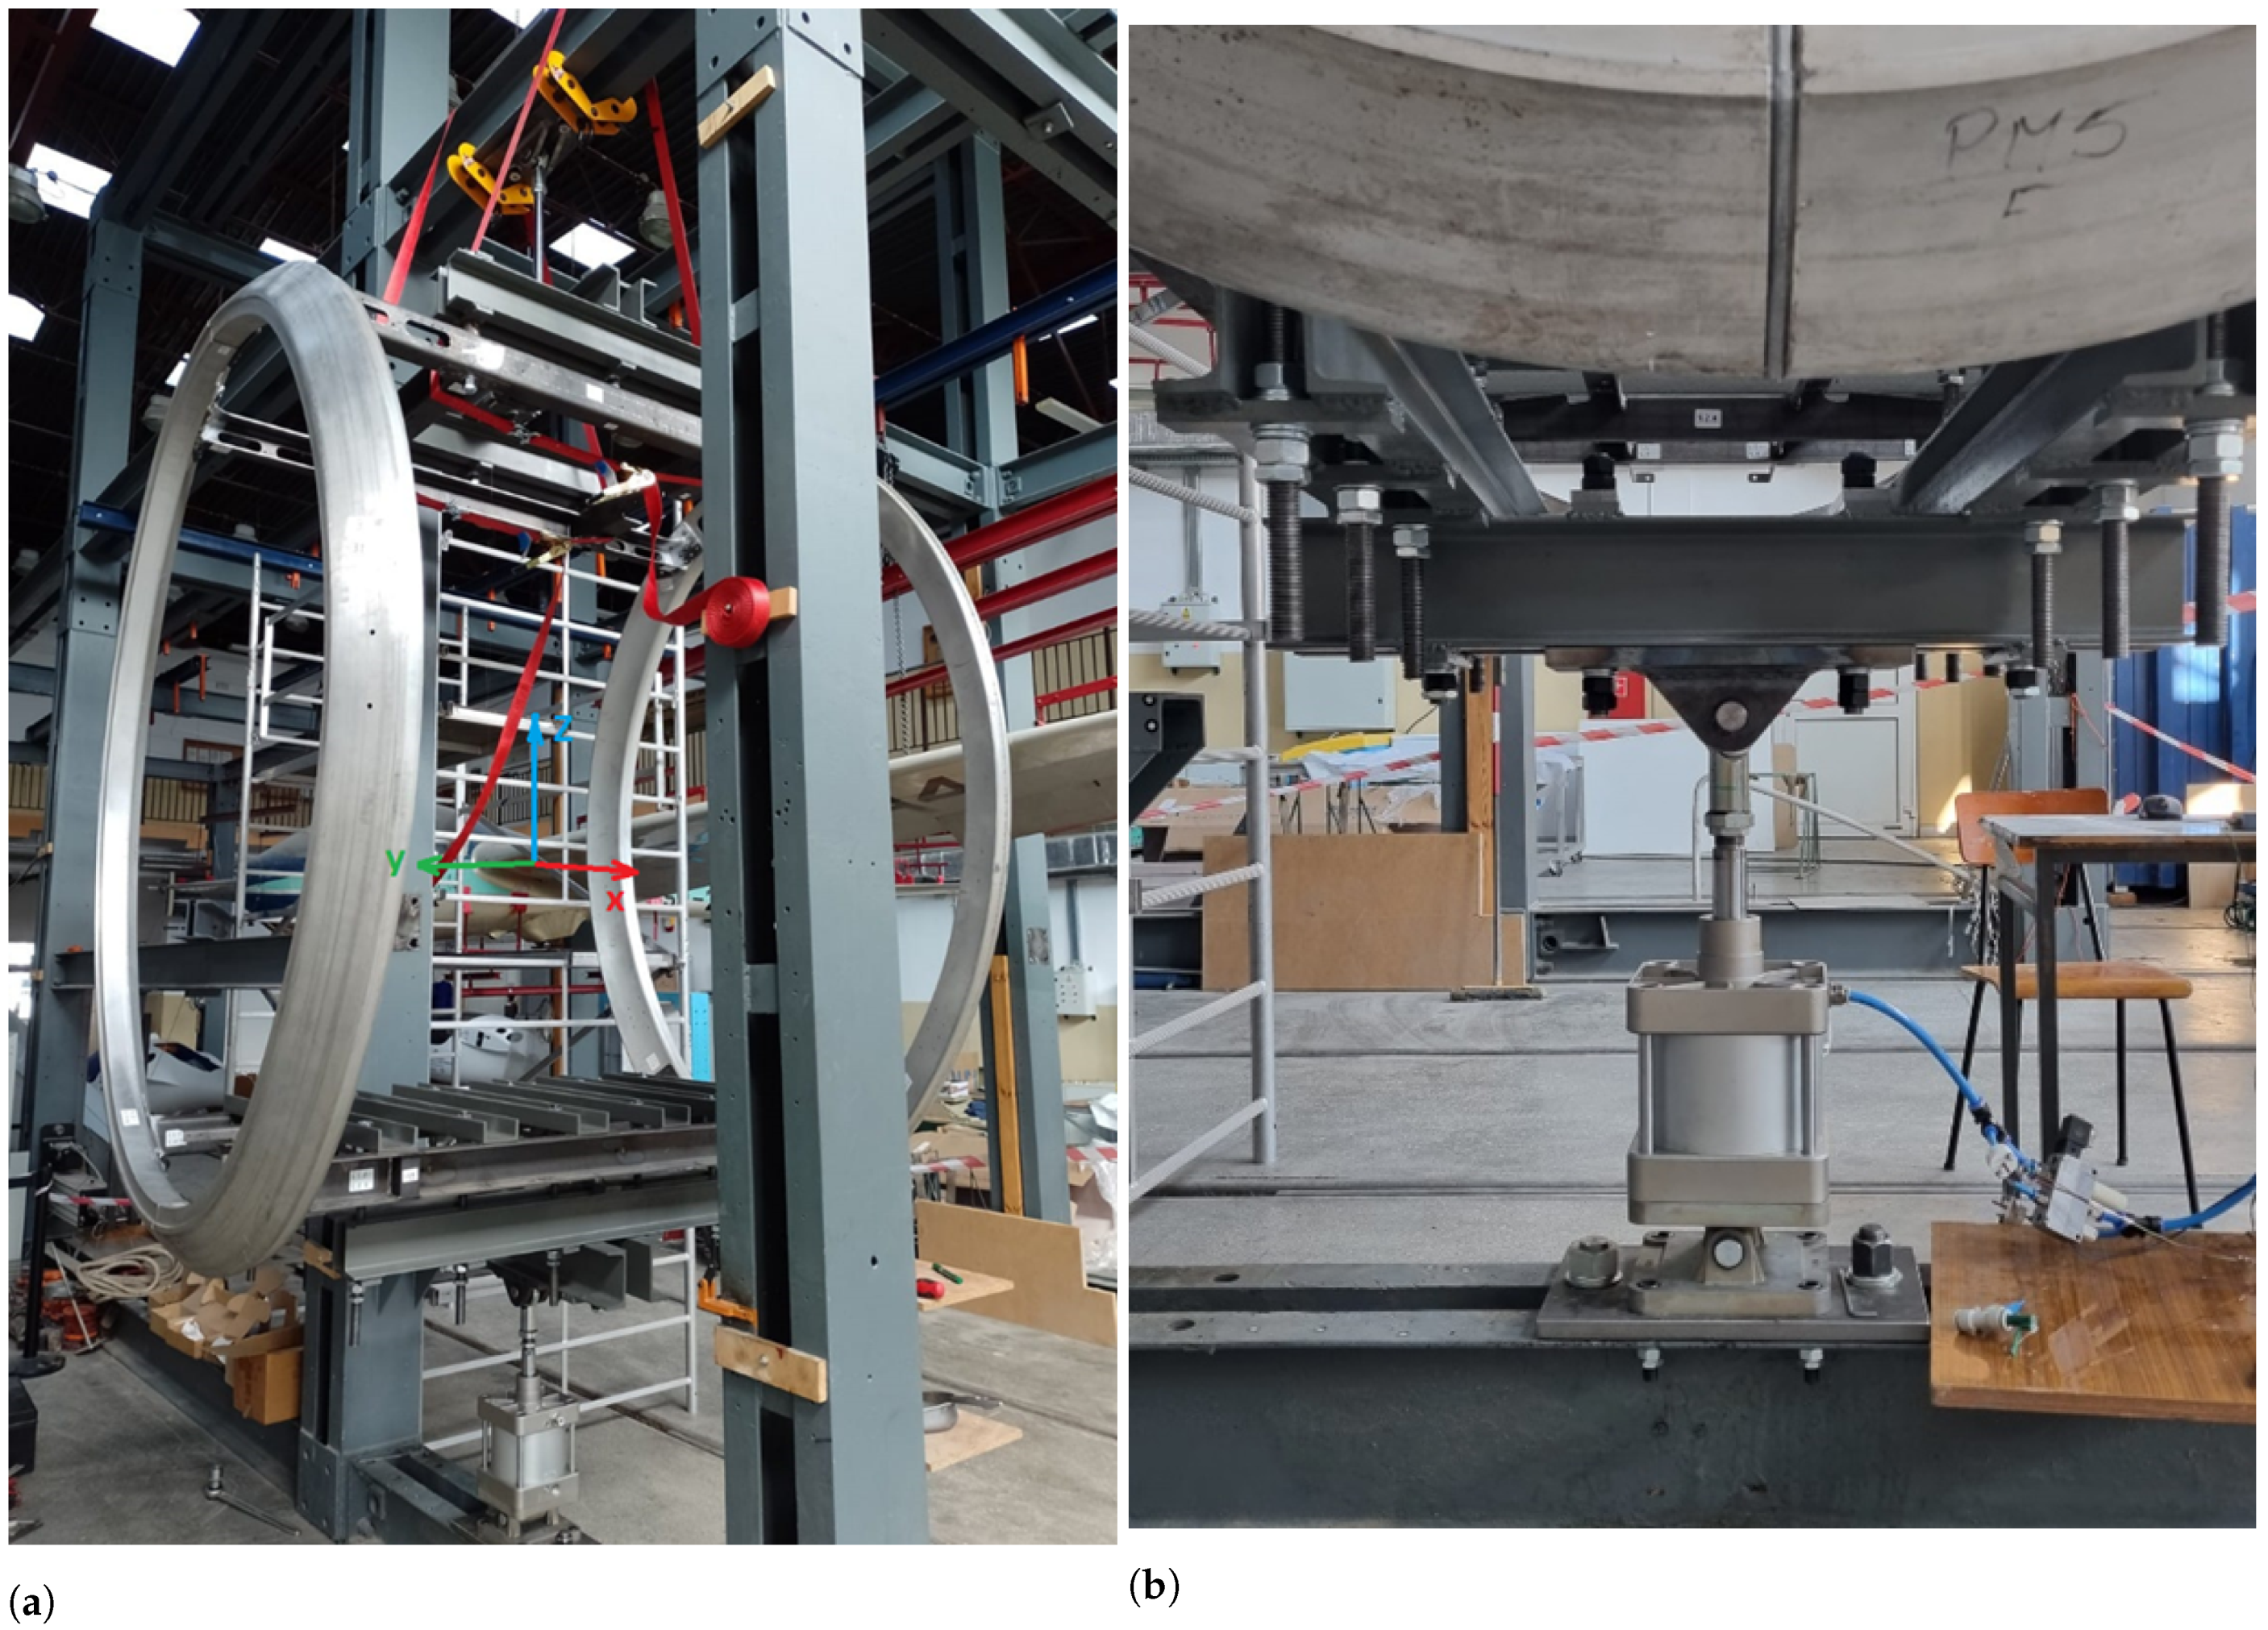
The research facility is a gondola for circular overhead railways designed by TRANSSYSTEM S.A.—
Figure 3. The basic division of the structure divides it into 4 parts:
The upper frame is connected to the A and B rings (
Figure 4 by bolts at the top of the rings. In the upper frame, there are 4 mounting holes for the sling/clutch, which will be used for positioning and mounting the gondola in fatigue tests. The bottom frame is connected to the rings in a similar manner to the upper frame in the lower part of the rings.
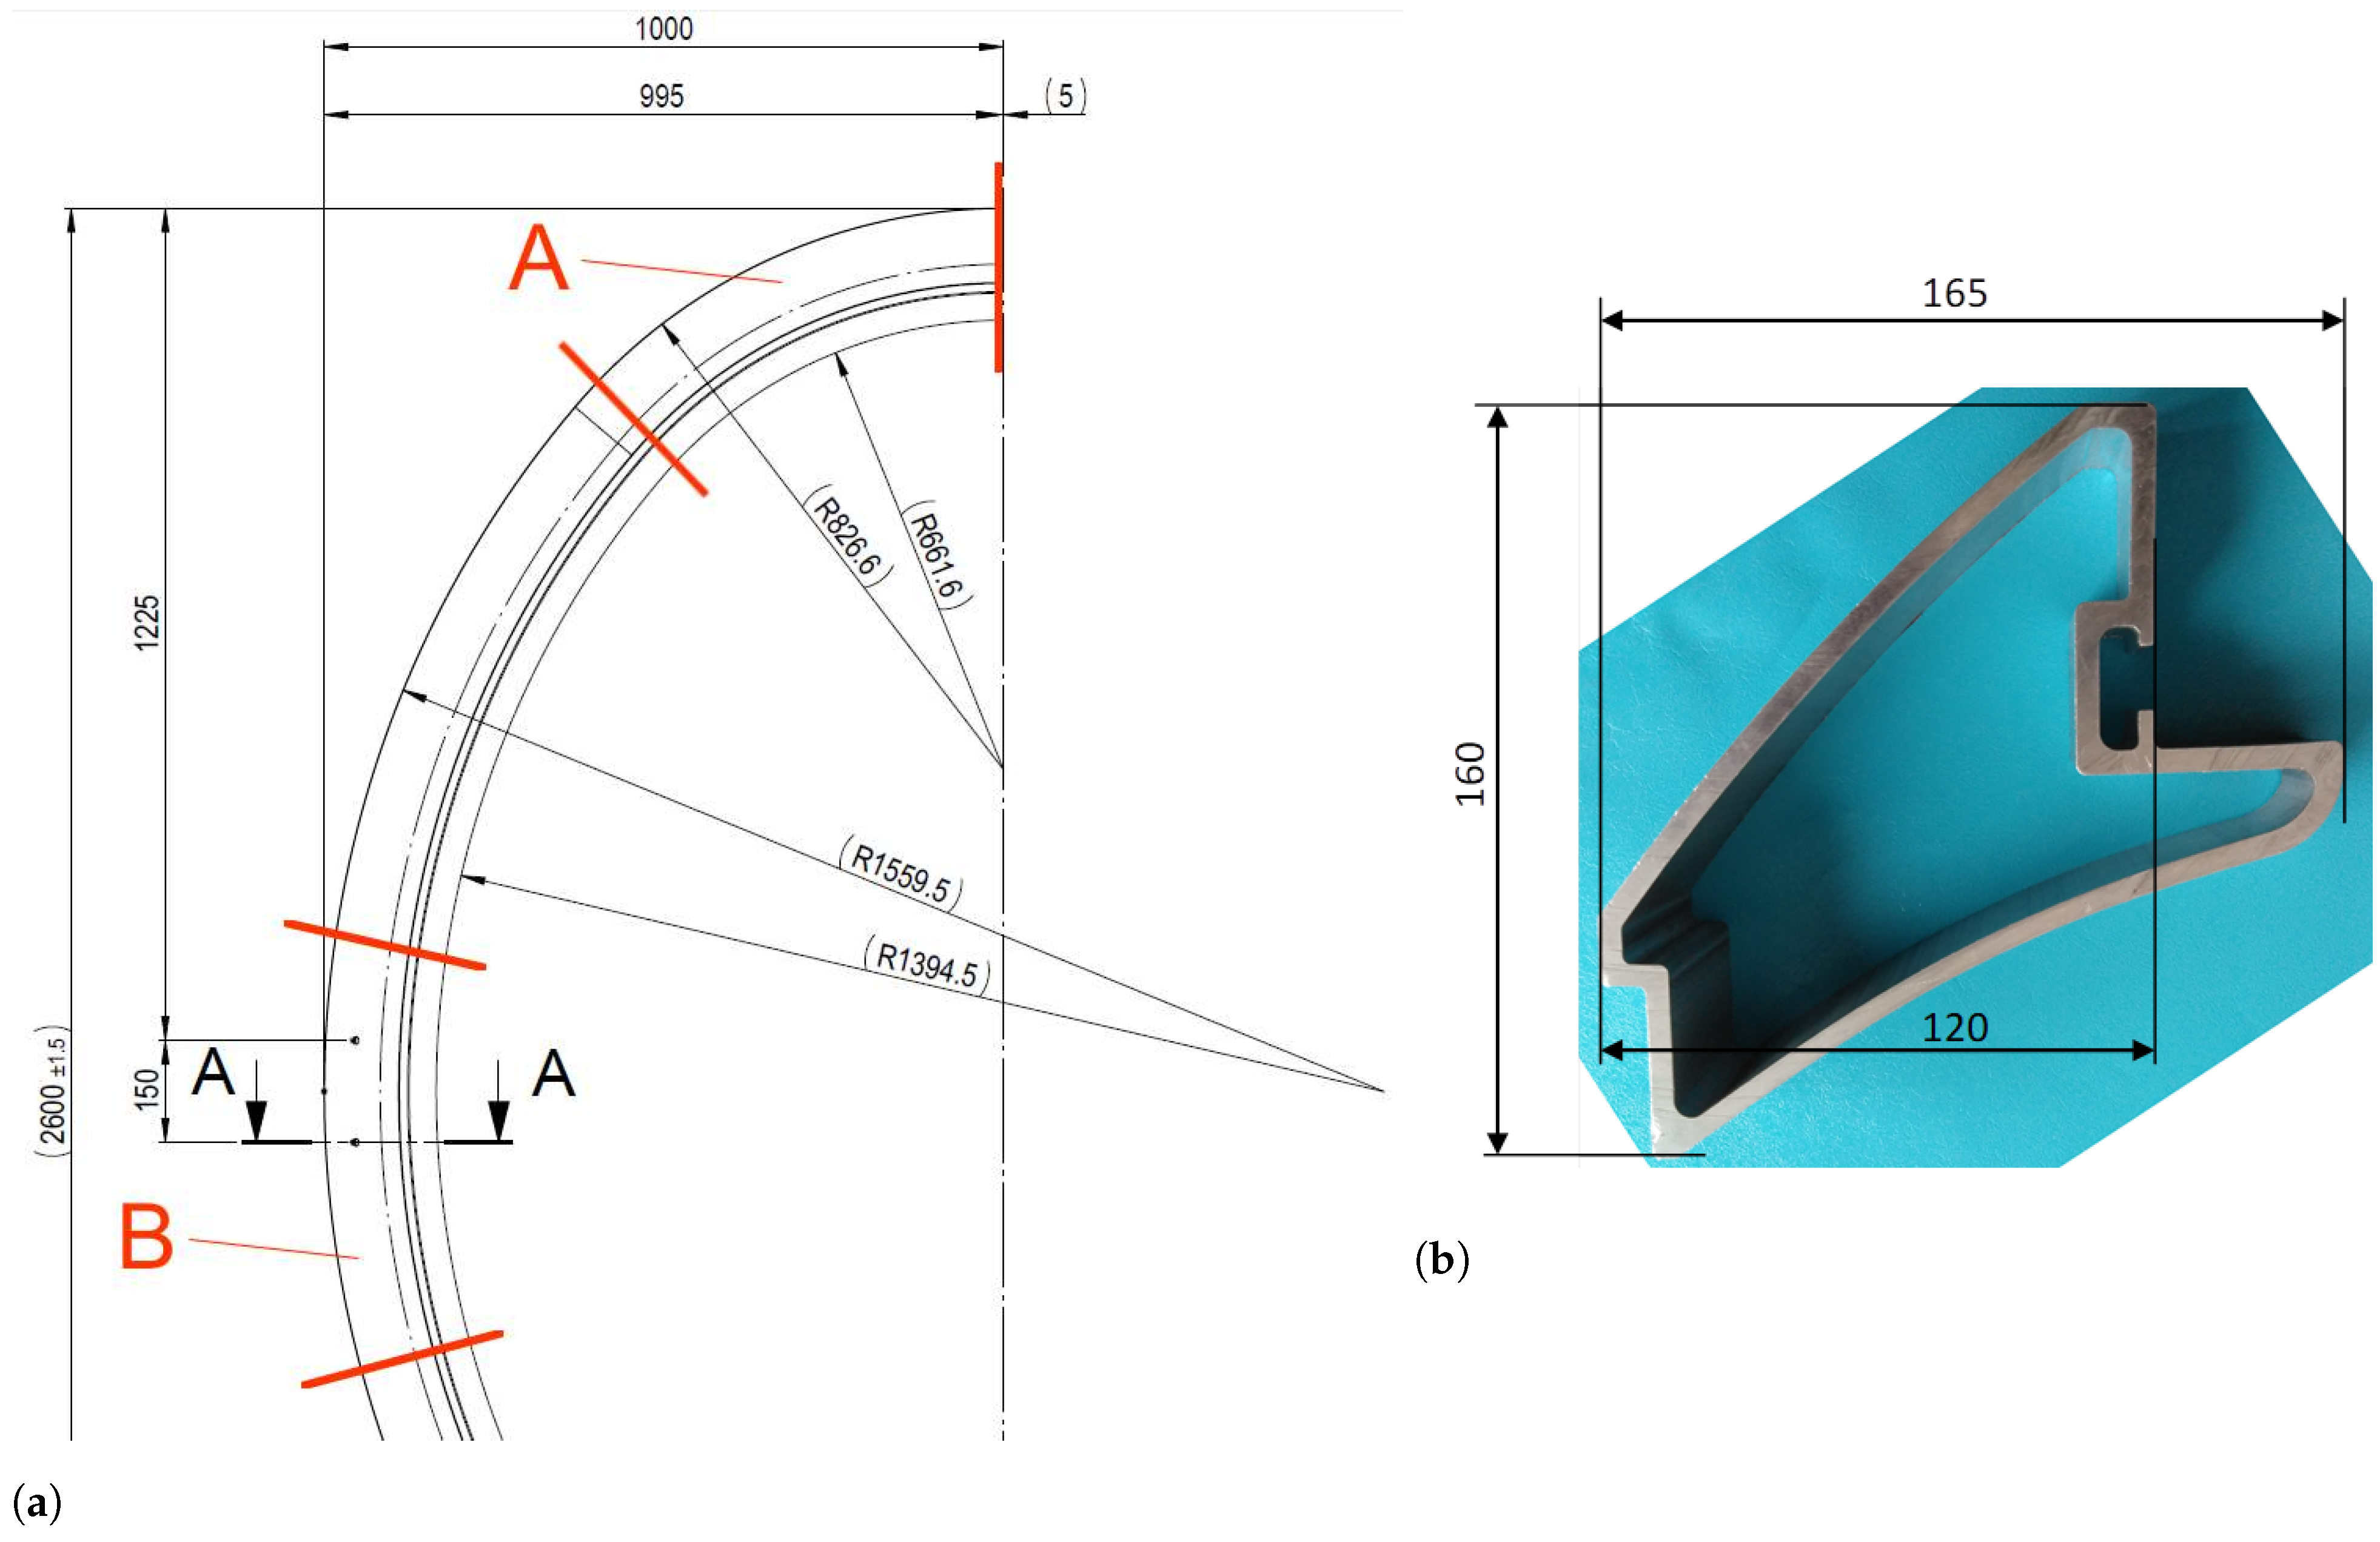
The ring elements of the gondola are made of cold-formed aluminum profiles. This method of treatment causes permanent plastic deformations in the structure [
26] and creates a complex state of stress in the load-bearing profiles [
27]. This technology of execution brings relief to the structure (reducing the weight of the entire set) and minimizing screw connections, as well as avoiding corrosion centers. On the other hand, cold forming significantly affects fatigue life [
28]. There will be compressive stresses on the inner surface [
29] of the profile, and tensile stresses on the outer surface. Mounting holes made in these components may be the starting point for future fatigue cracking.
The structure of the floor is based on two C-beams and a system of transverse and longitudinal beams forming the basis of the future floor. The gondola subjected to the tests has a width of 1999 mm, a length of 2391 mm and a height of 2600 mm.
The tested gondola is made of steel and aluminum alloys. As part of the fatigue tests, the entire structure is verified [
30], and all elements, regardless of the material of manufacture, are subjected to visual tests. The manufacturer was not obliged to provide detailed information about the materials of which the tested gondola is made. Before starting the tests, the certification body (in the case of Poland—Transportowy Dozor Techniczny, abbreviation TDT) should verify the consistency of the documentation with the tested object and verify potential damage.
3.2. Load Generation
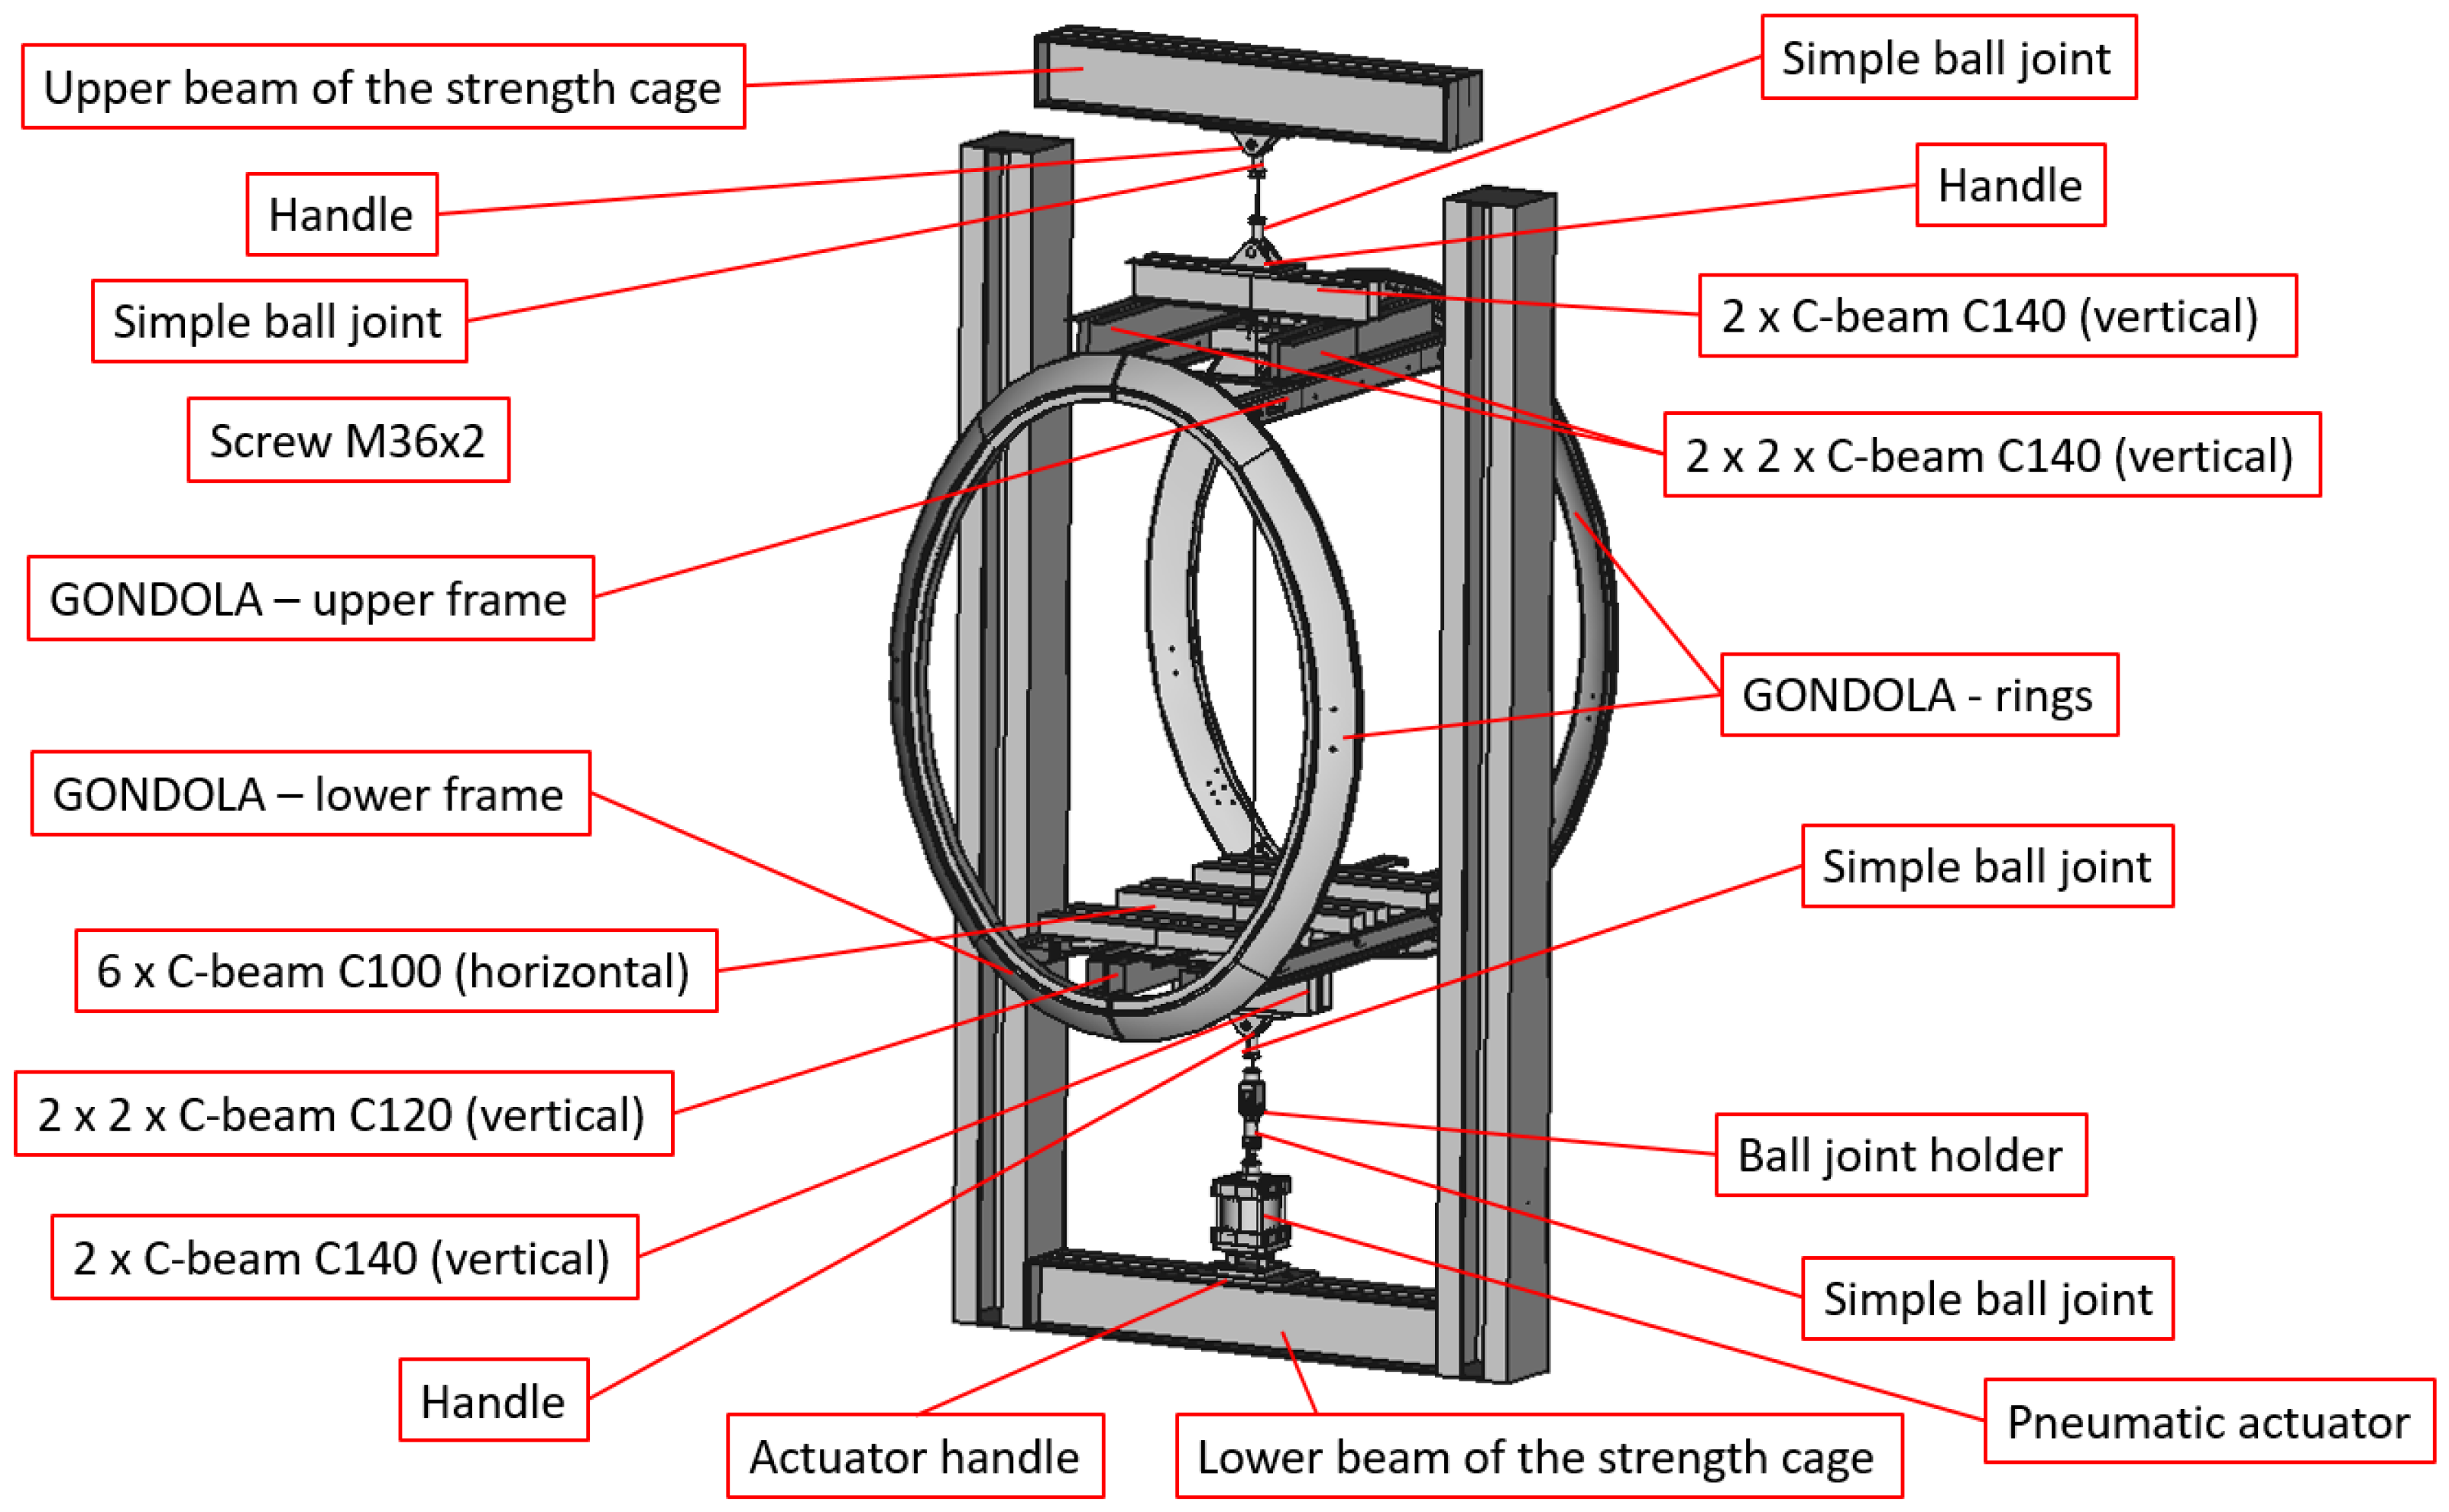
The gondola should be mounted in a strength cage using a system of C-beams and articulated joints ensuring the appropriate number of degrees of freedom. The gondola is suspended from the upper beam of the main endurance cage.
The diagram of the gondola assembly system is shown in
Figure 5. The basis for the assembly of the upper gondola are sets of C140 beams. In the case of the gondola loading system, C100, C120 and C140 beams were used in the configurations presented in
Figure 5 and
Figure 6. All beams are made of S235 steel. Bolts in screw connections are made of 42CRMo4 +QT steel (data 40HM+QT), on which a fine thread M24x2 is made.
The designed assembly system leaves an appropriate number of degrees of freedom (all rotations are allowed in several points while blocking the displacement of the upper part of the gondola and allowing the displacement of the rest of the gondola as a result of the axial load).
This is done through the following movable connections (
—displacement in the direction of the
X axis,
—displacement in the direction of the
Y axis,
—displacement in the direction of the
Z axis,
—rotation around the
X axis,
—rotation around the
Y axis,
—rotation around the
Z axis (definition of the axis in
Figure 6a and
Figure 3a):
ball joint in the bolt connection between the upper beam and the M36x2 bolt—locked: , , ; free: , , ;
ball joint in the pin connection between the M36x2 bolt and the C-beam system—locked: , , ; free: , , ;
ball joint in the pin connection between the system of C-beams and the cylinder—locked: , , ; free: , , ;
simple bolt conection—locked: , , , , ; casual: .
The methodology of loading cableway gondolas is based on the dynamic generation of tensile force. In the discussed case, where the tests will be performed in the hanging position of the gondola, this corresponds to a vertical change in the direction of the force. The transducer generating the force will be a double-acting pneumatic cylinder controlled by a valve and quick-release valves.
The method is commonly used in force systems, due to the speed of reaction and independence of the generated force from the occurring deformation of the structure. In the case of stepper and mechanical actuators, it is necessary to establish the stroke, which can change with the potential permanent deformation of the structure. In the presented case, i.e., pressure control, the forcing force will be repeatable due to the direct relationship between the generated pressure in the actuator and the force (the force is the product of the piston rod area and the pressure in the pneumatic system), i.e., the force in this solution depends from the amount of pressure. The pressure value signal supplied to the system in the DasyLab environment is converted into the actual value of the force with the simultaneous recording of its value in a continuous mode on the disk of the controlling computer.
A pneumatic cylinder CQ 200 × 50 mm by Airworks (presented in
Figure 6), compliant with the ISO15552 standard, was selected to generate loads as part of the fatigue tests of the cableway gondola. According to the manufacturer’s data [
31], it can work at a working pressure of up to 10 bar, and at a pressure of 7 bar, it achieves a force of 2199 kg. Due to the fact that the relationship between the force and working pressure is linear, it was determined that the assumed load of 2140 kg
is obtained at a pressure of about
bar. The pneumatic system at the Department of Aeronautical and Space Engineering operates at a pressure of 8 bar. The pressure transducer used is the MPX5999DP Motorola, Freescale piezoresistive transducer—calibrated to the FLUKE718 1G pressure calibrator + 750P06 module.
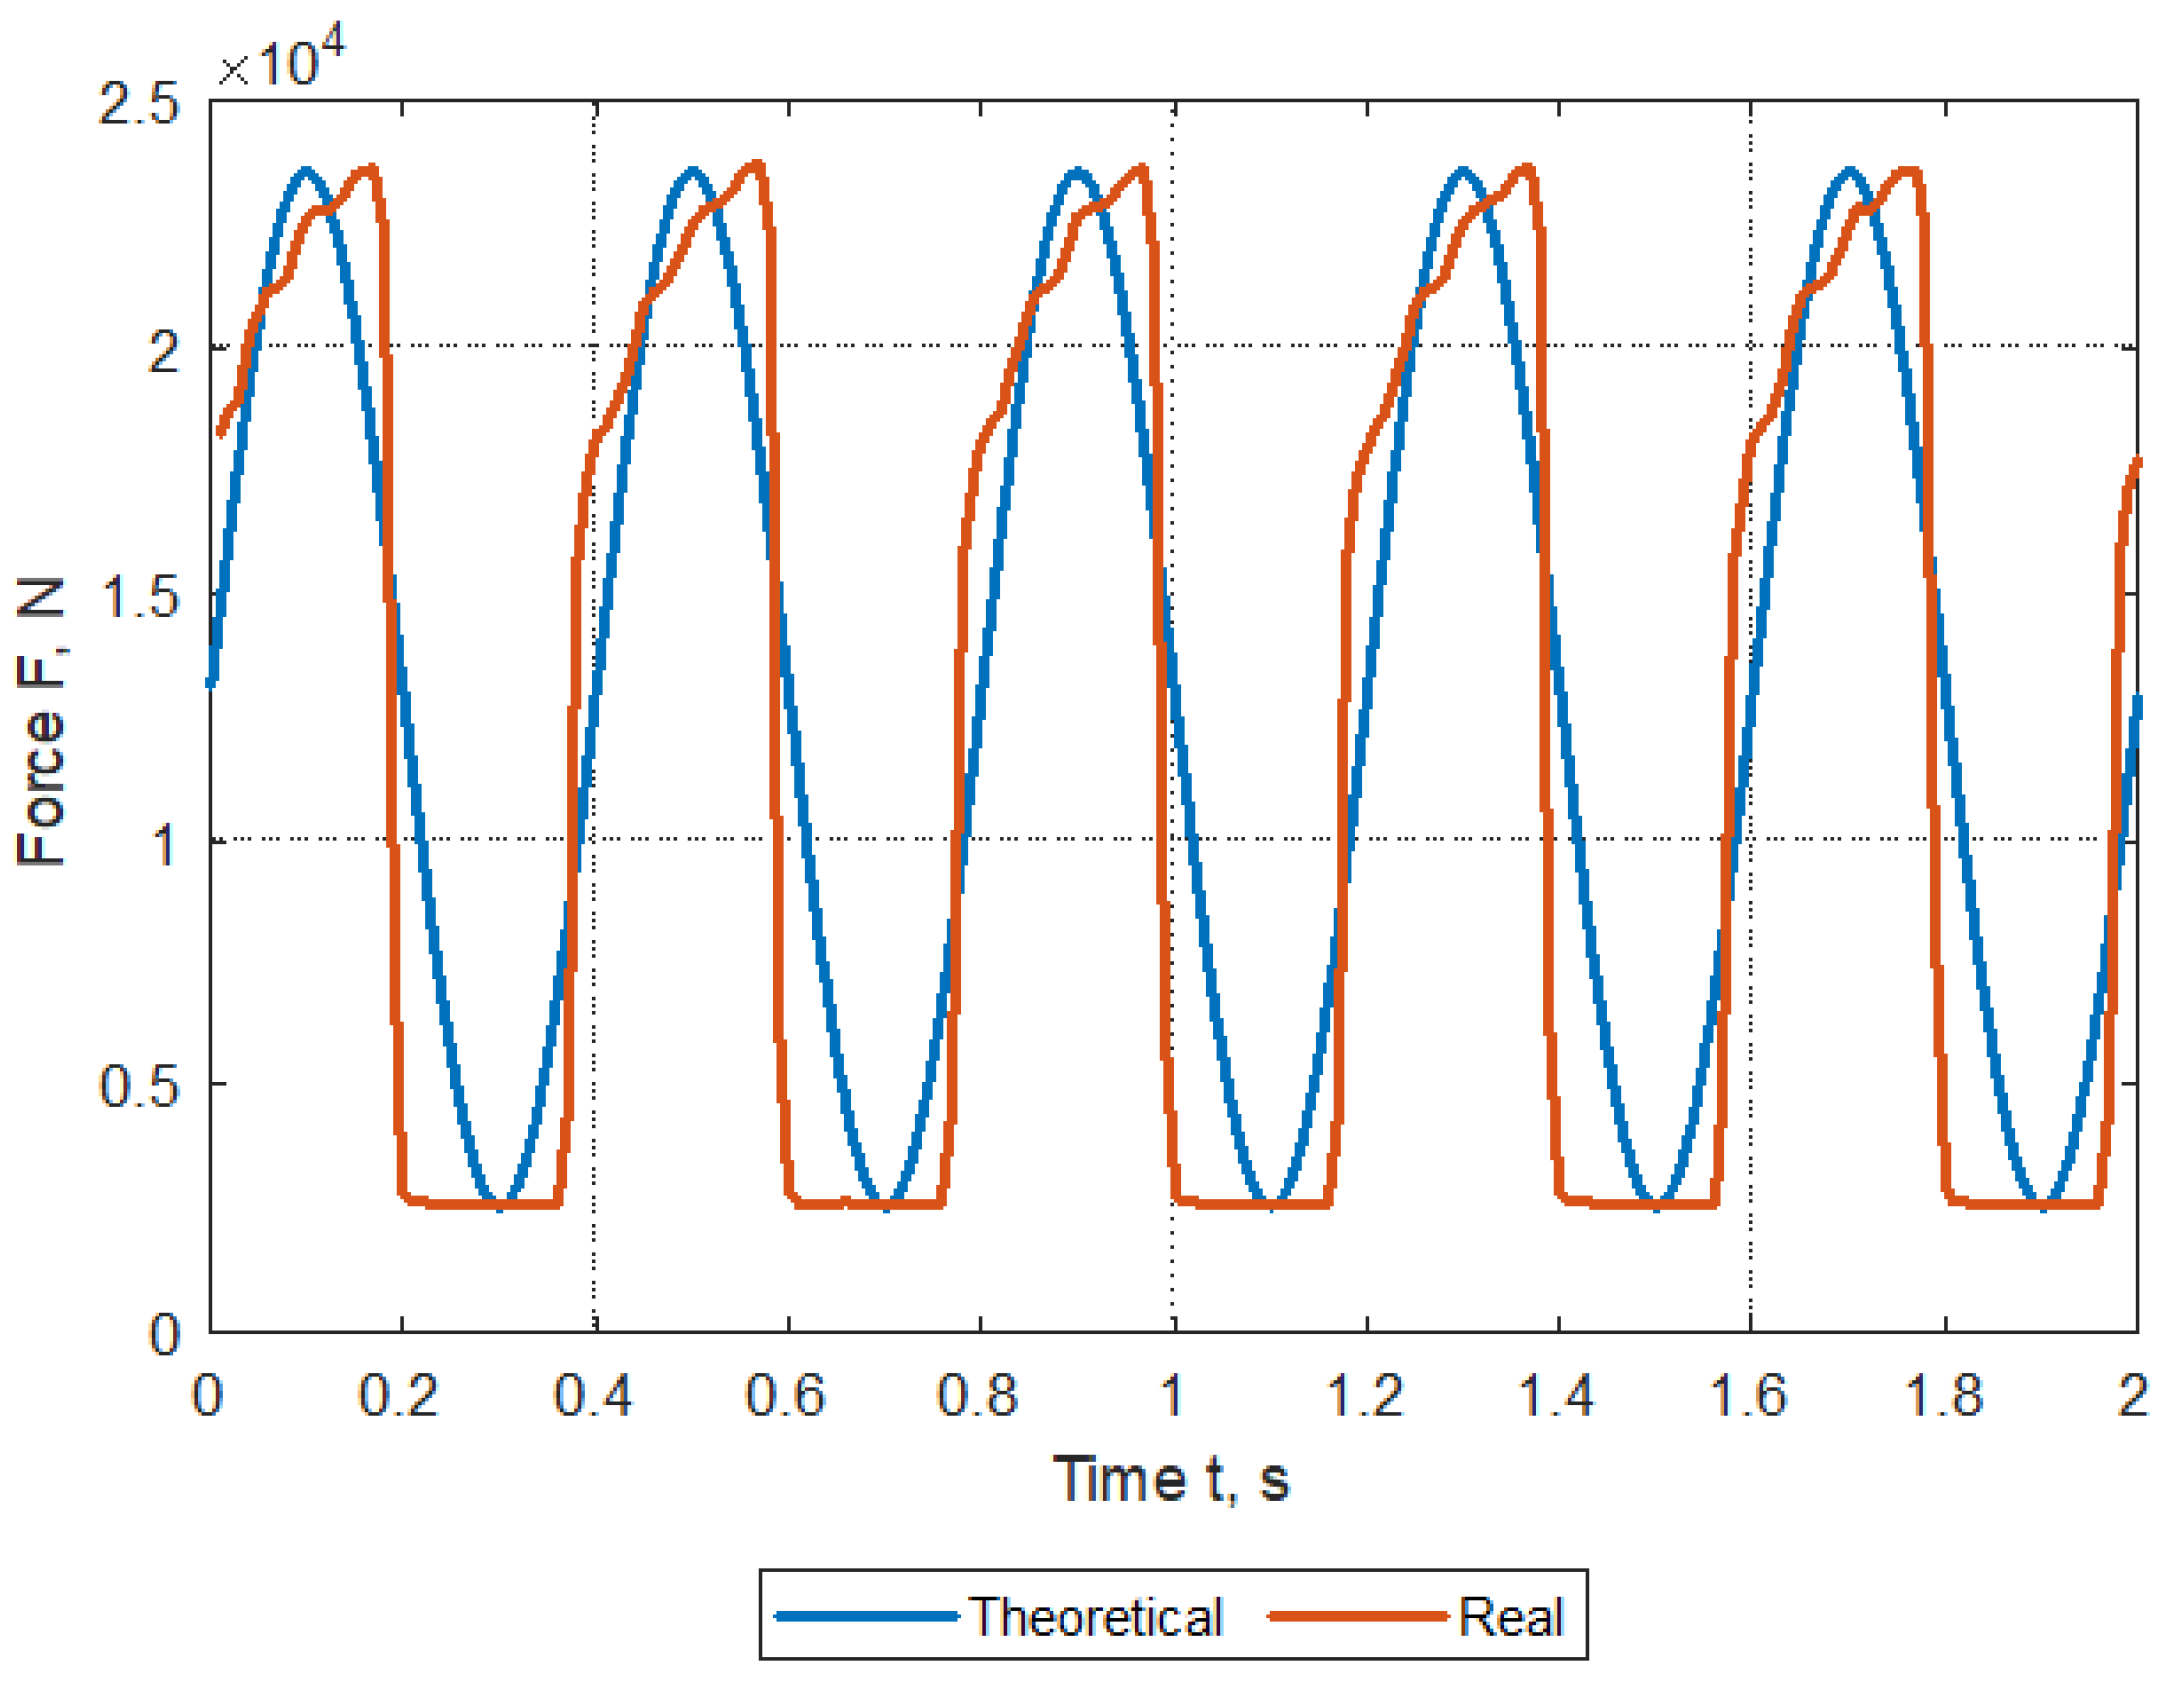
Based on the above control system and the assumed method of loading, a sinusoidal load cycle presented in
Figure 7 will be introduced into the gondola structure. There are plans to conduct tests with the frequency of the load from 1 to 4 Hz, depending on the demand for air and the ability to properly control the real system. The EN 13796-3 and EN 13796-1 standard do not define the load frequency. Standards for fatigue testing of steel allow frequencies up to 10 Hz.
In accordance with the aforementioned normative guidelines, the test should be carried out with the assumption of a sinusoidal nature of the load. In fact, such a state is difficult to implement and at the assumed frequency of
Hz, the structure requires adequate time to return to the state before the load. For this purpose, the parameters controlling the pressure valve were appropriately selected, which allowed obtaining a course close to the theoretical one (Real—
Figure 7).
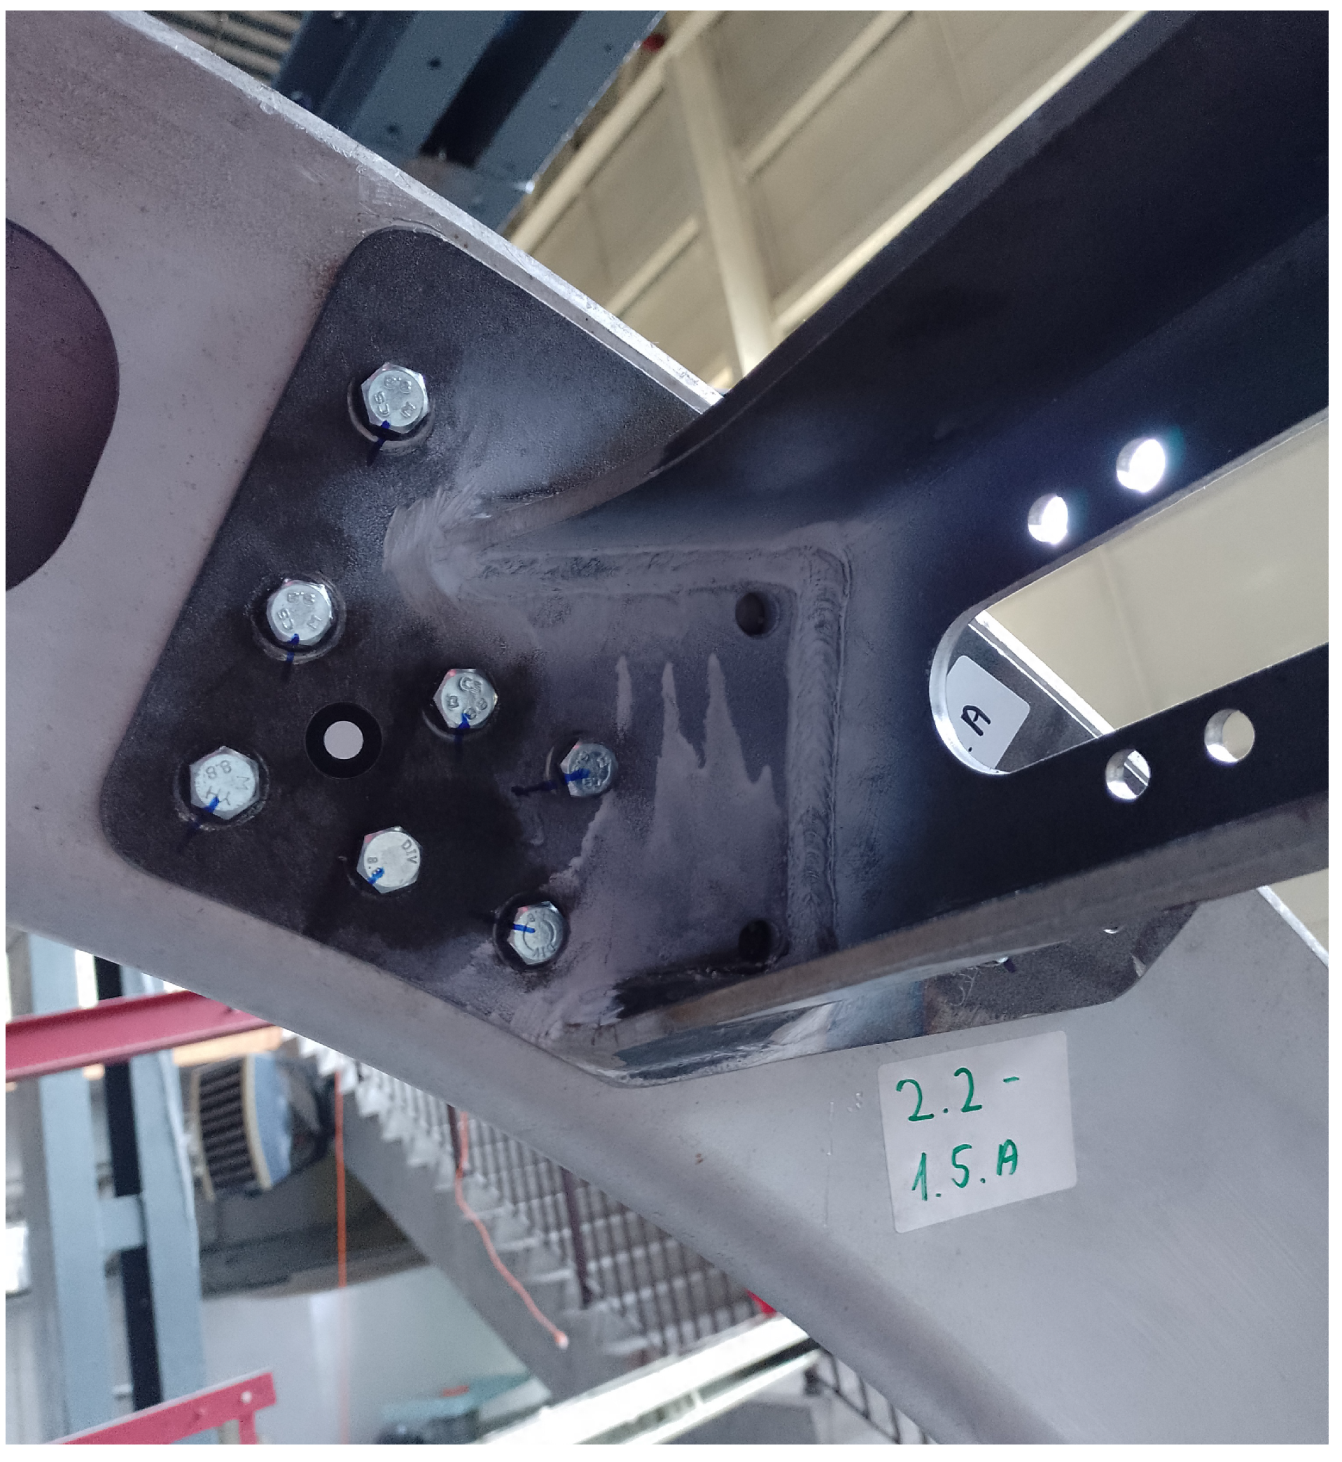
The tested structure, as mentioned earlier, is divided into several components connected with bolts. The screw connections used, in accordance with the manufacturer’s data, were tightened with the appropriate—planned tightening torque and secured with appropriate nuts and glue. However, bearing in mind the possibility of loosening the connections, it is necessary to determine the original position of the bolts relative to the elements and their subsequent verification in order to determine the appearance of potential play, rotation, or loosening of the bolts. An example of bolt designation is shown in
Figure 8.
The adopted pneumatic system, i.e., based on the Airworks CQ 200 × 50 actuator, which had to generate forces up to about 21 kN, is a sufficient system. Appropriate selection of the piston diameter, which translates into the selection of the actuator, contributed to the possibility of generating loads with a frequency of about 2 Hz. The designed system could generate higher load frequencies, but the elastic response of the structure would be too slow, which would translate into a changed average value in the sinusoidal load, which would make the tests incompatible with the EN 13796-3 standard.
3.3. Force Distribution
According to the EN 13796-1 standard, the load should be evenly distributed on the floor. Due to the above, it was decided that the load would be carried by a series of 6 C100 beams lying horizontally. The number of beam sections was selected based on the assumed passenger capacity of the tested gondola—6 people. Each beam bar rests on edge beam bars and angle bars from the bottom gondola frame (
Figure 6a). The arrangement of C-beams and force application points is shown in
Figure 9. Due to the fact that the total load should be 21 kN, theoretically, one bolt carried about
kN. A total of 12 bolts transferred the load between the beams (and the bottom frame) and the lower load-generating system connected to the pneumatic actuator. C-beams are spaced every 28 cm, of which the two middle ones are offset from the gondola axis (in the direction of the
Y axis) by 14 cm. At the same time, the loading bolts are distributed 33 cm from the central axis of the gondola (in the direction of the
X axis), i.e., the distance between the bolts is 66 cm. This distance corresponds to about 1/3 of the width of the entire gondola (
cm) and about 2/3 of the width of the bottom frame of the gondola (102 cm). At the same time, the extreme points of force application are approximately
cm from the edge of the bottom frame/rings.
4. Construction Monitoring
In order to verify the deformation and permanent deformation of the cableway gondola structure, various structure monitoring systems can be used during the fatigue tests. In the presented studies, two independent monitoring systems were chosen.
The first discussed method of controlling displacements of the structure was laser sensors HG-C1030-P from Panasonic. It is an optical laser sensor designed for precise measurements. Sensor response time up to 1.5 ms. The applicability range is 30 mm and the accuracy is 10 μm. Based on the use of a system of two such laser sensors, it was possible to measure the actual distance of the bottom frame from the ground during the test and verify the uniformity of deformation of this structure.
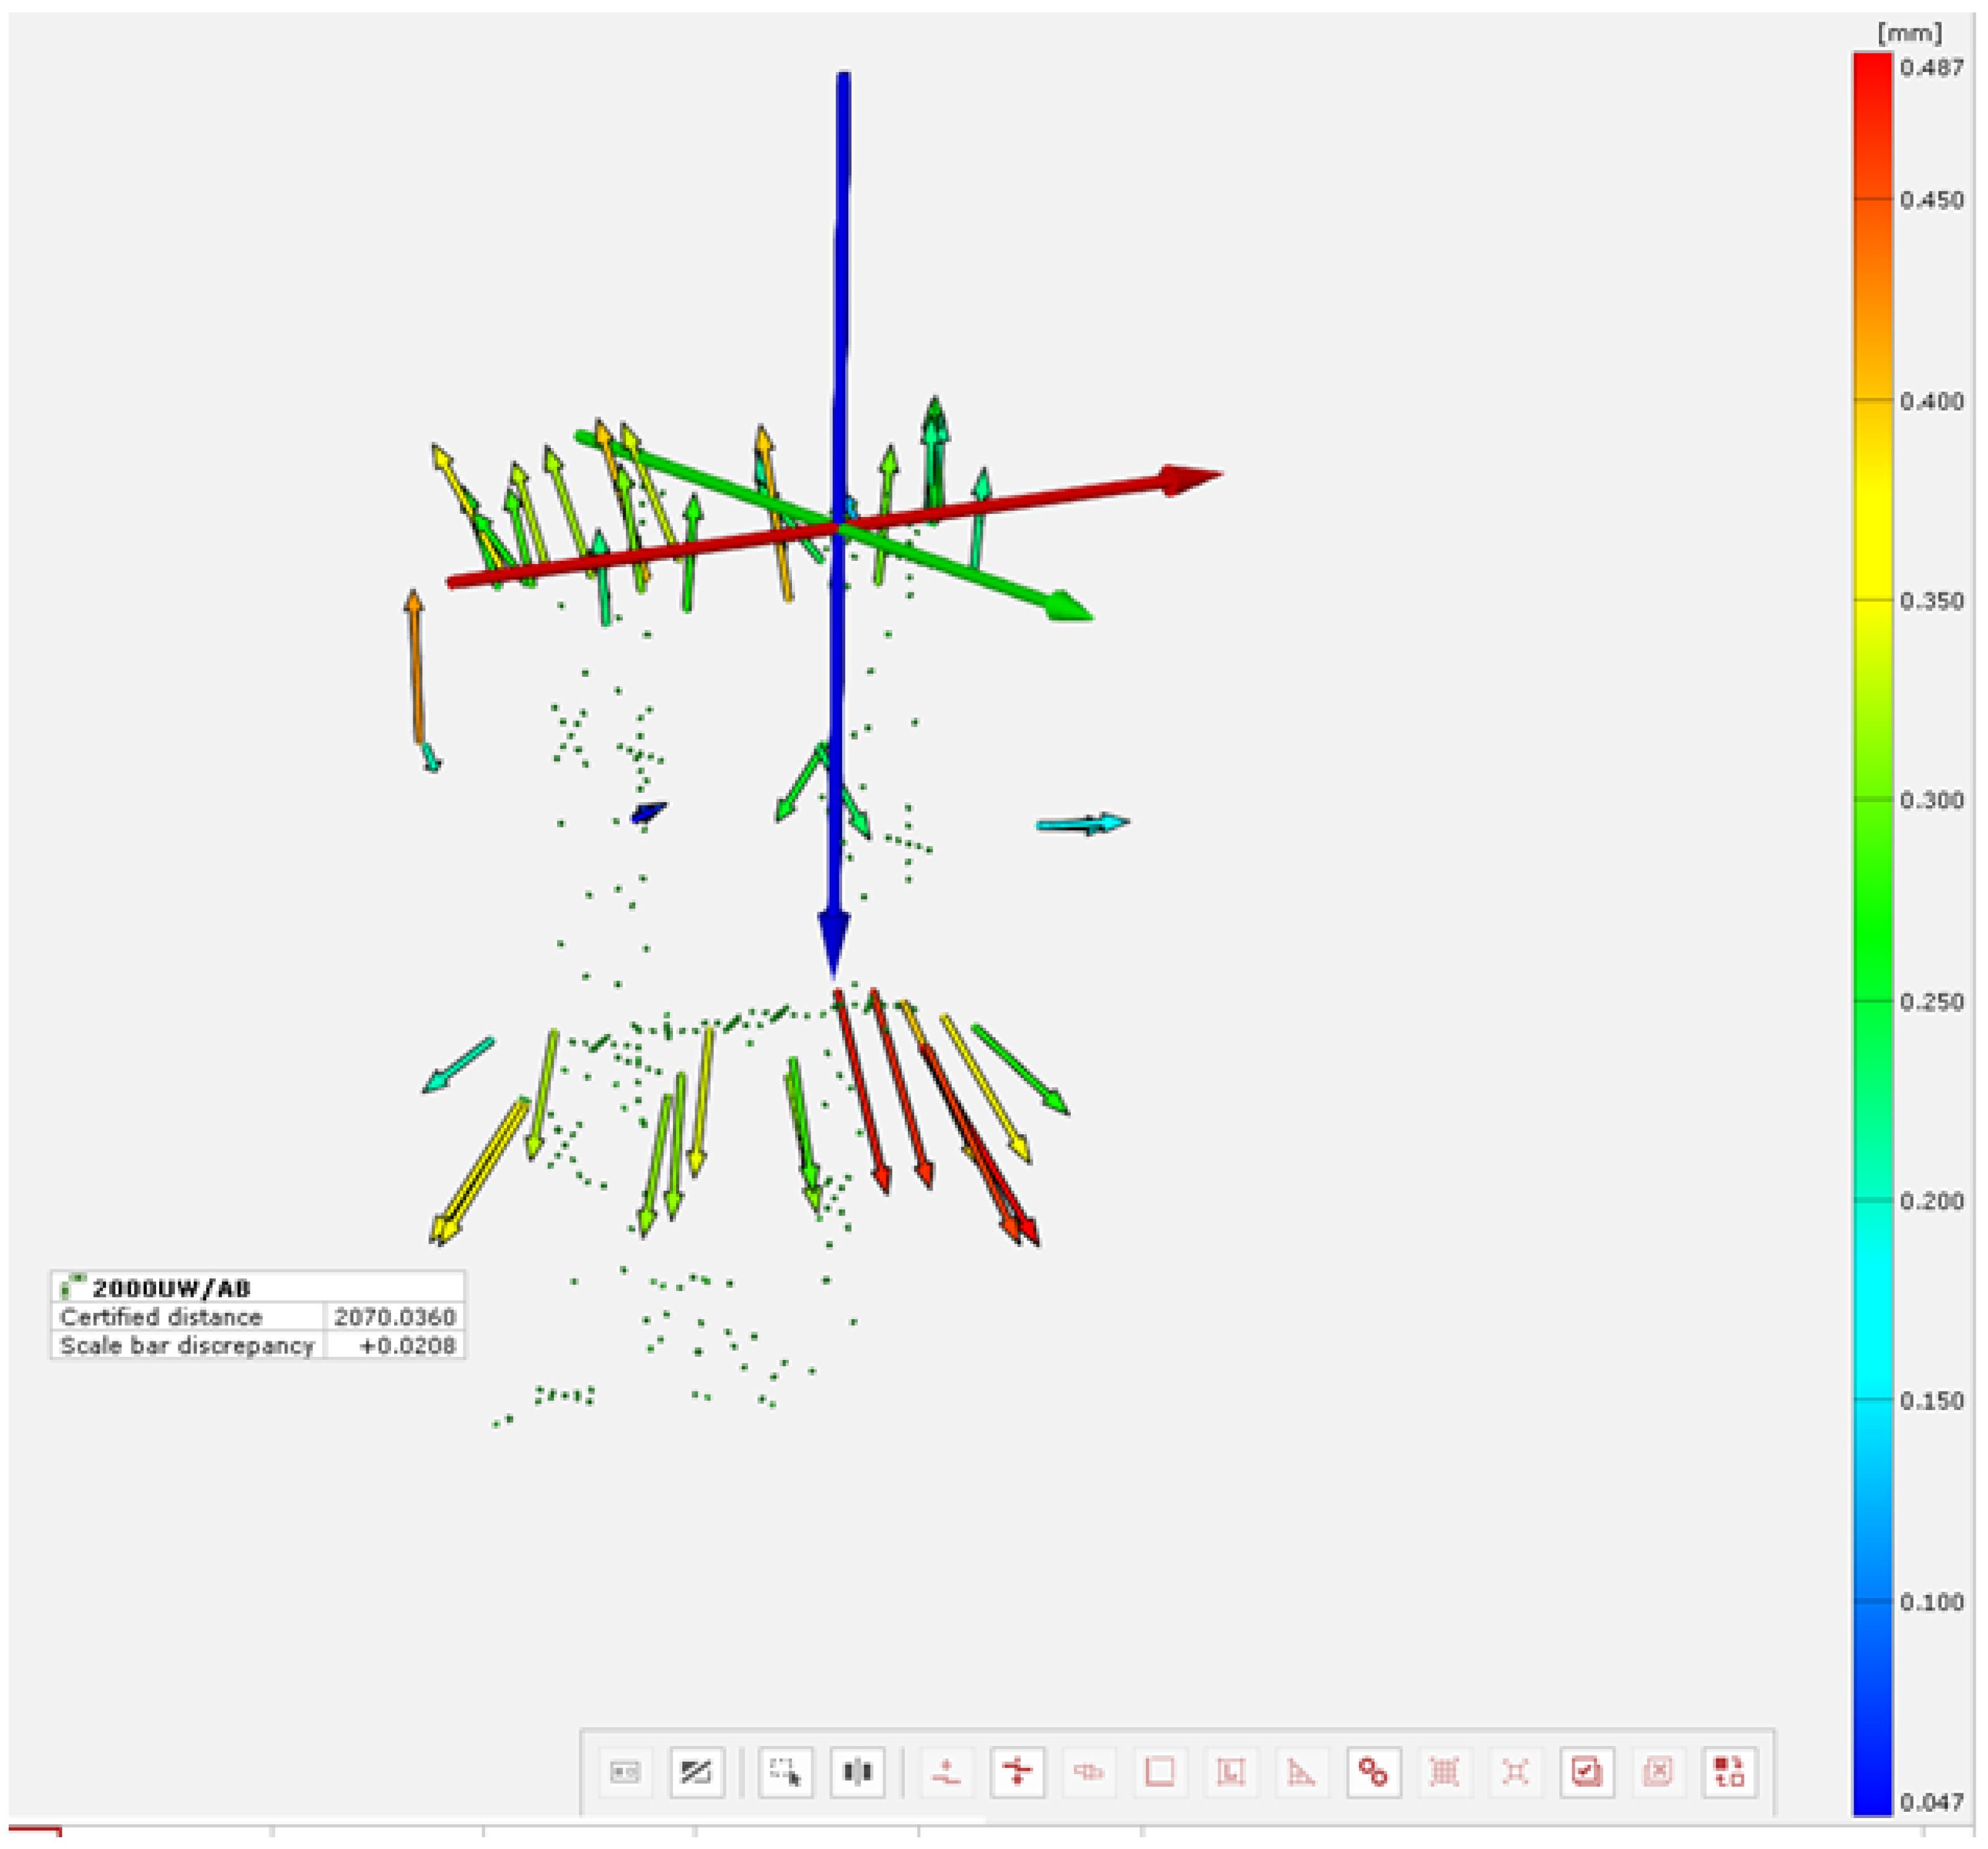
Due to the assumptions of the EN 13796-3 standard, the gondola had to be inspected every 500,000 cycles. In addition to the visual inspection assumed by the standard, tests were conducted based on Digital Image Correlation (DIC) tools. On the gondola structure, a “cloud of reference points” should be marked, which have been verified geometrically using an optical 3D coordinate measuring device—TRITOP by GOM. Then, in each test break, the geometrical coordinates of these points were re-measured, based on which it was possible to assess their mutual displacement, angles of rotation, and permanent deformation of the entire structure. The accuracy of the aforementioned measuring system, in the case of a structure with the dimensions of the tested gondola, is about 30 .
As part of the research, deformations of the gondola structure were measured in order to check whether the structure is not permanently deformed as a result of the applied load. A total of 11 measurements were made. The first one was made before the structure was loaded and it was a reference measurement for subsequent measurements. These were performed in the intervals between successive series of load cycles. A single run contained 500,000 cycles.
The GOM TRITOP measurement system was used in the research. The system consists of the following elements:
A camera with a modified lens,
wi-fi data transmission module,
Computer with dedicated software for digital image correlation,
A set of coded markers constituting reference points in measurements,
A set of self-adhesive markers constituting measuring points,
A set of precise crossbars constituting the dimensional basis for measurements.
The research of DIC consisted of three stages.
4.1. Stage I—Preparation of the Object for Measurements
At this stage, the strength cage around the gondola was covered with coded markers, constituting reference points, enabling correlations of the location of measurement points from subsequent photographs. Placed markers had the form of single points on magnetic pads or crosses with 9 coded points. On the gondola, 82 uncoded markers (measuring points) were glued, which were then recognized by the software. An example of the arrangement of reference and measurement points is shown in
Figure 10a,b.
The arrangement of the points was selected in such a way that they allowed determining changes in the characteristic dimensions of the gondola. Measuring points with a diameter of 8 mm were used for the measurements.
4.2. Stage II—Measurements
The measurements consisted in taking a series of photographs of the test object with marked measurement points. Photos from the camera were sent via the wi-fi module to the computer. Photographs of the same points were taken from different distances and angles, so that coded markers were also visible on each photo. Thanks to this, the software of the measurement system was able to recognize individual points and determine their location in space. This process required real-time verification of finding the required number of measurement points
4.3. Stage III—Analysis of the Results
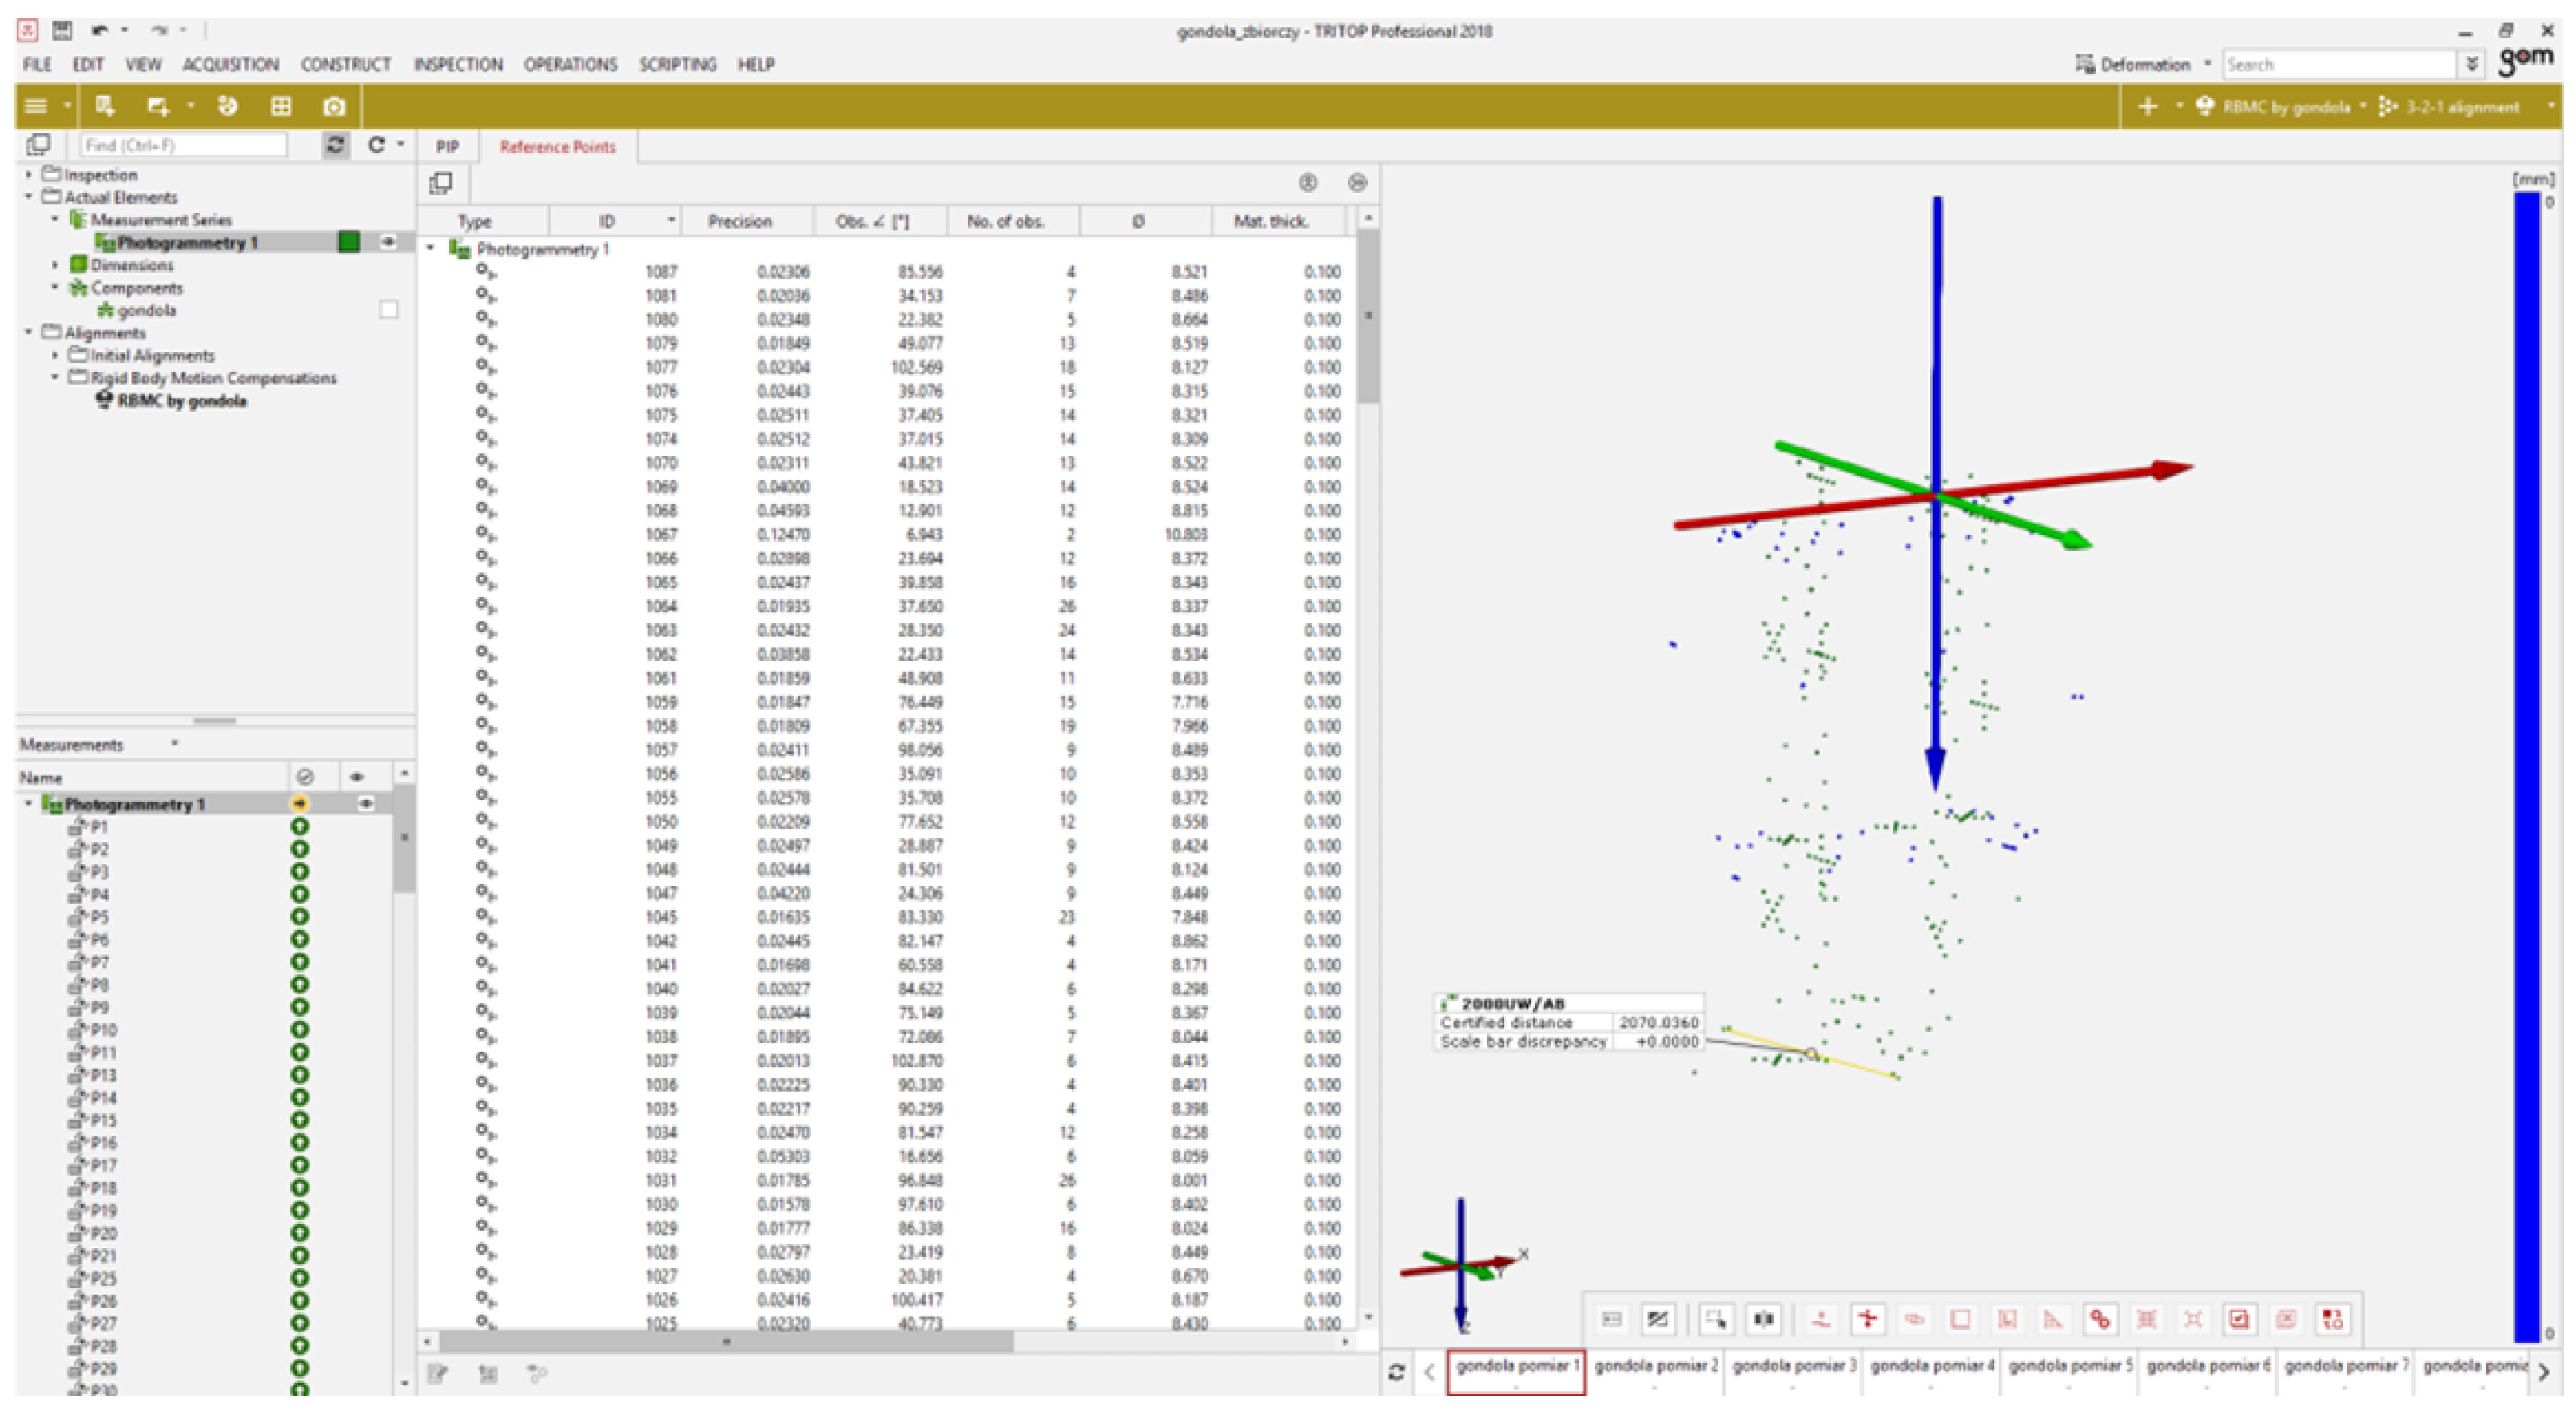
The results were analyzed in the dedicated TRITOP Professional software. Built-in inspection tools were used for this purpose. First, a common coordinate system for all measurements was introduced. Due to the fact that the gondola was able to rotate relative to the vertical axis, compensation for this rotation was introduced in each subsequent measurement. An example screenshot showing a cloud of measurement and reference points is shown in
Figure 11. Example displacements of measurement points are shown in
Figure 12.
5. Results
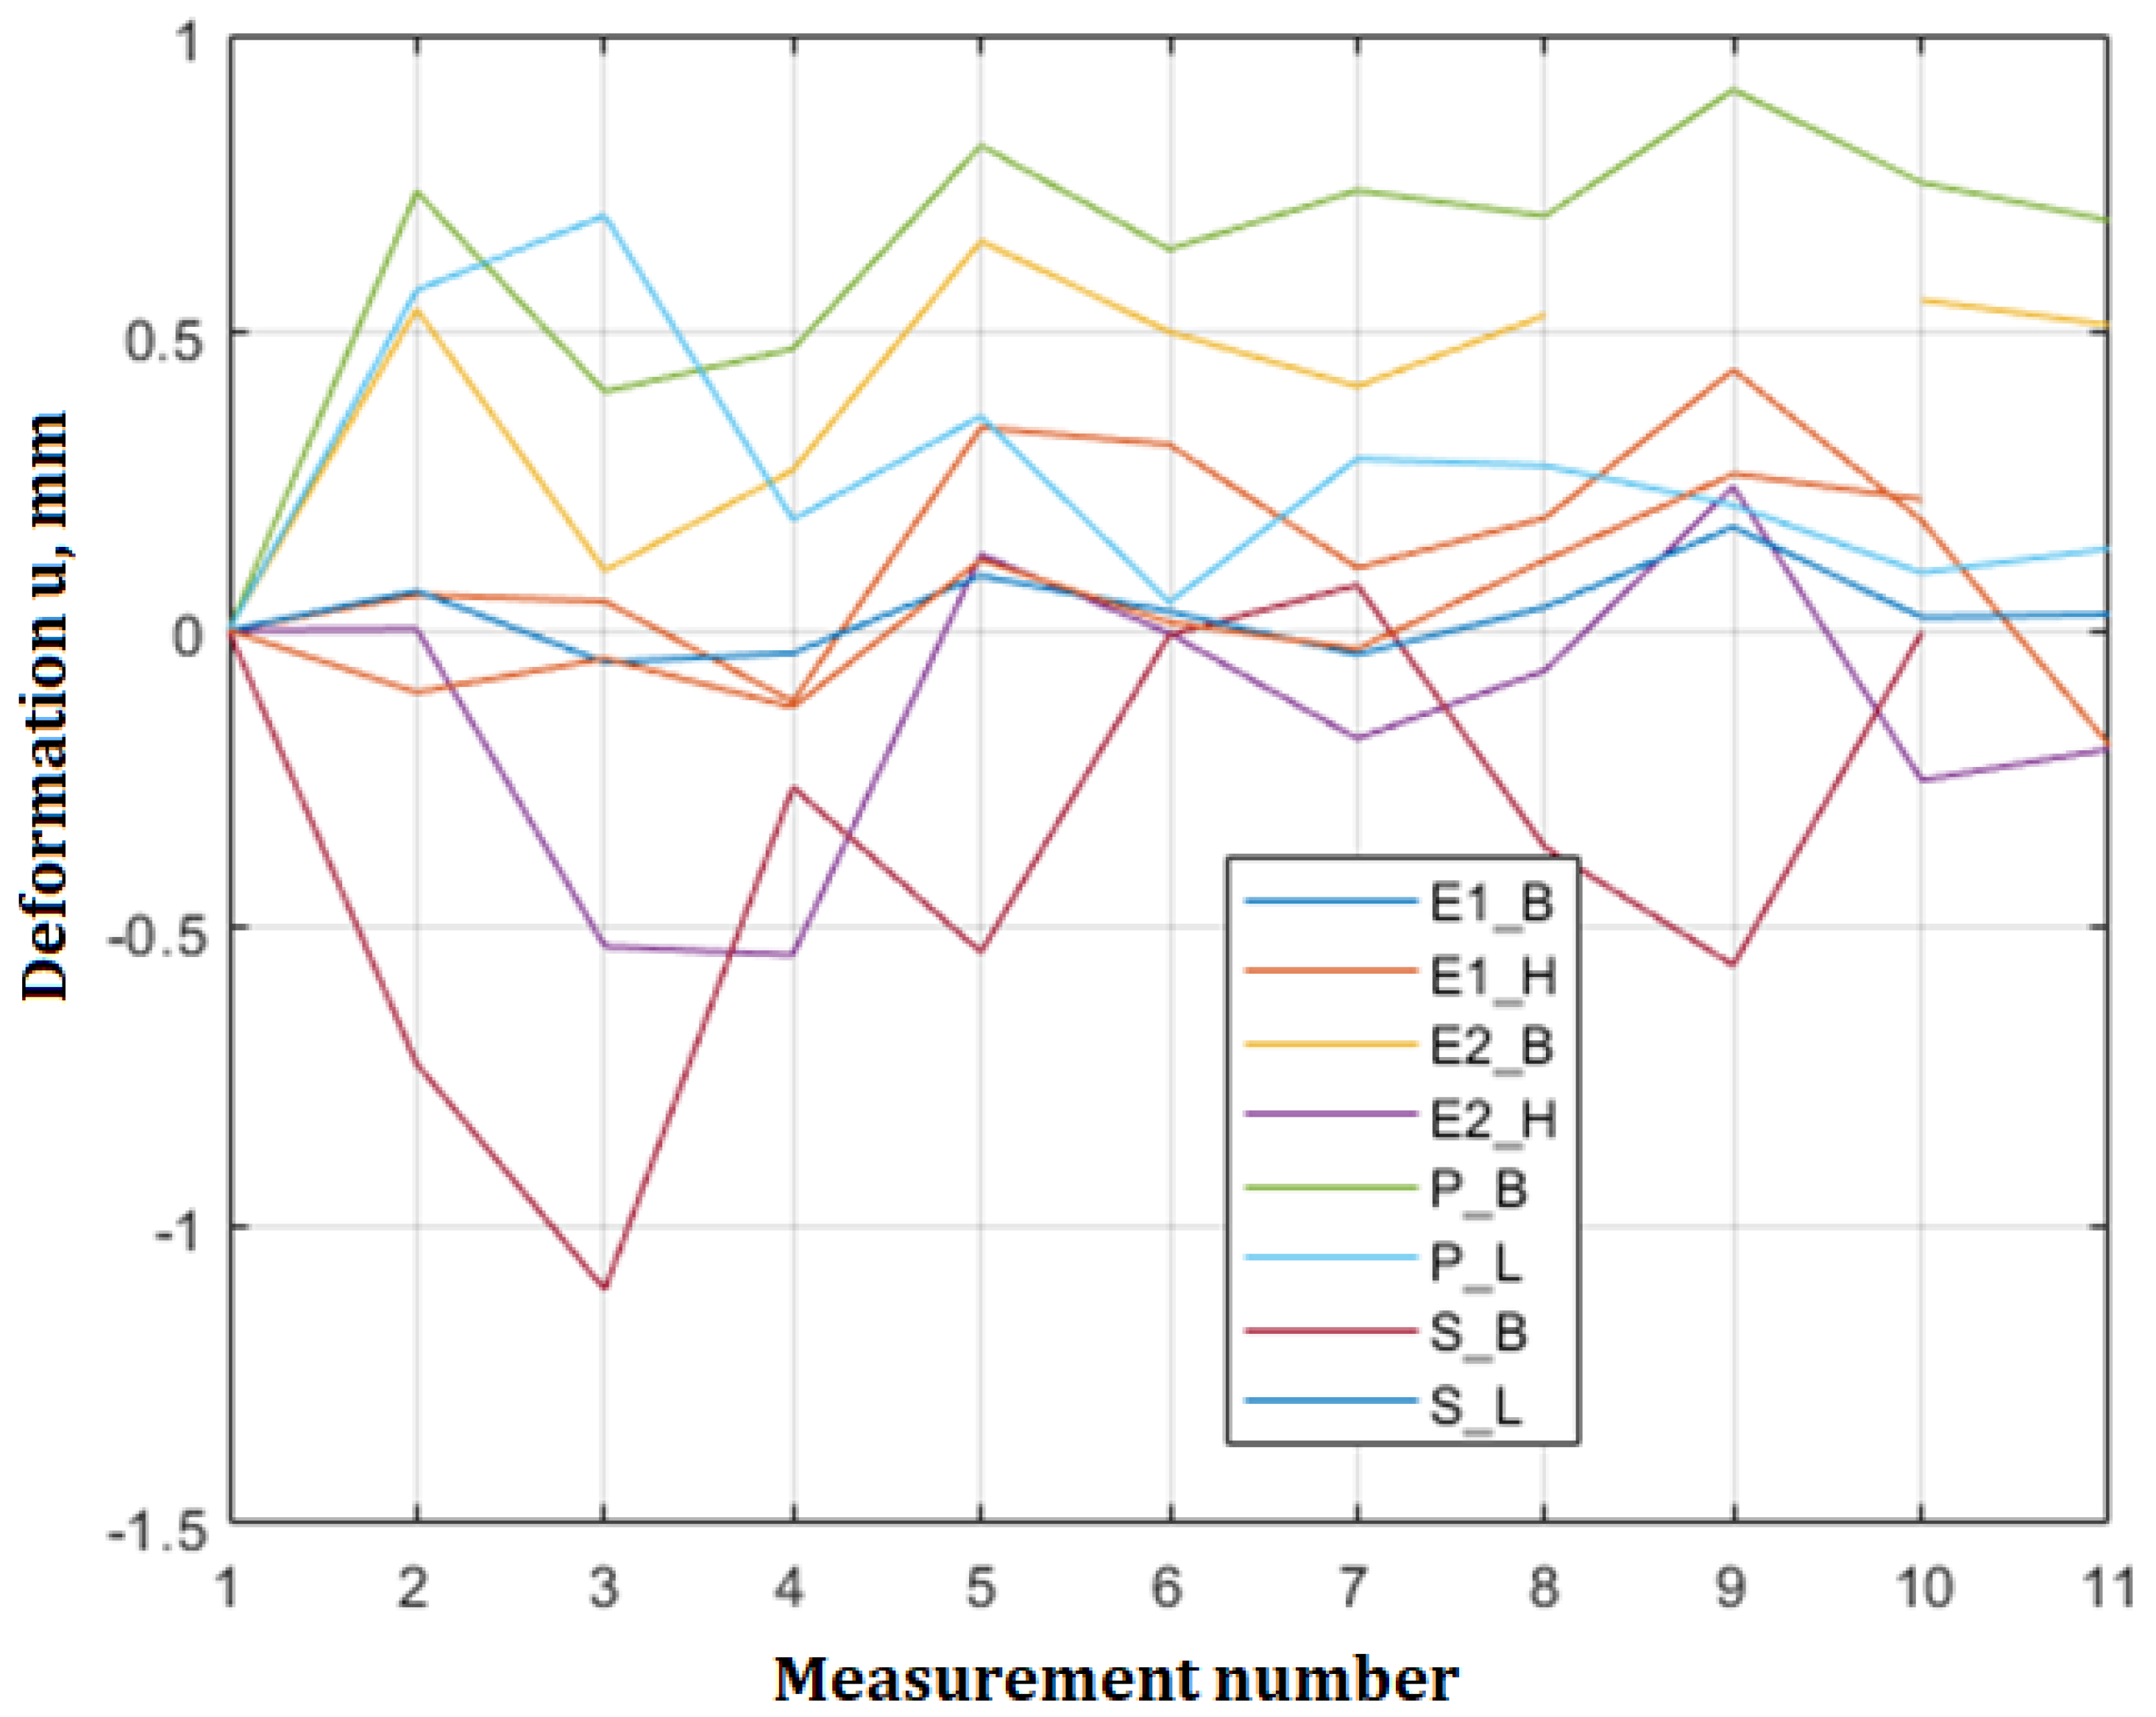
For the purposes of the analysis of the DIC results, an independent definition of the gondola markings was prepared (
Figure 3a), in which: E1—ring A, E2—ring B, P—floor/bottom frame, S—ceiling/upper frame. Longitudinal dimensions were marked with the letter L, transverse dimensions with the letter B, and dimensions in the vertical direction with the letter H. For example, the designation E1_B describes the change in the width of ring A.
Based on the conducted tests, a set of results was prepared to show the change in the characteristic dimensions of the gondola in the directions mentioned above (deformation of the rings, distances between them, distances between the upper and bottom frames, etc.). The obtained results are summarized in
Table 2. For the purposes of a more accurate interpretation of the results, a graph was prepared in
Figure 13, showing the change of individual distances (displacements) during subsequent inspections with the DIC system.
Based on the measurements, it can be concluded that there was no permanent deformation of the structure. The obtained changes in the characteristic dimensions of the structure assume small values of the order of measurement uncertainty. No growing tendencies of these dimensions are observed. They have a variable character resulting from the residual load during the measurement. This, in turn, results from the fact that during the measurements the loading system was not disconnected from the test object.
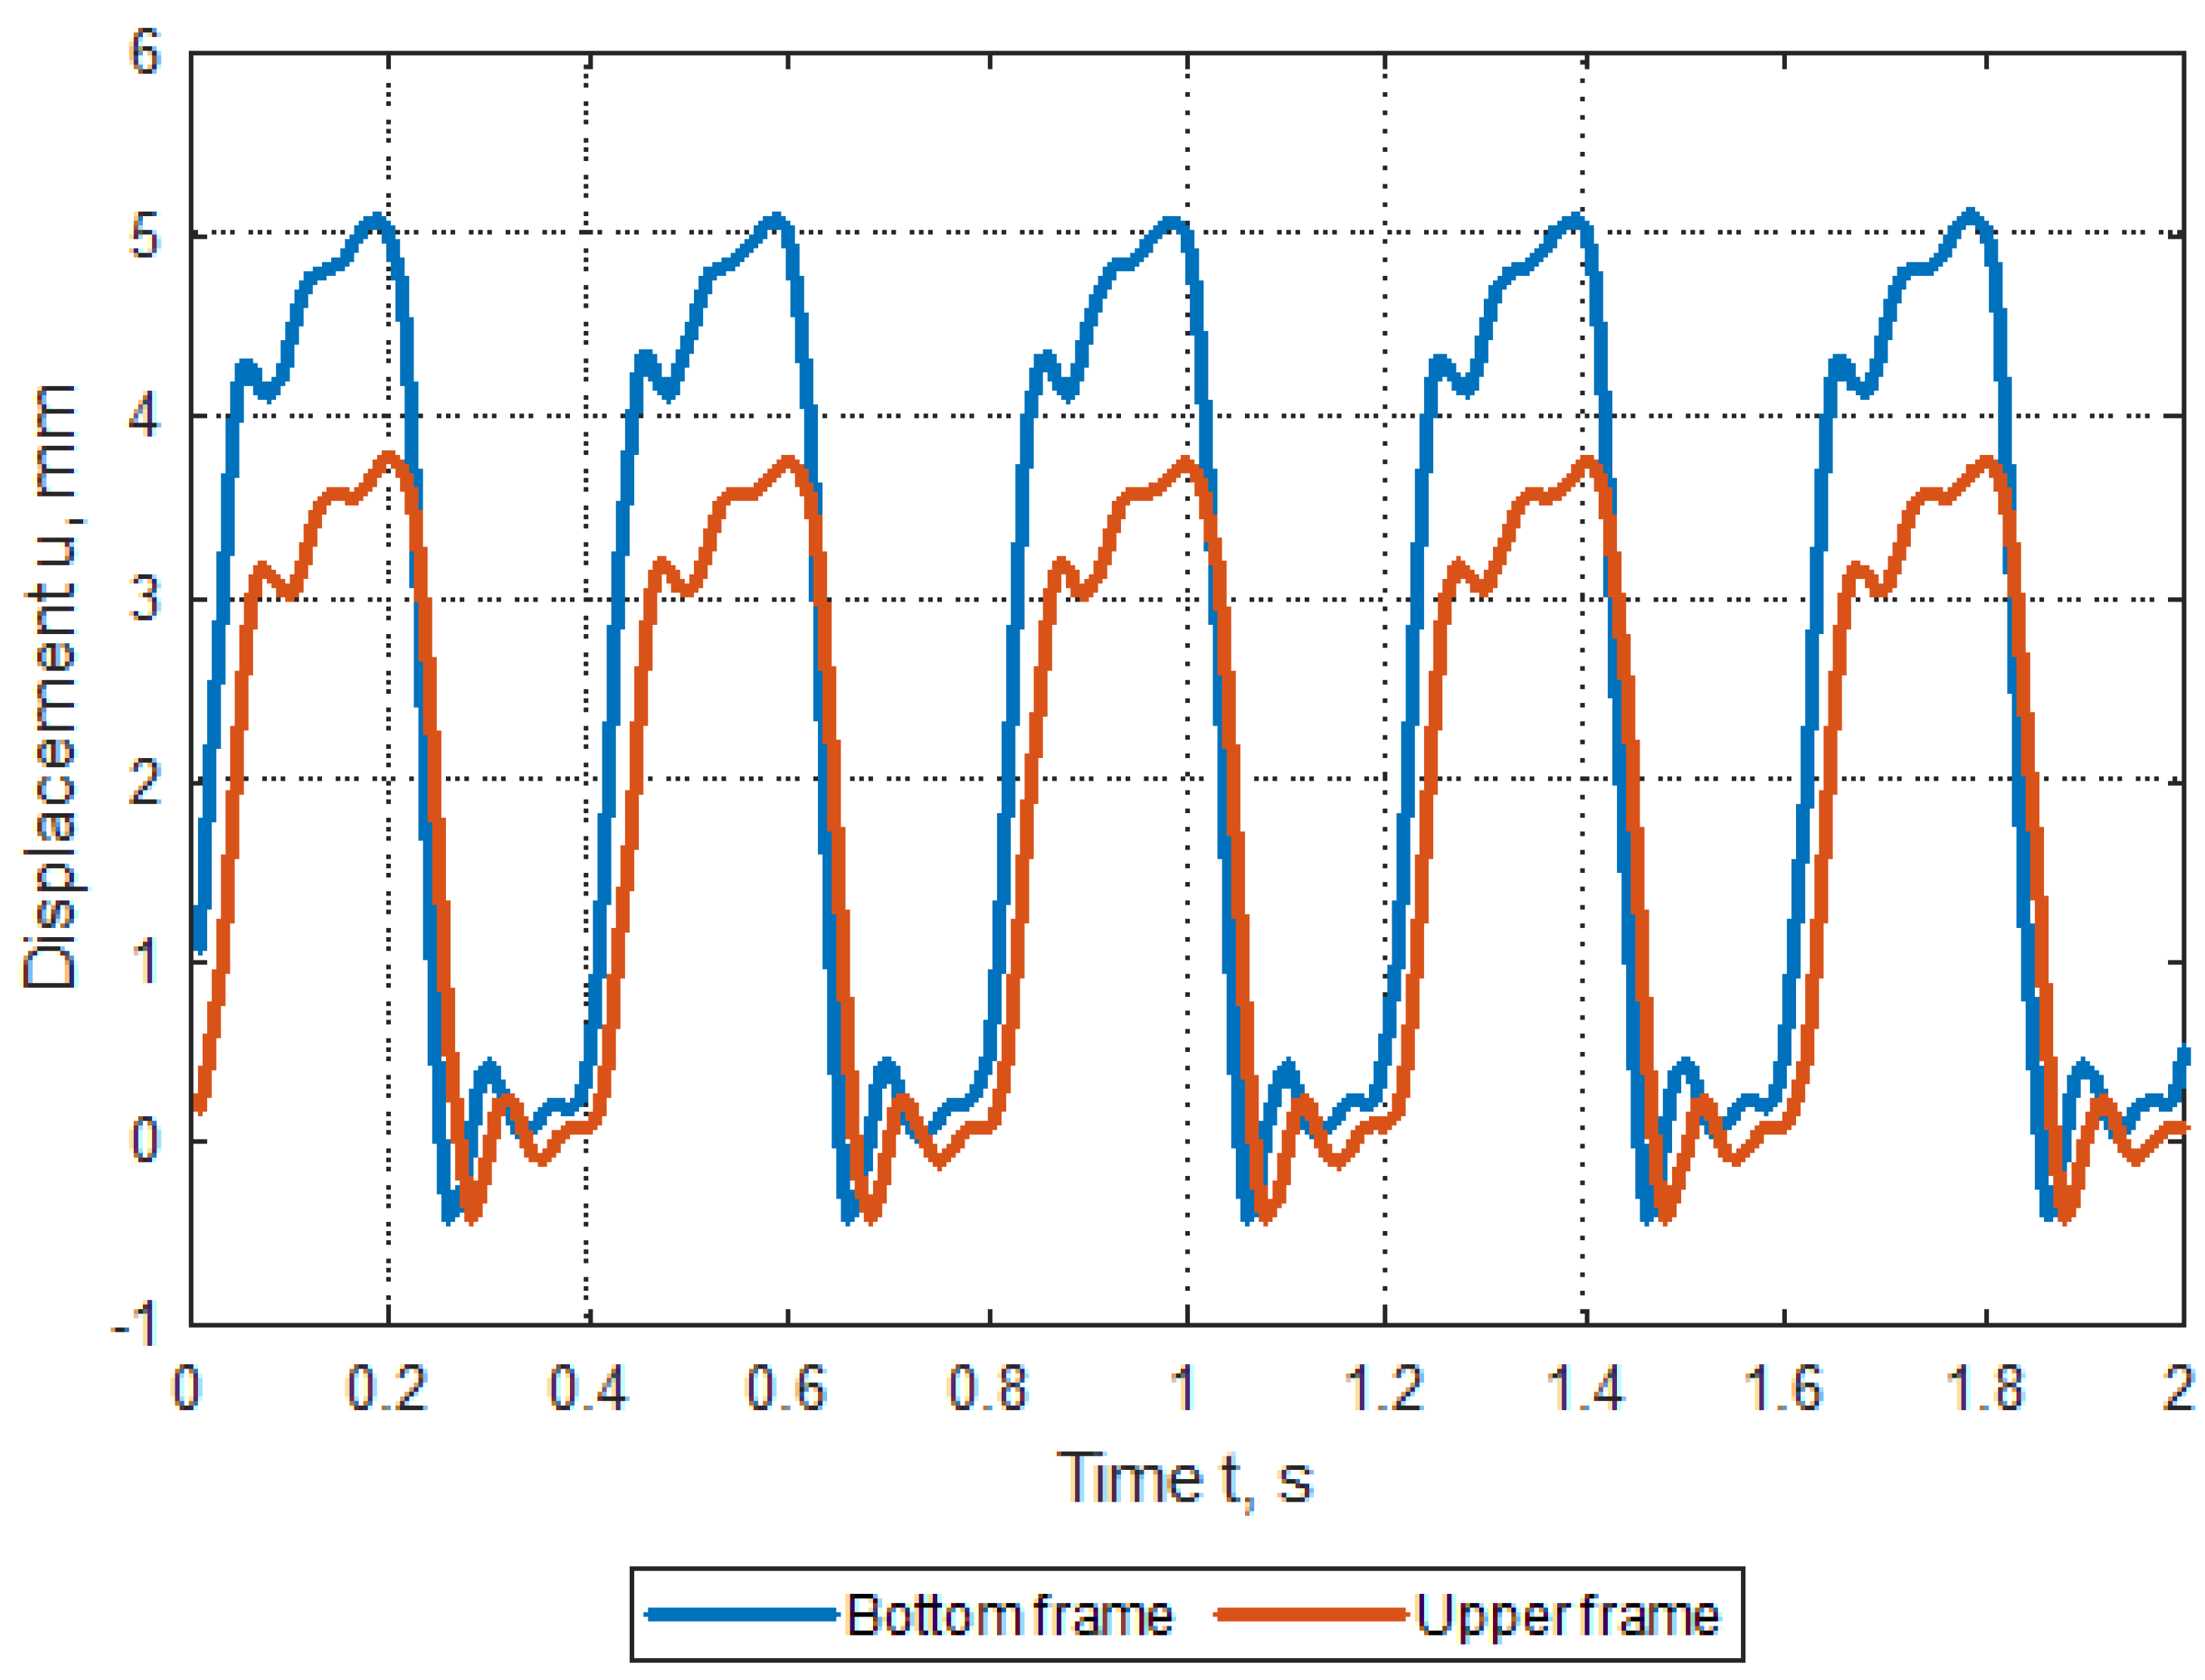
Conducted in parallel to the DIC, research using laser sensors allowed to determine the level of displacement of the bottom and upper frame of the tested gondola. The results are presented in
Figure 14. The difference in levels of about
mm is the actual spreading of the gondola elements—stretching of the “A” and “B” rings. The slight phase shift shows the delay in the appearance of the displacements between the frames.
After the fatigue tests are completed, before dismantling the gondola from the strength cage, an inspection should be carried out by the Certification Laboratory (in the case of the test facility in question—the TDT Laboratory with its registered office in Krakow).
6. Conclusions
Tests of gondolas for cableways in accordance with the EN 13786-3 standard should be carried out using a force cage. The loads, in the conducted tests, can be generated by a pneumatic cylinder mounted in the lower part of the strength cage. The transfer of the load from the actuator to the bottom frame of the gondola is carried out by a system of C-beams, articulated and screw connections. In order to evenly distribute the load on the structure of the bottom frame of the gondola, a set of C100 beams (located horizontally) should be prepared, which will transfer the loads to the beams suspended under the gondola through the M24 bolts.
The actuator together with the system of beam sections fixing the gondola through the upper frame and the bottom frame should be located in one axis. Such arrangement of the fastening and loading components ensures adequate rigidity of the structure while ensuring the axial character of the generated load.
In the case of the discussed gondola (designed by TRANSSYSTEM S.A.), the values of loads N and N were determined. A load of about 21 kN (F = 20,994 N) applied along the Z axis causes the stretching of the gondola. The character of the load cycle obtained in this way is compliant with the EN 13796-3 standard. The load is sinusoidal with the initial load kg, i.e., 2550 N. The value of the average load in the discussed tests was 13,047.3 N. The load is generated with a frequency of about 2 Hz (in the range from to Hz—depending on the elasticity of the system and the “return of the gondola”). The maximum value of the load observed in the gondola was 23,544 N.
Every 500,000 load cycle, a technical break should be introduced during which visual inspections (organoleptic and endoscope inspections—to verify the screw connections used to build the gondola) should be made. It is a good practice to additionally conduct research using digital image correlation (DIC) in order to detect potential permanent deformation/relative displacement of individual gondola elements. By default, 11 visual inspections and DIC tests should be performed—pre-test, every 500,000 load cycles. cycles and after fatigue tests. The inspections carried out, together with the appropriate photographic documentation, should be attached to the final report.
The use of photogrammetry allowed for accurate (assumed accuracy of mm) verification of the deformation of the structure. Due to the relatively large dimensions of the gondola (height 3 m, width 2 m), it would be troublesome to carefully monitor the structure without specialized equipment.The distribution of measurement points allows for accurate and repeatable measurements of the distance between these points, which facilitates work and increases the amount of data received for analysis of the structure’s operation.
Future research should be focused on determining the maximum loads carried by the structure and determining the impact of shaping profiles on their fatigue life. Future research should include both the research of the nacelle structure (individual elements) and the methodology of testing such vehicles, taking into account the conditions of the ISO 13796-3 standard.

 ,
, 


