1. Introduction
It is inevitable to expand the implementation of renewable power plants in a transition to low-carbon power generation, and wind power is recognized as one of the most promising renewable sources of power generation. For example, it is expected that the wind power will account for approximately 30% of renewable power generation by 2034 in the Republic of Korea [
1]. Encountered with an increasing demand for precise performance analysis of wind turbines (WTs), power curve modeling of individual WTs is crucial for an efficient integration of wind generation into the power system [
2]. Representing the power output of WTs with respect to wind speed under ideal environment free from external noises, the specification power curve is often provided by the manufacturer. It is not unusual, however, that the actual power curve of installed WTs does not coincide with the power curve specification mainly due to highly variable and hardly controllable operational and environmental factors, such as component wear-out, breakdown maintenance, air density, temperature, humidity, precipitation, etc. [
3,
4]. It is therefore pointed out in [
5] that the prediction error in generation output may be brought about by the improper use of theoretical power curve as well as the variability in wind speed.
Power curve modeling has been extensively examined in the literature and the modeling approach can be categorized into parametric and nonparametric ones [
3,
4,
5,
6]. The former postulates a mathematical model of which parameters are to be estimated from observed data, whereas the latter may not be confined to specific models and a wide variety of candidate models may be scrutinized. The most recent development of modeling approaches often adopts different machine learning algorithms [
7,
8]. Interested readers are also referred to [
5,
9] for the development of WT power curve modeling techniques. Since the adequacy of modeling approach is highly dependent upon both the quantity and quality of available data, no one model or method may not be said to be unequivocally or universally superior to others. There exists a general consensus, however, that detecting and removing outliers included in the data prior to modeling is essential for a more proper estimation of power curves no matter which approach is employed [
5,
10]. Outliers may be caused by factors directly related to the operation of WTs, such as output curtailment and outage due to failure and maintenance of individual turbines, as well as simple measurement errors [
10]. The behavior of outliers is also affected by the time resolution of data, and it is relatively easy to detect outliers with higher time resolution, preferably with less than 10 min of time resolution. It is often the case, however, that a sufficient amount of data with enough time resolutions may not be readily available. For example, the measurement data for wind speed and power output are taken hourly in most wind farms in the Republic of Korea.
This study is aimed at outlining the estimation of actual power curves which may better account for operational and environmental variations than the specification power curves. A more efficient and effective planning and operation of WTs may thus be enabled by systematically detecting and eliminating outliers. Proposed is the outlier elimination procedure under variable circumstances by adopting different clustering algorithms frequently used in unsupervised machine learning. More specifically, the density-based algorithm of DBSCAN (Density-Based Spatial Clustering of Applications with Noises) is employed in combination with the partition-based K-means clustering algorithm. These algorithms differ in their approach and assumptions, and it is asserted that the proposed procedure may be efficient to detect and eliminate outliers from data with insufficient time resolution as exemplified in the Korean wind farms. After taking outliers out of the dataset, it is then necessary to fit the power curve with inlying data points for an effective operation of individual wind turbines by better representing their actual power output. Several parametric models widely employed in the literature, such as polynomial, Gompertz, Weibull, and logistic functions [
3,
5], can be tested and compared for their fitness to the refined data points to derive the corresponding power curve. The overall procedure is demonstrated with the observations taken from WTs in a Korean wind farm site. The remainder of this study is organized as follows: First, a brief description of power curve is outlined and the behavior of outliers from actual observations is also discussed. Second, an overall procedure for power curve modeling is proposed by employing clustering-based machine learning algorithms and parametric curve fitting. The proposed procedure is then demonstrated with the data from a Korean wind farm site having the time resolution of 1 h. The concluding remarks follow in the last section.
2. Data and Method
Wind turbines covert the kinetic energy of wind into electric energy by using a wind rotor and the aerodynamic forces are generated when wind passes over the blades of the rotor. When the wind flows over the rotor blades, a lift force is generated due to the difference in air pressure on the two sides of blade which causes the blade to rotate. As the blades rotate, a shaft connected to a generator also rotates to spin the generator and generate electric energy. The amount of energy produced depends upon the wind speed as well as the technical characteristics of WTs. The power curve of wind turbines is a specific type of power curve that describes the relationship between wind speed and the amount of electrical power that can be generated by a wind turbine [
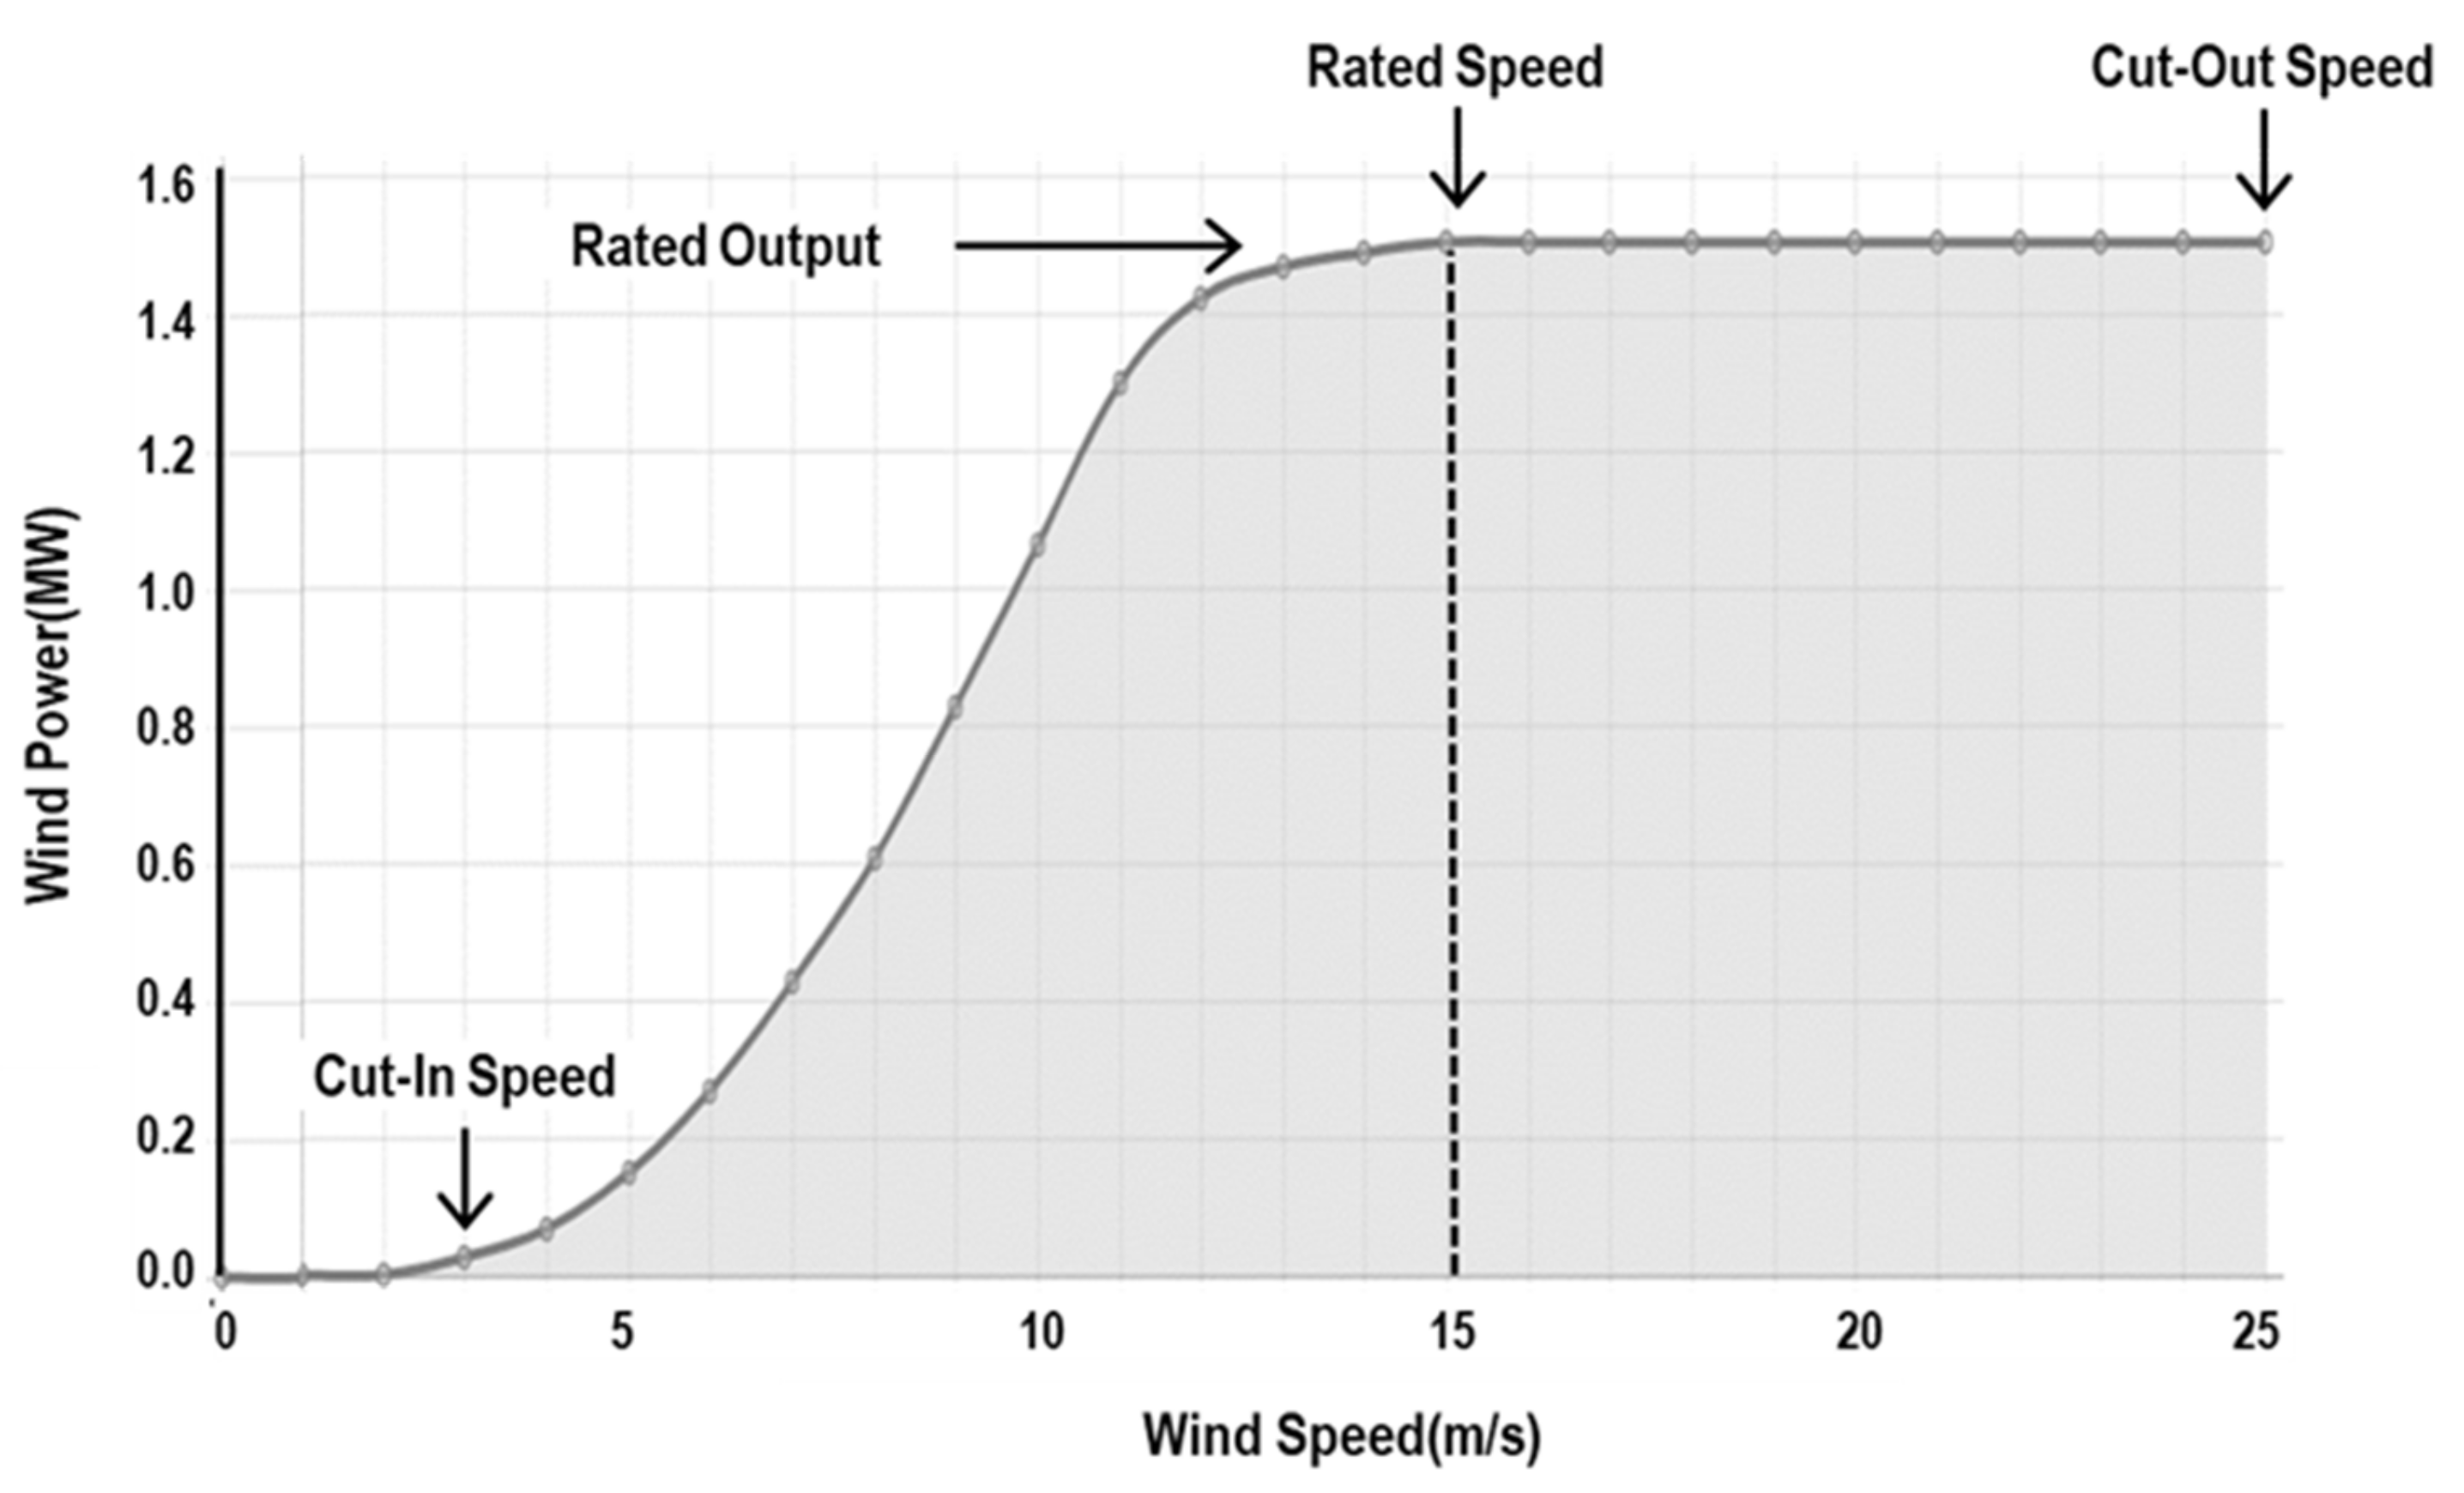
11]. The power output of a wind turbine is directly proportional to the wind speed, but the relationship is not linear. Understanding the power curve of a wind turbine is crucial for wind farm operators to maximize the energy output and economic efficiency of their wind turbines. By monitoring and analyzing the power curve over time, operators can identify any issues or inefficiencies with the turbines and take corrective action to improve their performance. Additionally, the power curve can help predict the energy output of a wind farm, which can be used to estimate the economic viability of a project and inform energy planning and policy decisions. A typical power curve for a wind turbine shows that the turbine produces little or no power at wind speeds below a certain threshold, known as the cut-in speed. As wind speed increases beyond the cut-in speed, the power output of the turbine increases, reaching a maximum at the rated wind speed. The rated wind speed is the wind speed at which the turbine is designed to produce its maximum power output. Beyond the rated wind speed, the power output of the turbine begins to level off, and at some point, it reaches its maximum output, known as the rated power output. This point is the maximum amount of power that the turbine can produce, regardless of how strong the wind gets. Beyond the rated wind speed, the power output of the WT may be kept constant via the stall or brake mechanism to avoid the risk of rotor damage from over-speeding. This mechanism explains why the power curve of WTs takes a different form from the usual power curve of cubic function. At some point, the wind speed becomes too high and the turbine needs to shut down to avoid breakdown from further operation. This wind speed is known as the cut-out speed [
11].
The shape of the power curve can vary depending on the specific design and characteristics of the wind turbine, as well as the wind conditions at the site where the turbine is installed. For example, some wind turbines may have a steeper increase in power output at lower wind speeds than others, and some may have a lower cut-out wind speed.
Figure 1 depicts the traditional specification power curve of WTs, which represents the amount of specified power output with respect to varying wind speed. The turbine begins to generate power at the cut-in speed, and the amount of power generation steadily increases up to the rated output at the rated wind speed. No power can be generated when the wind speed is greater than the cut-out speed. The typical values of cut-in, rated, and cut-out speeds are 3~4 m/s, 11~13 m/s, 23~25 m/s, respectively [
12,
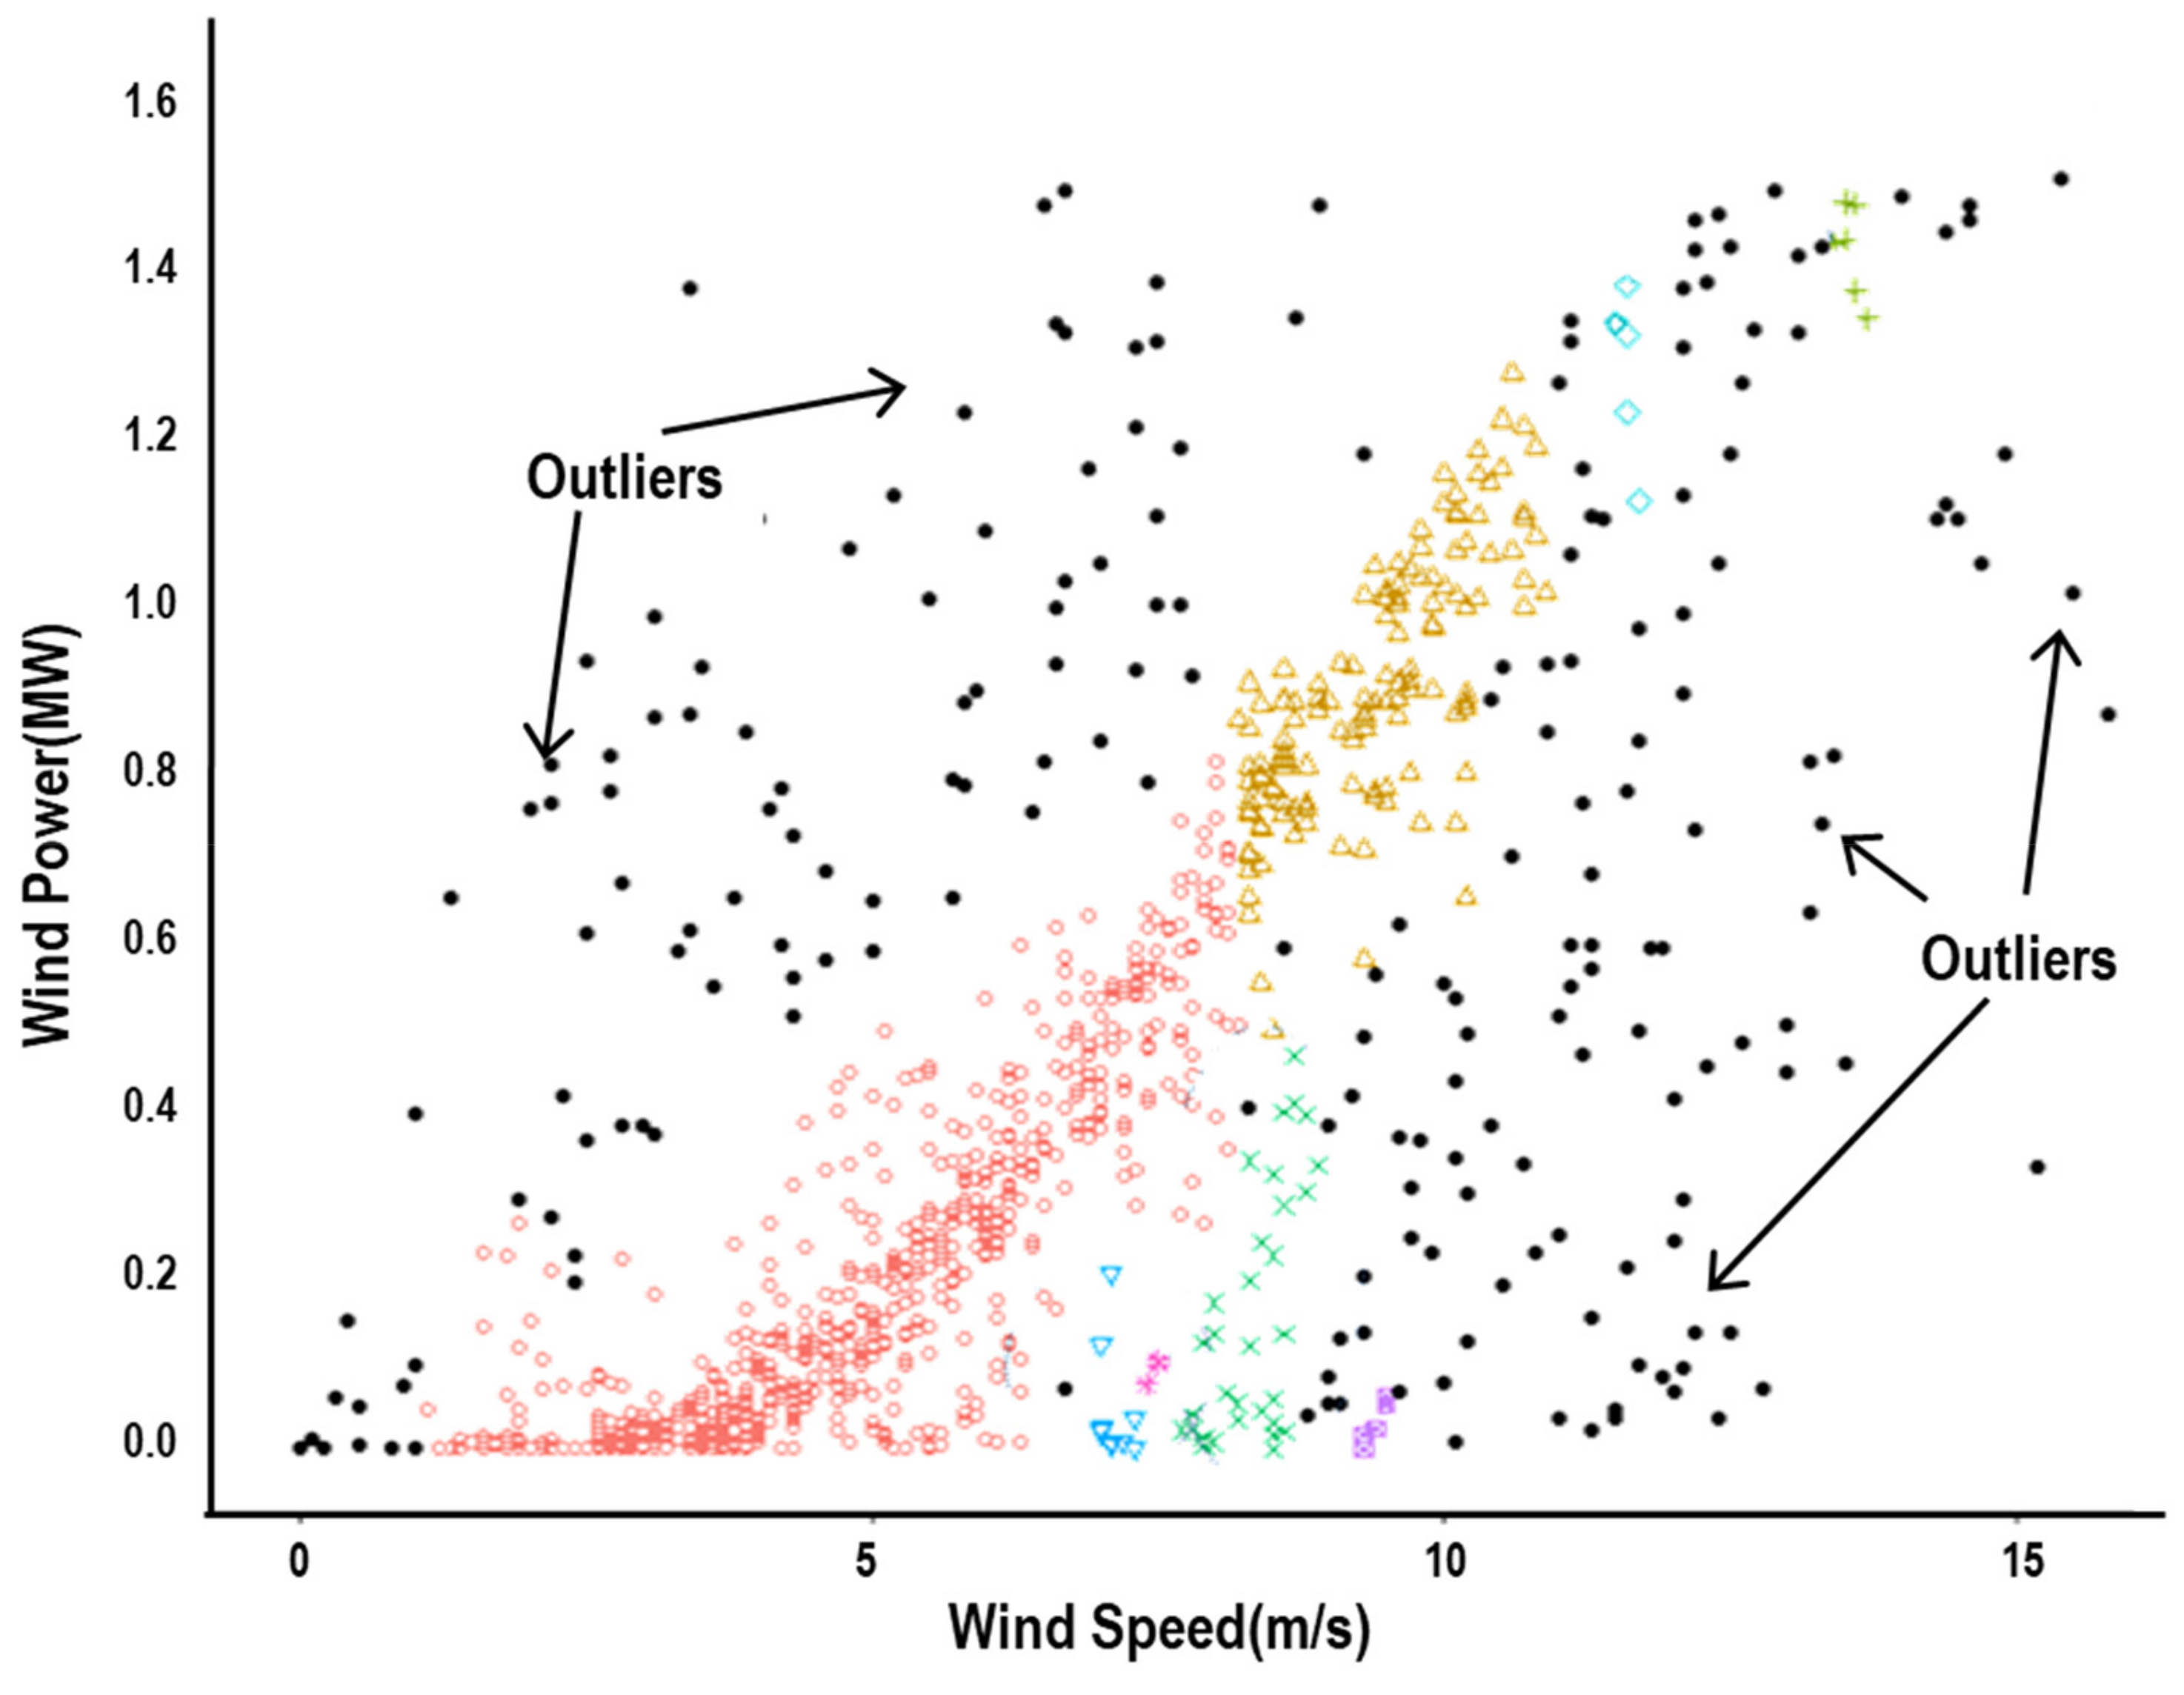
13]. As stated earlier, however, the observed data greatly deviate from the specification power curve presumably due to various factors related to the operational characteristics of turbines, environmental conditions, and measurement errors as shown in
Figure 2, which plots 1095 data points of power output against wind speed from 1.5 MW and 3.0 MW wind turbines from the Hankyung wind farm site in the Republic of Korea over the period 2018~2020.
It is widely acknowledged that how effectively remove outliers plays a decisive role in the accuracy of power curve estimation since they prominently influence either the fit of the model or the estimation of parameters [
14]. The causes of outliers are multifaceted, which may include the operational abnormality because of outage, curtailment, and maintenance, the average-out effect from the lack of temporal resolution, and measurement errors. No matter what the causes of outliers are, the most important aspect of outlier issues is the technique to identify them. It is suggested that outliers are divided into three different types in this study as shown in
Figure 2. Data points that little power is generated even at a wind speed higher than the cut-in speed are labeled as Type I outliers. The main probable causes of Type I outliers are the outage and curtailment due to failure and maintenance. Type II outliers designate data points that unusually higher outputs are generated at a given wind speed, and their most probable causes are measurement errors [
10]. The so-called average-out effects may cause Type III outliers that the generation output can be less than the expected output when a turbine is stopped or the output is curtailed for a shorter period of time than the data collection interval, i.e., 1-h in this case. The incorrect load of wind rotor as well as measurement errors may also be the source of Type III outliers. It may seem simple and intuitive to screen out these outliers, but it will be highly inefficient to revise the power curves better representing the operational characteristics of individual turbines as more data become available over time. This study postulates that a rigorous and scientifically sound procedure for outlier detection may facilitate the periodic revision of power curve modeling. Machine learning algorithms combined with traditional statistical approaches can enhance the ability to cope with variations in wind power production while ensuring the accuracy of power curves, especially when a larger amount of training and testing data is being collected over the long-term time period.
3. Proposed Procedure
Having long been under investigation in the community of data analysis, outlier detection is a method to identify data points that are significantly different from the majority in a dataset. Outliers may affect the accuracy of data analysis and models, and there exists a variety of different methods for outlier detection. The choice of method depends on the characteristics of the data and the research question at hand. Encountered with excessive inherent variations in wind speed and potential difficulties with data collection of enough time resolution, power curve modeling experiences the lack of detailed information regarding the operation of wind turbines. Under such circumstances, clustering algorithms can be effectively employed. Clustering algorithms are a type of unsupervised machine learning technique used to group similar data points together into clusters. The main goal of clustering algorithms is to find natural groupings in the data without any prior knowledge of the labels or categories that the data points belong to. The most popular applications of clustering include customer segmentation, image classification, and recommendation systems. It can also be used for anomaly or outlier detection by identifying data points that do not belong to any of the existing clusters. These data points can be considered as outliers or anomalies and may indicate unusual behavior, errors, or other anomalies in the data. There are many different types of clustering algorithms, but some of the most commonly used ones include partition- and density-based clustering. The most popular partition- and density-based methods are DBSCAN and K-means, respectively.
As a density-based clustering algorithm, DBSCAN can handle arbitrary-shaped clusters and does not require a predefined number of clusters. It groups data points that are close to each other and separates outliers that are far from any cluster by defining a neighborhood around each data point and looking for areas of high density. It can be observed from
Figure 2 that data points far from the usual power curves are sparsely distributed and they may most probably be seen as manifest outliers. Thus, the density-based DBSCAN can be effective to rule out these points for power curve modeling. There are two key parameters in DBSCAN: epsilon, which defines the radius of the neighborhood around each data point, and minPts, which sets the minimum number of data points required to form a dense region. Unless the shape of remaining data points after DBSCAN clustering may closely coincide with the usual power curve, the power curve modeling can hardly be effective and it is not intuitive to apply the density-based clustering to remaining data points that are already densely distributed. Instead, partition-based methods such as K-means clustering can be effective to further group densely populated data points. K-means is a centroid-based clustering algorithm that partitions data into a fixed number of K clusters on their distances from a set of K centroids. It works by iteratively assigning each point to the nearest centroid and then updating the centroid based on the mean of the points assigned to it. This process continues until the centroids no longer move significantly or a maximum number of iterations is reached. It is not unusual to use the Euclidian distance for proximity measure [
15], but it is pointed out in [
16] that Mahalanobis distance is more appropriate for correlated data and it is defined as
where the Mahalanobis distance between
and
is denoted by
, and
is the covariance matrix of
and
. It is noted that the Mahalanobis distance is more appropriate than the usual Euclidian one in clustering for power curve modeling. The effectiveness of power curve modeling depends upon the detection and elimination of outliers, and it is proposed to employ clustering algorithms of DBSCAN and K-means in a sequential manner. Applying K-means clustering to remaining data points after DBSCAN clustering, clusters located near the usual power curves can now be used for power curve modeling of wind turbines.
After identifying and eliminating outliers from the dataset through clustering, the behavior of power curves from the cut-in speed to rated speed is often fitted with different parametric models such as polynomial, Gompertz, Weibull, and logistic functions [
3,
5]. The polynomial regression has often been adopted for power curve modeling [
5], which is a generalization of linear regression for nonlinear datasets. The polynomial regression of degree
can be written as
where
denotes the polynomial function,
represents the set of coefficients, and the random error term denoted by
follows the standard normal distribution, i.e.,
. Noting that the power curve is S-shaped, other parametric models may also be employed for power curve modeling [
3,
4]. The most popular S-shaped models are Gompertz, Weibull, and logistic functions, which are defined by Equations (3)–(5) in the below, respectively.
The goodness-of-fit of each model can now be compared to determine which fits best the data refined through clustering, using usual performance metrics such as root mean squared error (RMSE), mean absolute error (MAE), and coefficient of determination
. Denoting the actual and fitted values of power output by
and
, RMSE, MAE, and
can be written as
where
and
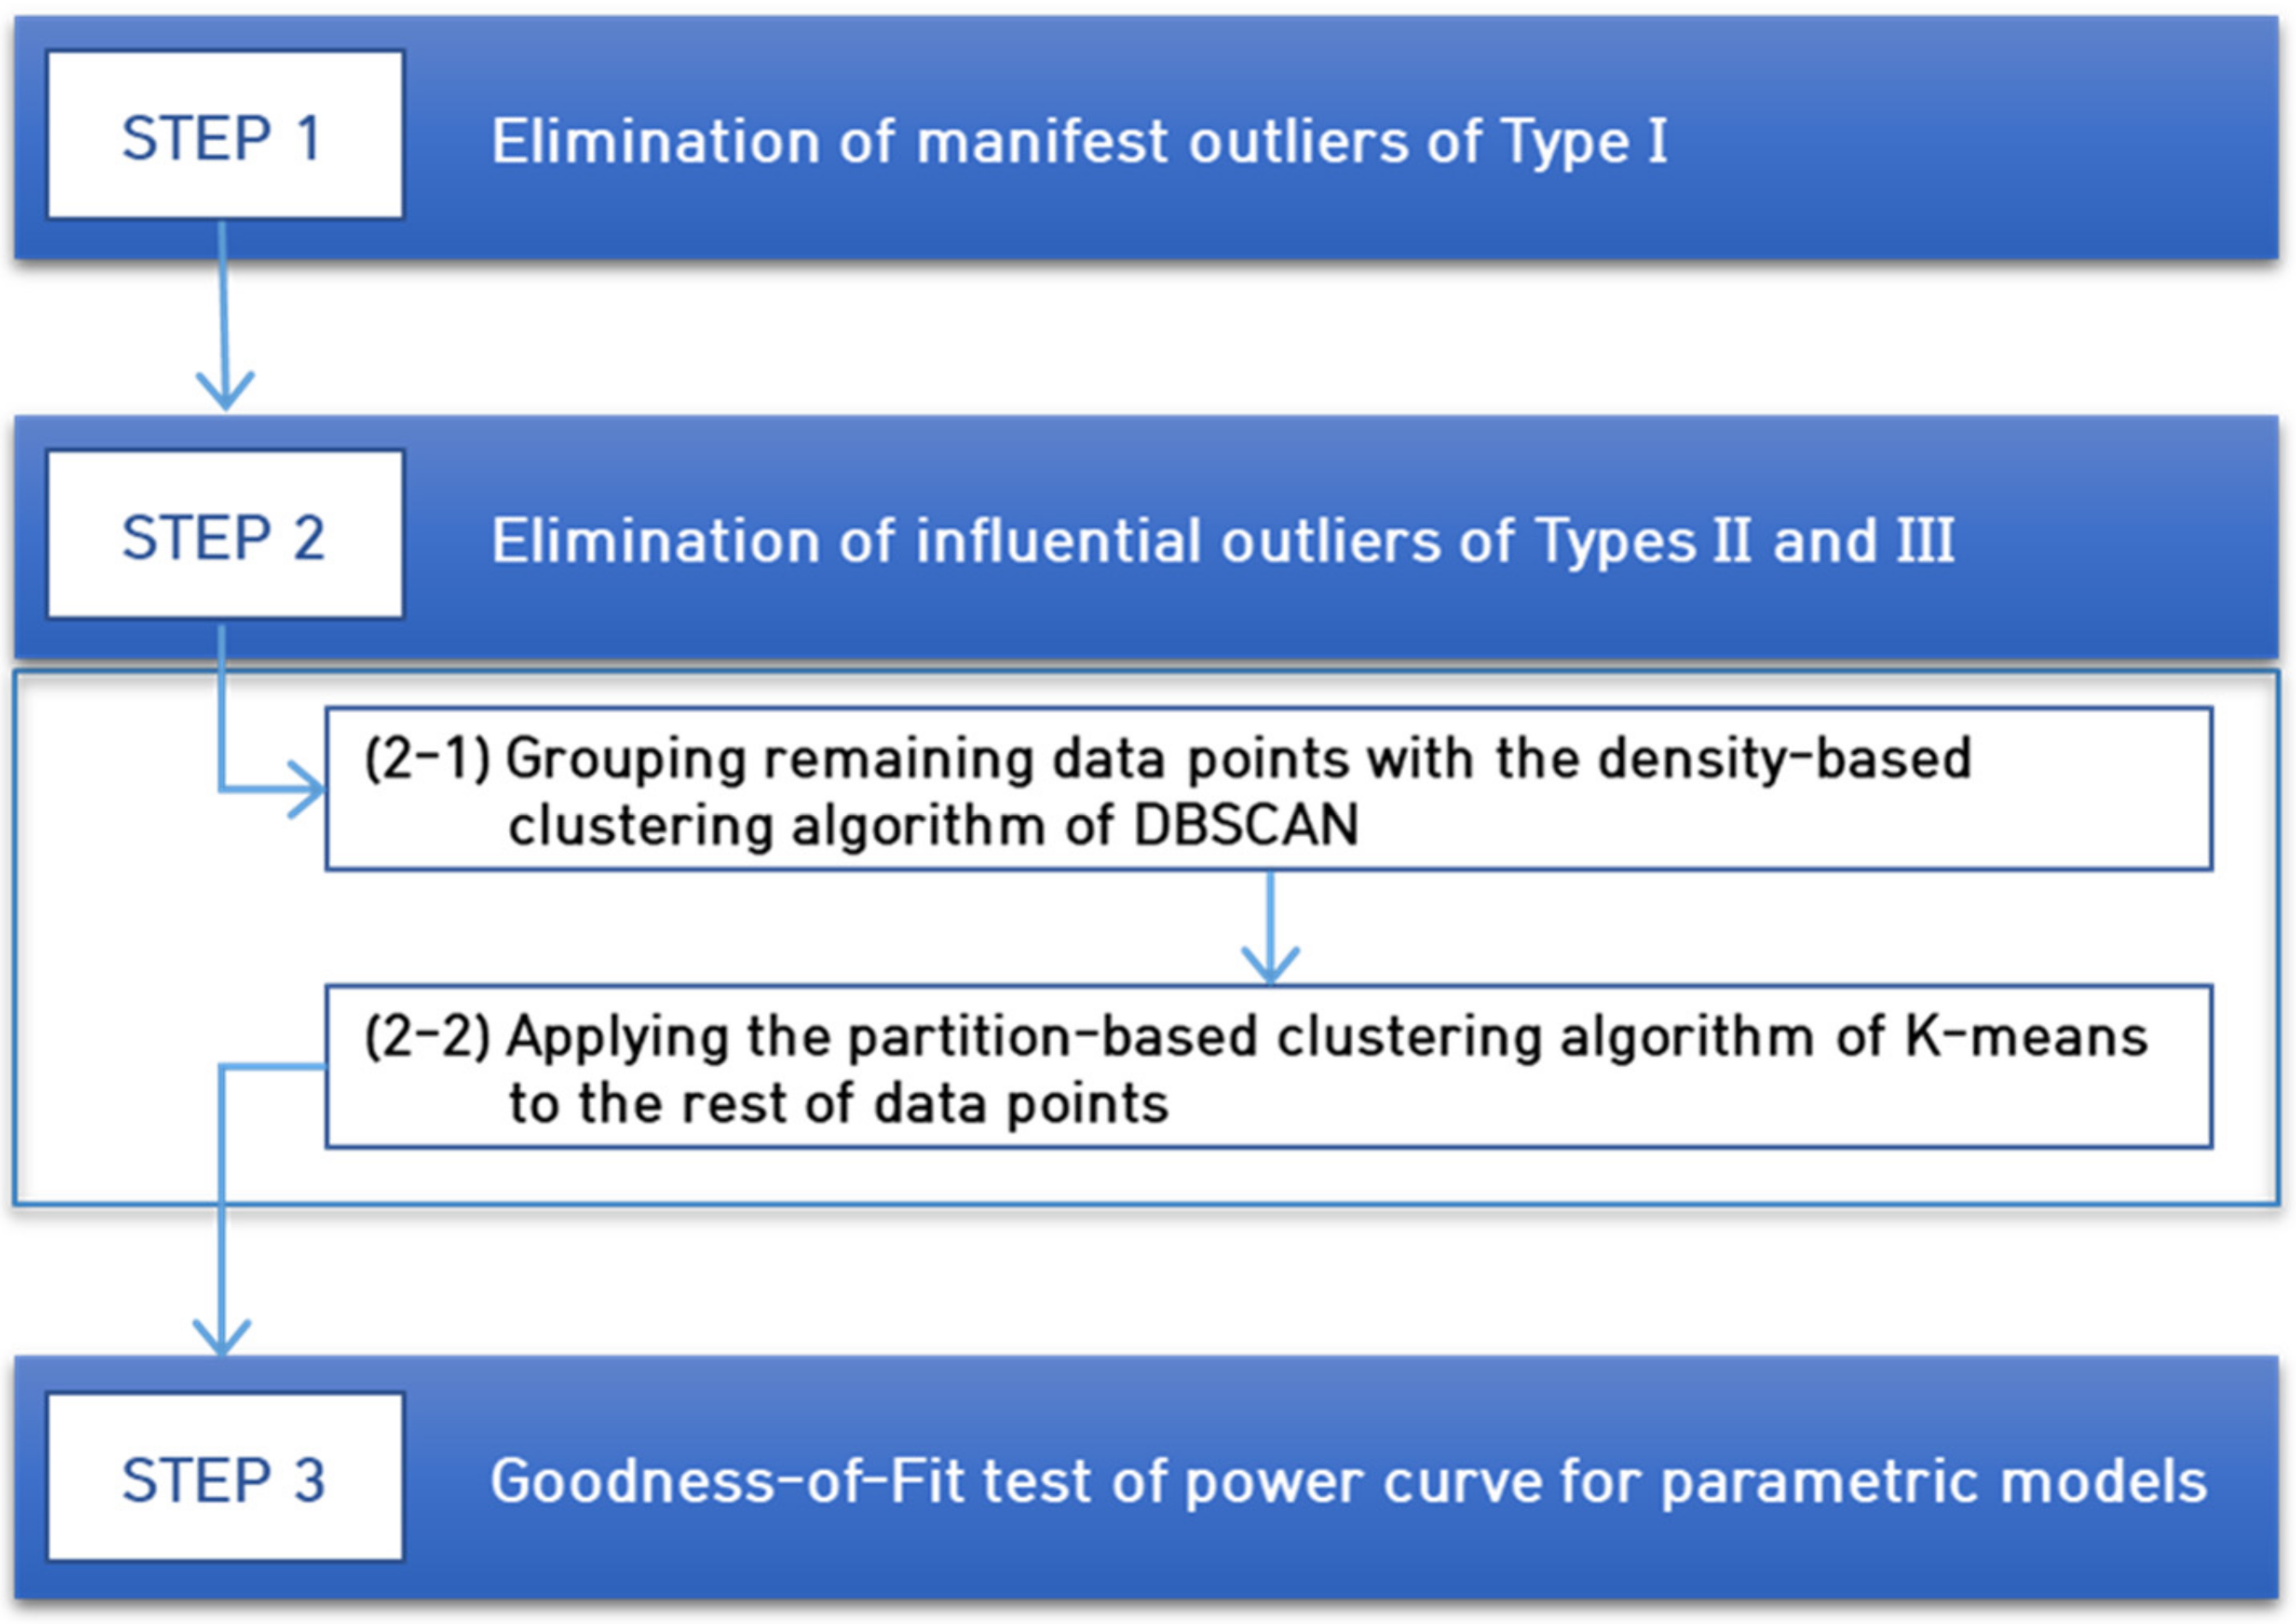
represent the number of data points and the sample mean of power output, respectively. Partitioning potential outliers into three different types, a 3-step power curve modeling procedure can be summarized as shown in
Figure 3.
4. Case Study
The proposed procedure outline in the previous section is now to be demonstrated with the case study of Hankyung wind farm in the Republic of Korea, which is consisted of three 1.5 MW and five 3.0 MW turbines. Data from one of the 1.5 MW turbines are taken over the period of 2018~2020 as shown in
Figure 2a. The turbine is manufactured by VESTAS and its cut-in and cut-off speeds are to be 4 m/s and 25 m/s, respectively. Unlike outliers of Type II and III, the cause of Type I outliers is relatively clear and it is intuitively obvious to take these outliers out of the dataset. Removed in [Step 1] are 59 data points that no power is generated at the wind speed higher than the cut-in speed of 4.0 m/s in this study. Potentially influential outliers are now to be screened using clustering algorithms. It is widely recognized that density-based clustering techniques are more efficient than partition-based techniques when it comes to arbitrary shaped clusters or anomaly detection [
17]. As an unsupervised learning method, the DBSCAN algorithm is first employed with epsilon = 0.15 and minPts = 5, which are chosen based on testing different combinations of parameters, in (2-1) of [Step 2]. Based on these two parameters, data points are categorized as core point, border point, or outlier, and those corresponding to outlier may be removed [
15,
18].
Figure 4 depicts the results from DBSCAN, where black dots represent data points classified as outlier. It can be observed that there are still a multitude of points classified as border point which seems influential but irrelevant in modeling the power curve.
The centroid-based algorithm of K-means clustering is then applied to identify those remaining influential outliers in (2-2) of [Step 2], and it is noted that the Mahalanobis distance instead of the usual Euclidian distance is used to reflect the correlation between wind speed and power output [
10].
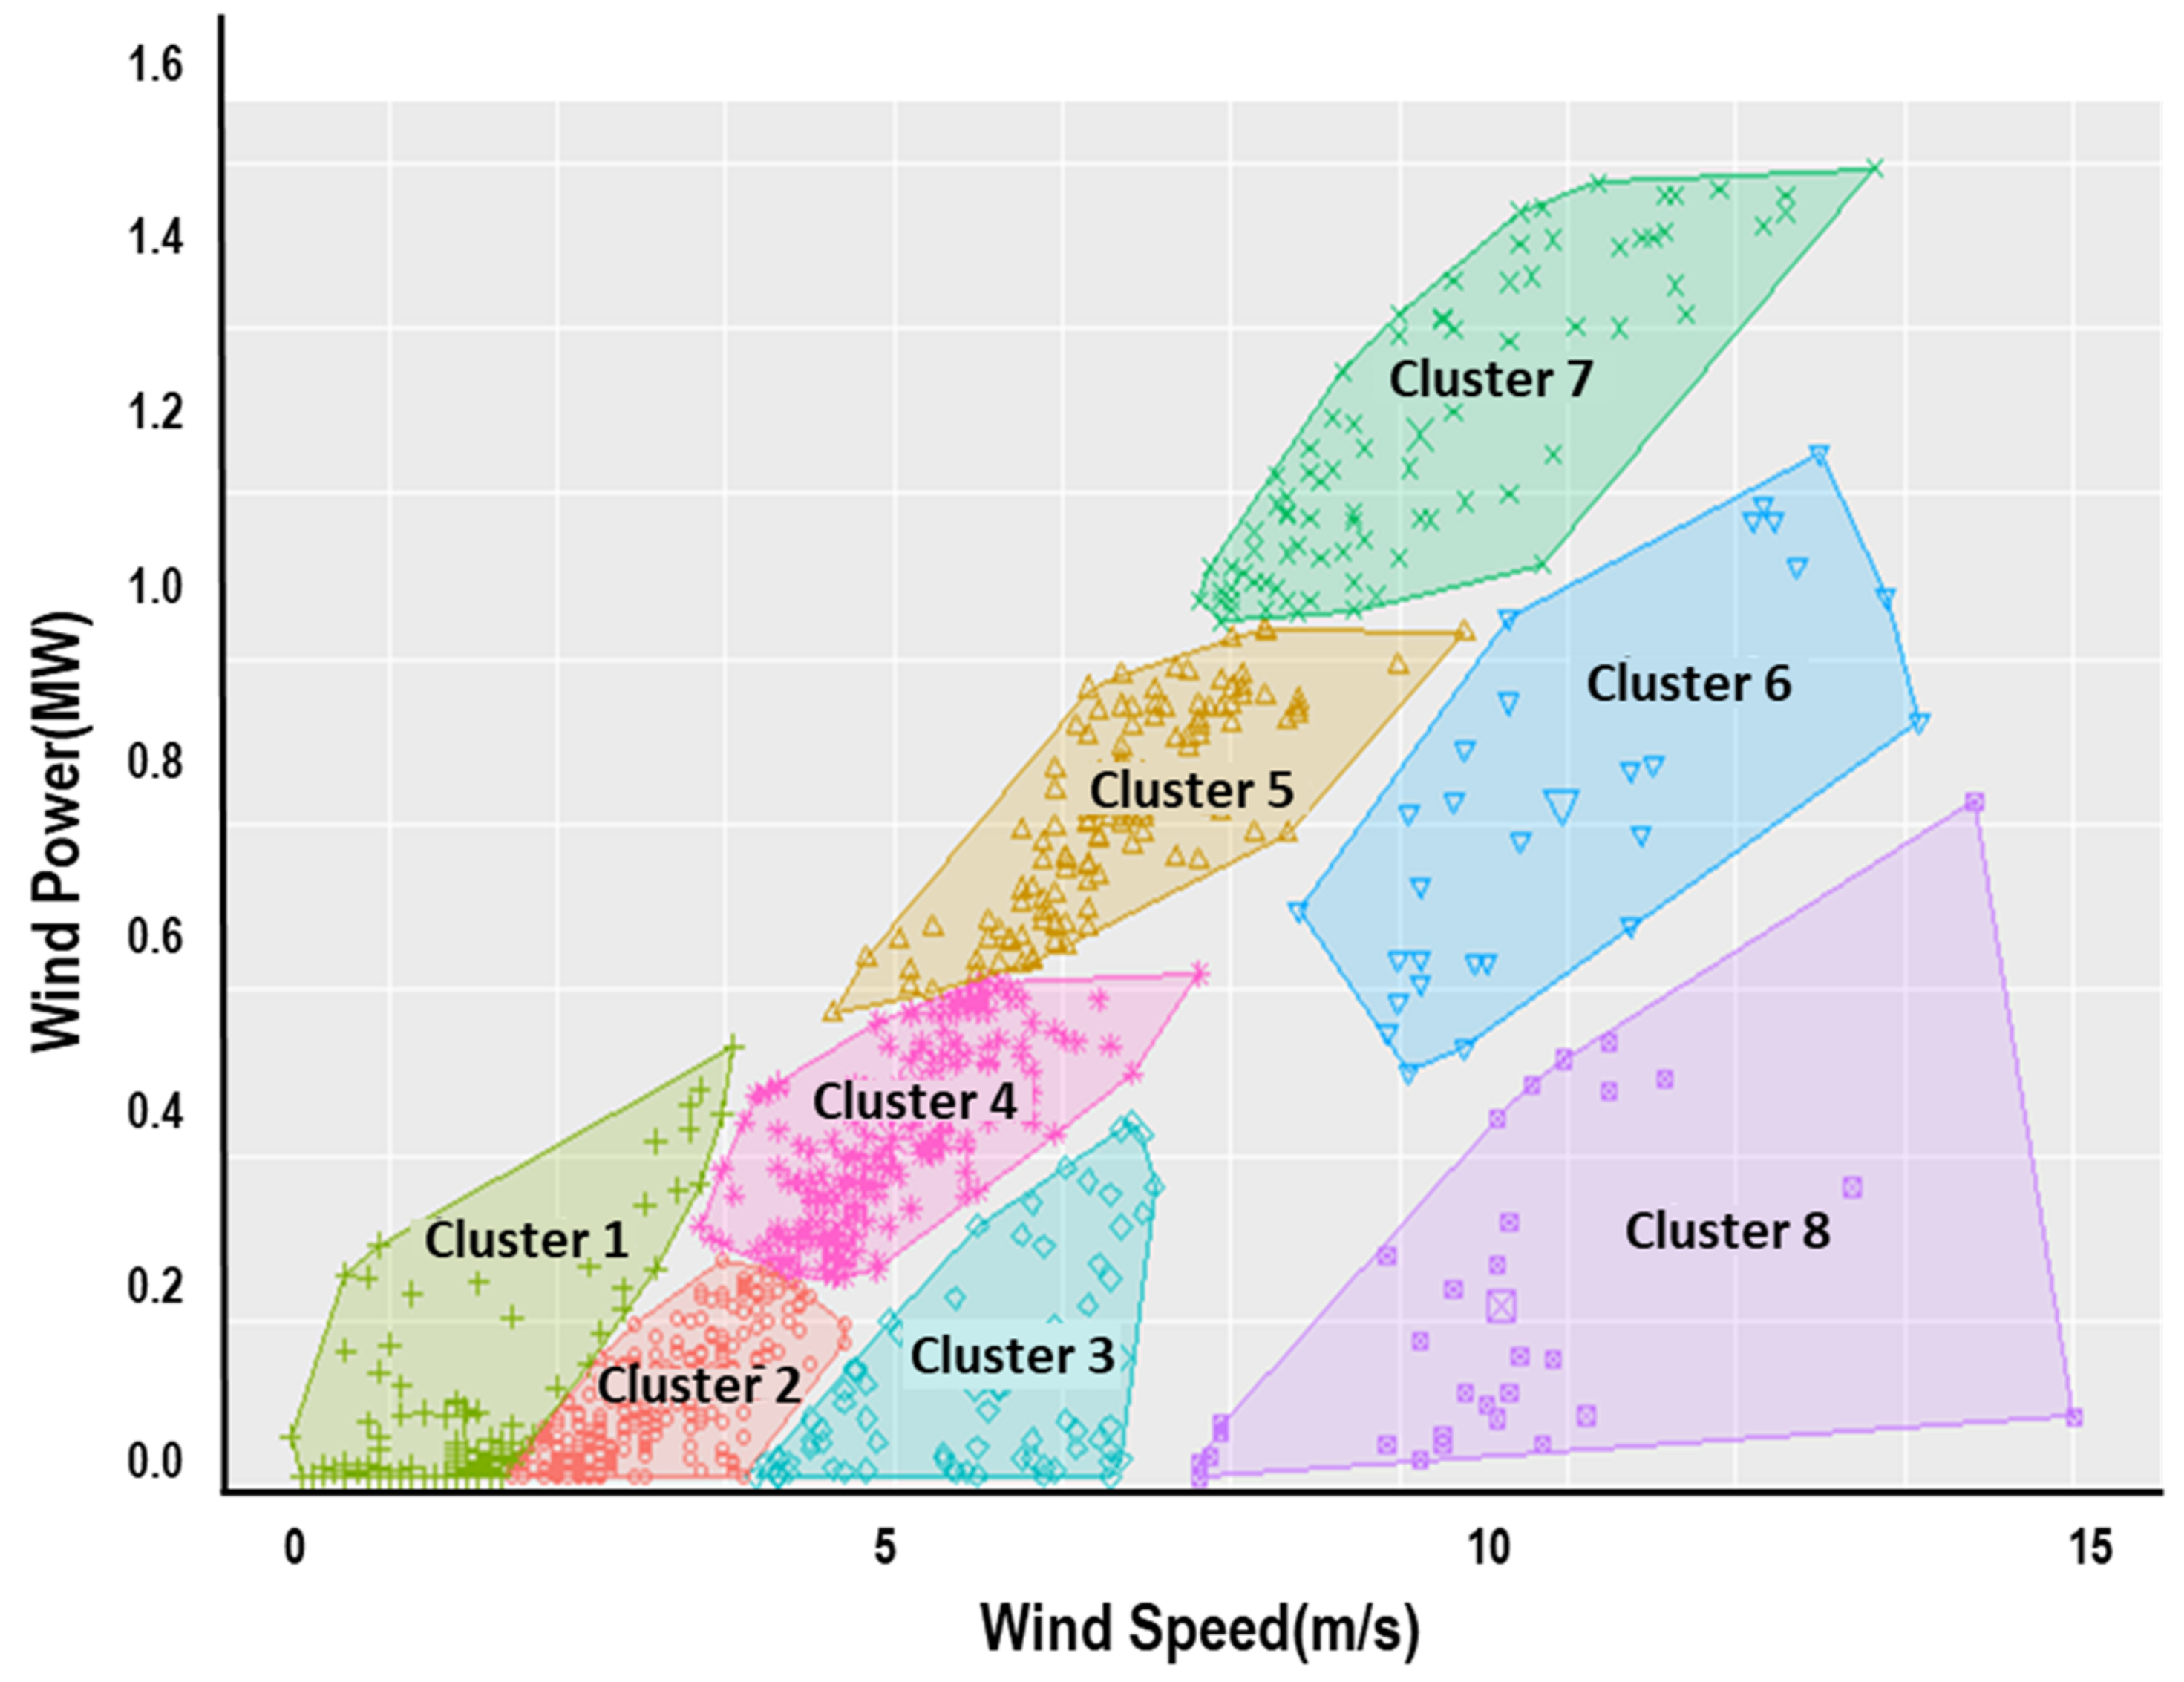
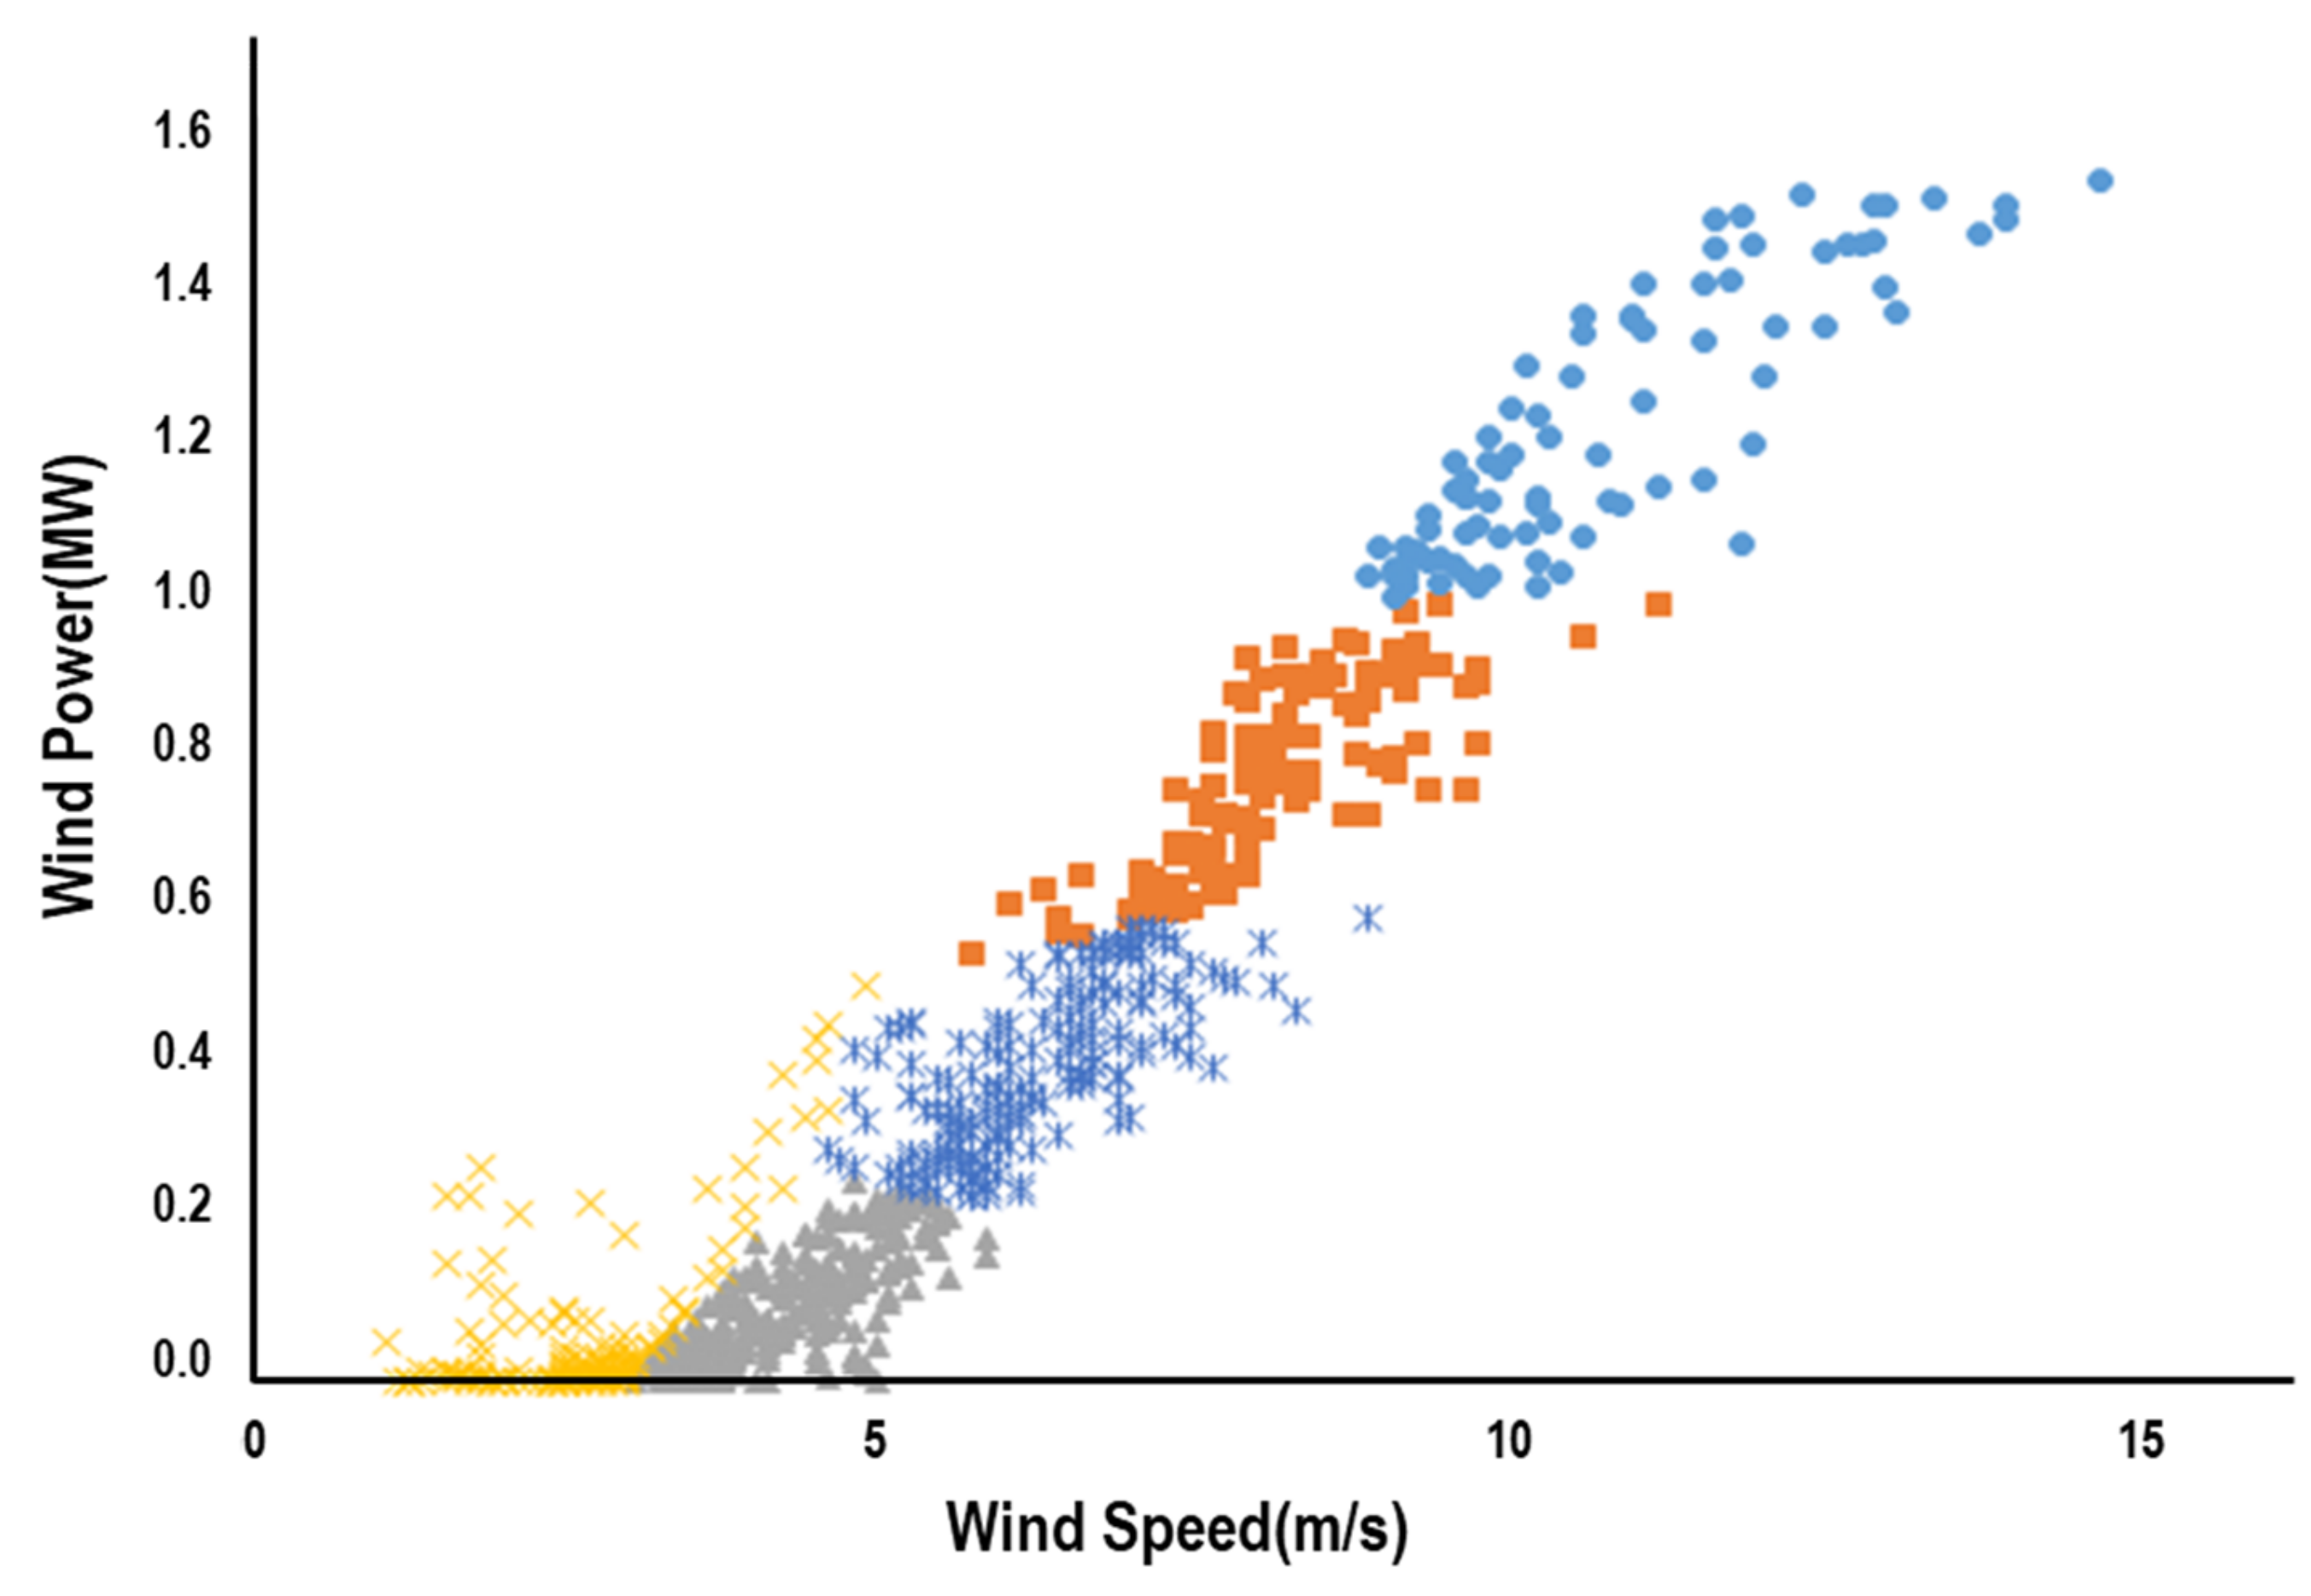
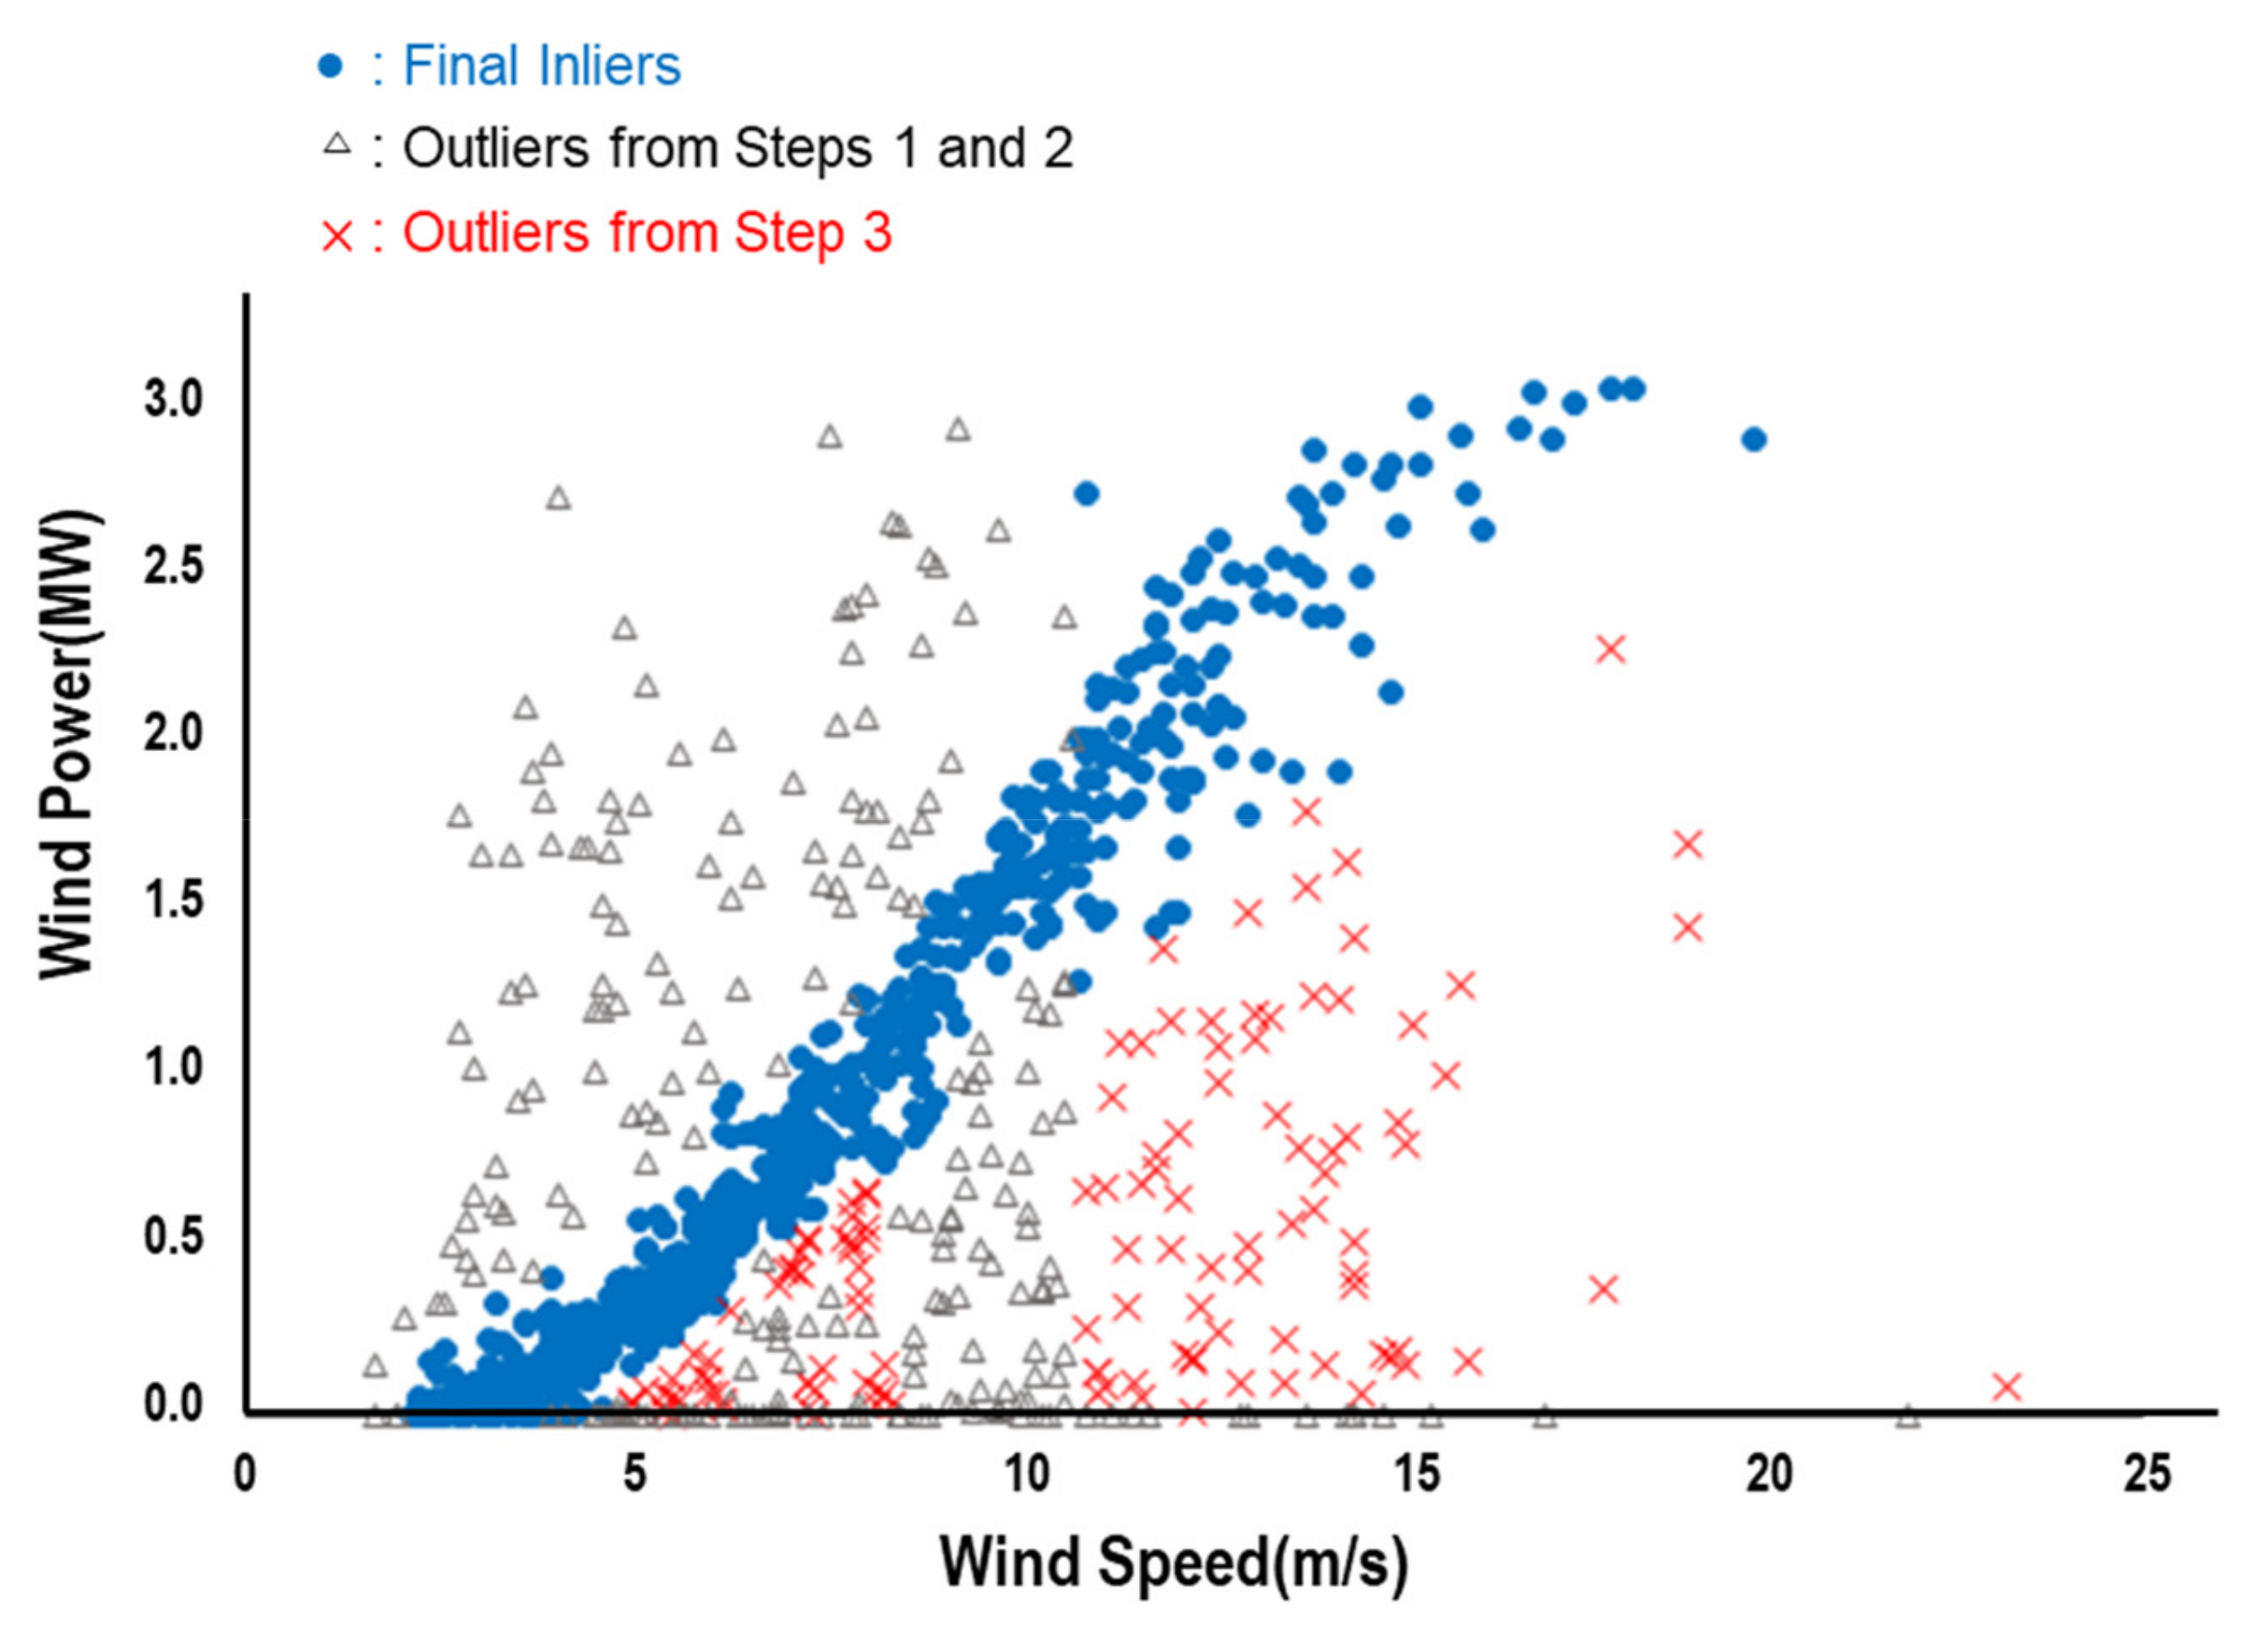
Figure 5 depicts the formation of clusters resulting from K-means clustering. It can be observed that clusters 3, 6, and 8 are corresponding to Type I and III outliers which may lead to a poor goodness-of-fit. The resultant data points from [Step 2] depicted in
Figure 6 are to be used for modeling power curve of the 1.5 MW wind turbine. The procedure is also applied to data from the 3.0 MW wind turbine in the site, of which result is depicted in
Figure 7.
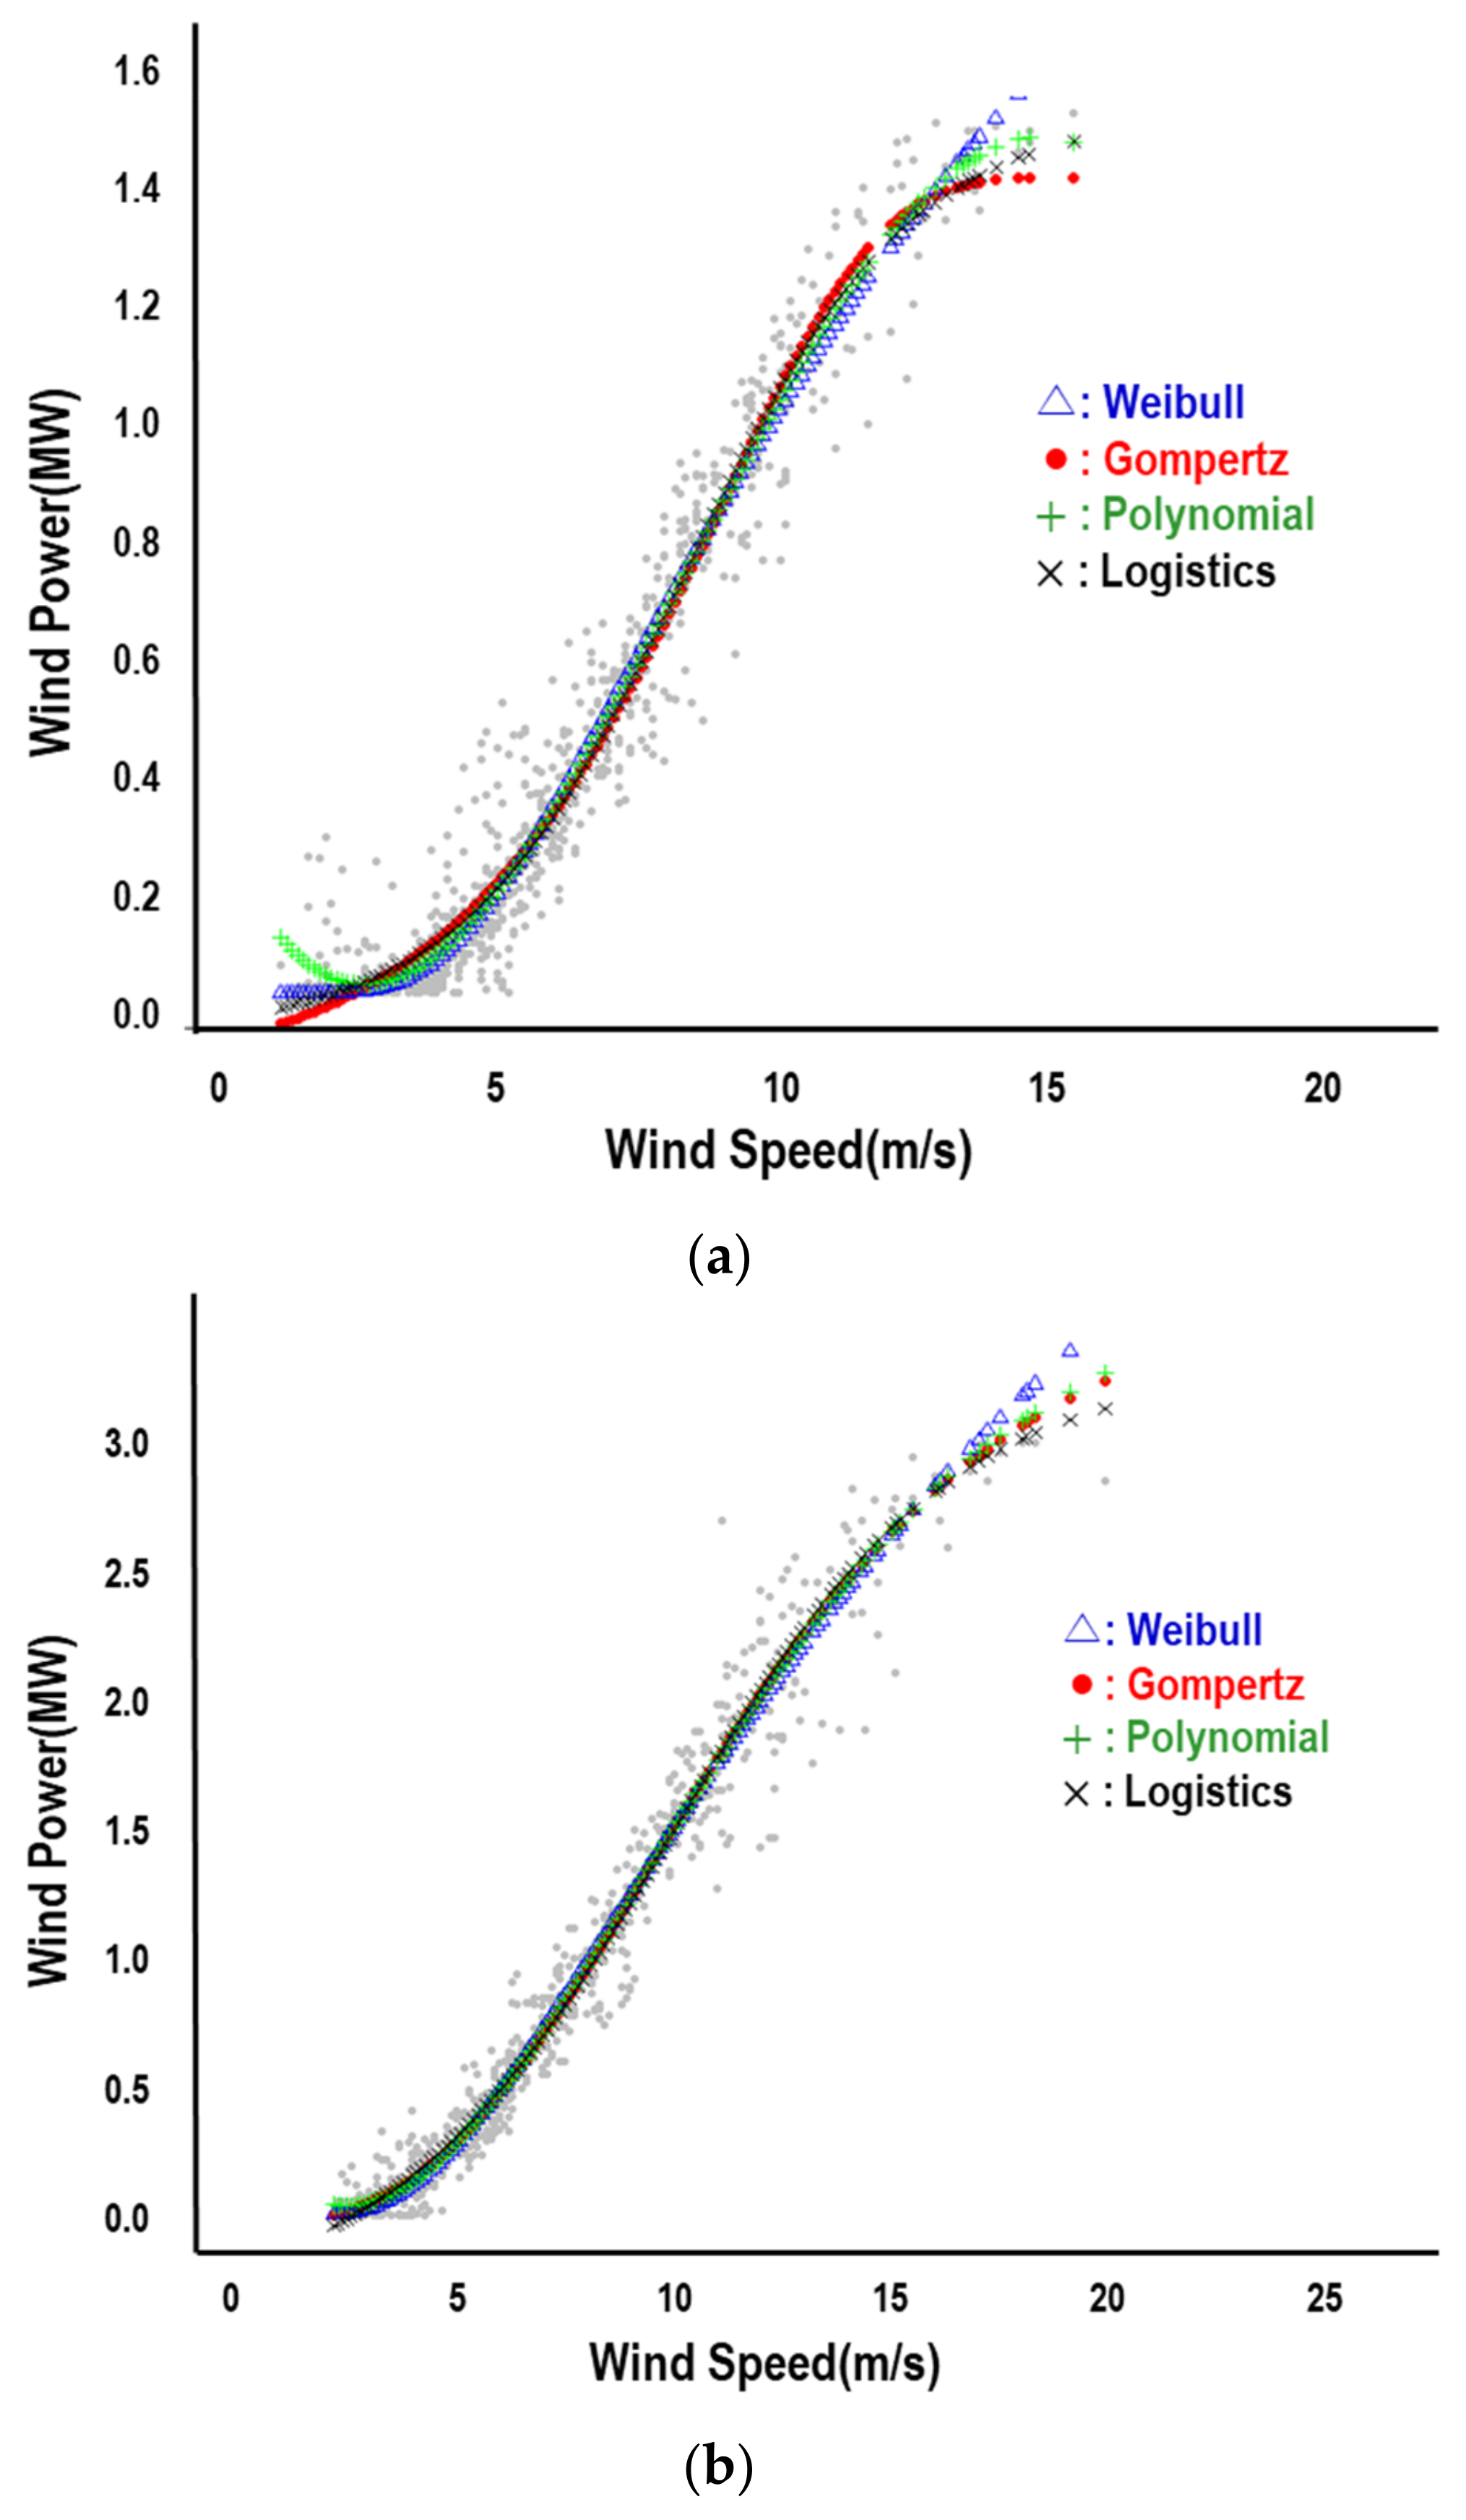
Several parametric models are frequently adopted to fit the power curve, and the goodness-of-fit of polynomial, Gompertz, logistics, and Weibull functions, are to be tested in [Step 3] with the performance metrics of RMSE, MAE, and
. The results of goodness-of-fit analysis are summarized in
Table 1 with 4 parameters for different parametric models to ensure the same degrees of freedom. It is indicated that the data from the 1.5 MW turbine are well fitted with the Weibull function by observing the absolute measure of
and the relative measure of MAE while the polynomial function fits the data better with respect to the measure of RMSE. On the other hand, the data for the 3.0 MW turbine are best fitted with Gompertz function regardless of measures.
Figure 8 depicts different parametric functions fitted with the refined data shown in
Figure 6 and
Figure 7.
5. Concluding Remarks
The power curve of wind turbines is the central element for an efficient plant operation and prediction of generation output. It is often the case that the specification power curve provided by the manufacturer may not well account for variations incurred by operational and environmental factors, which may not lead to an efficient operation of wind turbines since the actual power curve hardly coincide with the specification power curve. An accurate estimation of actual power curve may be hindered by manifest and influential outliers and it is necessary that the observed data are preprocessed to detect and eliminate those outliers for the effective estimation of power curves. This study proposes a novel outlier elimination procedure, which can be applied in situations where a sufficient amount of data with proper time resolution is not readily available. More specifically, the popular algorithms of density-based DBSCAN and partition-based K-means are simultaneously adopted. Different parametric models are then employed to fit the refined data and tested for their goodness-of-fit to derive the actual power curve. The applicability of proposed procedure is demonstrated with the hourly measurement data taken from the Hankyung wind farm site in the Republic of Korea over the years 2018~2020. The data from 1.5 MW turbine are well fitted with the Weibull function whereas those from 3.0 MW turbine are best fitted with Gompertz function. It is implied that different parametric models are more suitable for estimating power curves of different turbines. It is asserted that the proposed method is effective in estimating the power curve with data having low temporal resolution. As one of the reviewers pointed out, the measurement data used in this study may exhibit the lack of temporal resolutions. The acquisition of data with high enough resolutions is highly limited for individual wind turbines in many sites. To the best of authors’ knowledge, this study is the first attempt for power curve modeling with hourly measurement data available in the Republic of Korea. Nonetheless, a more precise derivation of power curve need to be enabled by securing data with high enough temporal resolutions. In addition, it will be meaningful to examine the nonparametric methods in modeling power curves, which has hardly been investigated in the current literature.


