1. Introduction
Diabetic retinopathy (DR) is a major cause of vision loss worldwide [
1]. Regular screening for DR can detect early features or symptoms. However, human experts in this domain still perform the diagnosis. Computer-aided disease diagnosis in retinal image analysis could provide a reasonable solution for the screening and diagnosis processes. Automated tools for clinical stage measurements of retinal problems can provide continuous and accurate monitoring of the disease. Advances in artificial intelligence and machine learning approaches enable such application for clinical practice [
2].
Recently, an important need has arisen for the automation of an accurate DR detection system, as providing an affordable, accurate system will overcome the problem of a lack of retina specialists around the word [
3]. The detection of different patterns in retinal images is a key factor in DR measurement. Retinal tissue in diabetic patients deforms in different ways, such as microaneurysms that appear as tiny red dots on images of early-stage DR. Microaneurysms usually grow into retinal hemorrhages in moderate DR cases, and in some cases yellow or white exudates can observed, while in severe cases, blood vessels leak into the retina, known as macular edema, causing blurry vision [
4].
Intelligent health care application has an important function in retinal image analysis and feature extraction, and provides a reasonable solution to control the growth of DR, especially if the detection occurs at the early stages; moreover, deep learning methods for DR grading have achieved significantly improved performance [
5]. However, accurate classification for DR grading remains challenging due to many reasons, such as the insufficiency of training samples and the poor quality of fundus images taken using different devices [
6]. The measurement of the DR severity stage is a difficult task due to the differences in the sizes of lesions among fundus images of the same class and visual similarities in detected features, such as shapes and colors between the fundus images of different classes [
7].
Hybrid artificial intelligence approaches face performance challenges in CNN models. Zhang et al. [
8] proposed a Hybrid Graph Convolutional Network (HGCN) for diabetic retinopathy grading with limited labeled data and a large amount of unlabeled data (semi-supervised learning), and the experimental results showed the better performance of HGCN in semi-supervised retinal image classification.
Considering all of these facts, the proposed work implemented a simple CNN for feature extraction and combined it with a rule-based expert system for better classification using the model used in [
9]; the model was trained using Kaggle public datasets [
10], and the rules changed based on the new domain of application. The grading of diabetic retinopathy was implemented without segmentation; furthermore, the framework gives similar performance for all classes. This study provides important contributions to this field by enhancing the accuracy and the performance based on a hybrid approach and a relatively small amount of data.
The goal of the proposed hybrid intelligent framework consisting of a conventional neural network and a fuzzy inference system to efficiently measure the stages of DR.
The framework has similar performance for all classes, overcoming the problem of different data sizes in each training class;
The framework does not need a segmentation phase;
The framework adds a rule-based system based on human experts’ knowledge to the deep learning model;
The evaluation and comparison with related models show that the framework outperforms the other models.
The rest of this paper is organized as follows:
Section 2 provides the background and previous works. In
Section 3, we present the research methodology in detail.
Section 4 shows the evaluation and experimental results. Finally, in
Section 5, we conclude our work and identify future work avenues.
2. Background and Previous Work
Diabetic retinopathy (DR) appears in people with a medical history of diabetes [
11] and high blood glucose levels. Many researchers have worked on DR symptom detection using feature recognition techniques [
12].
Other methods are based on recognizing the retinal blood vessels and pathologies from fundus images as features and classifying the diabetic retinopathy severity grades [
13]. Feature extraction and image analysis for DR classification show great potential for DR grading; however, they excessively depend on labelled data. These methods rely on pixel-level annotation data. This type of annotation is useful in techniques to locate lesions within an image and segment out regions of interest from the background [
14].
Image processing techniques using machine-learning methods suffer from the lack of domain experts for validation [
15]; in such cases, the dependency on data and statistical models without human experts’ validation is still questionable [
16].
Currently, deep learning and convolutional neural networks (CNNs) are frequently used in medical applications with computer vision, especially the automated detection of diabetic retinopathy [
17,
18]. Extracting important features, such as hard exudates, blood vessels, and texture [
19], using a transfer learning-based CNN architecture from fundus images performs relatively well.
CNN studies address the grading of non-proliferative DR categories, namely mild, moderate, and severe stages, using a transfer learning-based DR detection system [
20], but performance issues face most of the deep learning methods due to the small number of DR fundus images used to train a deep CNN model; hence, overfitting problems appear [
21,
22,
23,
24].
Convolutional neural networks (CNNs) are a powerful tool for DR detection, which includes different tasks: classification [
25], segmentation [
26], and detection [
27].
Researchers [
28] have coupled CNNs with transfer learning and hyper-parameter tuning, adopted AlexNet, VggNet, GoogleNet, and ResNet, and analyzed how well these models handle DR image classification, using Kaggle datasets to train these models. The best classification accuracy is 95.68% using transfer learning with data augmentation, where the fundus images data were increased to 20 times the original.
The authors of [
29] (Resnet50, Inceptionv3, Xception, Dense121, Dense169) enhanced the classification of different stages of DR. The experimental results show that the proposed model detects all of the stages of DR. The achieved accuracy is 80.8%.
Many hybrid methods based on CNN and other intelligent methods have been proposed, such as the Swarm Optimization (PSO) algorithm-based Convolutional Neural Network (CNN) Model, also called the PSO-CNN model [
30], to detect DR from color fundus images. Many proposed hybrid CNN models used preprocessing, feature extraction, and classification [
31].
Orujov et al. [
32] used feature extraction for blood vessels in retinal fundus images using a contour detection algorithm based on fuzzy rules. Fuzzy rules were applied to image gradient values to extract edges and make DR classification decisions based on membership functions. The results of this model offered a similar performance to CNN methods, but it contains flexible rules, offering an alternative to current deep learning applications, severity classification of DR using CNN and attention module proposed in [
33], which reduced both the complexity of the model and the training time needed.
This research work proposed a method for fine-tuning a pre-trained CNN model for DR grading using fuzzy rules and fundus images. The method takes a retinal fundus image as the input, the CNN model processes it with the fine-tuned model and grades it into normal or DR levels and then the fuzzy system takes the processed images and classifies them based on human experts’ rules into four categories (normal, mild, moderate and severe) with the grading percentage.
An intelligent computer-aided diagnosis framework for the DR grading of retinal fundus images is implemented, and the framework does not need any segmentation process for the retinal fundus images.
The proposed framework has two parts. The first part embeds the DR lesion structures in a pre-trained CNN model. The second part uses the extracted features of retinal fundus images in a fuzzy inference system (FIS), which significantly reduces the model complexity and data dependency and measures the severity percentage, so multiple uses of the system can provide the progression rate in this case.
Table 1 summarizes the related works’ techniques, findings, and limitations compared to the proposed framework.
3. (DRSM-CNNFIS) Framework
This section presents the steps of the Diabetic Retinopathy Stage Measurement using the Conventional Neural Network and Fuzzy inference system (DRSM-CNNFIS) framework and the dataset used in training and testing.
3.1. Dataset Description
Different retinal image types and qualities are available for developing and testing digital screening for diabetic retinopathy. The public dataset used in this work was Kaggle Diabetic Retinopathy Detection [
10], which is sponsored by the California Healthcare Foundation.
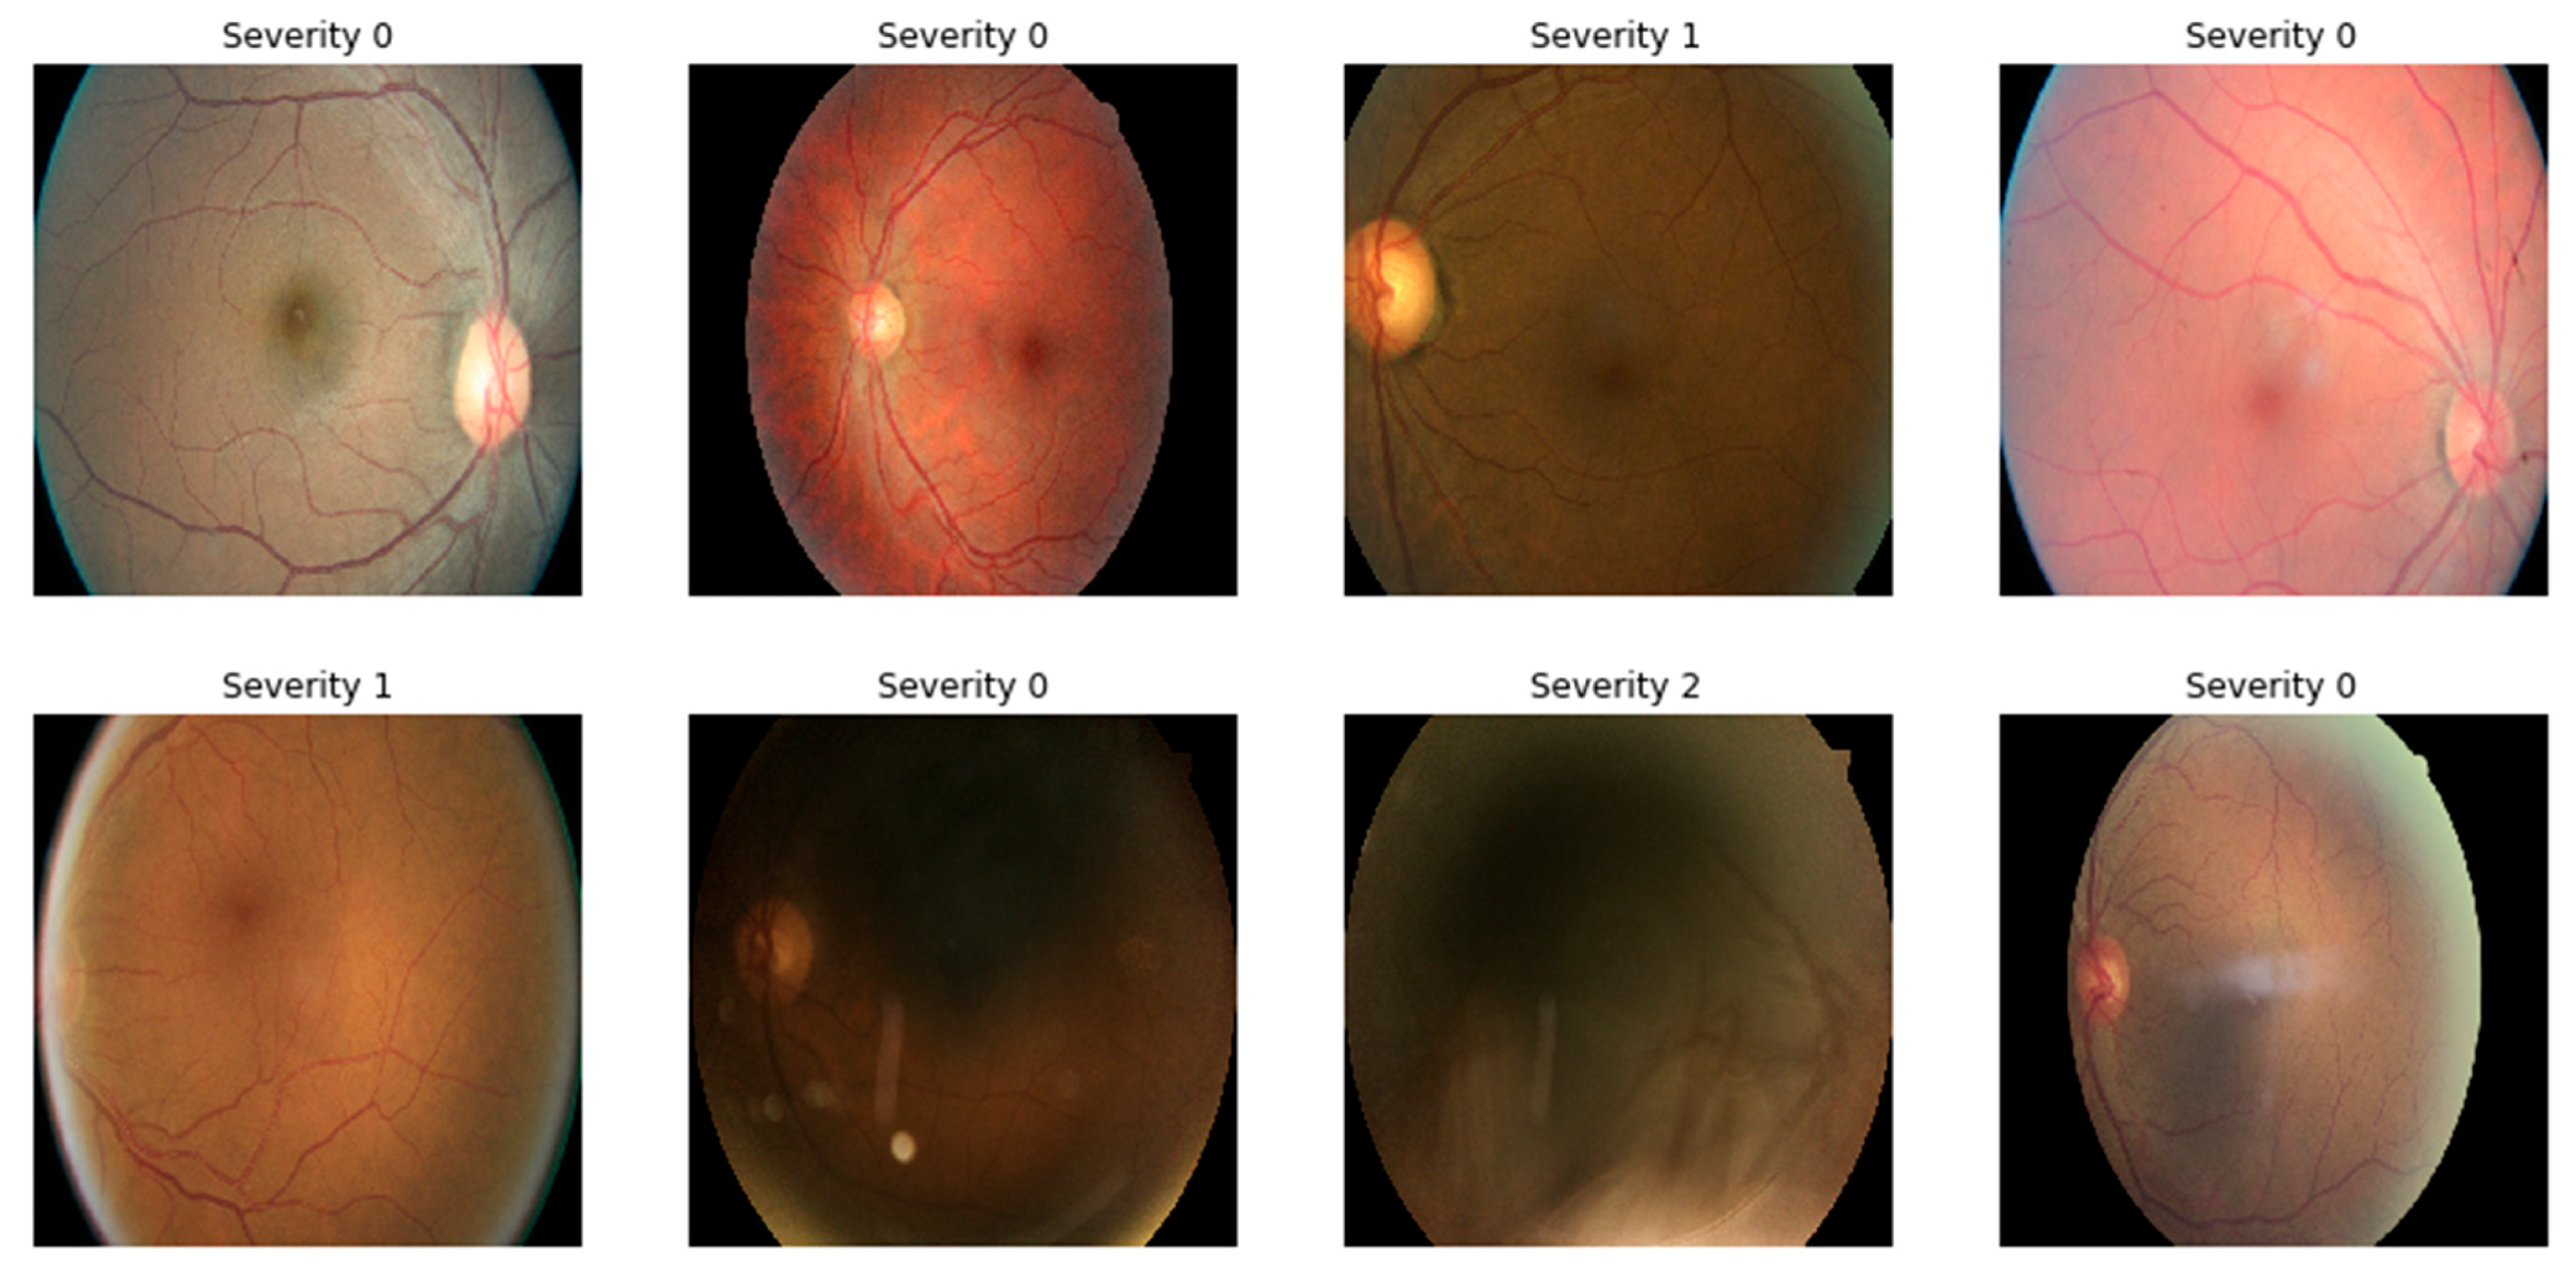
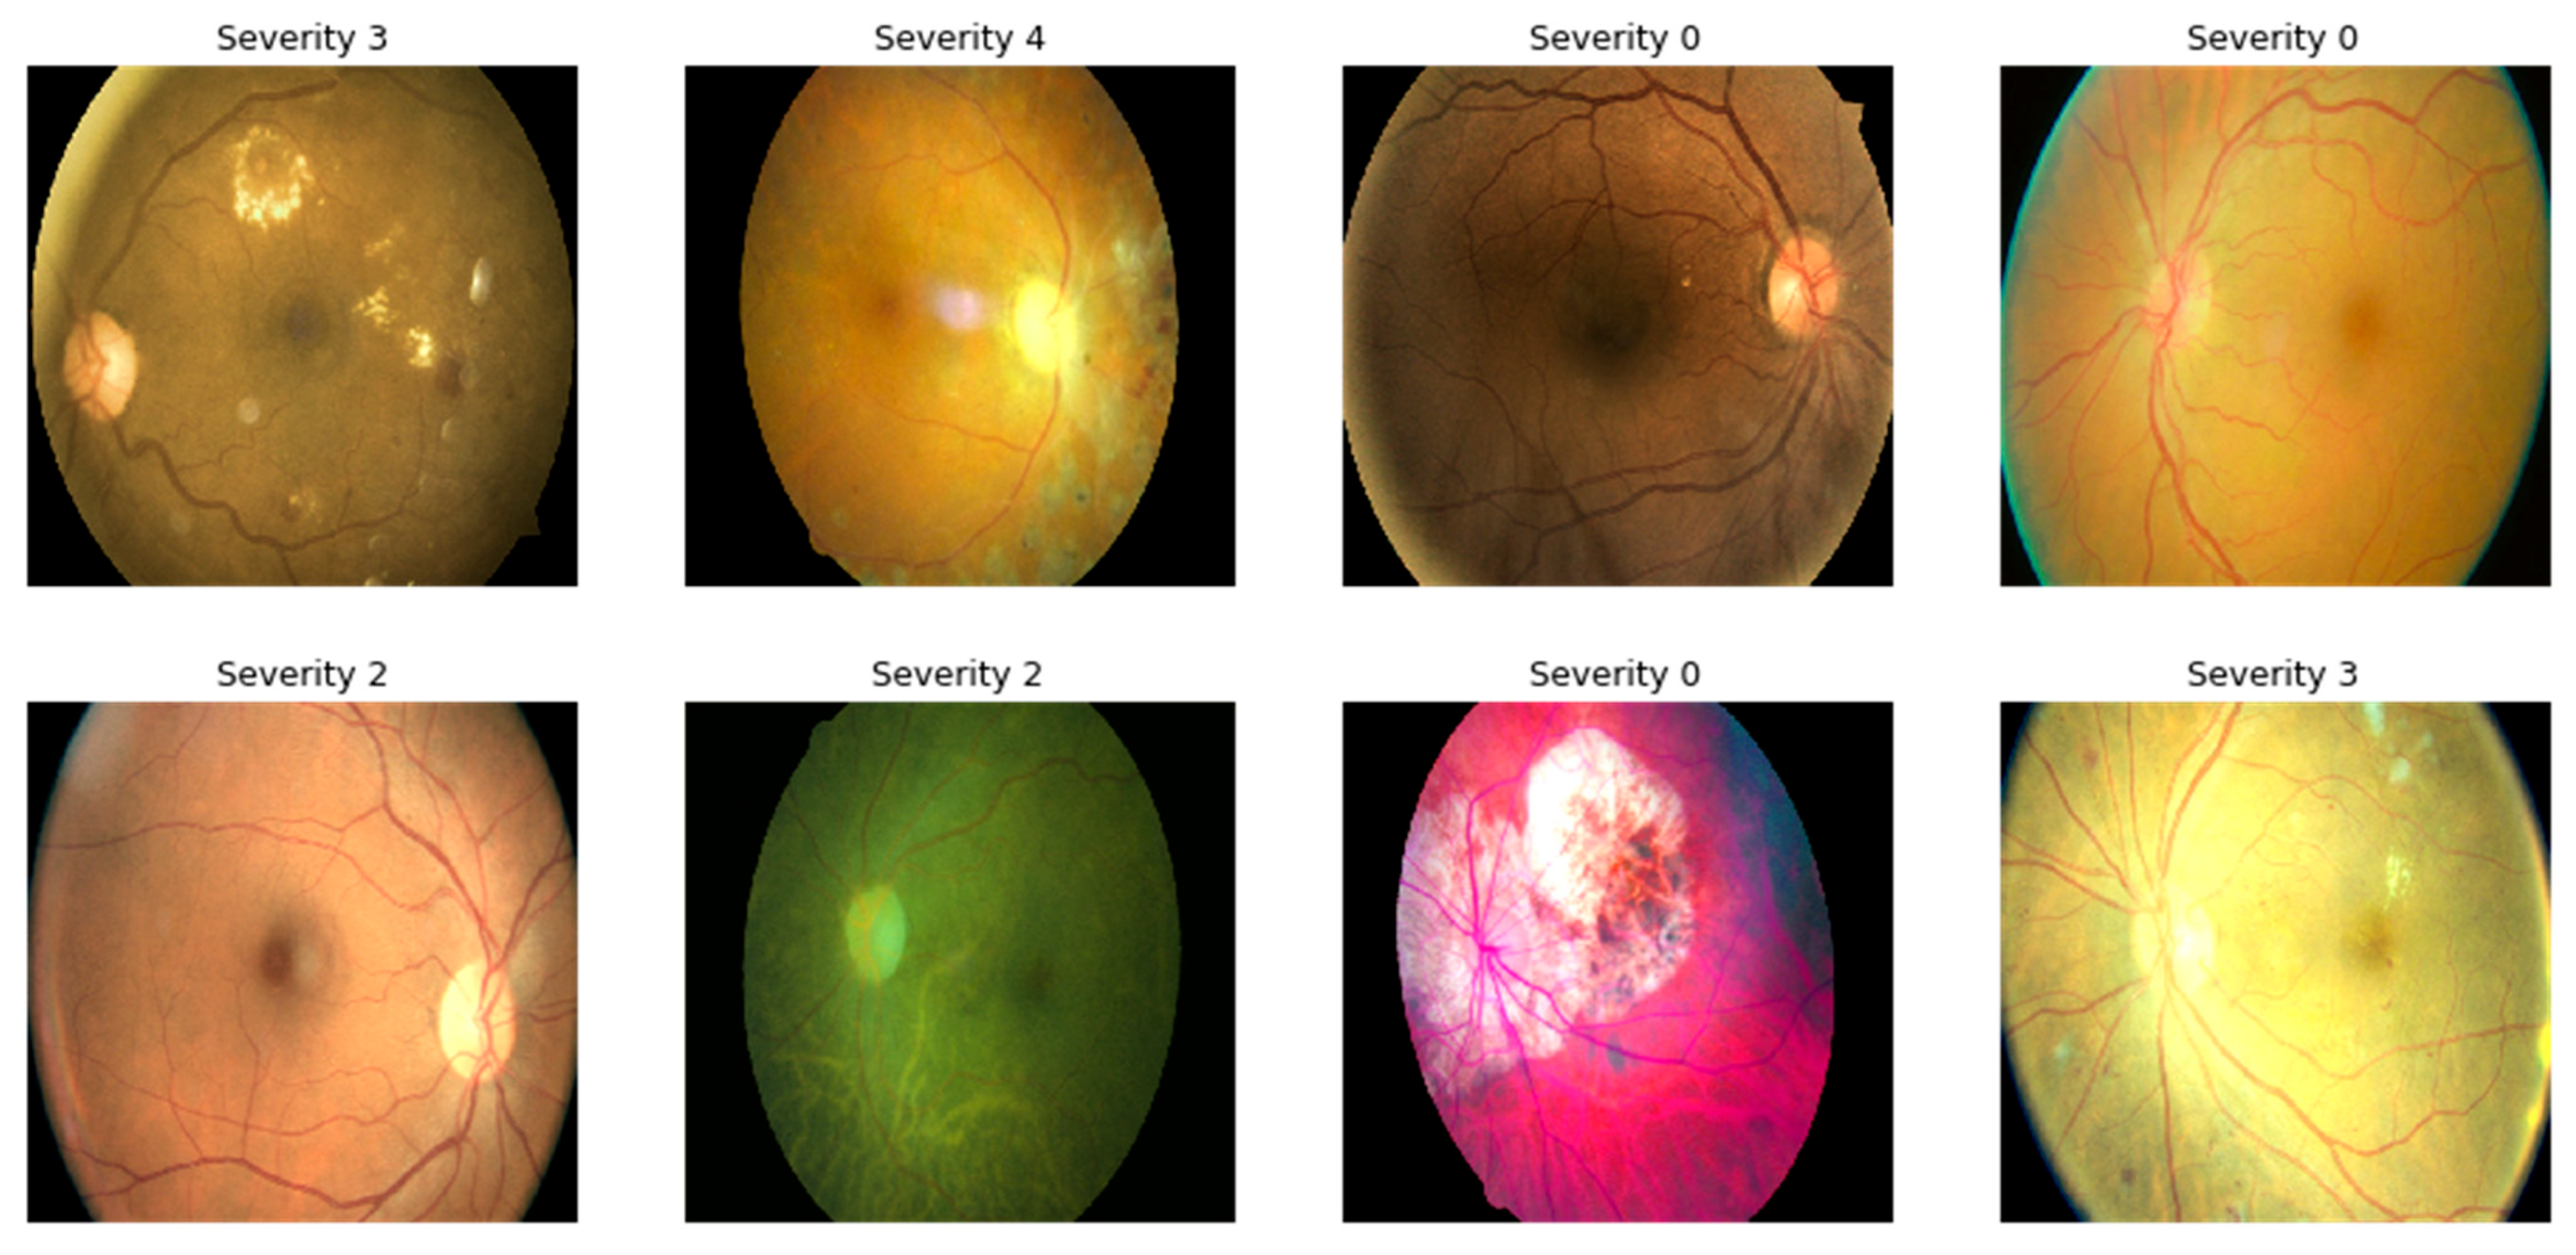
The Kaggle DR Dataset has 35,126 fundus images for training. Different devices collected the images. Kaggle DR is one of the largest publicly available DR classification datasets; most of the labelling was performed manually and the quality of the images is not homogenous.
These images were labeled using a scale of 0 to 4 based on the severity of diabetic retinopathy (DR).
Table 2 shows the five classes of DR as well as their respective percentage from the total data. According to the international clinical diabetic retinopathy scale [
35], binary classification, images with labels of 0 and 1 were classified as “No PDR”, and relabeled with 0, and images with labels of 2, 3, and 4 were classified as “RDR” and relabeled with 1, as shown in
Table 3. The distribution of labels was: {0:25,810, 1:2443, 2:5292, 4:708, 3:873}. Total images: 35,126.
Table 2 provides the five grades of the dataset with their percentage, and
Table 3 provides the distribution of the binary classification in the training set of the Kaggle dataset.
Figure 1 shows sample gradable images from Kaggle DR.
In this research, the class imbalance issue was addressed using two methods—first, data augmentation, as explained in
Section 3.2, and human experts’ rules for the results, as explained in
Section 3.3.
3.2. Image Pre-Processing and Data Augmentation
For preprocessing, first, median filters were used for noise removal and contrast improvement. In addition, images were resized to a standard size of 256 × 256, followed by cropping, random rotation, and flipping. Finally, normalization using the mean was applied to all images.
Random rotation for all the images in all the directions was used for data augmentation. The representation of images after applying various color augmentation operations is displayed in
Figure 2. The details of augmentation operations after applying them to the training dataset are given in
Table 4. The augmented dataset was 3.6 times larger than the original dataset, and most importantly all DR grades were balanced.
3.3. The Framework Design
Combining rules with feature extraction results from convolutional neural network showed high accuracy in [
9]. The combined model was reused in this framework by changing the training data and improving and changing the fuzzy rules following the application domain, which was diabetic retinopathy stage identification. Convolutional layers and pooling layers extracted the most relevant features that were used by rules in the next step; the addition of rules provided a robust stage for identification because it was medical expert-driven and it was domain-specific. Meanwhile, it reduced the training time and provided high accuracy based on the experts’ rules.
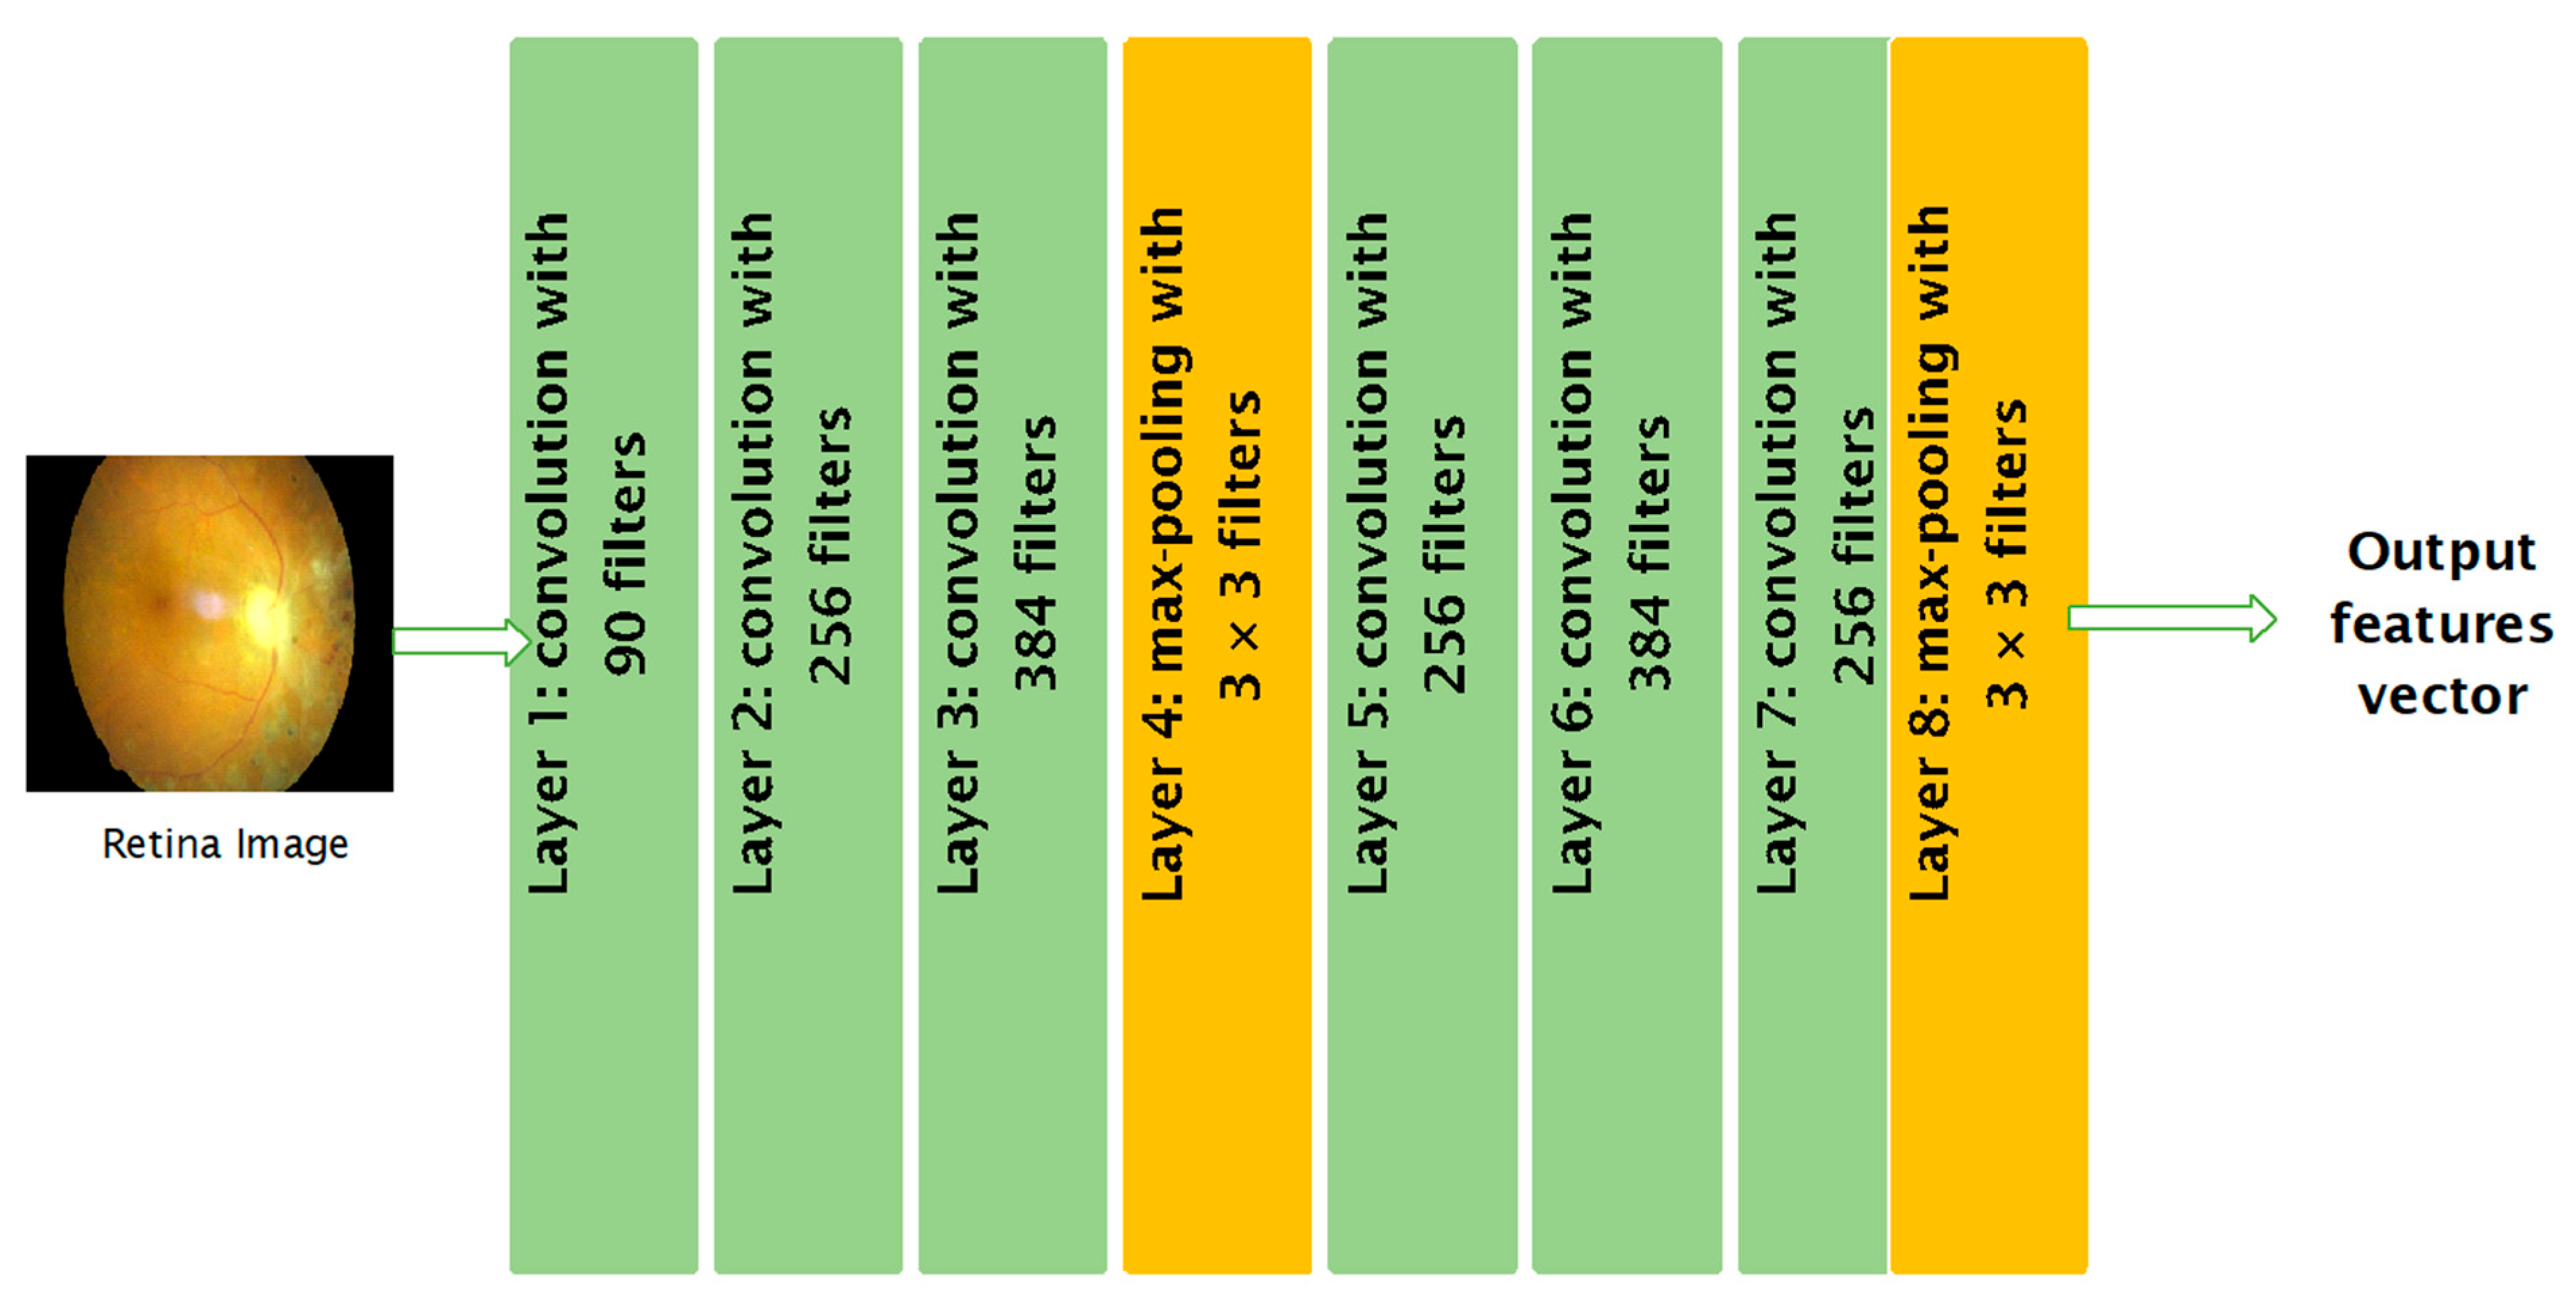
Figure 3 shows the first part the framework (DRSM-CNNFIS), which is the feature extraction part, with the relevant features obtained by multiple convolutional layers (Layers 1, 2, 3, 5, 6, and 7), and two max pooling layers added (Layers 4 and 8) for dimensionality reduction. The filter size and number were changed and optimized experimentally.
The output vector provided the extracted features of the system, which were numeric values used in the diabetic retinopathy stage measurement part, with the fuzzy inference system (FIS) using the constructed rules based on medical experts that explain the direct relation between the extracted vector and the severity stage. The rules were built based on human expert knowledge. The key inputs for the fuzzy inference were features such as microaneurysms, intraretinal hemorrhage, exudates, and macular edema [
25]. Linear membership functions were used for the output features: vector mean, standard deviation, max, and min.
Figure 4 shows the second part the framework (DRSM-CNNFIS), which builds the rule-based fuzzy inference system starting with the linear membership functions for the inputs, and manually added rules based on expert knowledge until the final diabetic retinopathy stage grading.
3.4. DRSM-CNNFIS Implementation
Multiple rounds of convolution and pooling layers were used to provide single-vector output that was used by experts to extract rules associated with each class of diabetic retinopathy (normal, mild, moderate, severe, and proliferative diabetic retinopathy). In the training of CNN with Stochastic, the gradient descent with momentum (SGDM) learning rate was set to 0.1, and an early stop mechanism was used. Tuning for the linear membership function used for the FIS was based on the labeled data. The implementation used Keras and the number of epochs was set to 400. The key inputs for the fuzzy inference were features that could be measured by experts, such as:
Microaneurysms, which are red patterns that increase the mean value of the output numeric vector;
Intraretinal hemorrhages, which are outlined patterns starting as dot shape that then defuse into a flame shape and increase the maximum value of the output vector;
Exudates, which have a yellow or white thick texture and affect the range of the standard deviation of the output vector;
Macular edema, which occurs when blood leaks into scattered parts of the retina, affecting the minimum value of the extracted features vector.
Four trapezoidal membership functions were used for the output features: the vector mean, standard deviation, max, min, and feature map max.
Table 5 presents the description for the linguistics terms used in the membership function for all variables.
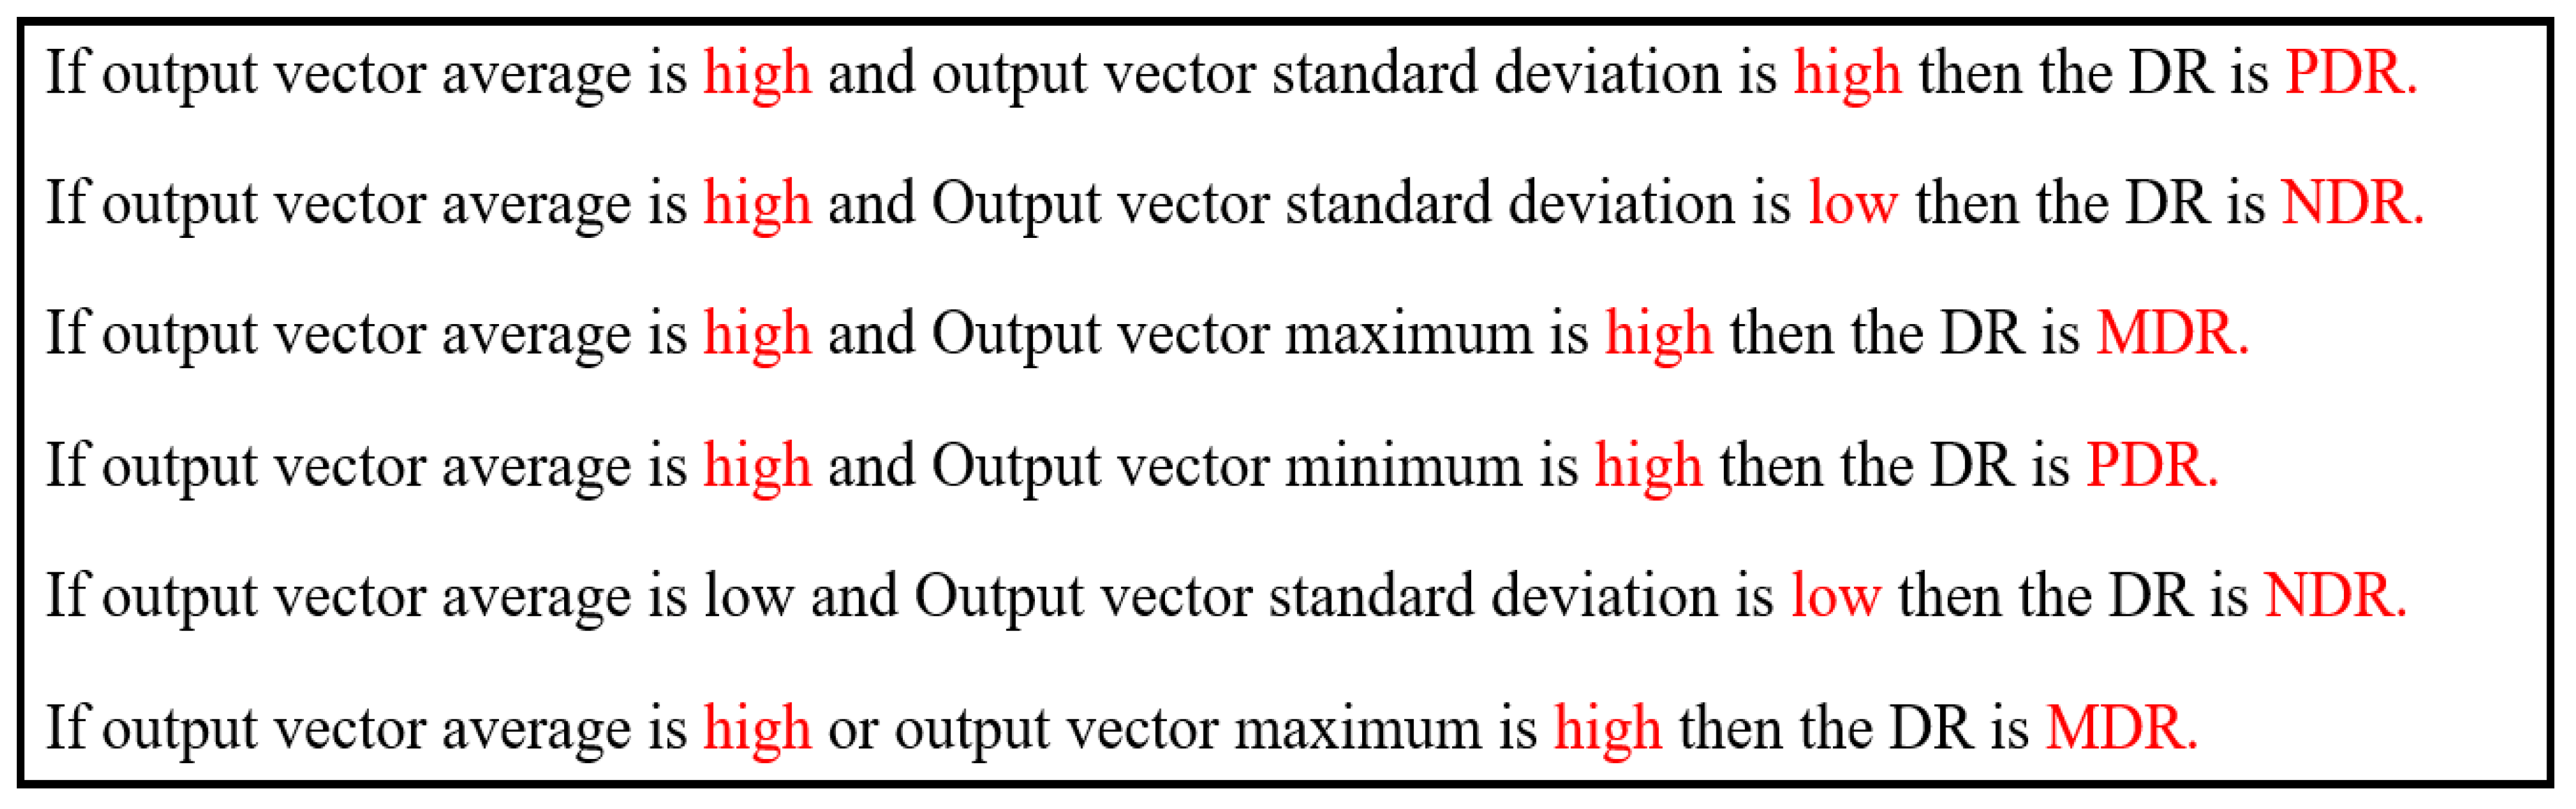
To accomplish the stage identification task, medical experts provided rules based on the output feature vector and the associated labels. The medical experts’ decisions were based mainly on features, such as microaneurysms, hemorrhages, exudates, and macular edema [
35]. Some of the rules used in the fuzzy system are shown in
Figure 5.
The aggregation method used for the rules evaluation is Mamdani inference [
9].
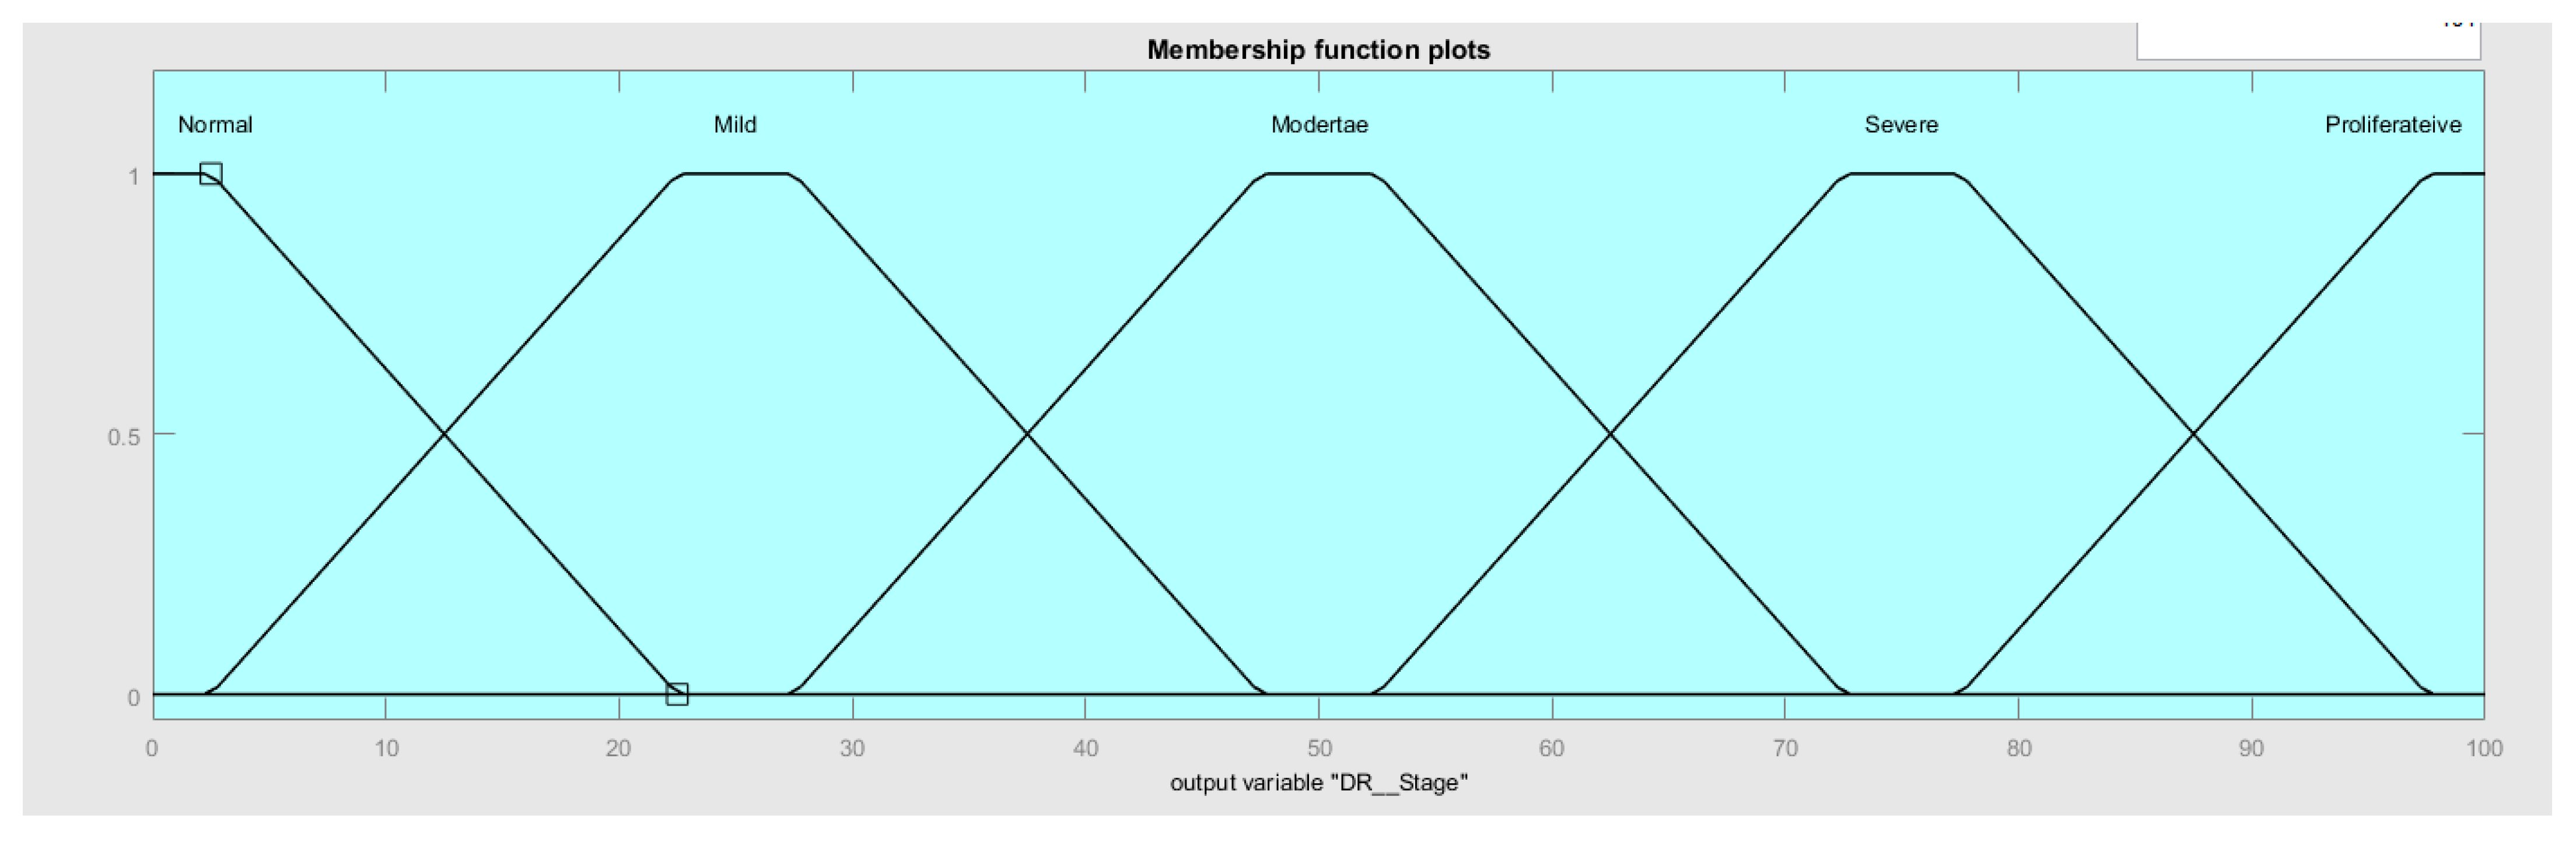
Figure 6 shows the membership function for all the linguistic values for the fuzzy output variable: diabetic retinopathy (DR) stage, starting with normal DR (NDR), followed by mild DR (MDR), moderate (MoDR), and severe DR (SDR), and ending with proliferative DR (PDR).
After evaluating the rules, the output showed as stage percentage. In this phase, human adjustment of the membership function interval was calculated several times to improve the classification accuracy.
4. Experimental Results
The experiments were implemented on two Nvidia Quadro RTX 8000 GPUs in an Ubuntu environment. Fold validation was implemented to obtain more robust results, and due to the size of the dataset, we used five-fold cross-validation to train on 80% of the dataset and tested using 20% of the original dataset during each trial. Early stopping callback was used to minimize validation loss.
Models were evaluated using accuracy precision recall and F1 score; the equations used were applied for the performance assessment mentioned in [
36,
37,
38].
Table 6 shows that DRSM-CNNFIS outperforms the CNN-only models—DenseNet-201, Inception-ResNet-V2, Inception-V3, ResNet-50, Xception, Majority Vote Ensemble, and Average Ensemble—with an accuracy of 0.9281. The model was evaluated on the macro average, the weighted average for precision, recall, and F1-score to obtain the performance of the model using the single-label classification method of the study. The macro average and the weighted average for precision, recall, and F1-score were evaluated for five classes. Macro averages of 0.7142, 0.7753, and 0.7301, and weighted averages of 0.9371, 0.9281, and 0.9296 were recorded for precision, recall, and F1-score, respectively.
Table 7,
Table 8,
Table 9,
Table 10,
Table 11,
Table 12 and
Table 13 illustrates the performance of the five models and the ensemble methods in the class-specific classification in terms of precision, recall, and F1 score. Our framework (DRSM-CNNFIS) shows robust behavior in detecting classes (0, 1, 2, 3, and 4), as shown in
Table 14, compared with the distorted behavior for other models that have different performances in each class (0, 1, 2, 3, and 4).
5. Conclusions and Future Work
In this hybrid framework (DRSM-CNNFIS), the diabetic retinopathy stage identification process provided robust performance in all classes (normal DR (NDR), mild DR (MDR), moderate (MoDR), severe DR (SDR), and proliferative DR (PDR)), with an overall accuracy of 93%. Membership functions were constructed and tuned based on labelled data [
14] that increased only by 3.6-fold compared to the original data. In the first step, the convolutional neural network was used to obtain the output vector of image features. In the next step, a fuzzy rule-based system was implemented based on human expert knowledge to measure the stage of DR. The final framework showed better performance compared with existing CNN models and ensemble models mentioned in the related work: DenseNet-201, Inception-ResNet-V2, Inception-V3, ResNet-50, Xception, Majority Vote Ensemble, and Average Ensemble. The proposed system showed better results and robust performance for multiclass classification with a weighted average of 0.9371, 0.9281, and 0.9296 for precision, recall, and D1-score, respectively, using the five-fold cross-validation method. In the future, automated method for rule extraction in the fuzzy rule-based system based on the training data will be implemented.
Implementing the proposed model in clinical practice at hospitals and ophthalmology offices will enable regular automated diagnostic measurement, which will save time and cost, and increase the chance of early stage diagnosis, as the results of the proposed model provide stable accuracy for all classes. Furthermore, dealing with noisy or low-quality data can open the door for the future of using mobile phone cameras for such applications.
The proposed model overcomes data dependency problems for deep learning models by using human expert (ophthalmology consultant) knowledge, but the limitation of this work can be seen in different aspects, such as the variation of the performance using different devices and the ethical aspects of health application automation.


