Article

Detection and Identification of Expansion Joint Gap of Road Bridges by Machine Learning Using Line-Scan Camera Images

1
School of Civil, Environmental and Architectural Engineering, Korea University, 145 Anam-ro, Seongbukgu, Seoul 02841, Korea
2
R&D Division, Korea Expressway Corporation, Hwaseong 18489, Korea
3
AI Research Division, CNSI, Seoul 05262, Korea
*
Author to whom correspondence should be addressed.
Appl. Syst. Innov. 2021, 4(4), 94; https://doi.org/10.3390/asi4040094
Submission received: 18 October 2021 / Revised: 16 November 2021 / Accepted: 16 November 2021 / Published: 18 November 2021
(This article belongs to the Collection Feature Paper Collection on Civil Engineering and Architecture)

Abstract

:
Recently, the lack of expansion joint gaps on highway bridges in Korea has been increasing. In particular, with the increase in the number of days during the summer heatwave, the narrowing of the expansion joint gap causes symptoms such as expansion joint damage and pavement blow-up, which threaten traffic safety and structural safety. Therefore, in this study, we developed a machine vision (M/V)-technique-based inspection system that can monitor the expansion joint gap through image analysis while driving at high speed (100 km/h), replacing the current manual method that uses an inspector to inspect the expansion joint gap. To fix the error factors of image analysis that happened during the trial application, a machine learning method was used to improve the accuracy of measuring the gap between the expansion joint device. As a result, the expansion gap identification accuracy was improved by 27.5%, from 67.5% to 95.0%, and the use of the system reduces the survey time by more than 95%, from an average of approximately 1 h/bridge (existing manual inspection method) to approximately 3 min/bridge. We assume, in the future, maintenance practitioners can contribute to preventive maintenance that prepares countermeasures before problems occur.

1. Introduction

The Korea Expressway Corporation is an institution that builds and maintains expressways in Korea, and the number of highway bridges in use reached about 9800 as of 2020. Recently, the number of narrow expansion joint gap occurrences has been increasing. It increased the most in 2018, when the number of days of summer heat waves was the greatest (see Figure 1, Table 1). If such a lack of expansion joint gap occurs, it may adversely affect the structural behavior of the bridge and can be a major threat to traffic safety [1]. Considering the characteristics of the climate of Korea, which has four distinct seasons, we can see that the importance of maintenance and the role of the bridge expansion joint responding to temperature changes between the cold and hot seasons is growing very high.
The causes of narrow expansion joint gap occurrences vary. Representatively, there are construction errors, inappropriate pre-setting, deformation of backfill, and alkaline silica reaction; recently, abnormal high temperatures have also emerged as one of the causes. The year 2018 had the highest number of heatwave days since 2013, and accordingly, the number of cases of lacking bridge expansion joint gaps and pavement blow-up damage rapidly increased. The Korea Expressway Corporation conducted a complete survey of bridges under its management and found that narrow expansion joint gap occurred in 276 bridges (2.96% of the total of 9334 bridges). Table 2 presents the main causes of the occurrence of narrow expansion joint gaps as analyzed through onsite investigations [2].
Most importantly, after bridge expansion joint damages occur, a huge budget is required for maintenance, and restoration is virtually impossible unless the bridge is remodeled. Experience shows that the life-cycle costs of a bridge expansion joint, over the life of the bridge, are many times greater than the initial costs of supply and installation, especially when consequential impacts such as traffic disruption during replacement works are considered [3].
Therefore, to solve these problems, the overall design/materials/construction/maintenance should be re-examined to supplement the relevant standards, but this has the problem of consuming a large amount of budget and time. Gaining a full understanding of the demands on the bridge’s expansion joints, and how well they are performing, can enable adjustments and maintenance measures to be tailored to maximize the length of the service life with a minimum of maintenance effort [4,5,6,7].
In this study, to detect problems and minimize the damage that may occur in the bridge expansion joint at an early stage, an optimal inspection method was developed by converting a vast number of bridge expansion joint gap maintenance inspection methods from existing manual inspections to automated inspections. To this end, it was decided to incorporate an M/V technique to switch from the existing manual inspection method of the bridge expansion joint device to a precise high-speed inspection method.
M/V refers to the technology and methods used to provide imaging-based automatic inspection and analysis for such applications as automatic inspection, process control, and robot guidance, usually in industry. It refers to many technologies, software and hardware products, integrated systems, actions, methods, and expertise.
Definitions of the term M/V vary, but all include the technology and methods used to extract information from an image on an automated basis, as opposed to image processing, where the output is another image. The information can be used for such applications as automatic inspection, robot and process guidance in industry, security monitoring, and vehicle guidance [8,9,10]. This field encompasses a large number of technologies, software and hardware products, integrated systems, actions, methods, and expertise [10,11]. M/V is practically the only term used for these functions in industrial automation applications. It attempts to integrate existing technologies in new ways and apply them to solve real-world problems in a way that meets the requirements of industrial automation and similar application areas [10,12].
The primary uses for M/V are imaging-based automatic inspection and sorting and robot guidance [13,14]. The imaging device (e.g., camera) can either be separate from the main image processing unit or combined with it, in which case the combination is generally called a smart camera or smart sensor [15,16]. While conventional (2D visible light) imaging is most commonly used, alternatives include multispectral imaging, hyperspectral imaging, imaging various infrared bands, line scan imaging, 3D imaging of surfaces, and X-ray imaging [13]. We used the method of line scan imaging, which we think is most effective in technology that can automatically acquire images while driving at high speeds. [17,18,19,20].
One of the purposes of the research is to use a line-scan camera in M/V to record road surfaces as images with a resolution of 1.0 mm per pixel in a high-speed (100 km/h) environment. Existing line-scanning cameras are used for the purpose of identifying counterfeit bills and inspecting semiconductor wafers’ surfaces on belt conveyors, so they can be said to be the best technology for introducing to fast-moving vehicles on roads [21,22]. This is suitable for this study because it is free from the problem of lens distortion that may occur in an area-scan camera [23]. According to this study, we developed a survey system equipped with line-scan cameras, Global Positioning System (GPS), and a distance measurement instrument sensor (DMI) in the vehicle, and as a result, we could obtain a safe and accurate image without blocking the road [24,25,26,27,28].
Recently, deep-learning-based approaches [29] have been applied to many problems in various industrial and academic fields. Visual recognition tasks, which extract information of interest from images, such as image classification [30], object detection [31], and semantic segmentation [32], have been actively studied. In particular, CNN (convolutional neural networks) have shown successful results in many visual recognition applications. In this study, models based on CNN and some deep learning techniques are applied to image analysis problems to determine the distance between expansion joints. Two CNN models are used to analyze the distance step by step. First, image classification categorizes images semantically into sub-groups. An image-classification CNN extracts important image features like texture cues and shape cues from each image, and a logistic regression [31] distinguishes them between categories based on the extracted features. Successful studies on image classification CNNs have been conducted focusing on the ImageNet benchmark dataset [33], and some design patterns have been proposed to achieve technical goals such as learning more complex patterns (ResNet) [34], light model weights (MobileNet) [35], and efficient scalability (EfficientNet) [36]. These design patterns, called CNN architectures, are applied to general image classification to reduce the need to design new models every time. Second, semantic segmentation is the process of classifying each pixel in an image belonging to a particular class. The recent success of CNN has also driven outstanding progress in semantic segmentation [37,38,39,40,41,42,43,44,45,46]. Based on CNN architecture, the semantic segmentation model extracts local contexts (a small area centered in a pixel to classify) and global contexts (overall semantics of input image) from an image and reconstructs contexts to create a class heatmap of the same size as the original image, which shows the probability of which class each pixel is. Therefore, it can be thought of as a classification problem for each pixel, considering local and global contexts.
Another purpose of the study is to develop software that measures gap width with more than 90% accuracy in the road image of the survey so that many bridges can be monitored quickly. Therefore, an algorithm was developed to measure the gap width after first finding the expansion point in the road image using machine learning. As a result, the identification accuracy was more than 95%, and the investigation time was reduced by more than 95%, from an average of about 1 h/bridge (the inspector’s existing manual inspection method) to about 3 min/bridge.
The main contribution of this study is to demonstrate the possibility of developing smart maintenance techniques for road structures, in other words, the successful development of a smart maintenance system that combines machine vision and machine learning technology, for the following purposes: first, to ensure the traffic safety of vehicles on roads that are already in use; and second, to obtain the condition of road structures at the level the investigator wants with figures and accurate images.
The article is organized as follows:
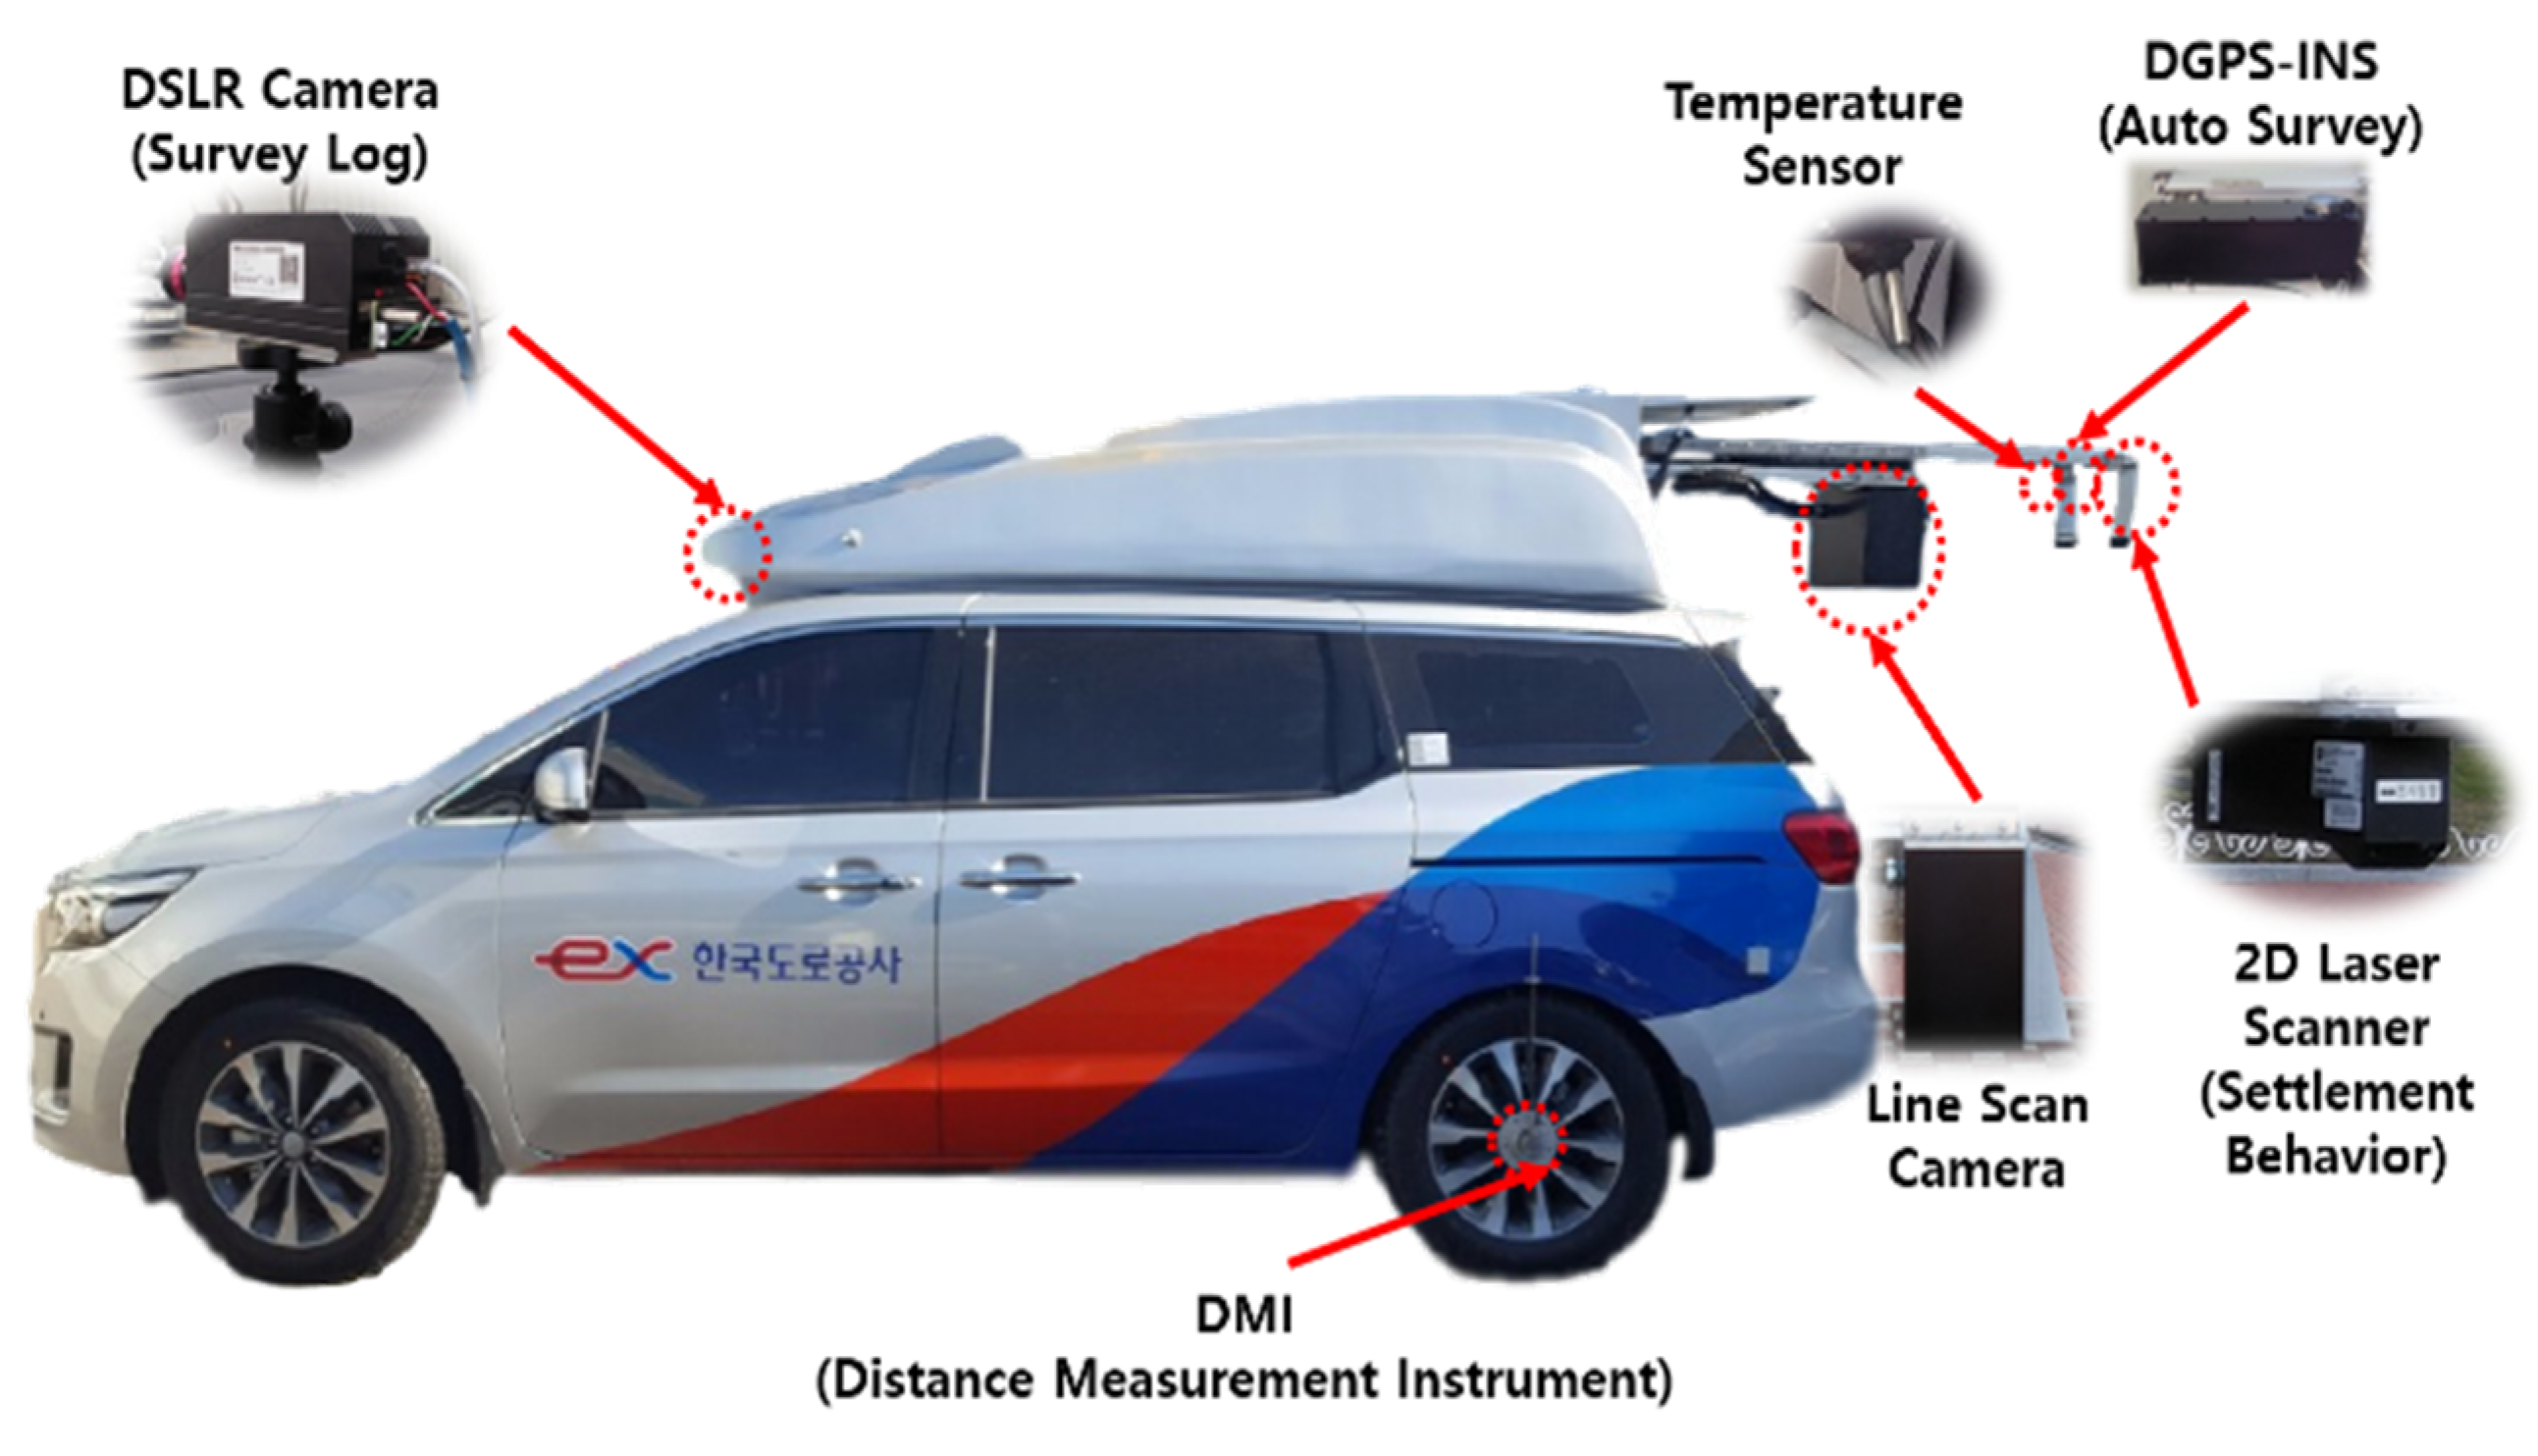
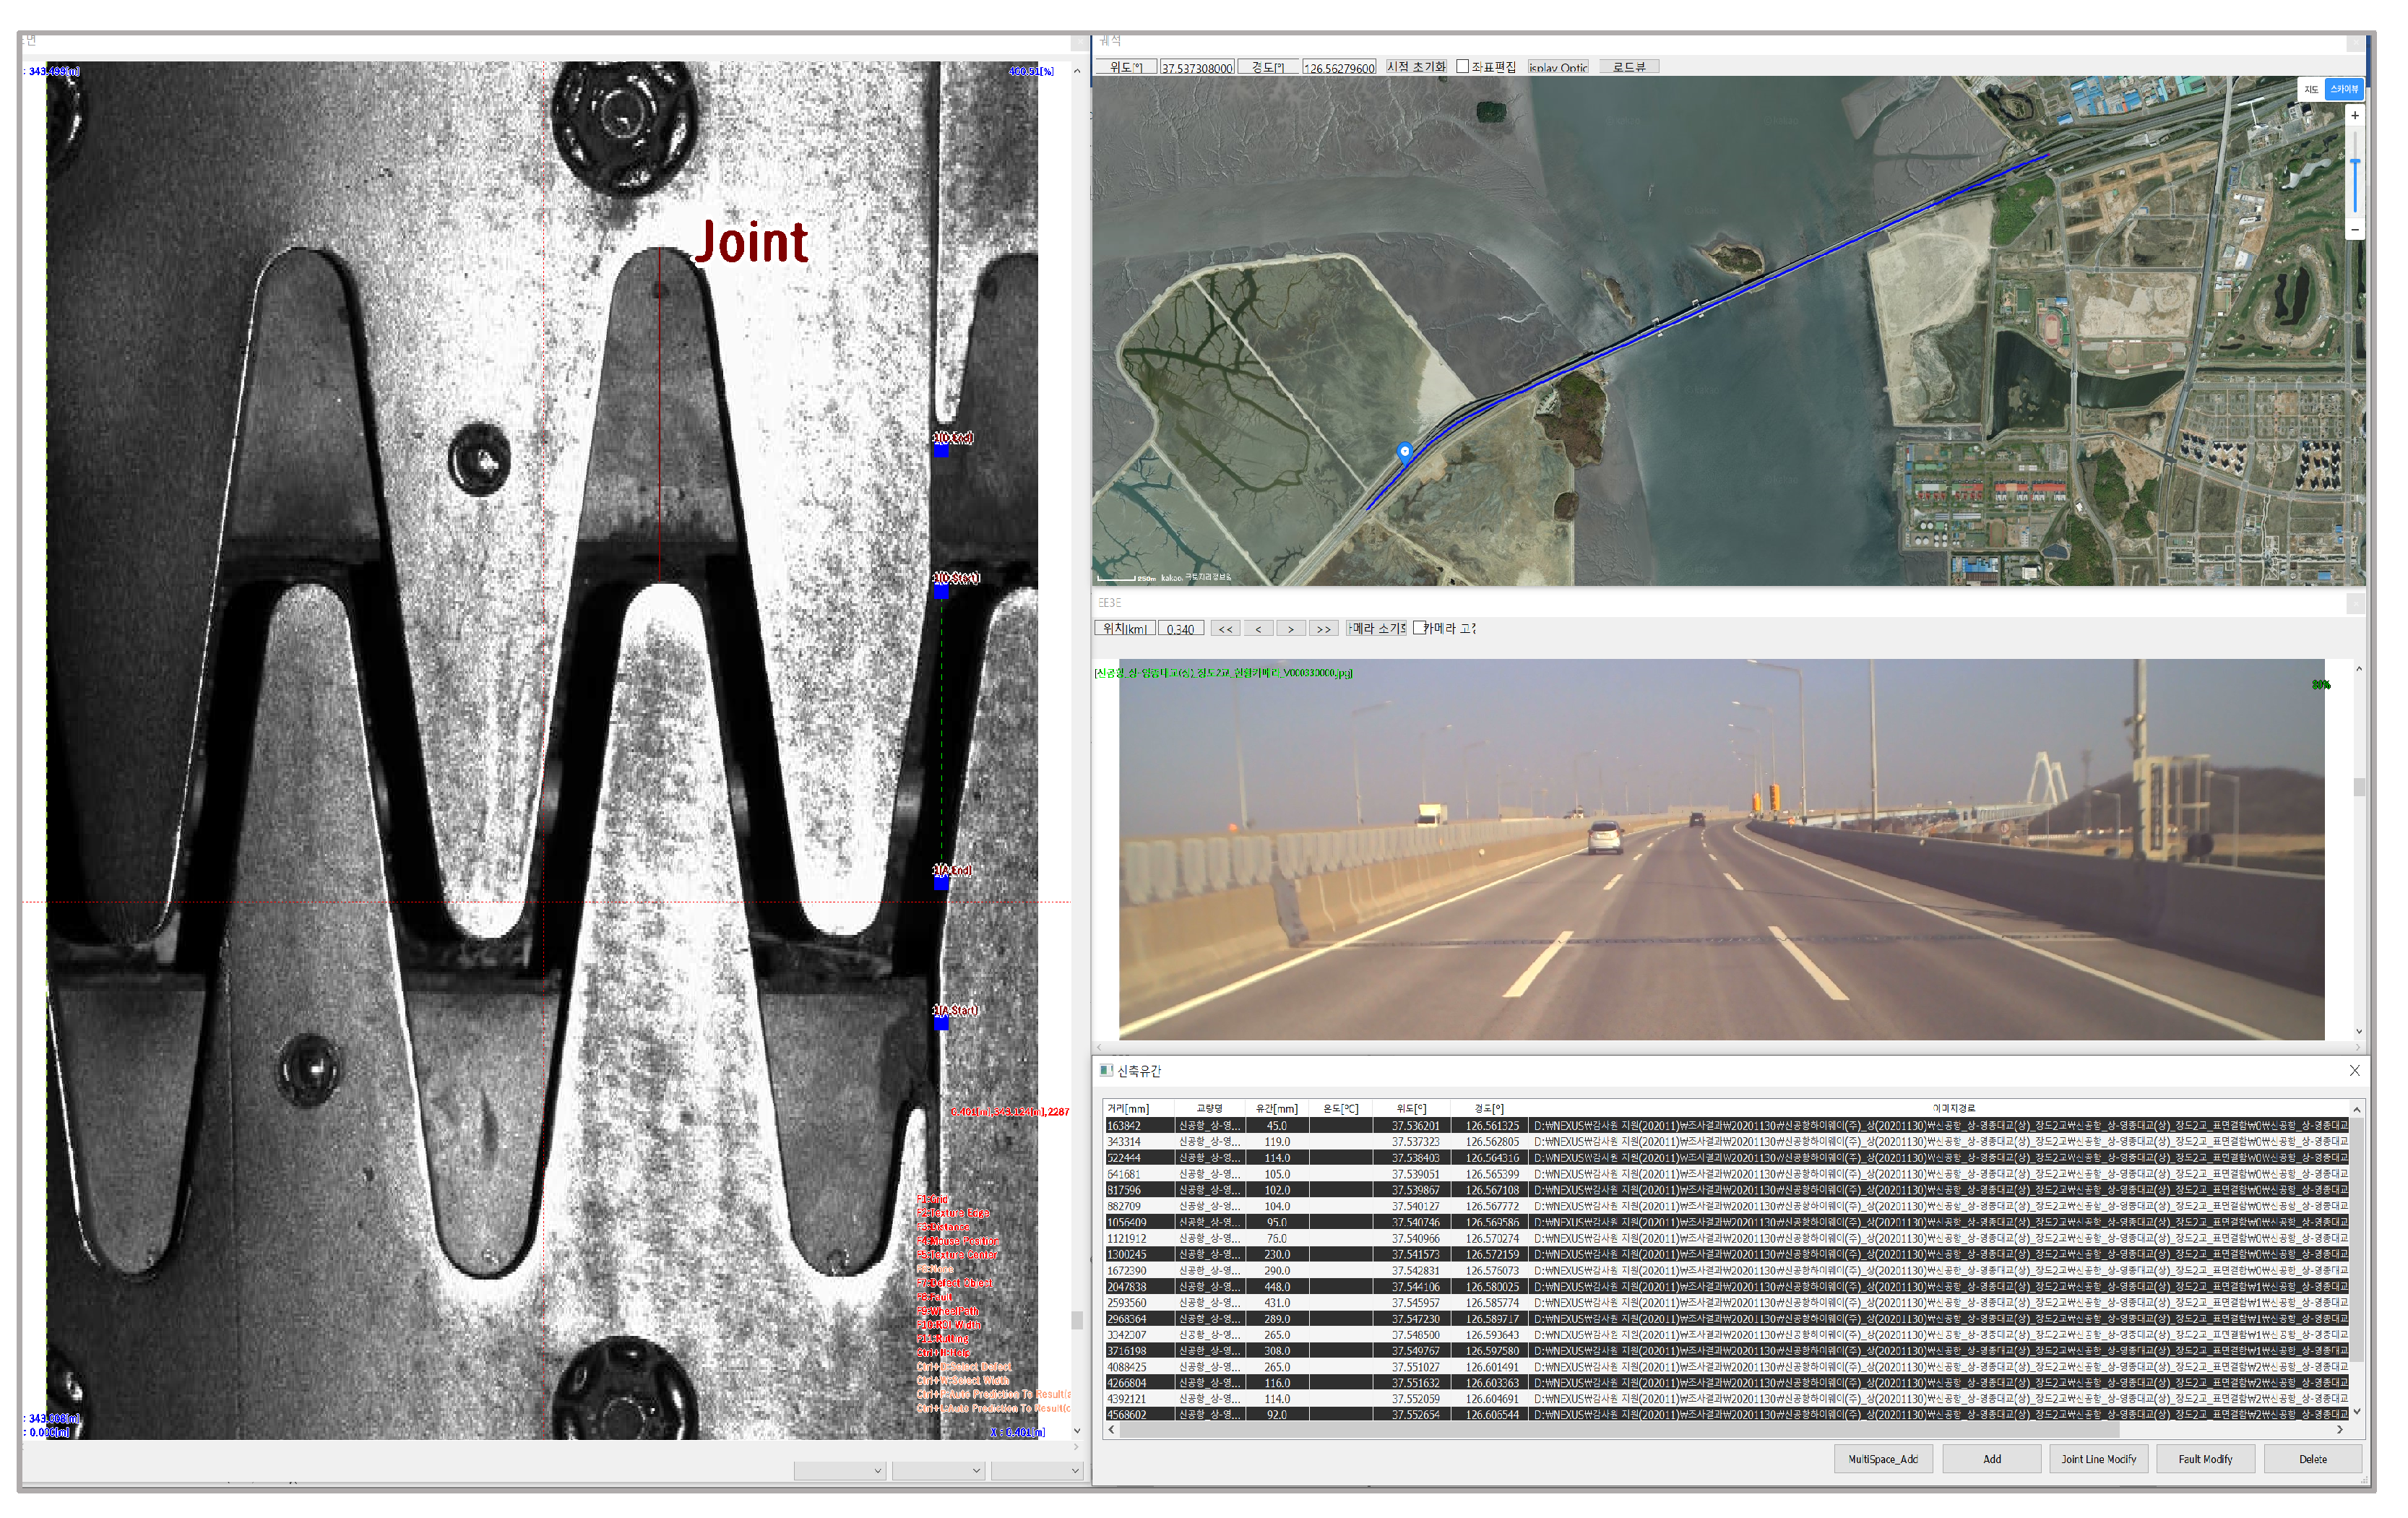
  • Section 2 introduces a system developed to survey the road surface while driving at high speed (100 km/h) with a line-scan camera and an M/V imaging device. It introduces operating equipment and explains the main functions and test results.
  • Section 3 describes the adequacy review of pre-setting by surveying newly constructed bridge construction joints with standard computer vision methods applied to the initial system.
  • Section 4 describes another detection mechanism that uses machine learning.
  • Section 5 concludes the paper and proposes future work.

2. Development of Monitoring Technology for Bridge Expansion Joint Using Line-Scan Cameras

Recently, the Korean government has been actively encouraging the introduction of the latest structural safety inspection technologies through the revision of various laws and regulations. For example, Annex 10 of the Enforcement Decree of the Special Act on the Safety and Maintenance of Facilities was amended in March 2020 to newly establish a provision for “appearance investigation and image analysis using new technology or inspection robot, etc.”. In other words, new technology can be applied for structure inspection. Further, the revision of Article 167 of the Occupational Safety and Health Act emphasized the safety management of internal employees by strengthening the punishment standards for employers (a maximum fine of $100,000 USD) in case of workplace accidents caused by negligence in worker safety management [1,2].
As a result, the structure management conditions of the Korea Expressway Corporation are becoming increasingly strict. The establishment of facility and performance evaluation following the revision of the Special Act on Safety and Maintenance of Facilities newly necessitated the performance evaluation of 2611 Type 3 facilities (bridges) and 4626 structures. As a result, structural inspectors performed 25,219 regular safety inspections, 2205 precise safety inspections, and 258 precise safety diagnoses in 2020, including in-house and external services. A shortage of management personnel is arising owing to this excessive workload (see Table 3).
Given that the stricter structure management conditions are imposing greater demands on manpower, it is crucial to promote inspection methods and smart technologies that can replace manpower.
The Korea Highway Corporation Road Traffic Research Institute analyzed past safety inspection and technical advice data and found that 78.3% of expansion joint devices that had to be replaced lacked a gap. Since 2016, we have been researching monitoring methods to preemptively maintain a suitable gap between expansion joints [2].
For this purpose, by integrating high-speed line-scan cameras, which are widely used in various fields such as semiconductor inspection and road pavement investigation, image-processing technology to determine the length of expansion and contraction through AI-based (i.e., machine learning) image sensing in the analysis process, and automatic control technology, we developed the Nonstop bridge EXpansion joint gap measuring Utility System (NEXUS) to measure the distance between expansion joints with 1.0 mm resolution while driving at a high speed of 100 km/h [1] (see Figure 2).
Existing methods manually measure the gap in highway bridge expansion joints through traffic control and partial blockage. By contrast, the proposed method uses a high-speed line-scan camera mounted on a vehicle driving at 100 km/h to acquire an image across a 40 cm-wide car lane. This system uses the geographical information system data of the bridge (above, longitude coordinate system) to perform automatic measurements in conjunction with the mounted GPS while driving at high speed and thereby creates a database of the expansion gaps based on accurate survey images without affecting the traffic flow. In this study, a test survey was conducted on approximately 5000 bridges along the highway, and the analysis results were used for big-data-based machine learning for developing algorithms to accurately determine the length of the expansion joint gap depending on its type and site conditions (see Figure 3) [45,46,47,48,49,50,51,52,53,54,55,56,57,58,59,60,61,62]. The NEXUS system and the on-site test survey introduction is available on our YouTube channel [63].
The use of the NEXUS for performing automatic surveys of the bridge expansion joint device gap while driving at high speed reduces the survey time by more than 95%, from an average of approximately 1 h/bridge (existing manual inspection method) to approximately 3 min/bridge. In addition, if the accumulated gap is monitored and preemptive maintenance is performed before gap narrowing occurs, it can eliminate the risk factors in the future temperature expansion behavior of the bridge and contribute to traffic safety and cost reductions.

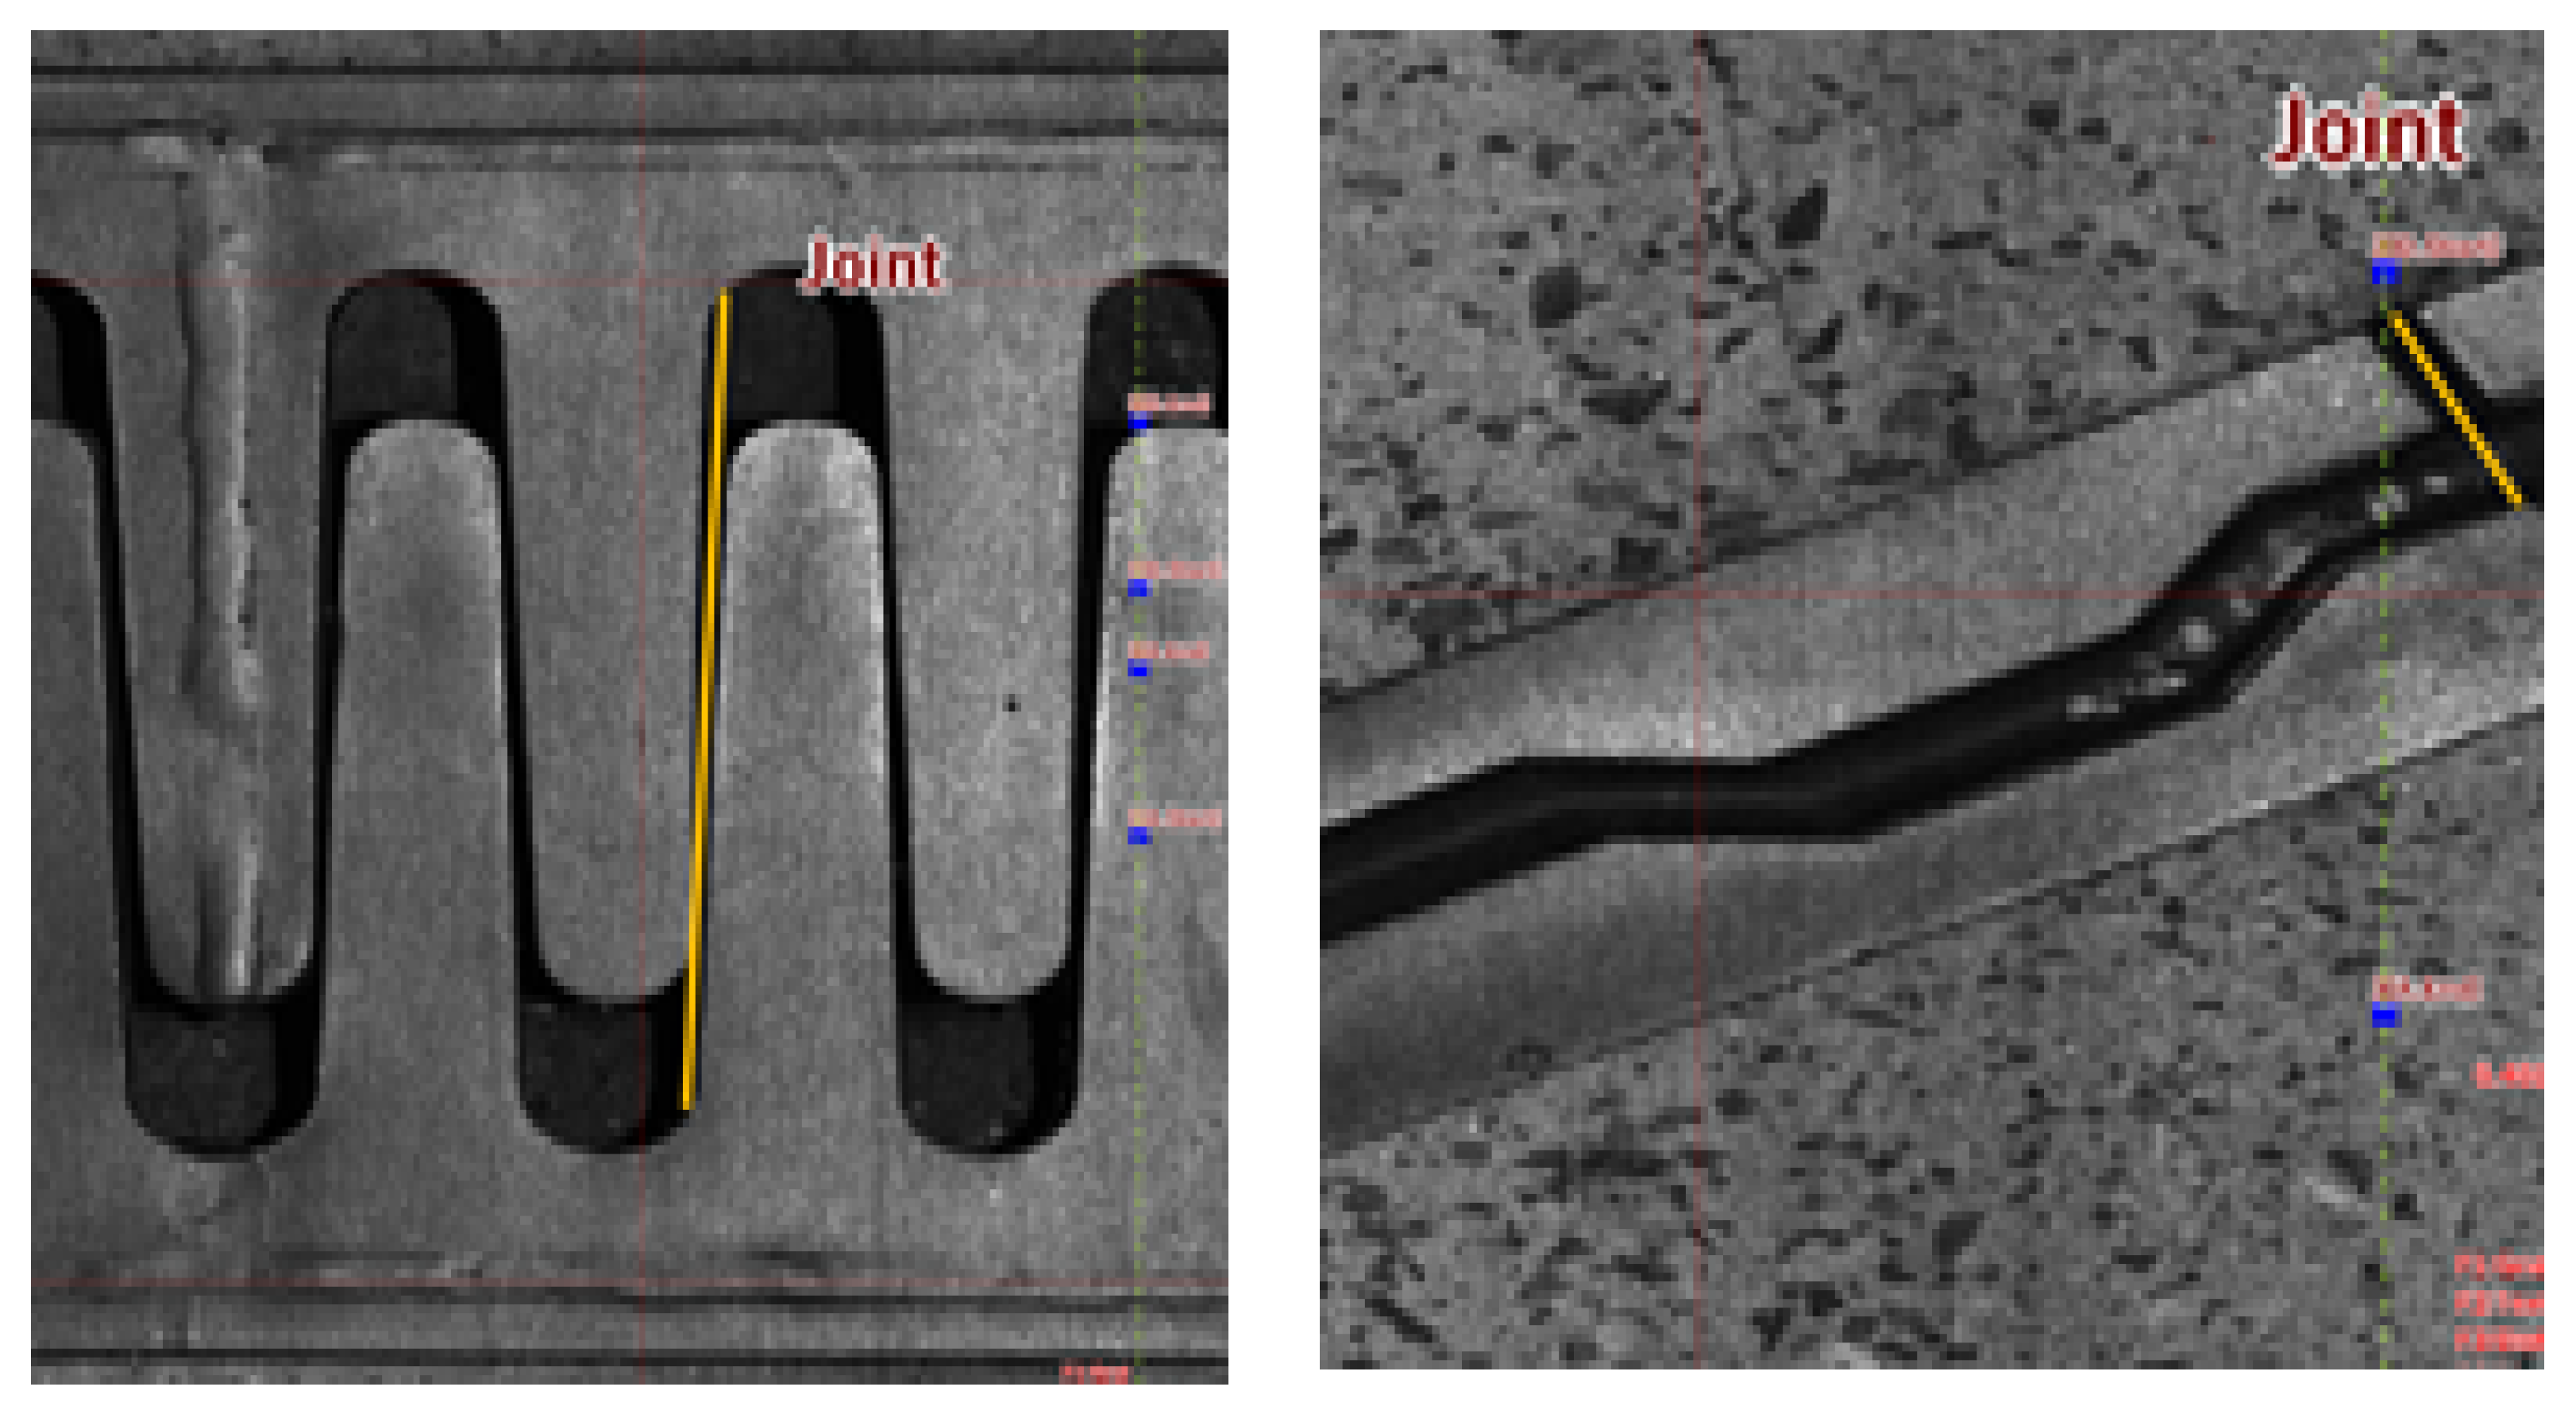
3. Initial Gap Measurement and Evaluation of New Bridge Expansion Joint Device

Previously, it was difficult to use data when necessary, as they were managed in the form of reports and fields. By contrast, by using the NEXUS device, initial data can be accumulated, and the adequacy of highway bridge expansion joints can be checked and evaluated online at any time. To confirm this, we tested the initial data for the adequacy of the pre-setting after 300 days, when the initial drying shrinkage and creep deformation roughly converge; in this regard, it can be beneficial to use the initial gap database (D/B) for the three routes completed at the end of 2016. As the pre-setting of the expansion joint device is not consistent with the daily average temperature during winter and summer at the time of construction, it is essential to adjust the gap in advance such that it has an intermediate value at the reference temperature (average daily temperature of 15 °C).
The route to be investigated has 302 expansion joint devices of three types, namely, rail type, steel finger type, and mono cell type (see Table 4). We converted the expansion gap and average temperature (obtained from the Korea Meteorological Administration) at 15 °C during the investigation and evaluated the adequacy of the pre-setting. After analyzing the initial values of the new bridges, we investigated some bridges that were not properly preset, potentially due to lacking gaps during summer (35–40 °C) or excessive gaps during winter (−15 °C) (see Figure 4 and Figure 5).
For example, the design temperature range Δ T is from −5 °C to 35 °C in the prestressed concrete girder type expansion bridge design movement calculation standard. Therefore, the reference temperature for pre-setting can be seen as 15°C, which is the median temperature. In fact, the temperature at the time of construction of the new joint is under various temperature environments, not 15 °C, so pre-setting is performed at the time of installation to increase or decrease the spacing at the time of installation. The y-axis “Percentage of the capacity of the new joint” is to ensure that pre-setting was performed properly at the time of construction:
(1)
After examining the joint gap and the average daily temperature on any day,
(2)
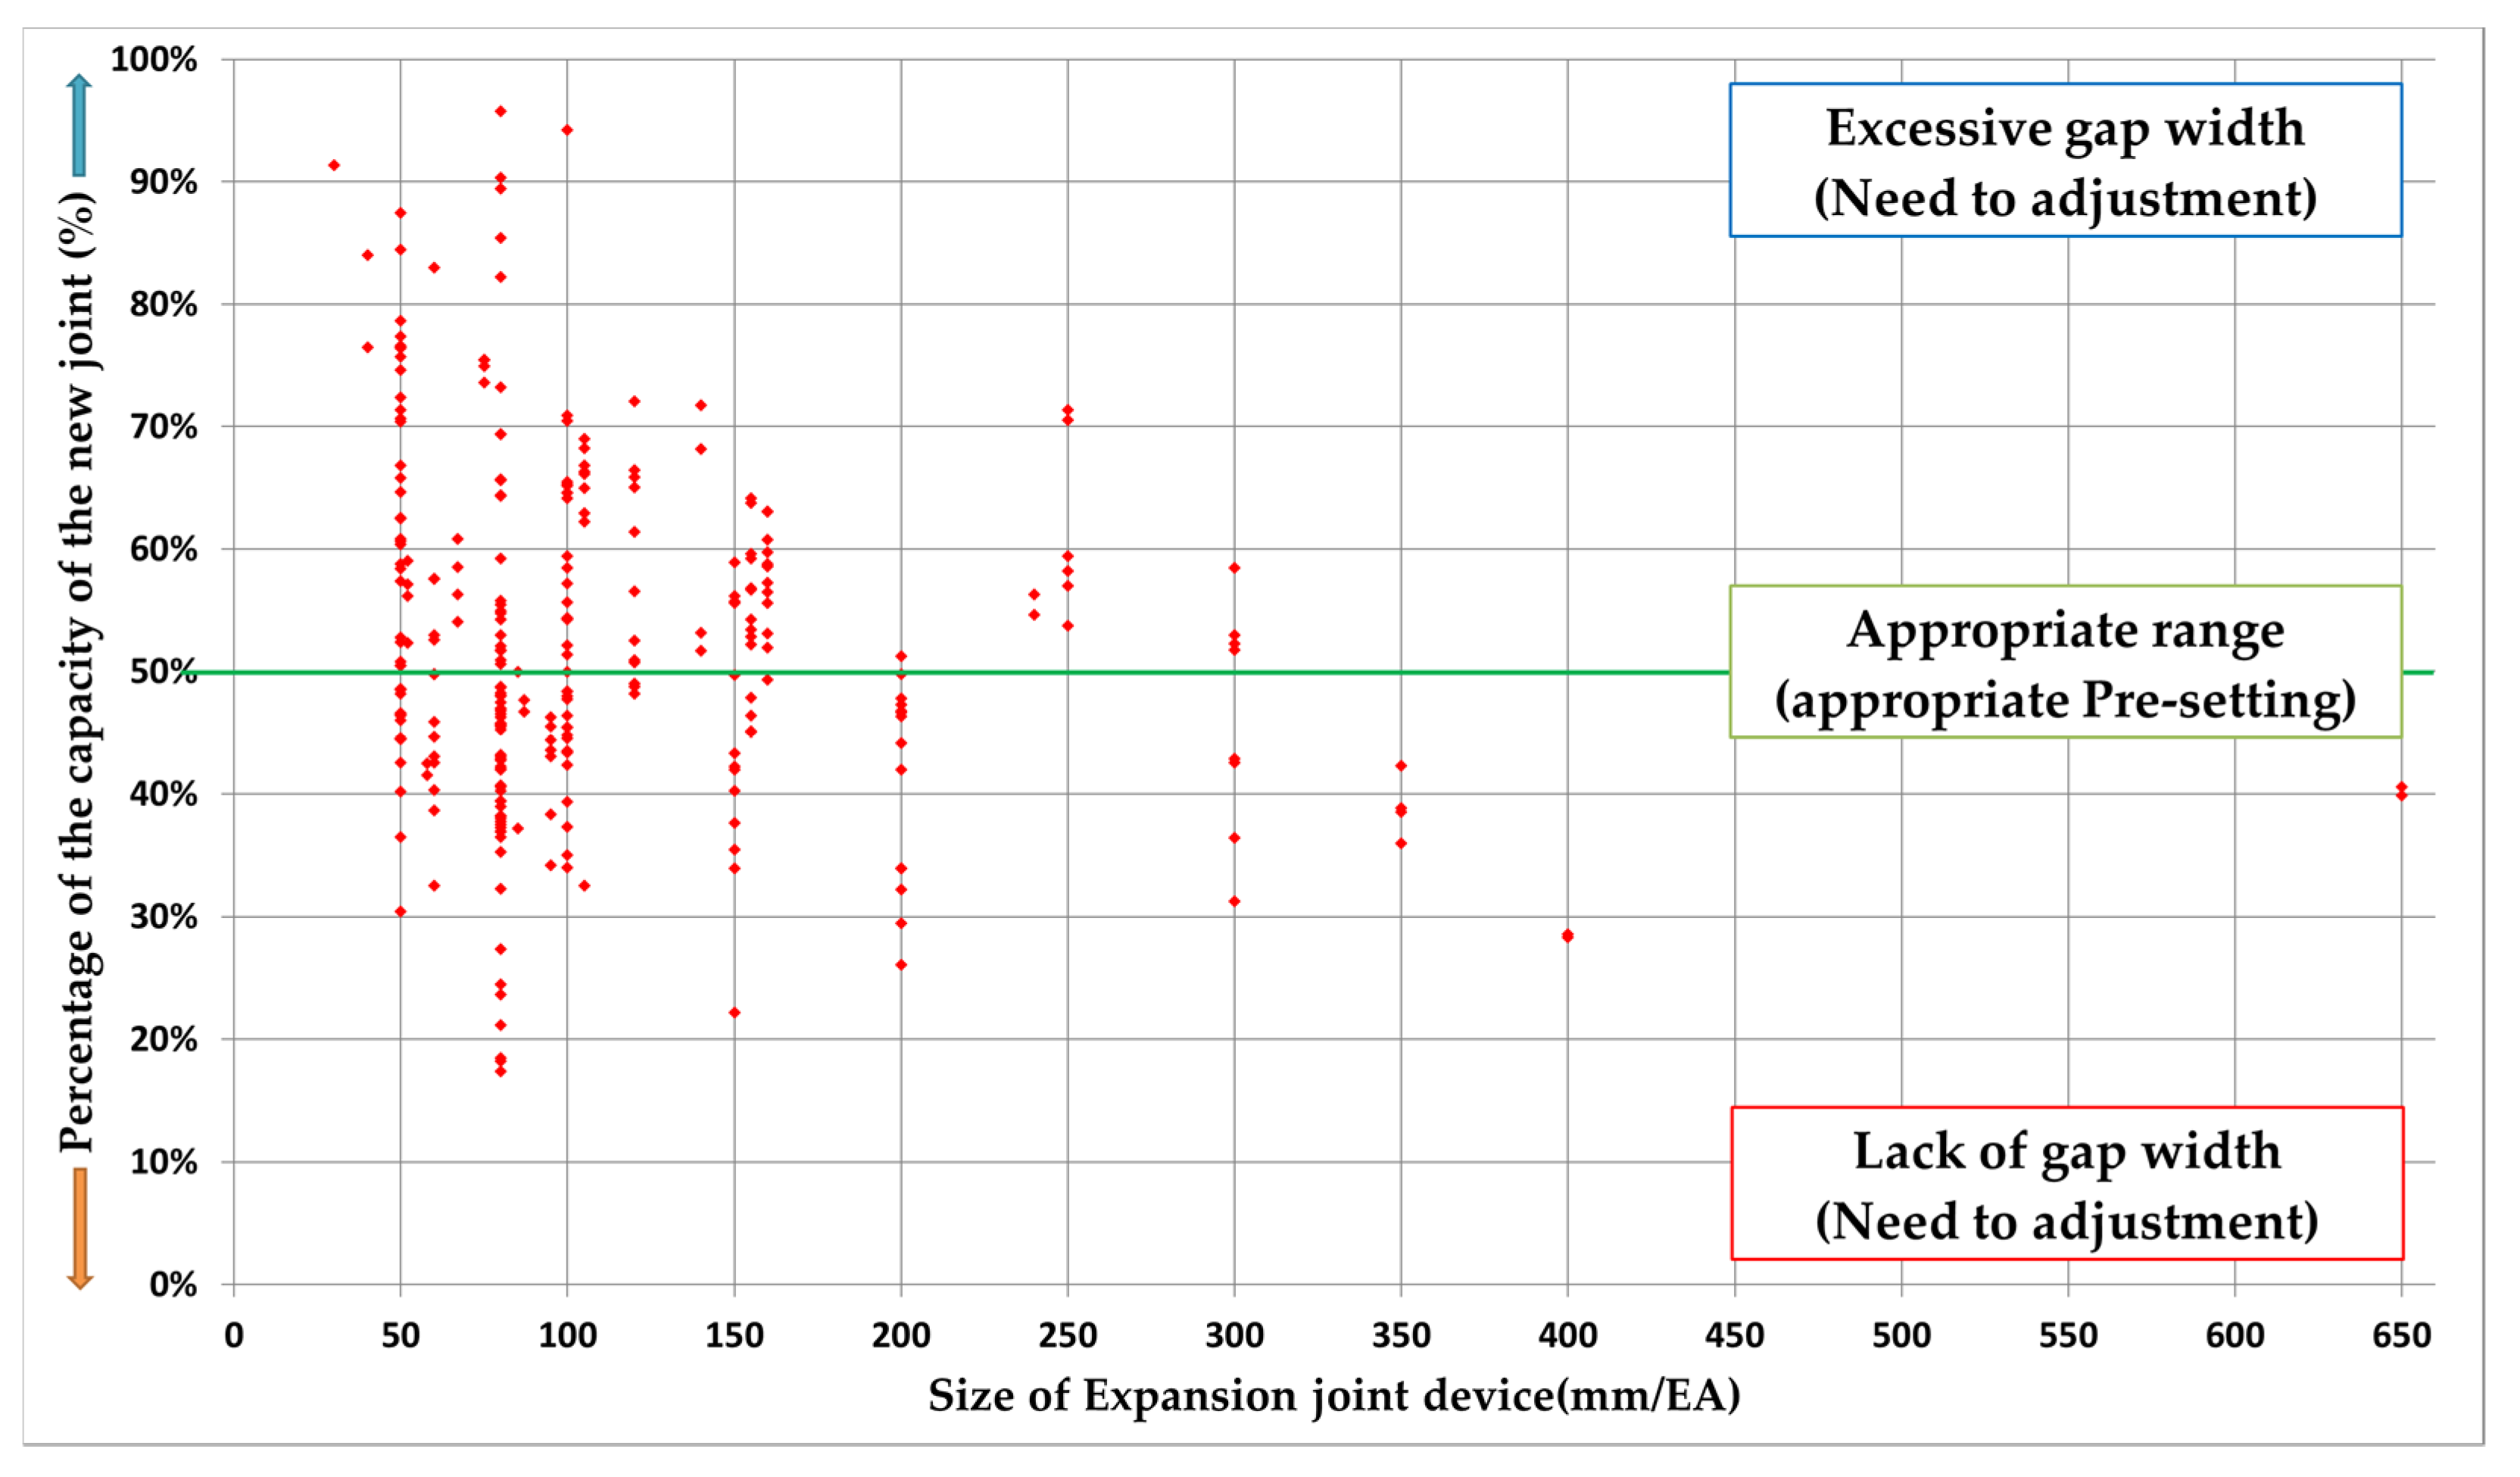
The joint gap converted into the reference temperature of 15 °C is expressed as a percentage of the capacity of the new joint.
This value means the following:
(a)
If it is close to 50%, it means that it is installed in the middle of the absolute value of the joint gap. (If it is an expansion and contraction joint with a capacity of 100 mm, it represents 50 mm when the joint gap is 15 °C, which is the reference temperature.)
(b)
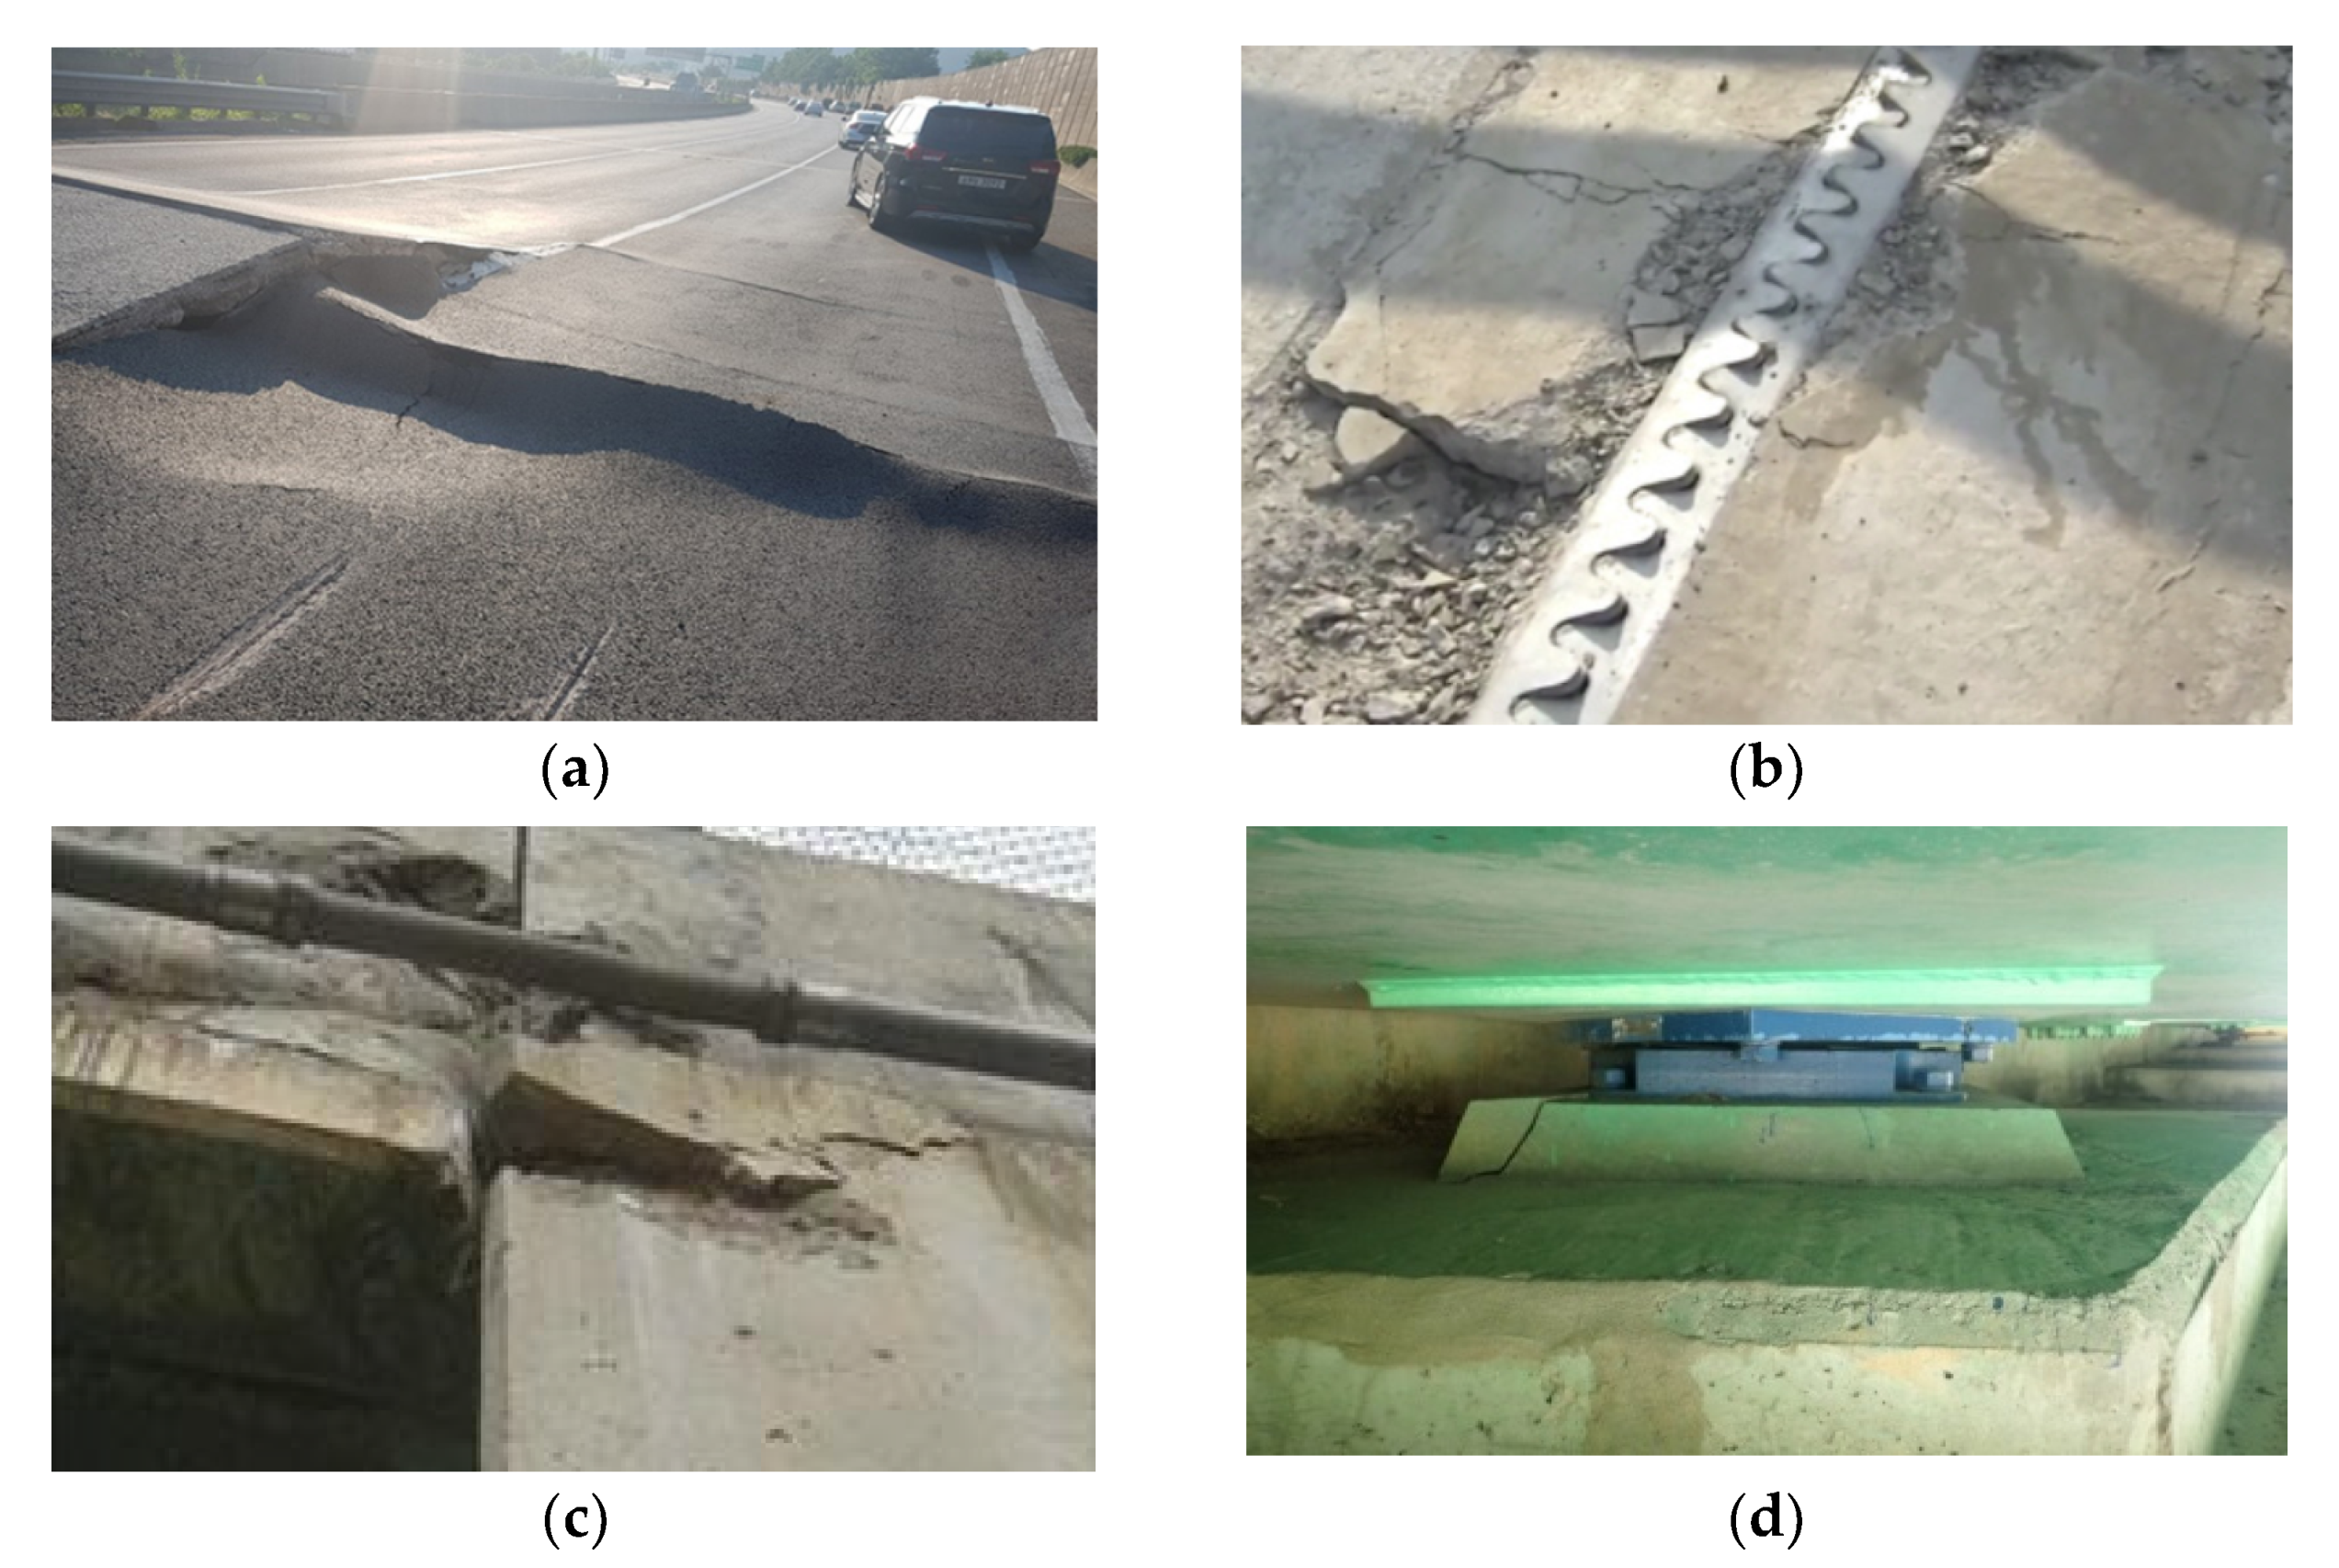
If it is near 10%, it means that it is installed at a small value of the absolute value of the joint gap. (In the case of an expansion joint with a capacity of 100 mm, it shows 10 mm when the joint gap is 15 °C, which is the reference temperature, so the joint gap is insufficient in summer.)
(c)
If it is near 90%, it means that it is installed at a large value of the absolute value of the joint gap. (If it is a 100 mm stretchable joint, it is 90 mm when the joint gap is 15 °C, which is the reference temperature, so the gap is exceeded in winter.)
As such, if it is possible to investigate and analyze the expansion joint device gap while driving, without blocking a separate route, from the beginning, and to convert it into D/B in the bridge management system, by monitoring the changing trend, it is possible to take preemptive measures in case of emergency (such as when the gap narrows in a short time).

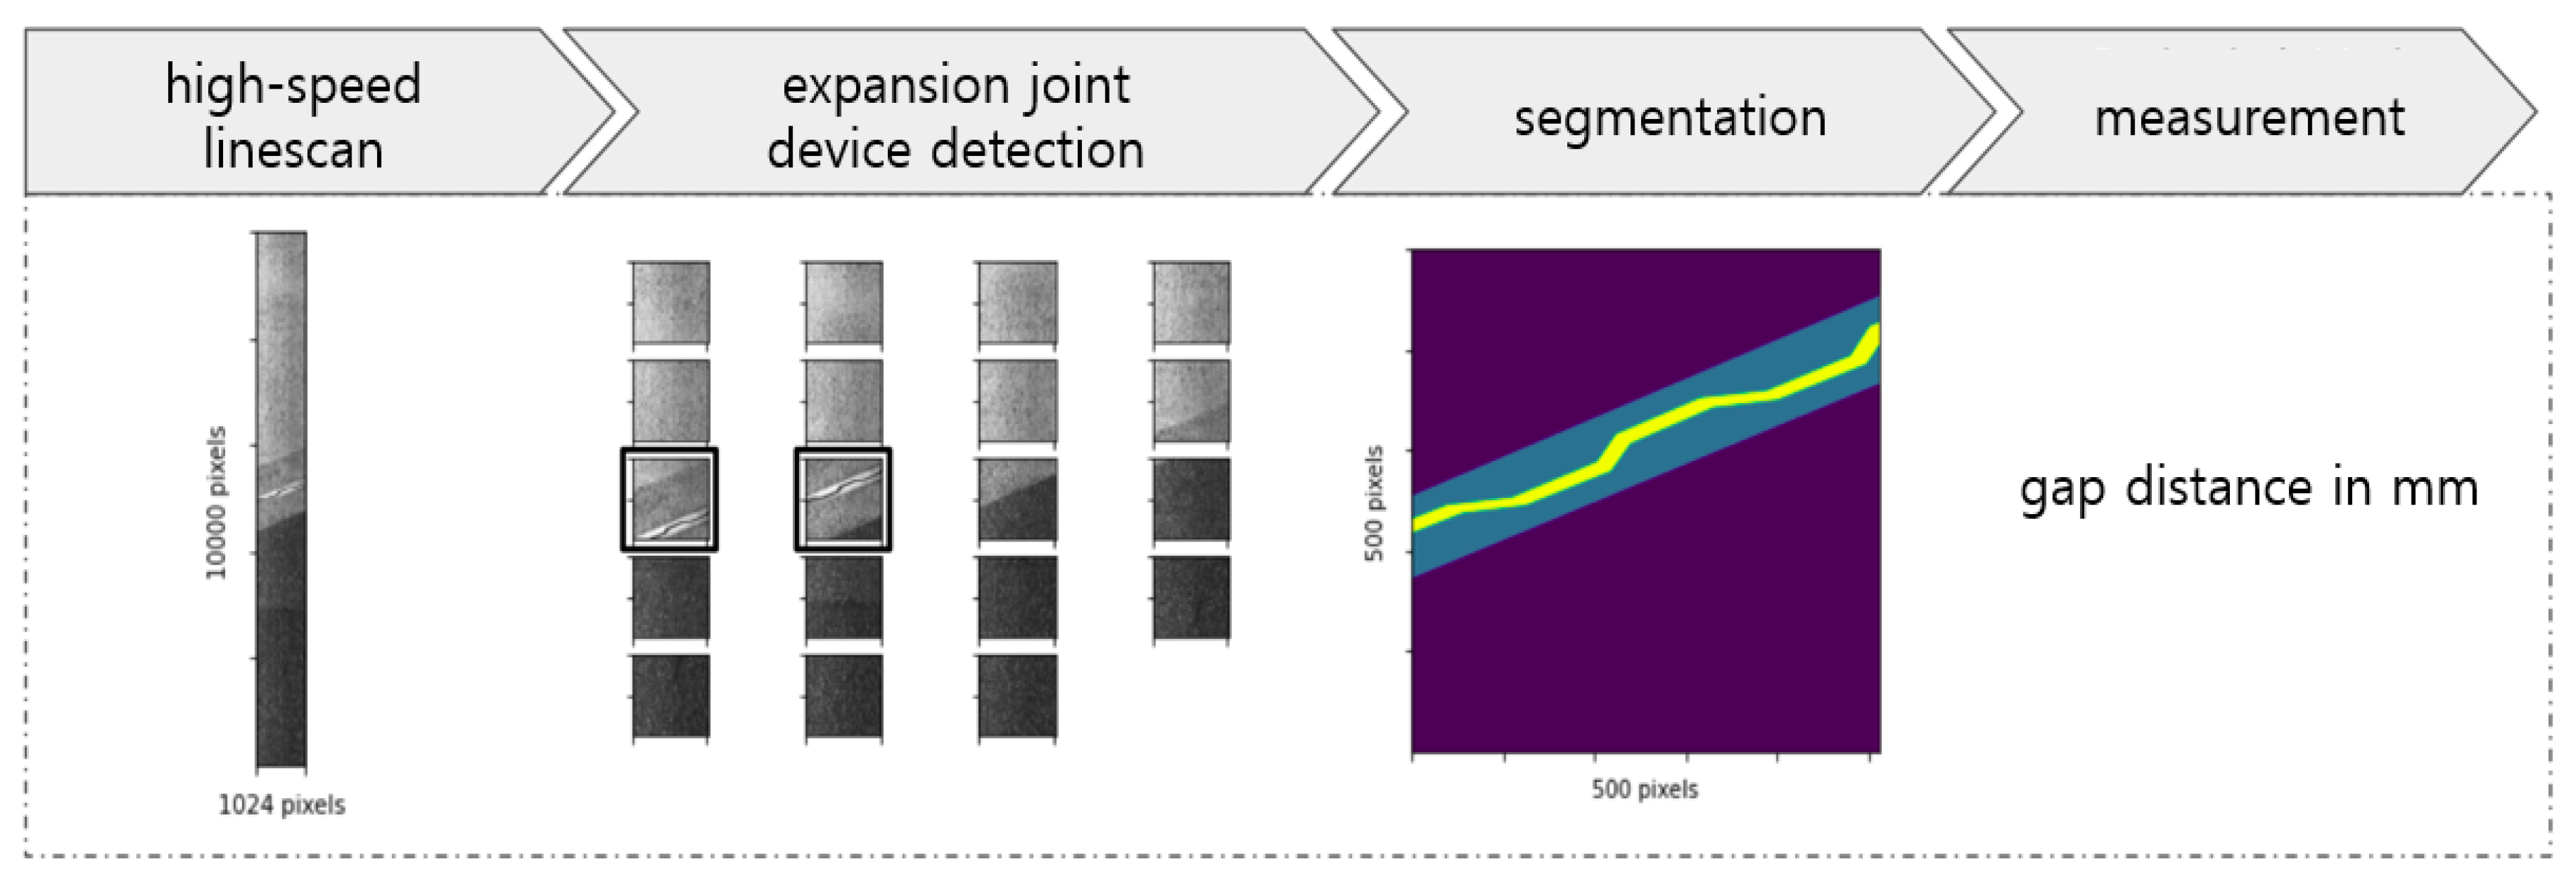
4. Advanced Identification of Expansion Gap Using Machine Learning

Expansion joints device has different details for each development and sales company, and typical expansion joint devices constructed on road bridges in South Korea include mono cell type, finger type, and rail type. Table 5 lists the types of expansion joint devices installed on highway bridges in South Korea as of 2014.
The analysis of the expansion joint gaps of 4821 bridges and 12,825 devices on the highway mainline from 2017 to 2019 using NEXUS equipment revealed various types of expansion joint devices and gap identification errors depending on the condition of the expansion joint device body installed in the field. False-detection errors include the case of erroneously identifying another gap in the expansion joint body as a gap and the case of detecting a specific part of the road surface (portholes, repair marks, cracks, etc.). On average, the gap identification accuracy was 67.5%; that for the finger type with a complex shape was the lowest at 51% (see Table 6, Figure 5). False detections were attributed to limitations of the traditionally coded image analysis algorithm. Therefore, the image identification method must be improved using machine learning, as it is superior to traditional coding.
We aimed to overcome the limitations of the traditional gap identification algorithm. Machine learning can be used to learn previously investigated images as big data, and to thereby identify the expansion joint device from an input image and more accurately determine the gap value. The input image obtained using the NEXUS equipment was recorded as multiple 10,000 × 1024 pixels images, depending on the irradiation distance. The image analysis system consisted of cascaded AI vision modules, in which the work process analyzed high-resolution input images for realizing effective calculations. The AI process involves the following steps: original image input > expansion joint area extraction AI network (classification) > expansion joint area image area (cropping) input > gap extraction AI (segmentation) > gap measurement (algorithm) (see Figure 6).
To measure the gap value, the position of the expansion joint device must be specified in the image. Further, for achieving high measurement accuracy, the expansion joint device needs to be recognized at the pixel level. This can be done using image segmentation methods used in computer vision. Further, a deep learning model with extensive data learning is used for problems with large changes in illuminance, angle, image shape, and noise generation, such as road environments.
The AI machine learning model for expansion joint device discovery was implemented to solve the classification problem using CNN as a feature extractor. The original image with a size of 10,000 × 1024 pixels was cut into an image patch with a size of 1000 × 1024 pixels to be inputted to the AI model with minimal distortion. Then, 19 image patches were generated for each line-scan image, and classification was performed to find the image patches in which the expansion joint device exists (see Figure 7).
To find the point with the minimum gap distance, it is necessary to precisely segment the gap region from the image patch where the expansion joint device appears. The AI machine learning model for gap region extraction used U-Net, a representative segmentation model. The first AI model generated and learned training data by labeling pixels in the corresponding area to extract metal parts with characteristic textures from the line-scan images of the expansion joint device. The second AI model was trained to find the gap region between the extracted joint devices (see Figure 8).
After obtaining a binarized image with the gap region and the background, we found the point with the minimum gap distance. The minimum gap distance in pixels was converted to the final gap value in millimeters by multiplying the information in millimeters per pixel.

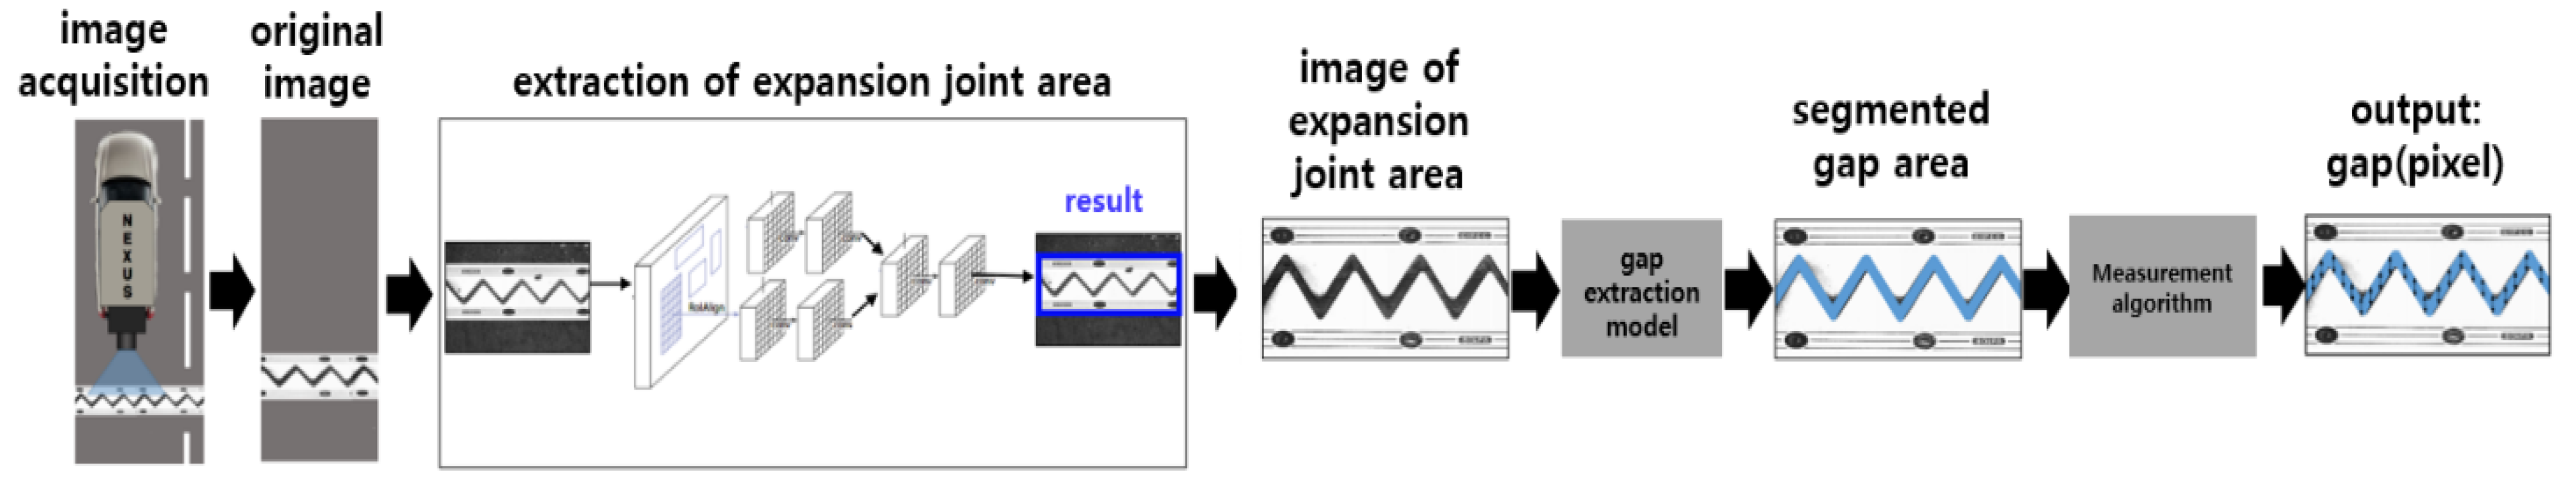
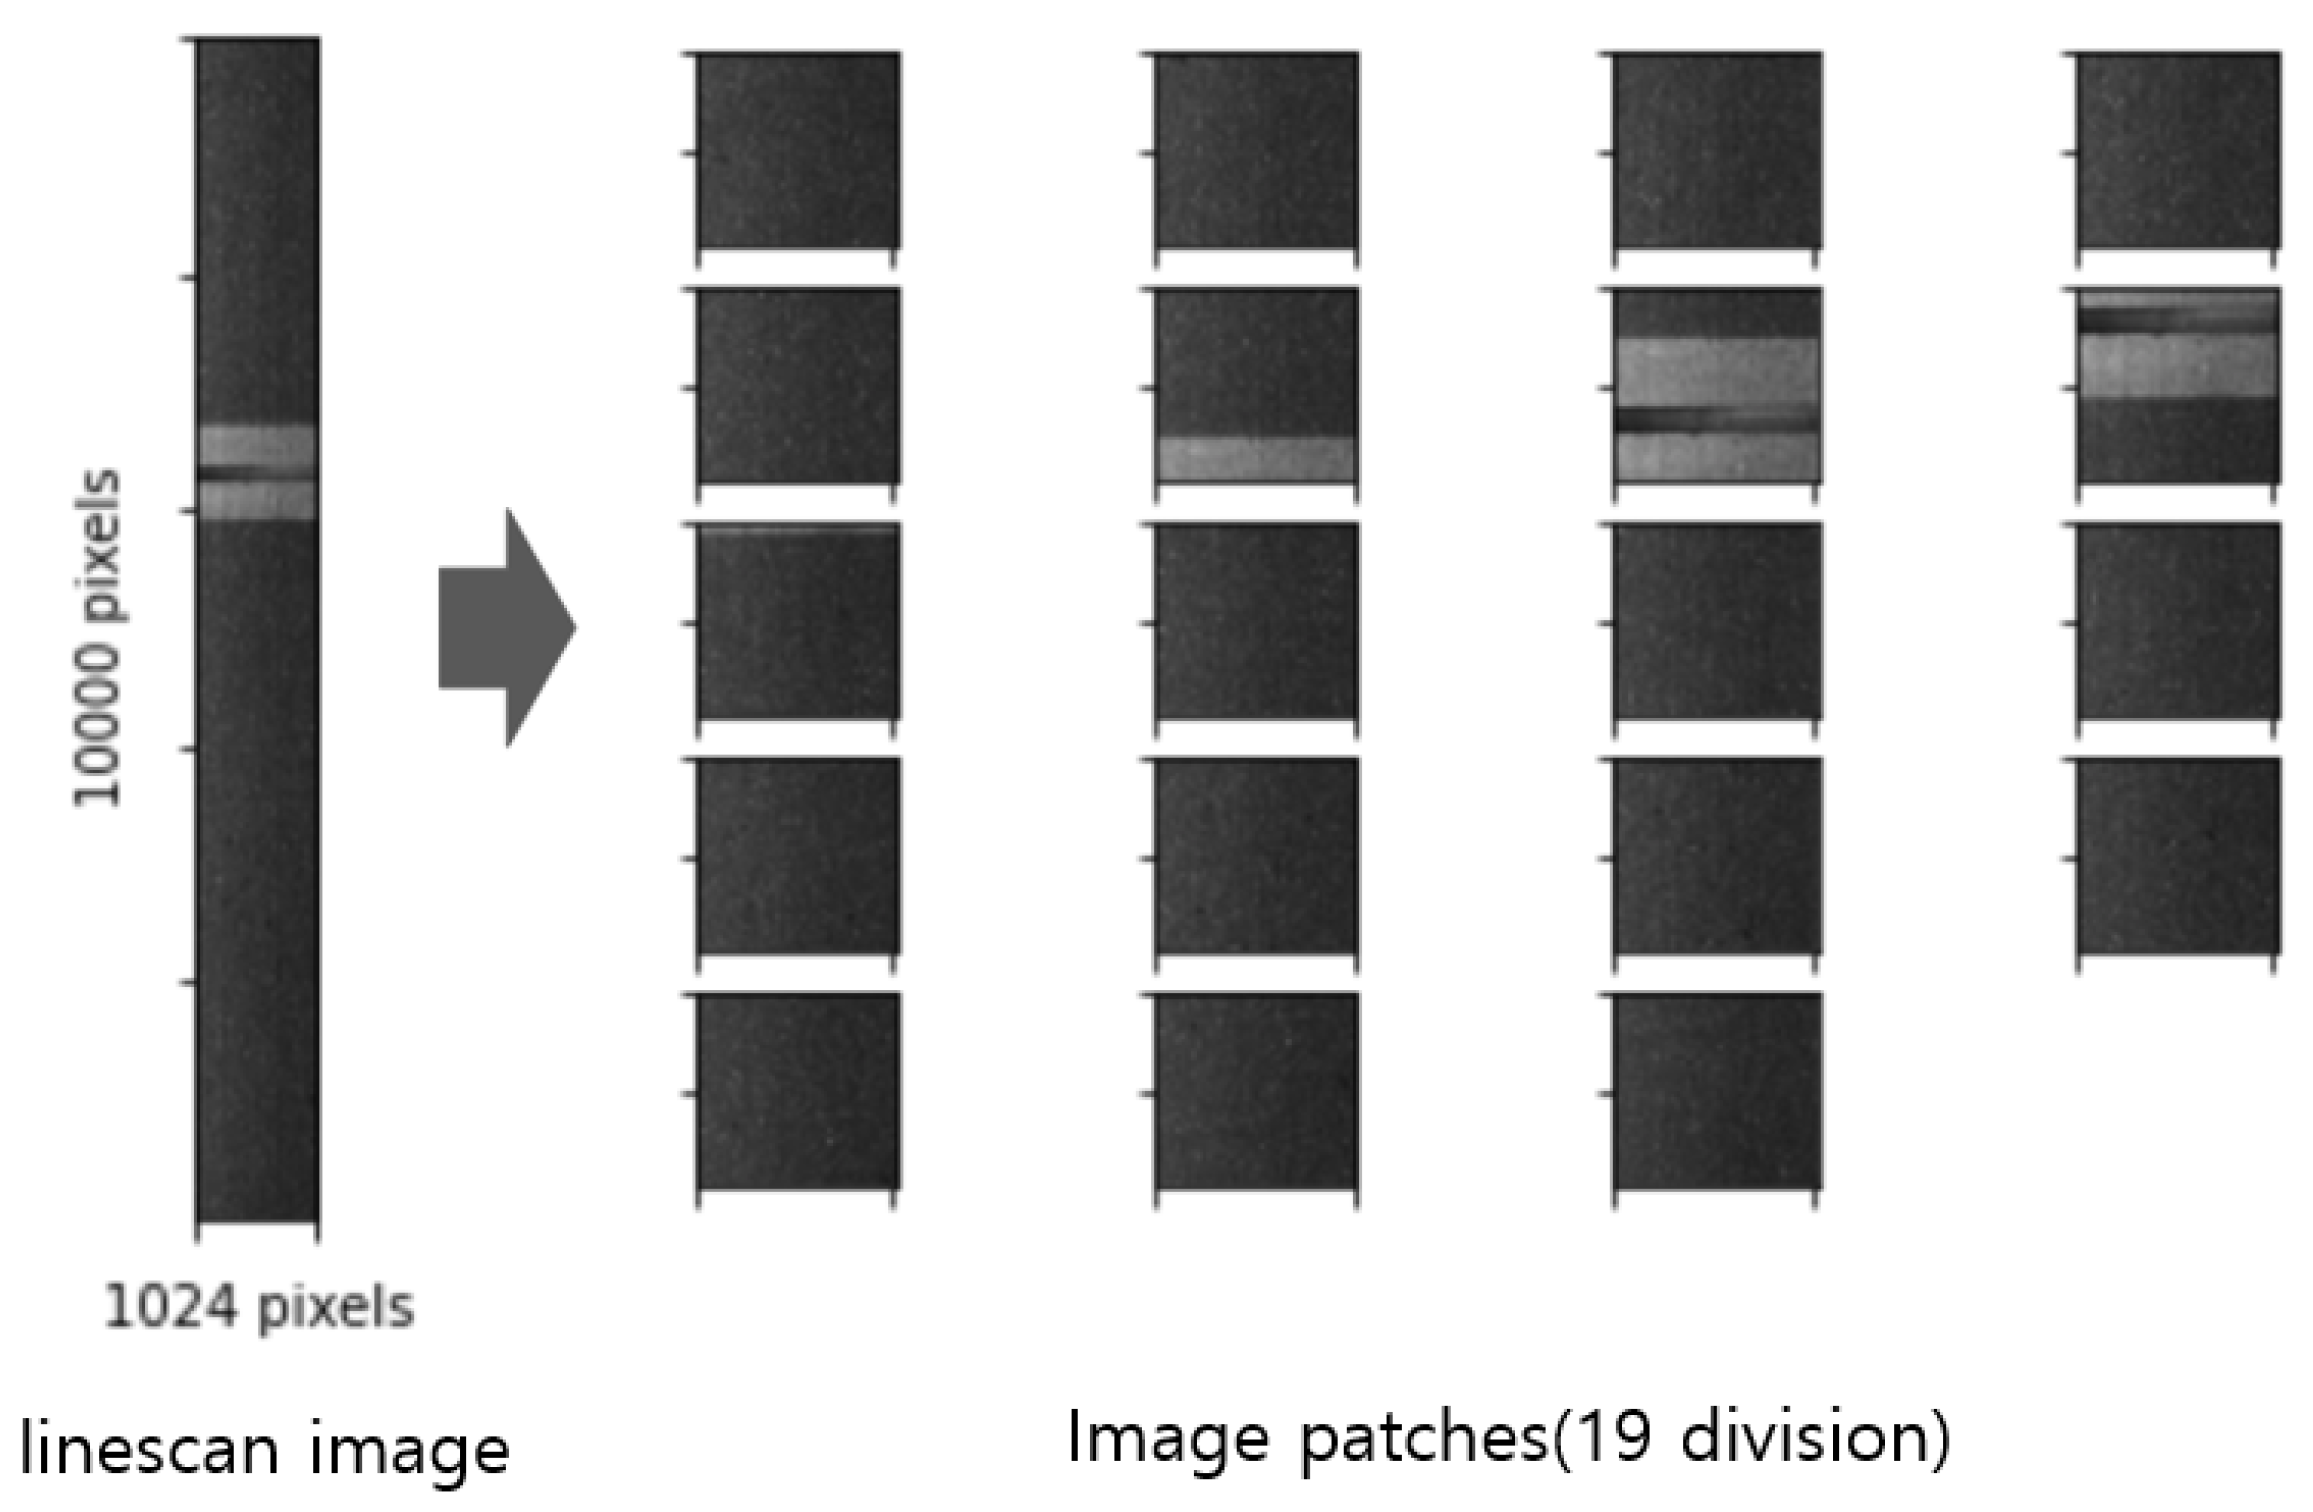
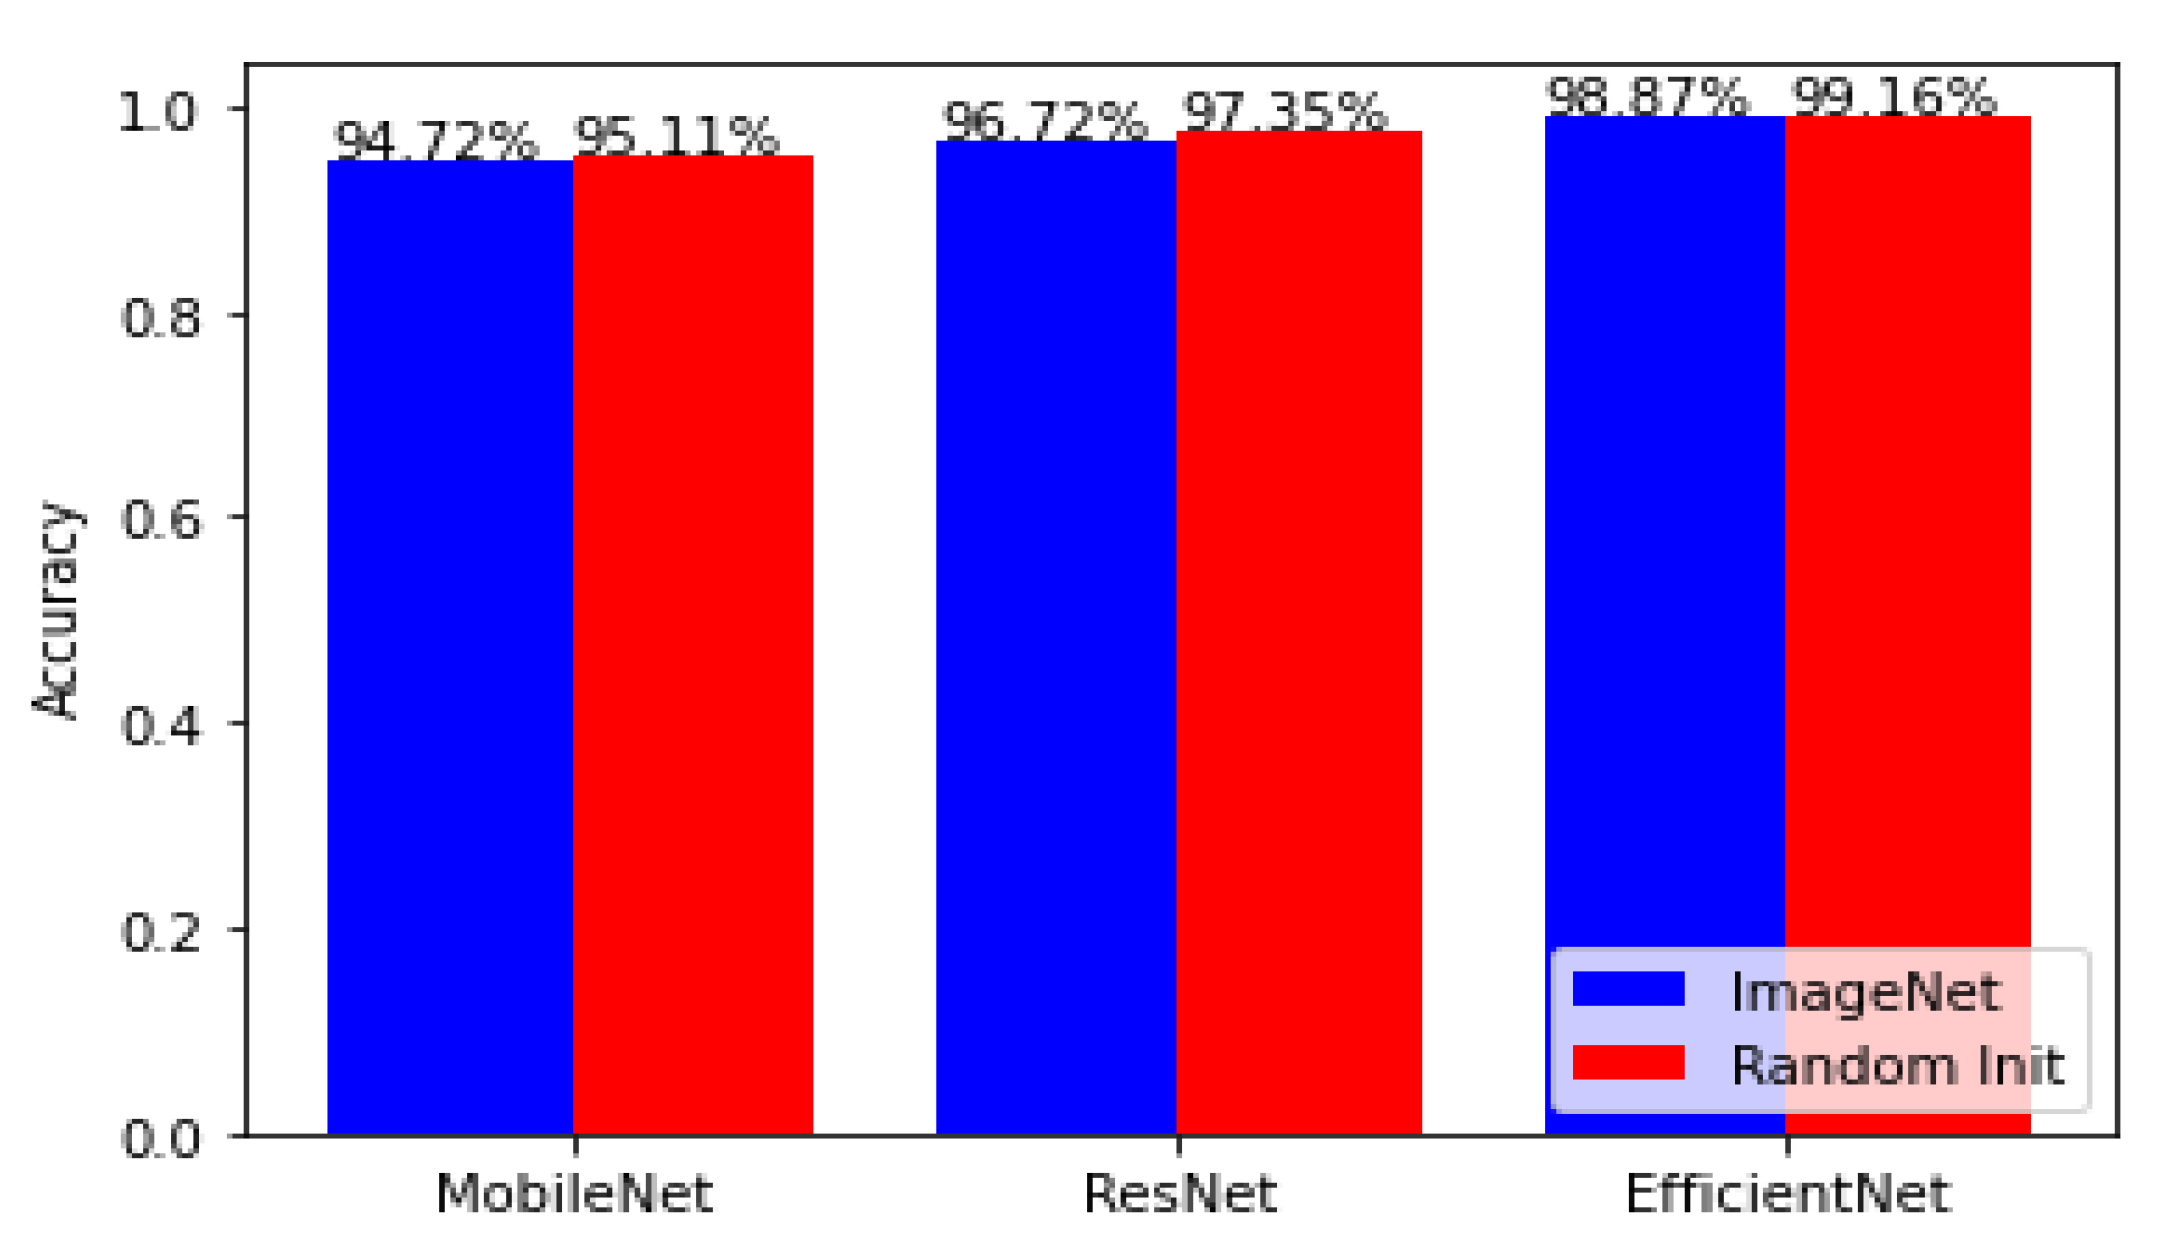
4.1. AI-Based Image Analysis

Line-scan images obtained using NEXUS were converted into high-resolution digital images with a length and width of 10,000 and 1024 pixels, respectively. The unit length (mm) of the pixels can be calculated by considering the vehicle speed at the time of the shooting. If the expansion joint device can be measured in pixels, the actual value of the gap distance can be inferred within the error range. Therefore, recognizing the position of the expansion joint device in the line-scan image using a program and accurately measuring the size of the gap in pixels determine the measurement accuracy.
To perform highly accurate analyses, a large number of line-scan images were trained using deep learning. To efficiently analyze high-resolution input images, cascade-type analysis procedures were configured. The analysis involved the following steps: (1) ultrafast line-scan image input, (2) extraction of small image patches in a square matrix, (3) recognition of expansion joint device among the image patches, (4) expansion gap division, and (5) gap distance analysis and actual value calculation (see Figure 9).

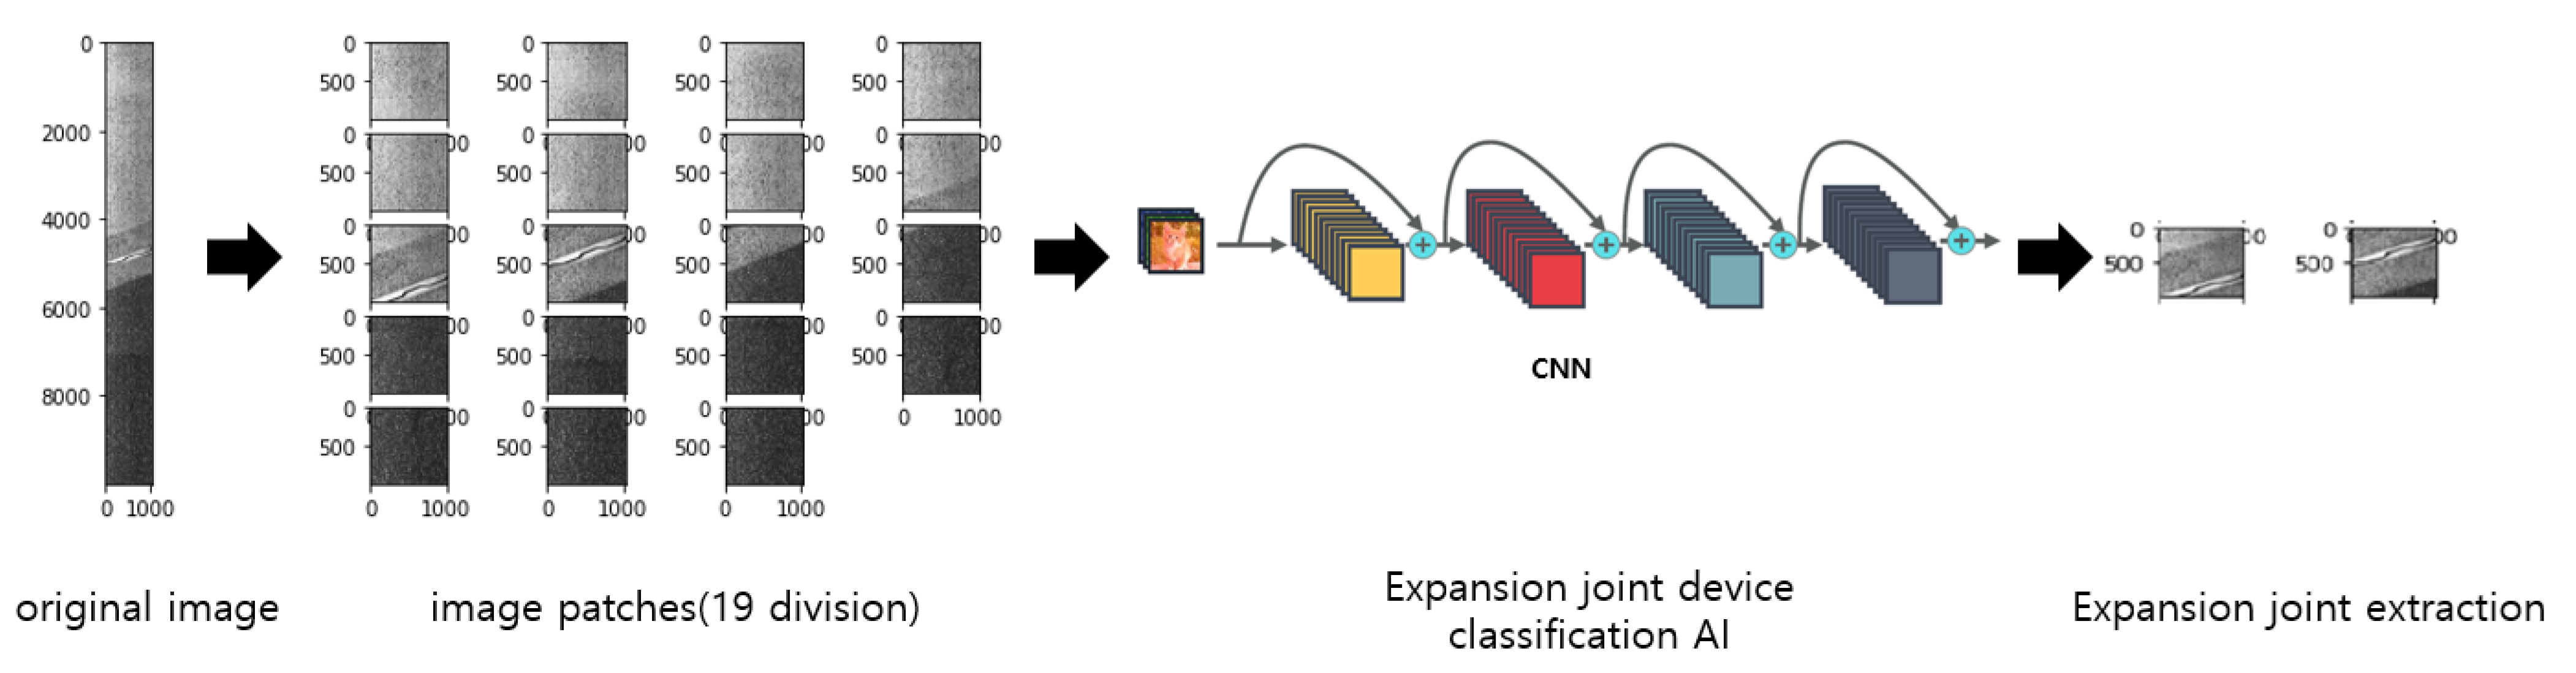
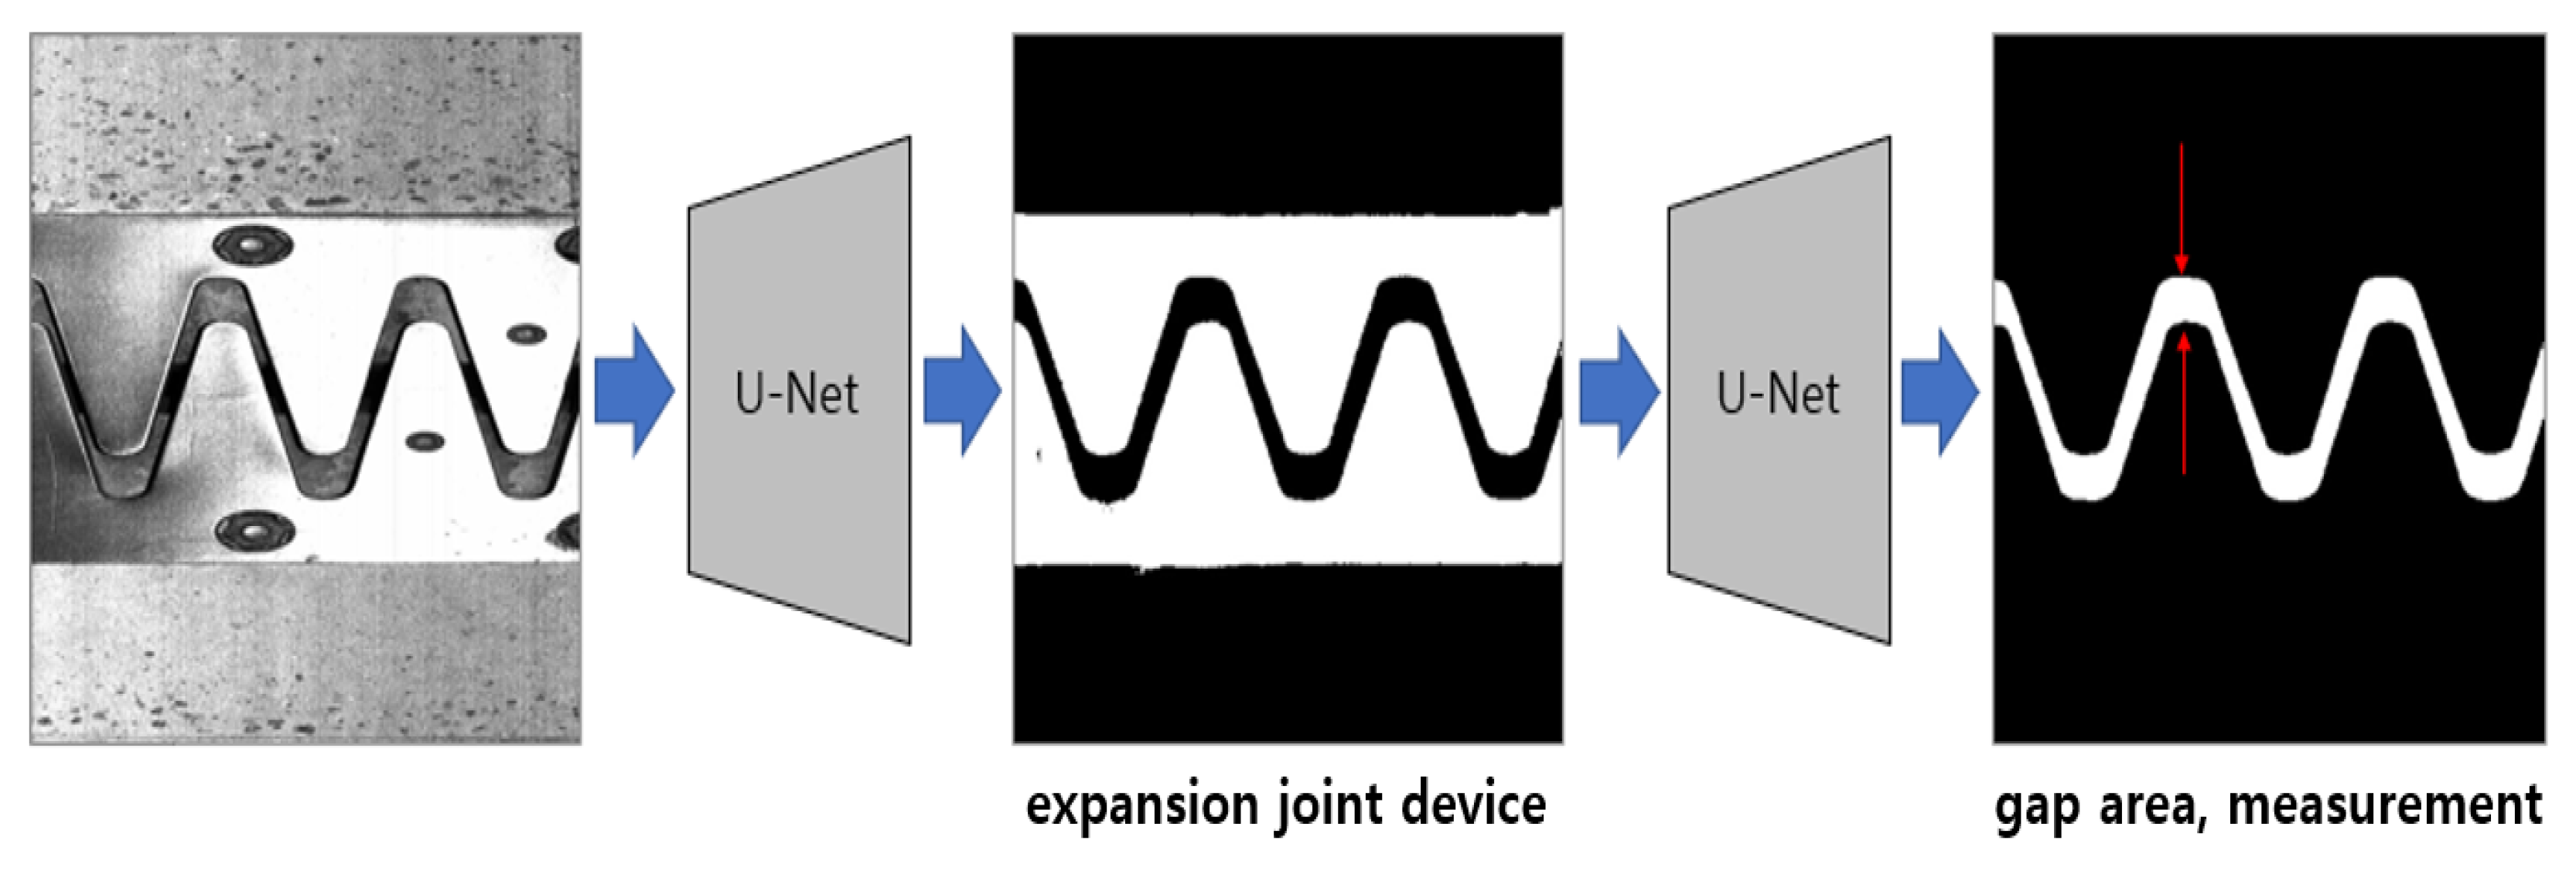
4.2. Expansion Joint Device Recognition

Line-scan images have a high resolution of more than 10,000,000 pixels and require considerable memory and computational resources when being analyzed using a deep neural network. Therefore, it is necessary to divide the image into small image patches for realizing effective computations. Through the window sliding method, images were extracted every 1000 pixels in the longitudinal direction to generate a total of 19 image patches with a size of 1000 × 1024 (see Figure 10). Each image patch is again converted to a size of 224 × 224 pixels and subjected to binary classification.
Each image patch is again converted to a size of 224 × 224 pixels for binary classification. By using a CNN, an effective neural network for image analysis, we labelled patches with the expansion joint device as y = 1 and patches without the expansion joint device as y = 0 and classified them by logistic regression. The logistic regression followed by CNN infers the probability P that there is an expansion joint in the image patch. The error of the model prediction for each image patch is calculated with binary cross entropy [64,65,66,67,68,69], which compares each of the predictions to the actual class, which can be either 0 or 1. The errors of each set of training data are summed up. In stochastic gradient methods [70,71,72,73,74,75,76,77], the cost and sum of errors is used to update current model parameters to reduce the distance from the optimal point in the parameter space. The equation of binary cross entropy is shown as follows:
L   =   y l o g P ( 1 y ) l o g ( 1 P )
Because class imbalance exists in a ratio of 1:9, a weight is assigned to each class.
L w e i g h t e d   =   ϵ × y l o g P μ × ( 1 y ) l o g ( 1 P )
where ϵ = 9.0   ,   μ   =   1.0 .
The cost function J is calculated by averaging the errors for N training data and adding the L2 regularization to reduce overfitting [78,79,80,81,82,83,84,85] of the model.
J   =   1 N j = 1 N L w e i g h t e d j + λ | w | 2
where λ = 10 4 .
The gradient descent method updates the model parameters in the direction of reducing the cost function J as follows:
w     w     α g  
where α = 10 4 , g = J w .
We tested ResNet, MobileNet, and EfficientNet, all of which are well-known CNN architectures [22,23,24]. Gradient vanishing is more likely to occur as the layers of the deep learning model deepen, and ResNet solved this problem by performing residual learning using skip connection. The structure obtained high accuracy compared to the scale of the model. MobileNet proposed a depth-wise separable convolution that reconstructed the existing convolution method to reduce the computational amount of the model. Compared to the popular models at the time of proposal, the amount of computation was significantly reduced, and the same accuracy was maintained. EfficientNet, which empirically reports a methodology to increase model complexity to improve performance, updated the state of the art for benchmark datasets.
We trained the three models to a binary classification of expansion joints and non-expansion joints (see Figure 11). Through the test, the EfficientNet model showed the highest performance, with recognition accuracy of 97.57% for the expansion joint device. Further, it was better to start learning from randomized initial parameters than through transfer learning for ImageNet. This is because the analysis image has different characteristics from the general characteristics of ImageNet. We employed EfficientNet for expansion joint detection, as it has the highest accuracy.

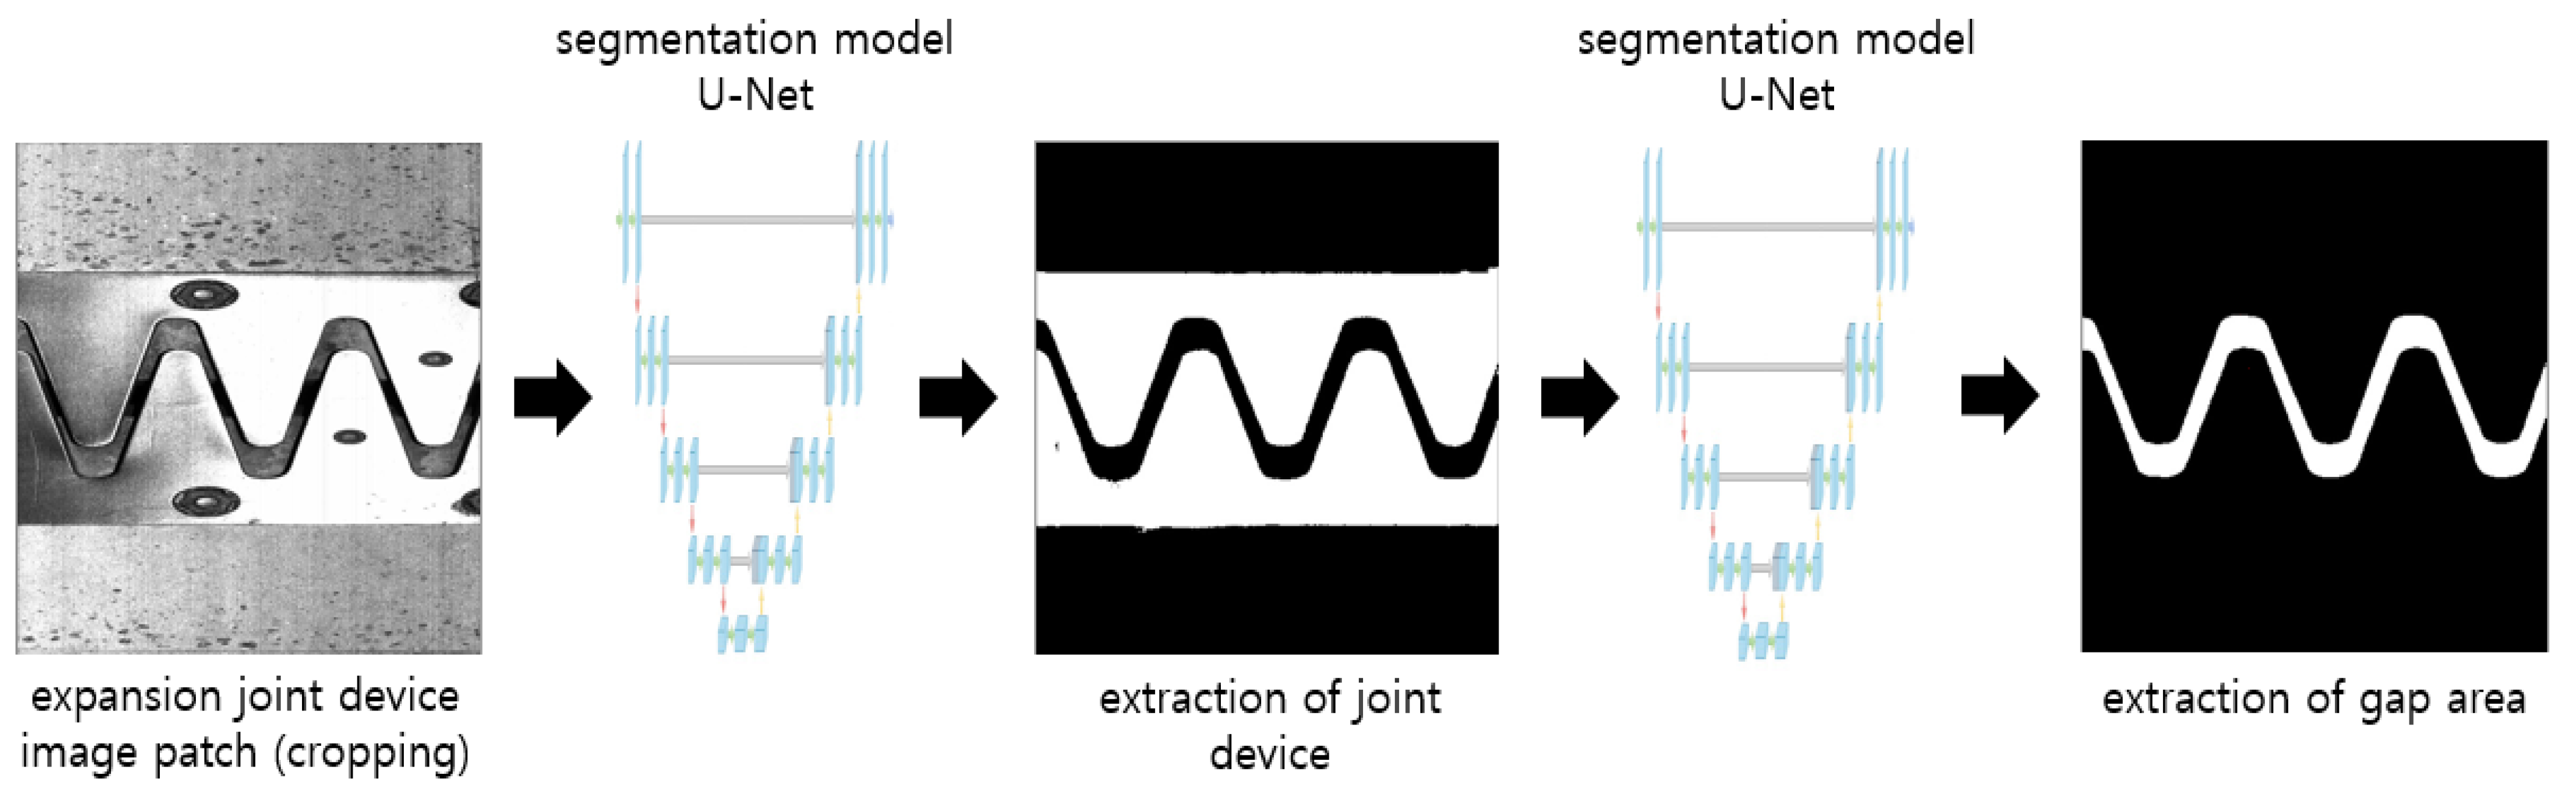
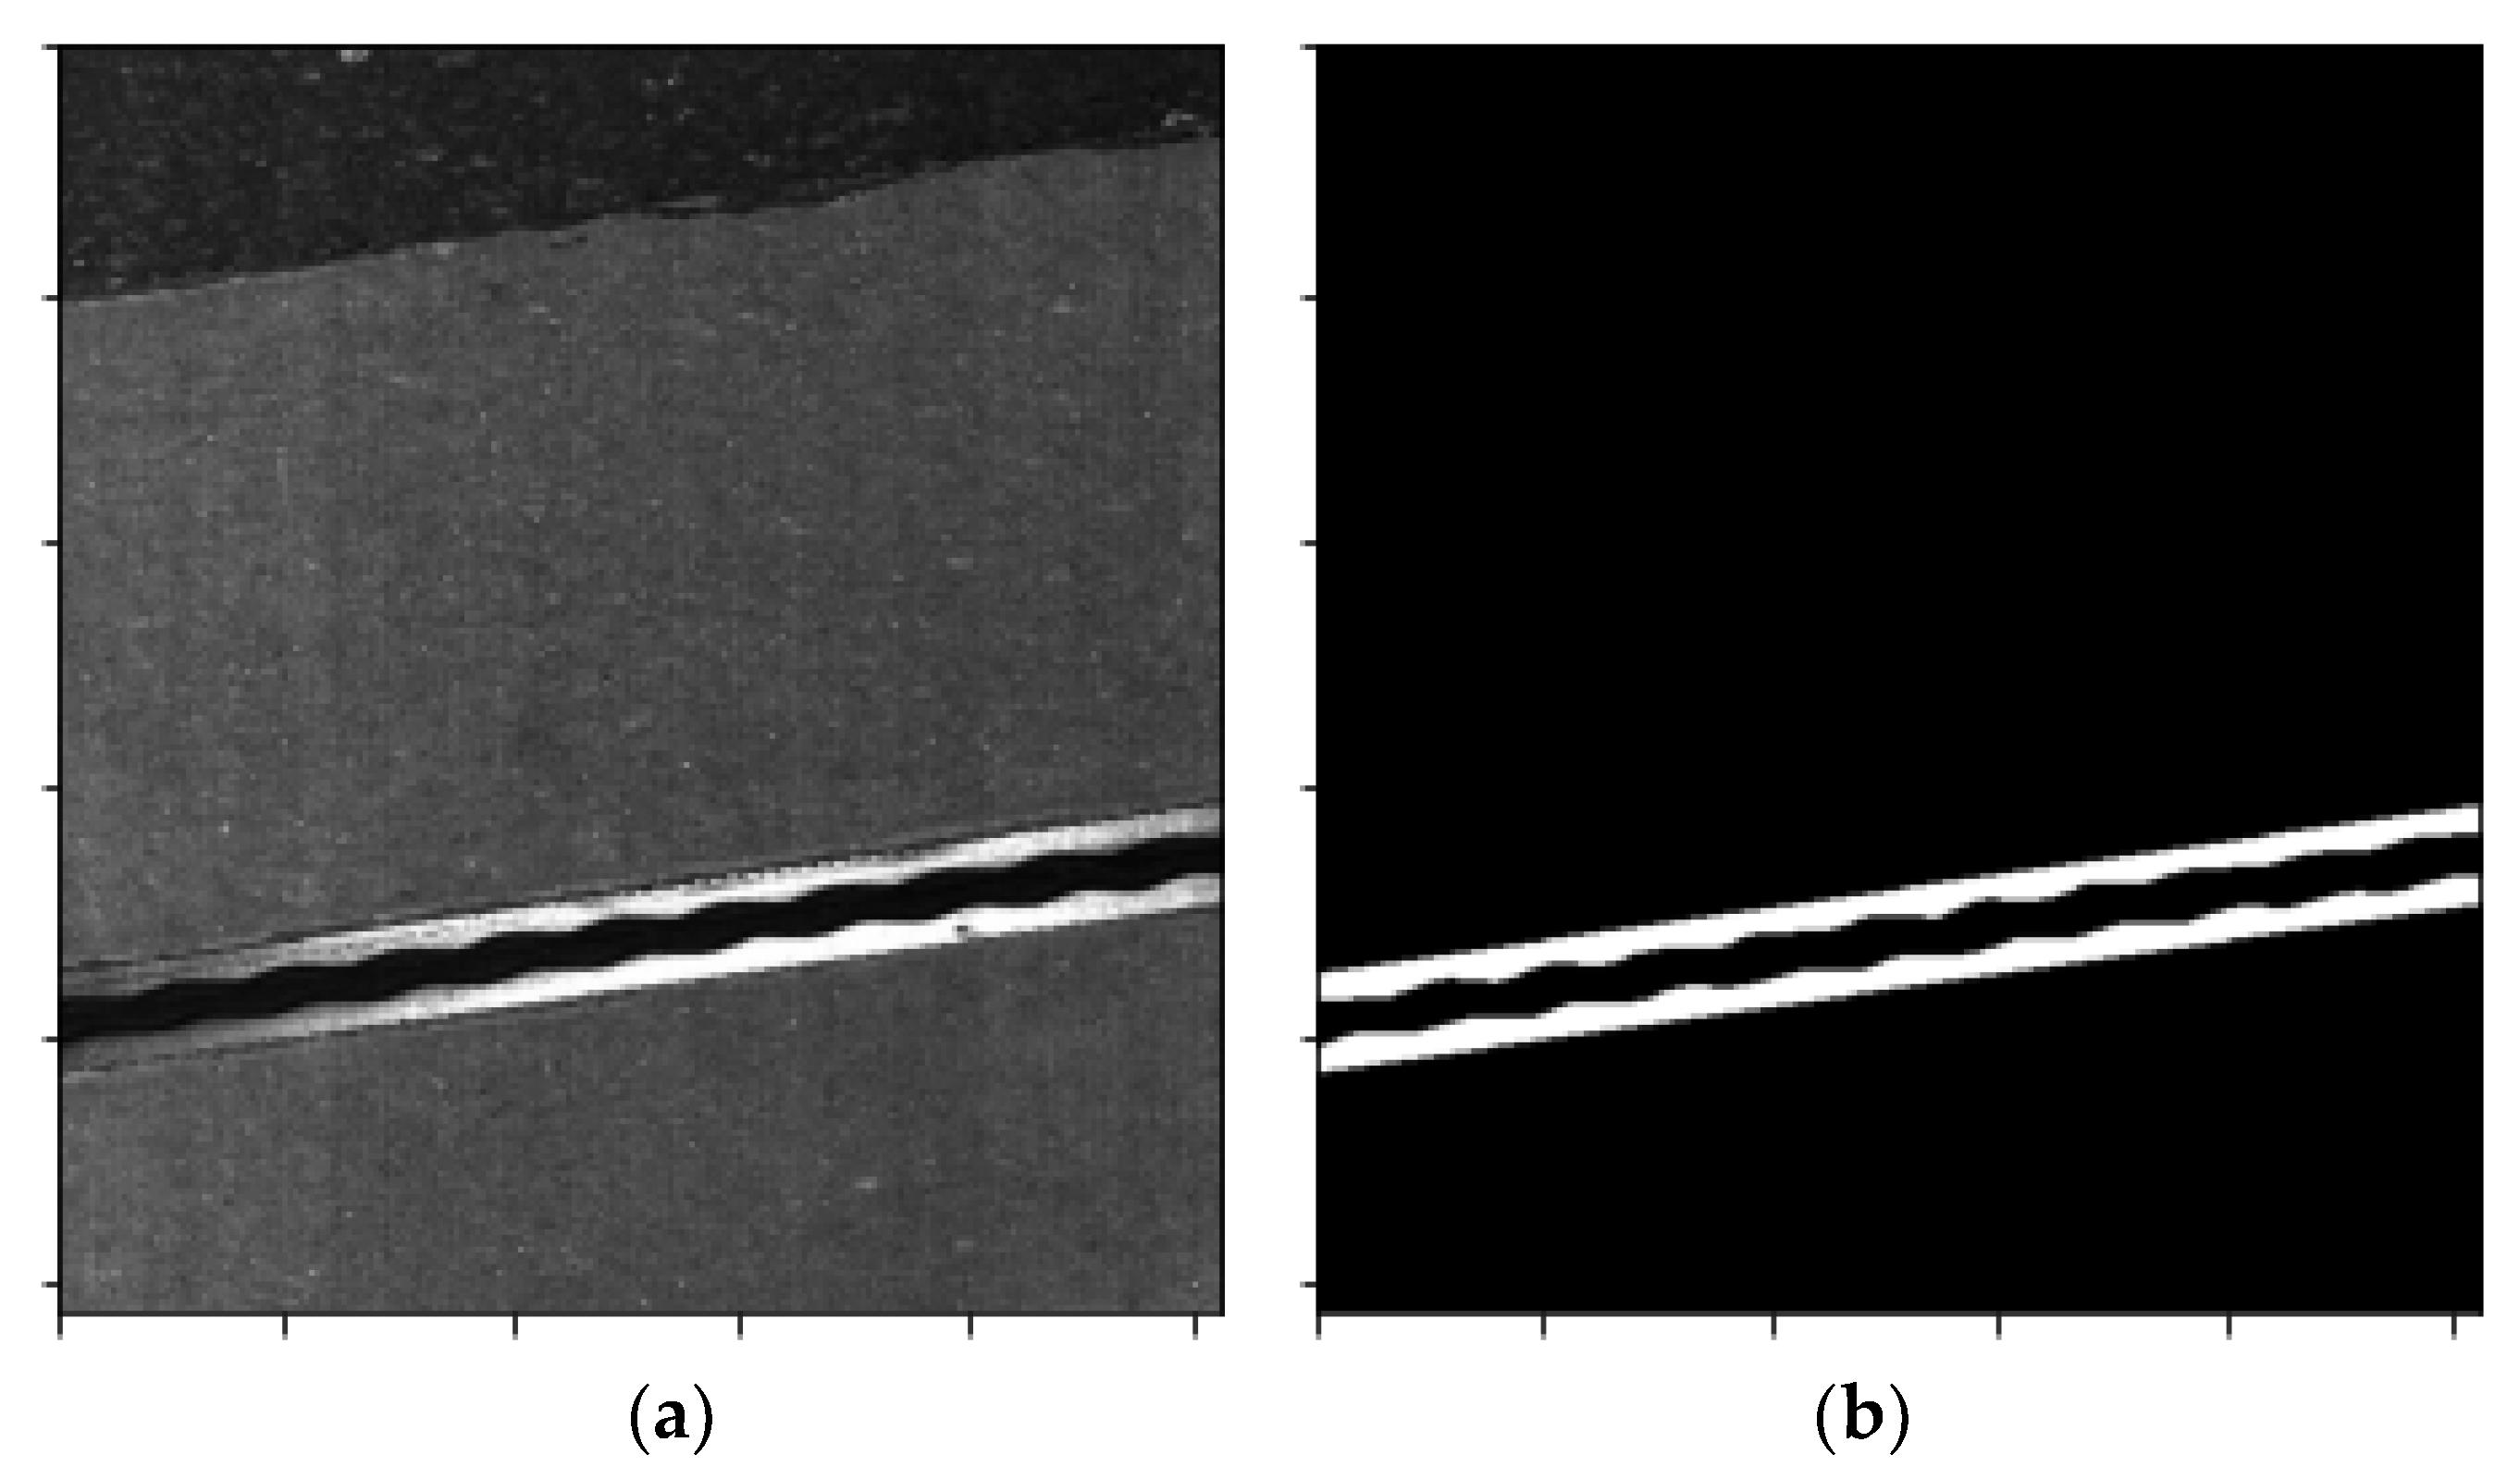
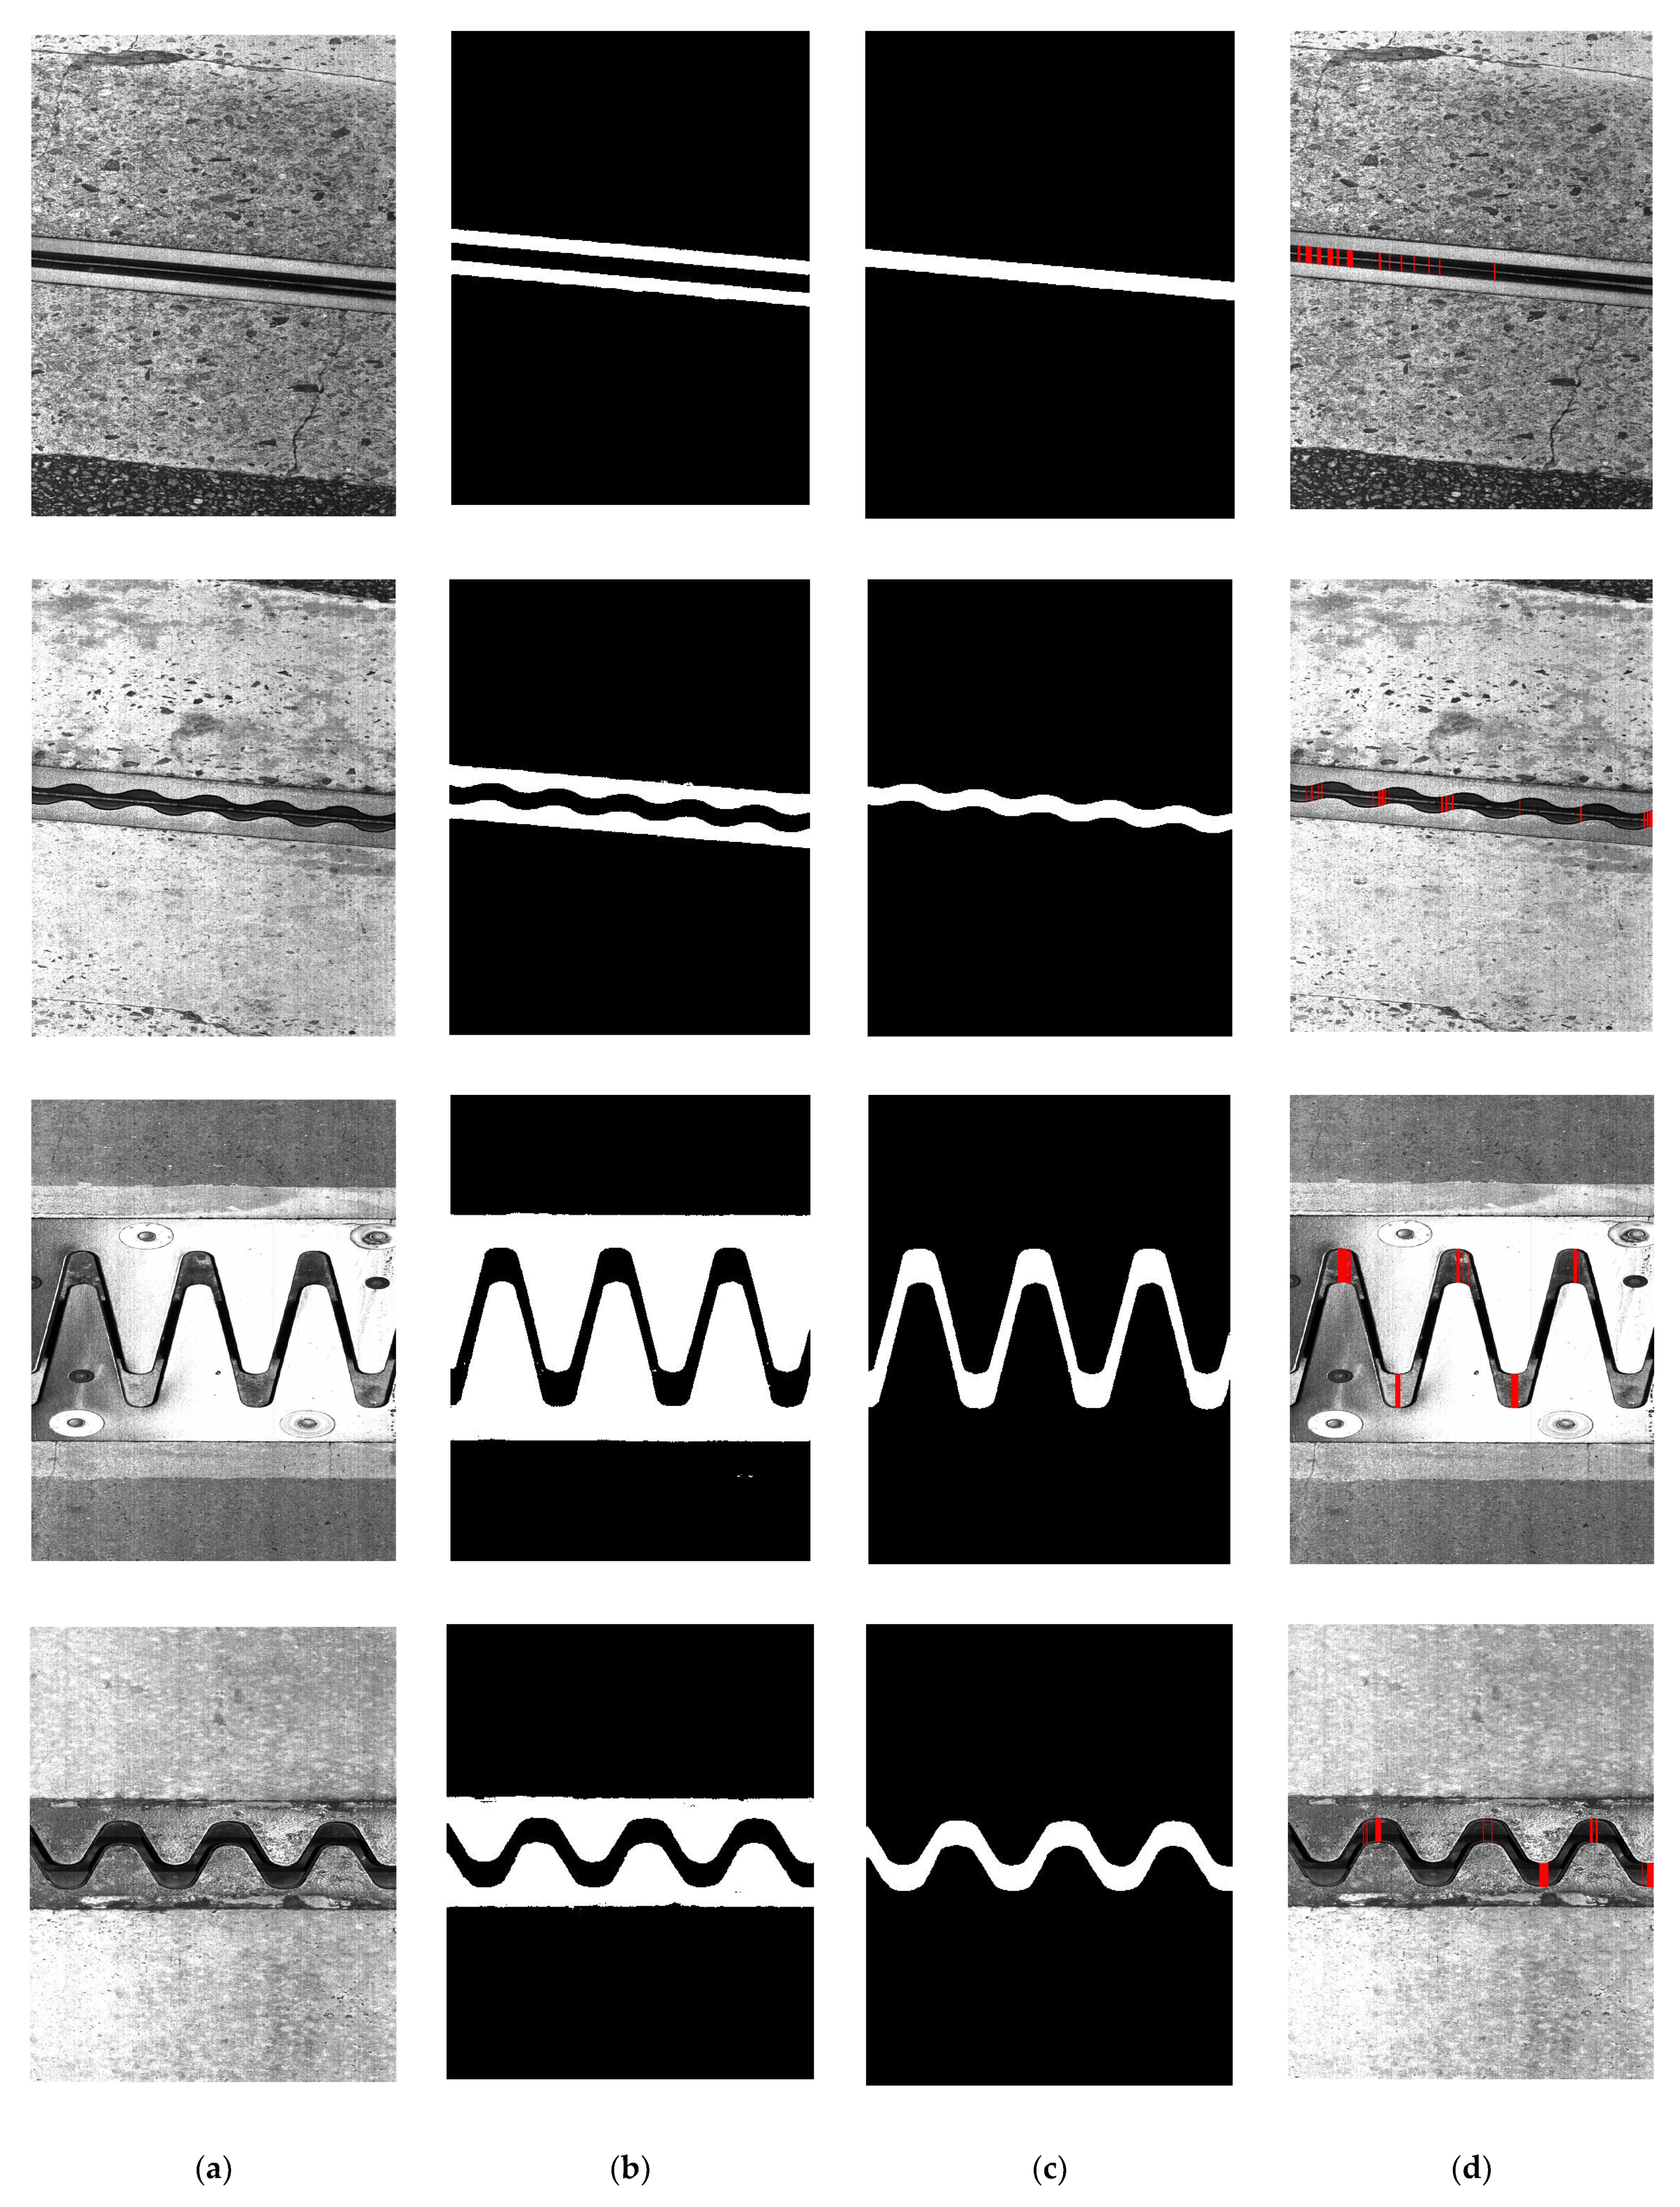
4.3. Expansion Joint Gap Segmentation

Even if the image patch of the expansion joint is extracted from the line-scan image, image segmentation is required within the detected image to accurately measure the expansion gap. Image segmentation is a pixel-level classification that deduces the class each pixel belongs to (i.e., expansion joint device or background). A masking image representing the pixel corresponding to the expansion joint device can be generated by the image segmentation algorithm.
Figure 12 shows the image patch (left) and correct mask (right) of the expansion joint device. The neural network structure receives image patches as an input and performs binary classification of the individual pixels. The deep learning model receives image patches as the input and learns to predict a masking that is close to the correct answer. In this case, the class of a pixel should be determined by considering the global and local characteristics of the image rather than individual pixel values.
This study uses a U-Net model, which was previously developed for sophisticated analyses of organ lesions in the field of biomedical science [36]. U-Net is suitable for the problem of precisely detecting the shape of the analysis target by simultaneously learning the global and local information of the image. The structure of U-Net was modified to develop EfficientNet, a neural network that extracts image information.
U-Net infers the probability that an arbitrary pixel is an expansion joint device and learns the correct answer for each pixel from the correct answer masking. Therefore, the prediction error for all pixels M of the image patch expressed as BCE is as follows:
L p a t c h =   L p i x e l = i = 1 M ( y i log P i ( 1 y i ) log ( 1 P i ) ) ,     i = 1 , 2 , 3 ,   ,   N
The final cost function J is expressed by summing the mean error for N image patches and the L2 regularization term:
J = 1 N j = 1 N ( L p a t c h j + λ | w | 2 )
where λ = 10 4 .
The gradient descent method updates model parameters in the direction of reducing the cost function J as follows:
w     w     α g  
where α   = 10 4 ,   g   =   J w .
We compared the performance between U-Net’s masking image and the correct masking image in the test dataset. Table 7 shows the pixel-level classification performance for the test set; the pixel precision of the expansion joint device was 96.61%, recall rate was 94.38%, and f1-score was 95.49%. The f1-score of the expansion joint device pixel detection was within 5%. In the post-processing process, by correcting the error of the predicted masking image of U-Net, the minimum gap point was detected, and the distance was measured.

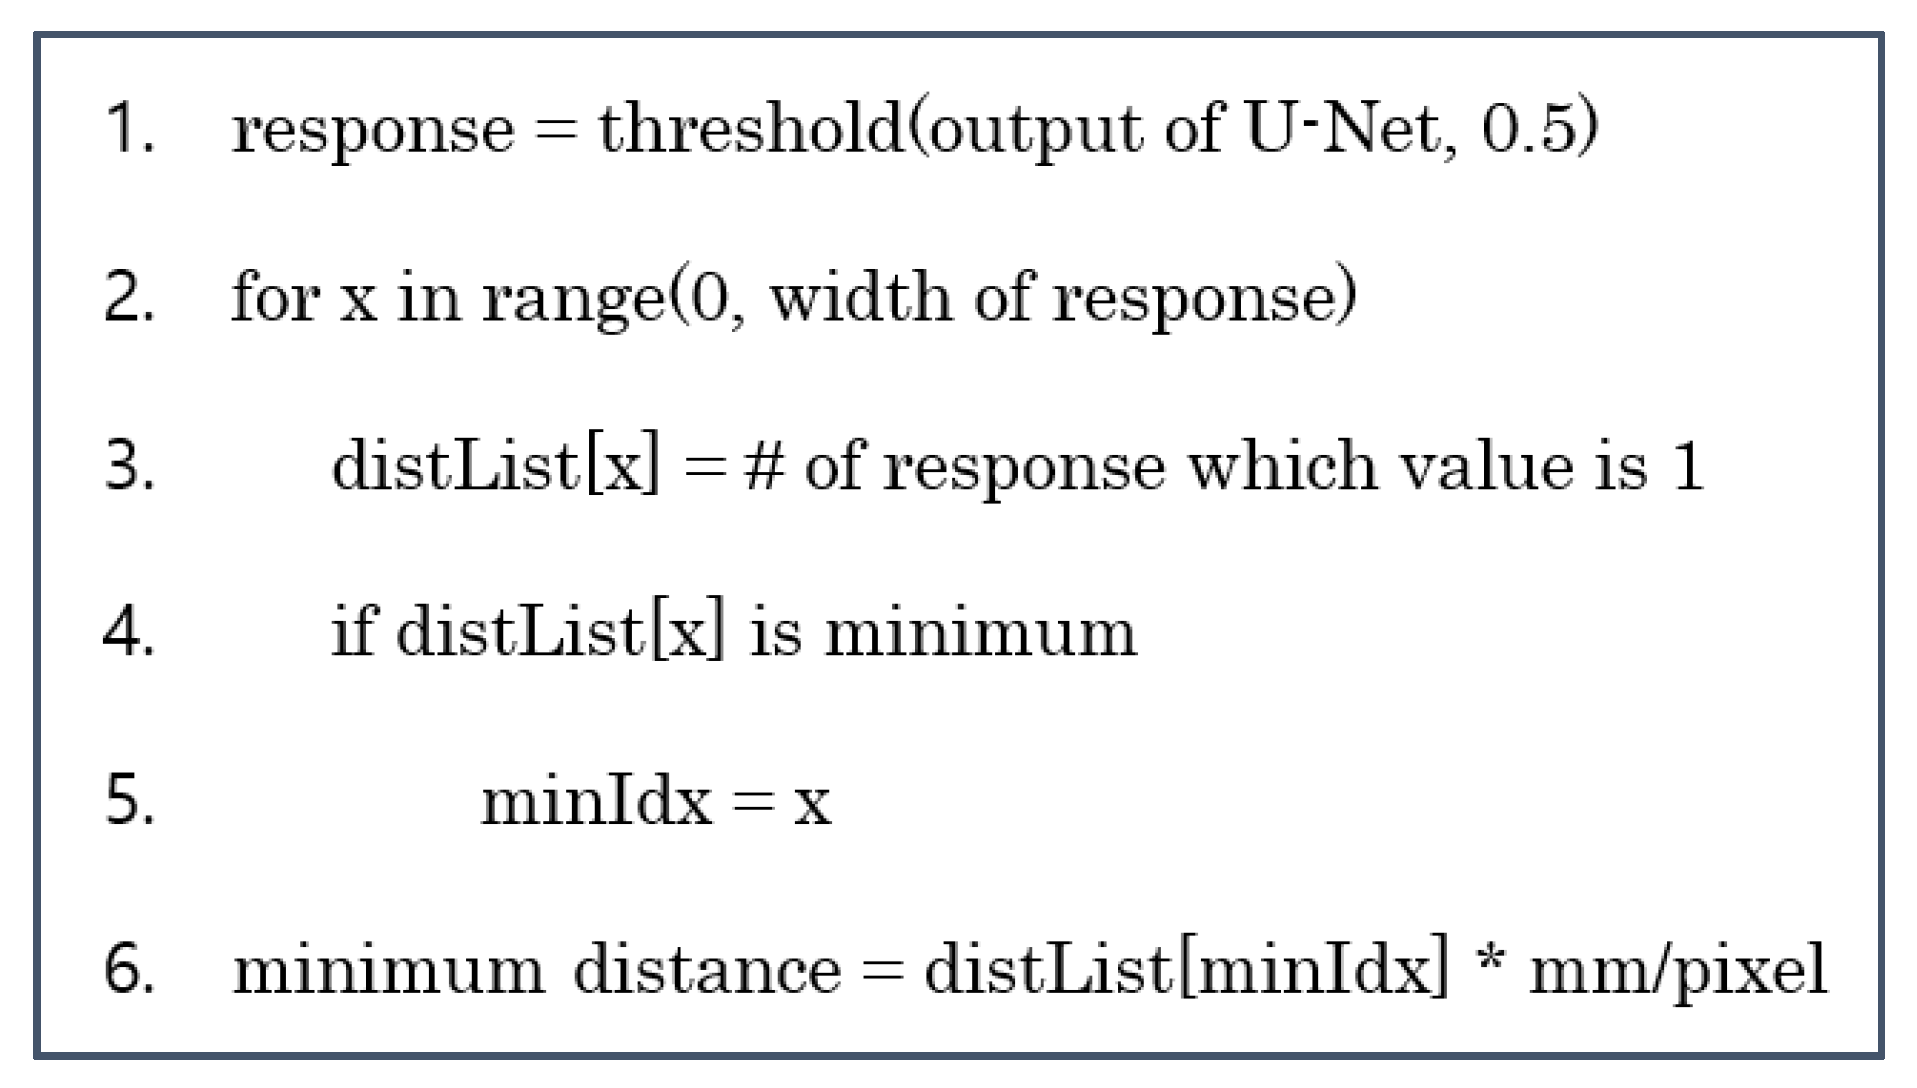
4.4. Gap Distance Analysis Algorithm

The texture of the pixels in the expansion gap area to be measured appears somewhat irregular depending on the gap, foreign matter, and type of expansion joint device. Texture irregularity is a factor that makes it difficult to distinguish pixels in the expansion gap area.
The metal surface constituting the expansion joint device has a consistent texture compared to the gap region. This means that it is easier to extract the expansion joint device than the gap area. Therefore, to analyze the gap distance, the expansion joint device is extracted first, and the gap area is extracted again from the resulting image. Image segmentation using U-Net was applied to both area extraction processes (see Figure 13).
Because the U-Net output represents the probability that each pixel is a gap area, binarization is performed by applying a threshold value of 0.5. When defining a binarization function as a response, the formula to search the x-coordinate of the minimum gap is as given below. Note that the same applies to rail-type expansion joint devices.
a r g   m i n 1 x 512 y = 1 512 r e s p o n s e ( x , y )
The input and output of the U-Net model have the size of 512 × 512. By binarizing the final output probability map, we search for the x-coordinate with the smallest number of pixels with a value of 1. The number of pixels at the coordinates is the gap distance in pixels, and the actual gap distance is obtained by multiplying the distance value per pixel.
( d i s t a n c e ) = ( #   o f   p i x e l ) * ( m m p i x )
Figure 14 shows the pseudocode for obtaining the minimum gap distance from the output probability map of U-Net.

4.5. Gap Identification Verification

Based on the abovementioned results of AI-based gap identification, we randomly selected 10,526 places among 12,825 expansion joint device big-data images obtained previously to determine the discrimination of the expansion joint device gap. After dividing and refining 10,526 line-scan images into 19 image patches, 289,495 sets of training data and 45,950 tests of the classification model were constructed. A total of 21,604 sets of training data and 4174 of test data of the segmentation model for measuring the expansion joint gap were refined. The results are presented below for each expansion joint device type. The result of the position where the minimum spacing was measured is indicated by a red line. For rail-type joints in which several gaps appear at once, the starting and end gaps of the part with the smallest actual gap value are indicated by red lines (see Figure 15).
We used Python 3 and TensorFlow 2 to implement and train a deep learning model using CNN, and development frameworks such as TensorFlow and PyTorch support libraries for implementing popular CNN layers and to support learning using GPUs.
We used a single NVIDIA Tesla V100 graphics card and Tensorflow to accelerate the training of the model. The EfficientNet B0 model for classification of expansion joints completed training in less than 30 epochs and took up to 4 h. A total of 259,495 training images and 30,000 validation images were used. Overall, 45,950 images for testing did not participate in the training. The U-Net model for gap region extraction completed training in less than 20 epochs and took up to 4 h, and 19,304 training images and 2300 validation images were used, while 4174 images for testing did not participate in the training.
In the environment for field application after training, one NVIDIA RTX 3070 graphics card and Tensorflow were used. In one line-scan image (1024 × 10,000), it took an average of 0.6 s to find the expansion joint and measure the gap.
After comparing the identification rate results from the existing traditional algorithm, we found that the finger type, which had the lowest discrimination accuracy, improved the most, by 41% to an accuracy of approximately 92%, and the overall average identification accuracy improved by 27.5% to 95%. Even though the identification accuracy was greatly improved, if a foreign substance existed inside the expansion gap, if a sealing agent was applied to the surface for preventing water leakage, if the body was damaged, and so on, these were included in the discriminant errors and manual correction would be required (see Table 8).

5. Conclusions

In this research, an automatic-image-recognition-based survey system was established on road bridges and was successfully verified through field tests. In order to ensure 1.0 mm resolution performance per pixel in a high-speed (100 km/h) environment, M/V technology using a line-scan camera was used, and accurate images could be obtained almost in real time as a result of the test. Line-scan camera technology advances rapidly, so using a better camera could further improve system performance.
Technological advances will promote the implementation of the M/V system and lower maintenance costs. Therefore, one contribution of this research is providing a solution that can apply the M/V system to road maintenance using line-scan cameras.
A survey system equipped with line-scan cameras, GPS, and DMI was designed to perform automatic investigation when accessing the bridge while driving at high speeds. The use of NEXUS for performing automatic surveys of the bridge expansion joint device gap while driving at high speed reduces the survey time by more than 95%, from an average of approximately 1 h/bridge (existing manual inspection method by an inspector) to approximately 3 min/bridge. In addition, if the accumulated gap data is monitored and preemptive maintenance is performed before gap narrowing (lack of joint gap) occurs, it can eliminate the risk factors in the future temperature expansion behavior of the bridge and contribute to traffic safety and cost reductions. This is the second contribution.
Measuring the bridge expansion joint gap through survey images has limitations in traditional algorithmic methods. Images with various objects on the road surface and shapes of various expansion joint devices are similar to big data. Therefore, by creating an algorithm by artificial intelligence technology (machine learning), more accurate survey values can be stably obtained. The machine learning model for searching for expansion joint devices in survey images used Resnet as a feature extractor, and the representative segmentation model for searching for the gap area used U-Net. These were used to solve the classification problem. Testing with a random selection of 10,526 previously acquired big data images indicated that the expansion gap identification accuracy was improved by 27.5%, from 67.5% to 95.0%. This is another contribution.
However, the main contribution of this study is to demonstrate the possibility of developing smart maintenance techniques for road structures, in other words, the successful development of a smart maintenance system that combines machine vision and machine learning technology that serves the following purposes: first, to ensure the traffic safety of vehicles on roads that are already in us; and second, to obtain the condition of road structures at the level the investigator wants with figures and accurate images. This requires satisfaction with vehicle traffic, customer safety, investigator convenience, and traffic safety, so we believe that developing road maintenance technology should consider much more complex problems than developing smart construction technology.
If this study intensifies in the future, we will be able to create a wider variety of smart road maintenance systems based on this concept and our imagination.

Author Contributions

Supervision, investigation, data creation, writing—original draft preparation, and writing—review and editing, I.B.K.; conceptualization, J.S.C. and G.S.Z.; software, formal analysis, validation, and data curation, B.S.C., S.M.L. and H.U.K. All authors have read and agreed to the published version of the manuscript.

Funding

This research received no external funding.

Institutional Review Board Statement

Not applicable.

Informed Consent Statement

Not applicable.

Conflicts of Interest

The authors declare no conflict of interest.

References

  1. In Bae, K.; Byung Ju, L.; Chang Ho, P. Development of Behavior Evaluation Method for Bridge Expansion Joints Based on Ultrafast Laser Line Scanning System; The Korea Expressway Corporation Research Institute: Hwaseong-si, Korea, 2018; OTKCRK190185. [Google Scholar]
  2. Hyun Ho, C.; In Bae, K.; Hong Sam, K.; Yu Sung, S. A Study on Proper Construction and Management Standards for Bridge Expansion Joints to Cope with Lack of Joint-Gap; The Korea Expressway Corporation Research Institute: Hwaseong-si, Korea, 2020; OTKCRK210798. [Google Scholar]
  3. Spuler, T.; Loehrer, R.; O’Suilleabhain, C. Life-cycle considerations in the selection and design of bridge expansion joints. In Proceedings of the IABSE Congress on Innovative Infrastructures towards Human Urbanism, Seoul, Korea, 19–21 September 2012. [Google Scholar]
  4. Moor, G.; Meng, N.; O’Suilleabhain, C. Remote structural health monitoring systems for bridge expansion joints and bearings. In Proceedings of the 2nd Conference on Smart Monitoring Assessment and Rehabilitation of Civil Structures, Istanbul, Turkey, 9–11 September 2013. [Google Scholar]
  5. Joo, O.; Hyun Sup, S.; Sang Suk, L.; Hu Seung, K. Bridge Expansion Joint Design and Construction; CIR: Seoul, Korea, 2015. [Google Scholar]
  6. Korea Expressway Corporation. Technical Advisory Case Book (Bridge Support and Expansion Joint Device); Korea Expressway Corporation: Gimcheon-si, Korea, 2008. [Google Scholar]
  7. Korea Expressway Corporation. Expressway Construction Professional Specifications/Civil Edition; Korea Expressway Corporation: Gimcheon-si, Korea, 2017. [Google Scholar]
  8. Steger, C.; Ulrich, M.; Wiedemann, C. Machine Vision Algorithms and Applications, 2nd ed.; Wiley-VCH: Weinheim, Germany, 2018; p. 1. ISBN 978-3-527-41365-2. [Google Scholar]
  9. Beyerer, J.; León, F.P.; Frese, C. Machine Vision—Automated Visual Inspection: Theory, Practice and Applications; Springer: Berlin/Heidelberg, Germany, 2016; ISBN 978-3-662-47793-9. [Google Scholar] [CrossRef]
  10. Graves, M.; Batchelor, B. Machine Vision for the Inspection of Natural Products; Springer: Berlin/Heidelberg, Germany, 2003; p. 5. ISBN 978-1-85233-525-0. [Google Scholar]
  11. Holton, W.C. By Any Other Name. Vis. Syst. Des. 2010, 15, 1089–3709. [Google Scholar]
  12. Turek, F.D. Machine Vision Fundamentals, How to Make Robots See. NASA Tech. Briefs 2011, 35, 60–62. [Google Scholar]
  13. Zhuang, H.; Raghavan, S. Development of a machine vision laboratory. Age 2003, 8, 1. [Google Scholar]
  14. Belbachir, A.N. (Ed.) Smart Cameras; Springer: Berlin/Heidelberg, Germany, 2009; ISBN 978-1-4419-0952-7. [Google Scholar]
  15. Dechow, D. Explore the Fundamentals of Machine Vision: Part 1. Vis. Syst. Des. 2013, 18, 14–15. [Google Scholar]
  16. Wilson, A. The Infrared Choice. Vis. Syst. Des. 2011, 16, 20–23. [Google Scholar]
  17. Jang, J.; Shin, M.; Lim, S.; Park, J.; Kim, J.; Paik, J. Intelligent image-based railway inspection system using deep learning-based object detection and weber contrast-based image comparison. Sensors 2019, 19, 4738. [Google Scholar] [CrossRef] [Green Version]
  18. Li, L.; Luo, W.T.; Wang, K.C.P. Lane marking detection and reconstruction with line-scan imaging data. Sensors 2018, 18, 1635. [Google Scholar] [CrossRef] [Green Version]
  19. Wendel, A.; Underwood, J. Extrinsic Parameter Calibration for Line Scanning Cameras on Ground Vehicles with Navigation Systems Using a Calibration Pattern. Sensors 2017, 17, 2491. [Google Scholar] [CrossRef] [Green Version]
  20. Lopes, G.; Ribeiro, A.; Sillero, N.; Gonçalves-Seco, L.; Silva, C.; Franch, M.; Trigueiros, P. High Resolution Trichromatic Road Surface Scanning with a Line Scan Camera and Light Emitting Diode Lighting for Road-Kill Detection. Sensors 2016, 16, 558. [Google Scholar] [CrossRef] [Green Version]
  21. Chien, J.-C.; Wu, M.-T.; Lee, J.-D. Inspection and Classification of Semiconductor Wafer Surface Defects Using CNN Deep Learning Networks. Appl. Sci. 2020, 10, 5340. [Google Scholar] [CrossRef]
  22. Wang, J.; Lee, S. Data Augmentation Methods Applying Grayscale Images for Convolutional Neural Networks in Machine Vision. Appl. Sci. 2021, 11, 6721. [Google Scholar] [CrossRef]
  23. Chen, A.; Orlov-Levin, V.; Meron, M. Applying High-Resolution Visible-Channel Aerial Scan of Crop Canopy to Precision Irrigation Management. Proceedings 2018, 2, 335. [Google Scholar] [CrossRef] [Green Version]
  24. Amziane, A.; Losson, O.; Mathon, B.; Dumenil, A.; Macaire, L. Reflectance Estimation from Multispectral Linescan Acquisitions under Varying Illumination—Application to Outdoor Weed Identification. Sensors 2021, 21, 3601. [Google Scholar] [CrossRef] [PubMed]
  25. Wu, N.; Haruyama, S. The 20k Samples-Per-Second Real Time Detection of Acoustic Vibration Based on Displacement Estimation of One-Dimensional Laser Speckle Images. Sensors 2021, 21, 2938. [Google Scholar] [CrossRef] [PubMed]
  26. Tzu, F.-M.; Chen, J.-S.; Hsu, S.-H. Light Emitted Diode on Detecting Thin-Film Transistor through Line-Scan Photosensor. Micromachines 2021, 12, 434. [Google Scholar] [CrossRef] [PubMed]
  27. Kim, H.; Choi, Y. Autonomous Driving Robot That Drives and Returns along a Planned Route in Underground Mines by Recognizing Road Signs. Appl. Sci. 2021, 11, 10235. [Google Scholar] [CrossRef]
  28. Xu, D.; Qi, X.; Li, C.; Sheng, Z.; Huang, H. Wise Information Technology of Med: Human Pose Recognition in Elderly Care. Sensors 2021, 21, 7130. [Google Scholar] [CrossRef]
  29. Goodfellow, I.; Bengio, Y.; Courville, A. Deep Learning; MIT Press: Cambridge, MA, USA, 2016. [Google Scholar]
  30. Tamuly, S.; Jyotsna, C.; Amudha, J. Deep learning model for image classification. In Proceedings of the International Conference on Computational Vision and Bio-Inspired Computing, Coimbatore, India, 25–26 September 2019; Springer: Cham, Switzerland, 2019. [Google Scholar]
  31. Liu, L.; Ouyang, W.; Wang, X.; Fieguth, P.; Chen, J.; Liu, X.; Pietikäinen, M. Deep Learning for Generic Object Detection: A Survey. Int. J. Comput. Vis. 2020, 128, 261–318. [Google Scholar] [CrossRef] [Green Version]
  32. Lateef, F.; Ruichek, Y. Survey on semantic segmentation using deep learning techniques. Neurocomputing 2019, 338, 321–348. [Google Scholar] [CrossRef]
  33. Russakovsky, O.; Deng, J.; Su, H.; Krause, J.; Satheesh, S.; Ma, S.; Huang, Z.; Karpathy, A.; Khosla, A.; Bernstein, M.; et al. Imagenet large scale visual recognition challenge. Int. J. Comput. Vis. 2015, 115, 211–252. [Google Scholar] [CrossRef] [Green Version]
  34. Howard, A.G.; Zhu, M.; Chen, B.; Kalenichenko, D.; Wang, W.; Weyand, T.; Andreetto, M.; Adam, H. Mobilenets: Efficient convolutional neural networks for mobile vision applications. arXiv 2017, arXiv:1704.04861. [Google Scholar]
  35. Tan, M.; Le, Q. Efficientnet: Rethinking model scaling for convolutional neural networks. In Proceedings of the International Conference on Machine Learning, PMLR, Long Beach, CA, USA, 9–15 June 2019. [Google Scholar]
  36. Ronneberger, O.; Fischer, P.; Brox, T. U-net: Convolutional networks for biomedical image segmentation. In Proceedings of the International Conference on Medical Image Computing and Computer-Assisted Intervention, Munich, Germany, 5–9 October 2015; Springer: Cham, Switzerland, 2015. [Google Scholar]
  37. Dreiseitl, S.; Ohno-Machado, L. Logistic regression and artificial neural network classification models: A methodology review. J. Biomed. Inform. 2002, 35, 352–359. [Google Scholar] [CrossRef] [Green Version]
  38. Long, J.; Shelhamer, E.; Darrell, T. Fully convolutional networks for semantic segmentation. In Proceedings of the IEEE Conference on Computer Vision and Pattern Recognition, Boston, MA, USA, 7–12 June 2015. [Google Scholar]
  39. Noh, H.; Hong, S.; Han, B. Learning deconvolution network for semantic segmentation. In Proceedings of the IEEE International Conference on Computer Vision, Santiago, Chille, 7–13 December 2015. [Google Scholar]
  40. Badrinarayanan, V.; Kendall, A.; Cipolla, R. SegNet: A Deep Convolutional Encoder-Decoder Architecture for Image Segmentation. IEEE Trans. Pattern Anal. Mach. Intell. 2017, 39, 2481–2495. [Google Scholar] [CrossRef]
  41. Chen, L.-C.; Papandreou, G.; Kokkinos, I.; Murphy, K.; Yuille, A.L. DeepLab: Semantic Image Segmentation with Deep Convolutional Nets, Atrous Convolution, and Fully Connected CRFs. IEEE Trans. Pattern Anal. Mach. Intell. 2018, 40, 834–848. [Google Scholar] [CrossRef] [PubMed]
  42. Hartung, J.; Jahn, A.; Bocksrocker, O.; Heizmann, M. Camera-Based In-Process Quality Measurement of Hairpin Welding. Appl. Sci. 2021, 11, 10375. [Google Scholar] [CrossRef]
  43. Martins, J.; Nogueira, K.; Osco, L.; Gomes, F.; Furuya, D.; Gonçalves, W.; Sant’Ana, D.; Ramos, A.; Liesenberg, V.; dos Santos, J.; et al. Semantic Segmentation of Tree-Canopy in Urban Environment with Pixel-Wise Deep Learning. Remote. Sens. 2021, 13, 3054. [Google Scholar] [CrossRef]
  44. Mohajerani, Y.; Wood, M.; Velicogna, I.; Rignot, E. Detection of Glacier Calving Margins with Convolutional Neural Networks: A Case Study. Remote. Sens. 2019, 11, 74. [Google Scholar] [CrossRef] [Green Version]
  45. Hirahara, K.; Ikeuchi, K. Detection of street-parking vehicles using line scan camera and scanning laser range sensor. In Proceedings of the EEE IV2003 Intelligent Vehicles Symposium. Proceedings (Cat. No. 03TH8683), Columbus, OH, USA, 9–11 June 2003; IEEE: Piscataway, NJ, USA, 2003. [Google Scholar]
  46. Dvorák, M.; Kanich, O.; Drahanský, M. Scalable Imaging Device using Line Scan Camera for Use in Biometric Recognition and Medical Imaging. In Proceedings of the 14th International Joint Conference on Biomedical Engineering Systems and Technologies (BIOSTEC 2021)-Volume 1: BIODEVICES, Online Streaming, 11–13 February 2021; pp. 160–168. [Google Scholar]
  47. Zhang, L.; Yang, F.; Zhang, Y.D.; Zhu, Y.J. Road crack detection using deep convolutional neural network. In Proceedings of the 2016 IEEE International Conference on Image Processing (ICIP), Phoenix, AZ, USA, 25–28 September 2016; IEEE: Piscataway, NJ, USA, 2016. [Google Scholar]
  48. Shi, Y.; Cui, L.; Qi, Z.; Meng, F.; Chen, Z. Automatic road crack detection using random structured forests. IEEE Trans. Intell. Transp. Syst. 2016, 17, 3434–3445. [Google Scholar] [CrossRef]
  49. Bang, S.; Park, S.; Kim, H.; Kim, H. Encoder–decoder network for pixel-level road crack detection in black-box images. Comput. Aided Civ. Infrastruct. Eng. 2019, 34, 713–727. [Google Scholar] [CrossRef]
  50. Kruachottikul, P.; Cooharojananone, N.; Phanomchoeng, G.; Chavarnakul, T.; Kovitanggoon, K.; Trakulwaranont, D.; Atchariyachanvanich, K. Bridge sub structure defect inspection assistance by using deep learning. In Proceedings of the 2019 IEEE 10th International Conference on Awareness Science and Technology (iCAST), Morioka, Japan, 23–25 October 2019; IEEE: Piscataway, NJ, USA, 2019. [Google Scholar]
  51. Pereira, V.; Tamura, S.; Hayamizu, S.; Fukai, H. Classification of paved and unpaved road image using convolutional neural network for road condition inspection system. In Proceedings of the 2018 5th International Conference on Advanced Informatics: Concept Theory and Applications (ICAICTA), Krabi, Thailand, 14–17 August 2018; IEEE: Piscataway, NJ, USA, 2018. [Google Scholar]
  52. Guo, W.; Wang, N.; Fang, H. Design of airport road surface inspection system based on machine vision and deep learning. J. Phys. Conf. Ser. 2021, 1885, 052046. [Google Scholar] [CrossRef]
  53. Mei, Q.; Gül, M. A cost effective solution for pavement crack inspection using cameras and deep neural networks. Constr. Build. Mater. 2020, 256, 119397. [Google Scholar] [CrossRef]
  54. Maeda, H.; Sekimoto, Y.; Seto, T.; Kashiyama, T.; Omata, H. Road Damage Detection and Classification Using Deep Neural Networks with Smartphone Images. Comput. Civ. Infrastruct. Eng. 2018, 33, 1127–1141. [Google Scholar] [CrossRef]
  55. Cha, Y.-J.; Choi, W.; Suh, G.; Mahmoudkhani, S.; Büyüköztürk, O. Autonomous Structural Visual Inspection Using Region-Based Deep Learning for Detecting Multiple Damage Types. Comput.-Aided Civ. Infrastruct. Eng. 2018, 33, 731–747. [Google Scholar] [CrossRef]
  56. Chehri, A.; Saeidi, A. IoT and Deep Learning Solutions for an Automated Crack Detection for the Inspection of Concrete Bridge Structures. In International Conference on Human-Centered Intelligent Systems; Springer: Singapore, 2021. [Google Scholar]
  57. Wang, D.; Zhang, Y.; Pan, Y.; Peng, B.; Liu, H.; Ma, R. An Automated Inspection Method for the Steel Box Girder Bottom of Long-Span Bridges Based on Deep Learning. IEEE Access 2020, 8, 94010–94023. [Google Scholar] [CrossRef]
  58. Mukherjee, R.; Iqbal, H.; Marzban, S.; Badar, A.; Brouns, T.; Gowda, S.; Arani, E.; Zonooz, B. AI Driven Road Maintenance Inspection. arXiv 2021, arXiv:2106.02567. [Google Scholar]
  59. Maeda, H.; Sekimoto, Y.; Seto, T.; Kashiyama, T.; Omata, H. Road damage detection using deep neural networks with images captured through a smartphone. arXiv 2018, arXiv:1801.09454. [Google Scholar]
  60. Siriborvornratanakul, T. An automatic road distress visual inspection system using an onboard in-car camera. Adv. Multimed. 2018, 2018, 2561953. [Google Scholar] [CrossRef] [Green Version]
  61. Abdellatif, M.; Peel, H.; Cohn, A.G.; Fuentes, R. Hyperspectral imaging for autonomous inspection of road pavement defects. In Proceedings of the 36th International Symposium on Automation and Robotics in Construction (ISARC), Banff, AB, Canada, 21–24 May 2019. [Google Scholar]
  62. Zhao, X.; Li, S.; Su, H.; Zhou, L.; Loh, K.J. Image-based comprehensive maintenance and inspection method for bridges using deep learning. In Smart Materials, Adaptive Structures and Intelligent Systems; American Society of Mechanical Engineers: New York, NY, USA, 2018; Volume 51951. [Google Scholar]
  63. The NEXUS System and the On-Site Test Survey Introduction. Available online: https://www.youtube.com/watch?v=S7p6P3VG-40 (accessed on 27 July 2018).
  64. Cox, D.R. The regression analysis of binary sequences. J. R. Stat. Soc. Ser. B (Methodol.) 1959, 21, 238. [Google Scholar] [CrossRef]
  65. He, K.; Zhang, X.; Ren, S.; Sun, J. Deep Residual Learning for Image Recognition. In Proceedings of the 2016 IEEE Conference on Computer Vision and Pattern Recognition (CVPR), Las Vegas, NV, USA, 27–30 June 2016; pp. 770–778. [Google Scholar] [CrossRef] [Green Version]
  66. Schwing, A.G.; Urtasun, R. Fully connected deep structured networks. arXiv 2015, arXiv:1503.02351. [Google Scholar]
  67. Manzoor, B.; Othman, I.; Durdyev, S.; Ismail, S.; Wahab, M.H. Influence of Artificial Intelligence in Civil Engineering toward Sustainable Development—A Systematic Literature Review. Appl. Syst. Innov. 2021, 4, 52. [Google Scholar] [CrossRef]
  68. Grác, Š.; Beňo, P.; Duchoň, F.; Dekan, M.; Tölgyessy, M. Automated Detection of Multi-Rotor UAVs Using a Machine-Learning Approach. Appl. Syst. Innov. 2020, 3, 29. [Google Scholar] [CrossRef]
  69. Xue, D.; Wang, X.; Zhu, J.; Davis, D.N.; Wang, B.; Zhao, W.; Peng, Y.; Cheng, Y. An adaptive ensemble approach to ambient intelligence assisted people search. Appl. Syst. Innov. 2018, 1, 33. [Google Scholar] [CrossRef] [Green Version]
  70. Robbins, H.; Monro, S. A stochastic approximation method. Ann. Math. Stat. 1951, 22, 400–407. [Google Scholar] [CrossRef]
  71. Zhao, W.; Meng, Z.; Wang, K.; Zhang, J.; Lu, S. Hierarchical Active Tracking Control for UAVs via Deep Reinforcement Learning. Appl. Sci. 2021, 11, 10595. [Google Scholar] [CrossRef]
  72. Pantho, M.J.H.; Bhowmik, P.; Bobda, C. Towards an Efficient CNN Inference Architecture Enabling In-Sensor Processing. Sensors 2021, 21, 1955. [Google Scholar] [CrossRef] [PubMed]
  73. Hennessy, P.J.; Esau, T.J.; Farooque, A.A.; Schumann, A.W.; Zaman, Q.U.; Corscadden, K.W. Hair Fescue and Sheep Sorrel Identification Using Deep Learning in Wild Blueberry Production. Remote Sens. 2021, 13, 943. [Google Scholar] [CrossRef]
  74. Minnetti, E.; Chiariotti, P.; Paone, N.; Garcia, G.; Vicente, H.; Violini, L.; Castellini, P. A Smartphone Integrated Hand-Held Gap and Flush Measurement System for in Line Quality Control of Car Body Assembly. Sensors 2020, 20, 3300. [Google Scholar] [CrossRef]
  75. Pham, T.-A.; Yoo, M. Nighttime Vehicle Detection and Tracking with Occlusion Handling by Pairing Headlights and Taillights. Appl. Sci. 2020, 10, 3986. [Google Scholar] [CrossRef]
  76. Zhang, T.; Hu, X.; Xiao, J.; Zhang, G. A Machine Learning Method for Vision-Based Unmanned Aerial Vehicle Systems to Understand Unknown Environments. Sensors 2020, 20, 3245. [Google Scholar] [CrossRef]
  77. Guo, Y.; Chai, L.; Aggrey, S.E.; Oladeinde, A.; Johnson, J.; Zock, G. A Machine Vision-Based Method for Monitoring Broiler Chicken Floor Distribution. Sensors 2020, 20, 3179. [Google Scholar] [CrossRef]
  78. Hawkins, D.M. The Problem of Overfitting. J. Chem. Inf. Comput. Sci. 2004, 44, 1–12. [Google Scholar] [CrossRef] [PubMed]
  79. Brehar, R.; Mitrea, D.-A.; Vancea, F.; Marita, T.; Nedevschi, S.; Lupsor-Platon, M.; Rotaru, M.; Badea, R.I. Comparison of Deep-Learning and Conventional Machine-Learning Methods for the Automatic Recognition of the Hepatocellular Carcinoma Areas from Ultrasound Images. Sensors 2020, 20, 3085. [Google Scholar] [CrossRef]
  80. Azimi, M.; Eslamlou, A.D.; Pekcan, G. Data-Driven Structural Health Monitoring and Damage Detection through Deep Learning: State-of-the-Art Review. Sensors 2020, 20, 2778. [Google Scholar] [CrossRef] [PubMed]
  81. Zhou, J.; Pan, L.; Li, Y.; Liu, P.; Liu, L. Real-Time Stripe Width Computation Using Back Propagation Neural Network for Adaptive Control of Line Structured Light Sensors. Sensors 2020, 20, 2618. [Google Scholar] [CrossRef] [PubMed]
  82. Huang, Y.; Qiu, C.; Wang, X.; Wang, S.; Yuan, K. A Compact Convolutional Neural Network for Surface Defect Inspection. Sensors 2020, 20, 1974. [Google Scholar] [CrossRef] [PubMed] [Green Version]
  83. Zhang, Q.; Liu, Y.; Gong, C.; Chen, Y.; Yu, H. Applications of Deep Learning for Dense Scenes Analysis in Agriculture: A Review. Sensors 2020, 20, 1520. [Google Scholar] [CrossRef] [PubMed] [Green Version]
  84. Guo, Y.; He, D.; Chai, L. A Machine Vision-Based Method for Monitoring Scene-Interactive Behaviors of Dairy Calf. Animals 2020, 10, 190. [Google Scholar] [CrossRef] [PubMed] [Green Version]
  85. Hochreiter, S. The vanishing gradient problem during learning recurrent neural nets and problem solutions. Int. J. Uncertain. Fuzziness Knowl.-Based Syst. 1998, 6, 107–116. [Google Scholar] [CrossRef] [Green Version]
Figure 1. Examples of major damage at road bridge expansion joint: (a) blow-up in road pavement, (b) lack of joint gap in expansion joint, (c) damage to wing wall of bridge abutment, and (d) damage by excessive bridge support movement.
Asi 04 00094 g001
Figure 2. Development system (NEXUS) and main function configuration.
Asi 04 00094 g002
Figure 3. UI configuration of the analysis program: measurement point image; survey trajectory (link to GPS); front-view status; value of the joint gap.
Asi 04 00094 g003
Figure 4. Pre-setting suitability evaluation of new bridge expansion joint devices.
Asi 04 00094 g004
Figure 5. False-detection case of expansion joint gap.
Asi 04 00094 g005
Figure 6. Expansion joint device analysis process for AI method (i.e., machine learning).
Asi 04 00094 g006
Figure 7. Image segmentation and classification to search for expansion joint device.
Asi 04 00094 g007
Figure 8. Segmentation process for extracting gap area.
Asi 04 00094 g008
Figure 9. Spacing measurement process of expansion joint device.
Asi 04 00094 g009
Figure 10. Line-scan image segmentation to search for expansion joint devices.
Asi 04 00094 g010
Figure 11. Recognition accuracy test results for each CNN structure.
Asi 04 00094 g011
Figure 12. Image of flexible expansion joint and mask of correct answer: (a) original image, (b) masked image.
Asi 04 00094 g012
Figure 13. An approach for elaborate gap area extraction.
Asi 04 00094 g013
Figure 14. Pseudocode to obtain minimum gap distance from U-Net output.
Asi 04 00094 g014
Figure 15. Machine-learning-based verification results of expansion joint device gap identification: (a) original image; (b) extraction of expansion joint area image; (c) extraction of gap area image; (d) final measurement result image.
Asi 04 00094 g015
Table 1. Average annual temperature, average annual maximum temperature, and number of heatwave days (national).
Year20112012201320142015201620172018Recent
Average
(2011–2018)
Average
Year
(1981–2010)
DifferenceRatio
Average
Temperature
(°C)
24.024.725.423.623.724.824.525.424.523.6+0.83.8%
Maximum
Temperature
(°C)
36.738.739.237.938.739.639.741.038.937.5+1.43.7%
Number of
Heatwave Days (days)
14151861022143214.29.8+4.445%
Table 2. Analysis of causes of insufficient expansion joint gap.
Asi 04 00094 i001Sum
(Bridges)
Major causes
Expansion of cement concrete pavement ①Deformation of backfill ②
276166 (60%)110 (40%)
Table 3. Number of structural inspections (2020).
Safety ManagementSumBridgesTunnelsBox Culverts
Sum (EA)27,68215,63621189928
Regular safety inspection 125,21913,64816439928
Precision safety inspection 222051783422-
Precision safety diagnosis25820553-
1 Regular safety inspection: an average of approximately 450 EA/yr/branches performed by the structural staff. 2 Precision safety inspection (2020): self-manpower performance (684EA), performing external services (1521EA).
Table 4. Bridge expansion joint devices installation status.
DivisionTotalRail TypeSteel Finger TypeMono Cell Type
Total302 places169 places128 places5 places
100%56%42%2%
lane A171 places98 places71 places2 places
100%57%42%1%
lane B131 places71 places57 places3 places
100%54%44%2%
Table 5. Expansion joint device installation status (2014).
InstallationSumMono Cell
Type
Finger
Type
Rail
Type
Others
EA14,784779317864228977
Prop (%)1005312297
Table 6. Gap identification accuracy by type of expansion joint (2017–2019).
Discrimination
(%)
Average
(%)
Mono Cell
Type
Finger
Type
Rail
Type
Others
Accuracy67.571518761
Loss32.529491339
Table 7. Gap identification accuracy by type of expansion joint (2017–2019).
Accuracy by Type of Expansion Joint (%)PrecisionRecallf1-Score
Positive (pixels of expansion joints)96.6194.3895.49
Negative (other pixels)99.2399.5599.39
Table 8. Accuracy of expansion gap identification using machine learning algorithm.
Accuracy (%)AverageMono Cell
Type
Finger
Type
Rail
Type
Others
Conventional algorithm67.571518761
AI algorithm
(machine learning)
9598929991
Improvement rate↑27.5↑27↑41↑12↑30
Publisher’s Note: MDPI stays neutral with regard to jurisdictional claims in published maps and institutional affiliations.

