
Review of Structural Health Monitoring Techniques in Pipeline and Wind Turbine Industries

 , , ,
, , ,
Abstract
:1. Introduction
2. Health Monitoring Techniques in Pipeline Industry
2.1. In Pipeline Industry
2.1.1. Optical Endoscopy
2.1.2. Electromagnetic Inspection
2.1.3. Radiographic Inspection
2.1.4. Acoustic Method
2.1.5. Ultrasonic Technique
3. Health Monitoring in Corrosion
3.1. Conventional Corrosion Sensors
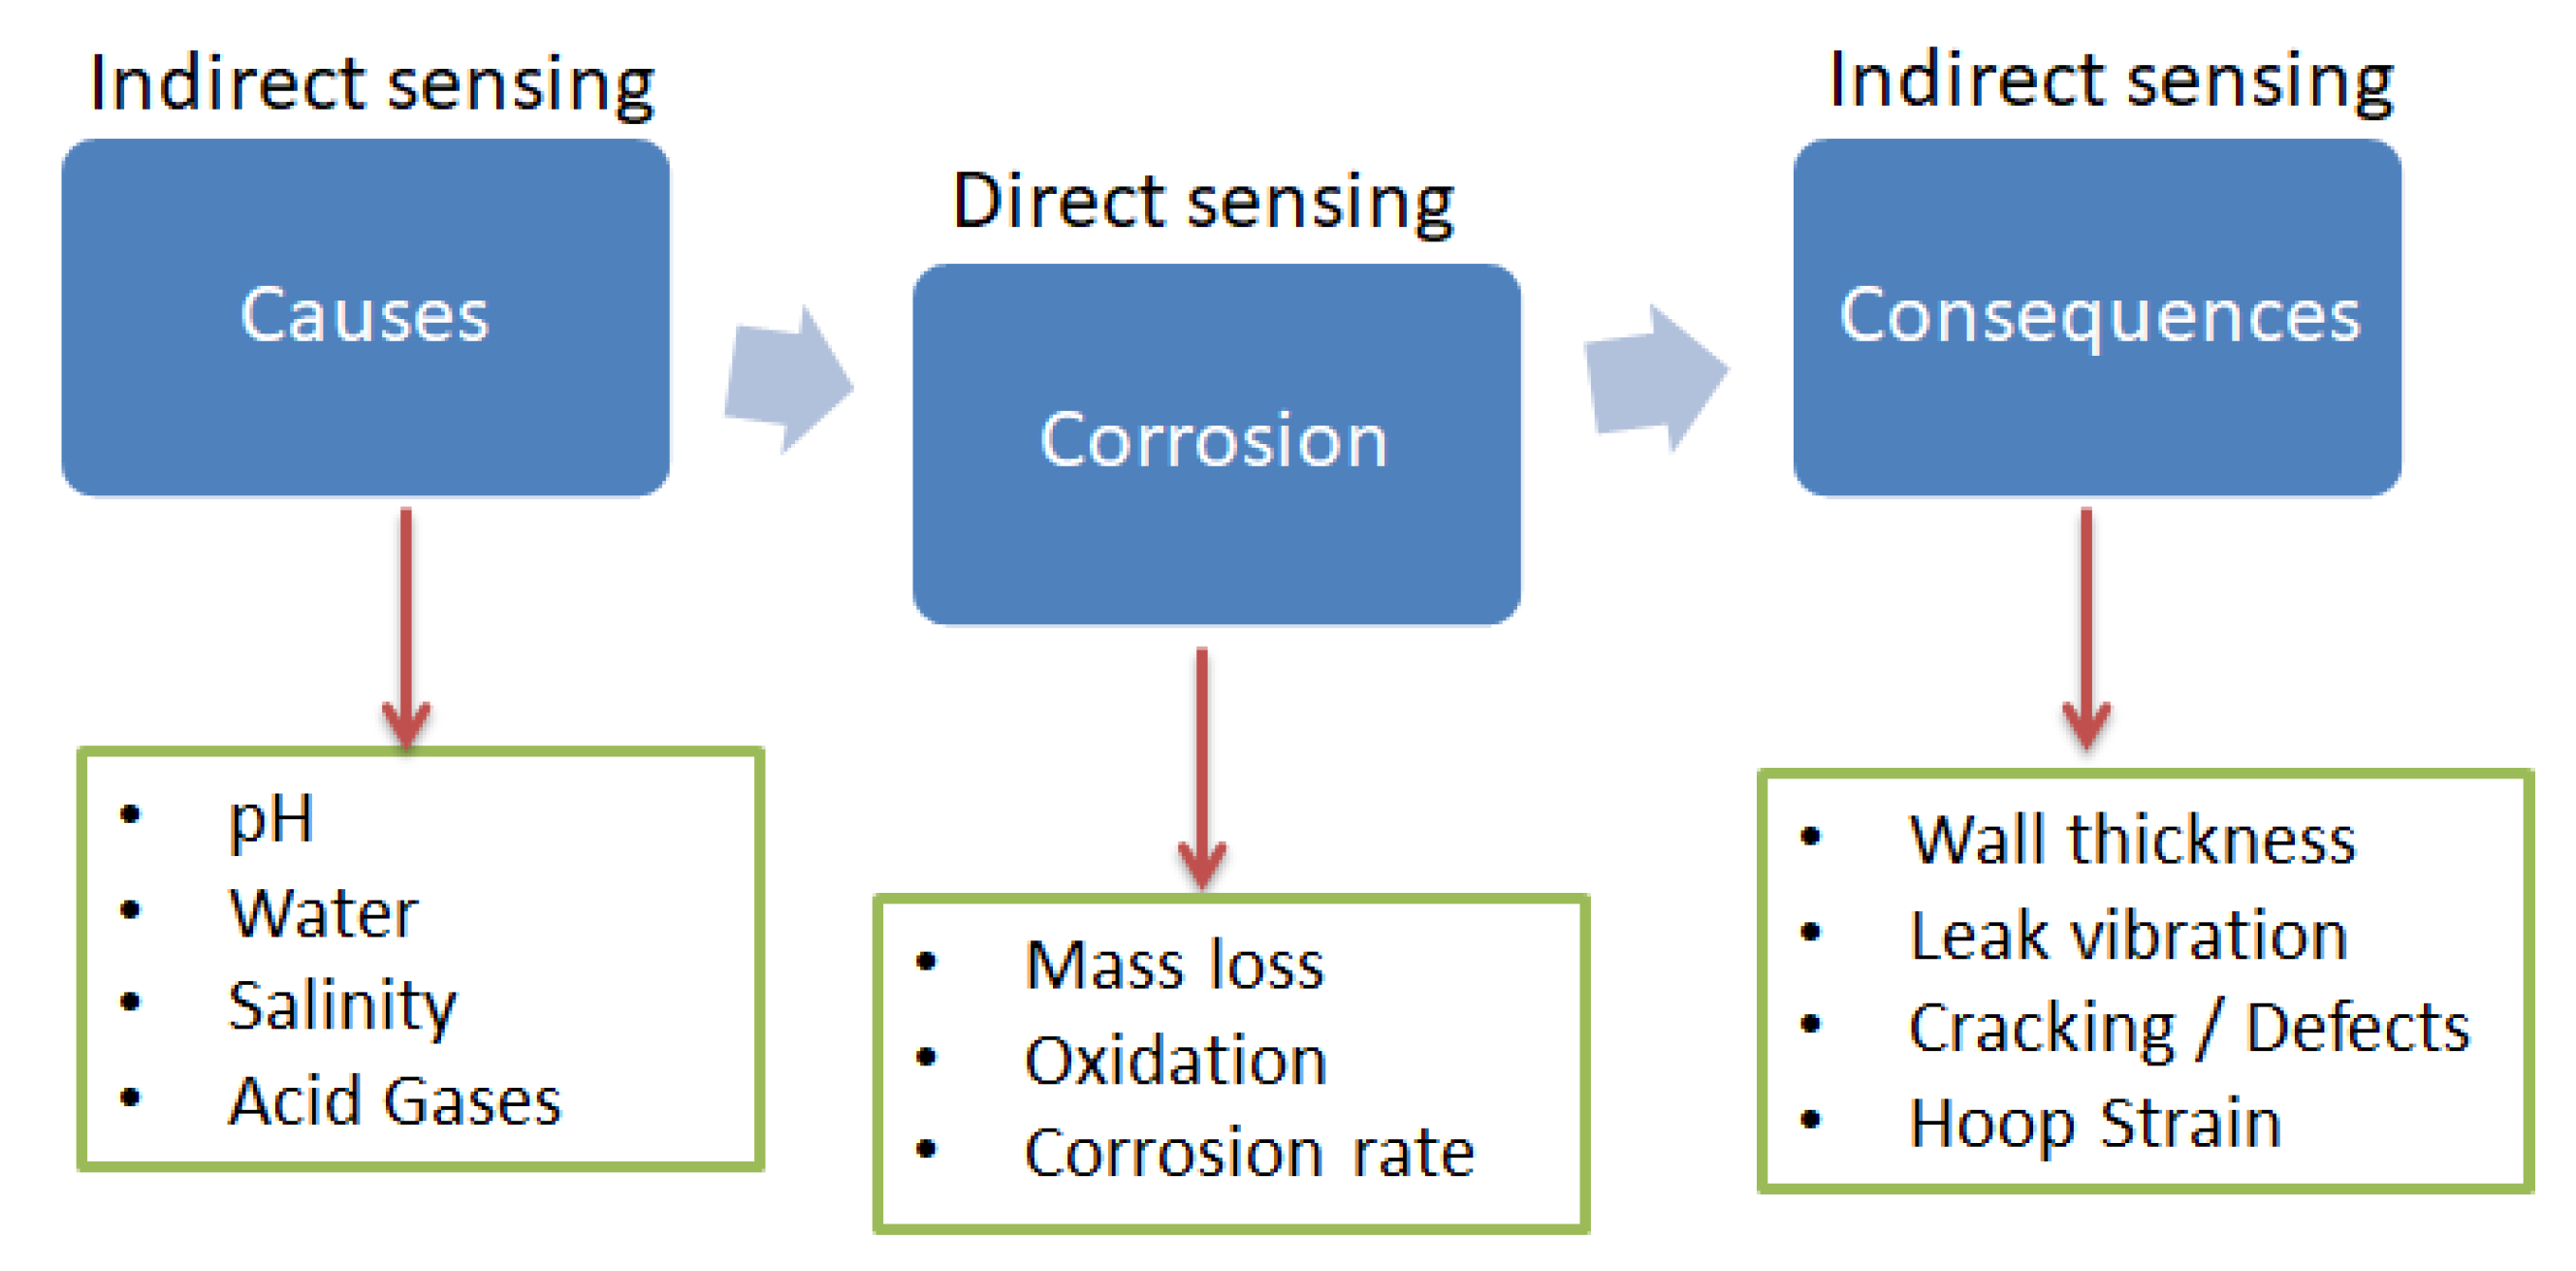
3.1.1. Corrosion
3.1.2. Electrical Resistance Probe
3.1.3. Electrochemical Sensors
3.1.4. Ultrasonic Testing Sensor
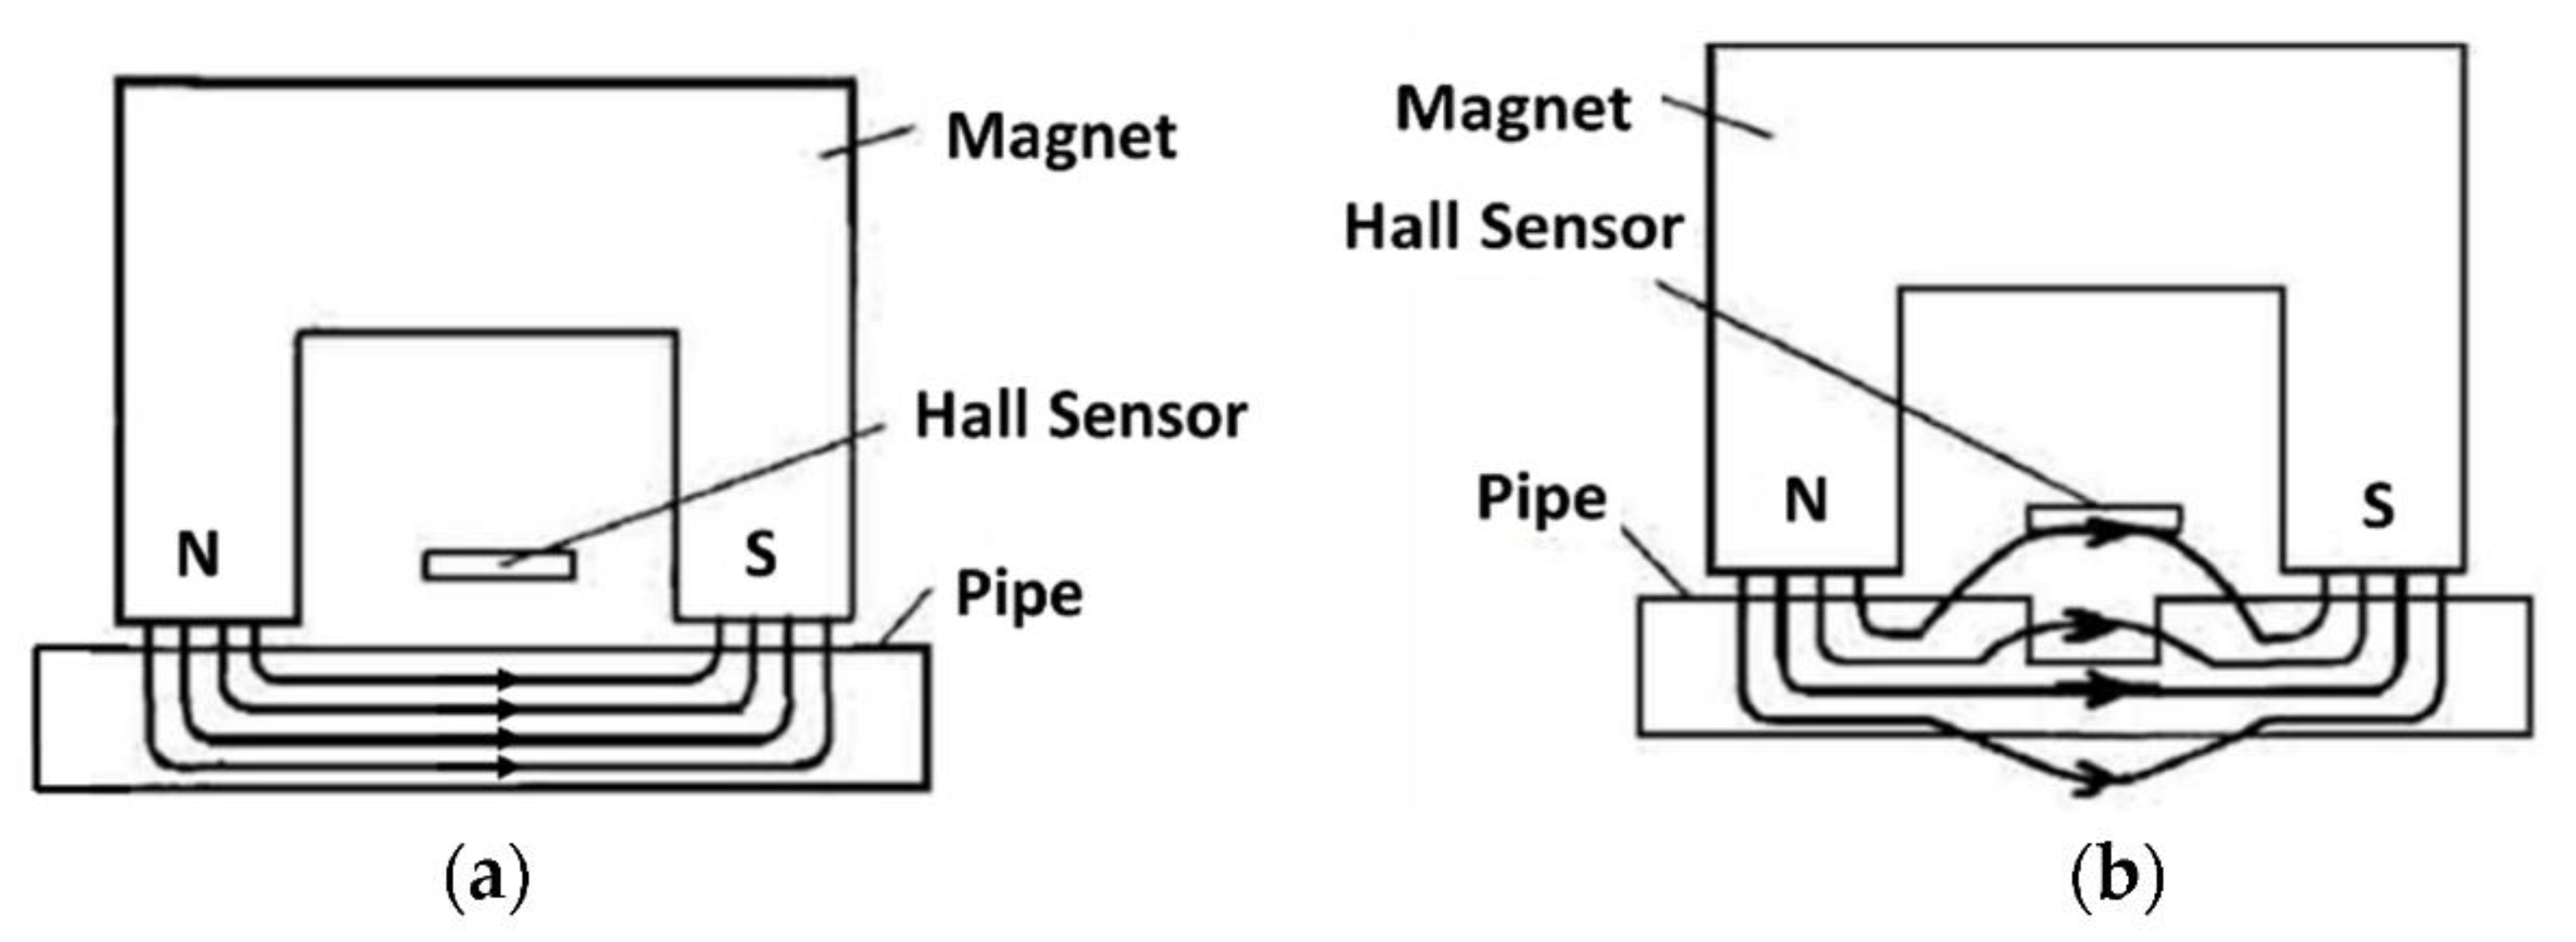
3.1.5. Magnetic Flux Leakage Method
3.2. Point OFS for Corrosion
3.3. Quasi-Distributed OFS for Corrosion
3.4. Distributed OFS for Physical Sensing
3.5. Distributed OFS for Chemical Sensing
3.6. Challenges of OFS Application in the O&G Industry
4. Health Monitoring Techniques for Wind Farms
4.1. Supervisory Control and Data Acquisition (SCADA) and Content Management Systems (CMSs) for Health Monitoring
4.2. Health Monitoring System of Blades
4.3. Health Monitoring System of the Tower and Foundation
4.4. Issues of Concern and their Mitigation in Wind Turbines
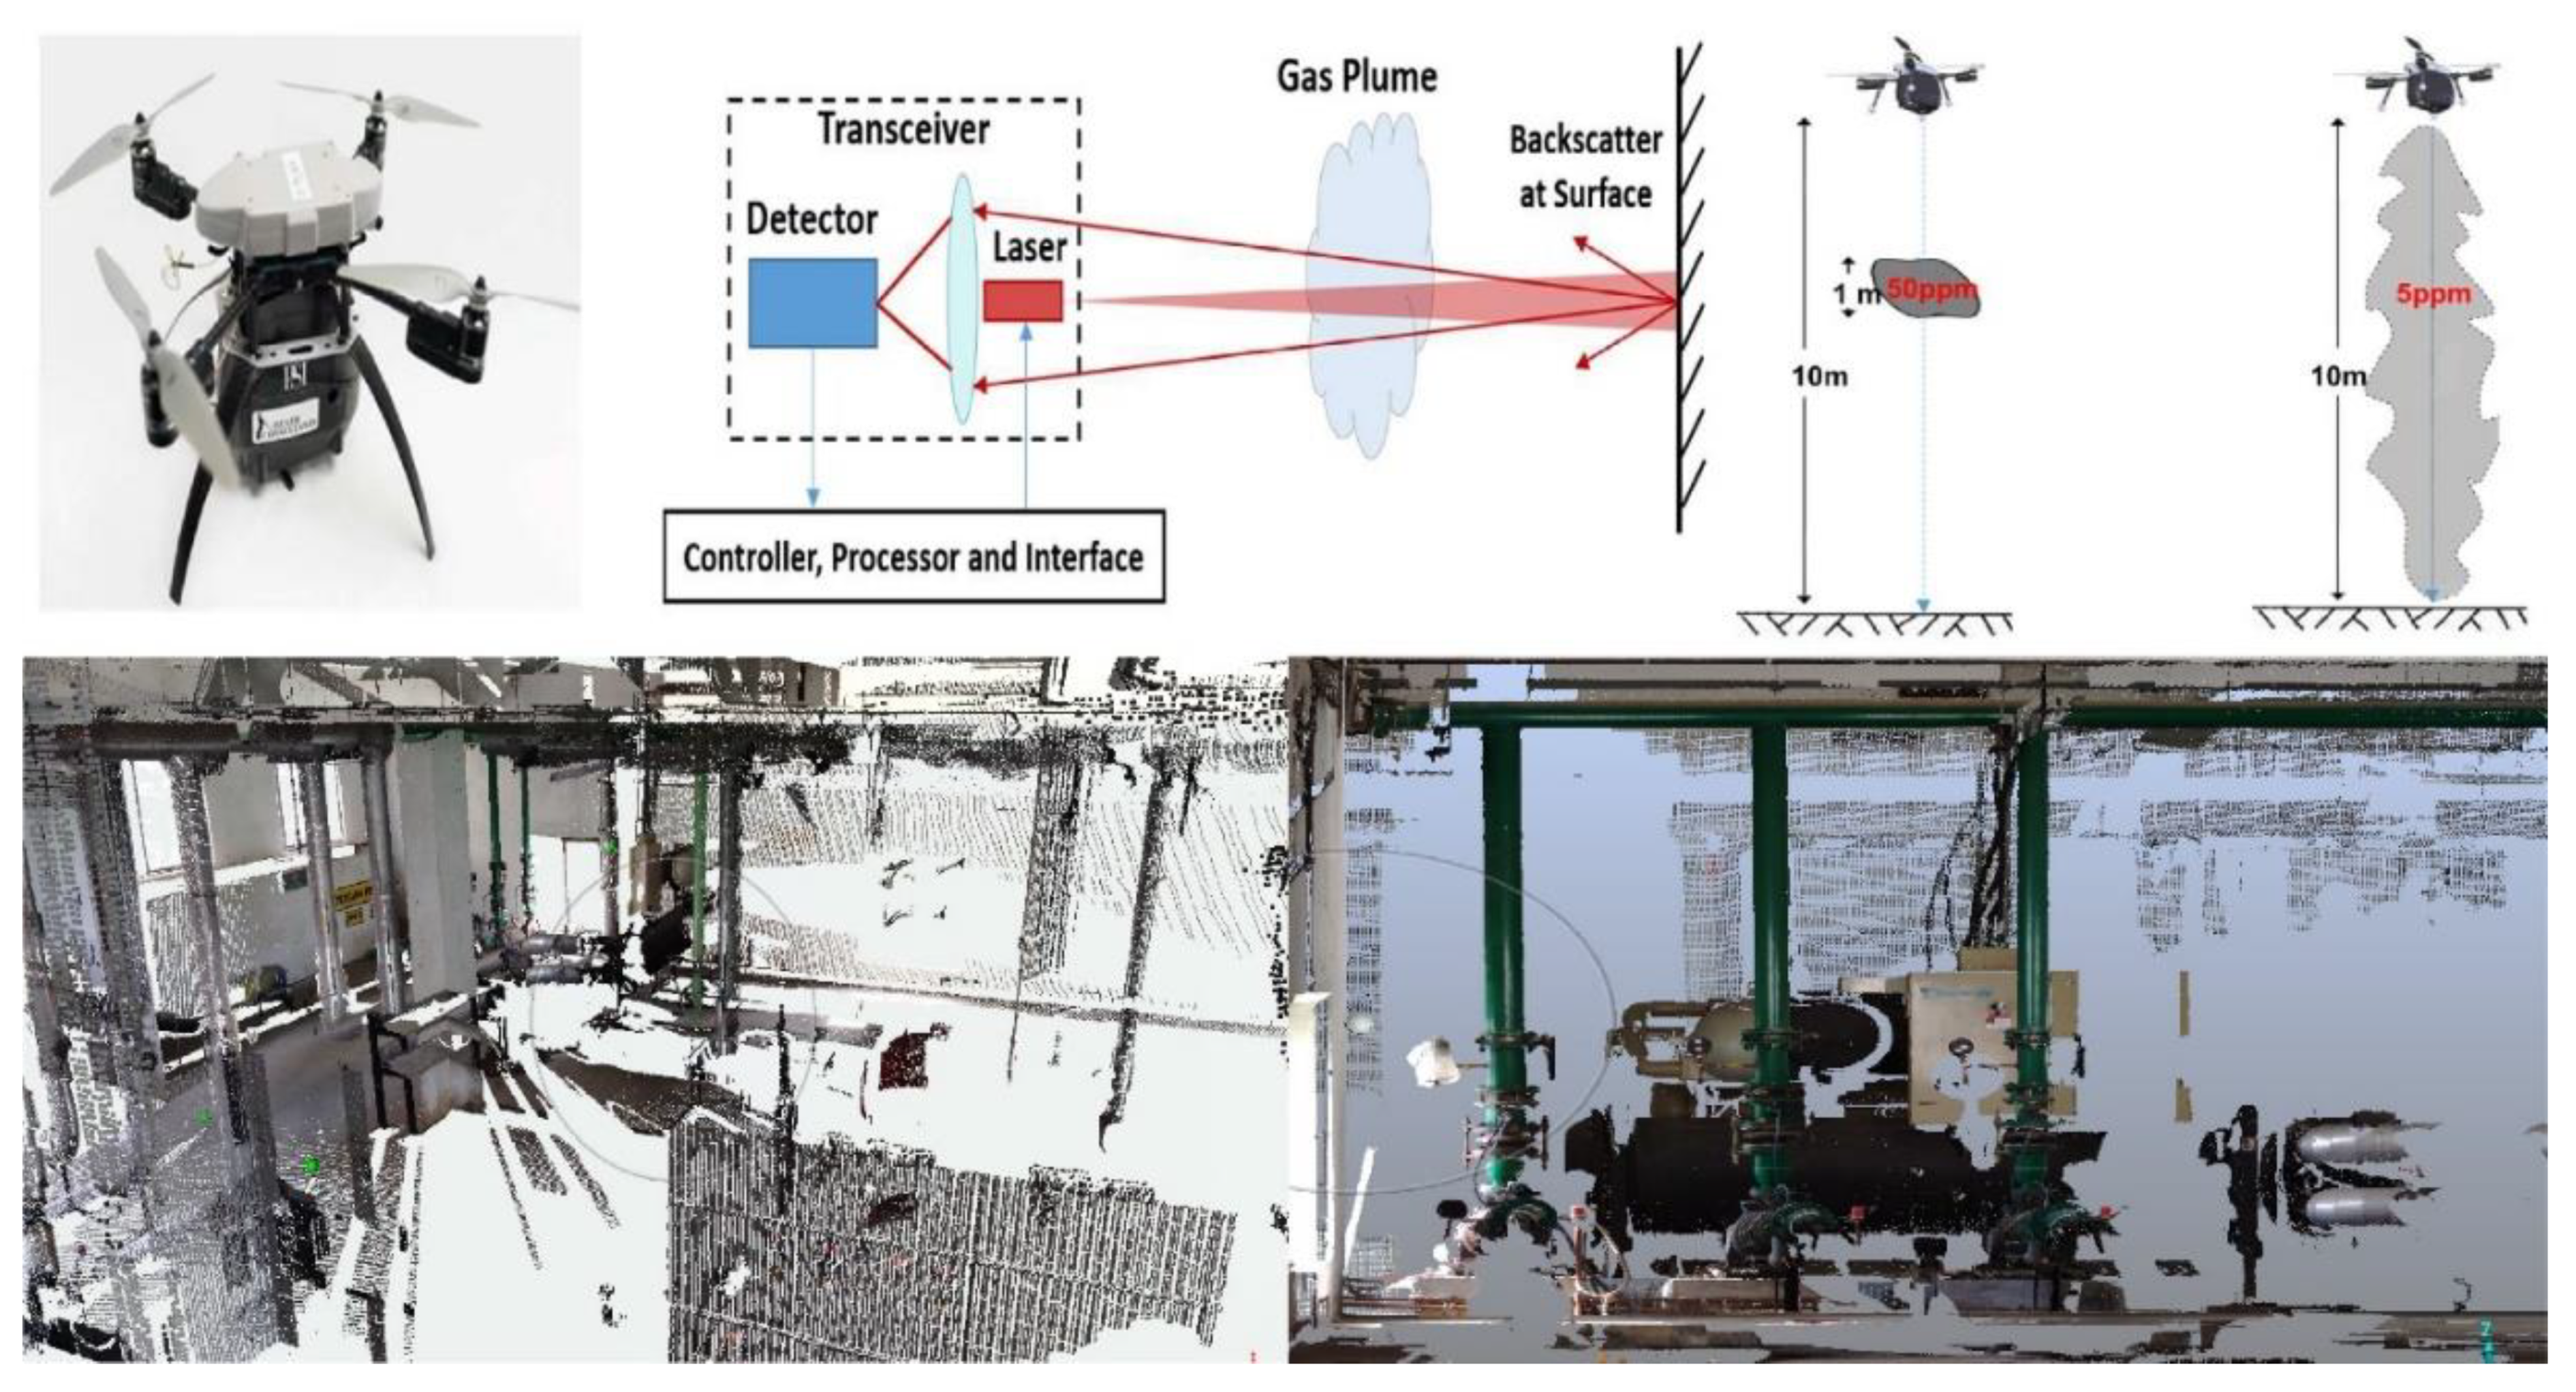
5. UAV Systems for Health Monitoring
6. Concluding Remarks
Funding
Institutional Review Board Statement
Informed Consent Statement
Data Availability Statement
Conflicts of Interest
References
- Beavers, J.A.; Thompson, N.G.; Technologies, C.C. External corrosion of oil and natural gas pipelines. ASM Int. 2006, 13, 1–12. [Google Scholar]
- Popoola, L.T.; Grema, A.S.; Latinwo, G.K.; Gutti, B. Corrosion problems during oil and gas production and its mitigation. IJIC 2013, 4, 35. [Google Scholar] [CrossRef] [Green Version]
- Brondel, D.; Edwards, R.; Hayman, A.; Hill, D. Corrosion in the oil industry. Oilf. Rev. 2020, 6, 4–18. [Google Scholar]
- European Commission. The European Semester. Available online: https://ec.europa.eu/info/business-economy-euro/economic-and-fiscal-policy-coordination/eu-economic-governance-monitoring-prevention-correction/european-semester_en (accessed on 18 August 2021).
- Weiss, P.S. Aiming high. ACS Nano 2007, 1, 377. [Google Scholar] [CrossRef] [PubMed]
- Wong, G.; He, S.; Siragam, V.; Bi, Y.; Mbikay, M.; Chretien, M.; Qiu, X. Antiviral activity of quercetin-3-β-O-D-glucoside against Zika virus infection. Virol. Sin. 2017, 32, 545–547. [Google Scholar] [CrossRef] [PubMed]
- Gwec. Global Wind Report; Global Wind Energy Council: Brussels, Belgium, 2021. [Google Scholar]
- Ciang, C.C.; Lee, J.; Bang, H. Structural health monitoring for a wind turbine system: A review of damage detection methods. Meas. Sci. Technol. 2008, 19, 122001. [Google Scholar] [CrossRef] [Green Version]
- Bagheri, A.; Kourehli, S.S. Damage detection of structures under earthquake excitation using discrete wavelet analysis damage detection of structures under earthquake. Asian J. Civ. Eng. 2013, 14, 289–304. [Google Scholar]
- Pozo, F.; Tibaduiza, D.A.; Vidal, Y. Sensors for structural health monitoring and condition monitoring. Sensors 2021, 21, 1558. [Google Scholar] [CrossRef]
- Qing, W. Processing high TAN crude: Part I. Pet. Technol. Q. 2010, 4, 35. [Google Scholar]
- Ropital, F. Current and future corrosion challenges for a reliable and sustainable development of the chemical, refinery, and petrochemical industries. Mater. Corros. 2009, 60, 495–500. [Google Scholar] [CrossRef]
- Turnbull, A. Review of naphthenic acid corrosion in oil refining. Br. Corros. J. 1999, 34, 125–131. [Google Scholar]
- API RP 571 Damage Mechanisms Affecting Fixed Equipment in the Refining Industry; American Petroleum Institute: Washington, DC, USA, 2003; pp. 1–12.
- Wu, X.Q.; Jing, H.M.; Zheng, Y.G.; Yao, Z.M.; Ke, W. Study on high-temperature naphthenic acid corrosion and erosion-corrosion of aluminized carbon steel. J. Mater. Sci. 2004, 9, 975–985. [Google Scholar] [CrossRef]
- Birring, A.S.; Beissner, R. Nondestructive Evaluation Methods for It; Nondestructive Testing Information Analysis Center: San Antonio, TX, USA, 1986. [Google Scholar]
- Lozev, M.G.; Smith, R.W.; Grimmett, B.B. Evaluation of methods for detecting and monitoring of corrosion damage in risers. J. Press. Vessel Technol. 2005, 127, 244–254. [Google Scholar] [CrossRef]
- Liu, Z.; Kleiner, Y. State of the art review of inspection technologies for condition assessment of water pipes. Measurement 2013, 46, 1–15. [Google Scholar] [CrossRef] [Green Version]
- Bray, D.E. Nondestructive Evaluation: A Tool in Design, Manufacturing, and Service; CRC Press: Boca Raton, FL, USA, 2018; ISBN 9781315272993. [Google Scholar]
- Shokravi, H.; Shokravi, H.; Bakhary, N.; Heidarrezaei, M.; Rahimian Koloor, S.S.; Petrů, M. Vehicle-assisted techniques for health monitoring of bridges. Sensors 2020, 20, 3460. [Google Scholar] [CrossRef] [PubMed]
- Materials, T.; Company, I. The Materials Information Company; ASM International: Almere, The Netherlands, 1997; ISBN 0-87170-386-6. [Google Scholar]
- Shadravan, A.; Amani, M. Impacts of hydrogen embrittlement on oil and gas wells: Theories behind premature failures. In Proceedings of the SPE Gas & Oil Technology Showcase and Conference, Dubai, United Arab Emirates, 21–23 October 2019. [Google Scholar]
- Nagumo, M. Function of hydrogen in embrittlement of high-strength steels. ISIJ Int. 2001, 41, 590–598. [Google Scholar] [CrossRef]
- Common Causes and Cures of Hydrogen Cracking. Available online: https://www.fabricatingandmetalworking.com/2014/12/common-causes-cures-hydrogen-cracking (accessed on 13 February 2021).
- How to Fix 8 Common Welding Problems with these Easy Steps. Available online: https://www.welding.com.au/news/view/how-to-fix-8-common-welding-problems-with-these-easy-steps (accessed on 13 February 2021).
- Hansen, P.; Alismail, H.; Rander, P.; Browning, B. Pipe mapping with monocular fisheye imagery. In Proceedings of the 2013 IEEE/RSJ International Conference on Intelligent Robots and Systems, Tokyo, Japan, 3–7 November 2013; IEEE: Piscataway, NJ, USA, 2013; pp. 5180–5185. [Google Scholar]
- Duran, O.; Althoefer, K.; Seneviratne, L.D. Automated pipe defect detection and categorization using camera/laser-based profiler and artificial neural network. IEEE Trans. Autom. Sci. Eng. 2007, 4, 118–126. [Google Scholar] [CrossRef]
- Majumder, M.; Gangopadhyay, T.K.; Chakraborty, A.K.; Dasgupta, K.; Bhattacharya, D.K. Fibre Bragg gratings in structural health monitoring—Present status and applications. Sens. Actuators A Phys. 2008, 147, 150–164. [Google Scholar] [CrossRef]
- Tennyson, R.C.; Banthia, N.; Rivera, E.; Huffman, S.; Sturrock, I. Monitoring structures using long gauge length fibre optic sensors. Can. J. Civ. Eng. 2007, 34, 422–429. [Google Scholar] [CrossRef]
- Balageas, D.; Fritzen, C.-P.; Güemes, A. Structural Health Monitoring; Wiley-ISTE: Hoboken, NJ, USA, 2006. [Google Scholar]
- Tonelli, D.; Luchetta, M.; Rossi, F.; Migliorino, P.; Zonta, D. Structural health monitoring based on acoustic emissions: Validation on a prestressed concrete bridge tested to failure. Sensors 2020, 20, 7272. [Google Scholar] [CrossRef]
- Shokravi, H.; Shokravi, H.; Bakhary, N.; Koloor, S.S.R.; Petrů, M. A Comparative study of the data-driven stochastic subspace methods for health monitoring of structures: A bridge case study. Appl. Sci. 2020, 10, 3132. [Google Scholar] [CrossRef]
- Barshan, B. Fast processing techniques for accurate ultrasonic range measurements. Meas. Sci. Technol. 2000, 45, 45–50. [Google Scholar] [CrossRef]
- Jarvis, A.J.C.; Cegla, F.B. Application of the distributed point source method to rough surface scattering and ultrasonic wall thickness measurement. J. Acoust. Soc. Am. 2012, 132, 1325–1335. [Google Scholar] [CrossRef] [PubMed]
- Cegla, F.B.; Cawley, P.; Allin, J.; Davies, J. High-temperature (>500 °C) wall thickness monitoring using dry-coupled ultrasonic waveguide transducers. IEEE Trans. Ultrason. Ferroelectr. Freq. Control 2011, 58, 156–167. [Google Scholar] [CrossRef]
- Kobayashi, M.; Jen, C.K.; Bussiere, J.F.; Wu, K.T. High-temperature integrated and flexible ultrasonic transducers for nondestructive testing. NDT E Int. 2009, 42, 157–161. [Google Scholar] [CrossRef] [Green Version]
- Bartoli, I. Structural Health Monitoring by Ultrasonic Guided Waves; UC San Diego: San Diego, CA, USA, 2007. [Google Scholar]
- Rose, J.L. Ultrasonic guided waves in structural health monitoring. Key Eng. Mater. 2004, 270, 14–21. [Google Scholar] [CrossRef]
- Rose, J.L.; Soley, L.E. Ultrasonic guided waves for anomaly detection in aircraft components. Mater. Eval. 2000, 58, 1080–1086. [Google Scholar]
- Hongerholt, D.D. Summary of results from an ultrasonic in-flight wing ice detection system. AIP Conf. Proc. 2003, 615, 1023–1028. [Google Scholar] [CrossRef]
- Rose, J.; Zhu, W.; Zaidi, M. Ultrasonic NDT of titanium diffusion bonding with guided waves. Undefined 1998, 56, 535–539. [Google Scholar]
- Hay, T.; Rose, J.L. Skin to Honeycomb Core delamination Detection with Guided Waves. In Proceedings of the 15th World Conference on Non-Destructive Testing (WCNDT), Rome, Italy, 15–21 October 2000; pp. 1–14. [Google Scholar]
- ETHICONTM Energy | Energy Sealing & Dissecting | J&J Medical Devices. Available online: https://www.jnjmedicaldevices.com/en-US/product-family/energy-sealing-dissecting (accessed on 18 August 2021).
- Cawley, P.; Lowe, M.J.S.; Alleyne, D.N.; Pavlakovic, B.; Wilcox, P. Practical long range guided wave testing: Applications to pipes and rail. Mater. Eval. 2003, 61, 66–74. [Google Scholar]
- Elastic Wave Analysis for Broken Rail Detection. Available online: https://www.ndt.net/article/wcndt00/papers/idn270/idn270.htm (accessed on 19 August 2021).
- Hayashi, T.; Song, W.J.; Rose, J.L. Guided wave dispersion curves for a bar with an arbitrary cross-section, a rod and rail example. Ultrasonics 2003, 41, 175–183. [Google Scholar] [CrossRef]
- Rose, J.L. Ultrasonic inspection of adhesive bonds. In Adhesion Science and Engineering; Pocius, A.V., Dillard, D.A., Eds.; Elsevier: Amsterdam, The Netherlands, 2002; pp. 699–724. [Google Scholar] [CrossRef]
- Sun, Z.; Rose, L.J.; Zaidi, M. A phased array guided wave approach to adhesive bonding structural integrity analysis—Penn State. Mater. Eval. 2003, 61, 941–946. [Google Scholar]
- Song, W.J.; Rose, J.L.; Galán, J.M.; Abascal, R. Ultrasonic guided wave scattering in a plate overlap. IEEE Trans. Ultrason. Ferroelectr. Freq. Control 2005, 52, 892–903. [Google Scholar] [CrossRef]
- Rose, J.L.; Avioli, M.J.; Mudge, P.; Sanderson, R. Guided wave inspection potential of defects in rail. NDT E Int. 2004, 37, 153–161. [Google Scholar] [CrossRef]
- Koch, G.H.; Brongers, M.P.H.; Thompson, N.G.; Virmani, Y.P.; Payer, J.H. Corrosion Costs and Preventive Strategies in the United States; NACE International: Houston, TX, USA, 1998; pp. 1–10. [Google Scholar]
- Wright, R.F.; English, R.; Egbu, J.C.; Baltrus, J.; Ziomek-Moroz, M.; Ohodnicki, P.R. Fe thin film-coated optics for corrosion monitoring: Optical and electrochemical studies. JOM 2021, 73, 655–664. [Google Scholar] [CrossRef]
- Wright, R.F.; Brand, E.R.; Ziomek-Moroz, M.; Tylczak, J.H.; Ohodnicki, P.R. Effect of HCO3− on electrochemical kinetics of carbon steel corrosion in CO2-saturated brines. Electrochim. Acta 2018, 290, 626–638. [Google Scholar] [CrossRef]
- Nesic, S.; Postlethwaite, J.; Olsen, S. An electrochemical model for prediction of corrosion of mild steel in aqueous carbon dioxide solutions. Corrosion 1996, 52, 280–294. [Google Scholar] [CrossRef]
- Sun, W.; Nesic, S. A mechanistic model of H2S corrosion of mild steel. In Proceedings of the Corrosion 2007, Nashville, TN, USA, 11–15 March 2007; p. 07655. [Google Scholar] [CrossRef]
- Zheng, Y.; Ning, J.; Brown, B.; Nešić, S. Electrochemical model of mild steel corrosion in a mixed H2S/CO2 aqueous environment in the absence of protective corrosion product layers. Corrosion 2015, 71, 316–325. [Google Scholar] [CrossRef]
- Feng, R.; Beck, J.R.; Hall, D.M.; Buyuksagis, A.; Ziomek-Moroz, M.; Lvov, S.N. Effects of CO2 and H2S on corrosion of martensitic steels in brines at low temperature. Corrosion 2018, 74, 276–287. [Google Scholar] [CrossRef]
- Feng, R.; Beck, J.; Ziomek-Moroz, M.; Lvov, S.N. Electrochemical corrosion of ultra-high strength carbon steel in alkaline brines containing hydrogen sulfide. Electrochim. Acta 2016, 212, 998–1009. [Google Scholar] [CrossRef] [Green Version]
- Feng, R.; Beck, J.; Ziomek-Moroz, M.; Lvov, S.N. High-temperature electrochemical corrosion of ultra-high strength carbon steel in H2S-Containing Alkaline Brines. Electrochim. Acta 2017, 241, 341–352. [Google Scholar] [CrossRef]
- Heidersbach, R. Metallurgy and Corrosion Control in Oil and Gas Production; Wiley: Hoboken, NJ, USA, 2018; ISBN 9781119252054. [Google Scholar]
- Ziomek-Moroz, M. Environmentally assisted cracking of drill pipes in deep drilling oil and natural gas wells. J. Mater. Eng. Perform. 2012, 21, 1061–1069. [Google Scholar] [CrossRef]
- Iverson, W.P. Microbial corrosion of metals. Adv. Appl. Microbiol. 1987, 32, 1–36. [Google Scholar] [CrossRef]
- Craig, B. Deep oil and gas well construction. Adv. Mater. Process. 2008, 166, 33. [Google Scholar]
- NACE Intl Task Goup. Technique for monitoring corrosion and related parameters in field applications. NACE Int. Publ. 2012, 199, 1–41. [Google Scholar]
- Agarwala, V.S.; Reed, P.L.; Ahmad, S. Corrosion detection and monitoring—A review. In Proceedings of the Corrosion 2000, Orlando, FL, USA, 26–31 March 2000. [Google Scholar]
- Tullmin, M.A.A.; Roberge, P.R.; Little, M.A. Sensors for Aircraft Corrosion—Review and Future Developments. In Proceedings of the Corrosion 1997, New Orleans, LA, USA, 9–14 March 1997. [Google Scholar]
- Qi, X.; Gelling, J.V. A Review of different sensors applied to corrosion detection and monitoring. Recent Patents Corros. Sci. 2011, 1, 1–7. [Google Scholar] [CrossRef]
- ASTM G4-01 Standard Guide for Conducting Corrosion Tests in Field Applications. Available online: https://www.astm.org/DATABASE.CART/HISTORICAL/G4-01.htm (accessed on 18 August 2021).
- Kuang, F.; Jinna, J.; Zou, C.; Shi, T.; Wang, Y.; Zhang, S.; Xu, H.; Zhang, J. Electrochemical methods for corrosion monitoring: A survey of recent patents. Recent Patents Corros. Sci. 2010, 2, 34–39. [Google Scholar] [CrossRef] [Green Version]
- Pallarés, F.J.; Betti, M.; Bartoli, G.; Pallarés, L. Structural health monitoring (SHM) and Nondestructive testing (NDT) of slender masonry structures: A practical review. Constr. Build. Mater. 2021, 297, 123768. [Google Scholar] [CrossRef]
- Wright, R.F.; Lu, P.; Devkota, J.; Lu, F.; Ziomek-Moroz, M.; Ohodnicki, P.R. Review on corrosion sensors for structural health monitoring of oil and natural gas infrastructure. In Proceedings of the Smart Structures and NDE for Energy Systems and Industry 4.0; Niezrecki, C., Meyendorf, N.G., Gath, K., Eds.; SPIE: Bellingham, WA, USA, 2019; Volume 10973, p. 22. [Google Scholar]
- LPR Probe 7012/7022—Cosasco. Available online: https://www.cosasco.com/product/lpr-probe-7012-7022 (accessed on 18 August 2021).
- Sridhar, N.; Yang, L. Coupled multielectrode array systems and sensors for real-time corrosion monitoring—A review. In Proceedings of the Corrosion 2006, San Diego, CA, USA, 12–16 March 2006. [Google Scholar]
- Chiang, K.T.; Yang, L. High-temperature electrochemical sensor for online corrosion monitoring. In Proceedings of the Corrosion 2010, San Antonio, TX, USA, 14–18 March 2010; pp. 095002–095008. [Google Scholar] [CrossRef]
- Yang, L. Coupled multielectrode array sensors for localized corrosion monitoring. In Proceedings of the NACE TEG 97 Technical Information Exchange, Houston, TX, USA, 13 March 2011. [Google Scholar]
- Beck, J.; Hall, D.M.; Ziomek-Moroz, M.; Lvov, S.N. Membrane-based electrochemical sensor for corrosion monitoring in natural gas pipelines. ECS Trans. 2017, 77, 681–691. [Google Scholar] [CrossRef]
- Hall, D.M.; Duffy, T.; Ziomek-Moroz, M.; Lvov, S.N. Electrochemical impedance spectroscopy and finite element analysis modeling of a 4-electrode humidity sensor for natural gas transportation pipelines. Rev. Sci. Instrum. 2019, 90, 015005. [Google Scholar] [CrossRef] [PubMed]
- Rodríguez-Olivares, N.A.; Cruz-Cruz, J.V.; Gómez-Hernández, A.; Hernández-Alvarado, R.; Nava-Balanzar, L.; Salgado-Jiménez, T.; Soto-Cajiga, J.A. Improvement of ultrasonic pulse generator for automatic pipeline inspection. Sensors 2018, 18, 2950. [Google Scholar] [CrossRef] [Green Version]
- Cegla, F. Ultrasonic Monitoring of Corrosion with Permanently Installed Sensors (PIMS). In Sensors, Algorithms and Applications for Structural Health Monitoring; Chapuis, B., Sjerve, E., Eds.; Springer: Berlin/Heidelberg, Germany, 2018; pp. 13–20. [Google Scholar] [CrossRef]
- Lakestani, F.; Coste, J.F.; Denis, R. Application of ultrasonic Rayleigh waves to thickness measurement of metallic coatings. NDT E Int. 1995, 28, 171–178. [Google Scholar] [CrossRef]
- Ali, S.H.; Zaid, M.; Abdullah, M.; Khan, T.M.R. SHM of Concrete Bridge Structures using Wireless Sensor Networks. In Proceedings of the Smart SysTech 2018: European Conference on Smart Objects, Systems and Technologies, Dresden, Germany, 12–13 June 2018; pp. 1–6. [Google Scholar]
- Rao, B.P.C. Magnetic flux leakage technique: Basics. J. Nondestruct. Test. Eval. 2012, 11, 7–17. [Google Scholar]
- Shi, Y.; Zhang, C.; Li, R.; Cai, M.; Jia, G. Theory and application of magnetic flux leakage pipeline detection. Sensors 2015, 15, 31036–31055. [Google Scholar] [CrossRef]
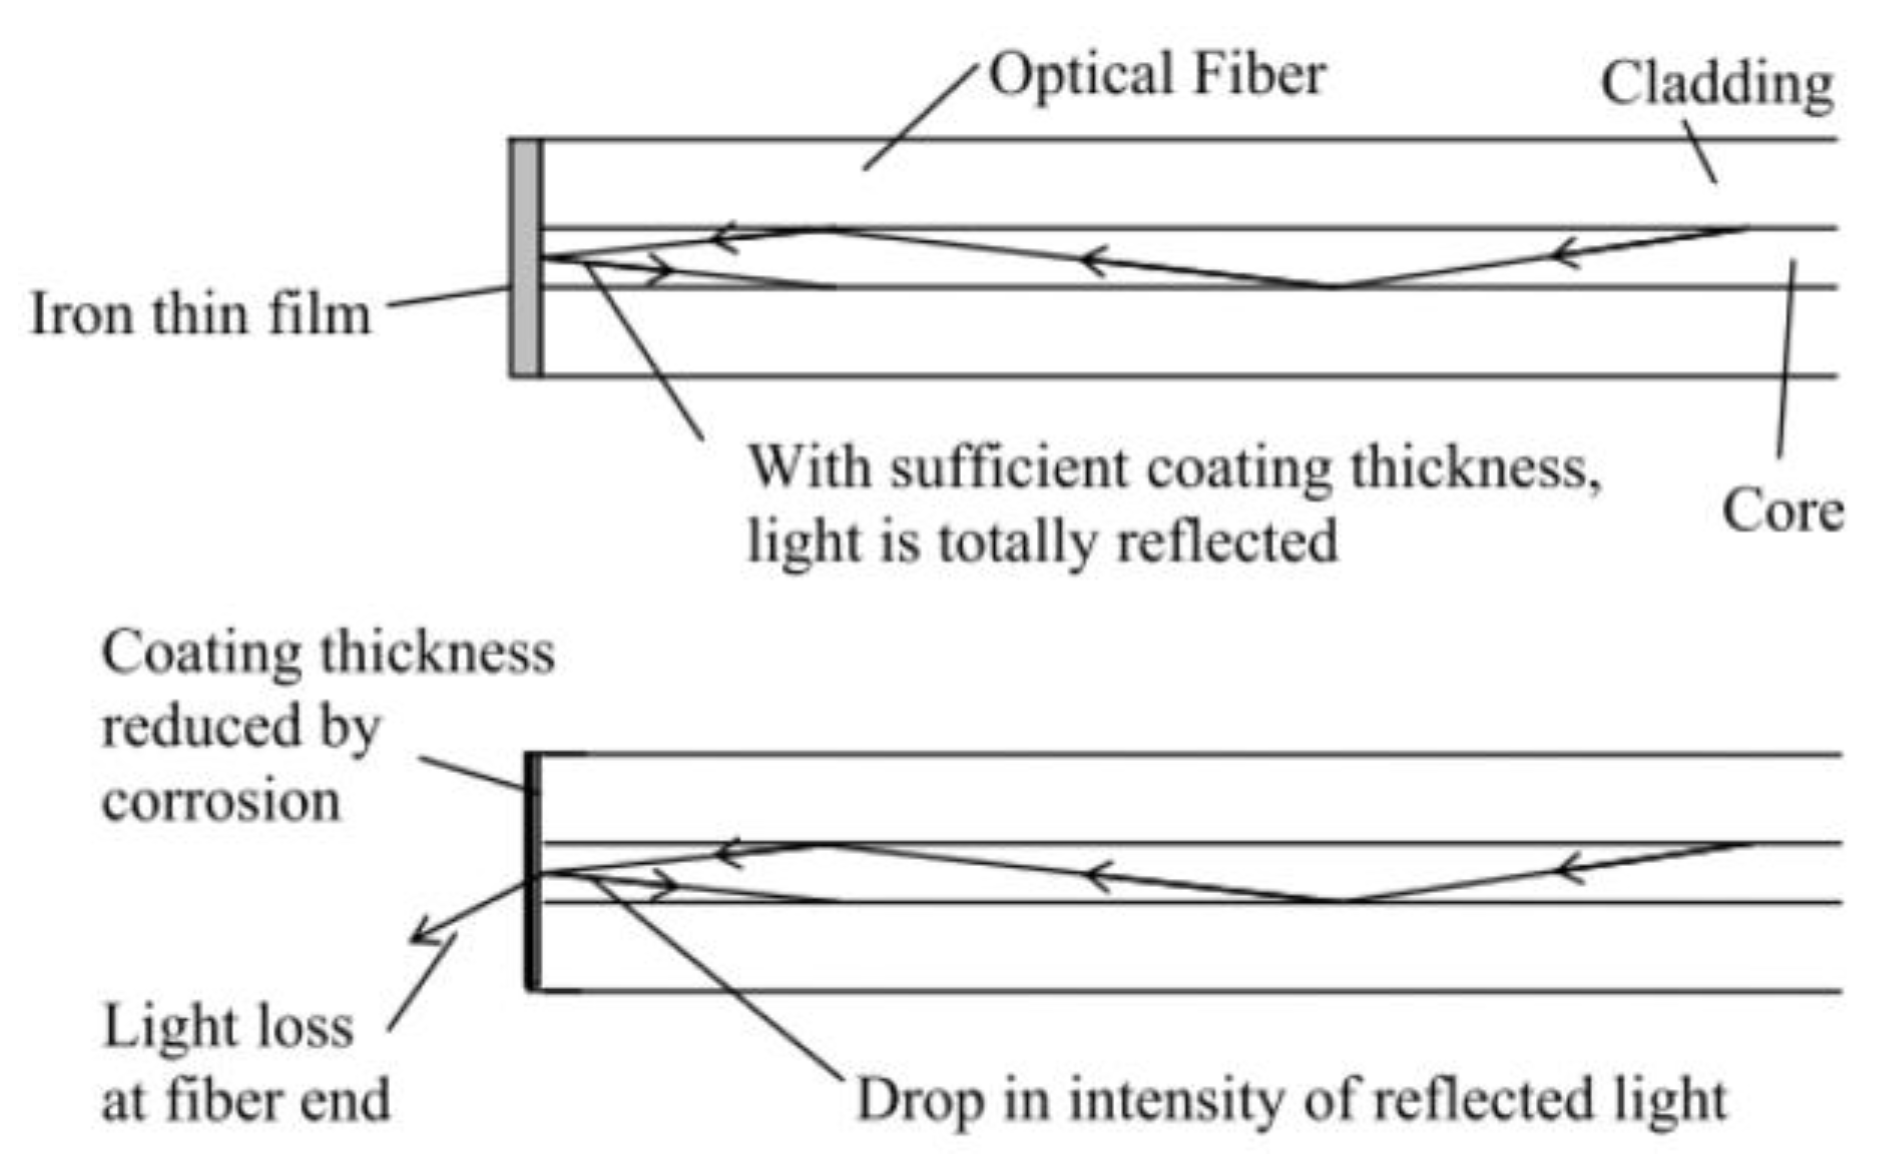
- Qiao, G.; Zhou, Z.; Ou, J. Thin Fe-C alloy solid film based fiber optic corrosion sensor. In Proceedings of the 1st IEEE International Conference on Nano/Micro Engineered and Molecular Systems (NEMS ’06), Zhuhai, China, 18–21 January 2006; pp. 541–544. [Google Scholar] [CrossRef]
- Leung, C.K.Y.; Wan, K.T.; Chen, L. A novel optical fiber sensor for steel corrosion in concrete structures. Sensors 2008, 8, 1960–1976. [Google Scholar] [CrossRef] [PubMed] [Green Version]
- Dong, S.; Liao, Y.; Tian, Q.; Luo, Y.; Qiu, Z.; Song, S. Optical and electrochemical measurements for optical fibre corrosion sensing techniques. Corros. Sci. 2006, 48, 1746–1756. [Google Scholar] [CrossRef]
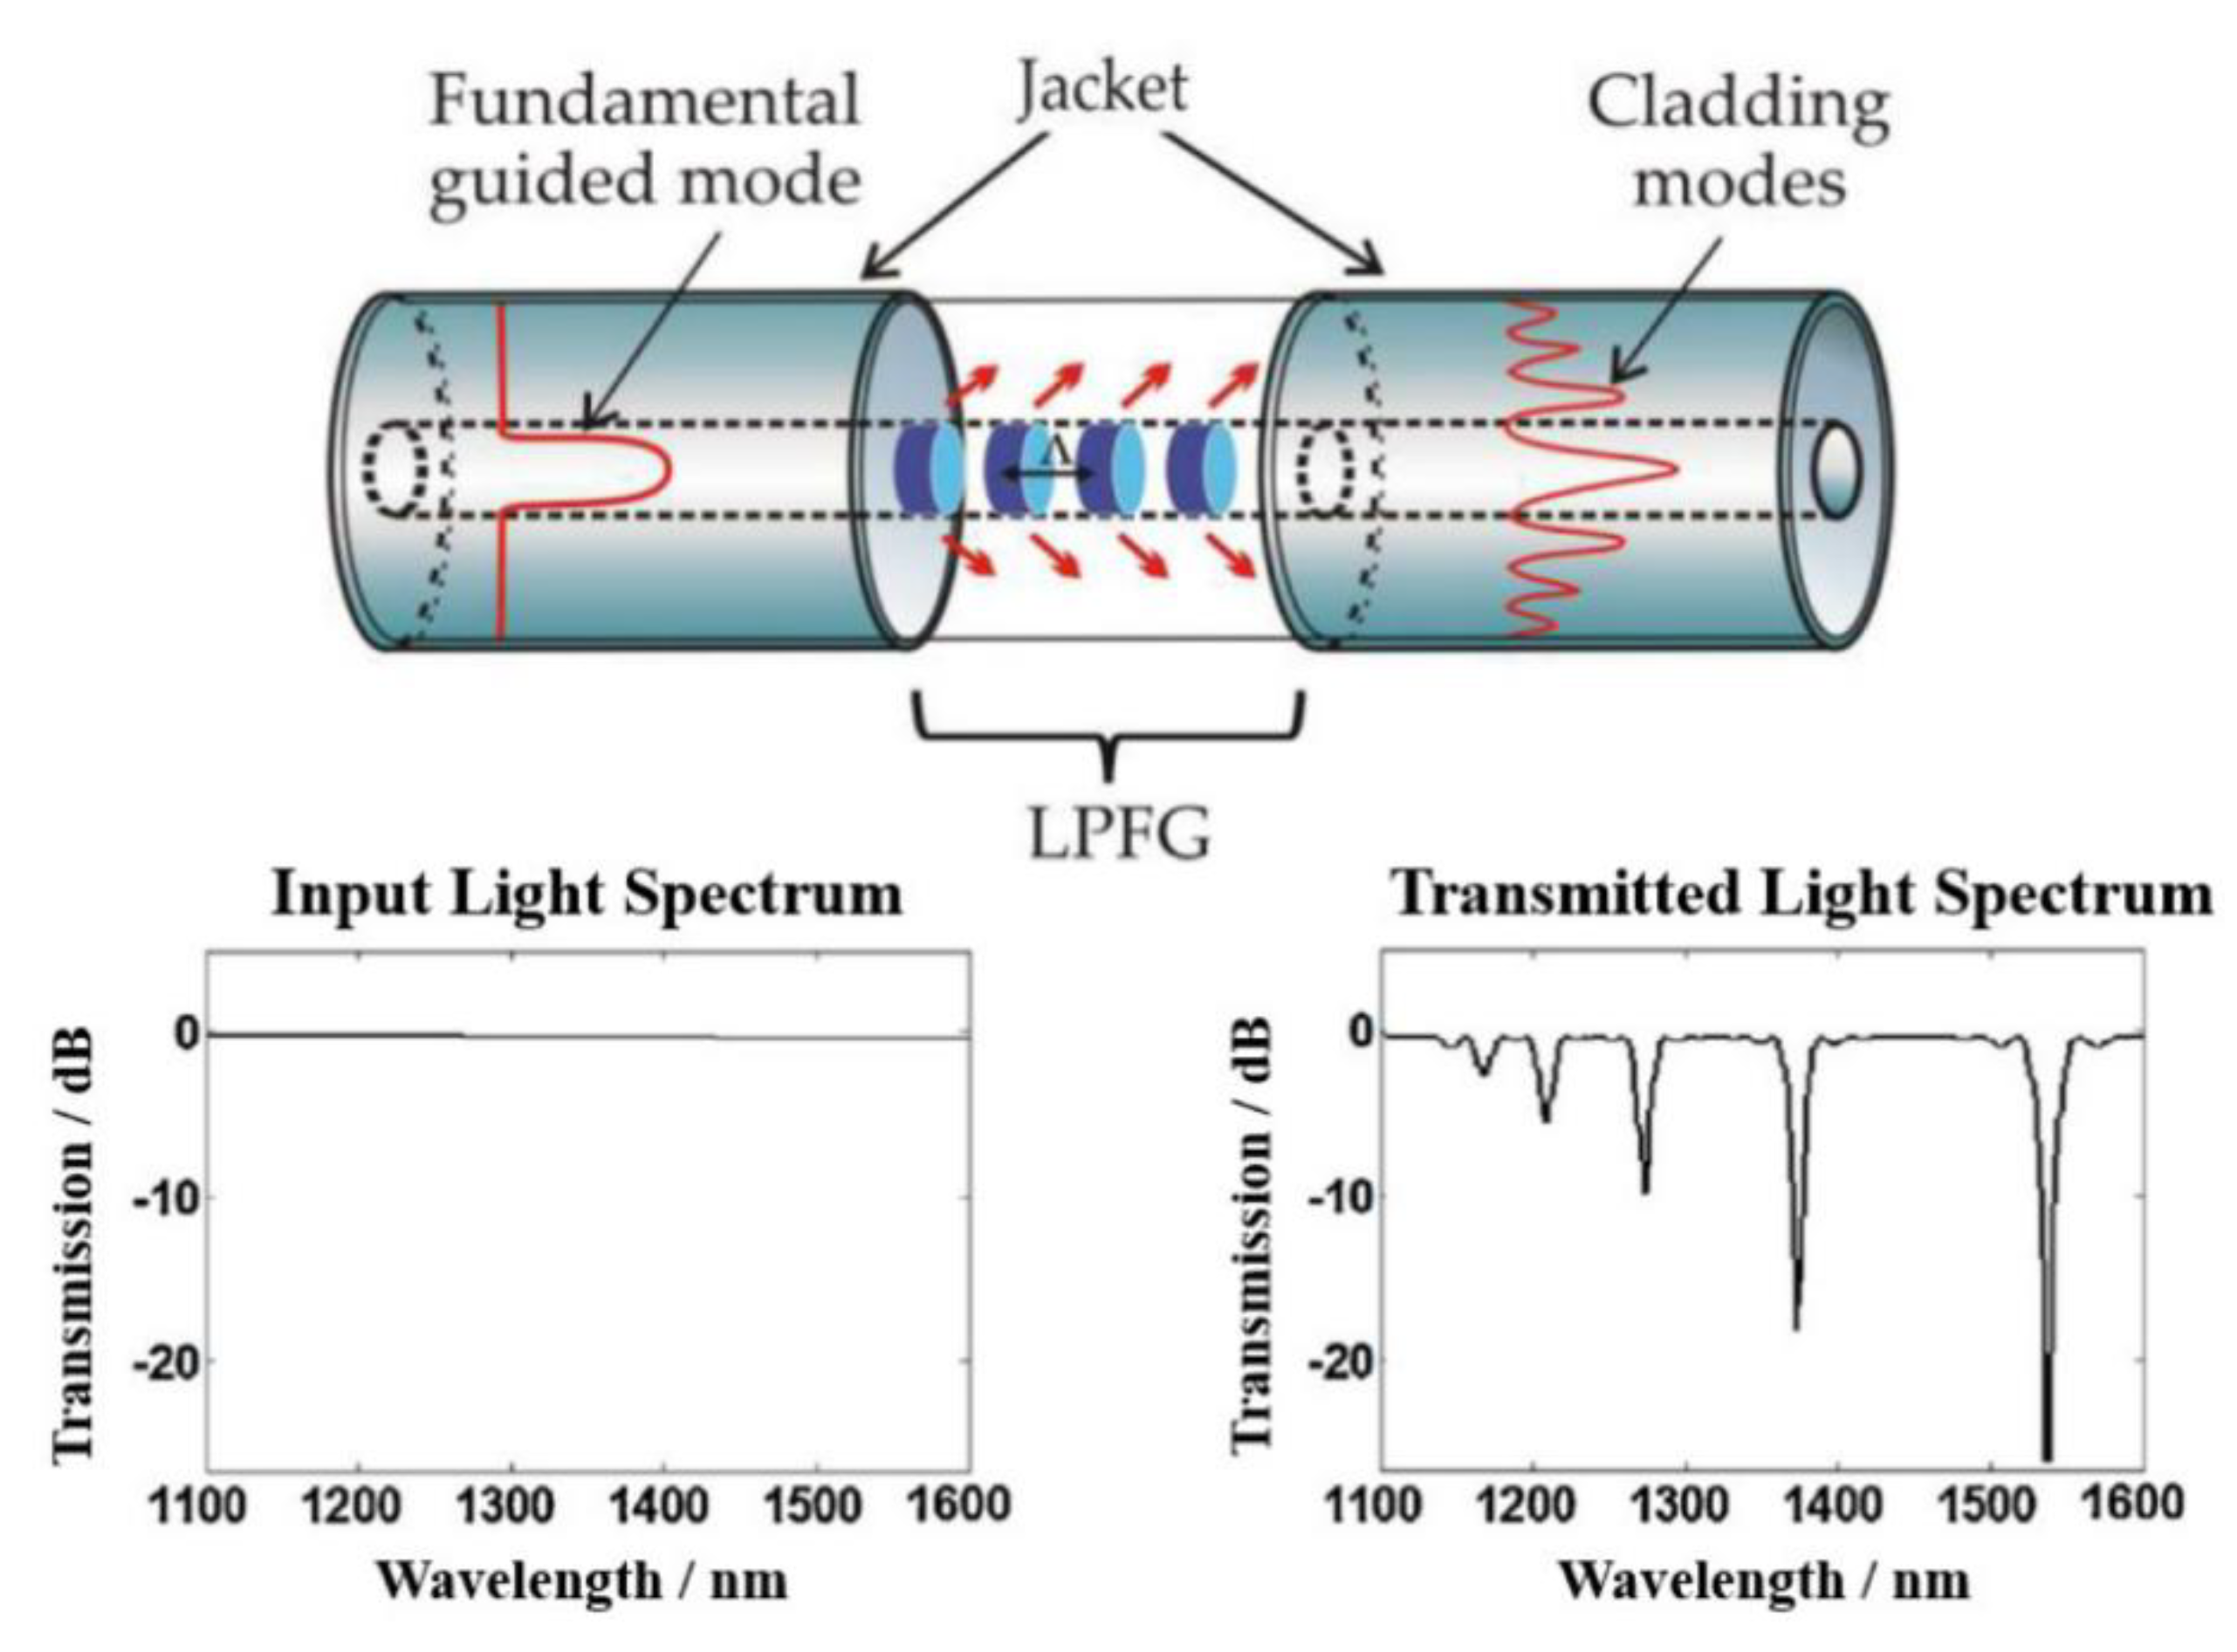
- Vengsarkar, A.M.; Bhatia, V. Optical fiber long-period grating sensors. Opt. Lett. 1996, 21, 692–694. [Google Scholar] [CrossRef]
- James, S.W.; Tatam, R.P. Optical fibre long-period grating sensors: Characteristics and application. Meas. Sci. Technol. 2003, 14, 49–61. [Google Scholar] [CrossRef] [Green Version]
- Tang, F.; Chen, G.; Tang, Y.; Bao, Y.; Chen, Y. A Fe-C coated long-period fiber grating sensor for corrosion-induced mass loss measurement. Opt. Lett. 2016, 41, 2306–2309. [Google Scholar] [CrossRef]
- Guo, C.; Fan, L.; Wu, C.; Chen, G.; Li, W. Ultrasensitive LPFG corrosion sensor with Fe-C coating electroplated on a Gr/AgNW film. Sens. Actuators B Chem. 2019, 283, 334–342. [Google Scholar] [CrossRef]
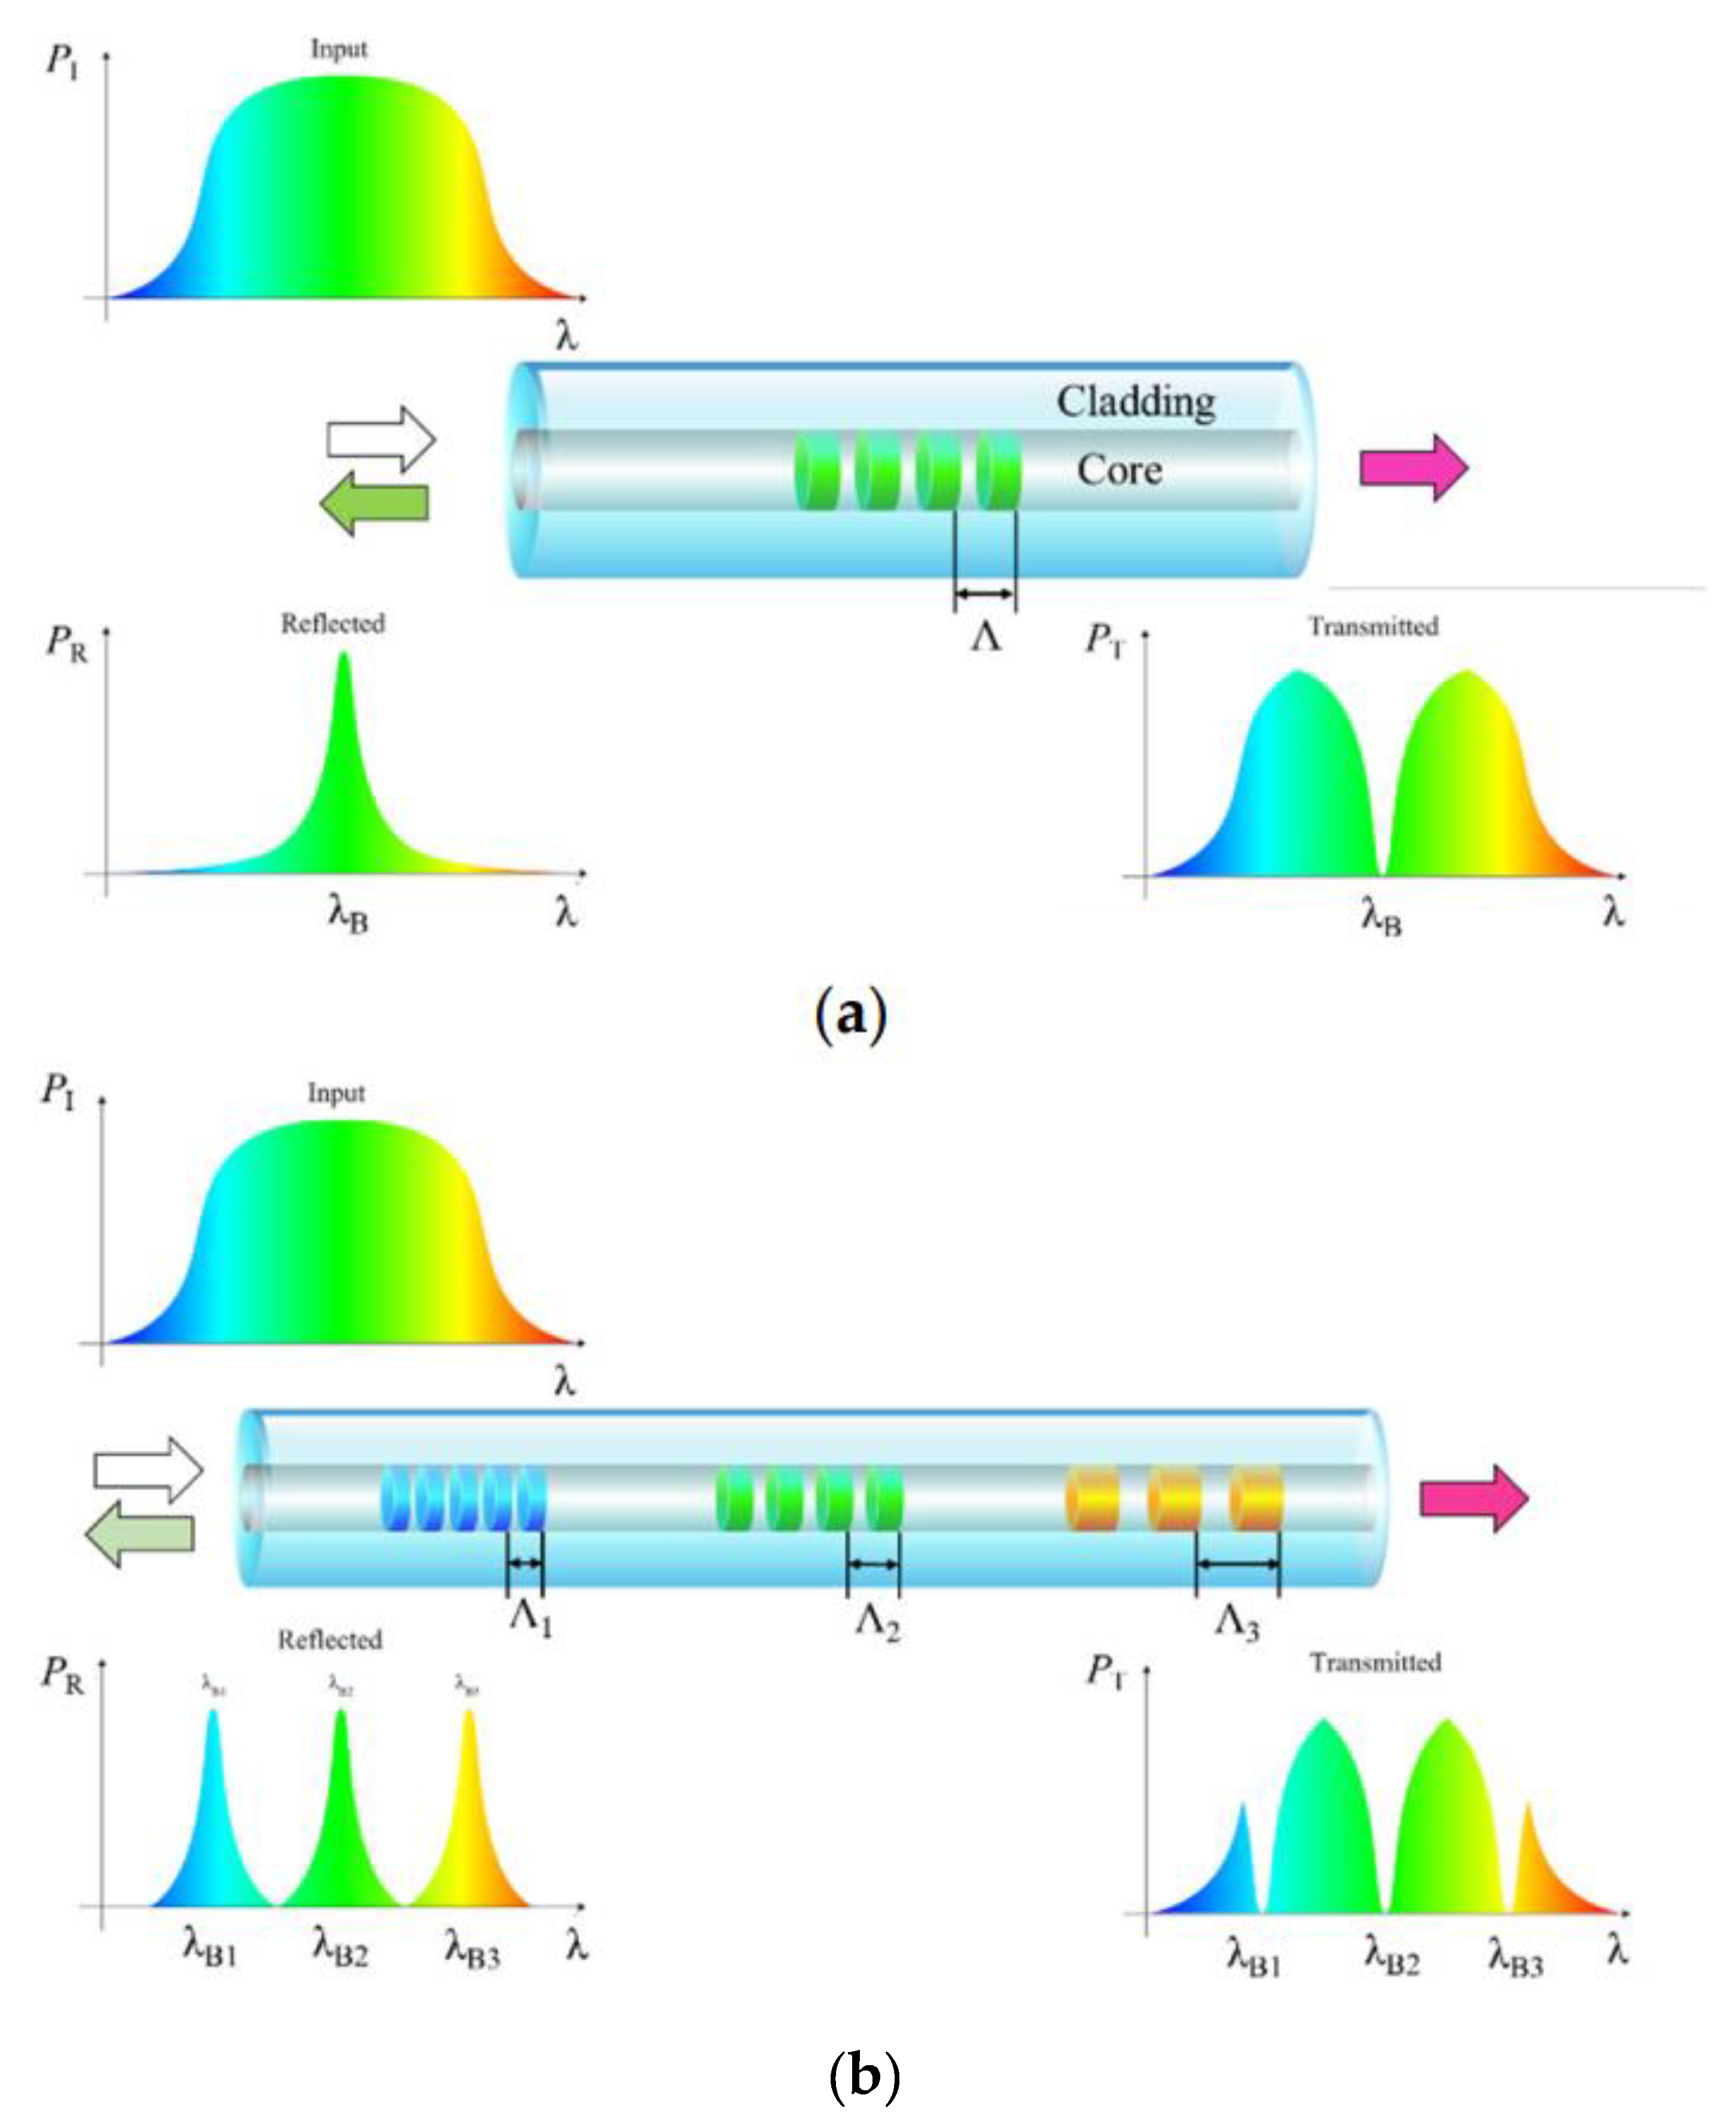
- Hou, Q.; Ren, L.; Jiao, W.; Zou, P.; Song, G. An improved negative pressure wave method for natural gas pipeline leak location using FBG based strain sensor and wavelet transform. Math. Probl. Eng. 2013, 2013, 278794. [Google Scholar] [CrossRef] [Green Version]
- Wang, J.; Grattan, K.T.V.; Zhao, L.; Sun, T.; Liu, T.; Li, Z. Novel negative pressure wave-based pipeline leak detection system using fiber bragg grating-based pressure sensors. J. Light. Technol. 2017, 35, 3366–3373. [Google Scholar] [CrossRef]
- Freire, J.L.F.; Perrut, V.A.; Braga, A.M.B.; Vieira, R.D.; Ribeiro, A.S.; Rosas, M.A.P. Use of FBG strain gages on a pipeline specimen repaired with a CFRE composite. Exp. Tech. 2015, 395, 70–79. [Google Scholar] [CrossRef]
- Xu, J.; Yang, D.; Qin, C.; Jiang, Y.; Sheng, L.; Jia, X.; Bai, Y.; Shen, X.; Wang, H.; Deng, X.; et al. Study and test of a new bundle-structure riser stress monitoring sensor based on FBG. Sensors 2015, 15, 29648–29660. [Google Scholar] [CrossRef] [Green Version]
- Morrison, D.G.; Dean, J.R. Apparatuses and Methods for Monitoring Stress in Steel Catenary Risers. U.S. Patent US7194913B2, 27 March 2007. [Google Scholar]
- Brower, D.; Prescott, N. Real time subsea monitoring and control smart field solutions. In Proceedings of the Subsea Rio 2004 Conference, Rio de Janeiro, Brazil, 3 June 2004. [Google Scholar]
- Yulianti, I.; Supa’at, A.S.M.; Idrus, S.M.; Kurdi, O.; Anwar, M.R.S. Sensitivity improvement of a fiber Bragg grating pH sensor with elastomeric coating. Meas. Sci. Technol. 2011, 23, 15104. [Google Scholar] [CrossRef]
- Tahhan, S.R.; Chen, R.Z.; Huang, S.; Hajim, K.I.; Chen, K.P. Fabrication of fiber bragg grating coating with TiO2 nanostructured metal oxide for refractive index sensor. J. Nanotechnol. 2017, 2017, 2791282. [Google Scholar] [CrossRef] [Green Version]
- Yeo, T.L.; Sun, T.; Grattan, K.T.V.; Parry, D.; Lade, R.; Powell, B.D. Characterisation of a polymer-coated fibre Bragg grating sensor for relative humidity sensing. Sens. Actuators B Chem. 2005, 1, 148–156. [Google Scholar] [CrossRef]
- Ukil, A.; Braendle, H.; Krippner, P. Distributed temperature sensing: Review of technology and applications. IEEE Sens. J. 2012, 12, 885–892. [Google Scholar] [CrossRef] [Green Version]
- Yamate, T.; Fujisawa, G.; Ikegami, T. Optical sensors for the exploration of oil and gas. J. Light. Technol. 2017, 35, 3538–3545. [Google Scholar] [CrossRef]
- Mirzaei, A.; Bahrampour, A.R.; Taraz, M.; Bahrampour, A.; Bahrampour, M.J.; Ahmadi Foroushani, S.M. Transient response of buried oil pipelines fiber optic leak detector based on the distributed temperature measurement. Int. J. Heat Mass Transf. 2013, 65, 110–122. [Google Scholar] [CrossRef]
- Stajanca, P.; Chruscicki, S.; Homann, T.; Seifert, S.; Schmidt, D.; Habib, A. Detection of leak-induced pipeline vibrations using fiber—Optic distributed acoustic sensing. Sensors 2018, 18, 2841. [Google Scholar] [CrossRef] [PubMed] [Green Version]
- Muanenda, Y. Recent advances in distributed acoustic sensing based on phase-sensitive optical time domain reflectometry. J. Sens. 2018, 2018, 3897873. [Google Scholar] [CrossRef]
- Joe, H.E.; Yun, H.; Jo, S.H.; Jun, M.B.G.; Min, B.K. A review on optical fiber sensors for environmental monitoring. Int. J. Precis. Eng. Manuf. Green Technol. 2018, 5, 173–191. [Google Scholar] [CrossRef]
- Zhang, Y.; Peng, H.; Qian, X.; Zhang, Y.; An, G.; Zhao, Y. Recent advancements in optical fiber hydrogen sensors. Sens. Actuators B Chem. 2017, 244, 393–416. [Google Scholar] [CrossRef] [Green Version]
- Lu, P.; Ziomek-moroz, M.; Buric, M.P. A Multifunctional Fiber Optic Sensor for Internal Corrosion Monitoring in Natural Gas Transmission Pipelines. In Proceedings of the NACE-International Corrosion Conference Series, Phoenix, AZ, USA, 15–19 April 2018. [Google Scholar]
- Knight, J.C.; Broeng, J.; Birks, T.A.; Russell, P.S.J. Photonic band gap guidance in optical fibers. Science 1998, 282, 1476–1478. [Google Scholar] [CrossRef] [PubMed]
- Monro, T.M.; Belardi, W.; Furusawa, K.; Baggett, J.C.; Broderick, N.G.R.; Richardson, D.J. Sensing with microstructured optical fibres. Meas. Sci. Technol. 2001, 12, 854–858. [Google Scholar] [CrossRef]
- Pinto, A.M.R.; Lopez-Amo, M. Photonic crystal fibers for sensing applications. J. Sens. 2012, 2012, 1–21. [Google Scholar] [CrossRef] [Green Version]
- Atkin, D.M.; Knight, J.C.; Russell, P.S.J.; Birks, T.A. All-silica single-mode optical fiber with photonic crystal cladding. Opt. Lett. 1996, 21, 1547–1549. [Google Scholar] [CrossRef]
- Hingerl, F.F.; Marpu, S.; Guzman, N.; Benson, S.M.; Delgado-Alonso, J. Development and testing of a new fiber optic system for monitoring CO2 solubility in aqueous high-pressure geological systems. Energy Procedia 2014, 63, 4134–4144. [Google Scholar] [CrossRef] [Green Version]
- George, A.K.; Hand, D.P.; Reid, D.T.; Knight, J.C.; Stone, J.M.; Gayraud, N.; MacPherson, W.N.; Kornaszewski, Ł. Mid-infrared methane detection in a photonic bandgap fiber using a broadband optical parametric oscillator. Opt. Express 2007, 15, 11219–11224. [Google Scholar] [CrossRef]
- Carvalho, J.P.; Lehmann, H.; Bartelt, H.; Magalhães, F.; Amezcua-Correa, R.; Santos, J.L.; Van Roosbroeck, J.; Araújo, F.M.; Ferreira, L.A.; Knight, J.C. Remote system for detection of low-levels of methane based on photonic crystal fibres and wavelength modulation spectroscopy. J. Sens. 2009, 2009, 1–10. [Google Scholar] [CrossRef]
- Tang, D.L.; He, S.; Dai, B.; Tang, X.H. Detection H2S mixed with natural gas using hollow-core photonic bandgap fiber. Optik 2014, 125, 2547–2549. [Google Scholar] [CrossRef]
- Hoo, Y.L.; Jin, W.; Shi, C.; Ho, H.L.; Wang, D.N.; Ruan, S.C. Design and modeling of a photonic crystal fiber gas sensor. Appl. Opt. 2003, 42, 3509. [Google Scholar] [CrossRef] [Green Version]
- Quintero, S.M.M.; Valente, L.C.G.; Gomes, M.S.D.P.; da Silva, H.G.; de Souza, B.C.; Morikawa, S.R.K. All-fiber co2 sensor using hollow core PCF operating in the 2 µm Region. Sensors 2018, 18, 4393. [Google Scholar] [CrossRef] [Green Version]
- Ding, L.; Li, Z.; Ding, Q.; Shen, X.; Yuan, Y.; Huang, J. Microstructured optical fiber based chloride ion sensing method for concrete health monitoring. Sens. Actuators B Chem. 2018, 260, 763–769. [Google Scholar] [CrossRef]
- Wright, R.F.; Egbu, J.; Lu, P.; Buric, M.; Ziomek-Moroz, M.; Ohodnicki, P.R. Electrolessly coated optical fibers for distributed corrosion monitoring. NACE-Int. Corros. Conf. Ser. 2019, 2019, 13499. [Google Scholar]
- Addanki, S.; Amiri, I.S.; Yupapin, P. Review of optical fibers-introduction and applications in fiber lasers. Results Phys. 2018, 10, 743–750. [Google Scholar] [CrossRef]
- Thomas, P.J.; Hellevang, J.O. A high response polyimide fiber optic sensor for distributed humidity measurements. Sens. Actuators B Chem. 2018, 270, 417–423. [Google Scholar] [CrossRef]
- Wright, R.; Badar, M.; Egbu, J.C.; Lu, P.; Buric, M.P.; Ohodnicki, P.R. Fully distributed optical fiber sensor for water and humidity monitoring. In Proceedings of the Fiber Optic Sensors and Applications XVI, Baltimore, MD, USA, 16–17 April 2019; Sanders, G.A., Lieberman, R.A., Scheel, I.U., Eds.; SPIE: Bellingham, WA, USA, 2019; Volume 11000, p. 6. [Google Scholar]
- Lu, X.; Thomas, P.J.; Hellevang, J.O. A review of methods for fibre-optic distributed chemical sensing. Sensors 2019, 19, 2876. [Google Scholar] [CrossRef] [Green Version]
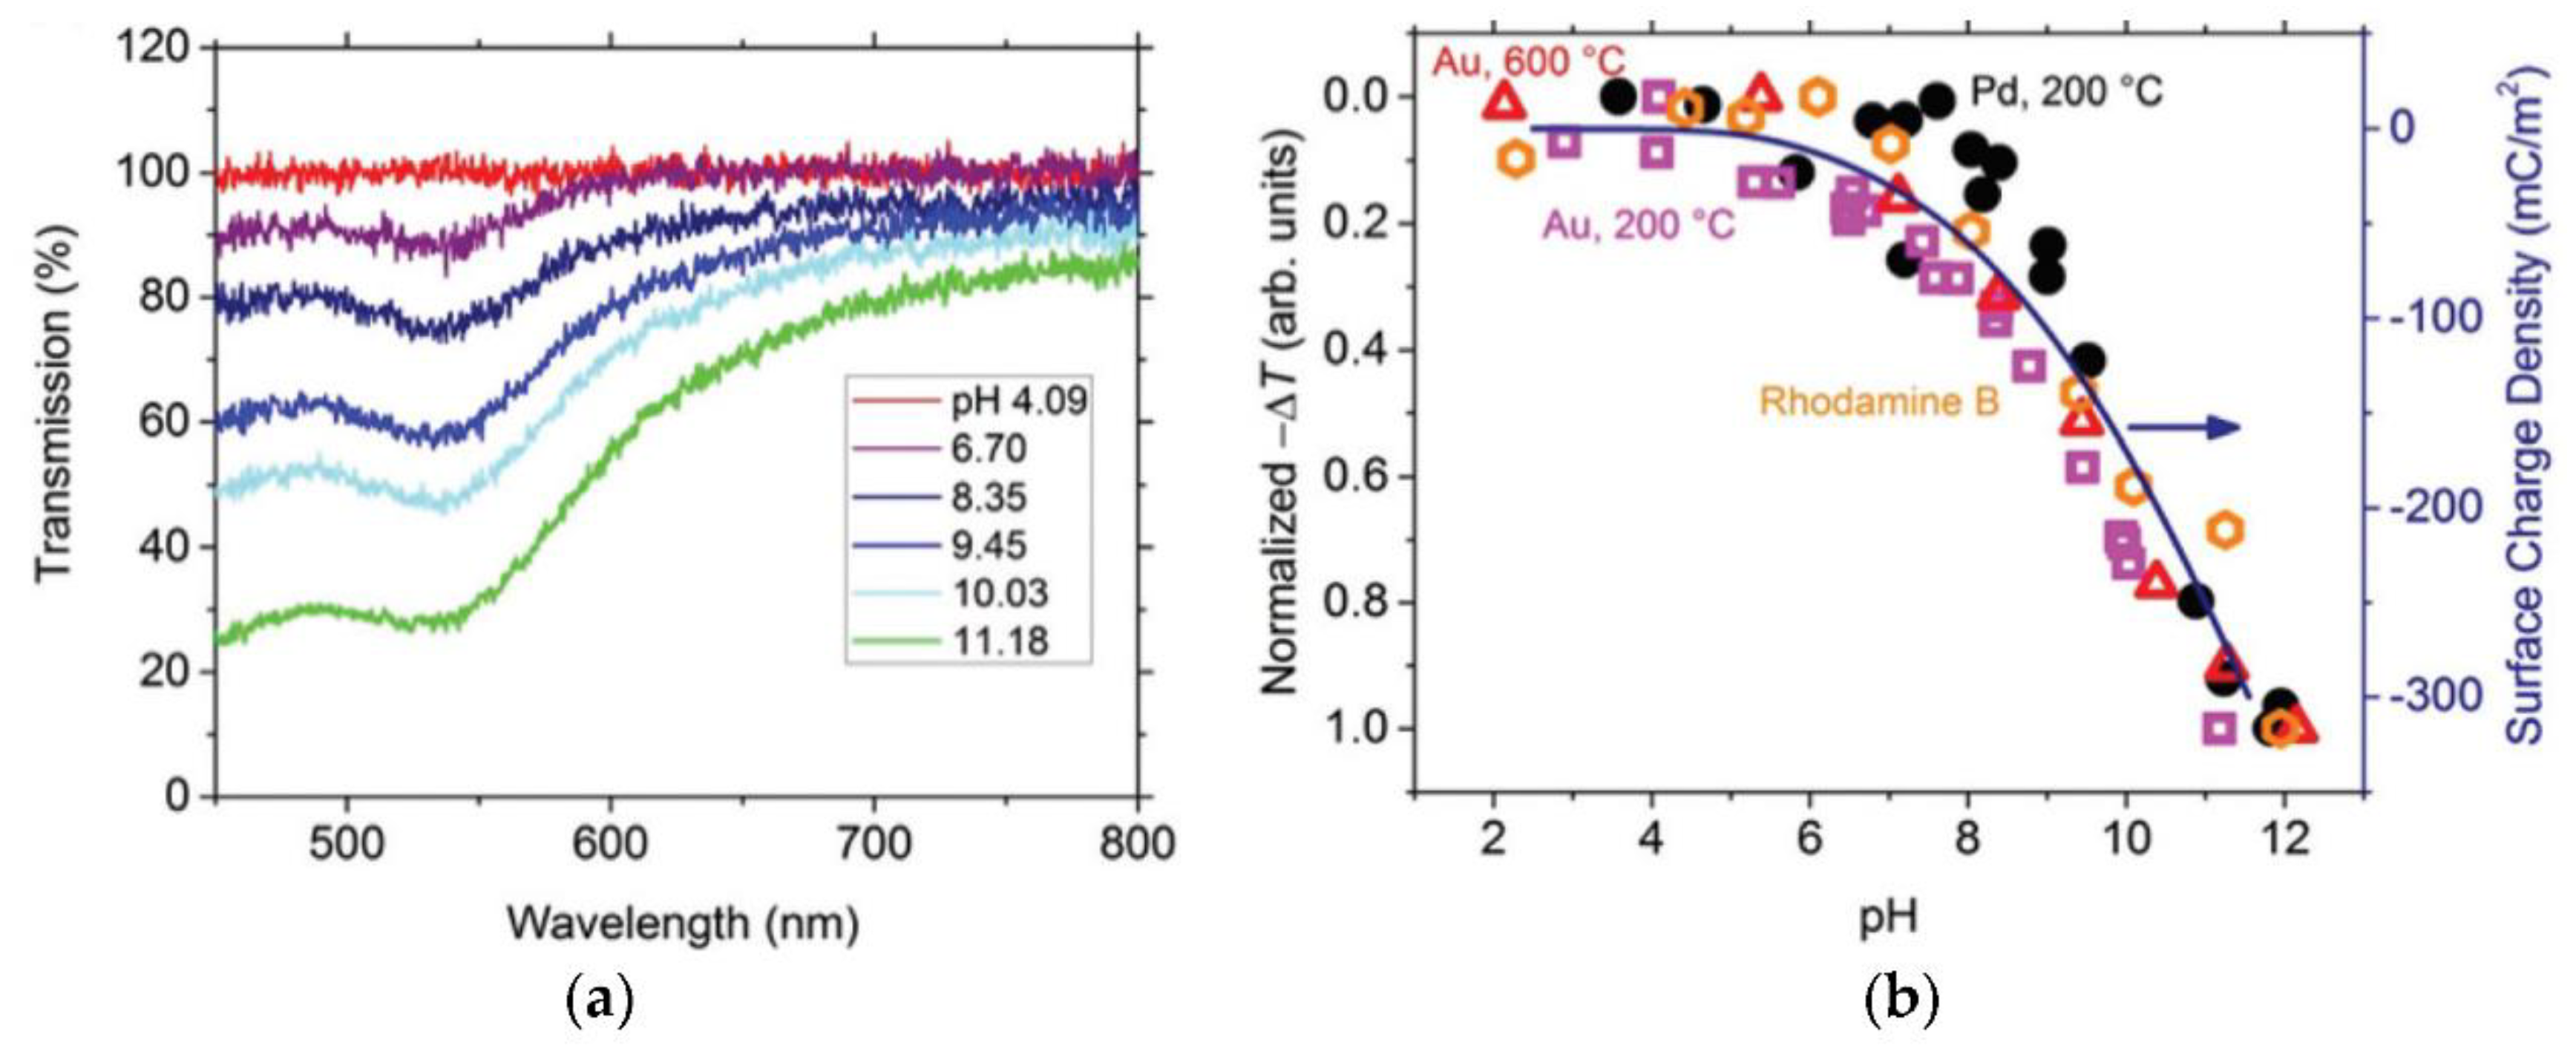
- Wang, C.; Ohodnicki, P.R.; Su, X.; Keller, M.; Brown, T.D.; Baltrus, J.P. Novel silica surface charge density mediated control of the optical properties of embedded optically active materials and its application for fiber optic pH sensing at elevated temperatures. Nanoscale 2015, 7, 2527–2535. [Google Scholar] [CrossRef]
- Mishra, S.K.; Gupta, B.D. Surface plasmon resonance based fiber optic pH sensor utilizing Ag/ITO/Al/hydrogel layers. Analyst 2013, 138, 2640–2646. [Google Scholar] [CrossRef] [PubMed]
- Rivero, P.J.; Goicoechea, J.; Hernaez, M.; Socorro, A.B.; Matias, I.R.; Arregui, F.J. Optical fiber resonance-based pH sensors using gold nanoparticles into polymeric layer-by-layer coatings. Microsyst. Technol. 2016, 22, 1821–1829. [Google Scholar] [CrossRef]
- Miled, O.B.; Grosso, D.; Sanchez, C.; Livage, J. An optical fibre pH sensor based on dye doped mesostructured silica. J. Phys. Chem. Solids 2004, 65, 1751–1755. [Google Scholar] [CrossRef]
- Gupta, B.D.; Sharma, S. A long-range fiber optic pH sensor prepared by dye doped sol-gel immobilization technique. Opt. Commun. 1998, 154, 282–284. [Google Scholar] [CrossRef]
- Beltrán-Pérez, G.; López-Huerta, F.; Muñoz-Aguirre, S.; Castillo-Mixcóatl, J.; Palomino-Merino, R.; Lozada-Morales, R.; Portillo-Moreno, O. Fabrication and characterization of an optical fiber pH sensor using sol–gel deposited TiO2 film doped with organic dyes. Sens. Actuators B Chem. 2006, 120, 74–78. [Google Scholar] [CrossRef]
- Schyrr, B.; Pasche, S.; Scolan, E.; Ischer, R.; Ferrario, D.; Porchet, J.A.; Voirin, G. Development of a polymer optical fiber pH sensor for on-body monitoring application. Sens. Actuators B Chem. 2014, 194, 238–248. [Google Scholar] [CrossRef]
- Gupta, B.D.; Sharma, D.K. Evanescent wave absorption based fiber optic pH sensor prepared by dye doped sol-gel immobilization technique. Opt. Commun. 1997, 140, 32–35. [Google Scholar] [CrossRef]
- Alvarado-Méndez, E.; Rojas-Laguna, R.; Andrade-Lucio, J.A.; Hernández-Cruz, D.; Lessard, R.A.; Aviña-Cervantes, J.G. Design and characterization of pH sensor based on sol-gel silica layer on plastic optical fiber. Sens. Actuators B Chem. 2005, 106, 518–522. [Google Scholar] [CrossRef]
- Nguyen, T.H.; Venugopala, T.; Chen, S.; Sun, T.; Grattan, K.T.V.; Taylor, S.E.; Basheer, P.A.M.; Long, A.E. Fluorescence based fibre optic pH sensor for the pH 10–13 range suitable for corrosion monitoring in concrete structures. Sens. Actuators B Chem. 2014, 191, 498–507. [Google Scholar] [CrossRef]
- Ton, X.-A.; Acha, V.; Bonomi, P.; Bui, B.T.S.; Haupt, K. A disposable evanescent wave fiber optic sensor coated with a molecularly imprinted polymer as a selective fluorescence probe. Biosens. Bioelectron. 2015, 64, 359–366. [Google Scholar] [CrossRef]
- Rosenberg, M.; Laursen, B.W.; Frankær, C.G.; Sørensen, T.J. A fluorescence intensity ratiometric fiber optics–based chemical sensor for monitoring pH. Adv. Mater. Technol. 2018, 3, 1800205. [Google Scholar] [CrossRef]
- Wallace, P.A.; Campbell, M.; Yang, Y.; Holmes-Smith, A.S.; Uttamlal, M. A distributed optical fibre fluorosensor for pH measurement. J. Lumin. 1997, 72–74, 1017–1019. [Google Scholar] [CrossRef]
- Nguyen, T.H.; Venugopalan, T.; Sun, T.; Grattan, K.T.V. Intrinsic fiber optic pH sensor for measurement of pH values in the range of 0.5–6. IEEE Sens. J. 2016, 16, 881–887. [Google Scholar] [CrossRef]
- Shao, L.-Y.; Yin, M.-J.; Tam, H.-Y.; Albert, J. Fiber optic pH sensor with self-assembled polymer multilayer nanocoatings. Sensors 2013, 13, 1425–1434. [Google Scholar] [CrossRef]
- Jin, Z.; Su, Y.; Duan, Y. An improved optical pH sensor based on polyaniline. Sens. Actuators B Chem. 2000, 71, 118–122. [Google Scholar] [CrossRef]
- Moutsiopoulou, A.; Andreopoulou, A.K.; Lainioti, G.; Bokias, G.; Voyiatzis, G.; Kallitsis, J.K. Quinoline-functionalized cross-linked poly(vinyl acetate) and poly(vinyl alcohol) nanoparticles as potential pH-responsive luminescent sensors. Sens. Actuators B Chem. 2015, 211, 235–244. [Google Scholar] [CrossRef]
- Rivero, P.J.; Goicoechea, J.; Arregui, F.J. Optical fiber sensors based on polymeric sensitive coatings. Polymers 2018, 10, 280. [Google Scholar] [CrossRef] [PubMed] [Green Version]
- Singh, S.; Gupta, B.D. Fabrication and characterization of a highly sensitive surface plasmon resonance based fiber optic pH sensor utilizing high index layer and smart hydrogel. Sens. Actuators B Chem. 2012, 173, 268–273. [Google Scholar] [CrossRef]
- Pathak, A.K.; Singh, V.K. A wide range and highly sensitive optical fiber pH sensor using polyacrylamide hydrogel. Opt. Fiber Technol. 2017, 39, 43–48. [Google Scholar] [CrossRef]
- Zhao, Y.; Lei, M.; Liu, S.X.; Zhao, Q. Smart hydrogel-based optical fiber SPR sensor for pH measurements. Sens. Actuators B Chem. 2018, 261, 226–232. [Google Scholar] [CrossRef]
- Richter, A.; Paschew, G.; Klatt, S.; Lienig, J.; Arndt, K.-F.; Adler, H.-J.P. Review on hydrogel-based pH sensors and microsensors. Sensors 2008, 8, 561–581. [Google Scholar] [CrossRef] [Green Version]
- Ohodnicki, P.R., Jr.; Wang, C. Optical waveguide modeling of refractive index mediated pH responses in silica nanocomposite thin film based fiber optic sensors. J. Appl. Phys. 2016, 119, 064502. [Google Scholar] [CrossRef] [Green Version]
- Lin, J. Recent development and applications of optical and fiber-optic pH sensors. TrAC-Trends Anal. Chem. 2000, 19, 541–552. [Google Scholar] [CrossRef]
- Kocak, G.; Tuncer, C.; Bütün, V. pH-Responsive polymers. Polym. Chem. 2016, 8, 144–176. [Google Scholar] [CrossRef]
- Qian, Y.; Zhao, Y.; Wu, Q.; Yang, Y. Review of salinity measurement technology based on optical fiber sensor. Sens. Actuators B Chem. 2018, 260, 86–105. [Google Scholar] [CrossRef]
- Rahman, H.A.; Harun, S.W.; Yasin, M.; Phang, S.W.; Damanhuri, S.S.A.; Arof, H.; Ahmad, H. Tapered plastic multimode fiber sensor for salinity detection. Sens. Actuators A Phys. 2011, 171, 219–222. [Google Scholar] [CrossRef]
- Wang, J.; Chen, B. Experimental research of optical fiber sensor for salinity measurement. Sens. Actuators A Phys. 2012, 184, 53–56. [Google Scholar] [CrossRef]
- Lemaire, P.J. Hydrogen-induced losses and their effects on optical fiber reliability. Fiber Opt. Reliab. Test. A Crit. Rev. 1993, 10272, 1027207. [Google Scholar] [CrossRef]
- 50 Graded-Index OM2-Bend-Insensitive Multimode Optical Fiber. Available online: www.ofsoptics.com (accessed on 18 August 2021).
- Chen, H.; Buric, M.; Ohodnicki, P.R.; Nakano, J.; Liu, B.; Chorpening, B.T. Review and perspective: Sapphire optical fiber cladding development for harsh environment sensing. Appl. Phys. Rev. 2018, 5, 011102. [Google Scholar] [CrossRef]
- Dong, Y.; Chen, L.; Bao, X. Extending the sensing range of Brillouin optical time-domain analysis combining frequency-division multiplexing and in-line EDFAs. J. Light. Technol. 2012, 30, 1161–1167. [Google Scholar] [CrossRef]
- Loayssa, A.; Urricelqui, J.; Mompó, J.J. Brillouin optical time-domain analysis sensor with pump pulse amplification. Opt. Express 2016, 24, 12672–12681. [Google Scholar] [CrossRef] [Green Version]
- Angulo-Vinuesa, X.; Martin-Lopez, S.; Corredera, P.; Gonzalez-Herraez, M. Raman-assisted Brillouin optical time-domain analysis with sub-meter resolution over 100 km. Opt. Express 2012, 20, 12147. [Google Scholar] [CrossRef] [Green Version]
- Moore, J.; Froggatt, M. High-spatial-resolution distributed strain measurement in optical fiber with Rayleigh scatter. Appl. Opt. 1998, 37, 1735–1740. [Google Scholar] [CrossRef]
- Kreger, S.T.; Gifford, D.K.; Froggatt, M.E.; Soller, B.J.; Wolfe, M.S. High resolution distributed strain or temperature measurements in single- and multi-mode fiber using swept-wavelength interferometry. In Proceedings of the Optical Fiber Sensors 2006, Cancun, Mexico, 23–27 October 2006. [Google Scholar] [CrossRef] [Green Version]
- Ding, Z.; Yang, D.; Du, Y.; Liu, K.; Zhou, Y.; Zhang, R.; Xu, Z.; Jiang, J.; Liu, T. Distributed strain and temperature discrimination using two types of fiber in OFDR. IEEE Photonics J. 2016, 8, 1–8. [Google Scholar] [CrossRef]
- Zhou, D.-P.; Li, W.; Chen, L.; Bao, X. Distributed temperature and strain discrimination with stimulated Brillouin scattering and rayleigh backscatter in an optical fiber. Sensors 2013, 13, 1836–1845. [Google Scholar] [CrossRef] [Green Version]
- Peng, F.; Wu, H.; Jia, X.-H.; Rao, Y.-J.; Peng, Z.-P.; Wang, Z.-N. Ultra-long high-sensitivity Φ-OTDR for high spatial resolution intrusion detection of pipelines. Opt. Express 2014, 22, 13804–13810. [Google Scholar] [CrossRef] [PubMed]
- Salameh, J.P.; Cauet, S.; Etien, E.; Sakout, A.; Rambault, L. Gearbox condition monitoring in wind turbines: A review. Mech. Syst. Signal Process. 2018, 111, 251–264. [Google Scholar] [CrossRef]
- Schlechtingen, M.; Santos, I.F.; Achiche, S. Wind turbine condition monitoring based on SCADA data using normal behavior models. Part 1: System description. Appl. Soft Comput. J. 2013, 13, 259–270. [Google Scholar] [CrossRef]
- Schlechtingen, M.; Santos, I.F. Wind turbine condition monitoring based on SCADA data using normal behavior models. Part 2: Application examples. Appl. Soft Comput. J. 2014, 14, 447–460. [Google Scholar] [CrossRef]
- Song, Z.; Zhang, Z.; Jiang, Y.; Zhu, J. Wind turbine health state monitoring based on a Bayesian data-driven approach. Renew. Energy 2018, 125, 172–181. [Google Scholar] [CrossRef]
- Yang, W.; Court, R.; Jiang, J. Wind turbine condition monitoring by the approach of SCADA data analysis. Renew. Energy 2013, 53, 365–376. [Google Scholar] [CrossRef]
- Nie, M.; Wang, L. Review of condition monitoring and fault diagnosis technologies for wind turbine gearbox. Procedia CIRP 2013, 11, 287–290. [Google Scholar] [CrossRef] [Green Version]
- Romero, A.; Soua, S.; Gan, T.-H.; Wang, B. Condition monitoring of a wind turbine drive train based on its power dependant vibrations. Renew. Energy 2018, 123, 817–827. [Google Scholar] [CrossRef]
- Wymore, M.L.; Van Dam, J.E.; Ceylan, H.; Qiao, D. A survey of health monitoring systems for wind turbines. Renew. Sustain. Energy Rev. 2015, 52, 976–990. [Google Scholar] [CrossRef]
- Lu, B.; Li, Y.; Wu, X.; Yang, Z. A review of recent advances in wind turbine condition monitoring and fault diagnosis. In Proceedings of the 2009 IEEE Power Electronics and Machines in Wind Applications, Lincoln, NE, USA, 24–26 June 2009; IEEE: Piscataway, NJ, USA, 2009; pp. 1–7. [Google Scholar]
- Sutherland, H.; Beattie, A.; Hansche, B.; Musial, W.; Allread, J.; Johnson, J.; Summers, M. The Application of Non-Destructive Techniques to the Testing of a Wind Turbine Blade; USDOE: Washington, DC, USA, 1994. [Google Scholar] [CrossRef] [Green Version]
- Kirikera, G.R.; Shinde, V.; Schulz, M.J.; Sundaresan, M.J.; Hughes, S.; van Dam, J.; Nkrumah, F.; Grandhi, G.; Ghoshal, A. Monitoring multi-site damage growth during quasi-static testing of a wind turbine blade using a structural neural system. Struct. Health Monit. 2008, 7, 157–173. [Google Scholar] [CrossRef]
- Blanch, M.J.; Dutton, A.G. Acoustic emission monitoring of field tests of an operating wind turbine. Key Eng. Mater. 2003, 245, 475–482. [Google Scholar] [CrossRef]
- Papasalouros, D.; Tsopelas, N.; Anastasopoulos, A.; Kourousis, D.; Lekou, D.J.; Mouzakis, F. Acoustic emission monitoring of composite blade of NM48/750 NEG-MICON wind turbine. J. Acoust. Emiss. 2013, 36, 1. [Google Scholar]
- Rumsey, M.A.; Paquette, J.A. Structural health monitoring of wind turbine blades. Smart Sens. Phenom. Technol. Netw. Syst. 2008, 6933, 69330E. [Google Scholar] [CrossRef]
- Berg, J.C.; Resor, B.R.; Paquette, J.A.; White, J.R. SANDIA REPORT SMART Wind Turbine Rotor: Design and Field Test; SAND2014-0681 6678; U.S. Department of Energy: Washington, DC, USA, 2014. [Google Scholar]
- Hyers, R.W.; Mcgowan, J.G.; Sullivan, K.L.; Manwell, J.F.; Syrett, B.C. Condition monitoring and prognosis of utility scale wind turbines. Energy Mater. 2006, 1, 187–203. [Google Scholar] [CrossRef]
- Ozbek, M.; Meng, F.; Rixen, D.J. Challenges in testing and monitoring the in-operation vibration characteristics of wind turbines. Mech. Syst. Signal Process. 2013, 41, 649–666. [Google Scholar] [CrossRef]
- Hwang, S.; An, Y.-K.; Sohn, H. Continuous line laser thermography for damage imaging of rotating wind turbine blades. Procedia Eng. 2017, 188, 225–232. [Google Scholar] [CrossRef]
- Amenabar, I.; Mendikute, A.; López-Arraiza, A.; Lizaranzu, M.; Aurrekoetxea, J. Comparison and analysis of non-destructive testing techniques suitable for delamination inspection in wind turbine blades. Compos. Part B Eng. 2011, 42, 1298–1305. [Google Scholar] [CrossRef]
- Guo, P.; Infield, D. Wind turbine tower vibration modeling and monitoring by the nonlinear state estimation technique (NSET). Energies 2012, 5, 5279–5293. [Google Scholar] [CrossRef] [Green Version]
- Kusiak, A.; Zhang, Z. Analysis of wind turbine vibrations based on SCADA data. J. Sol. Energy Eng. 2010, 132, 0310081–03100812. [Google Scholar] [CrossRef]
- Andrew Swartz, R.; Lynch, J.P.; Zerbst, S.; Sweetman, B.; Rolfes, R. Structural monitoring of wind turbines using wireless sensor networks. Smart Struct. Syst. 2010, 6, 183–196. [Google Scholar] [CrossRef] [Green Version]
- Kilic, G.; Unluturk, M.S. Testing of wind turbine towers using wireless sensor network and accelerometer. Renew. Energy 2015, 75, 318–325. [Google Scholar] [CrossRef]
- Smarsly, K.; Hartmann, D. Structural health monitoring of wind turbines observed by autonomous software components–2nd level monitoring. In Proceedings of the 14th International Conference on Computing in Civil and Building Engineering, Moscow, Russia, 27–29 June 2012. [Google Scholar]
- Smarsly, K.; Hartmann, D.; Law, K.H. A Computational framework for life-cycle management of wind turbines incorporating structural health monitoring. Struct. Health Monit. 2013, 12, 359–376. [Google Scholar] [CrossRef] [Green Version]
- Smarsly, K.; Hartmann, D.; Law, K.H. An integrated monitoring system for life-cycle management of wind turbines. Smart Struct. Syst. 2013, 12, 209–233. [Google Scholar] [CrossRef] [Green Version]
- Rolfes, R.; Zerbst, S.; Haake, G.; Reetz, J.; Lynch, J.P. Integral SHM-System for Offshore Wind Turbines Using Smart Wireless Sensors. In Proceedings of the International Workshop on Structural Health Monitoring, Stanford, CA, USA, 11–13 September 2007; pp. 1–8. [Google Scholar]
- Fritzen, C.-P.; Kraemer, P.; Klinkov, M. An Integrated SHM Approach for Offshore Wind Energy Plants Introduction: Short Overview of Monitoring Systems for OWEP. In Proceedings of the IMAC-XXVIII, Jacksonville, FL, USA, 1–4 February 2011. [Google Scholar]
- Faulkner, P.; Cutter, P.; Owens, A. Structural Health Monitoring Systems in Difficult Environments-Offshore Wind Turbines. In Proceedings of the 6th European Workshop on Structural Health Monitoring, Dresden, Germany, 2–3 February 2012. [Google Scholar]
- Devriendt, C.; Magalhães, F.; El Kafafy, M.; De Sitter, G.; Cunha, Á.; Guillaume, P. Long-term dynamic monitoring of an offshore wind turbine. In Topics in Dynamics of Civil Structures, Volume 4, Proceedings of the 31st IMAC, A Conference on Structural Dynamics; Springer: Berlin/Heidelberg, Germany, 2013; pp. 253–267. [Google Scholar] [CrossRef]
- Wind Farm Fears as Blade Snaps | The Times. Available online: https://www.thetimes.co.uk/article/wind-farm-fears-as-blade-snaps-gd9wg90wwns (accessed on 18 August 2021).
- Yang, W.; Peng, Z.; Wei, K.; Tian, W. Structural health monitoring of composite wind turbine blades: Challenges, issues and potential solutions. IET Renew. Power Gener. 2017, 11, 411–416. [Google Scholar] [CrossRef] [Green Version]
- Ou, Y.; Grauvogl, B.; Spiridonakos, M.; Dertimanis, V.; Chatzi, E.; Vidal, J. Vibration-based damage detection on a blade of a small scale wind turbine. In Proceedings of the 10th International Workshop on Structural Health Monitoring IWSHM 2015, Porto, Portugal, 1–3 September 2015. [Google Scholar] [CrossRef]
- Wei, J.; McCarty, J. Acoustic emission evaluation of composite wind turbine blades during fatigue testing on JSTOR. JSTOR 1993, 17, 266–274. [Google Scholar]


| Parameter | Potential Target |
|---|---|
| Temperature | Up to 400 °C |
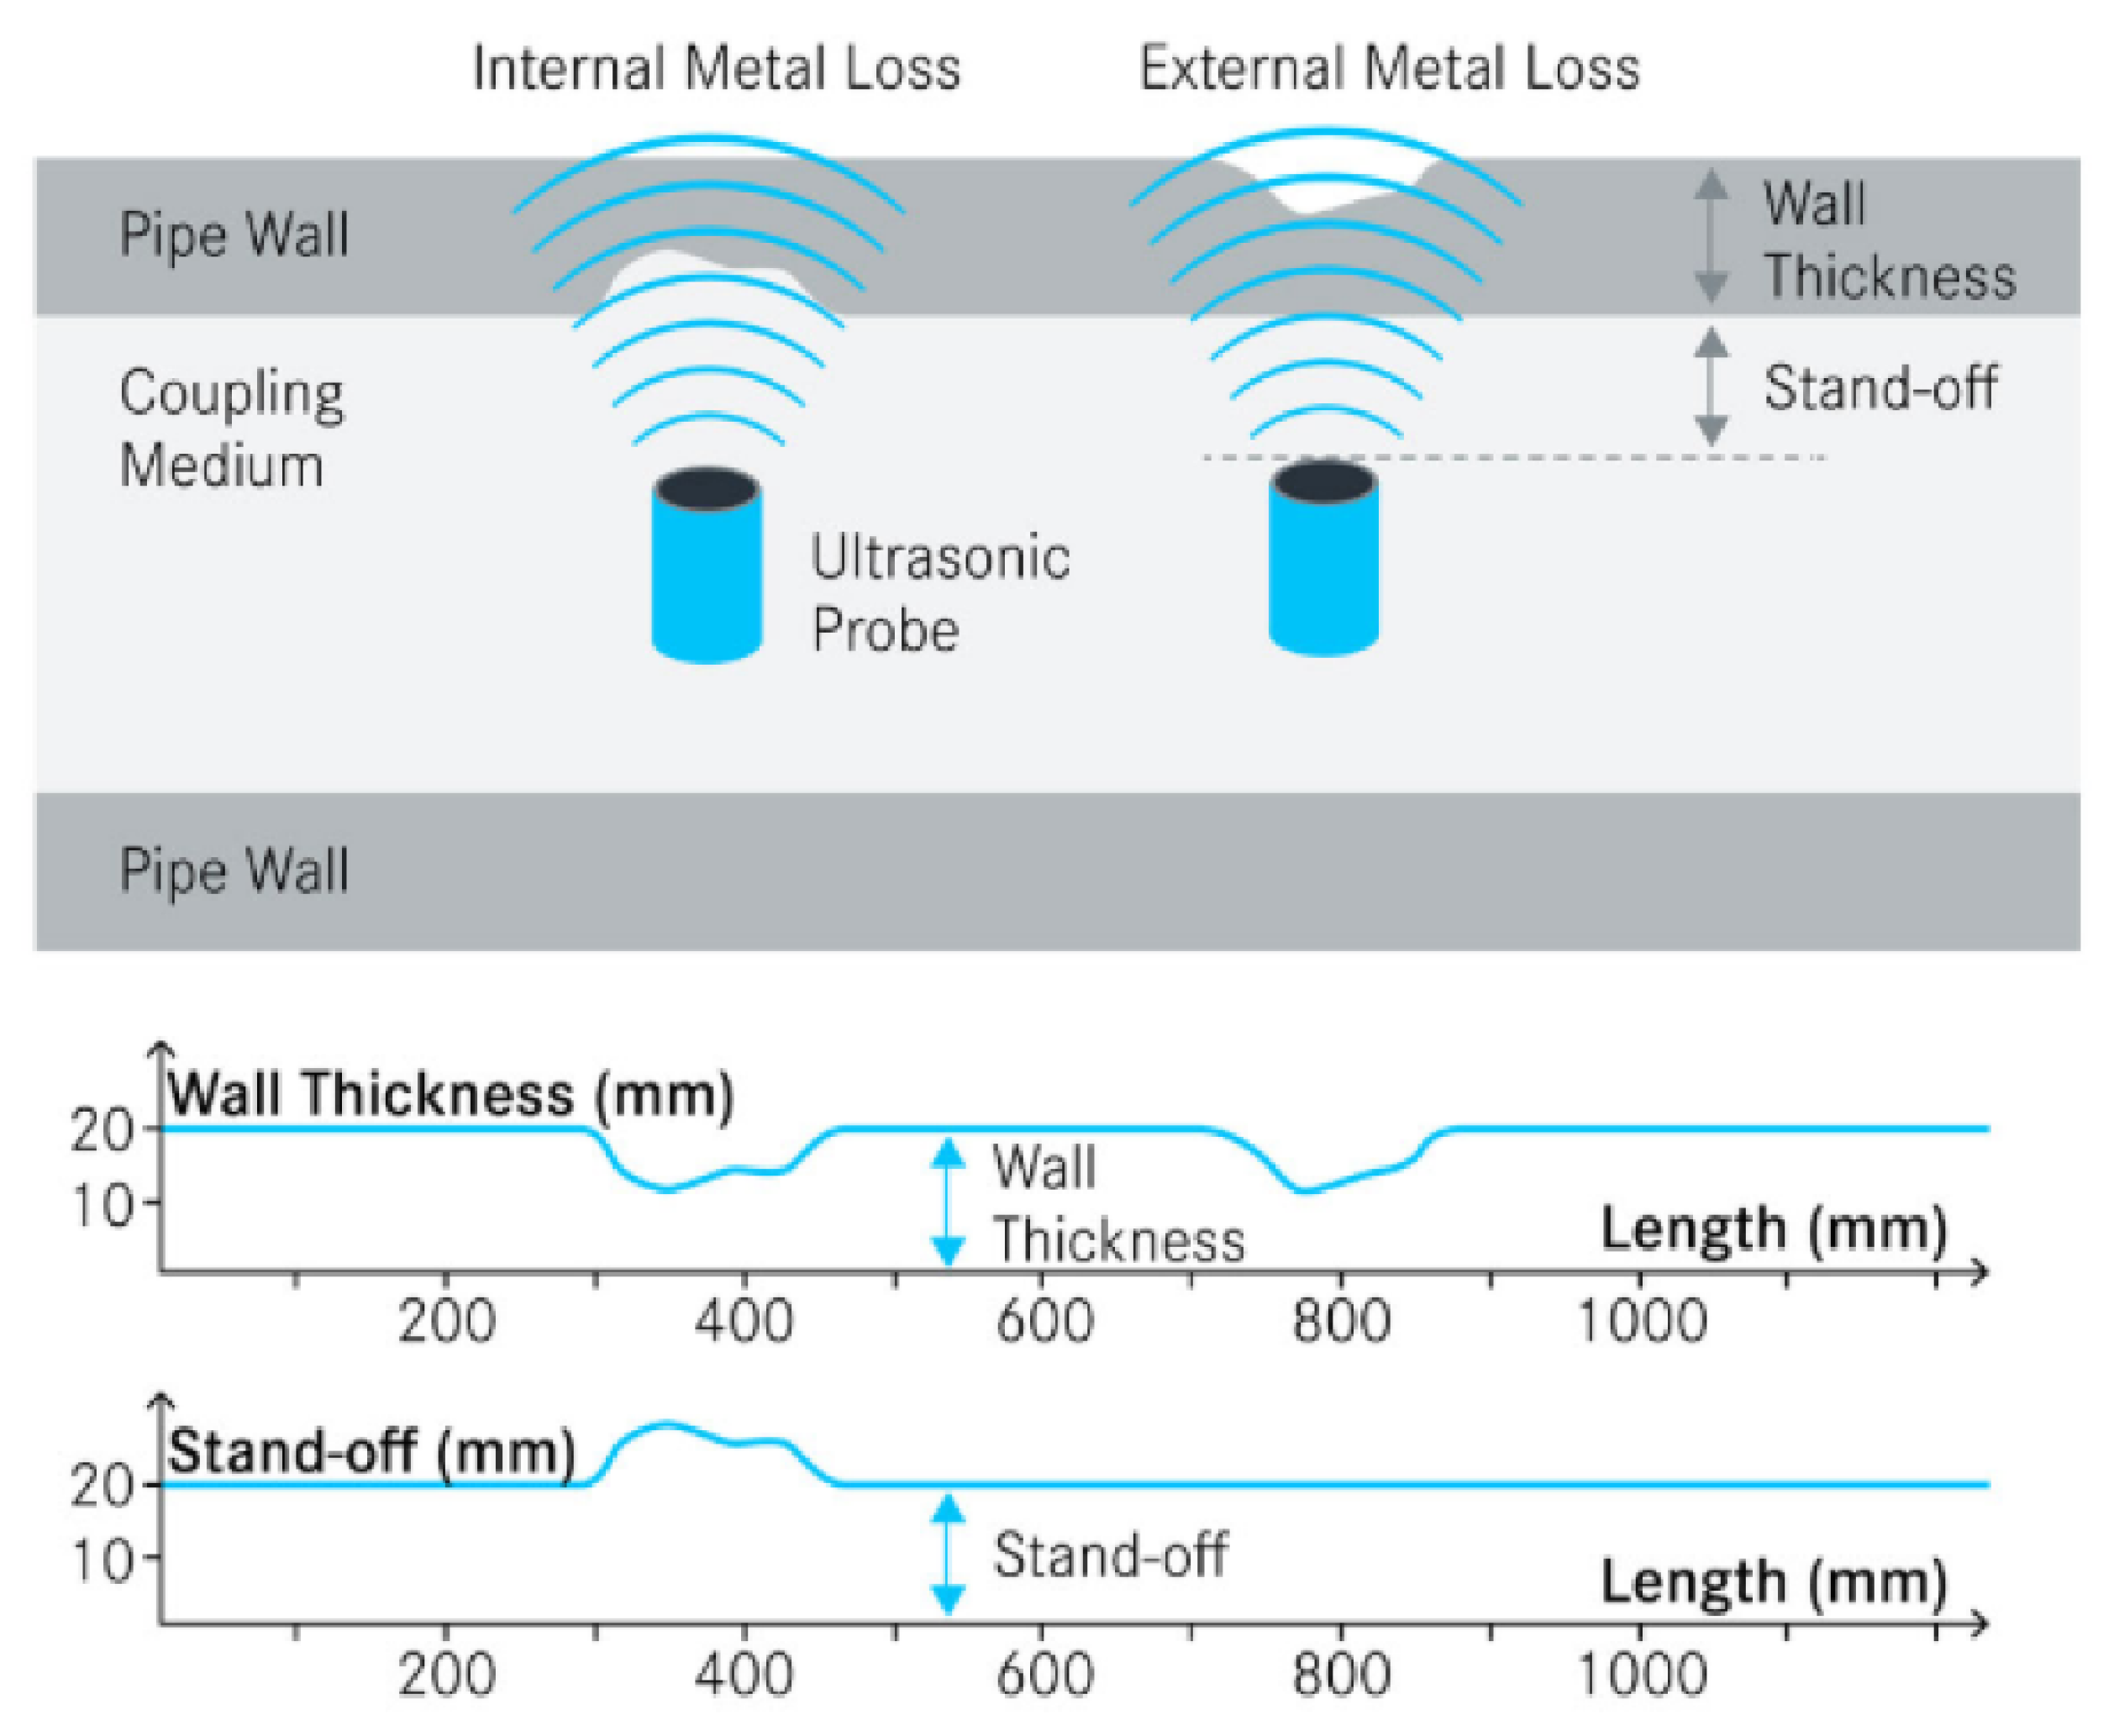
| Thickness Precision | 0.05 mm |
| Spatial Resolution Precision | 0.05 mm width and 0.05 mm length |
| Pipe Wall Thickness | 3–25 mm |
| Pipe Diameter | >100 mm |
| Metallurgy | Low-Alloy Steel (<9% Cr & <2.5% Mo) |
| Sl No | Name of SHM Technique | Nature of Technique | Applicable Infrastructure | Precision of Damage Detection | Use for Water-Based or Oil-Based Conduit | Potential to Predict Future Damages |
|---|---|---|---|---|---|---|
| 1 | Corrosion Coupon | Coupon is placed within the working material and is thus invasive | Can be applicable for pipe/reactor of any shape or size | No precision position and time of leak/corrosion | Can work for water-based system | Difficult to predict any future damage location |
| 2 | Electrical Resistance Probe | Invasive probe works as a real-time corrosion coupon | Can be applicable for pipe/reactor of any shape or size | No precise positioning but time and extent of corrosion or mass loss can be determined | Can work for oil or water-based system | Real-time data may be utilized to detect the future damage or probable future leaks |
| 3 | Electrochemical Sensors | In-situ electrochemical corrosion rate determination | Can be applicable for pipe/reactor of any shape or size | No precise positioning but time and extent of corrosion can be determined | Work better for ion-conducting electrolytes. Externally imposed potential may increase electrochemical corrosion rate | Difficult to predict any future damage location |
| 4 | Ultrasonic (Acoustic) Testing Sensor | Ultrasonic probes are placed inside the pipe to detect pipe thickness, flow change, or loss | Can be applicable for pipe/reactor of any shape or size | Precision is better than corrosion coupon or other corrosion sensors. Real-time positioning is possible. However, very small leak or structural damages are difficult to determine using this technique | Can work for oil or water-based system | Real-time data may be utilized to detect the future damage or probable location of leaks in future |
| 5 | Magnetic Flux Leakage Method | Invasive technique for detection of damage in structure by comparing magnetic flux lines | Can be applicable for pipe of any shape or size | Cannot precisely locate the position of structural damage | Can work for oil or water-based system | Using this technique, it becomes difficult to predict any future damage location |
| 6 | Point OFS for Corrosion | Works as an optical corrosion coupon using optical spectrum from its position inside the pipe | Can be applicable for pipe of any shape or size | No precise positioning but incidence and extent of corrosion can be determined | Can work for oil or water-based system to determine structural damage | Difficult to predict any future damage location |
| 7 | Quasi-Distributed OFS for Corrosion | It uses FBG-based external point sensors to determine change in temperature and strain. The pressure wave generated transmits both the directions from point of leakage, where the pressure sensors detect the leakage point by analyzing the pressure wave | Very useful to determine the corrosion in pipeline and wellbore in real time | Precise point and time of leakage can be determined using this technique of negative pressure wave (NPW) | Can work for oil or water-based system to determine structural damage. It can detect gas leaks | Can be useful for predicting future leaks or damage |
| 8 | Distributed OFS for Physical Sensing | Parameters of corrosion and leaks are determined by monitoring pressure and temperature change due to leaks. Optical fibers are wound over the pipe to detect the leak | Determination of corrosion and structural change in well. The technique is also useful for determination of efficient flow of crude in pipes and impacts in flow due to corrosion | The leak can be determined precisely and in real time | Can work for conduits carrying oil, waters, and gas | The technology can be extended to determine corrosion or damages in pipe |
| 9 | Distributed OFS for Chemical Sensing | Optical fibers with chemical coating and air holes are activated over the pipe core or cladding. Can be applied to check the external or internal health of a pipeline structure | Multi-sensors OFS are designed and utilized to determine leaks of gases of different types and the nature of environments the conduits are exposed to. | Precise determination of leaks and damages are possible in real time | Can work for conduits carrying oil, waters, and gas for leak detection | It gives early signs of corrosion. It is the best method to predict damage or leaks |
| 10 | SCADA and CMS | Acoustic emission, optic fiber, thermographic, photogrammetric techniques, and others are used to remotely collect and monitor the external conditions of infrastructure frequently via SCADA and CMS. Then, the data are communicated to determine damages in infrastructures | Determine the damages in external parts of wind farms. The techniques can also be used to detect damages in pipelines and other infrastructures | External damages to infrastructure can be monitored. General cracks can be determined. However, very fine leaks may not be detected in real time. | Can work for conduits carrying oil, waters, and gas | Monitoring external conditions may not always indicate any impending danger |
| 11 | UAV-Based Technique | Multi-sensor (thermal, laser, sonic, spectroscopic, photogrammetric) remote sensing of crack and structural deformations using UAV platform | Determine the external damages to any infrastructure of the oil and gas industry | Laser UAV can detect fine damages if scanning is done from close proximity. Data are required to be analyzed to determine the leaks. However, it would need the help of ground-based/internal sensors to know about any leak and then can fly over the damaged part to make detailed monitoring of damaged infrastructure | Can work over oil, water, gas conduits, or any other infrastructure | The damages existing at the pipeline or infrastructure may be extrapolated to determine the future source of leak or gas emissions. However, prediction requires inputs from other accurate invasive techniques to comprehensively monitor the existing situation and any likely situation that can develop in the future |
| 12 | Ground Penetration Radar Sensing | Underground sensing technique by GPR instruments | For underground civil structure oil and gas pipelines | Use electromagnetic waves that are transmitted through an antenna moving along the surface to the monitoring object | Underground pipeline leak detection | Reliable and leak information is comprehensive when leaks are found in underground pipelines |
| 13 | Analysis of the Pressure Point | Monitor pressure difference in pipeline by contact and non-contact sensors | For dill bits and oil and gas pipelines | The pipeline system controls pressure variations at various points | Cold climates and working properly under various flow conditions | Suitable for submarine environments |
| 14 | Infrared Thermography | Remote sensing of cracks and by thermal photogrammetric camera | For tall structures and oil drill bits | Easy to use and fast response time for converting detected objects into visual images | Detection of pipeline temperature variations | Detect leaks with infrared picture techniques to detect pipeline temperature changes |
| 15 | LiDAR Sensing | LIDAR sensing for small cracks by LiDAR scanner | For oil and gas pipelines as well as minor cracks detection for civil infrastructures | In the absence of any temperature variation between the gas and the environment, the leaks can be detected | The pulsed laser is used for methane detection as a lighting source for pipelines | Methane detection light source for gas pipelines |
Publisher’s Note: MDPI stays neutral with regard to jurisdictional claims in published maps and institutional affiliations. |
© 2021 by the authors. Licensee MDPI, Basel, Switzerland. This article is an open access article distributed under the terms and conditions of the Creative Commons Attribution (CC BY) license (https://creativecommons.org/licenses/by/4.0/).
Share and Cite
Sharma, V.B.; Singh, K.; Gupta, R.; Joshi, A.; Dubey, R.; Gupta, V.; Bharadwaj, S.; Zafar, M.I.; Bajpai, S.; Khan, M.A.; et al. Review of Structural Health Monitoring Techniques in Pipeline and Wind Turbine Industries. Appl. Syst. Innov. 2021, 4, 59. https://doi.org/10.3390/asi4030059
Sharma VB, Singh K, Gupta R, Joshi A, Dubey R, Gupta V, Bharadwaj S, Zafar MI, Bajpai S, Khan MA, et al. Review of Structural Health Monitoring Techniques in Pipeline and Wind Turbine Industries. Applied System Innovation. 2021; 4(3):59. https://doi.org/10.3390/asi4030059
Chicago/Turabian StyleSharma, Vinamra Bhushan, Kartik Singh, Ravi Gupta, Ayush Joshi, Rakesh Dubey, Vishwas Gupta, Shruti Bharadwaj, Md. Iltaf Zafar, Sushant Bajpai, Mohd Ashhar Khan, and et al. 2021. "Review of Structural Health Monitoring Techniques in Pipeline and Wind Turbine Industries" Applied System Innovation 4, no. 3: 59. https://doi.org/10.3390/asi4030059