Article

Perception of Quality of Life and Fatigue in Multiple Sclerosis Patients Treated with High-Dose Vitamin D

by
Antonio Ianniello
1,*,
Andrea Sottosanti
2,
Giovanna Borriello
3 and
Massimo Vincenti
4
1
Department of Human Neurosciences, Sapienza University of Rome, 00185 Rome, Italy
2
Department of Medicine, University of Padova, 35128 Padua, Italy
3
Department of Neurology, San Pietro Fatebenefratelli, 00189 Rome, Italy
4
Associazione Italiana Protocollo Coimbra, 35020 Legnaro, Italy
*
Author to whom correspondence should be addressed.
Clin. Transl. Neurosci. 2023, 7(2), 12; https://doi.org/10.3390/ctn7020012
Submission received: 10 January 2023 / Revised: 20 March 2023 / Accepted: 17 April 2023 / Published: 19 April 2023

Abstract

:
Background: Multiple sclerosis (MS) is a chronic autoimmune disease of the central nervous system, with symptoms that greatly affect quality of life (QoL). One of the most prevalent symptoms of MS is fatigue, also one of the main factors reducing QoL. Low levels of vitamin D (VD) are associated with worse QoL and with increased risk of developing more severe forms of the disease. Methods: In this cross-sectional study, we compared perceptions of quality of life and fatigue in 324 patients, subdivided into four groups, according to their treatment: high-dose VD therapy only, disease-modifying therapy (DMT) only, both treatments, and no treatments. All subjects completed the MSQOL-54 and the FSS questionnaires via an online survey. Results: High-dose VD treatment was associated with an increased perception of physical QoL (83.60 vs. 66.92, p < 0.001), mental QoL (75.52 vs. 59.80, p < 0.001), and fatigue (1.89 vs. 2.98, p < 0.001), compared to the DMT-only group. Treatment with DMT was associated with a worse perception of physical QoL compared to no treatment (70.58 vs. 76.53, p = 0.024). Conclusions: high-dose VD treatment is well-tolerated and associated with an increased perception of QoL in people with MS.

1. Introduction

Multiple sclerosis (MS) is a chronic autoimmune disease of the central nervous system, characterized by inflammation and demyelination, with a varying degree of neuroaxonal damage and atrophy [1,2]. Motor and cognitive deficits are the main drivers of disability that patients experience throughout the course of the disease and have a significant impact on their quality of life (QoL) [3]. The expanded disability status scale (EDSS) was designed and validated to better measure and describe the clinical course and severity of functional deficits in people with MS (PwMS) [4]. Higher EDSS scores indicate greater disability and are associated with lower QoL [5].
MS is the most common cause of nontraumatic disability among young adults, with an estimated prevalence of 142/100,000 people in Europe [6]. The female to male ratio of this disease is approximately 2.2:1, and the mean age of onset in Europe is 32 years old [6]. The young age of presentation entails a very high economic burden, which worsens with increasing disability, mainly due to the increase in nonhealthcare costs (need for informal care) and indirect costs (loss of productivity) [7].
Multiple sclerosis quality of life-54 (MSQOL-54) is one of the most widely used scales to assess health-related QoL in PwMS and has been validated in numerous languages besides English [8]. It consists of 54 items across 12 multi-item domains. MSQOL-54 is a well-accepted test that is quick and easy to fill out by patients autonomously. The results of this questionnaire allow us to identify two dimensions underlying the perception of a patient’s QoL: physical health and mental health [9].
One of the main physical factors determining the overall quality of life in PwMS is fatigue [10]. Fatigue is considered the most disabling symptom in 50–60% of PwMS, affecting up to 80% of them [11,12]. It can present from the onset of the disease and across all MS phenotypes [13]. The MS Council for Clinical Practice Guidelines defines fatigue as “subjective lack of physical and/or mental energy that is perceived by the individual or caregiver to interfere with usual and desired activities” [14]. Being a multidimensional symptom subjectively experienced by each person, it is difficult to objectify in clinical practice. Therefore, fatigue assessment is often overlooked in the routine evaluation of PwMS. Nevertheless, several scales have been formulated in order to evaluate fatigue in MS. Among these, one of the most popular and most often administered is the fatigue severity scale (FSS) [15]. The FSS is a nine-item questionnaire, focusing on the assessment of the impact of fatigue symptoms on an individual’s daily functioning. The overall score is calculated from the average of the nine items and ranges from 1 to 7. The results are robust and uniform across all populations in which this scale has been validated [16]. Numerous studies have suggested a cut-off for the definition of fatigue at a score ≥4 [17,18].
At present, there is no definitive cure for MS. However, multiple approaches can be adopted to modify the course of the disease and manage symptoms in order to improve quality of life [19]. Many immunomodulating agents have been discovered in the past 30 years and can now be used as disease-modifying therapies (DMTs). There is a lot of evidence showing that the use of DMTs in MS can reduce the frequency of relapses, the appearance of new brain and spinal lesions, and slow down disability worsening [20]. In recent years, the need to personalize treatment for each specific patient has emerged as increasingly important. Personalized therapy must take into account several factors, including efficacy, tolerability, and practicality. This is important in MS, due to the heterogeneous clinical presentation and the unpredictable course of the disease, as well as the inter-individual variability in terms of response to therapy [21]. Another key aspect in the management of MS is symptomatic treatment, which aims to mitigate or remove symptoms of MS that impact patients’ functional abilities and includes both pharmacological and non-pharmacological approaches [22]. Choosing the best DMT and adequate symptom management for each patient can lead to an improvement in the quality of life for PwMS and reduce the impact of disability [23].
Among the environmental factors with the strongest evidence of correlation with the risk of developing MS are EBV infection, vitamin D deficiency, obesity, and smoking [24,25]. In particular, a higher serum vitamin D concentration (particularly in young adulthood) has been shown to be associated with a lower risk of developing MS in subsequent years [26]. Lower vitamin D levels are also considered to be long-term risk factors for the number and duration of MS relapses, as well as predictors of evolution to the progressive form of the disease [27,28]. There is also evidence suggesting that the intake of vitamin D supplements correlates with an improvement in both physical and mental QoL in PwMS, measured by the MSQOL scale [29,30].
Vitamin D has numerous effects on the immune system. It inhibits the proliferation and differentiation of B cells, thus reducing the production of immunoglobulins. In addition, VD induces a shift from the Th1 to Th2 phenotype, favoring the induction of Tregs. These mechanisms lead to a decline in the production of inflammatory cytokines, such as IL-12 and IL-17, and to an increase in anti-inflammatory cytokines, such as IL-10 [31]. VD also exerts its anti-inflammatory effects on monocytes, macrophages, and dendritic cells [32]. Due to these mechanisms, vitamin D deficiency has been associated not only with MS, but also with numerous other autoimmune, oncological, infectious, and cardiovascular diseases [33].
The clinical definition of vitamin D deficiency and the exact dosage of vitamin D to give as a supplement has been the subject of debate. If daily intakes of 600–800 IU might satisfy the requirements for bone health, it is known that higher doses (1000–2000 IU) are often needed to reach and maintain 25 (OH) D levels > 30 ng/mL [33,34]. However, some individuals may have some form of vitamin D resistance. As a result, they would not be able to reach optimal levels of 25 (OH) D even taking the recommended doses of vitamin D. Multiple polymorphisms of genes encoding different proteins involved with the vitamin D system could underlie this resistance. Indeed, these polymorphisms are all associated with autoimmune diseases [35,36].
Based on these assumptions is the Coimbra protocol, in which high doses of vitamin D (about 1000/IU/kg per day at the beginning, up to 40/200,000 IU per day) are administered, accompanied by regular sonographic checks of the kidneys and monitoring of calcium homeostasis, to overcome vitamin D resistance. Of course, the protocol also requires that patients take some precautionary measures, such as avoiding dairy products and consuming at least 2.5 L/day of water [33,35].
In PwMS, three studies have already evaluated the safety of high-dose vitamin D (up to 40,000 IU/day with or without concomitant calcium supplementation) for 12, 28, and 52 weeks. Although plasma levels of 25 (OH) D above the normal range were reached in these trials, neither significant adverse events nor significant increases in calcium levels were reported, demonstrating the safety of high-dose vitamin D supplementation [37,38,39].
The present study aims to compare patients on high-dose VD therapy according to the Coimbra protocol, with or without concomitant use of a DMT, with patients not using VD and with patients not receiving any therapy. The aim is to verify whether treatment with high-dose VD is related to a better perception of the quality of life in PwMS.

2. Materials and Methods

2.1. Participants and Procedures

In this cross-sectional study, patients diagnosed with MS according to the 2017 McDonald criteria were enrolled in different Italian MS centers starting from 17 April 2021 [40]. Patients were invited to complete an online survey developed through the web application “Limesurvey”, “https://www.limesurvey.org” (accessed on 20 December 2022). Data from 448 PwMS were collected from 17 April to 17 May 2021.
For the purpose of this study, the following data were collected:
  • sociodemographic information (i.e., age, gender, weight, marital status, employment status);
  • clinical information (i.e., MS duration, EDSS, dosage of vitamin D taken, use of DMTs, adherence to the Coimbra protocol);
  • perception of quality of life: total physical health (TPH) and total mental health (TMH) (the two components of the MSQOL-54 questionnaire);
  • perception of the impact of fatigue in daily life (FSS).
The study was performed in accordance with the Declaration of Helsinki, EU regulations 2016/679 and 2018/1725. All subjects gave informed consent before participating in the online survey.

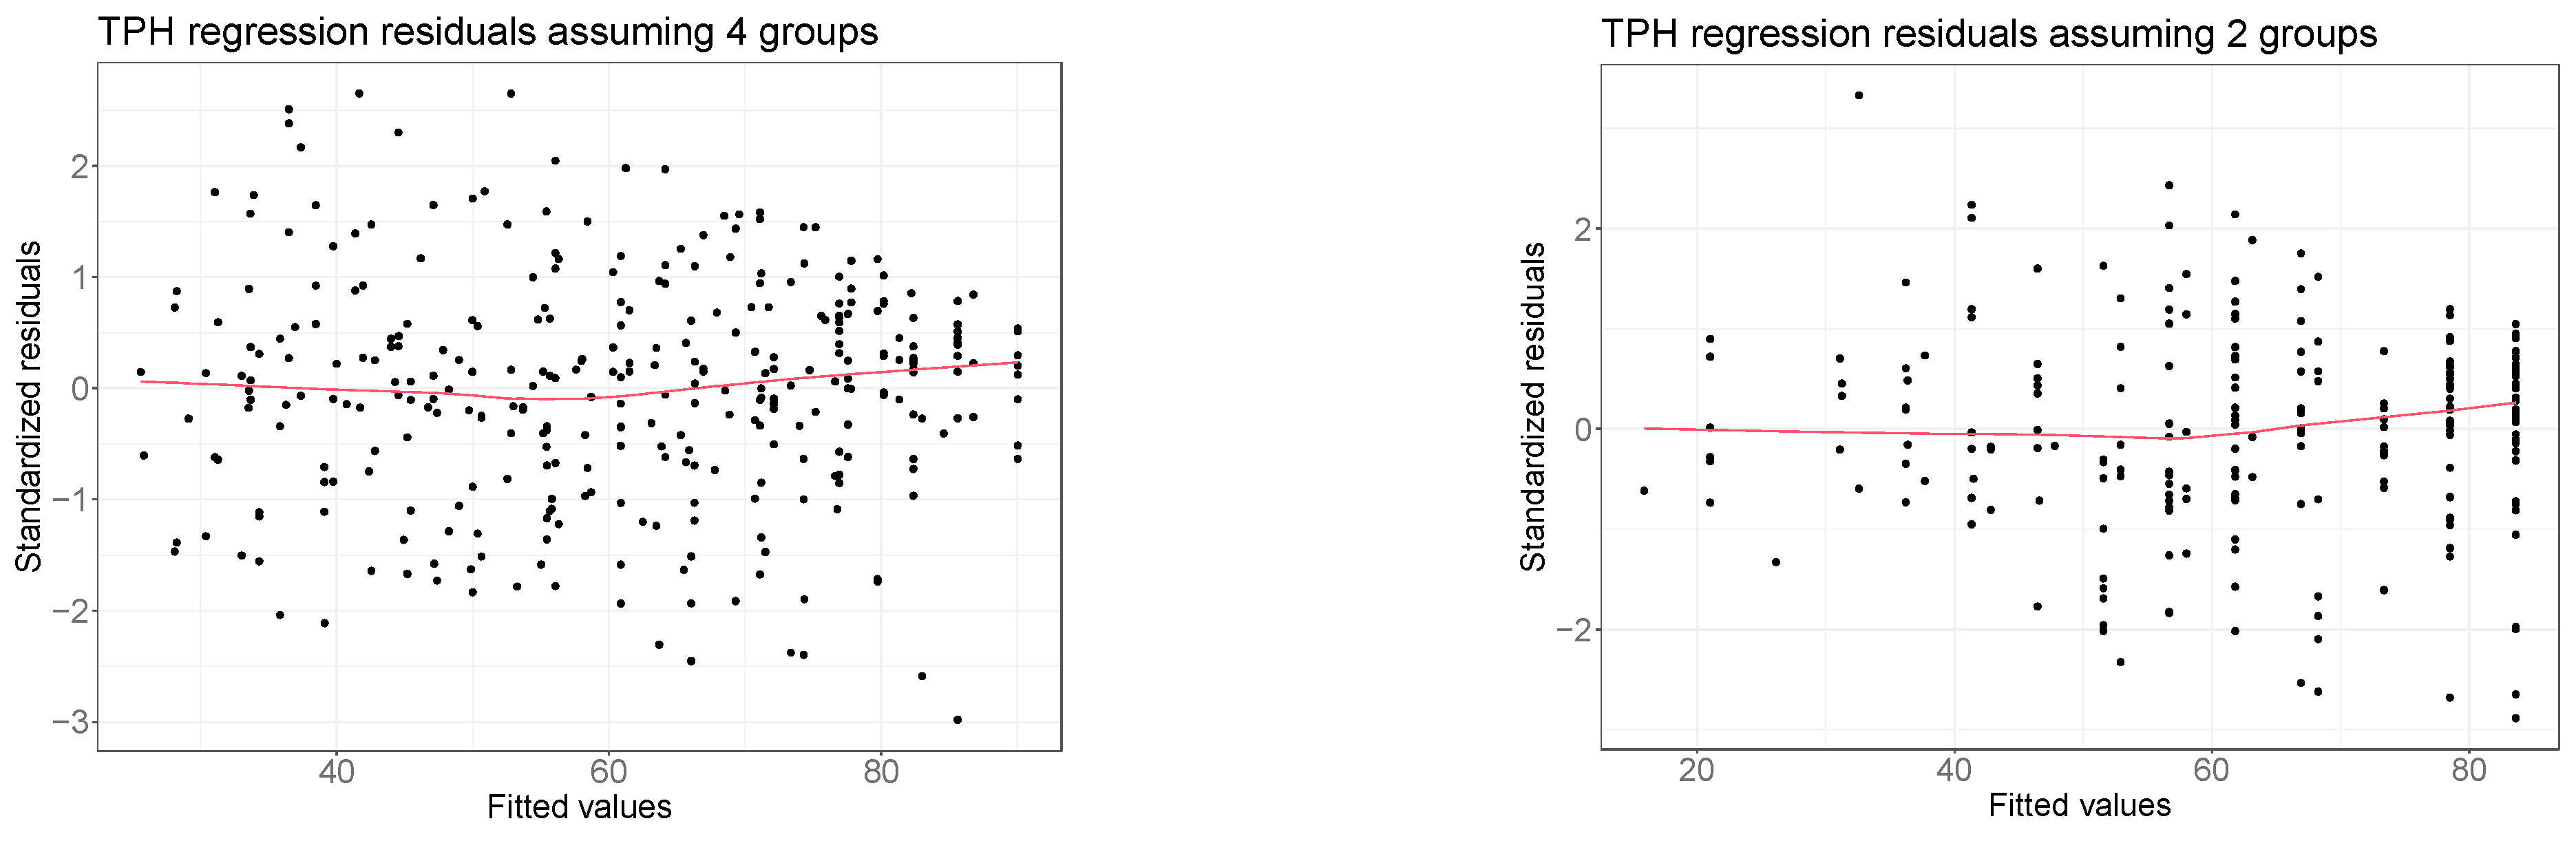
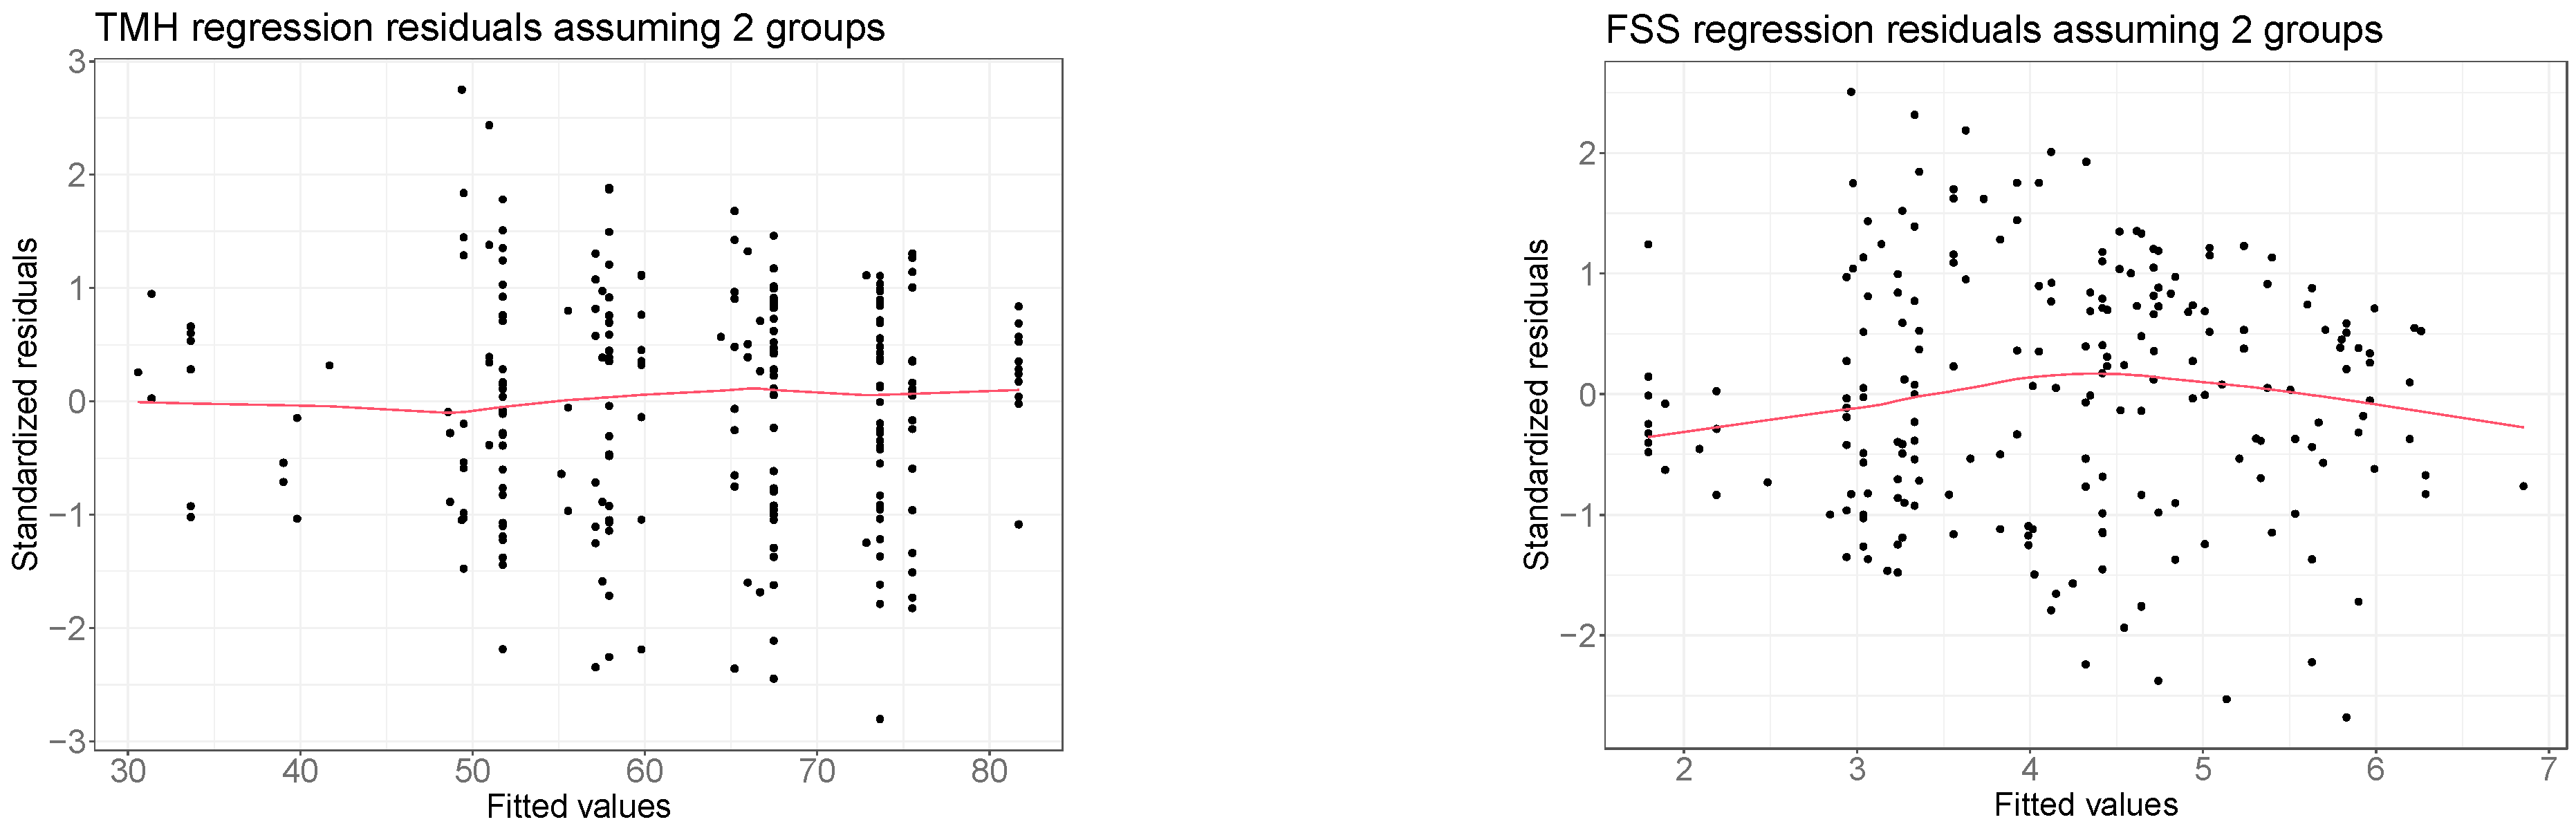
2.2. Statistical Analysis

The scope of this analysis was to evaluate if high-dose VD treatment, as defined by the Coimbra protocol, significantly impacts the quality of daily life and the fatigue perception of PwMS, compared with DMTs. Linear regression analysis was used to study the effects of demographic and treatment variables on the indexes TPH, TMH, and FSS, separately. This method allows one to determine which variables significantly impact the daily-life-quality indicators considered, net of the confounding effects given by the other variables. In the linear regression model, we defined a reference group that was a subset of statistical units with specific values of regression variables. Then, through the regression coefficients, we measured whether a variation of the regression variables significantly affected the average outcome value, compared to the reference group. Such evaluation is performed using t-tests, and when the regression residuals could not be assumed to be Gaussian distributed, we performed the tests using a bootstrap resampling scheme for linear regression [41]. In addition, for every regression analysis, we performed a selection of the demographic variables using a model selection procedure based on the AIC index [42]. All the regression analyses presented in this article verified the linearity assumption of the linkage between the response variable and the regression function (Figure A1 in the Appendix A). Therefore, there was no need to apply any transformations of the response variables, like the Box–Cox transformation [42].
The first regression analysis looked at the effect of different variables on TPH in the entire sample.
Second, we performed a further analysis on a restricted sample, in order to directly compare VD-only- and DMT-only-treated subjects. To evaluate the effect of VD treatment on the daily life quality compared to DMT, we performed three distinct regression analyses.
EDSS has been treated as a numeric variable because, as it emerged, the average TPH decreased with an approximately linear trend as the EDSS level grew, both in the VD-only and in the DMT-only cohorts. With this method, it is possible to estimate the average effect of a unitary increase of the EDSS level on the TPH, without excessively increasing the number of parameters in the regression model.
Lastly, we conducted an additional investigation to determine whether interaction effects between treatment and demographic variables had a significant impact on the TPH, TMH, and FSS. To achieve this, we incorporated interaction variables into the linear regression models previously described. If the regression coefficient associated with an interaction term was significantly non-null, it implied that the mean level of the outcome index (TPH, TMH, or FSS) changed on average. This also implied that the connection between the index and the demographic variable involved in the interaction changed as well, determining a different response to the treatment examined.
Figure 1 shows a workflow that summarizes the steps of the analysis. The entire analysis was performed using the R programming language [43]. The linear models were fitted using the functions implemented in the base library; all the graphs were produced using ggplot2, and the bootstrap procedure was performed using the library boot.

3. Results

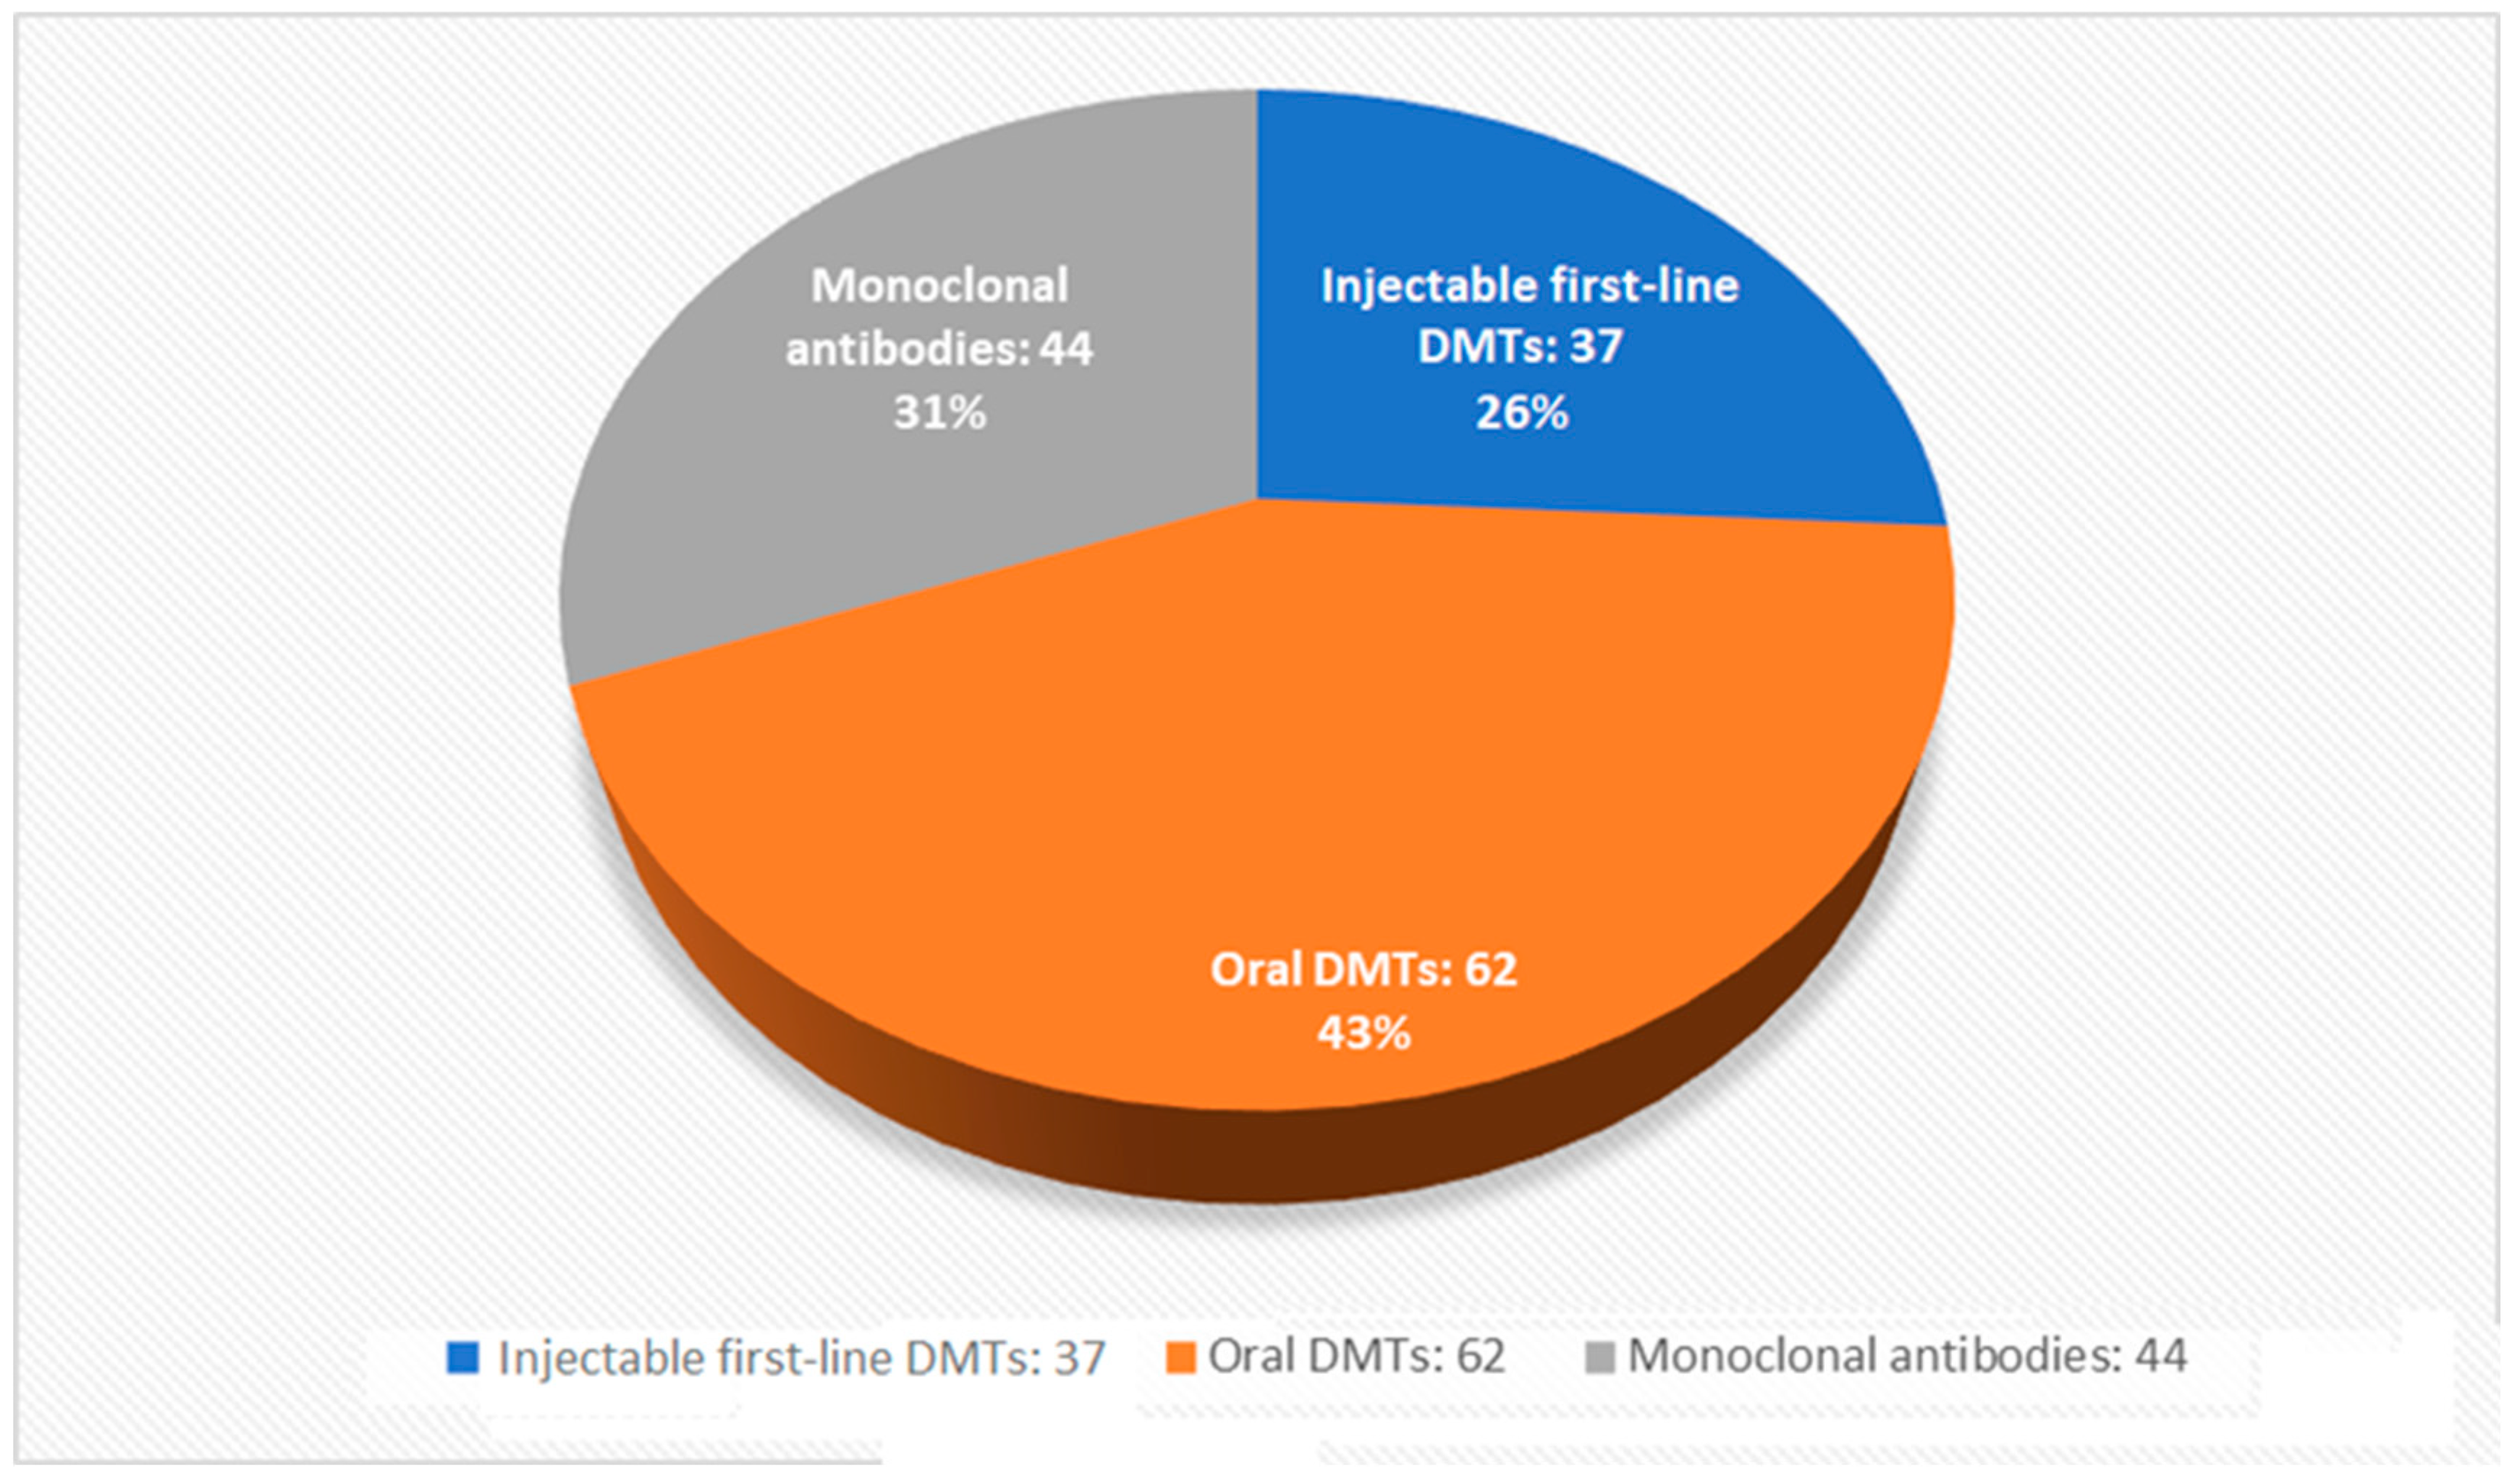
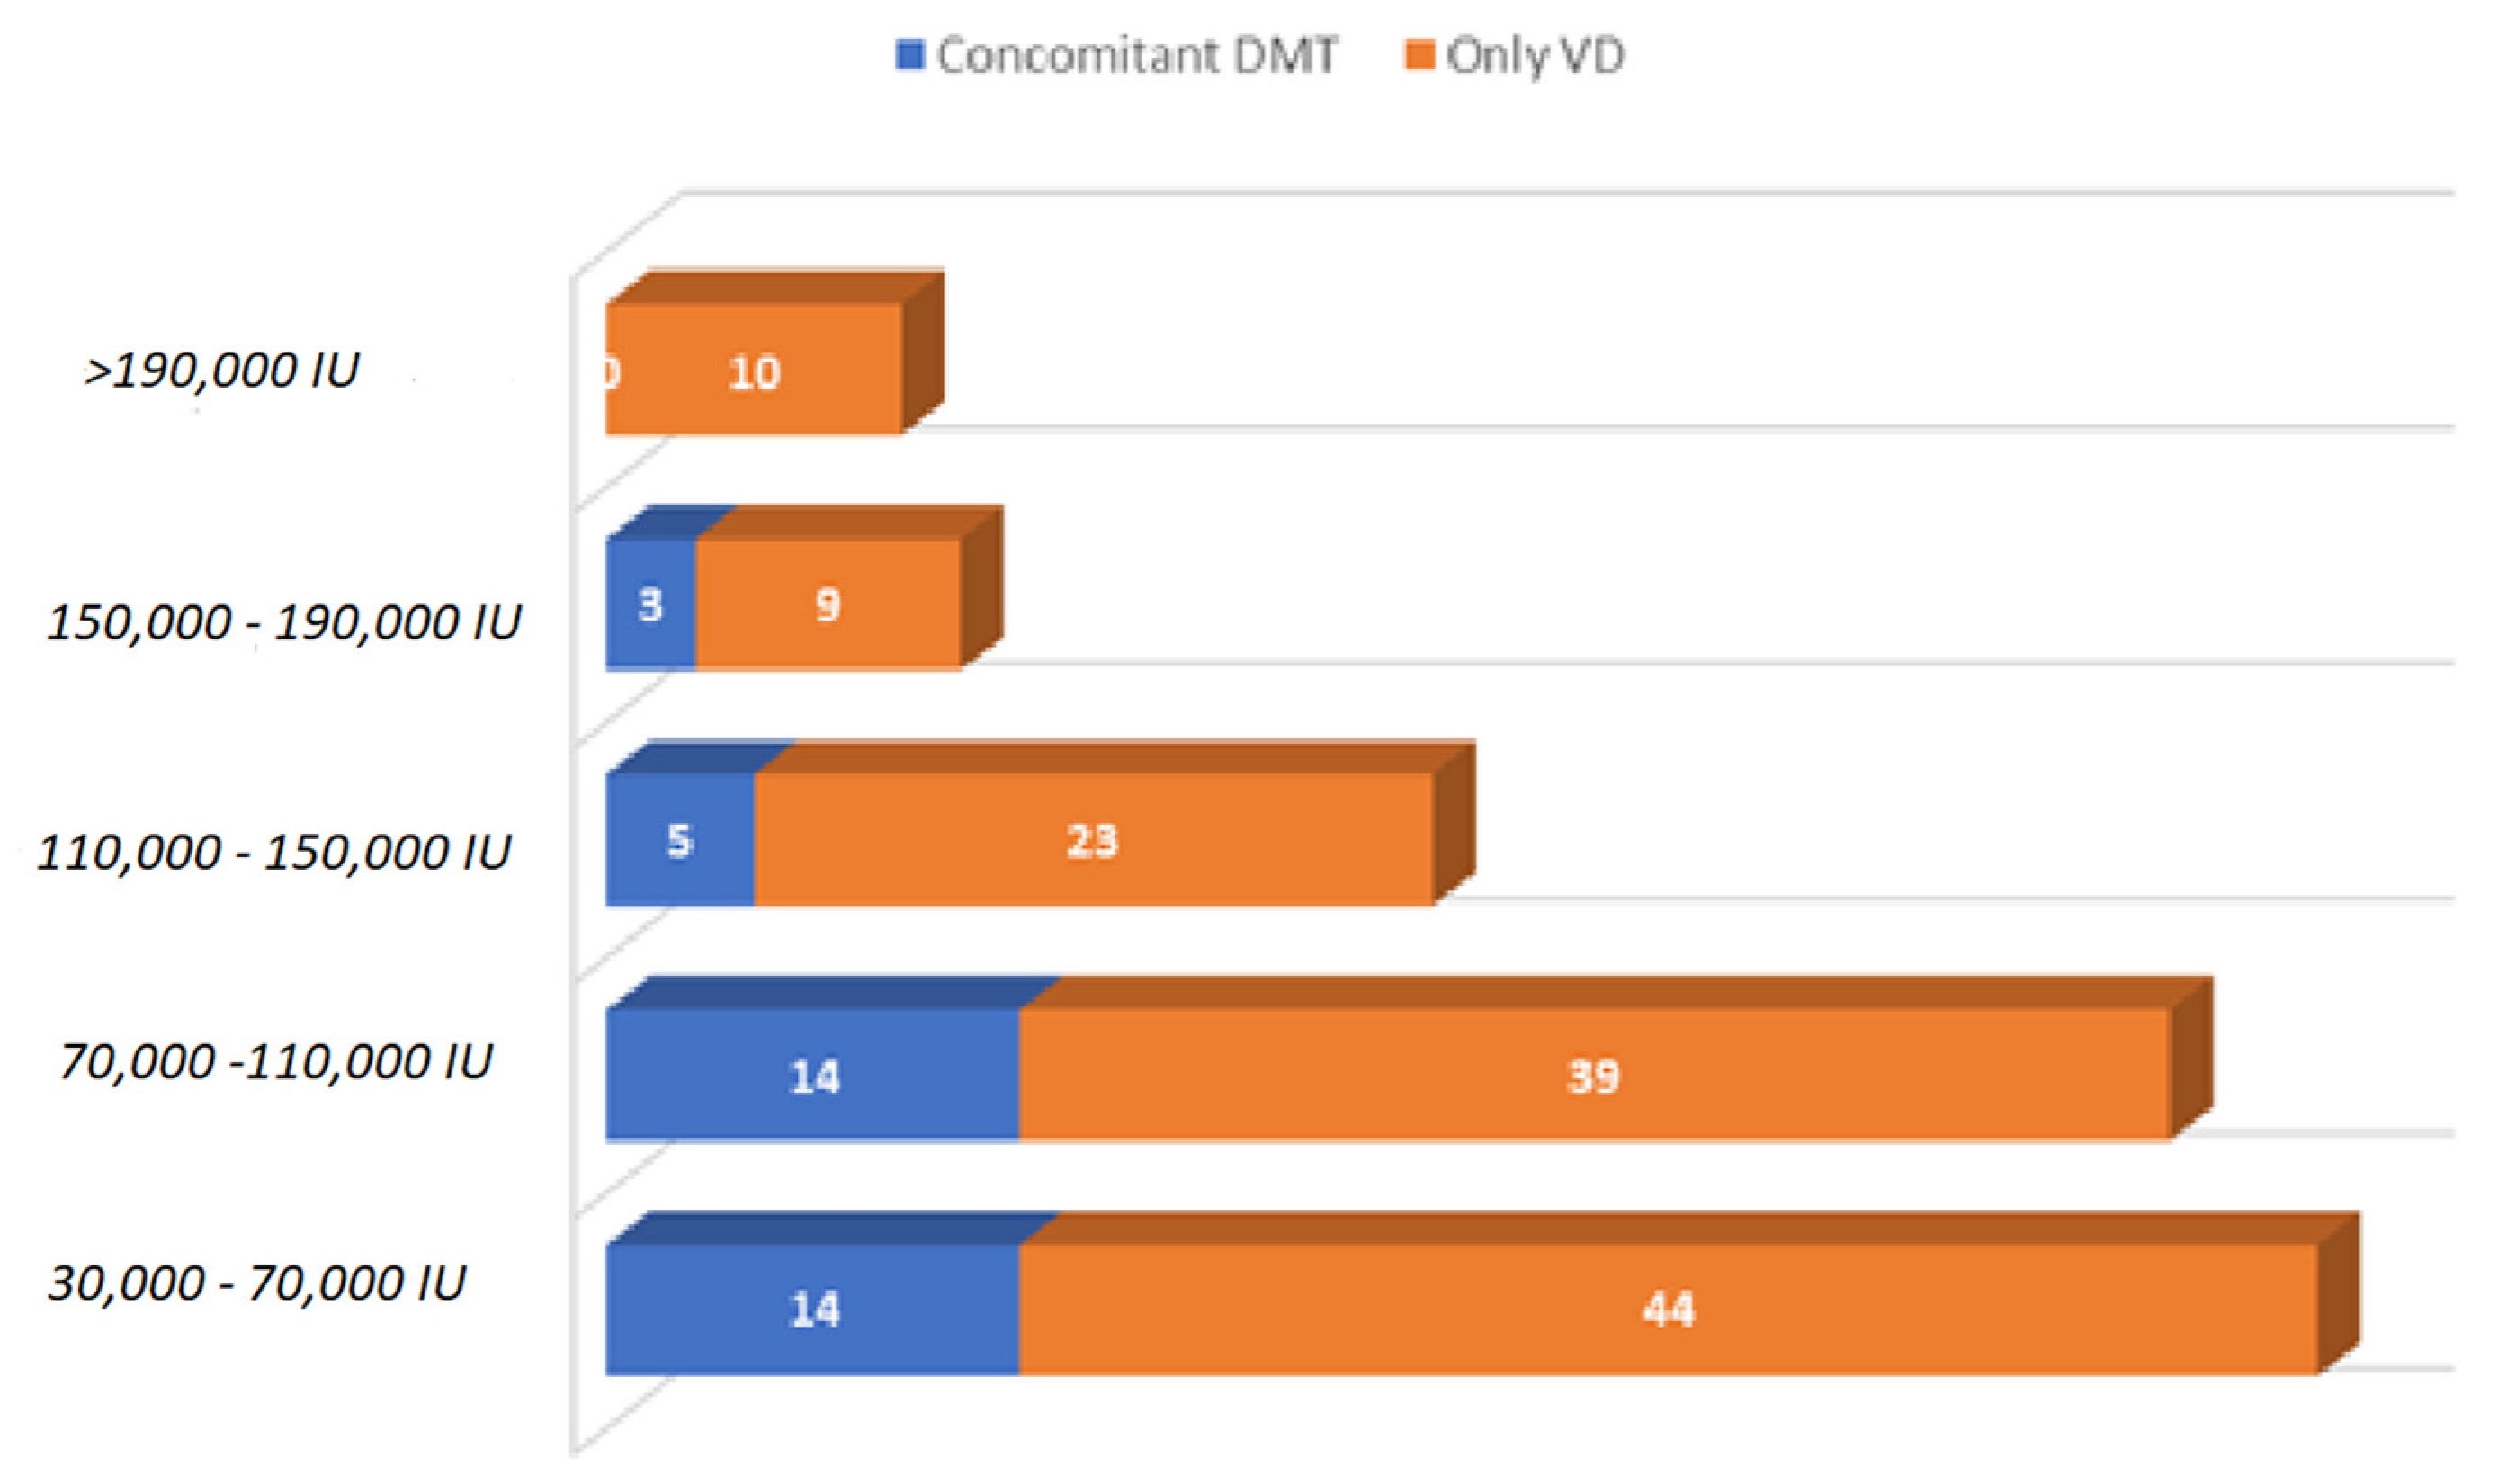
3.1. Characteristics of the Study Sample

Data from 448 PwMS were collected from 17 April to 17 May 2021. Among these, 124 patients were excluded from the final analysis for not completing all tests or because they were unable to provide information, such as EDSS, year of diagnosis, or disease phenotype. The final study sample included 107 patients on DMT alone, 125 on high-dose vitamin D alone, 36 on both therapies, and 56 on no therapy. The sociodemographic characteristics of the sample under study are summarized in Table 1, Figure 2 and Figure 3.

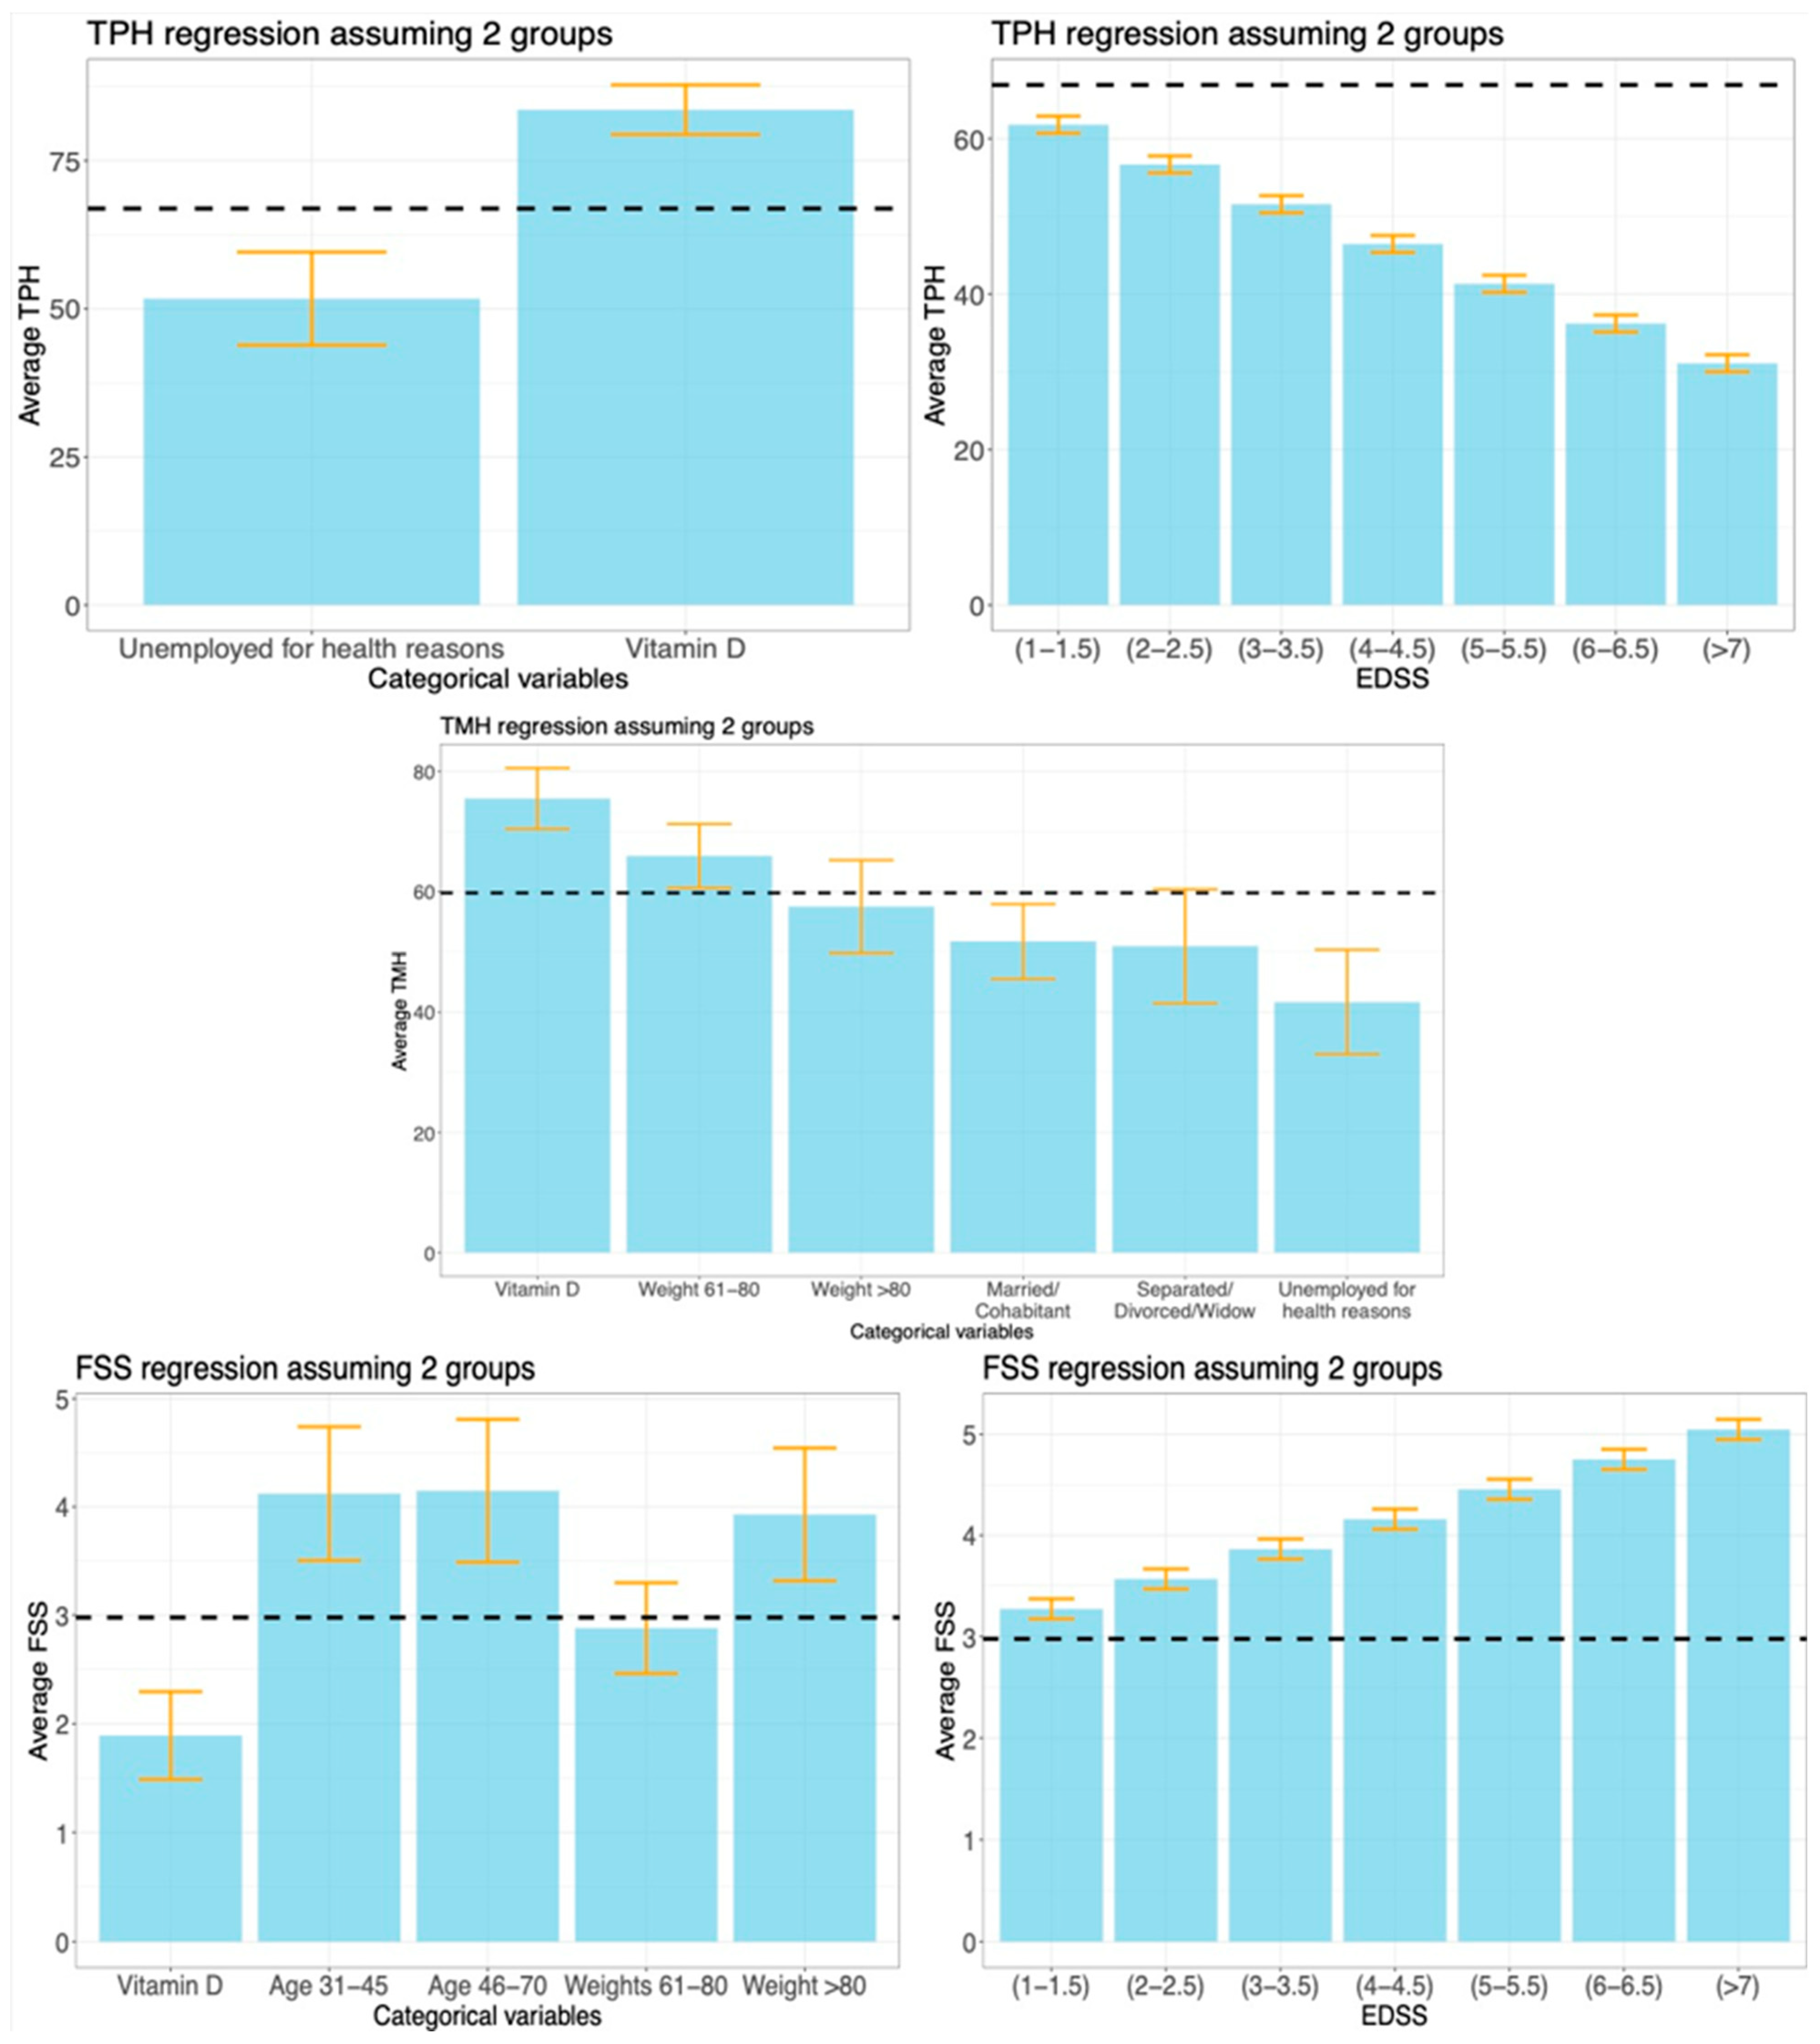
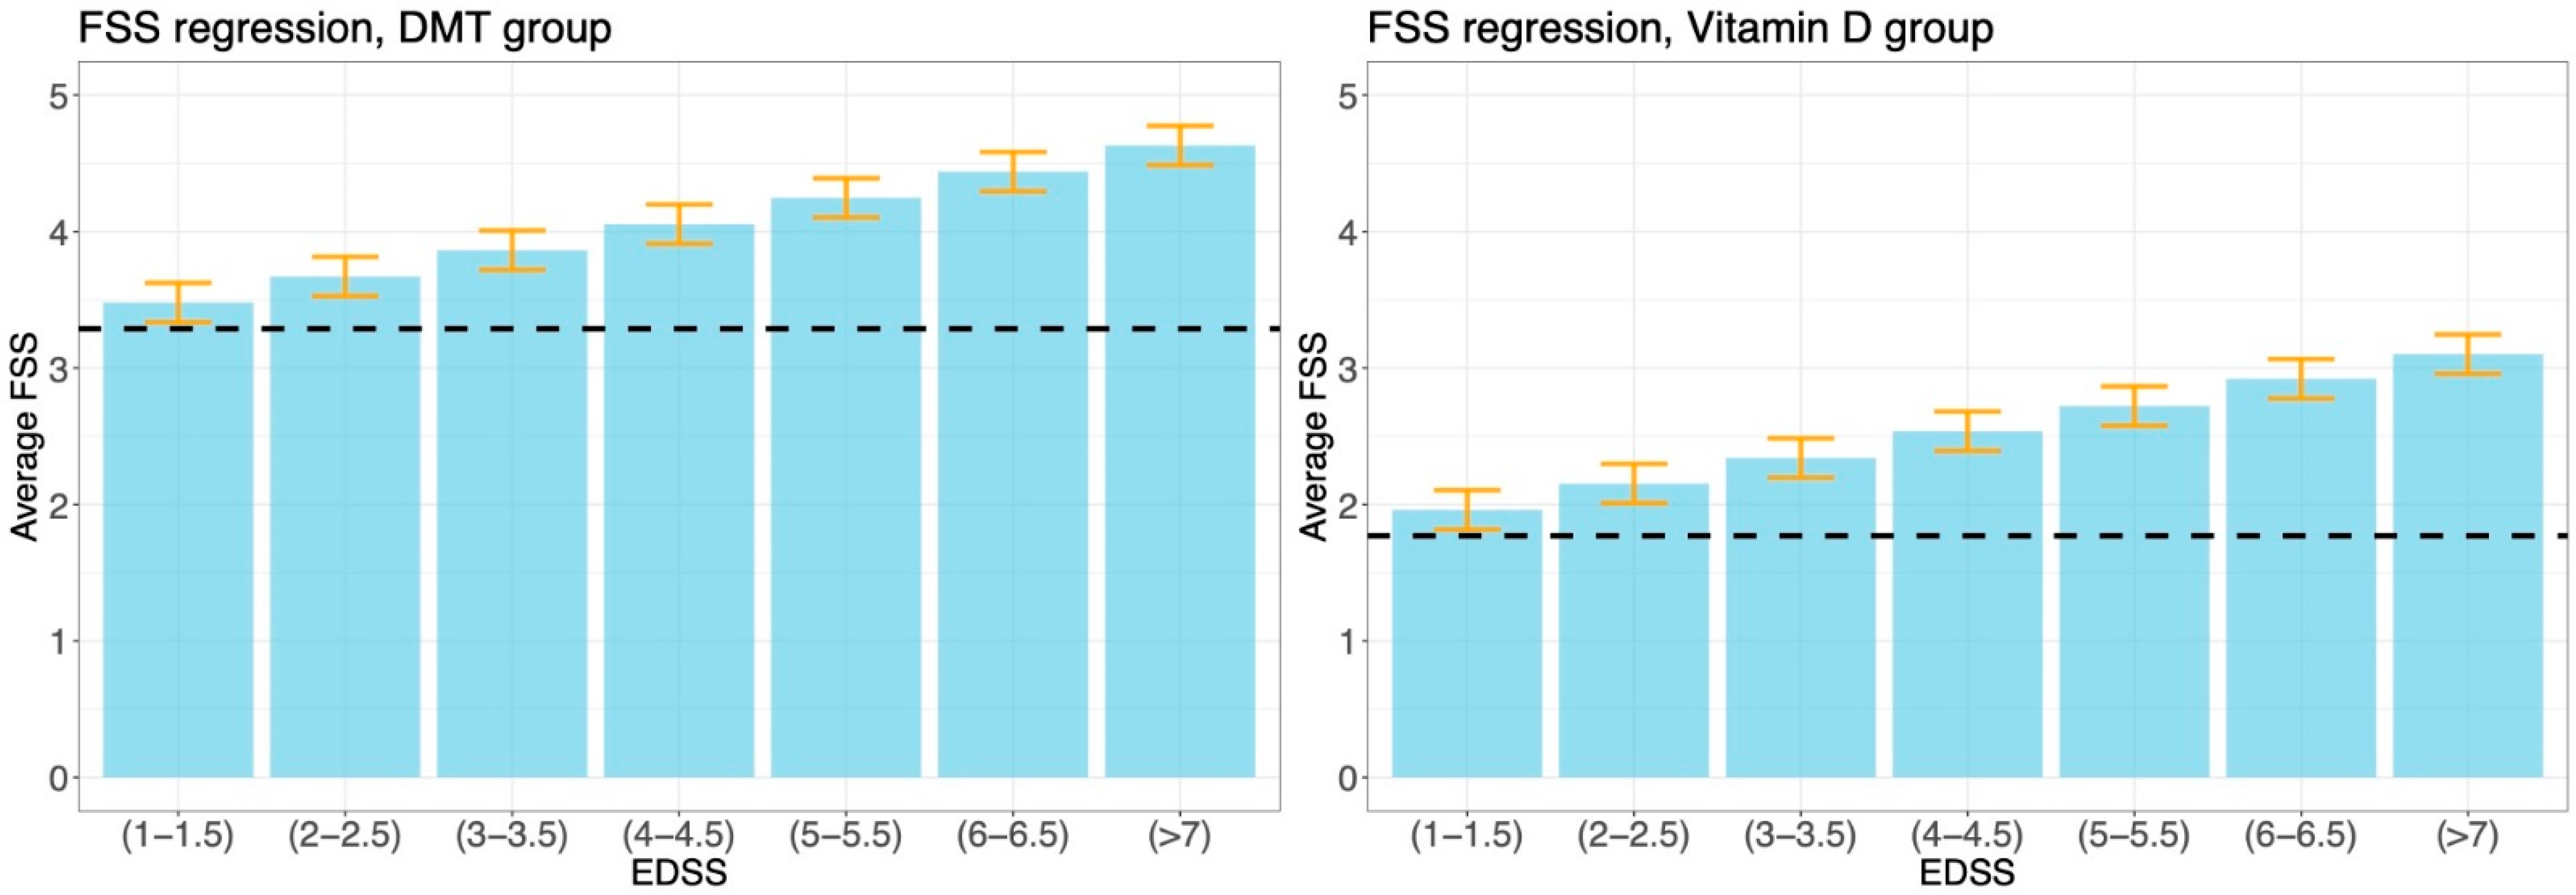
3.2. Results of the Regression Analysis on TPH in All Four Groups

Table 2 shows the results of a linear regression analysis that correlates the TPH index with the EDSS, the demographic information on age and weight, and the treatment of 324 patients. The regression does not consider the variables sex and marital status of the patients because they were excluded by the variable selection phase. By reference group, we denoted patients with an EDSS of 0, without therapy, in the 18–30 age group, and with a weight between 40 kg and 60 kg. In addition, they were active workers or inactive workers but not for health reasons. High-dose VD treatment was associated with a significant increase in mean TPH (+9.92, t-test p-value < 0.001), net of the effects of age, weight, and EDSS, while DMT was associated with a significant decrease in mean THP (−5.96, t-test p-value = 0.024). In addition, we evaluated whether there were interactions of the treatments with some demographic variables and with the EDSS that produced a significantly non-null effect on the TPH. To do so, we fitted the extended regression model with 40 regression coefficients in total. However, the AIC model selection criterion removed all possible interaction terms, leading to the same model discussed earlier. We concluded that, from the available data, no interaction effects between the treatments and the demographic variables were associated with TPH.

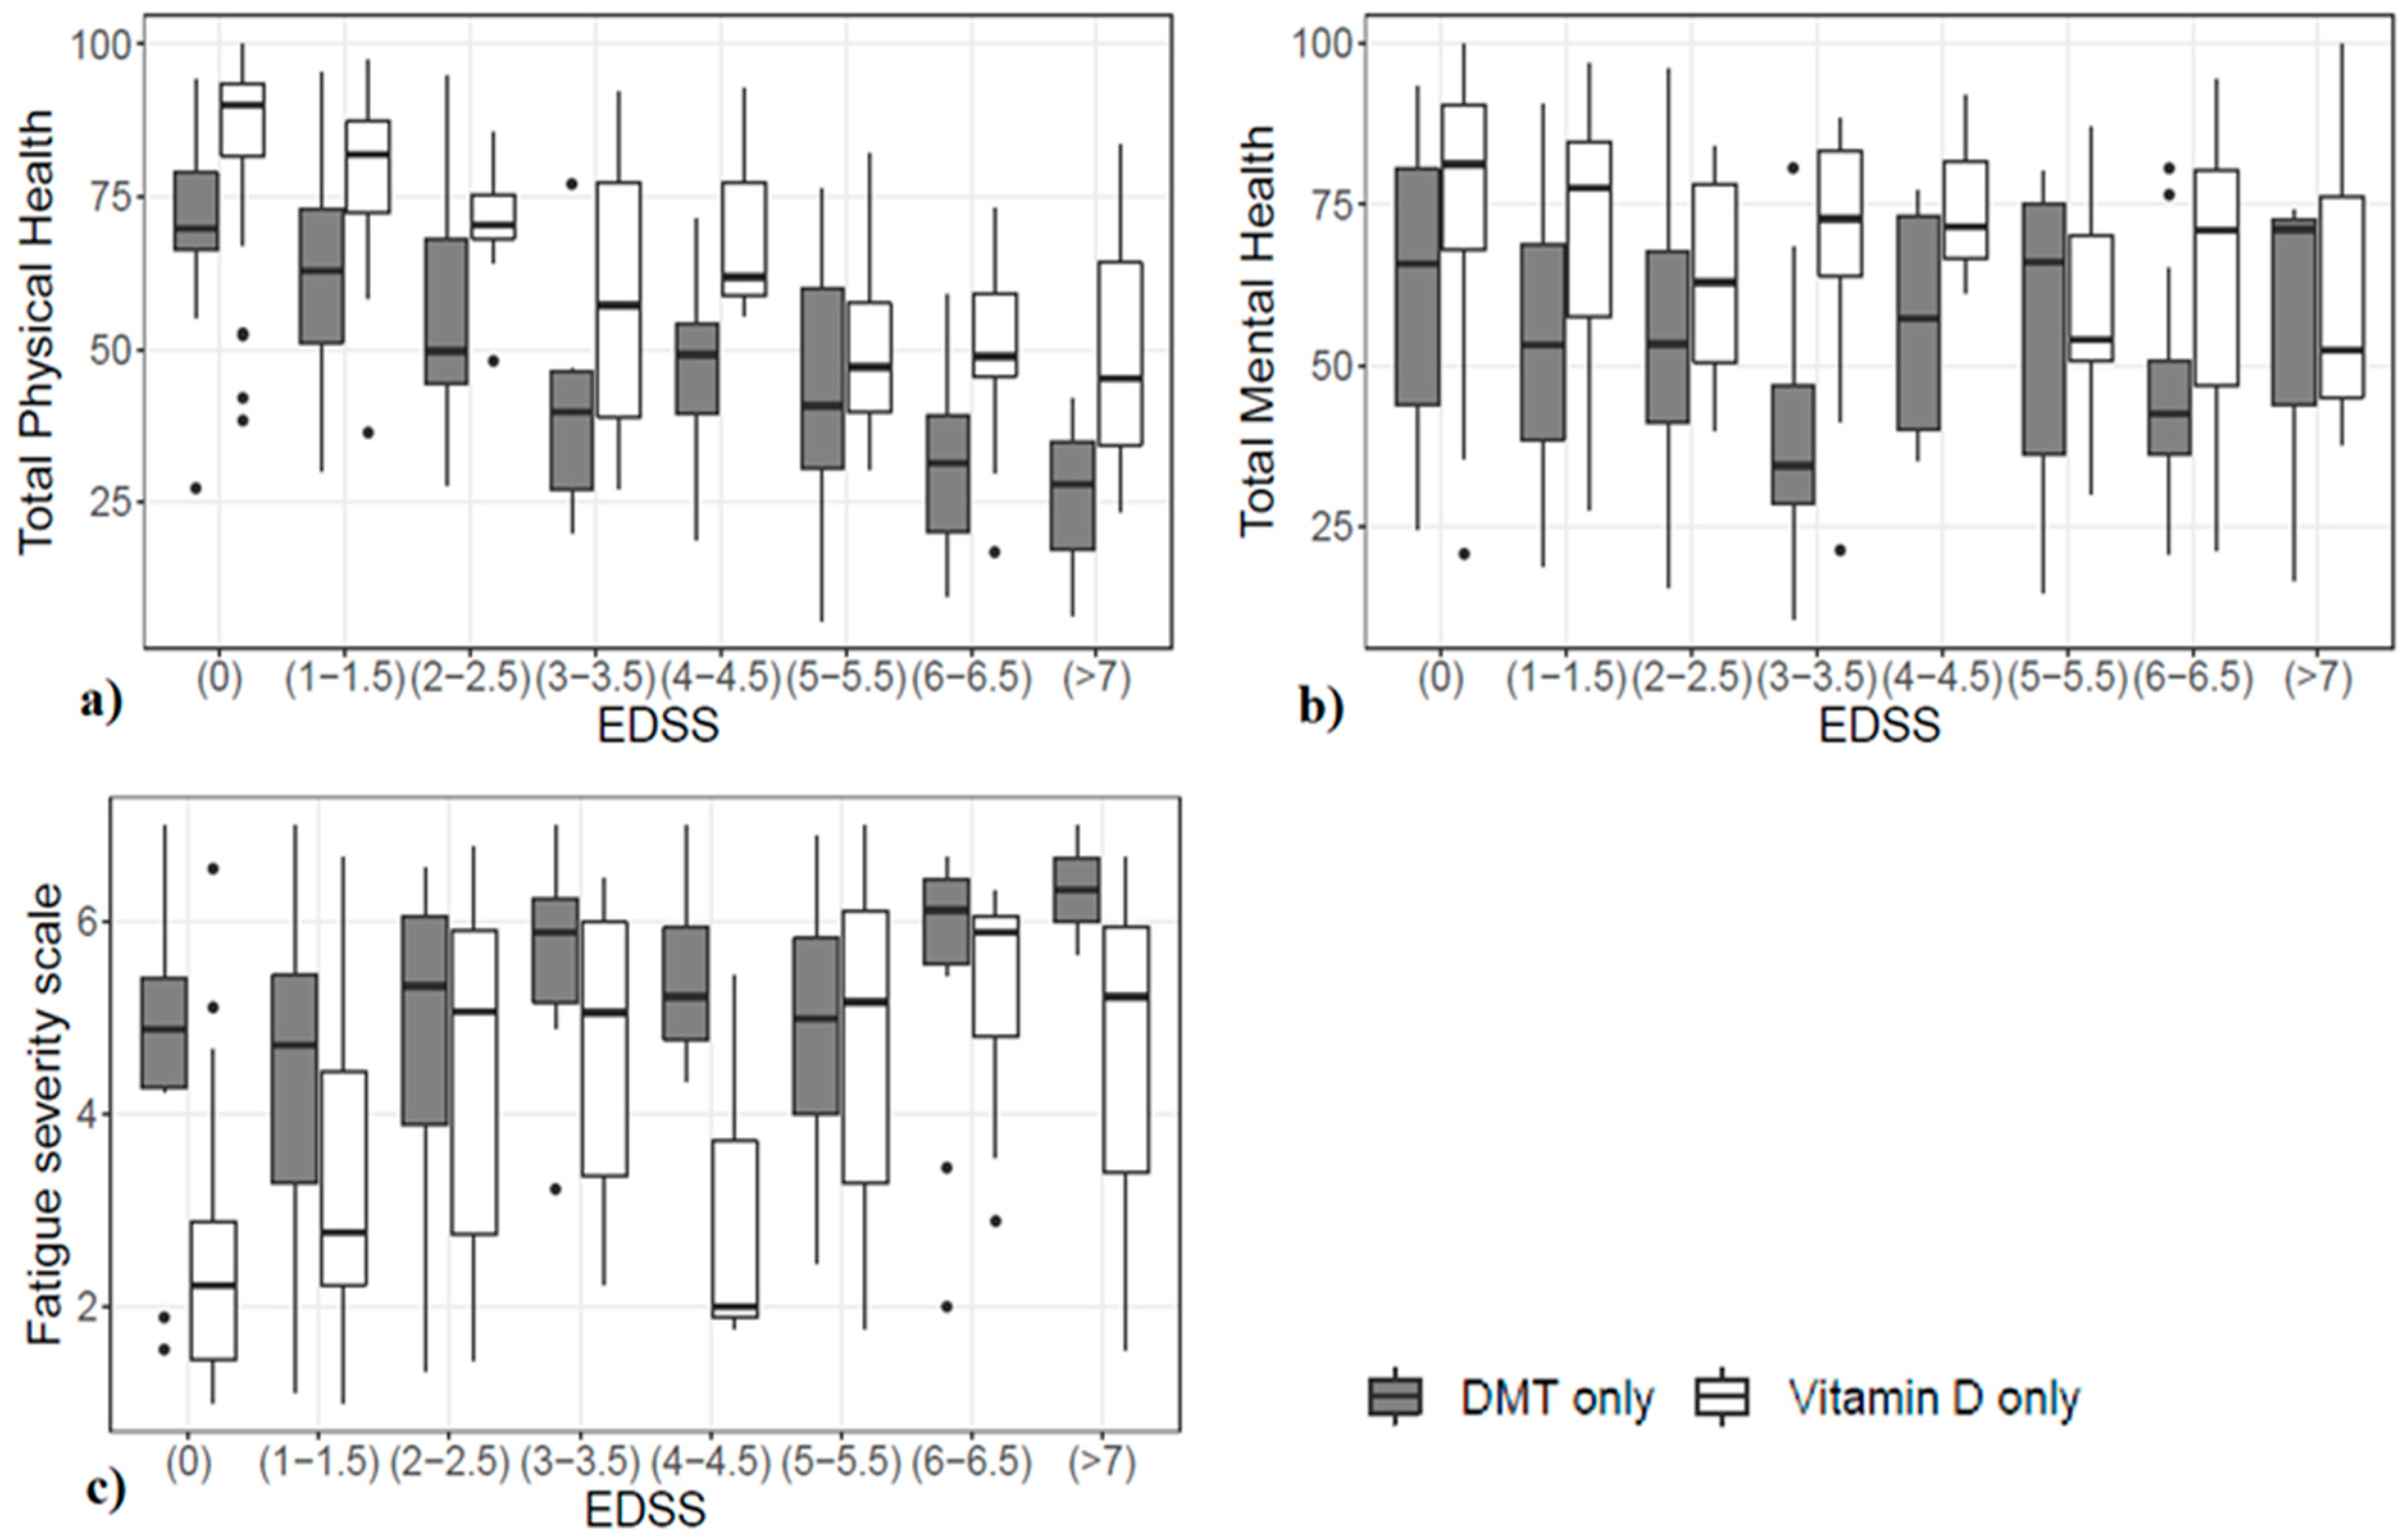
3.3. Analysis of VD-Only Versus DMT-Only Groups

As for the direct comparison between patients on VD (125 subjects) and those on DMT (107 subjects), the two treatment arms were comparable for most demographic variables, although they differed in age (patients on VD only were, on average, younger) and the EDSS (subjects on VD only had a lower level of disability). In the analysis presented in Section 3.2, population size differences were partly taken into account by the estimated standard errors. In this other analysis, we further reduced these differences by focusing only on two specific treatment arms. Figure 4 shows a graphical comparison of the TPH, TMH, and FSS within the two treatment groups at every EDSS level.
The variables selected for the analysis of TPH using the restricted sample appear in the top line of Figure 5, and numerical values are reported in the top part of Table A1. The reference group consisted of patients who were either active workers or inactive workers but not for health reasons, treated with DMT, and with an EDSS of 0. Results showed that the average TPH increased by 16.69 for patients treated with high-dose VD treatments (p-value < 0.001). In addition, we extended the regression model by considering the interaction of the treatment variable with the EDSS and all the demographic variables. However, the AIC applied to the extended model removed all the interaction terms, leading us to conclude that no interaction effects emerged from the data.
The variables selected for the analysis of TMH appear in the central graph of Figure 4 (numerical values are reported in the central part of Table 1). The reference group consisted of patients who were either active workers or inactive workers but not for health reasons, not involved in any relationship, with a weight between 40 kg and 60 kg, treated with DMT, and with an EDSS of 0. The effect of high-dose VD treatment increased the average TMH value by 15.72 (p-value < 0.001) compared to the reference group, net of the effects of the other variables. Again, we examined the interaction of the treatment variable with the EDSS and all the demographic variables, as we did earlier with the analysis of TPH. For the TMH index as well, no relevant interaction effects were observed.
The variables selected for the analysis of the FSS appear in the bottom part of Figure 4 (numerical values are reported in the bottom part of Table A1). The reference group consisted of patients with an EDSS of 0, with an age between 18 and 30, a weight between 40 kg and 60 kg, and treated with a DMT. T-tests were conducted to evaluate the significance of the selected variables. VD-based treatments were associated with lower perceived fatigue (1.09 decrease, p-value < 0.001) compared to the reference group, net of the effects of the other variables. As might be expected, there was also a significant increase in the mean FSS score for each 1-point increase in the EDSS (+0.3, p-value < 0.001), in older age groups (+1.15 and +1.17, p-values < 0.001), and in the group weighing more than 80 kg (+0.95, p-value = 0.003). In this case, an almost significant interaction effect between the treatment variable and the EDSS (p-value = 0.053) emerged. The estimated interaction term was +0.190, which led to an estimated average increment of +0.382 of the FSS for any 1-point increase of the EDSS class in the VD cohort, against an estimated average increment of +0.192 in the DMT cohort. Details are given in Figure A2.

4. Discussion

4.1. Summary and Contributions

In this multi-center, cross-sectional study, we compared patients on high-dose VD therapy, with and without concurrent use of a DMT, with patients not using high-dose VD and with patients not receiving any therapies. Particularly, we looked at three variables that best characterize quality of life in PwMS: TPH, TMH (the two components of the MSQOL-54 questionnaire), and the FSS. We analyzed how each demographic variable, especially different therapies, modified these indexes, compared to a previously defined reference group.
Initially, we compared all four study populations on perceived physical health. The analysis shows that age and EDSS score negatively affect TPH. Most importantly, however, data show that treatment with DMTs is associated with a reduction in perceived physical health compared to no treatments at all, while high-dose vitamin D is associated with an improved perception of physical health.
We then narrowed the sample to two populations, VD-only-treated patients and DMT-only-treated patients, and performed another analysis, considering all three outcome measures.
We found that treatment with high-dose VD is associated with an increase in TPH of 16.69 points (p < 0.001), an increase in TMH of 15.72 points (p < 0.001), and a decrease in the FSS of 1.09 points (p < 0.001), compared to treatment with DMT only.
The relationship between circulating VD levels and measures of quality of life and fatigue has been assessed in other studies [29,30,44]. A recent systematic review has further strengthened the evidence that vitamin D administration, alone or in combination with DMTs, is associated with improvements in mood, mental health, physical health, and fatigue [45].
In MS, VD has been administered as a supplement for decades, and it is known that VD deficiency represents a pathogenetic risk factor and can influence disease activity accrual in clinically defined MS [33]. Few studies have analyzed the clinical efficacy of VD in MS, and most of these suffer from methodological errors or too small sample sizes [46]. Although the results obtained are conflicting and ambiguous, there is already evidence supporting a positive effect in the clinically isolated syndrome and in early MS.
It is known that PwMS have a minor increase in circulating 25(OH)D levels after VD supplementation [47]. The recent discoveries of polymorphisms affecting VD resistance in PwMS might represent the substrate for the administration of higher doses compared to the rest of the general population [48,49].
In psoriasis, another autoimmune disease, high-dose VD has been used successfully in a series of patients not taking any other therapies and has been shown to be highly effective, without raising safety concerns [50]. As for MS, there is already some evidence that high-dose VD supplementation could be effective and safe in people not taking any DMTs, as well as when administered as an add-on therapy [51,52]. The efficacy of this approach in MS could be mediated by a reduction in the levels of IL-17, a cytokine that plays a crucial role in the pathogenesis of this disease and whose production is also reduced by other DMTs [53,54]. Despite this evidence, studies on the subject are still scarce, and clinical trials for this purpose will have to be carried out.

4.2. Strengths and Limitations

While many studies have focused on the impact of VD supplementation on MS, ours is the first study to evaluate perceptions of physical health, mental health, and fatigue in patients taking high-dose VD. These measures were compared across treatment groups, and we found treatment with high-dose VD alone to be associated with better outcome measures than treatment with DMTs alone.
Our study has some limitations. Firstly, it is a cross-sectional, noninterventional study; therefore, the potential for reverse causality makes a causal interpretation of the results impossible. Secondly, even after restricting our sample to patients treated with DMT or VD, we still observed a higher prevalence of younger patients or patients with a lower EDSS level (0–3.5) in the VD treatment group compared to the DMT group. The regression analysis accounts for these disparities in computing the p-values; nevertheless, we believe that randomized trials are more suitable for selecting a properly balanced sample than are observational studies. Furthermore, the study is based primarily on self-reported data on vitamin D intake and perceptions of quality of life and fatigue; therefore, our results may be affected by a reduced reliability of what the patients themselves may have declared. Finally, 124 patients failed to complete the questionnaire and had to be excluded from the final analysis, thus reducing the statistical power of our results.

4.3. Future Work

In the present study, we demonstrated a correlation between high-dose VD therapy and indicators of well-being. Future longitudinal studies are needed to establish whether this improving effect on quality of life and fatigue, as well as the effect on neuroinflammation and neurodegeneration, is directly caused by this treatment in PwMS.
In future studies, plasma VD concentrations will also need to be taken into account, as well as other factors that may influence physical and mental health, such as sleep quality, mood, diet, and physical activity [55,56,57,58].

5. Conclusions

High-dose VD is well-tolerated, as demonstrated in other studies [37,53,59,60]. Our cross-sectional work demonstrated that, in PwMS, high-dose VD treatment is also associated with improved perception of quality of life and fatigue. This possible link deserves to be further explored in randomized longitudinal studies.

Author Contributions

Conceptualization, M.V. and G.B.; methodology, M.V. and A.S.; software, A.S.; formal analysis, A.S. and A.I.; data curation, A.I. and A.S.; writing—original draft preparation, A.I. and A.S.; writing—review and editing, A.I. and G.B.; supervision, M.V. and G.B. All authors have read and agreed to the published version of the manuscript.

Funding

Andrea Sottosanti’s work is supported by PNRR (National Recovery and Resilience Plan) Mission 4–Investment 1.3, financed by European Union–NextGenerationEU, Project AGE-IT-A Novel Public-Private Alliance to Generate Socioeconomic, Biomedical and Technological Solutions for an Inclusive Italian Ageing Society, CUP C93C22005240007.

Institutional Review Board Statement

All participants have been assured of the anonymity of the data. The study was performed in accordance with the Declaration of Helsinki, EU regulations 2016/679 and 2018/1725. Approval by an Ethics Committee was not required for this type of study, according to national legislation (article 110 of the Italian Privacy Code).

Informed Consent Statement

Informed consent was obtained from all subjects involved in the study.

Data Availability Statement

Data reported in this paper will be made available upon request to the authors.

Conflicts of Interest

Andrea Sottosanti’s work is supported by PNRR (National Recovery and Resilience Plan) Mission 4–Investment 1.3, financed by European Union–NextGenerationEU, Project AGE-IT-A Novel Public-Private Alliance to Generate Socioeconomic, Biomedical and Technological Solutions for an Inclusive Italian Ageing Society, CUP C93C22005240007. The funder had no role in the design of the study; in the collection, analyses, or interpretation of data; in the writing of the manuscript, or in the decision to publish the results. The other authors declare no conflict of interest.

Abbreviations

AIC: Akaike’s information criterion; DMT: disease-modifying therapy; EBV: Epstein–Barr virus; EDSS: expanded disability status scale; EU: European Union; FSS: fatigue severity scale; IL: interleukin; IU: international units, MS: multiple sclerosis; MSQOL-54: multiple sclerosis quality of life-54; PwMS: people with multiple sclerosis; QoL: quality of life; Th: T helper cells; TMH: total mental health; TPH: total physical health; Tregs: T regulatory cells; VD: vitamin D.

Appendix A

This section includes additional graphs and tables.
Figure A1 displays some diagnostic graphs we used to check if models presented in Section 3.2 and Section 3.3 respected the standard linear regression assumptions.
The four graphs compare the predicted response values (also called fitted values) with the model residuals. In every scenario, fitted and residual values appear as uncorrelated, thus confirming that the linearity assumption is always respected, and no transformation of the response variables is required. In addition, the residuals randomly spread around 0 within the same range of variability for all the levels of fitted values, so we can also confirm that the homoskedasticity assumption is respected. We conclude that the applied linear regressions are adequate to analyze these data.
Figure A1. Comparison between the estimated values and the regression residuals obtained from the regression analyses presented in Section 3.2 and Section 3.3. Red lines denote nonparametric LOWESS regressions [42]. The bottom right graph refers to the regression analysis of the FSS without considering the interaction between treatment and the FSS. Residuals from the extended model are not reported here as they are essentially equivalent to the ones obtained from the model without the interaction term.
Ctn 07 00012 g0a1aCtn 07 00012 g0a1b
Table A1 displays numerical details about the regression analyses performed in Section 3.3.
Table A1. Details of the linear regression analysis of TPH, TMH, and FSS, for VD-only and DMT-only cohorts, explained in Section 3.3.
Mean Result (Diff. from Reference)Standard Errorp-Value
Total Physical Health *
Reference group66.912.03<0.001
EDSS single-point increase(−5.12)0.55<0.001
Inactive worker (for health reasons)51.71 (−15.20)4.01<0.001
VD group83.60 (16.69)2.10<0.001
Total Mental Health *
Reference group59.80 3.35<0.001
Weight 61–80 kg65.97 (6.17) 2.670.021
Weight >80 kg57.53 (−2.27)3.870.565
Married/Cohabitant51.75 (−8.05)3.180.014
Separated/Divorced/Widow50.96 (−8.84)4.790.062
Inactive worker (for health reasons)41.69 (−18.11)4.37<0.001
VD group75.52 (15.72) 2.56<0.001
Fatigue Severity Scale
Reference group2.980.34<0.001
EDSS single-point increase(0.30)0.05<0.001
Age 31–454.12 (1.15)0.32<0.001
Age 46–704.15 (1.17)0.34<0.001
Weight 61–80 kg2.88 (−0.1)0.210.649
Weight > 80 kg3.93 (0.95)0.310.003
VD group1.89 (−1.09)0.21<0.001
The variables included in each regression model were selected using the AIC. * Denotes that standard errors and p-values were computed using a bootstrap procedure, rather than using the t-test.
Figure A2 displays the results from the additional regression analysis with interactions presented in Section 3.3. In particular, it describes the relation between the EDSS and FSS in the two cohorts of patients, treated respectively with DMT and VD. The average increase in the FSS is associated with an increase in the EDSS level of 0.192 in the DMT cohort and of 0.382 in the VD cohort. The p-value associated with this interaction term is 0.053.
Figure A2. Results from the linear regression analysis of the FSS performed in performed in Section 3.3, using the model that includes the interaction between the EDSS and treatment.
Ctn 07 00012 g0a2

References

  1. Thompson, A.J.; Baranzini, S.E.; Geurts, J.; Hemmer, B.; Ciccarelli, O. Multiple sclerosis. Lancet 2018, 391, 1622–1636. [Google Scholar] [CrossRef] [PubMed]
  2. Hagström, I.T.; Schneider, R.; Bellenberg, B.; Salmen, A.; Weiler, F.; Köster, O.; Gold, R.; Lukas, C. Relevance of early cervical cord volume loss in the disease evolution of clinically isolated syndrome and early multiple sclerosis: A 2-year follow-up study. J. Neurol. 2017, 264, 1402–1412. [Google Scholar] [CrossRef] [PubMed]
  3. Ruggieri, S.; Petracca, M.; de Giglio, L.; de Luca, F.; Giannì, C.; Gurreri, F.; Petsas, N.; Tommasin, S.; Pozzilli, C.; Pantano, P. A matter of atrophy: Differential impact of brain and spine damage on disability worsening in multiple sclerosis. J. Neurol. 2021, 268, 4698–4706. [Google Scholar] [CrossRef] [PubMed]
  4. Meyer-Moock, S.; Feng, Y.S.; Maeurer, M.; Dippel, F.W.; Kohlmann, T. Systematic literature review and validity evaluation of the Expanded Disability Status Scale (EDSS) and the Multiple Sclerosis Functional Composite (MSFC) in patients with multiple sclerosis. BMC Neurol. 2014, 14, 58. [Google Scholar] [CrossRef]
  5. Ochoa-Morales, A.; Hernández-Mojica, T.; Paz-Rodríguez, F.; Jara-Prado, A.; Trujillo-De Los Santos, Z.; Sánchez-Guzmán, M.A.; Guerrero-Camacho, J.L.; Corona-Vázquez, T.; Flores, J.; Camacho-Molina, A.; et al. Quality of life in patients with multiple sclerosis and its association with depressive symptoms and physical disability. Mult. Scler. Relat. Disord. 2019, 36, 101386. [Google Scholar] [CrossRef]
  6. Walton, C.; King, R.; Rechtman, L.; Kaye, W.; Leray, E.; Marrie, R.A.; Robertson, N.; La Rocca, N.; Uitdehaag, B.; Van Der Mei, I.; et al. Rising prevalence of multiple sclerosis worldwide: Insights from the Atlas of MS, third edition. Mult. Scler. J. 2020, 26, 1816–1820. [Google Scholar] [CrossRef]
  7. Paz-Zulueta, M.; Parás-Bravo, P.; Cantarero-Prieto, D.; Blázquez-Fernández, C.; Oterino-Durán, A. A literature review of cost-of-illness studies on the economic burden of multiple sclerosis. Mult. Scler. Relat. Disord. 2020, 43, 102162. [Google Scholar] [CrossRef]
  8. Solari, A.; Filippini, G.; Mendozzi, L.; Ghezzi, A.; Cifani, S.; Barbieri, E.; Baldini, S.; Salmaggi, A.; La Mantia, L.; Farinotti, M.; et al. Validation of Italian multiple sclerosis quality of life 54 questionnaire. J. Neurol. Neurosurg. Psychiatry 1999, 67, 158–162. [Google Scholar] [CrossRef]
  9. Vickrey, B.G.; Hays, R.D.; Harooni, R.; Myers, L.W.; Ellison, G.W. A health-related quality of life measure for multiple sclerosis. Qual. Life Res. 1995, 4, 187–206. [Google Scholar] [CrossRef]
  10. Dymecka, J.; Gerymski, R.; Tataruch, R.; Bidzan, M. Fatigue, Physical Disability and Self-Efficacy as Predictors of the Acceptance of Illness and Health-Related Quality of Life in Patients with Multiple Sclerosis. Int. J. Environ. Res. Public Health 2021, 18, 13237. [Google Scholar] [CrossRef]
  11. Torres-Costoso, A.; Martínez-Vizcaíno, V.; Reina-Gutiérrez, S.; Álvarez-Bueno, C.; Guzmán-Pavón, M.J.; Pozuelo-Carrascosa, D.P.; Fernández-Rodríguez, R.; Sanchez-López, M.; Cavero-Redondo, I. Effect of Exercise on Fatigue in Multiple Sclerosis: A Network Meta-analysis Comparing Different Types of Exercise. Arch. Phys. Med. Rehabil. 2021, 103, 970–987.e18. [Google Scholar] [CrossRef] [PubMed]
  12. Sellitto, G.; Morelli, A.; Bassano, S.; Conte, A.; Baione, V.; Galeoto, G.; Berardi, A. Outcome measures for physical fatigue in individuals with multiple sclerosis: A systematic review. Expert Rev. Pharmacoecon. Outcomes Res. 2021, 21, 625–646. [Google Scholar] [CrossRef] [PubMed]
  13. Induruwa, I.; Constantinescu, C.S.; Gran, B. Fatigue in multiple sclerosis—A brief review. J. Neurol. Sci. 2012, 323, 9–15. [Google Scholar] [CrossRef] [PubMed]
  14. Schwid, S.R.; Covington, M.; Segal, B.M.; Goodman, A.D. Fatigue in multiple sclerosis: Current understanding and future directions. J. Rehabil. Res. Dev. 2002, 39, 211–224. [Google Scholar]
  15. Krupp, L.B.; LaRocca, N.G.; Muir-Nash, J.; Steinberg, A.D. The fatigue severity scale. Application to patients with multiple sclerosis and systemic lupus erythematosus. Arch. Neurol. 1989, 46, 1121–1123. [Google Scholar] [CrossRef]
  16. Rosti-Otajärvi, E.; Hämäläinen, P.; Wiksten, A.; Hakkarainen, T.; Ruutiainen, J. Validity and reliability of the Fatigue Severity Scale in Finnish multiple sclerosis patients. Brain Behav. 2017, 7, e00743. [Google Scholar] [CrossRef]
  17. Krupp, L.B.; Coyle, P.K.; Doscher, C.; Miller, A.; Cross, A.H.; Jandorf, L.; Halper, J.; Johnson, B.; Morgante, L.; Grimson, R. Fatigue therapy in multiple sclerosis: Results of a double-blind, randomized, parallel trial of amantadine, pemoline, and placebo. Neurology 1995, 45, 1956–1961. [Google Scholar] [CrossRef]
  18. Valko, P.O.; Bassetti, C.L.; Bloch, K.E.; Held, U.; Baumann, C.R. Validation of the Fatigue Severity Scale in a Swiss Cohort. Sleep 2008, 31, 1601–1607. [Google Scholar] [CrossRef]
  19. Ghasemi, N.; Razavi, S.; Nikzad, E. Multiple Sclerosis: Pathogenesis, Symptoms, Diagnoses and Cell-Based Therapy. Cell J. 2017, 19, 1–10. [Google Scholar]
  20. de Angelis, F.; John, N.A.; Brownlee, W.J. Disease-modifying therapies for multiple sclerosis. BMJ 2018, 363, k4674. [Google Scholar] [CrossRef]
  21. Comi, G.; Radaelli, M.; Soelberg Sørensen, P. Evolving concepts in the treatment of relapsing multiple sclerosis. Lancet 2017, 389, 1347–1356. [Google Scholar] [CrossRef] [PubMed]
  22. Henze, T.; Rieckmann, P.; Toyka, K.V. Symptomatic Treatment of Multiple Sclerosis. Eur. Neurol. 2006, 56, 78–105. [Google Scholar] [CrossRef] [PubMed]
  23. Toosy, A.; Ciccarelli, O.; Thompson, A. Symptomatic treatment and management of multiple sclerosis. Handb. Clin. Neurol. 2014, 122, 513–562. [Google Scholar] [PubMed]
  24. Olsson, T.; Barcellos, L.F.; Alfredsson, L. Interactions between genetic, lifestyle and environmental risk factors for multiple sclerosis. Nat. Rev. Neurol. 2017, 13, 25–36. [Google Scholar] [CrossRef] [PubMed]
  25. Bjornevik, K.; Cortese, M.; Healy, B.C.; Kuhle, J.; Mina, M.J.; Leng, Y.; Elledge, S.J.; Niebuhr, D.W.; Scher, A.I.; Munger, K.L.; et al. Longitudinal analysis reveals high prevalence of Epstein-Barr virus associated with multiple sclerosis. Science 2022, 375, 296–301. [Google Scholar] [CrossRef] [PubMed]
  26. Munger, K.L.; Levin, L.I.; Hollis, B.W.; Howard, N.S.; Ascherio, A. Serum 25-Hydroxyvitamin D Levels and Risk of Multiple Sclerosis. JAMA 2006, 296, 2832. [Google Scholar] [CrossRef]
  27. McKay, K.A.; Jahanfar, S.; Duggan, T.; Tkachuk, S.; Tremlett, H. Factors associated with onset, relapses or progression in multiple sclerosis: A systematic review. Neurotoxicology 2017, 61, 189–212. [Google Scholar] [CrossRef]
  28. Ascherio, A.; Munger, K.L.; White, R.; Köchert, K.; Simon, K.C.; Polman, C.H.; Freedman, M.S.; Hartung, H.-P.; Miller, D.H.; Montalban, X.; et al. Vitamin D as an Early Predictor of Multiple Sclerosis Activity and Progression. JAMA Neurol. 2014, 71, 306–314. [Google Scholar] [CrossRef]
  29. Simpson-Yap, S.; Jelinek, P.; Weiland, T.; Nag, N.; Neate, S.; Jelinek, G. Self-reported use of vitamin D supplements is associated with higher physical quality of life scores in multiple sclerosis. Mult. Scler. Relat. Disord. 2021, 49, 102760. [Google Scholar] [CrossRef]
  30. Ashtari, F.; Toghianifar, N.; Zarkesh-Esfahani, S.H.; Mansourian, M. High dose Vitamin D intake and quality of life in relapsing-remitting multiple sclerosis: A randomized, double-blind, placebo-controlled clinical trial. Neurol. Res. 2016, 38, 888–892. [Google Scholar] [CrossRef]
  31. Fattizzo, B.; Zaninoni, A.; Giannotta, J.A.; Binda, F.; Cortelezzi, A.; Barcellini, W. Reduced 25-OH vitamin D in patients with autoimmune cytopenias, clinical correlations and literature review. Autoimmun. Rev. 2016, 15, 770–775. [Google Scholar] [CrossRef] [PubMed]
  32. Goischke, H.K. Vitamin D supplementation for the prevention or depletion of side effects of therapy with alemtuzumab in multiple sclerosis. Ther. Clin. Risk Manag. 2019, 15, 891–904. [Google Scholar] [CrossRef] [PubMed]
  33. Sintzel, M.B.; Rametta, M.; Reder, A.T. Vitamin D and Multiple Sclerosis: A Comprehensive Review. Neurol. Ther. 2018, 7, 59–85. [Google Scholar] [CrossRef]
  34. Holick, M.F.; Binkley, N.C.; Bischoff-Ferrari, H.A.; Gordon, C.M.; Hanley, D.A.; Heaney, R.P.; Murad, M.H.; Weaver, C.M. Evaluation, Treatment, and Prevention of Vitamin D Deficiency: An Endocrine Society Clinical Practice Guideline. J. Clin. Endocrinol. Metab. 2011, 96, 1911–1930. [Google Scholar] [CrossRef]
  35. Lemke, D.; Klement, R.J.; Schweiger, F.; Schweiger, B.; Spitz, J. Vitamin D Resistance as a Possible Cause of Autoimmune Diseases: A Hypothesis Confirmed by a Therapeutic High-Dose Vitamin D Protocol. Front. Immunol. 2021, 12, 655739. [Google Scholar] [CrossRef] [PubMed]
  36. Scazzone, C.; Agnello, L.; Bivona, G.; Lo Sasso, B.; Ciaccio, M. Vitamin D and Genetic Susceptibility to Multiple Sclerosis. Biochem. Genet. 2021, 59, 1–30. [Google Scholar] [CrossRef]
  37. Smolders, J.; Peelen, E.; Thewissen, M.; Cohen Tervaert, J.W.; Menheere, P.; Hupperts, R.; Damoiseaux, J. Safety and T Cell Modulating Effects of High Dose Vitamin D3 Supplementation in Multiple Sclerosis. PLoS ONE 2010, 5, e15235. [Google Scholar] [CrossRef] [PubMed]
  38. Kimball, S.M.; Ursell, M.R.; O’Connor, P.; Vieth, R. Safety of vitamin D3 in adults with multiple sclerosis. Am. J. Clin. Nutr. 2007, 86, 645–651. [Google Scholar] [CrossRef] [PubMed]
  39. Burton, J.M.; Kimball, S.; Vieth, R.; Bar-Or, A.; Dosch, H.M.; Cheung, R.; Gagne, D.; D’Souza, C.; Ursell, M.; O’Connor, P. A phase I/II dose-escalation trial of vitamin D3 and calcium in multiple sclerosis. Neurology 2010, 74, 1852–1859. [Google Scholar] [CrossRef]
  40. Thompson, A.J.; Banwell, B.L.; Barkhof, F.; Carroll, W.M.; Coetzee, T.; Comi, G.; Correale, J.; Fazekas, F.; Filippi, M.; Freedman, M.S.; et al. Diagnosis of multiple sclerosis: 2017 revisions of the McDonald criteria. Lancet Neurol. 2018, 17, 162–173. [Google Scholar] [CrossRef]
  41. Efron, B.; Tibshirani, R.J. Regression Models. In An Introduction to the Bootstrap; Champan & Hall CRC: Boca Raton, FL, USA, 1994; pp. 105–121. [Google Scholar]
  42. Azzalini, A.; Scarpa, B. Data Analysis and Data Mining: An Introduction—Chapter 3; OUP: New York, NY, USA, 2012. [Google Scholar]
  43. R Core Team. R: A Language and Environment for Statistical Computing; R Foundation for Statistical Computing [Internet]: Vienna, Austria, 2021; Available online: https://www.R-project.org/ (accessed on 20 December 2022).
  44. Beckmann, Y.; Türe, S.; Duman, S.U. Vitamin D deficiency and its association with fatigue and quality of life in multiple sclerosis patients. EPMA J. 2020, 11, 65–72. [Google Scholar] [CrossRef] [PubMed]
  45. Głąbska, D.; Kołota, A.; Lachowicz, K.; Skolmowska, D.; Stachoń, M.; Guzek, D. Vitamin D Supplementation and Mental Health in Multiple Sclerosis Patients: A Systematic Review. Nutrients 2021, 13, 4207. [Google Scholar] [CrossRef] [PubMed]
  46. Boltjes, R.; Knippenberg, S.; Gerlach, O.; Hupperts, R.; Damoiseaux, J. Vitamin D supplementation in multiple sclerosis: An expert opinion based on the review of current evidence. Expert Rev. Neurother. 2021, 21, 715–725. [Google Scholar] [CrossRef]
  47. Bhargava, P.; Steele, S.U.; Waubant, E.; Revirajan, N.R.; Marcus, J.; Dembele, M.; Cassard, S.D.; Hollis, B.W.; Crainiceanu, C.; Mowry, E.M. Multiple sclerosis patients have a diminished serologic response to vitamin D supplementation compared to healthy controls. Mult. Scler. J. 2016, 22, 753–760. [Google Scholar] [CrossRef] [PubMed]
  48. Graves, J.S.; Barcellos, L.F.; Krupp, L.; Belman, A.; Shao, X.; Quach, H.; Hart, J.; Chitnis, T.; Weinstock-Guttman, B.; Aaen, G.; et al. Vitamin D genes influence MS relapses in children. Mult. Scler. J. 2020, 26, 894–901. [Google Scholar] [CrossRef] [PubMed]
  49. Mimpen, M.; Rolf, L.; Poelmans, G.; van den Ouweland, J.; Hupperts, R.; Damoiseaux, J.; Smolders, J. Vitamin D related genetic polymorphisms affect serological response to high-dose vitamin D supplementation in multiple sclerosis. PLoS ONE 2021, 16, e0261097. [Google Scholar] [CrossRef]
  50. Mahtani, R.; Nair, P.M.K. Daily oral vitamin D3 without concomitant therapy in the management of psoriasis: A case series. Clin. Immunol. Commun. 2022, 2, 17–22. [Google Scholar] [CrossRef]
  51. Etemadifar, M.; Janghorbani, M. Efficacy of high-dose vitamin D3 supplementation in vitamin D deficient pregnant women with multiple sclerosis: Preliminary findings of a randomized-controlled trial. Iran. J. Neurol. 2015, 14, 67–73. [Google Scholar] [PubMed]
  52. Hupperts, R.; Smolders, J.; Vieth, R.; Holmøy, T.; Marhardt, K.; Schluep, M.; Killestein, J.; Barkhof, F.; Beelke, M.; Grimaldi, L.M.; et al. Randomized trial of daily high-dose vitamin D 3 in patients with RRMS receiving subcutaneous interferon β-1a. Neurology 2019, 93, e1906–e1916. [Google Scholar] [CrossRef]
  53. Toghianifar, N.; Ashtari, F.; Zarkesh-Esfahani, S.H.; Mansourian, M. Effect of high dose vitamin D intake on interleukin-17 levels in multiple sclerosis: A randomized, double-blind, placebo-controlled clinical trial. J. Neuroimmunol. 2015, 285, 125–128. [Google Scholar] [CrossRef]
  54. Milovanovic, J.; Arsenijevic, A.; Stojanovic, B.; Kanjevac, T.; Arsenijevic, D.; Radosavljevic, G.; Milovanovic, M.; Arsenijevic, N. Interleukin-17 in Chronic Inflammatory Neurological Diseases. Front. Immunol. 2020, 11, 947. [Google Scholar] [CrossRef] [PubMed]
  55. Berrigan, L.I.; Fisk, J.D.; Patten, S.B.; Tremlett, H.; Wolfson, C.; Warren, S.; Fiest, K.M.; McKay, K.A.; Marrie, R.A.; For the CIHR Team in the Epidemiology and Impact of Comorbidity on Multiple Sclerosis (ECoMS). Health-related quality of life in multiple sclerosis. Neurology 2016, 86, 1417–1424. [Google Scholar] [CrossRef] [PubMed]
  56. Motl, R.W.; McAuley, E.; Snook, E.M.; Gliottoni, R.C. Physical activity and quality of life in multiple sclerosis: Intermediary roles of disability, fatigue, mood, pain, self-efficacy and social support. Psychol. Health Med. 2009, 14, 111–124. [Google Scholar] [CrossRef] [PubMed]
  57. Sakkas, G.K.; Giannaki, C.D.; Karatzaferi, C.; Manconi, M. Sleep Abnormalities in Multiple Sclerosis. Curr. Treat. Options Neurol. 2019, 21, 4. [Google Scholar] [CrossRef] [PubMed]
  58. Dauwan, M.; Begemann, M.J.H.; Slot, M.I.E.; Lee, E.H.M.; Scheltens, P.; Sommer, I.E.C. Physical exercise improves quality of life, depressive symptoms, and cognition across chronic brain disorders: A transdiagnostic systematic review and meta-analysis of randomized controlled trials. J. Neurol. 2021, 268, 1222–1246. [Google Scholar] [CrossRef]
  59. Sotirchos, E.S.; Bhargava, P.; Eckstein, C.; van Haren, K.; Baynes, M.; Ntranos, A.; Gocke, A.; Steinman, L.; Mowry, E.M.; Calabresi, P.A. Safety and immunologic effects of high-vs low-dose cholecalciferol in multiple sclerosis. Neurology 2016, 86, 382–390. [Google Scholar] [CrossRef] [PubMed]
  60. Amon, U.; Yaguboglu, R.; Ennis, M.; Holick, M.F.; Amon, J. Safety Data in Patients with Autoimmune Diseases during Treatment with High Doses of Vitamin D3 According to the “Coimbra Protocol”. Nutrients 2022, 14, 1575. [Google Scholar] [CrossRef]
Figure 1. Workflow of the analysis. Step 1 selects the cohorts of patients. Step 2 selects the demographic variables of interest for the study. Step 3 selects which of the variables from Step 2 should be included into the regression analysis of the TPH, TMH, and FSS. Step 4 selects which test should be used to evaluate the demographic variables that have a significant impact on the three daily-life-quality indicators considered.
Ctn 07 00012 g001
Figure 2. Distribution of disease-modifying therapies in subjects included in the final analysis.
Ctn 07 00012 g002
Figure 3. Daily vitamin D dosages taken by subjects included in the final analysis, with and without concomitant DMTs.
Ctn 07 00012 g003
Figure 4. Difference in (a) perceived TPH, (b) perceived TMH, and (c) FSS, stratified by the EDSS in the two groups.
Ctn 07 00012 g004
Figure 5. Linear regression analysis of the TPH, TMH, and FSS indexes, using the cohorts of patients treated with VD or DMT. The variables included in each regression model were selected using the AIC. Vertical bars represent the regression coefficients, while error bars denote the 95% confidence intervals. The horizontal black dashed lines are the average values of TPH, TMH, and FSS within the reference groups. If a horizontal bar crosses an error bar, then the variable associated to that error bar does not significantly change the average value of the response, compared to the reference group. For illustration purposes, we show the effects of the EDSS levels.
Ctn 07 00012 g005
Table 1. Demographic characteristics of our sample.
VariableGroupsDMT OnlyVD OnlyDMT+VDNo TreatmentTotal VD Patients Per Class (%)p-Valuep-Value (VD Only and DMT Only)
Age18–308223125 (73.5)0.010.014
31–454863202783 (52.5)
46–705140132853 (40.2)
SexMale1631141245 (61.6)0.0240.09
Female91942244116 (46.2)
Weight40–60 kg5158122270 (49)0.3690.184
61–80 kg3855172672 (52.9)
>80 kg18127819 (42.2)
Years since diagnosis0–106064241988 (52.7)0.0410.463
11–20284262248 (49)
>20191961525 (42.4)
Marital statusSingle1830151145 (60.8)<0.0010.016
Married/Cohabitant71881744105 (47.7)
Separated/Divorced/Widow1874111 (36.7)
Employment statusActive worker/unemployed/inactive worker (for reasons not related to the health status)931183341151 (53.0)<0.001 0.08
Inactive worker (for health reasons)14731510 (25.6)
Disease phenotypeRelapsing–remitting921062533131 (51.1)<0.0010.946
Progressive1519112330 (44.1)
EDSS0–3.5731012429125 (55.1)0.0010.04
≥4.03424122736 (37.1)
The last two columns show the chi-square group proportions test comparing the four groups of treatments and only the courts treated with VD or DMT. In bold: significant differences in the proportions of patients using different treatments across the levels of a variable.
Table 2. Linear regression analysis of the TPH index according to the EDSS level, treatment, and demographic data of the patients selected through the AIC.
Mean TPH (Diff. from Reference)Standard Errorp-Value
Reference group76.533.80<0.001
EDSS single point increase(−4.70) *0.46<0.001
Age 31–45 years71.80 (−4.73)3.040.120
Age 46–70 years69.51 (−7.02)3.220.030
Weight 61–80 kg79.53 (3.00)1.910.117
Weight > 80 kg72.13 (−4.41)2.710.105
DMT group70.58 (−5.95)2.620.024
VD group86.46 (9.92)2.65<0.001
DMT+VD group77.03 (0.50)3.380.883
Inactive worker (for health reasons)64.03 (−12.50)3.02<0.001
The first column shows an estimate of how much the average TPH varies as the conditions change, compared to the reference group. The EDSS box is marked with * to denote that the coefficient must be interpreted as the average change in the mean level of TPH when the EDSS level is increased by one point. p-value < 0.05 denotes a statistically significant difference in the average TPH in the two groups.
Disclaimer/Publisher’s Note: The statements, opinions and data contained in all publications are solely those of the individual author(s) and contributor(s) and not of MDPI and/or the editor(s). MDPI and/or the editor(s) disclaim responsibility for any injury to people or property resulting from any ideas, methods, instructions or products referred to in the content.

