Next Article in Journal
Approximation of Any Particle Size Distribution Employing a Bidisperse One Based on Moment Matching
Next Article in Special Issue
Correction: Veronico et al. Enhancing Oil-Uptake Efficiency with an Alkyl Polyglycoside–Dodecanol Formulation. Colloids Interfaces 2024, 8, 6
Previous Article in Journal
The Onset and Early Stages of Dynamic Wetting of Superspreading and Non-Superspreading Trisiloxane Surfactant Solutions on Hydrophobic Surfaces
Previous Article in Special Issue
Effect of Surfactants/Gels on the Stability of Boron Particle Dispersion in Liquid Fuel
 
 
Correction published on 29 February 2024, see Colloids Interfaces 2024, 8(2), 15.
Article

Enhancing Oil-Uptake Efficiency with an Alkyl Polyglycoside–Dodecanol Formulation

by
Lorenzo Veronico
1,
Giuseppe Colafemmina
1,2 and
Luigi Gentile
1,2,*
1
Department of Chemistry, University of Bari “Aldo Moro”, Via Orabona 4, 70126 Bari, Italy
2
Bari Unit, Center of Colloid and Surface Science (CSGI), Via Orabona 4, 70126 Bari, Italy
*
Author to whom correspondence should be addressed.
Colloids Interfaces 2024, 8(1), 6; https://doi.org/10.3390/colloids8010006
Submission received: 3 December 2023 / Revised: 26 December 2023 / Accepted: 2 January 2024 / Published: 4 January 2024 / Corrected: 29 February 2024
(This article belongs to the Special Issue Progress in Surfactants with Low Environmental Impact)

Abstract

:
This study provides valuable insights into biobased surfactant systems, shedding light on their behavior and potential applications in cleaning and oil recovery processes. By combining the alkyl polyglycoside Triton® CG-110 with C12OH fatty alcohol, a promising strategy emerges, enhancing the efficiency of surfactant-based formulations. This innovative approach paves the way for sustainable solutions in diverse industrial applications. A rheological analysis of the formulations containing C12OH demonstrated a Newtonian-like behavior of up to 3.2 v/v% of Triton, while a viscoelastic response was observed in a system containing 6.4 v/v% of Triton. Self-diffusion nuclear magnetic resonance revealed the formation of larger aggregates with C12OH, diverging from the classical spherical micellar solution. Moreover, cleaning efficiency tests highlighted C12OH’s significant enhancement of the surfactant system’s oil-uptake capacity. This study identified the optimum formulation point, corresponding to the Winsor III microemulsion phase, in samples containing C12OH. This pivotal discovery showcases the potential of tailored surfactant blends, indicating a path toward greener and more effective industrial practices.

1. Introduction

Biosurfactants, as an environmentally sustainable alternative to conventional surfactants, offer the potential to mitigate the environmental impact caused by the escalating production of industrial surfactant-containing formulations [1,2]. In recent years, heightened concern for environmental issues has directed scientific and technological research efforts. The imperative to safeguard human and environmental well-being while reducing reliance on nonrenewable resources has stimulated investigations into the discovery and development of novel sustainable molecules. These molecules should demonstrate high biocompatibility and biodegradability, originating from either natural sources or a synthetic approach grounded in the principles of green chemistry [3,4,5,6].
The extensive range of applications and markets relying on surfactant-based formulations—which underpin detergent formulations for both household [7] and personal care [8], as well as diverse industrial processes [9,10,11,12,13], oil recovery [12,14,15], and remediation [16]—underscores their significance. Furthermore, surfactants are important to the composition of food [17], cosmetics [18], and pharmaceutical products [18,19,20,21,22,23,24]. Yet, the utilization and synthesis of surfactants present mounting global environmental concerns. Most surfactants stem from petrochemical sources, involving polluting industrial procedures [25,26]. Hence, there is an escalating demand for environmentally benign surfactants that exhibit robust biodegradability [27]. Biosurfactants derived from microorganisms such as yeasts and bacteria [3,18,25,28,29,30] encompass not only naturally sourced and microbially/enzymatically produced agents but also surfactants chemically synthesized from biomass, plant oils, amino acids, and sugars [26]. These surfactants, chemically synthesized from biomass, are classified as ”bioderived” or “bioinspired” [3].
While canonical synthetic surfactants are classified based on their polar head properties, Rosenberg and Ron [31] introduced a classification method for biosurfactants that centers on their molecular weight. This classification system categorizes biosurfactants into two groups: low-molecular-weight (LMW) and high-molecular-weight (HMW) variants [2,6,28,31,32,33,34]. LMW biosurfactants, which include glycolipids and lipopeptides, are known for their ability to reduce surface and interfacial tension while enhancing wetting abilities [33,34,35,36]. On the other hand, HMW biosurfactants consist of polymeric compounds such as proteins, polysaccharides, lipoproteins, and lipopolysaccharides [6,30,34,37] and are characterized by their excellent emulsifying and surface adhesion properties. LMW biosurfactants are notable not only for their effectiveness at low concentrations and resilience under extreme pH, temperature, and salinity conditions but also for their high biodegradability, low toxicity, and enhanced environmental compatibility [2,3,18,25,32,34,38].
The major biosurfactant market currently features sophorolipid, rhamnolipid (Rha), alkyl polyglycoside (APG), methyl ethyl sulfonate (MES), sucrose ester, sorbitan ester, and lipopeptide surfactants [39,40,41]. However, microorganisms do not produce APG, MES, sucrose ester, and sorbitan ester. Therefore, a more precise classification would define them as fully biobased surfactants [18]. The drive to develop polysaccharide-based, biodegradable, nontoxic, and highly efficient high-end surfactants has witnessed substantial growth, as evidenced by numerous published studies on this subject [42,43,44,45].
Rha surfactants—comprising a hydrophilic group involving one or two (L)-rhamnose molecules with a glycosidic linkage to a hydrophobic group composed of one or two β-hydroxy fatty acids—have emerged as promising contenders for the partial or complete substitution of anionic surfactants across a range of industrial formulations [1,2]. However, the utilization of rhamnolipids is hindered by their elevated production costs, attributed to fermentation and product purification processes [46,47,48]. In contrast, APG surfactants offer a cost-effective alternative.
APG surfactants [49,50,51,52,53,54,55,56,57,58,59,60] belong to the category of non-ionic, low-molecular-weight (LMW) surfactants. They are synthesized through glycosylation reactions involving sugars and fatty oils [58]. The hydrophobic portion of APG surfactants comprises alkyl chains with variable carbon numbers, typically ranging from 8 to 14, while the hydrophilic segment is composed of 1–3 glucose structures.
APGs have been utilized in the composition of water-in-oil (W/O) nanoemulsions with various solvent systems, serving as specialized detergents for the precise removal of various graffiti coatings [61]. In the realm of detergency, APGs have been employed as degreasing agents [62] and have even been utilized to remove radioactive contamination in low-temperature environments [63]. As non-ionic surfactants, APGs possess impressive eco-friendly attributes and have emerged as promising candidates for chemical flooding applications, particularly in high-temperature, high-salinity reservoirs. Unlike other non-ionic surfactants containing propylene oxide (PO) and ethylene oxide (EO) structures, APGs do not exhibit a cloud point at elevated temperatures in the presence of salts, making them particularly interesting for high-temperature, high-salinity reservoirs where traditional surfactants tend to adsorb on carbonate surfaces [55,64]. Studies indicate that APGs show lower adsorption on carbonate surfaces compared with anionic surfactants like alkyl ether carboxylate [64,65].
Ultra-low interfacial tension in brine/alkane or brine/xylene systems can be seen in APG formulations. Balzer [66] observed ultra-low interfacial tension between water and three different model oils in the presence of APG surfactants, as did Kutschmann et al. and Kahlweit et al. with linear alcohols as co-solvents [67,68]. Dari et al. reported that it is possible to stabilize W/W emulsions using a lamellar gel network based on different APGs and fatty alcohols [69]. The effect of alcohol on classical surfactants has been a subject of investigation for decades. For instance, dodecanol on dodecylamine molecules forms stable clusters at the air/water interface through van der Waals forces between the hydrophobic alkyl chains and hydrogen bonding between the head groups [70]. Such interactions result in a lower critical micelle concentration (CMC), reduced interfacial tension, and more stable micelles. Colafemmina et al. investigated the effect of fatty alcohol mixtures inserted into a CTAC surfactant, indicating highly different effects depending on the cooling ramp rate used after mixing [71].
We present a formulation involving the APG surfactant Triton® CG-110, an octyl/decyl polyglucoside, combined with the fatty alcohol dodecanol that is able to enhance oil uptake. Dodecanol is a highly surface-active compound that significantly influences interfacial tension when co-adsorbed with Triton® CG-110. The impact of dodecanol on Triton® CG-110 concentrations was evaluated using both stationary and oscillatory rheology techniques, along with 1H self-diffusion NMR. We assess the surfactant’s ability to capture oils, both in the presence and absence of fatty alcohol. This study has the potential to enhance oil recovery and find applications in household cleaning.

2. Materials and Methods

2.1. Chemicals

Triton® CG-110—composed of a mixture of 58.0–62.0% D-glucopyranose, oligomeric, decyl octyl glycoside, and 38.0–42.0% water—and 1-Dodecanol were purchased from Sigma-Aldrich (Darmstadt, Germany). To determine the water content, a thermogravimetric analysis (TGA) was performed on the sample leading to the determination of 36% water.
The purchased surfactant might contain traces of 1-decanol and 1-octanol. In the following text, Triton® CG-110 will be indicated as C8–10Gm, where 8–10 are the number of atoms in the hydrocarbon chain, and “m” is a non-definite number of pyranose (G) units in oligomers. “C12OH” will denote the fatty alcohol 1-dodecanol. The critical micellar concentration (CMC) is at 1748 ppm (~0.17 v/v%) at a temperature of 25 °C [72,73].

2.2. Formulations

The Triton® CG-110 samples were prepared by blending the surfactant solution with distilled H2O at concentrations of 1%, 5%, and 10% by volume relative to the initial solution. In a second set of samples, an additional 0.25%, 1.25%, and 2.5% by volume of C12OH was added. The C12OH acts as a co-surfactant.
The surfactant and the C12OH were mixed at 70 °C, applying a shear rate of 1000 s−1. Subsequently, the system was cooled down at a rate of 1 °C/min while maintaining a shear rate of 100 s−1. Considering the surfactant concentration in the initial solution of approximately 64% by weight, the resulting ratio of surfactant to fatty alcohol was approximately 2.56:1. The investigated samples are reported in Table 1.

2.3. Stationary and Oscillatory Rheology

Stationary and oscillatory rheological measurements were carried out using the MCR302evolution stress-controlled rheometer (Anton Paar Gmbh, Graz, Austria) equipped with Taylor−Couette geometry, i.e., concentric cylinder geometry (inner diameter of 16.662 mm and a gap of 0.704 mm). For sample CG10C, a double-wall concentric cylinder geometry was utilized, having stationary inner and outer cylinder diameters of 23.824 mm and 27.586 mm, respectively. The inner and outer rotor diameters were 24.660 mm and 26.650 mm, respectively. The temperature was controlled by a Peltier system (±1 °C), and a water-bath circulator was used as a reference.
The stationary experiments were used to prepare the samples containing fatty alcohol, as described in Section 2.2. Moreover, they were performed at 25 °C by incrementally increasing the shear rate, γ ˙ , and obtaining the apparent viscosity, η γ ˙ , from the measured shear stress (flow curve). All samples were investigated within a range of shear rates from 0.1 to 100 s−1. The Carreau–Yasuda model, [74] was adopted to determine the zero-shear viscosity of non-Newtonian pseudoplastic samples. The equation for the Carreau–Yasuda model is as follows:
η γ ˙ = η γ ˙ 0 η γ ˙ 1 + λ γ ˙ a 1 n a + η γ ˙
where η γ ˙ 0 and η γ ˙ represent the zero-shear and infinity-shear viscosities, respectively. “ a ” is a constant that determines the curvature of the transition region between the lower and higher shear rates, while “λ” has the dimension of time and represents the characteristic time of the system. “ n ” has the same meaning as in the Herschel–Bulkley model; a Newtonian behavior is characterized by a flow index of 1, n = 1, whereas the shear-thinning and shear-thickening non-Newtonian behaviors are characterized by n < 1 and n > 1, respectively.
Small amplitude oscillatory shear tests provided insights into the linear viscoelastic behavior of materials through the determination of the complex shear modulus as a function of the oscillatory angular frequency, ω:
G*(ω) = G′(ω) + iG″(ω)
where G′(ω) and G″(ω), in the following indicated as G′ and G″, are the elastic and viscous moduli, respectively. Frequency sweep tests were conducted between 10−1 and 102 rad/s in the linear viscoelastic regime.

2.4. 1H Self-Diffusion NMR

The NMR experiments were conducted using an Agilent/Varian VNMRS 500 MHz spectrometer equipped with the OneNMR probe. The 1H NMR spectra were acquired using the PRESAT pulse sequence for water suppression. Self-diffusion 1H NMR measurements were carried out by employing the DOSY Gradient-Compensated Stimulated Echo with Spin Lock (DgcsteSL) [75] to measure water self-diffusion and the PRESAT sequence (DgcsteSL_dpfgse) to determine the self-diffusion coefficients of the surfactant while suppressing the water signal. The field gradient pulses, denoted as g, ranged from 0.02 to 0.64 Tm−1. The samples were maintained at a temperature of 25 °C. The resulting spin-echo decays were evaluated following the well-known Stejskal and Tanner equation [76]:
l n I I 0 = D γ δ g 2 Δ δ 3 = D b  
where I represents the echo amplitude, and I0 is the amplitude at g = 0. γ represents the proton’s gyromagnetic ratio; Δ is the gradient pulse separation, ranging from 70 ms to 130 ms; and the gradient pulse duration, δ, varied from 2 ms to 10 ms to explore different time scales and observe echo decays in the water or surfactant. D stands for the apparent self-diffusion coefficient. Equation (3) can also be expressed in terms of b, the diffusion attenuation factor, which contains information regarding the gradient duration and strength used to produce diffusion-weighted spectra. The echo decays for water self-diffusion were obtained at 4.8 ppm, while the surfactant self-diffusion coefficients were determined by integrating the signal from 0.5 to 4.5 ppm.

2.5. Cleaning Efficiency and Qualitative Oil-Uptake Performance

The cleaning efficiency was evaluated using a cleaning performance procedure based on IKW recommendations, which can also be interpreted as the amount of oil that the system is capable of absorbing (oil uptake). A sample of greasy soil was applied to a stainless-steel tile, which was then baked and aged at 135 °C for 2 h before being used for the cleaning assessment. The stainless-steel tiles were treated with a solution of potassium hydroxide (0.08 wt/vol%) and ethanol before use. The greasy soil consisted of oils and soil in a ratio of 4:1. Specifically, the oil was composed of peanut oil, sunflower oil, and corn oil, while the HSW soil was primarily composed of humus, cement, silica gel, and clay. The resulting negatively charged organic matter composition included fatty acids; carbohydrates; and, to a lesser extent, aromatics. The mixture was such that it could be perceived as used cooking oil. The soiled stainless-steel tiles were placed in Petri dishes and covered with pollutant-removal solutions for 18 h. The soiled stainless-steel tiles were weighed using an analytical balance before and after the application of the cleaning solutions.
To evaluate the oil uptake of the surfactant and the combined surfactant and fatty alcohol (co-surfactant) system, petroleum ether was added to form microemulsions. The oil was added to the surfactant and to the surfactant plus the co-surfactant solutions in water.

3. Results

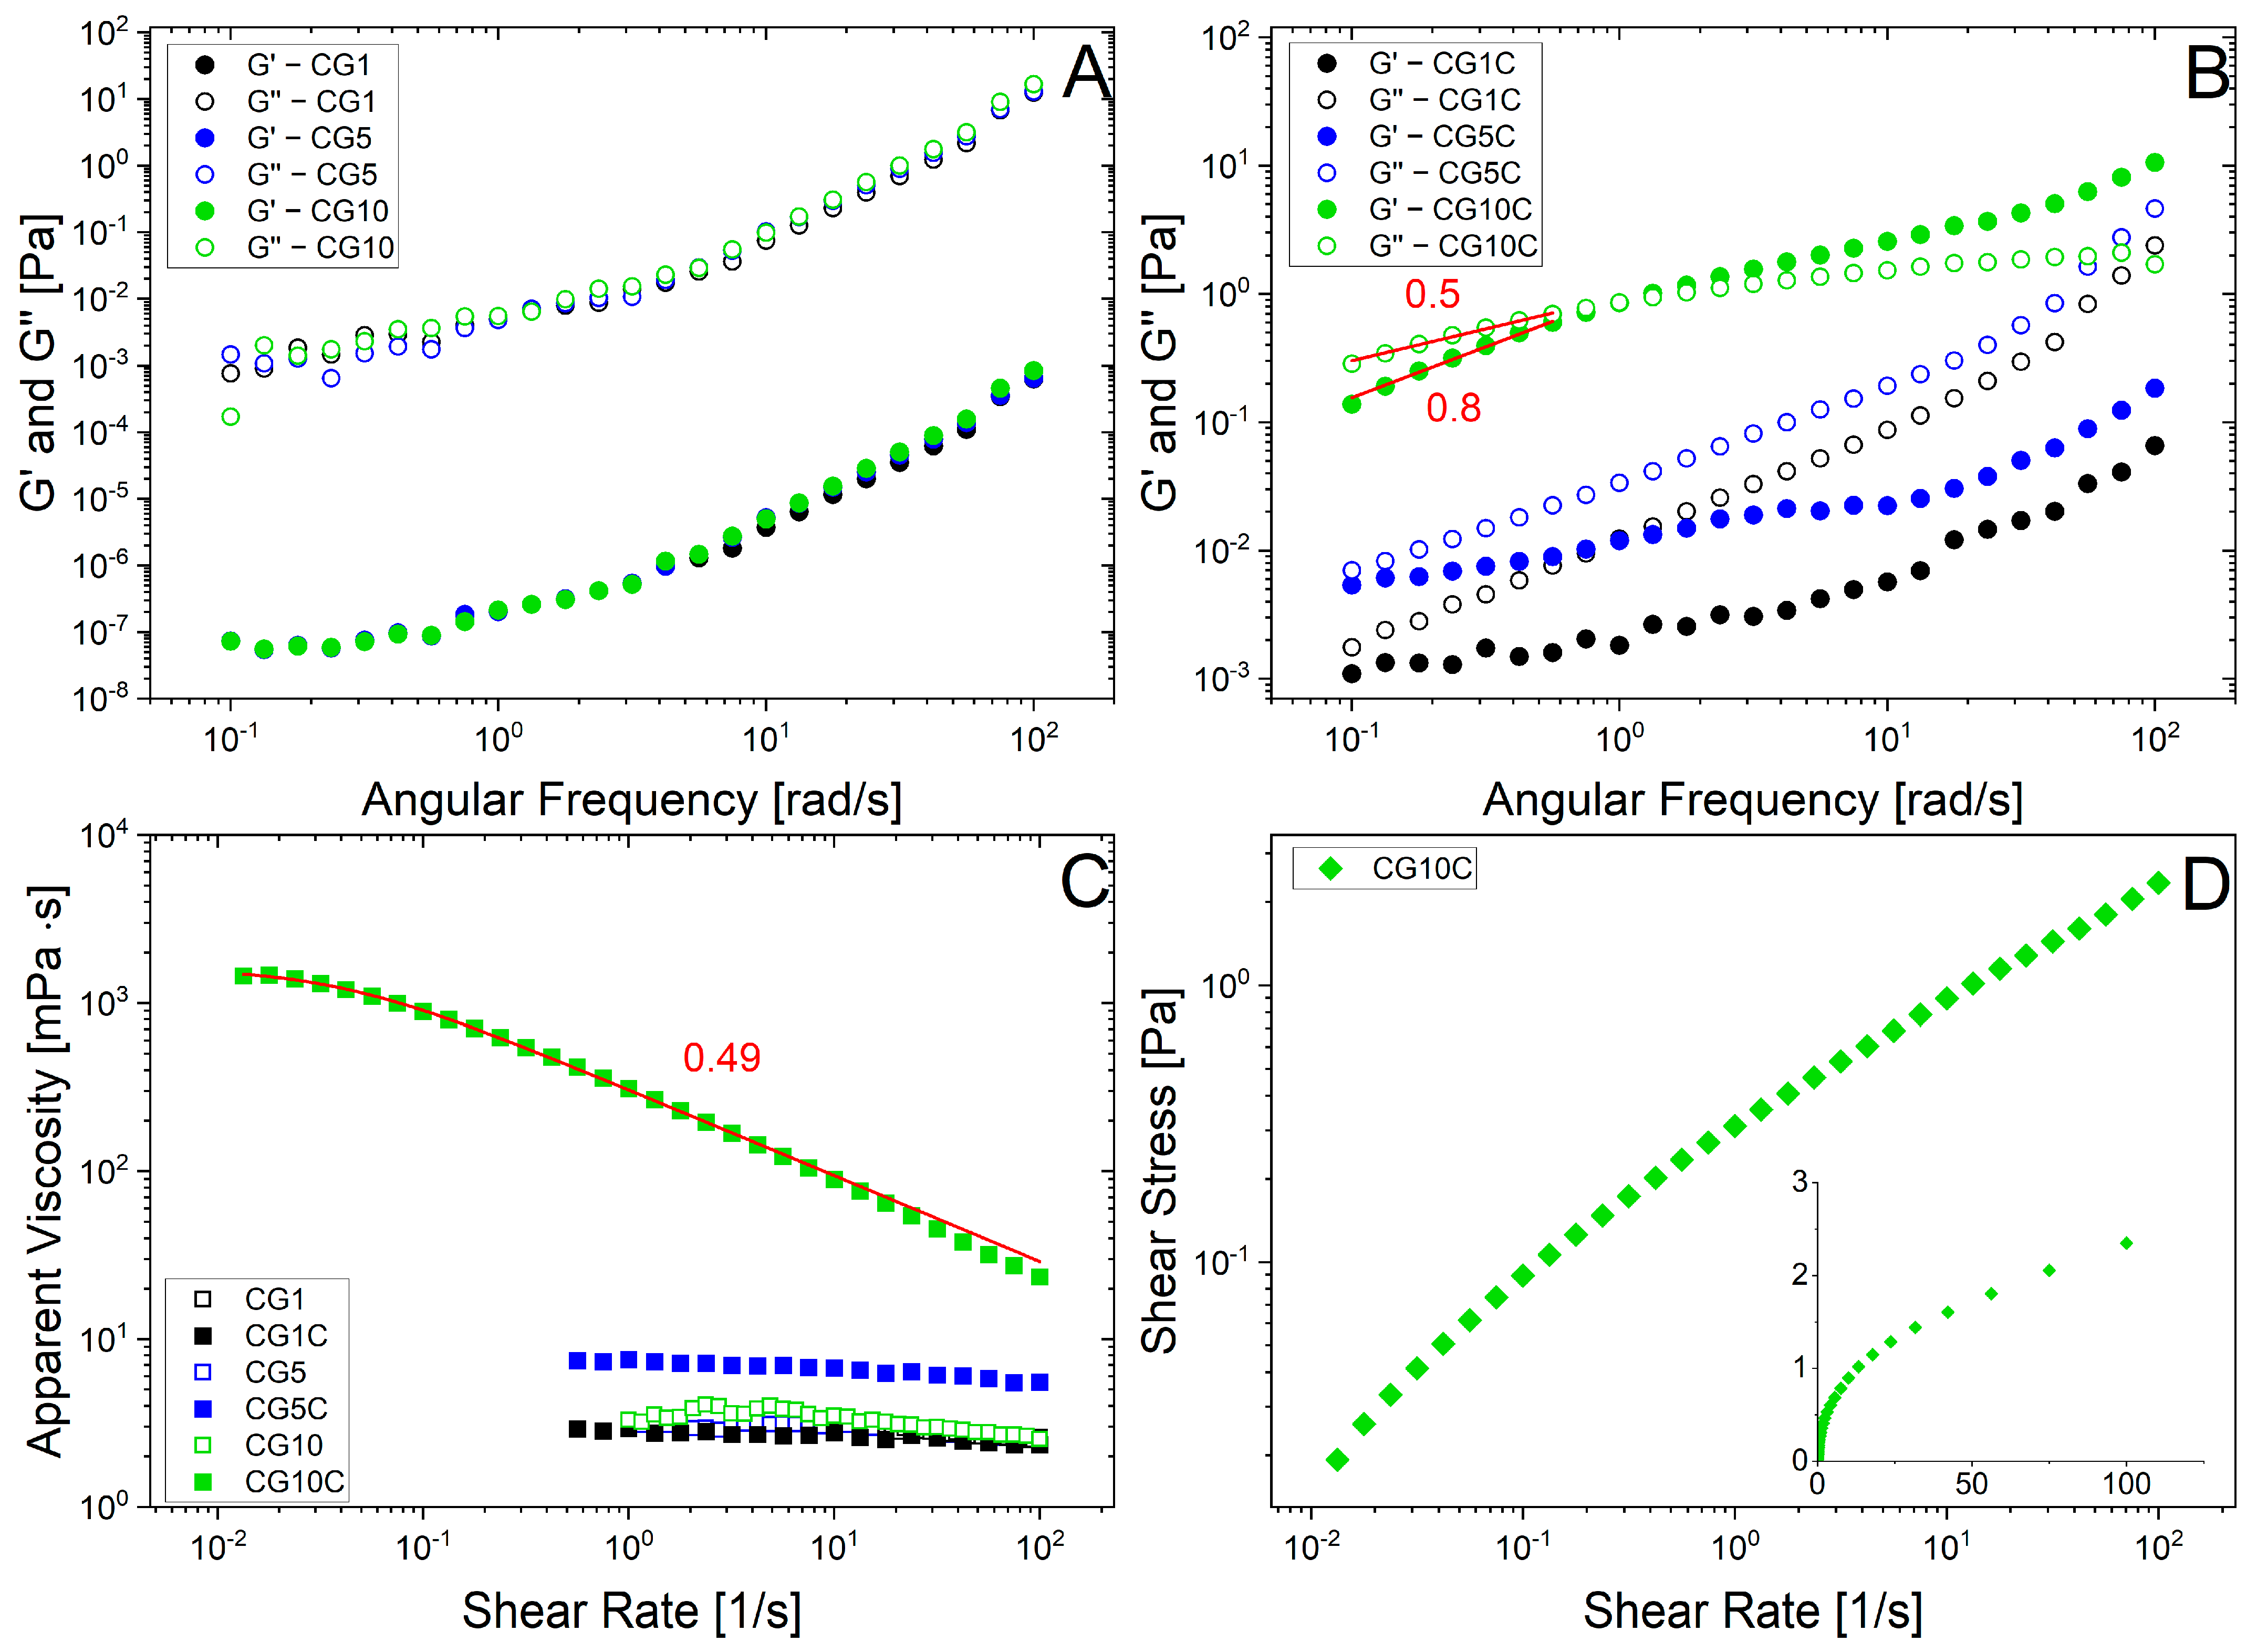
3.1. The Effect of Dodecanol on Triton® CG-110 Micellar Phase

The Triton® CG-110 and C8–10Gm surfactants exhibit a critical micelle concentration (CMC) of approximately 0.17 v/v% at 25 °C. The pseudo-binary phase diagram in water indicates a single micellar phase, L1 [72,73]. Figure 1A illustrates the elastic modulus (G′) and viscous modulus (G″) as functions of angular frequency for the CG1, CG5, and CG10 samples. The frequency sweep tests show overlapping results, resembling Newtonian-like solution behavior, confirming the presence of pure micelles for all investigated concentrations.
The addition of C12OH significantly affects the frequency sweep measurements. In CG1C and CG5C, G″ surpasses G′ across all angular frequencies, with G″ an order of magnitude higher compared with samples without C12OH, as shown in Figure 1B. Additionally, CG1C and CG5C exhibit Newtonian-like behavior in their apparent viscosity, as depicted in Figure 1C.
Conversely, the introduction of C12OH to the CG10C sample results in viscoelastic behavior, as shown in Figure 2B. The frequency sweep of CG10C demonstrates non-Maxwellian behavior, with the slopes of G′ and G″ at low frequency, deviating significantly from the expected values of two and one, respectively. The flow curve for this system indicates shear-thinning behavior, particularly with no apparent yield stress, classifying the system as pseudoplastic, as shown in Figure 1D. Applying the Carreau–Yasuda model (Equation (1)) to the pseudoplastic system yields a flow index (n) of 0.49, a zero-shear viscosity of 1613 ± 78 mPa, and a relaxation time (λ) of 72 ± 12 s.
Figure 1. The elastic modulus, G′, and viscous modulus, G″, are presented as functions of angular frequency for systems with Triton® CG-110 at 1 v/v%, CG1; 5 v/v%, CG5; and 10 v/v%, CG10, in water (A), as well as for Triton® CG-110 with C12OH in a 2.56:1 ratio as a function of surfactant concentrations for CG1C, CG5C, and CG10C (B). The red lines represent linear fits of G″ and G′ with slopes of 0.5 and 0.8, respectively. The apparent viscosity as a function of shear rate is shown for all investigated systems (C), while the shear stress as a function of shear rate is presented for the system CG10C (D). The red line corresponds to the Carreau–Yasuda model, Equation (1), while the inset is a linear–linear plot. All measurements were conducted at 25 °C.
Colloids 08 00006 g001

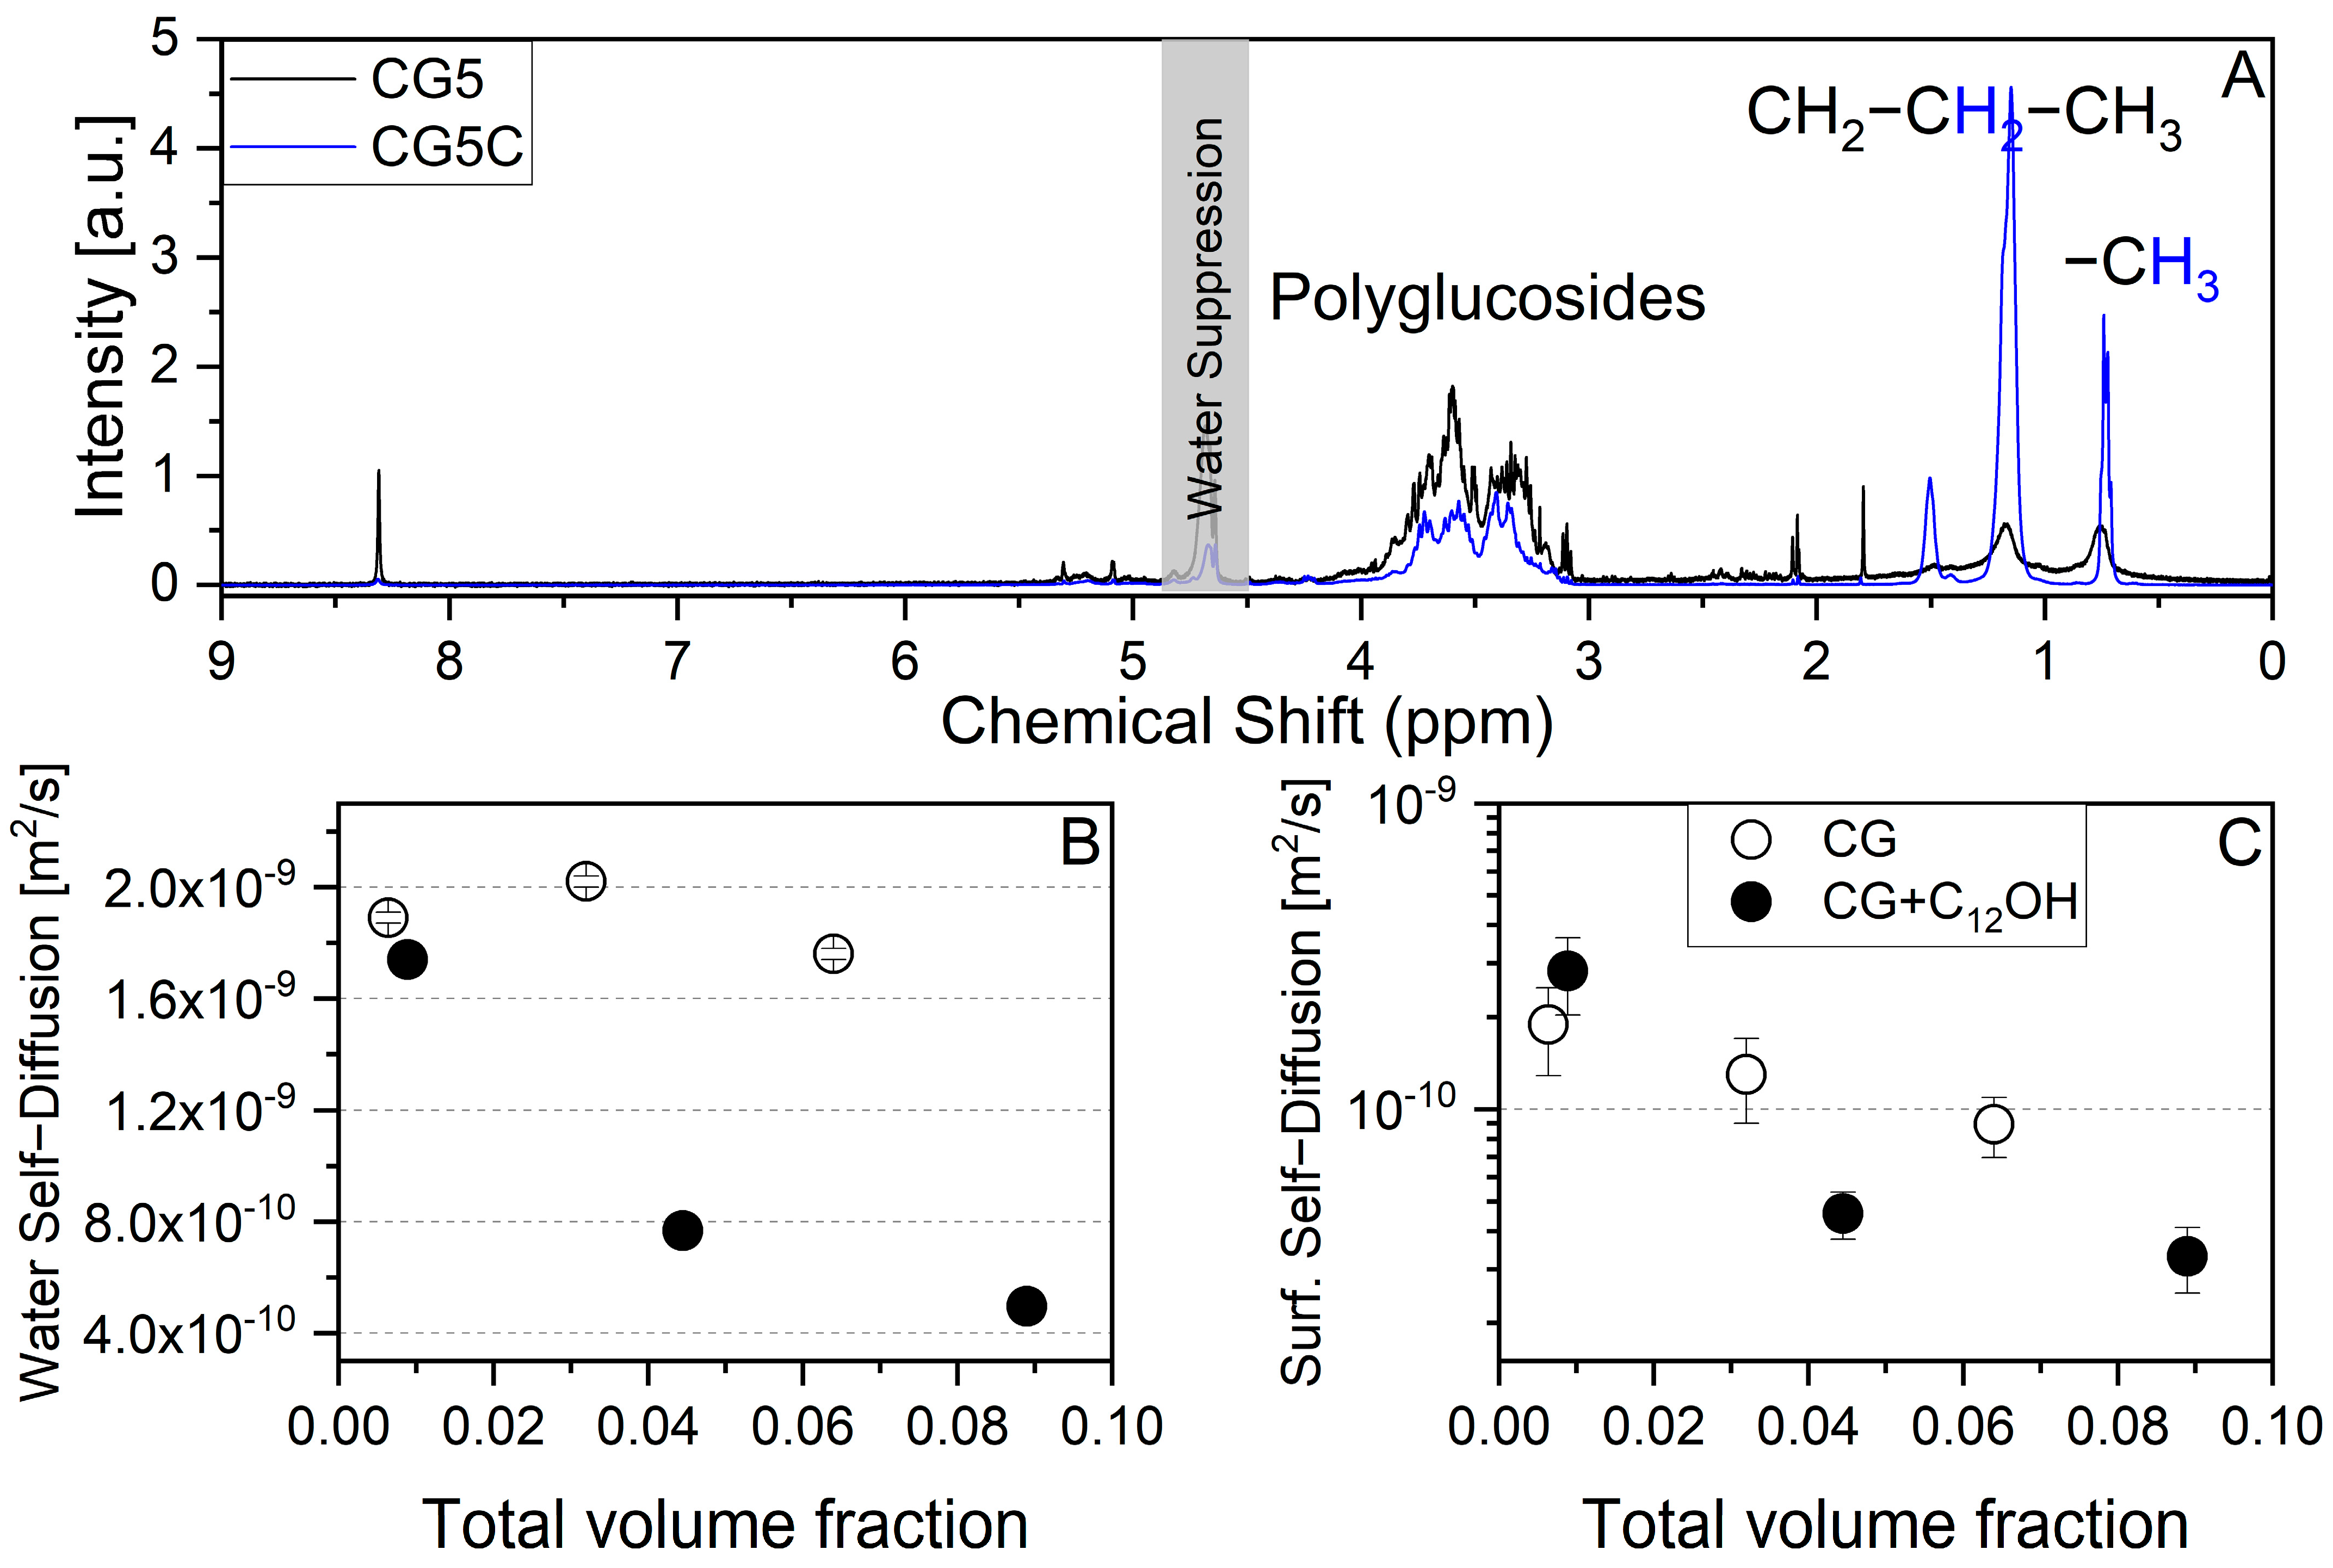
3.2. Self-Diffusion NMR and Obstruction Factor

The 1H NMR spectra of CG5 and CG5C are shown in Figure 2A. The resonances of the surfactant head (polyglycosides) are not affected by the presence of the fatty alcohol, while the intensities are visibly affected in the alkyl region (from 0.5 to 1.8 ppm), changing the intensity ratio between the polyglycoside region and the alkyl region as expected. Moreover, some impurities are appreciable in the CG5 spectrum, but they are not appreciable in the CG5C because of the high resonance intensities.
1H self-diffusion NMR was employed to evaluate the amount of C12OH entrapped in the surfactant and to elucidate the kind of surfactant–alcohol assembly. Figure 2B shows the water self-diffusion coefficients for all investigated samples with respect to the total volume fraction considering the surfactant volume fraction plus the fatty alcohol content of the samples containing fatty alcohol. It is worth noting that all echo decays were fitted with a single-exponential decay equation (Equation (3)). Clearly, water self-diffusion was strongly affected by the presence of the fatty alcohol even before reaching the CG10 sample (volume fraction of 0.064).
Equation (3), used to estimate the water self-diffusion NMR coefficient, is effective for pure isotropic systems such as the micellar phase, while for anisotropic systems, the following holds [77]:
n I I 0 = f D b  
where f is the obstruction factor, whose value is 0 < f < 1, which accounts for the geometrical restrictions to water self-diffusion. For any phase, the relation between water self-diffusion and the surfactant volume fraction can be expressed as
D = f 1 P b D w + P b D b
where Pb is the amount of water bound to interfaces with a self-diffusion equal to Db, and Dw is the self-diffusion of free water (2.29 × 10⁻⁹ m2/s). However, Pb is not directly available from experimental measurements, but if we have two lyotropic mixtures, i and j, belonging to the same phase or micellar solution but with a slightly different composition, a simple relation can be found via elementary stoichiometric considerations, locking the fractions Pi and Pj to the water weight fractions Wi and Wj.
P i P j = W j 1 W i W i 1 W j = K i j  
Rewriting Equation (5) for i and j and considering Equation (6), we can obtain the obstruction factor as a function of known quantities:
f = D b i K i j D b j 1 K i j D w  
If we consider 5 and 10 v/v% of C8–10Gm (CG5 and CG10) to be our i and j samples, we obtain f = 0.99, but it reduces to 0.86 considering 1 and 5 v/v% C8–10Gm + C12OH (CG1C and CG5C) and to 0.44 considering 5 v/v% and 10 v/v% of C8–10Gm + C12OH (CG5C and CG10C).
The surfactant self-diffusion coefficients, shown in Figure 2C as a function of the total volume fraction, were determined by fitting the echo decay signals with a single-exponential decay equation (Equation (3)). This implies that the fatty alcohol and the surfactant are located in the same assembly. The surfactant self-diffusion decreases as the total volume fraction increases, suggesting an increase in the size of the aggregates.
Assuming a spherical shape for the micelles in the samples without C12OH, we calculated hydrodynamic radii of 1.3 ± 0.5 nm, 1.9 ± 0.4 nm, and 2.7 ± 0.2 nm for CG1, CG5, and CG10, respectively, using the Stokes–Einstein equation. These results align with the DLS data in Figure S1, where a hydrodynamic radius of 2.8 ± 0.4 nm is observed for both CG5 and CG10.
However, the samples containing C12OH deviate from the classical spherical micellar solution, as indicated by the obstruction factor. Consequently, the Stokes–Einstein equation cannot be properly applied even though the self-diffusion coefficient is lower than the system without C12OH, implying the presence of larger aggregates.

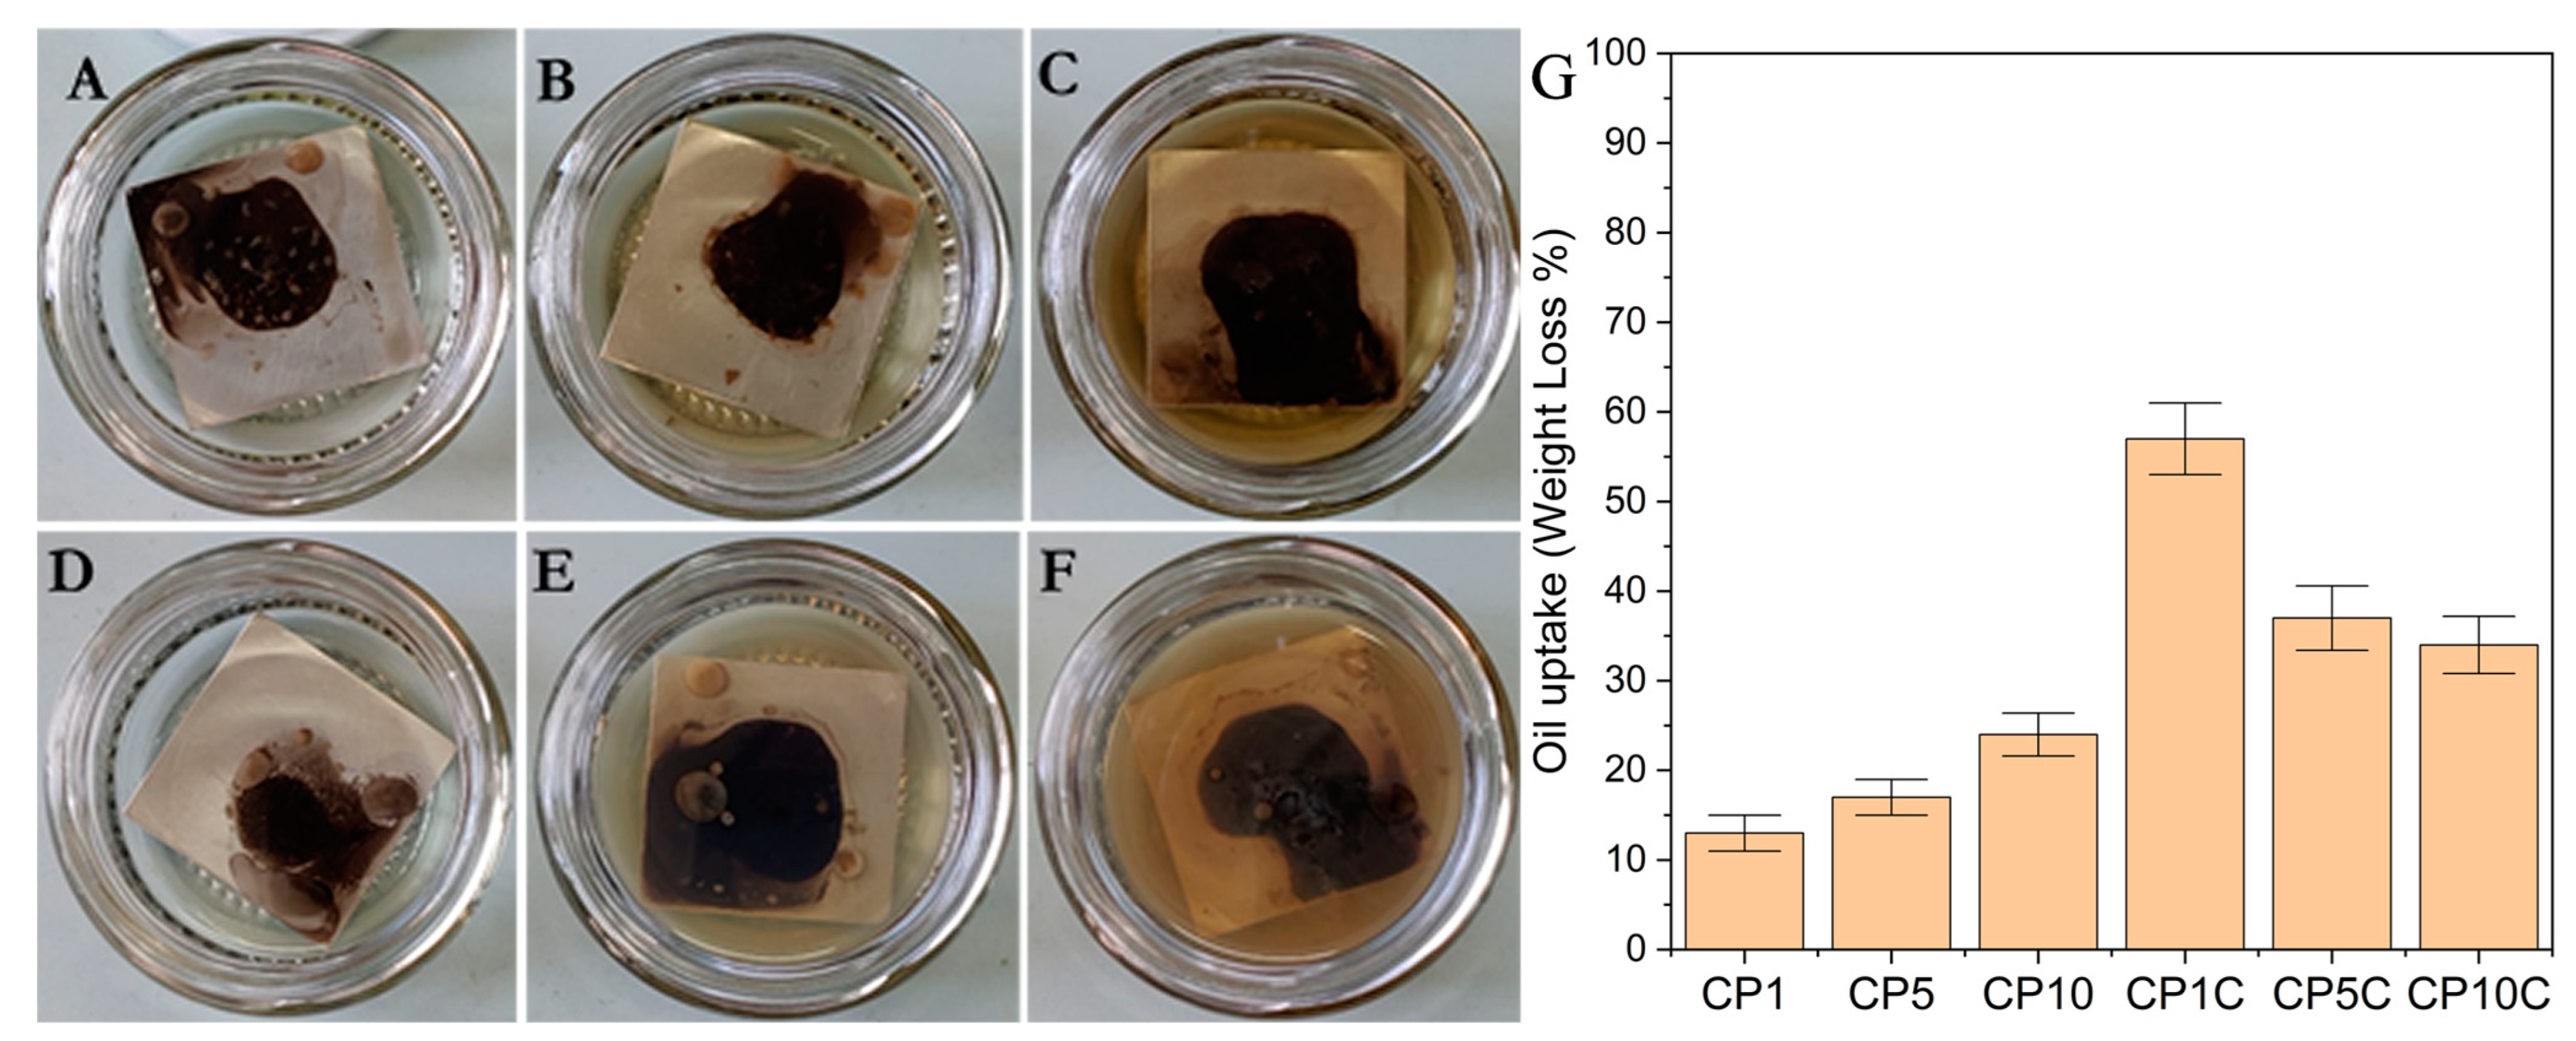
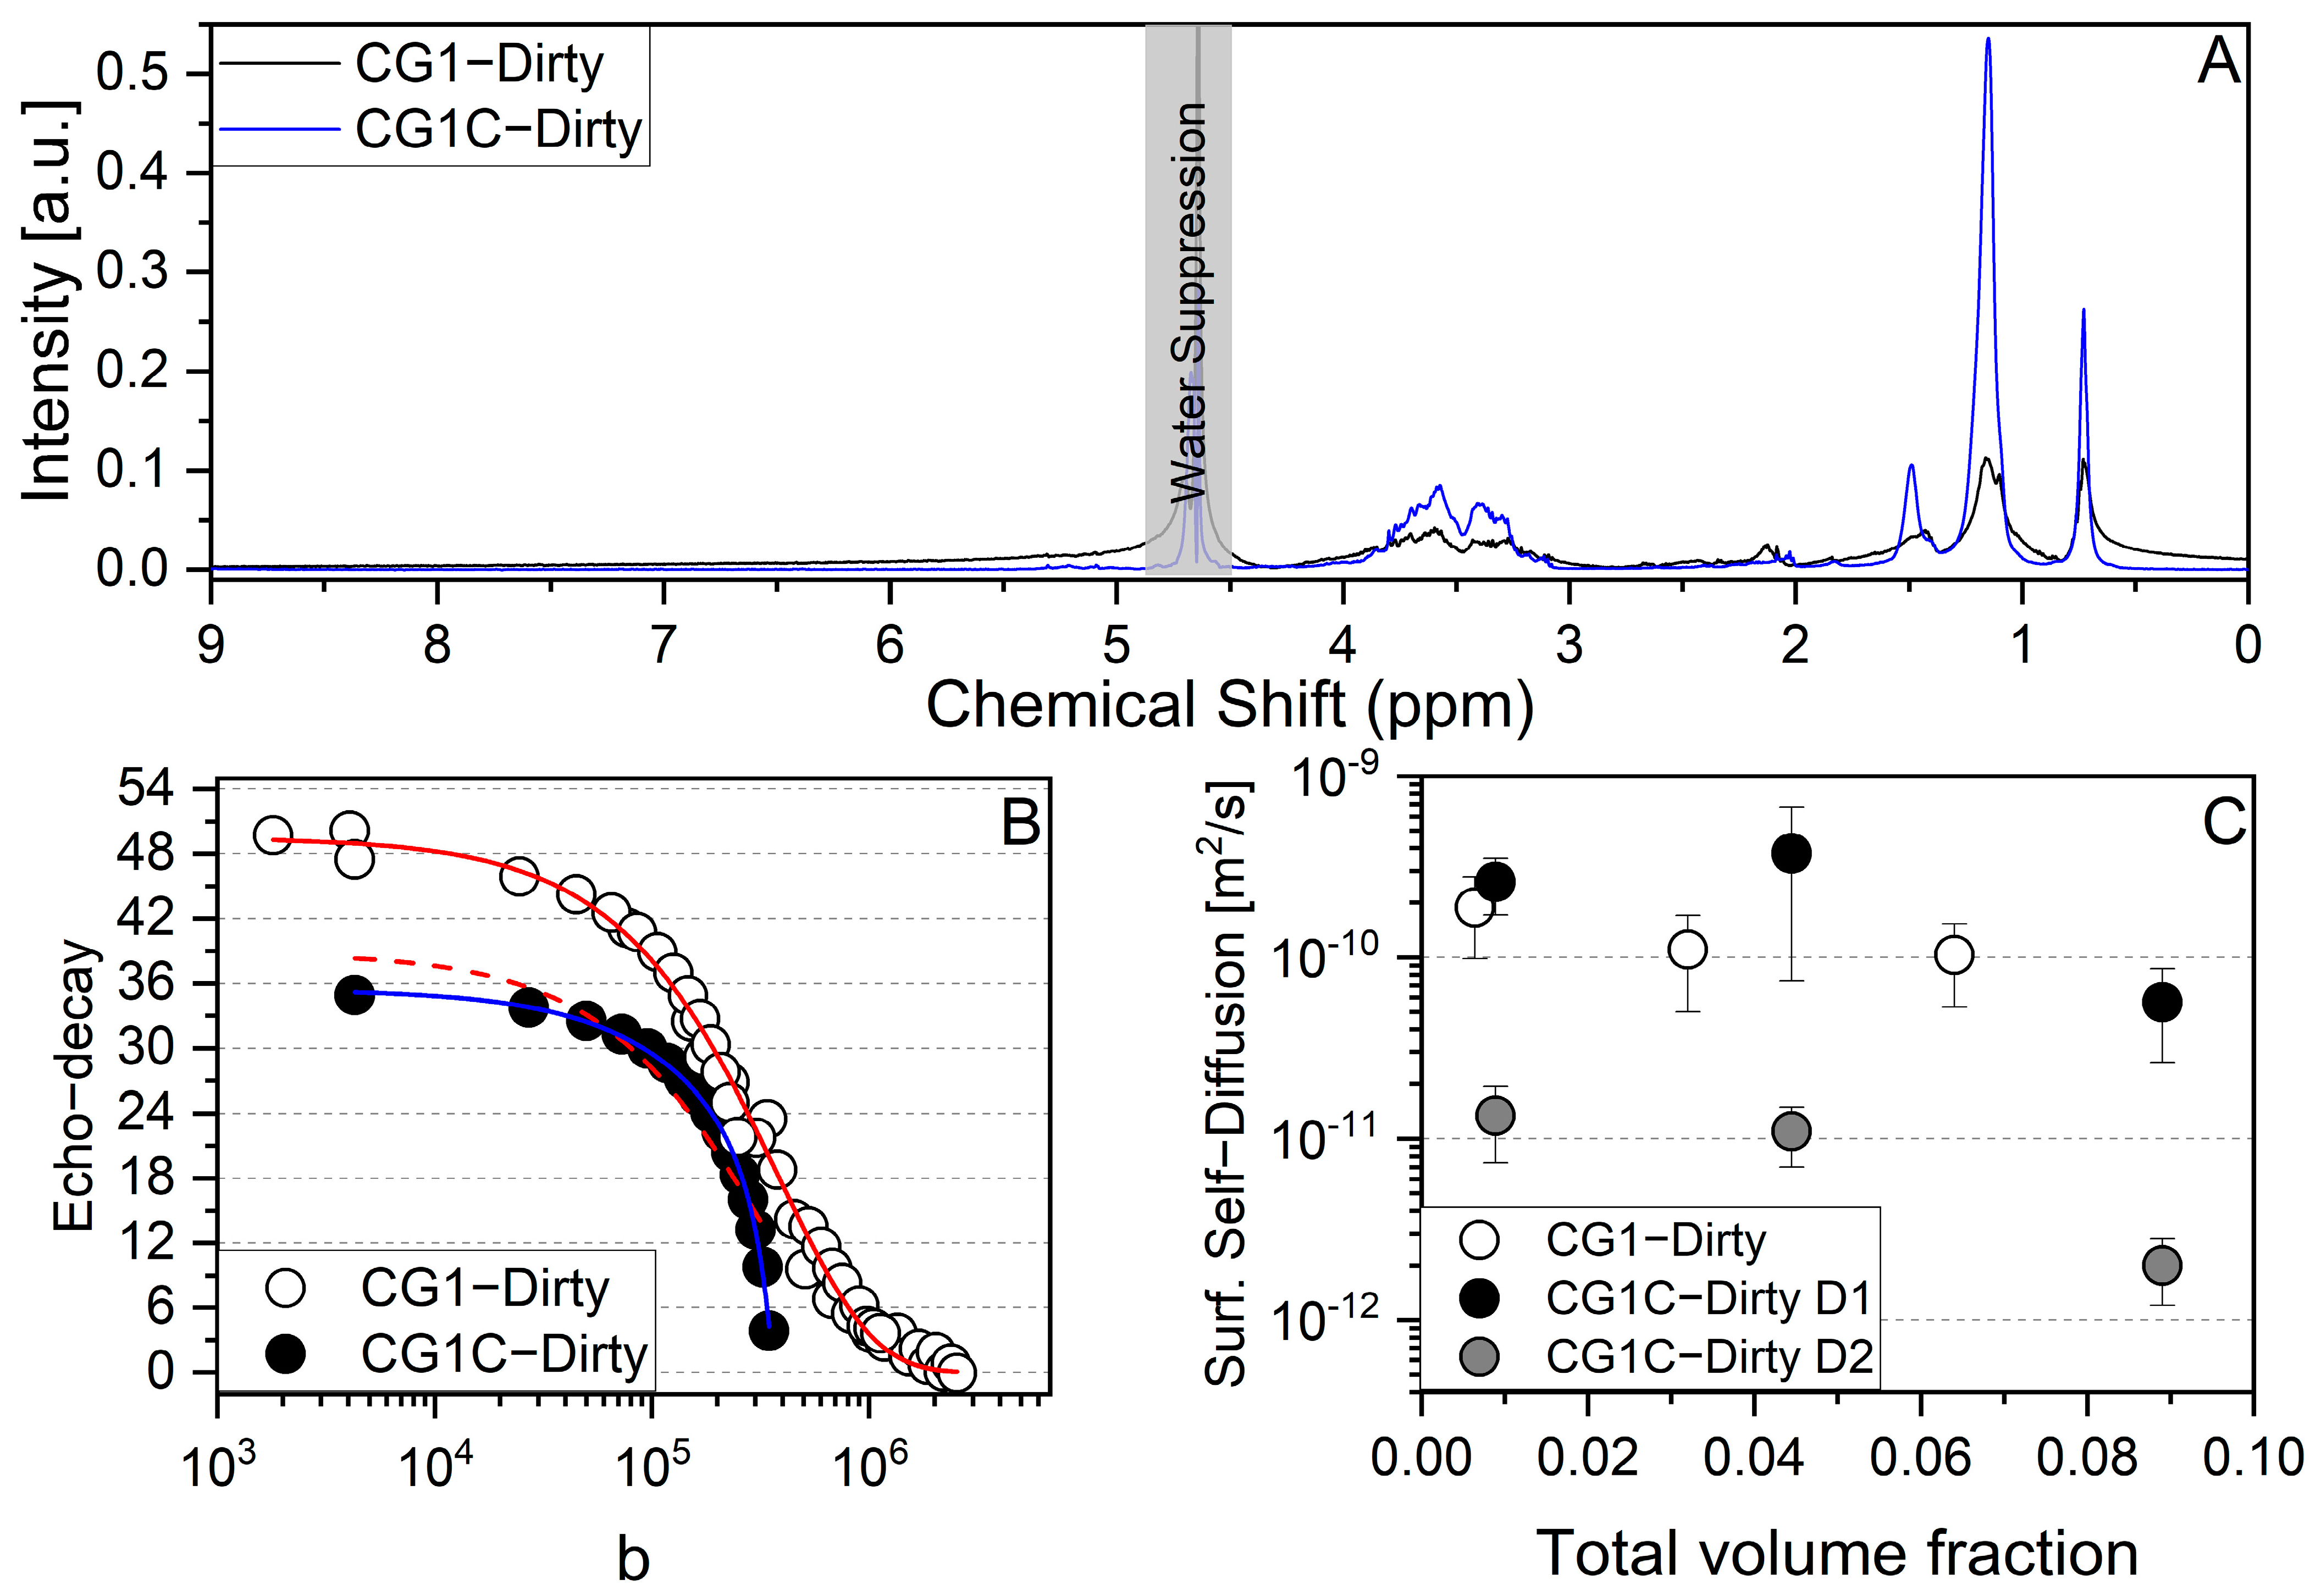
3.3. Cleaning Efficiency and Oil-Uptake

The samples, both with and without C12OH, were tested for cleaning efficiency. Contaminated stainless steel tiles were immersed in the respective systems and placed in Petri dishes for 18 h, as shown in Figure 3A–F. The cleaning efficiency, indicated by weight loss or oil uptake, is reported in Figure 3G. The oil uptake was estimated using the following formula:
W e i g h t   l o s s   % = 100 · ( W i n W f ) ( W i n W p )  
where W f represents the final weight of the contaminated stainless-steel tiles after 18 h of treatment with the testing sample, W i n is the initial weight of the contaminated stainless-steel tiles, and W p represents the weight of the clean stainless-steel tiles.
Even when increasing the surfactant concentration without C12OH, the results indicate a lower cleaning efficiency (see Figure S2).
The system containing 1 v/v% of C8–10Gm and 0.25 v/v% of C12OH (CG1C) demonstrated the highest cleaning efficiency, approximately 57%, surpassing commercial systems and newly developed formulations [78]. A further increase in surfactant concentrations leads to a decrease in efficiency because of the formation of a viscoelastic matrix. The CG1 without alcohol contains micelles with relatively low cleaning efficiency. Increasing the surfactant concentration increases cleaning efficiency as well but with less effectiveness compared with the systems containing C12OH.
Samples were collected to measure the self-diffusion coefficients at the end of the cleaning experiments (Figure 4). The line shape of the 1H NMR spectra was affected by the presence of contaminants (Figure 4A). Particularly in systems containing C12OH, the self-diffusion coefficients were significantly affected. For samples without C12OH, after collecting contaminants, monoexponential echo decays were observed, enabling the direct application of Equation (3). However, in samples with C12OH, a double-exponential decay (blue line) had to be applied since the monoexponential decay (red dotted line) did not fit the data properly (Figure 4B).
The self-diffusion coefficients decreased with increasing total volume fraction. Specifically, the two self-diffusion coefficients for samples containing C12OH are indicated as black- and gray-filled circles in Figure 4C.
To further evaluate the oil-uptake capacity of the investigated samples at 1 v/v% of C8–10Gm with and without C12OH, petroleum ether was gradually added to the respective samples (refer to Figure 5). The quantity of oil retained before reaching the Winsor III microemulsion phase is considered the maximum oil uptake, aligning with the optimized formulation concept introduced for enhanced oil recovery (EOR) [79]. It is well established that the optimal formulation corresponds to a minimum interfacial tension, described when the hydrophilic–lipophilic deviation (HLDN) equals zero [80,81,82], indicating the Winsor III phase [83]. In our case, Winsor III is achieved at a volume ratio of 2:0.300 for the CG1C sample (Figure 5H), but it is not observed for the corresponding sample without C12OH, CG1 (Figure 5D). However, the achieved Winsor III is referred to as “apparent” because the central phase does not form a bicontinuous structure, a behavior documented in other studies involving different systems [84]. Furthermore, after an extended period of 96 h, a Winsor II phase is observed (Figure 5I).

4. Discussion

The APG micellar phase has been extensively discussed in the literature. While micelles might be spherical and homogeneous in size at the CMC [85,86], they become larger and heterodisperse with increasing concentrations. Micelles have been demonstrated to be anisotropic in shape [87,88]. Using the 1H NMR self-diffusion coefficient of an APG surfactant with an eight-carbon alkyl chain and considering the contribution effects and the assumption that micelle size does not change with concentration, it has been demonstrated that cylindrical micelles, with a cylinder radius of 2.16 nm and an axial ratio of 0.45 nm, are more suitable.
The water self-diffusion obstruction factor of spherical micelles was estimated to be 1/(1 + (Φ/2)), where Φ is the volume fraction [89], implying that, for our volume fraction, 0.96 < f < 0.99, whereas the obstruction of cylinders is 1/(1 + Φ), implying that for our volume fraction is 0.92 < f < 0.99 for the samples without C12OH. In the concentration range investigated, we cannot distinguish between spherical or cylindrical micelles. On the other hand, it is clear that, from 1 to 10 v/v%, there is no increase in size (Figure 2C and Figure S1) or change in Newtonian behavior (Figure 1A,C).
The effect of C12OH on the micellar shape leads to an obstruction factor below the 0.92 value of the micelles with a cylindrical shape. This could be due to the formation of a worm-like micelle network, but the frequency sweep is far from being Maxwellian-like, suggesting a more intricate structure. The frequency sweep is not typical of a lamellar phase either [90,91,92] and is not birefringent. Further investigation is needed to characterize the obtained viscoelastic system.
Employing surfactants is a recognized approach to efficiently eliminating surface pollutants at both micro- and nanoscale levels [93]. Furthermore, in the realm of enhanced oil recovery (EOR), surfactants play a crucial role [12,13,14]. In both cases, a higher amount of oil is retained by the surfactant, leading to increased efficiency. The most effective oil uptake is usually achieved above the surface aggregation concentration when submonolayer, monolayer/hemimicelle, or bilayer/cylindrical micelle structures are formed at interfaces and surfaces [94].
The C8–10Gm in water always presents a micellar phase, which can be spherical or cylindrical, showing a relatively low capacity for entrapping the oil phase (contaminants). GC1 holds approximately 12% of the oil phase, while GC10 holds approximately 24% of the oil phase. The cleaning efficiency is relatively low compared with other systems [78]. Adding C12OH to the surfactants results in a much lower obstruction factor, indicating the presence of a more complex system that leads to pseudoplastic behavior, especially in the case of the CG10C sample. The pseudoplastic behavior is not desirable for a conventional formulation since it might interfere with the detergent’s ability to penetrate surfaces effectively. When C12OH is added to the system, the cleaning capacity, i.e., the oil uptake, increases considerably, particularly for CP1C, accounting for approximately 57% of the oil phase. An apparent Winsor III microemulsion phase was observed by adding petroleum ether to the samples containing C12OH, enabling the estimation of the optimum formulation point, which is at a ratio of 2:0.300 for CG1C, while no Winsor III was observed at any time in the absence of C12OH.
Fatty alcohols are oleochemicals characterized by hydrophobic acyl chains and hydroxyl groups, providing them with amphiphilic properties. As such, they are useful co-surfactants in formulations. We have demonstrated that their oleochemical nature enhances the oil-uptake capacity even in the case of an alkyl polyglycoside surfactant. As such, formulations including APGs and fatty alcohols can be adopted for detergency.

5. Conclusions

In conclusion, our study delved into the intricate behavior of the Triton® CG-110 micellar phase and the significant impact of C12OH addition. While all concentrations of Triton® CG-110 demonstrated Newtonian-like behavior, the introduction of C12OH led to a viscoelastic response in CG10C, signifying a more complex system. Through advanced NMR techniques, we investigated the self-diffusion coefficients, unveiling significant alterations influenced by the presence of C12OH. Spherical micellar structures, common in Triton® CG-110, transitioned into anisotropic shapes, particularly cylindrical micelles, as indicated by the obstruction factors. Moreover, our experiments highlighted the cleaning efficiency and oil-uptake capacity of the systems. Triton® CG-110 with C12OH demonstrated remarkable efficiency in oil uptake at more than 50%. The addition of petroleum ether to the samples containing C12OH led to the formation of apparent Winsor III microemulsion phases, offering insights into the optimal formulation ratios. Finally, we explored the role of fatty alcohols as co-surfactants, emphasizing, in our preliminary evaluation, their amphiphilic nature in enhancing oil-uptake capacities, even when combined with alkyl polyglycoside surfactants. Triton® CG-110 is still relatively expensive, but the low concentration and the use of fatty alcohols made the system cost-effective. Our findings provide valuable insights into the complex interplay of surfactant and co-surfactant systems, offering potential avenues for enhanced oil recovery strategies and efficient surface pollutant removal at both the micro- and nanoscale levels.

Supplementary Materials

The following supporting information can be downloaded at https://www.mdpi.com/2504-5377/8/1/6/s1: Figure S1: Correlation function (B) and volume-weighted distribution (A) of C8–10Pm and C8–10Pm + C12OH. Figure S2: Cleaning tests of stainless-steel plates for CG1P (A), CG5P (B), and CG10P (C) samples and cleaning efficiency indicated by weight loss or oil uptake (D). Table S1: Samples under investigation for Figure S2.

Author Contributions

Conceptualization, L.G.; methodology, L.V., G.C. and L.G.; software, L.V. and L.G.; validation, L.V. and G.C.; formal analysis, L.G.; investigation, L.V.; resources, L.G.; data curation, L.G.; writing—original draft preparation, L.G.; writing—review and editing, L.G.; visualization, L.V.; supervision, L.G.; project administration, L.G. and G.C.; funding acquisition, L.G. All authors have read and agreed to the published version of the manuscript.

Funding

This research was funded by Italian Ministry of University and Research (MUR) under the program Progetti di Rilevante Interesse Nazionale and by European Union—Next Generation EU (PRIN 2022 PNRR) grant number [P202229ME2].

Data Availability Statement

All data are available upon request from the authors.

Acknowledgments

Centre for Colloid and Surface Science (CSGI) is acknowledged.

Conflicts of Interest

The authors declare no conflicts of interest.

References

  1. Esposito, R.; Ingenito, L.; Cavasso, D.; Siciliano, A.; Alfieri, M.L.; Chiappisi, L.; Fragneto, G.; Ottaviani, M.F.; Guida, M.; Paduano, L.; et al. Rhamnolipid–SLES Aqueous Mixtures: From the Molecular Self-Aggregation to the Functional and Ecotoxicological Properties. J. Mol. Liq. 2022, 367, 120547. [Google Scholar] [CrossRef]
  2. Esposito, R.; Speciale, I.; De Castro, C.; D’Errico, G.; Russo Krauss, I. Rhamnolipid Self-Aggregation in Aqueous Media: A Long Journey toward the Definition of Structure–Property Relationships. Int. J. Mol. Sci. 2023, 24, 5395. [Google Scholar] [CrossRef] [PubMed]
  3. Baccile, N.; Seyrig, C.; Poirier, A.; Alonso-De Castro, S.; Roelants, S.L.K.W.; Abel, S. Self-Assembly, Interfacial Properties, Interactions with Macromolecules and Molecular Modelling and Simulation of Microbial Bio-Based Amphiphiles (Biosurfactants). A Tutorial Review. Green Chem. 2021, 23, 3842–3944. [Google Scholar] [CrossRef]
  4. Müller, M.M.; Kügler, J.H.; Henkel, M.; Gerlitzki, M.; Hörmann, B.; Pöhnlein, M.; Syldatk, C.; Hausmann, R. Rhamnolipids—Next Generation Surfactants? J. Biotechnol. 2012, 162, 366–380. [Google Scholar] [CrossRef]
  5. Otzen, D.E. Biosurfactants and Surfactants Interacting with Membranes and Proteins: Same but Different? Biochim. Biophys. Acta (BBA)-Biomembr. 2017, 1859, 639–649. [Google Scholar] [CrossRef]
  6. Sarubbo, L.A.; Maria da Gloria, C.S.; Durval, I.J.B.; Bezerra, K.G.O.; Ribeiro, B.G.; Silva, I.A.; Twigg, M.S.; Banat, I.M. Biosurfactants: Production, Properties, Applications, Trends, and General Perspectives. Biochem. Eng. J. 2022, 181, 108377. [Google Scholar] [CrossRef]
  7. Scheibel, J.J. The Evolution of Anionic Surfactant Technology to Meet the Requirements of the Laundry Detergent Industry. J. Surfactants Deterg. 2004, 7, 319–328. [Google Scholar] [CrossRef]
  8. Cornwell, P.A. A Review of Shampoo Surfactant Technology: Consumer Benefits, Raw Materials and Recent Developments. Int. J. Cosmet. Sci. 2018, 40, 16–30. [Google Scholar] [CrossRef]
  9. Rosen, M.; Kunjappu, J. Surfactants and Interfacial Phenomena; John Wiley & Sons: Hoboken, NJ, USA, 2012; ISBN 9786468600. [Google Scholar] [CrossRef]
  10. Tadros, T. Polymeric Surfactants: Dispersion Stability and Industrial Applications; Walter de Gruyter GmbH & Co KG: Berlin, Germany, 2017. [Google Scholar] [CrossRef]
  11. Pradip; Rai, B. Design of Tailor-Made Surfactants for Industrial Applications Using a Molecular Modelling Approach. Colloids Surf. A Physicochem. Eng. Asp. 2002, 205, 139–148. [Google Scholar] [CrossRef]
  12. Chowdhury, S.; Shrivastava, S.; Kakati, A.; Sangwai, J.S. Comprehensive Review on the Role of Surfactants in the Chemical Enhanced Oil Recovery Process. Ind. Eng. Chem. Res. 2022, 61, 21–64. [Google Scholar] [CrossRef]
  13. Marques, L.; Dias Rodrigues, P.; Simonelli, G.; de Jesus Assis, D.; Quintella, C.M.; de Carvalho Lima Lobato, A.K.; Maria Cordeiro de Oliveira, O.; Santos, L.C.L. Optimization of Enhanced Oil Recovery Using ASP Solution. Heliyon 2023, 9, e21797. [Google Scholar] [CrossRef]
  14. Salager, J.-L.; Marquez, R. Enhanced Oil Recovery by Surfactant Injection Was Improved during the Last 50 Years Thanks to the Multivariable HLD Formulation Equation. Pet. Petrochem. Eng. J. 2023, 7, 1–25. [Google Scholar] [CrossRef]
  15. Kumar, N.; Tyagi, R. Industrial Applications of Dimeric Surfactants: A Review. J. Dispers. Sci. Technol. 2014, 35, 205–214. [Google Scholar] [CrossRef]
  16. Rasheed, T.; Shafi, S.; Bilal, M.; Hussain, T.; Sher, F.; Rizwan, K. Surfactants-Based Remediation as an Effective Approach for Removal of Environmental Pollutants—A Review. J. Mol. Liq. 2020, 318, 113960. [Google Scholar] [CrossRef]
  17. Kralova, I.; Sjöblom, J. Surfactants Used in Food Industry: A Review. J. Dispers. Sci. Technol. 2009, 30, 1363–1383. [Google Scholar] [CrossRef]
  18. Moldes, A.B.; Rodríguez-López, L.; Rincón-Fontán, M.; López-Prieto, A.; Vecino, X.; Cruz, J.M. Synthetic and Bio-Derived Surfactants versus Microbial Biosurfactants in the Cosmetic Industry: An Overview. Int. J. Mol. Sci. 2021, 22, 2371. [Google Scholar] [CrossRef]
  19. Salager, J.L.; Antón, R.; Bullón, J.; Forgiarini, A.; Marquez, R. How to Use the Normalized Hydrophilic-Lipophilic Deviation (HLDN) Concept for the Formulation of Equilibrated and Emulsified Surfactant-Oil-Water Systems for Cosmetics and Pharmaceutical Products. Cosmetics 2020, 7, 57. [Google Scholar] [CrossRef]
  20. Chen, S.; Hanning, S.; Falconer, J.; Locke, M.; Wen, J. Recent Advances in Non-Ionic Surfactant Vesicles (Niosomes): Fabrication, Characterization, Pharmaceutical and Cosmetic Applications. Eur. J. Pharm. Biopharm. 2019, 144, 18–39. [Google Scholar] [CrossRef]
  21. Fait, M.E.; Bakas, L.; Garrote, G.L.; Morcelle, S.R.; Saparrat, M.C.N. Cationic Surfactants as Antifungal Agents. Appl. Microbiol. Biotechnol. 2018, 103, 97–112. [Google Scholar] [CrossRef] [PubMed]
  22. Colomer, A.; Pinazo, A.; Manresa, M.A.; Vinardell, M.P.; Mitjans, M.; Infante, M.R.; Pérez, L. Cationic Surfactants Derived from Lysine: Effects of Their Structure and Charge Type on Antimicrobial and Hemolytic Activities. J. Med. Chem. 2011, 54, 989–1002. [Google Scholar] [CrossRef] [PubMed]
  23. Dabkowska, A.P.; Hirst, C.; Valldeperas, M.; Clifton, L.A.; Montis, C.; Nöjd, S.; Gentile, L.; Wang, M.; Pálsson, G.K.; Lages, S.; et al. Temperature Responsive Lipid Liquid Crystal Layers with Embedded Nanogels. Chem. Commun. 2017, 53, 1417–1420. [Google Scholar] [CrossRef] [PubMed]
  24. Antunes, F.E.; Gentile, L.; Oliviero Rossi, C.; Tavano, L.; Ranieri, G.A. Gels of Pluronic F127 and Nonionic Surfactants from Rheological Characterization to Controlled Drug Permeation. Colloids Surf. B Biointerfaces 2011, 87, 42–48. [Google Scholar] [CrossRef] [PubMed]
  25. Jimoh, A.A.; Lin, J. Biosurfactant: A New Frontier for Greener Technology and Environmental Sustainability. Ecotoxicol. Environ. Saf. 2019, 184, 109607. [Google Scholar] [CrossRef] [PubMed]
  26. Foley, P.; Kermanshahi Pour, A.; Beach, E.S.; Zimmerman, J.B. Derivation and Synthesis of Renewable Surfactants. Chem. Soc. Rev. 2012, 41, 1499–1518. [Google Scholar] [CrossRef] [PubMed]
  27. Rebello, S.; Anoopkumar, A.N.; Sindhu, R.; Binod, P.; Pandey, A.; Aneesh, E.M. Comparative Life-Cycle Analysis of Synthetic Detergents and Biosurfactants—An Overview. In Refining Biomass Residues for Sustainable Energy and Bioproducts: Technology, Advances, Life Cycle Assessment, and Economics; Elsevier: London, UK, 2020; pp. 511–521. [Google Scholar] [CrossRef]
  28. Pardhi, D.S.; Panchal, R.R.; Raval, V.H.; Joshi, R.G.; Poczai, P.; Almalki, W.H.; Rajput, K.N. Microbial Surfactants: A Journey from Fundamentals to Recent Advances. Front. Microbiol. 2022, 13, 982603. [Google Scholar] [CrossRef]
  29. De, S.; Malik, S.; Ghosh, A.; Saha, R.; Saha, B. A Review on Natural Surfactants. RSC Adv. 2015, 5, 65757–65767. [Google Scholar] [CrossRef]
  30. Rodrigues, L.R. Microbial Surfactants: Fundamentals and Applicability in the Formulation of Nano-Sized Drug Delivery Vectors. J. Colloid Interface Sci. 2015, 449, 304–316. [Google Scholar] [CrossRef]
  31. Rosenberg, E.; Ron, E.Z. High- and Low-Molecular-Mass Microbial Surfactants. Appl. Microbiol. Biotechnol. 1999, 52, 154–162. [Google Scholar] [CrossRef]
  32. Johnson, P.; Trybala, A.; Starov, V.; Pinfield, V.J. Effect of Synthetic Surfactants on the Environment and the Potential for Substitution by Biosurfactants. Adv. Colloid Interface Sci. 2021, 288, 102340. [Google Scholar] [CrossRef]
  33. Drakontis, C.E.; Amin, S. Biosurfactants: Formulations, Properties, and Applications. Curr. Opin. Colloid Interface Sci. 2020, 48, 77–90. [Google Scholar] [CrossRef]
  34. Jahan, R.; Bodratti, A.M.; Tsianou, M.; Alexandridis, P. Biosurfactants, Natural Alternatives to Synthetic Surfactants: Physicochemical Properties and Applications. Adv. Colloid Interface Sci. 2020, 275, 102061. [Google Scholar] [CrossRef] [PubMed]
  35. Bognolo, G. Biosurfactants as Emulsifying Agents for Hydrocarbons. Colloids Surf. A Physicochem. Eng. Asp. 1999, 152, 41–52. [Google Scholar] [CrossRef]
  36. Sałek, K.; Euston, S.R. Sustainable Microbial Biosurfactants and Bioemulsifiers for Commercial Exploitation. Process Biochem. 2019, 85, 143–155. [Google Scholar] [CrossRef]
  37. Kashif, A.; Rehman, R.; Fuwad, A.; Shahid, M.K.; Dayarathne, H.N.P.; Jamal, A.; Aftab, M.N.; Mainali, B.; Choi, Y. Current Advances in the Classification, Production, Properties and Applications of Microbial Biosurfactants—A Critical Review. Adv. Colloid Interface Sci. 2022, 306, 102718. [Google Scholar] [CrossRef] [PubMed]
  38. Liu, K.; Sun, Y.; Cao, M.; Wang, J.; Lu, J.R.; Xu, H. Rational Design, Properties, and Applications of Biosurfactants: A Short Review of Recent Advances. Curr. Opin. Colloid Interface Sci. 2020, 45, 57–67. [Google Scholar] [CrossRef]
  39. Biosurfactants Market Share, Size & Trends Report, 2023–2032. Available online: https://www.gminsights.com/industry-analysis/biosurfactants-market-report (accessed on 24 August 2023).
  40. Hill, K. Fats and Oils as Oleochemical Raw Materials. J. Oleo Sci. 2001, 50, 433–444. [Google Scholar] [CrossRef]
  41. Von Rybinski, W. Natural Surfactants. Curr. Opin. Colloid Interface Sci. 2001, 6, 146–147. [Google Scholar] [CrossRef]
  42. Holmberg, K. Novel Surfactants; CRC Press: Boca Raton, FL, USA, 2003. [Google Scholar] [CrossRef]
  43. Kjellin, M.; Johansson, I. Surfactants from Renewable Resources; John Wiley & Sons: Hoboken, NJ, USA, 2010. [Google Scholar] [CrossRef]
  44. Ruiz, C.C. Sugar-Based Surfactants Fundamentals and Applications; CRC Press: Boca Raton, FL, USA, 2008; Volume 143, pp. 21–40. [Google Scholar] [CrossRef]
  45. Ortiz, M.S.; Alvarado, J.G.; Zambrano, F.; Marquez, R. Surfactants Produced from Carbohydrate Derivatives: A Review of the Biobased Building Blocks Used in Their Synthesis. J. Surfactants Deterg. 2022, 25, 147–183. [Google Scholar] [CrossRef]
  46. Gaciarz, A.; Khatri, N.K.; Velez-Suberbie, M.L.; Saaranen, M.J.; Uchida, Y.; Keshavarz-Moore, E.; Ruddock, L.W. Efficient Soluble Expression of Disulfide Bonded Proteins in the Cytoplasm of Escherichia Coli in Fed-Batch Fermentations on Chemically Defined Minimal Media. Microb. Cell Factories 2017, 16, 1–12. [Google Scholar] [CrossRef]
  47. Lang, S.; Wullbrandt, D. Rhamnose Lipids—Biosynthesis, Microbial Production and Application Potential. Appl. Microbiol. Biotechnol. 1999, 51, 22–32. [Google Scholar] [CrossRef]
  48. Lotfabad, T.B.; Ebadipour, N.; Roostaazad, R. Evaluation of a Recycling Bioreactor for Biosurfactant Production by Pseudomonas Aeruginosa MR01 Using Soybean Oil Waste. J. Chem. Technol. Biotechnol. 2016, 91, 1368–1377. [Google Scholar] [CrossRef]
  49. Balzer, D.; Lüders, H. Nonionic Surfactants: Alkyl Polyglucosides; CRC Press: Boca Raton, FL, USA, 2001; Volume 123, ISBN 0471196584. [Google Scholar]
  50. do Vale, T.O.; de Magalhães, R.S.; de Almeida, P.F.; Matos, J.B.T.L.; Chinalia, F.A. The Impact of Alkyl Polyglycoside Surfactant on Oil Yields and Its Potential Effect on the Biogenic Souring during Enhanced Oil Recovery (EOR). Fuel 2020, 280, 118512. [Google Scholar] [CrossRef]
  51. El-Sukkary, M.M.A.; Syed, N.A.; Aiad, I.; El-Azab, W.I.M. Synthesis and Characterization of Some Alkyl Polyglycosides Surfactants. J. Surfactants Deterg. 2008, 11, 129–137. [Google Scholar] [CrossRef]
  52. Iglauer, S.; Wu, Y.; Shuler, P.; Tang, Y.; Goddard, W.A. New Surfactant Classes for Enhanced Oil Recovery and Their Tertiary Oil Recovery Potential. J. Pet. Sci. Eng. 2010, 71, 23–29. [Google Scholar] [CrossRef]
  53. Iglauer, S.; Wu, Y.; Shuler, P.; Tang, Y.; Goddard, W.A. Alkyl Polyglycoside Surfactant–Alcohol Cosolvent Formulations for Improved Oil Recovery. Colloids Surf. A Physicochem. Eng. Asp. 2009, 339, 48–59. [Google Scholar] [CrossRef]
  54. Hou, B.; Zhang, F.; Wang, S.; Fan, H.; Wen, D.; Gao, S.; Tian, Y.; Yang, X.; He, H.; Zhang, X. Mechanisms of Spontaneous Imbibition and Wettability Reversal of Sandstone Cores by a Novel Imbibition Agent. Energy Fuels 2022, 36, 1316–1325. [Google Scholar] [CrossRef]
  55. Li, G.; Chen, L.; Ruan, Y.; Guo, Q.; Liao, X.; Zhang, B. Alkyl Polyglycoside: A Green and Efficient Surfactant for Enhancing Heavy Oil Recovery at High-Temperature and High-Salinity Condition. J. Pet. Explor. Prod. Technol. 2019, 9, 2671–2680. [Google Scholar] [CrossRef]
  56. Li, Z.; Bai, B.; Xu, D.; Meng, Z.; Ma, T.; Gou, C.; Gao, K.; Sun, R.; Wu, H.; Hou, J.; et al. Synergistic Collaboration between Regenerated Cellulose and Surfactant to Stabilize Oil/Water (O/W) Emulsions for Enhancing Oil Recovery. Energy Fuels 2019, 33, 81–88. [Google Scholar] [CrossRef]
  57. Nickel, D.; Nitsch, C.; Kurzendörfer, P.; von Rybinski, W. Interfacial Properties of Surfactant Mixtures with Alkyl Polyglycosides. In Trends in Colloid and Interface Science VI; part of the Progress in Colloid & Polymer Science book series; Springer Nature: Cham, Switzerland, 1992; Volume 89, pp. 249–252. [Google Scholar] [CrossRef]
  58. Von Rybinski, W.; Hill, K. Alkyl Polyglycosides—Properties and Applications of a New Class of Surfactants. Available online: https://onlinelibrary.wiley.com/doi/10.1002/%28SICI%291521-3773%2819980605%2937%3A10%3C1328%3A%3AAID-ANIE1328%3E3.0.CO%3B2-9 (accessed on 24 August 2023).
  59. Wei, P.; Pu, W.; Sun, L.; Zhou, W.; Ji, X. Foam Stabilized by Alkyl Polyglycoside and Isoamyl Alcohol for Enhancing Oil Recovery in the Low-Permeable Reservoir. J. Pet. Sci. Eng. 2018, 171, 1269–1278. [Google Scholar] [CrossRef]
  60. Yin, D.Y.; Zhang, X.R. Evaluation and Research on Performance of a Blend Surfactant System of Alkyl Polyglycoside in Carbonate Reservoir. J. Pet. Sci. Eng. 2013, 111, 153–158. [Google Scholar] [CrossRef]
  61. Bartman, M.; Balicki, S.; Hołysz, L.; Wilk, K.A. Benefits of Using Nonionic Saccharide Surfactant-Based Detergents for Nanostructured Fluids as Stubborn Graffiti Paint Remover. J. Surfactants Deterg. 2023, 1–14. [Google Scholar] [CrossRef]
  62. Dina, S.N.; Shah, Z.A.M.H.; Raudhah, A.N.; Aisah, A.U. Potential of Binary Mixtures of Sodium Lauryl Sulfoacetate (SLSA) and Alkyl Polyglucoside (APG10) as Oil Degreaser. Tenside Surfactants Deterg. 2023, 60, 236–244. [Google Scholar] [CrossRef]
  63. Chen, C.; Xi, H.; Li, Z.; Zhang, H.; Lin, X.; Wang, Y. Removal of Uranium by APG/TAS Antifreeze Foam Detergent with High Foaming Property. Colloids Surf. A Physicochem. Eng. Asp. 2022, 650, 129589. [Google Scholar] [CrossRef]
  64. Wei, P.; Li, J.; Xie, Y.; Huang, X.; Sun, L. Alkyl Polyglucosides for Potential Application in Oil Recovery Process: Adsorption Behavior in Sandstones under High Temperature and Salinity. J. Pet. Sci. Eng. 2020, 189, 107057. [Google Scholar] [CrossRef]
  65. Belhaj, A.F.; Elraies, K.A.; Alnarabiji, M.S.; Abdul Kareem, F.A.; Shuhli, J.A.; Mahmood, S.M.; Belhaj, H. Experimental Investigation, Binary Modelling and Artificial Neural Network Prediction of Surfactant Adsorption for Enhanced Oil Recovery Application. Chem. Eng. J. 2021, 406, 127081. [Google Scholar] [CrossRef] [PubMed]
  66. Balzer, D. Alkylpolyglucoside—Physikochemische Eigenschaften und Anwendung/Alkylpolyglucosides, Their Physico-Chemical Properties and Their Uses. Tenside Surfactants Deterg. 1991, 28, 419–427. [Google Scholar] [CrossRef]
  67. Kahlweit, M.; Busse, G.; Faulhaber, B. Preparing Microemulsions with Alkyl Monoglucosides and the Role of N-Alkanols. Langmuir 1995, 11, 3382–3387. [Google Scholar] [CrossRef]
  68. Kutschmann, E.M.; Findenegg, G.H.; Nickel, D.; von Rybinski, W. Interfacial Tension of Alkylglucosides in Different APG/Oil/Water Systems. Colloid Polym. Sci. 1995, 273, 565–571. [Google Scholar] [CrossRef]
  69. Dari, C.; Si, Y.; Douliez, J.-P.; Tahon, J.-F.; Benezech, T.; Clegg, P.S.; Fameau, A.-L. Mixture of Fatty Alcohols and Alkyl Polyglucosides Stabilizing Water-in-Water Emulsions. Front. Soft Matter 2023, 3, 1328195. [Google Scholar] [CrossRef]
  70. Wang, L.; Sun, N.; Wang, Z.; Han, H.; Yang, Y.; Liu, R.; Hu, Y.; Tang, H.; Sun, W. Self-Assembly of Mixed Dodecylamine–Dodecanol Molecules at the Air/Water Interface Based on Large-Scale Molecular Dynamics. J. Mol. Liq. 2019, 276, 867–874. [Google Scholar] [CrossRef]
  71. Colafemmina, G.; Palazzo, G.; Mateos, H.; Amin, S.; Fameau, A.L.; Olsson, U.; Gentile, L. The Cooling Process Effect on the Bilayer Phase State of the CTAC/Cetearyl Alcohol/Water Surfactant Gel. Colloids Surf. A Physicochem. Eng. Asp. 2020, 597, 124821. [Google Scholar] [CrossRef]
  72. TRITONTM CG-110 Surfactant. Available online: https://www.dow.com/en-us/pdp.triton-cg-110-surfactant.85698z.html#properties (accessed on 19 August 2023).
  73. Vo, T.V.; Chou, Y.Y.; Chen, B.H. Preparation of Microemulsion from an Alkyl Polyglycoside Surfactant and Tea Tree Oil. Molecules 2021, 26, 1971. [Google Scholar] [CrossRef] [PubMed]
  74. Gentile, L.; Amin, S. Rheology Primer for Nanoparticle Scientists. In Colloidal Foundations of Nanoscience; Elsevier: Amsterdam, The Netherlands, 2022; pp. 289–306. [Google Scholar] [CrossRef]
  75. Pelta, M.D.; Barjat, H.; Morris, G.A.; Davis, A.L.; Hammond, S.J. Pulse Sequences for High-Resolution Diffusion-Ordered Spectroscopy (HR-DOSY). Magn. Reson. Chem. 1998, 36, 706–714. [Google Scholar] [CrossRef]
  76. Stejskal, E.O.; Tanner, J.E. Spin Diffusion Measurements: Spin Echoes in the Presence of a Time Dependent Field Gradient. J. Chem. Phys 1965, 42, 288. [Google Scholar] [CrossRef]
  77. Chidichimo, G.; De Fazio, D.; Ranieri, G.A.; Terenzi, M. Self-Diffusion of Water in a Lamellar Lyotropic Liquid Crystal: A Study by Pulsed Field Gradient NMR. Chem. Phys. Lett. 1985, 117, 514–517. [Google Scholar] [CrossRef]
  78. Veronico, L.; Gentile, L. Removal of Pollutants by Ferrihydrite Nanoparticles Combined with Brij L4 Self-Assembled Nanostructures. ACS Appl. Nano Mater. 2023, 6, 720–728. [Google Scholar] [CrossRef]
  79. Cayias, J.L.; Schechter, R.S.; Wade, W.H. Measurement of Low Interfacial Tension via the Spinning Drop Technique; ACS Symposium Series; ACS Publications: Washington, DC, USA, 1974; pp. 234–247. [Google Scholar] [CrossRef]
  80. Forgiarini, A.M.; Marquez, R.; Salager, J.L. Formulation Improvements in the Applications of Surfactant–Oil–Water Systems Using the HLDN Approach with Extended Surfactant Structure. Molecules 2021, 26, 3771. [Google Scholar] [CrossRef] [PubMed]
  81. Marquez, R.; Meza, L.; Alvarado, J.G.; Bullón, J.; Langevin, D.; Forgiarini, A.M.; Salager, J.L. Interfacial Rheology Measured with a Spinning Drop Interfacial Rheometer: Particularities in More Realistic Surfactant–Oil–Water Systems Close to Optimum Formulation at HLDN = 0. J. Surfactants Deterg. 2021, 24, 587–601. [Google Scholar] [CrossRef]
  82. Salager, J.L.; Marquez, R.; Delgado-Linares, J.G.; Rondon, M.; Forgiarini, A. Fundamental Basis for Action of a Chemical Demulsifier Revisited after 30 Years: HLDN as the Primary Criterion for Water-in-Crude Oil Emulsion Breaking. Energy Fuels 2022, 36, 711–730. [Google Scholar] [CrossRef]
  83. Marquez, R.; Ontiveros, J.F.; Barrios, N.; Tolosa, L.; Palazzo, G.; Nardello-Rataj, V.; Salager, J.L. Advantages and Limitations of Different Methods to Determine the Optimum Formulation in Surfactant–Oil–Water Systems: A Review. J. Surfactants Deterg. 2023, 1–32. [Google Scholar] [CrossRef]
  84. Tartaro, G.; Gentile, L.; Palazzo, G. Characteristic Length and Curvature of the AOT/Brine/Squalane “Sponge” L3 Phases. JCIS Open 2023, 9, 100077. [Google Scholar] [CrossRef]
  85. La Mesa, C.; Bonincontro, A.; Sesta, B. Solution Properties of Octyl β-D Glucoside. Part 1: Aggregate Size. Shape and Hydration. Colloid Polym. Sci. 1993, 271, 1165–1171. [Google Scholar] [CrossRef]
  86. Roxby, R.W.; Mills, B.P. Micelle Size Distribution and Free Monomer Concentration in Aqueous Solutions of Octyl Glucoside. J. Phys. Chem. 1990, 94, 456–459. [Google Scholar] [CrossRef]
  87. Giordano, R.; Maisano, G.; Teixeira, J. SANS Studies of Octyl-β-Glucoside and Glycine Micellar Solutions. J. Appl. Crystallogr. 1997, 30, 761–764. [Google Scholar] [CrossRef]
  88. Kameyama, K.; Takagi, T. Micellar Properties of Octylglucoside in Aqueous Solutions. J. Colloid Interface Sci. 1990, 137, 1–10. [Google Scholar] [CrossRef]
  89. Jönsson, B.; Wennerström, H.; Nilsson, P.G.; Linse, P. Self-Diffusion of Small Molecules in Colloidal Systems. Colloid Polym. Sci. 1986, 264, 77–88. [Google Scholar] [CrossRef]
  90. Németh, Z.; Halász, L.; Pálinkás, J.; Bóta, A.; Horányi, T. Rheological Behaviour of a Lamellar Liquid Crystalline Surfactant–Water System. Colloids Surf. A Physicochem. Eng. Asp. 1998, 145, 107–119. [Google Scholar] [CrossRef]
  91. Gentile, L.; Silva, B.F.B.; Balog, S.; Mortensen, K.; Olsson, U. Structural Transitions Induced by Shear Flow and Temperature Variation in a Nonionic Surfactant/Water System. J. Colloid Interface Sci. 2012, 372, 32–39. [Google Scholar] [CrossRef]
  92. Gentile, L. Ferrihydrite Nanoparticles Entrapped in Shear-Induced Multilamellar Vesicles. J. Colloid Interface Sci. 2022, 606, 1890–1896. [Google Scholar] [CrossRef]
  93. Zhu, Y.; Free, M.L. Introduction to Surfactants. In Surfactants in Precision Cleaning; Elsevier: Amsterdam, The Netherlands, 2022; pp. 1–53. [Google Scholar] [CrossRef]
  94. Jain, N.; Trabelsi, S.; Guillot, S.; McLoughlin, D.; Langevin, D.; Letellier, P.; Turmine, M. Critical Aggregation Concentration in Mixed Solutions of Anionic Polyelectrolytes and Cationic Surfactants. Langmuir 2004, 20, 8496–8503. [Google Scholar] [CrossRef]
Figure 2. 1H NMR spectra of the 5 v/v% of C8–10Gm, CG5, and 5 v/v% of C8–10Pm + 1.25 v/v% of C12OH, CG10 (A). Water self-diffusion (B) and surfactant self-diffusion (C) coefficients extracted from the echo decays using the Stejskal and Tanner equation, Equation (3), for all investigated samples.
Colloids 08 00006 g002
Figure 3. Cleaning efficiency (oil-uptake) performance test made on contaminated stainless-steel tiles using the C8–10Gm surfactant concentrations, CG1 (A), CG5 (B), and CG10 (C), and the C8–10Gm surfactant + C12OH CG1C (D), CG5C (E), and CG10C (F). Finally, weight loss of contaminants from stainless-steel tiles (previously contaminated with HVS soil and oils) after 18 h of immersion in the respective solutions (G). The weight loss can be observed qualitatively as the amount of oil uptake.
Colloids 08 00006 g003
Figure 4. 1H NMR spectra of the 1 v/v% C8–10Gm, CG1-Dirty, and the 1 v/v% C8–10Gm + 0.25 v/v% C12OH, CG1C-Dirty, after the cleaning procedure, i.e., containing contaminants (A). Exponential echo decays of the surfactant resonance region (B). The red (solid and dotted) lines represent single-exponential decay (Equation (3)), while the blue line represents double-exponential decay. The surfactant self-diffusion coefficients extracted from the echo decays using the Stejskal and Tanner equation (Equation (3)) and the double-exponential decay of the CG1C-dirty samples lead to the two self-diffusion coefficients, D1 and D2 (C).
Colloids 08 00006 g004
Figure 5. A known amount of petroleum ether was added to both the 1 v/v% C8–10Gm sample, CG1 (AD), and the 1 v/v% C8–10Gm + 0.25 v/v% C12OH sample, CG1C (EI). The ratio is expressed as a volume ratio, where the first number denotes the sample volume, and the second number represents the volume of petroleum ether. For the 2:0.3 ratio of sample CG1, panel H displays the sample after 24 h of stabilization, while panel I shows it after 96 h.
Colloids 08 00006 g005
Table 1. Samples under investigation.
LabelC8–10Gm
(v/v% of the Initial Solution)
C8–10Gm
(v/v% of the Surfactant)
C12OH
(v/v%)
CG110.64-
CG553.2-
CG10106.4-
CG1C10.640.25
CG5C53.21.25
CG10C106.42.5
The standard uncertainties of 0.1 v/v% in the concentrations are estimated based on the precision of the micropipette. The v/v% concentration is obtained by considering the initial volume of aliquots of Triton® CG-110.
Disclaimer/Publisher’s Note: The statements, opinions and data contained in all publications are solely those of the individual author(s) and contributor(s) and not of MDPI and/or the editor(s). MDPI and/or the editor(s) disclaim responsibility for any injury to people or property resulting from any ideas, methods, instructions or products referred to in the content.

