Article

Wettability of Quartz by Ethanol, Rhamnolipid and Triton X-165 Aqueous Solutions with Regard to Its Surface Tension

by
Anna Zdziennicka
,
Katarzyna Szymczyk
and
Bronisław Jańczuk
*
Department of Interfacial Phenomena, Institute of Chemical Sciences, Faculty of Chemistry, Maria Curie-Skłodowska University in Lublin, Maria Curie-Skłodowska Sq. 3, 20-031 Lublin, Poland
*
Author to whom correspondence should be addressed.
Colloids Interfaces 2023, 7(4), 71; https://doi.org/10.3390/colloids7040071
Submission received: 5 October 2023 / Revised: 1 December 2023 / Accepted: 13 December 2023 / Published: 15 December 2023

Abstract

:
The wettability of quartz by different liquids and solutions plays a very important role in practical applications. Hence, the wetting behaviour of ethanol (ET), rhamnolipid (RL) and Triton X-165 (TX165) aqueous solutions with regard to the quartz surface tension was investigated. The investigations were based on the contact angle measurements of water (W), formamide (F) and diiodomethane (D) as well as ET, RL and TX165 solutions on the quartz surface. The obtained results of the contact angle for W, F and D were used for the determination of quartz surface tension as well as its components and parameters using different approaches, whereas the results obtained for the aqueous solution of ET, RL and TX165 were considered with regard to their adsorption at the quartz–air, quartz–solution and solution–air interfaces as well as the solution interactions across the quartz–solution interface. The considerations of the relations between the contact angle and adsorption of solution components at different interfaces were based on the components and parameters of the quartz surface tension. They allow us to, among other things, establish the mechanism of the adsorption of individual components of the solution at the interfaces and standard Gibbs surface free energy of this adsorption.

Graphical Abstract

1. Introduction

The wettability of quartz by various types of liquids and multi-component solutions plays an important role in many industries (for example, in petrochemistry, catalysis and carbon geostorage), medicine (for example, a as drug carrier) and mineral processing (for example, in flotation and flocculation processes as well as oil recovery) [1,2,3,4,5,6,7,8,9,10,11,12]. Quartz is a bipolar solid whose surface tension results from the Lifshitz-van der Waals (LW) and Lewis acid-base (AB) intermolecular interactions [13,14]. The wettability of quartz depends not only on the total surface tension but also on the ratio of LW to AB components. In turn, the LW and AB components of the quartz surface tension depend on the density of -SiO and -SiOH groups present on its surface. The variable density of these groups significantly influences the value of the contact angle of various liquids or solutions on the quartz surface. It is possible that due to the packing of the -SiO and -SiOH groups on the surface of the quartz, the water contact angle measured by various authors ranges from 0 to about 80 degrees [14,15,16,17,18].
The presence of -SiO and -SiOH groups on the quartz surface causes strong adsorption of water molecules, as a result of which a water layer can be formed, in which, even up to a thickness of 11–15 statistical monolayers, the properties of water molecules differ from those in the bulk phase [19,20,21,22]. Fowkes suggested that the structure of the water molecules in the surface layer changes with the distance from the quartz surface [19]. He also stated that the first two monolayers of the water possess the most ordered structure. This structure is compared to ice [21]. In turn, on the basis of theoretical considerations, Yang et al. [23] stated that on the quartz surface, the adsorbed film of water forms an ordered two-dimensional, quadrangular and octagonal H-bond network, in which the four water molecules are joined by a strong hydrogen bond and quadrangles are joined to each other by a weak H-bond. This strongly ordered water monolayer on the quartz surface changes its wettability considerably, and the contact angle is much higher than expected.
Different packing of the -SiO and -SiOH groups on the quartz surface and formation of a water film with a strictly ordered structure often make it difficult to interpret the influence of various types of water additives on the quartz wettability. This is particularly difficult in studies of the wetting properties of aqueous solutions of surfactants or biosurfactants as well as additives to these solutions such as ethanol. Recently, there has been a significant increase in interest in biosurfactants. This interest is due to the growing use of biosurfactants in practice [24,25]. Among the biosurfactants, anionic rhamnolipid (RL) occupies a very important position because of its large adsorption activity at the water-air interface and aggregation activity in the aqueous environment as well due to a number of biological activities [26,27,28,29,30,31,32,33,34,35]. Unfortunately, due to the high cost of RL, its practical use as a single compound is limited. Nevertheless, our recent research proved that there is a chance to use RL in practice as an additive to a classic synthetic surfactant such as Triton X-165 (TX165) [36], which is neutral, non-toxic and compatible with ionic surfactants [37].
To obtain better adsorption and wetting properties of surfactants or biosurfactants, short-chain alcohols are very often added. In order to predict the adsorption and wetting properties of mixtures of a classic surfactant with a biosurfactant in the presence of alcohol, it is necessary to get to know these properties for the individual components of a possible mixture.
Taking into account the above-mentioned facts, it seems interesting from both practical and theoretical points of view to investigate the wetting properties of quartz by the aqueous solutions of ethanol (ET), RL and TX165. Although studies have been carried out on the wettability of quartz by aqueous solutions of various surfactants [38,39], in the literature, it is difficult to find papers that present the analysis of the quartz wetting process based on the components and parameters of the quartz surface tension and their changes under the influence of adsorption of classical surfactants, biosurfactants and alcohols at different interfaces. In the study of quartz wettability, the relationship between its surface tension and wettability is important due to the diversity of quartz structures at the quartz-air interface. The knowledge of the surface tension of quartz and its components resulting from different types of intermolecular interactions can be helpful not only in explaining the process of surfactant adsorption at the quartz-solution interface but also in predicting the wettability of quartz by solutions of various types of surfactant mixtures based on the wetting properties of aqueous solutions of individual components in this mixture. Therefore, the aim of our paper was firstly to determine the quartz surface tension from the contact angle of such model liquids as water (W), formamide (F) and diiodomethane (D) using different approaches and next to establish the wettability of quartz by aqueous solutions of ET, RL and TX165 with regard to the quartz surface tension and its components and parameters. The relationship between the adsorption of ET, RL and TX165 at different interfaces as well as components and parameters of surface tension of quartz was considered thermodynamically based on the contact angle of ET, RL and TX165 aqueous solution.

2. Materials and Methods

2.1. Materials

For the contact angle measurements in the quartz-liquid (solution) drop-air system, quartz (Q), water (W), formamide (F), diiodomethane (D) and the solution, including water, ethanol (ET), rhamnolipid (RL) and Triton X-165 (TX165), were used. Doubly distilled and deionized (Destamat Bi18E) water used to measure the contact angle and to prepare solutions showed a resistance equal to 18.2 × 10⁶ Ω⋅m. The purity of formamide and diiodomethane (purchased from Sigma-Aldrich, St. Louis, MO, USA) used for contact angle measurements was higher than 99.5% and 99.0%, respectively, whereas, Triton X-165 ((p-(1,1,3,3-tetramethylbutyl)-phenoxypolyoxyethylene glycol) (purity greater than 99%) and R-95 Rhamnolipid (95%) used for solution preparation were purchased from Fluka and Sigma-Aldrich (St. Louis, MO, USA), respectively. The F, D, TX165 and RL were used for studies without further purification. However, 98% pure ethanol bought from POCH, Gliwice, Poland, was used for solution preparation after purification via the method described by Vogel [40].
Quartz plates for contact angle measurements were obtained from Conductance, Poland. These plates were cleaned with soapy water, washed in distilled water many times and placed in an ultrasonic bath for 20 min. This procedure was repeated twice for each plate. After washing, the plates were dried and placed in the desiccator with molecular sieves. More details were given earlier [17].
For contact angle measurements, the aqueous solution of ET in the whole range of its concentration was prepared. The concentration of RL in the aqueous solution was in a range from 0 to 40 mg/dm3, and TX165 concentration varied from 0 to 4 × 10⁻³ mole/dm3.

2.2. Methods

The advancing contact angles of water, formamide, diiodomethane as well as the aqueous solutions of ET, RL and TX165 on the quartz surface ( θ ) were measured at 293 K using the sessile drop method. The measurements of the contact angle were made, applying the DSA30 measuring system (Krüss, Hamburg, Germany). This system includes, among others, a thermostatic chamber. The apparatus chamber was saturated with vapour of a given liquid or solution for which the contact angle was measured, placing a cell filled with a given liquid or solution a few hours earlier. In the case of formamide and diiodomethane, the water vapour was first removed from the apparatus chamber using the molecular sieves and, next, the vessel filled with the measured liquid was introduced to the chamber for 24 h before the contact angle measurements. More details dealing with the advancing contact angle measurements are reported in the literature [41]. For all liquids and solutions, 20 drops of 7 μL were used for contact angle measurements on the quartz surface. The standard deviation of the contact angle values depended on type of liquid or solutions but, in any case, it did not exceed 2°.

3. Results and Discussion

3.1. Quartz Surface Tension

The wettability of the solids by different kinds of liquids or solutions, the measure of which is, among others, the contact angle (θ) on the solid surface, depends on the liquid or solution surface tension ( γ LV ), the solid surface tension ( γ SV ) and the solid-liquid (solution) interface tension ( γ SL ) as well as the type of forces contributing to this tension. In turn, γ SL is a function of γ LV and γ SV . The dependence between θ , γ LV , γ SV and γ SL can be expressed by the Young equation, having the form [42,43]:
γ SV γ SL = γ LV cos θ ,
Equation (1) shows that in order to determine the effect of the surface-active substances on the wettability of a solid, its surface tension should be known. In the case of quartz, it is difficult to use the literature data onits surface tension because, as mentioned above, many parameters affect this value. For this reason, the surface tension of quartz plates used to study the effect of ET, RL and TX165 wettability was determined. For the determination of γ SV and its Lifshitz-van der Waals (LW) and acid-base (AB) components as well as the electron-acceptor (+) and electron-donor (−) parameters of AB component, the contact angles of W ( θ W ), F ( θ F ) and D ( θ D ) on the quartz surface were measured. Water, formamide and diiodomethane are applied as model liquids for the surface tension determination of many solids [13].
The main problem in using Young’s equation (Equation (1)) to determine the surface tension of solids is the dependence of the solid-liquid interface tension on the surface tension of the solid and liquid. Most approaches dealing with this dependence are based on the equation proposed by Girifalco and Good [44], which has the form:
γ SL = γ SL = γ SV + γ LV 2 ϕ γ SV γ LV ,
where ϕ is the parameter of the interactions across the interface.
Neumann et al. [45,46,47] assumed that the ϕ parameter is a linear function of the solid-liquid interface tension and proposed the following equation for γ SV determination:
cos θ + 1 2 = γ SV γ LV exp β γ LV γ SV 2 ,
where β is a constant.
In contrast to Neumann et al. [45,46,47], Owens and Wendt [48] as well as van Oss et al. proved that the parameter ϕ depends on the kind of intermolecular interactions [13,49,50,51,52]. In consequence, Owens and Wendt obtained the following expression [48]:
γ LV cos θ + 1 = 2 γ LV d γ SV d + γ LV n γ SV n ,
where indices d and n refer to the dispersion and non-dispersion components of liquid and solid surface tension.
On the other hand, van Oss et al. [13,49,50,51,52] derived an equation, which has the following form:
γ LV cos θ + 1 = 2 γ LV LW γ SV LW + γ LV + γ SV + γ LV γ SV +   ,
In fact, the dispersion component in the Owens and Wendt approach differs from the LW component of the solid surface tension in the van Oss et al. equation only by the definition [53].
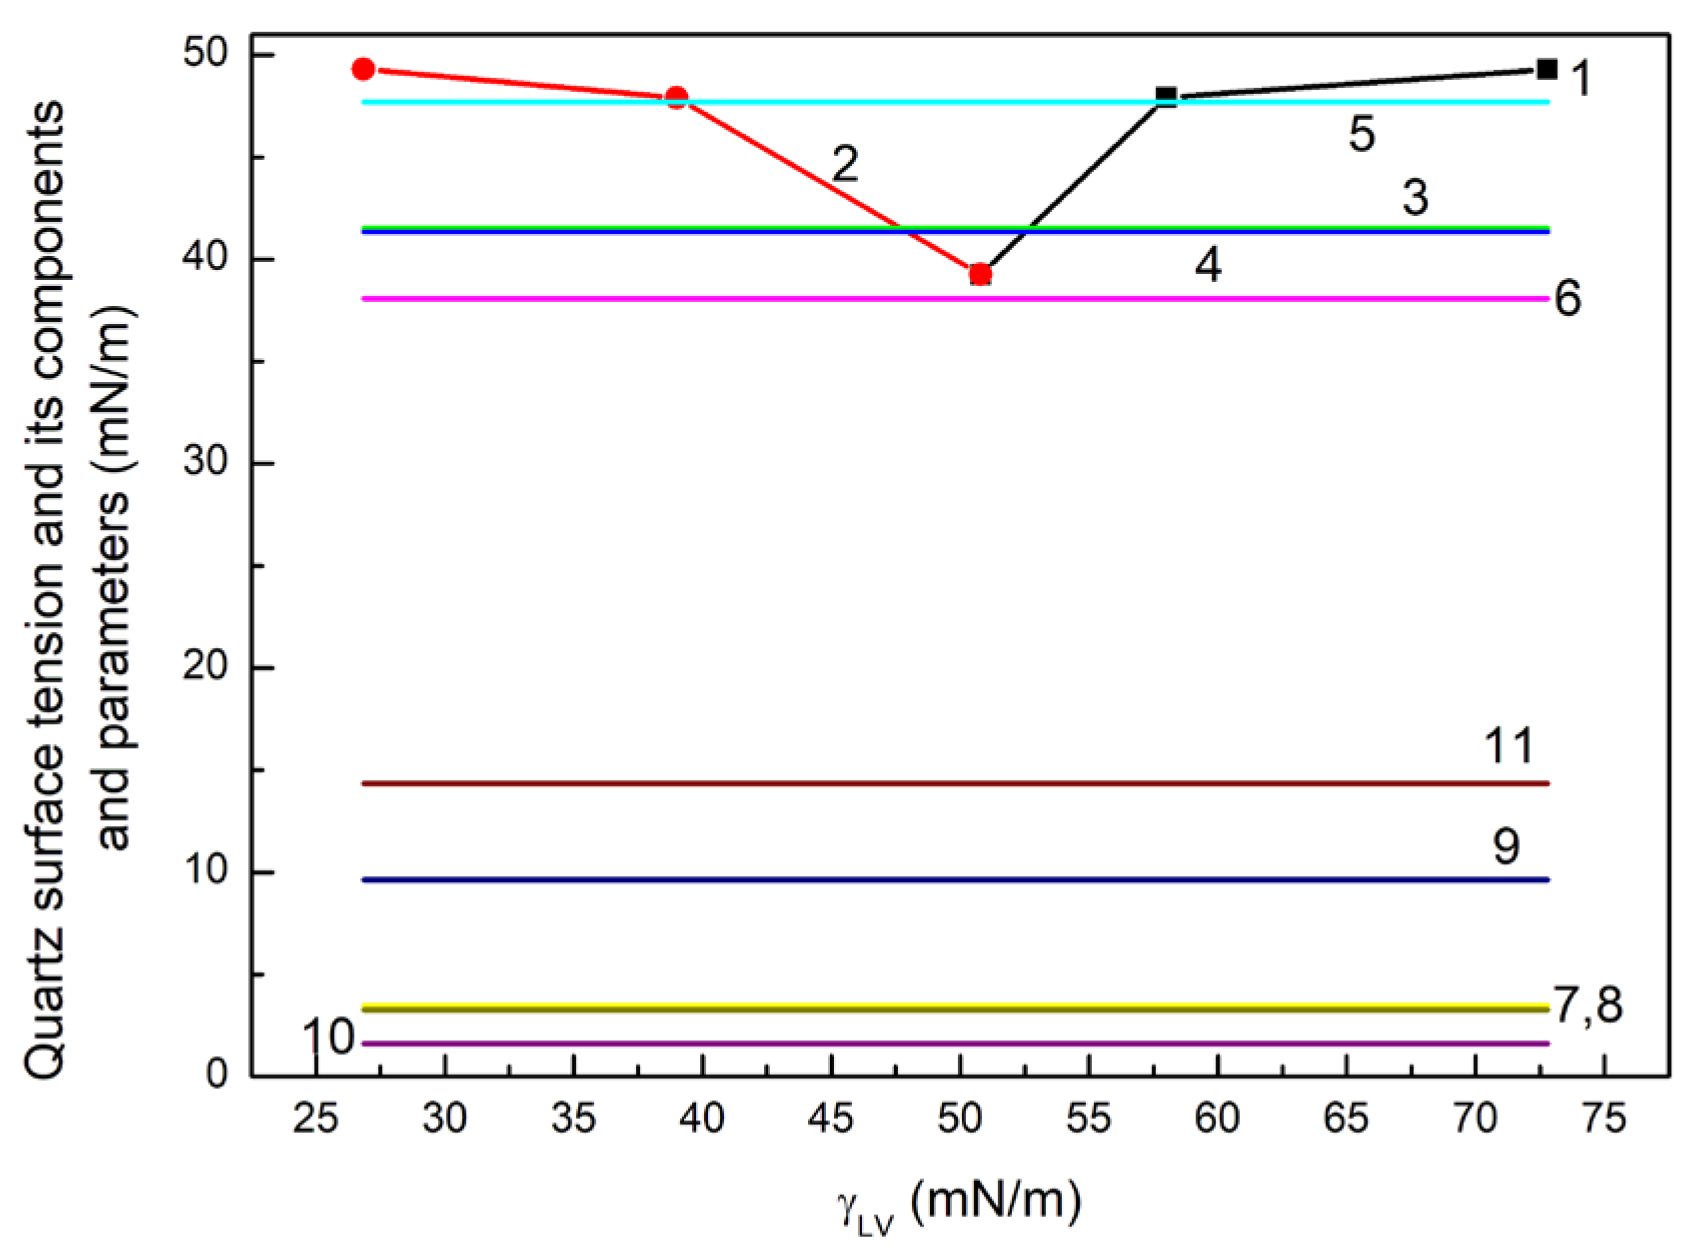
Equations (3)–(5) were used for quartz surface tension determination from θ W , θ F and θ D . It appeared that the γ SV values of quartz calculated from the Neumann et al. equation [45,46,47] increase with the increasing surface tension of liquids taken for calculations (Figure 1).
It should be mentioned that with the decreasing surface tension in the order W, F, D the LW component of this tension increases. In the case of diiodomethane, its surface tension results only from LW intermolecular interactions [13,53]. Thus, it follows for D from Equations (4) and (5) that:
γ LV cos θ + 1 = 2 γ LV d γ S V d = 2 γ LV LW γ SV LW ,
The values of γ SV d or γ SV LW calculated from Equation (6) based on θ D are close to those of γ SV determined from the Neumann equation (Equation (3)) (Figure 1). This fact suggests that not total surface tension of liquids used for the contact angle measurements on the quartz surface but its components resulting from different kinds of intermolecular interactions decide about the value of contact angle, which is also related rather to the components of quartz surface tension than to its total value. On the other hand, it is possible that the value of β in Equation (3) for quartz (Q) is not proper for all kinds of liquids or the properties of the water-specific layer on the quartz surface under a drop are different for each studied liquid. It is possible to obtain some information about the water layer properties from the calculations of the components and parameters of the quartz surface tension based on Equations (4) and (5) as well as from the ϕ   parameter calculated using the following expression:
cos θ + 1 2 γ SV γ LV = ϕ ,
For the calculation of components and parameters of the quartz surface tension from Equations (4) and (5), the values of γ LV d and γ LV n as well as γ LV LW ,     γ LV + ,     γ LV for water, formamide and diiodomethane, obtained only based on the contact angle of these liquids on the PTFE and PMMA surface, were used [41].
From the calculations based on Equation (4), it results that the quartz surface tension and dispersion and non-dispersion components obtained from θ W and θ D are comparable to those obtained from θ F and θ D (Figure 1). However, the γ SV values calculated from Equation (4) are lower than those calculated from Equation (5), which are close to the γ SV values determined from the Neumann et al. equation [45,46,47] (Figure 1). In turn, the ϕ values calculated from Equation (7) using γ SV ones obtained from Equation (5), which are higher than 1 for water and formamide, can suggest that the water layer on the Q surface is partially dissolved under the water and formamide drops. Nevertheless, it seems that the Q surface tension and its components and parameters calculated from the van Oss et al. [49,50,51,52] equation are the most appropriate to interpret the change in quartz wetting under the influence of ET, RL and TX165 and their mixture.

3.2. Wettability of Quartz by the Aqueous Solution of Ethanol, Rhamnolipid and Triton X-165

Some researchers suggest that in the case of liquids or aqueous solutions with a surface tension equal to that of a given solid, the contact angle is equal to zero [13,45,46,47,49,50,51,
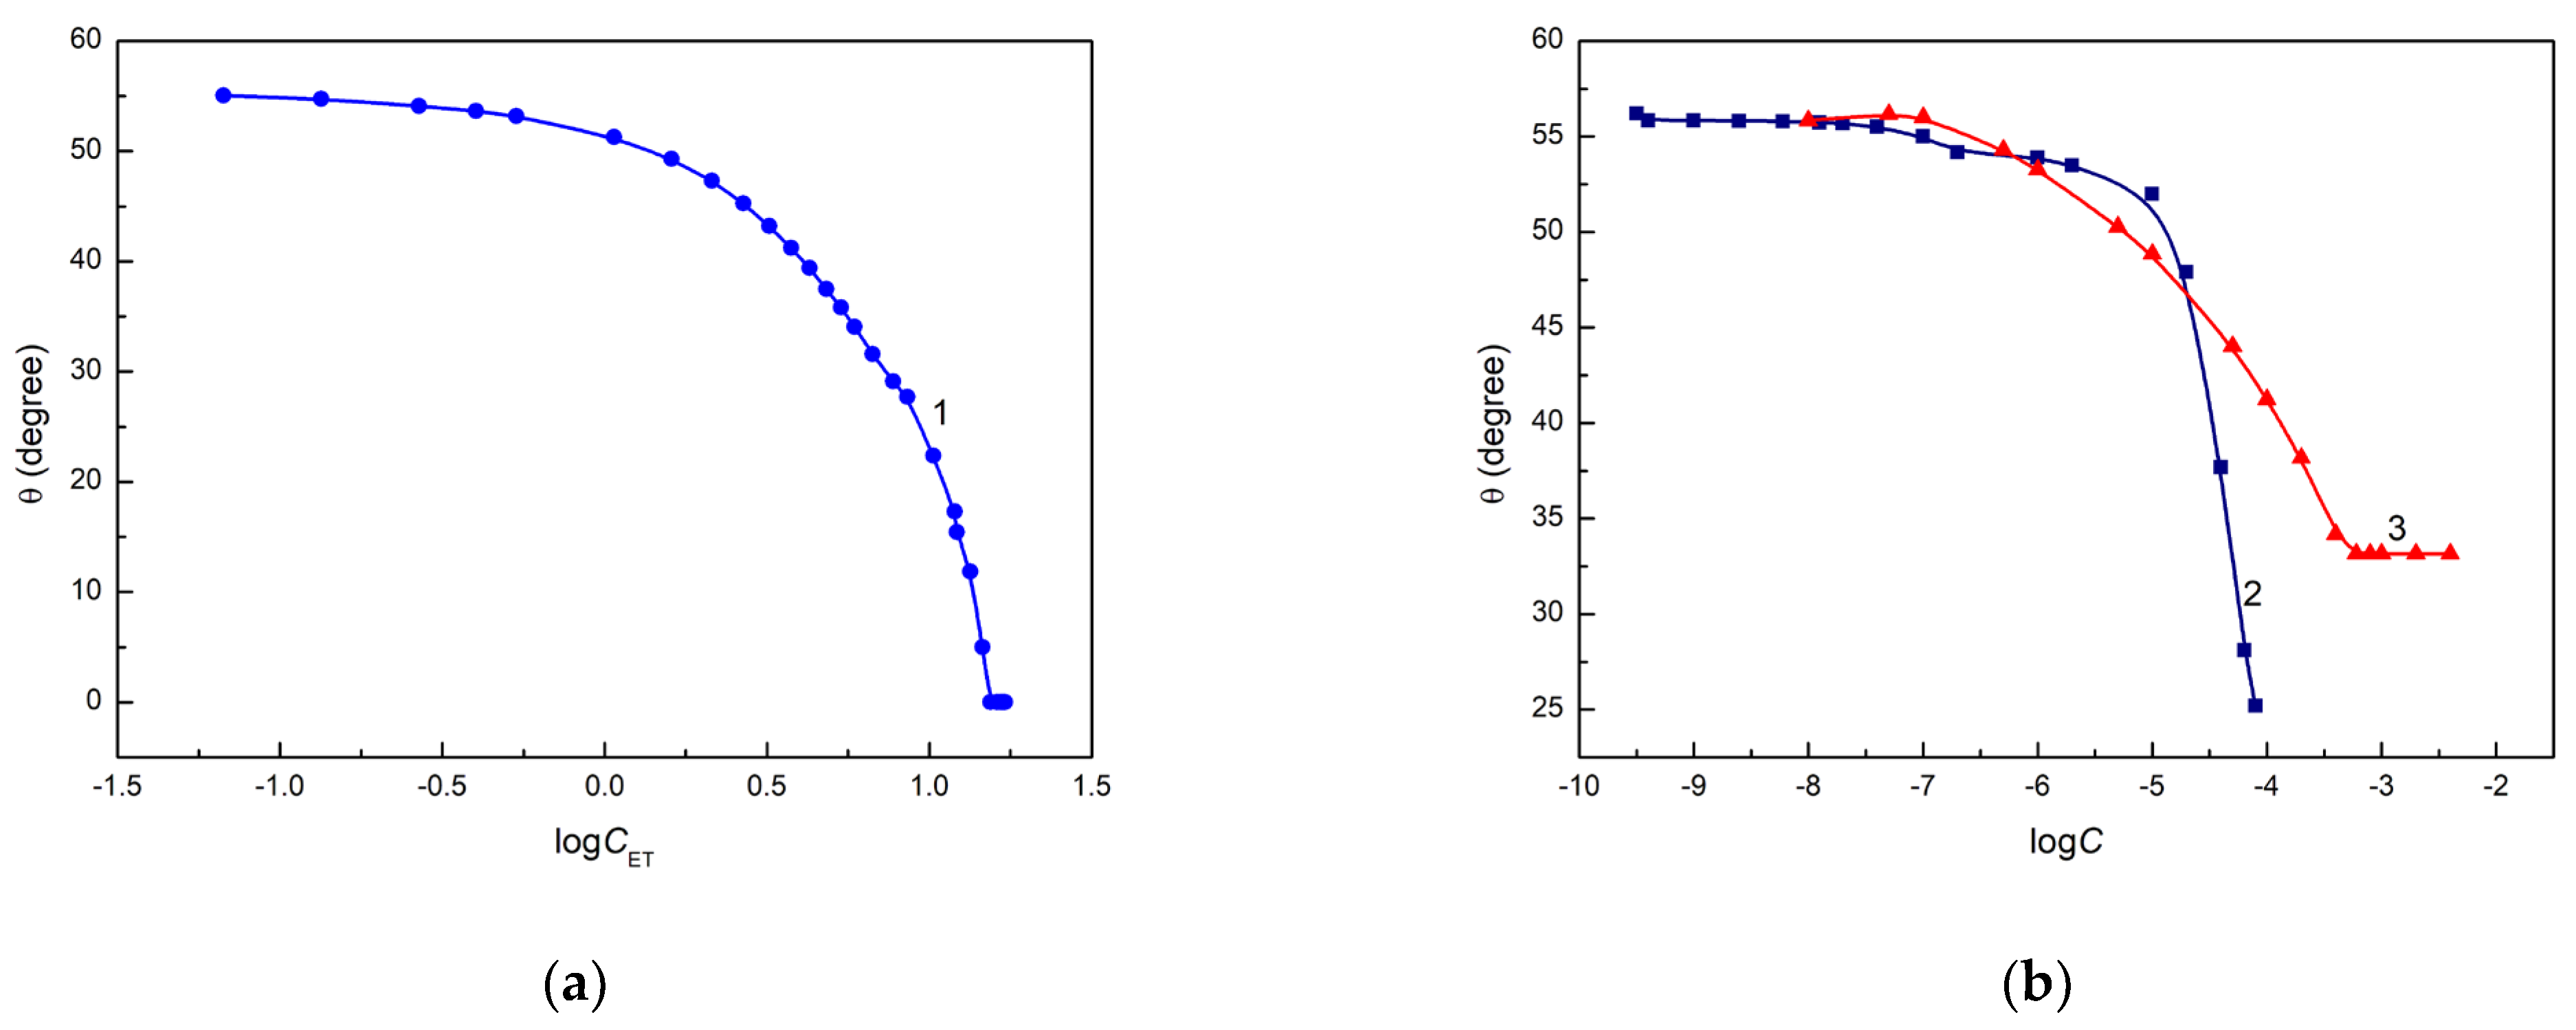
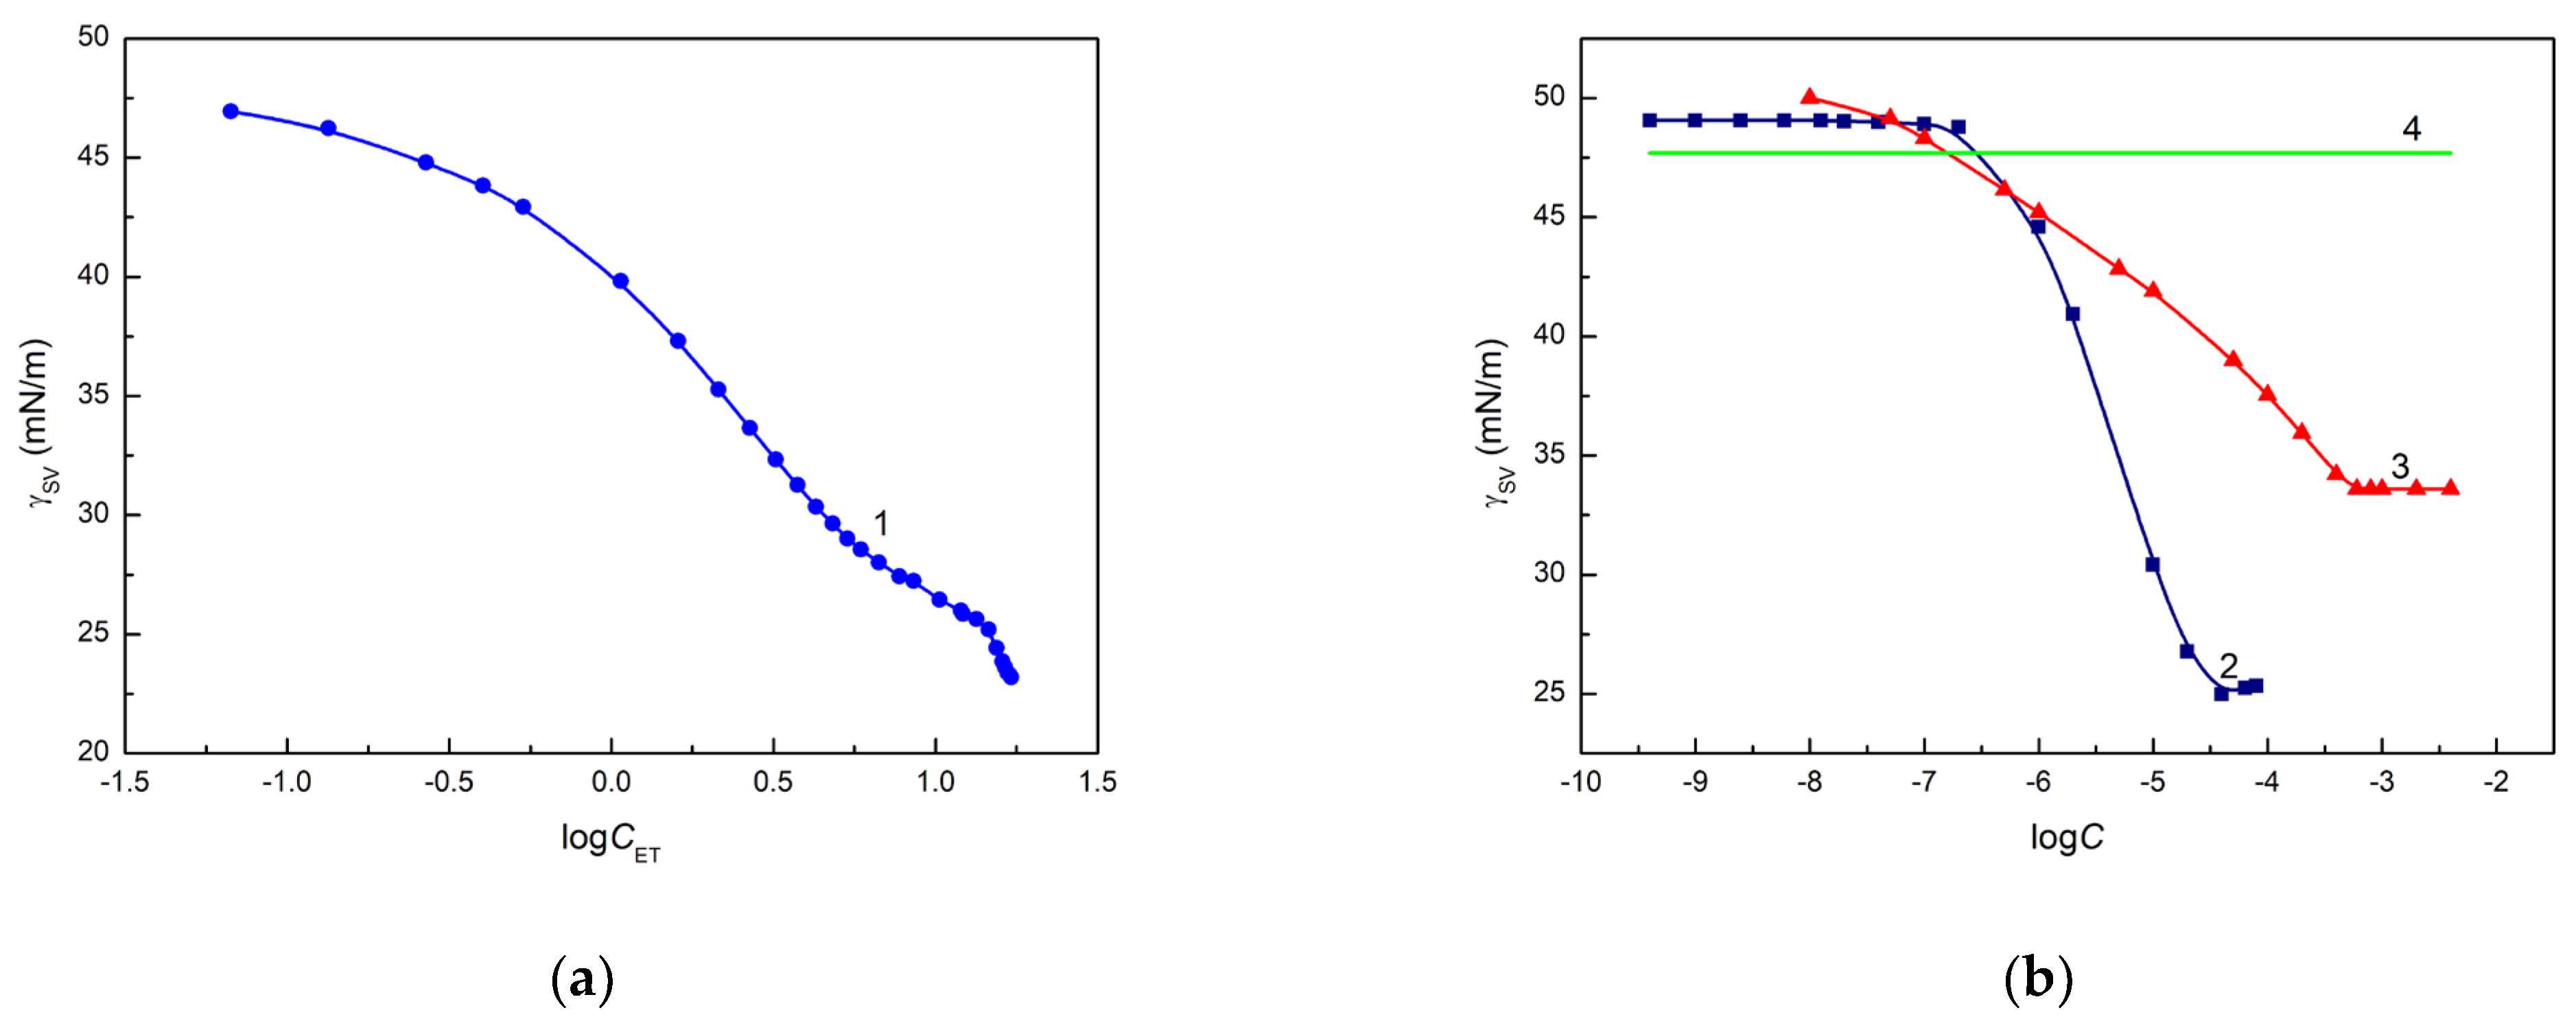
52]. Unfortunately, only in the case of an aqueous ET solution, its complete spreading is observed, but at a surface tension much lower than the quartz surface tension (Figure 2a). The minimum of the surface tension of aqueous solution of RL and TX165 [54,55] is lower than the Q surface tension, but θ is considerably higher than zero (Figure 2b).
Therefore, the following question arises: what is the reason for this? From the Young-Dupre equation, it results that [42,43]:
cos θ = 1 + W a γ LV ,
where W a is the adhesion work of liquid or solution to the solid surface.
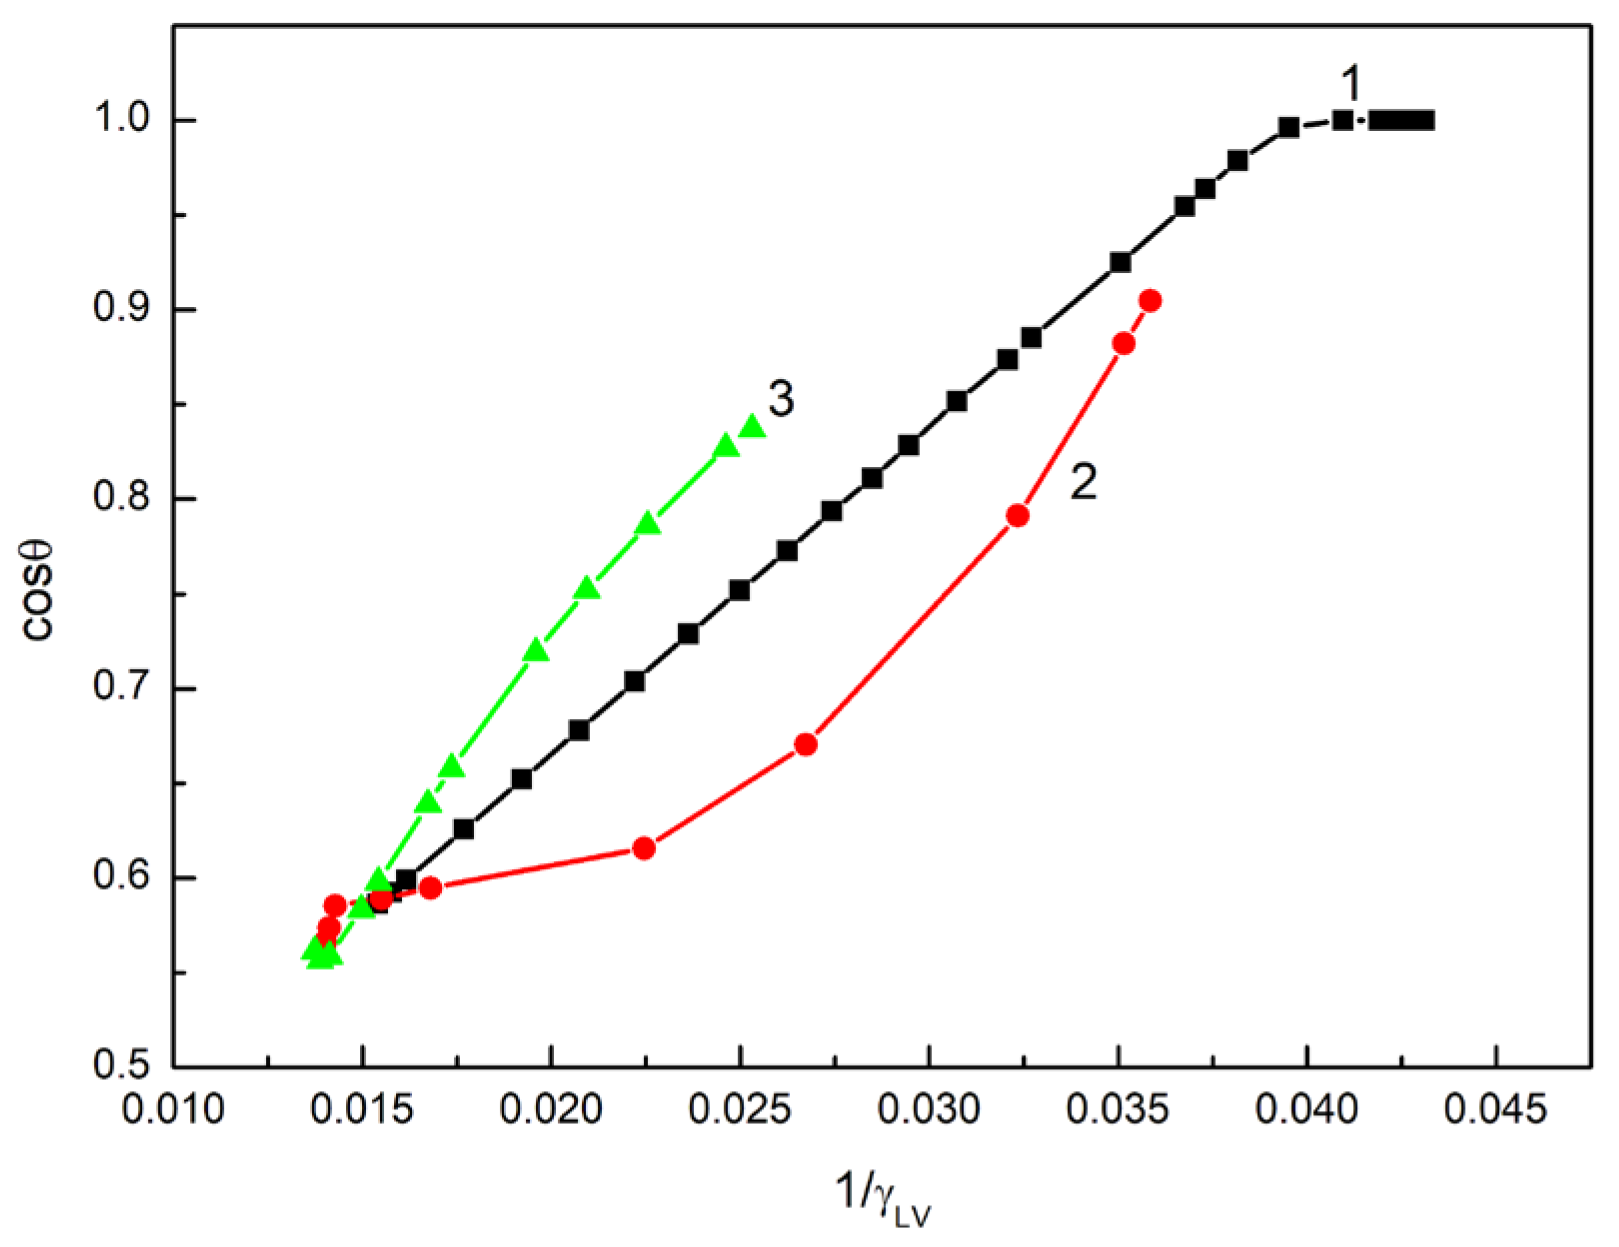
However, only in the case of the aqueous solution of ET is there linear dependence between the cosine of the contact angle and the reciprocal of its surface tension in the range of ET concentration, in which the contact angle on the quartz surface is higher than zero (Figure 3).
Unfortunately, Equation (8) is not satisfied because the slope of the linear relationship is not equal to W a of the aqueous ET solution to the quartz surface. For the ET aqueous solution, the relationship between cos θ and 1 γ LV satisfies the expression:
cos θ = k + l 1 γ LV ,
where k 1 and l W a .
The changes in cos θ as a function of 1 γ LV suggest that there is a different mechanism of the ET, RL and TX165 adsorption at interfaces including quartz. The LW and AB components of ET surface tension are considerably lower than these components of water surface tension. It seems that ET molecules are adsorbed on Q covered by a water layer surface in the whole range of its concentration. It is possible that at a high ET concentrations, only an ice-like layer of water is not destroyed, but the adsorbed water molecules are removed by the ET ones. In the case of RL and TX165, the mechanism of their adsorption at the interfaces including a quartz/water layer surface is more complicated that in the case of ET adsorption. According to van Oss and Constanzo [56], the surface tension of a surfactant depends on the molecule orientation towards the air phase. If the molecules of surfactants are oriented by the hydrophobic group towards air, then the surfactant tension is treated as the tail surface tension, and if the hydrophilic group of surfactant molecules is oriented towards the water phase, then the surface tension is called the head surface tension. The tail surface tension of RL and TX165 is the same and close to the LW component of ET surface tension but lower than LW of water surface tension determined from θ W on hydrophobic surfaces [41]. On the other hand, the head surface tension of RL and TX165 is higher than the tail surface tension and lower than that of water [51]. Although the surface tension of RL and TX165 tails is similar to the ET surface tension, the hydrophobic interactions of surfactant molecules with the quartz/water layer surface are much greater than that of ET due to the much larger contact area [38]. It should be remembered that RL is an anionic surfactant, and there may be repulsive electrostatic interactions between the RL molecules and the quartz/water layer surface. However, in the case of TX165, the hydrophilic group of its molecules is strongly hydrated, and it is possible that H3O+ ions are strongly bound to the oxyethylene groups in the TX165 molecule and, thus, attractive interactions between the TX165 molecules and the quartz surface may occur [42]. The above facts indicate that the adsorption mechanism of RL and TX165 on the quartz surface covered with a layer of water is different, which is reflected in the differences in the relationship between cos θ and 1 γ LV (Figure 3).
These differences for the ET, RL and TX165 solutions can also result from the change in the surface tension of the quartz after deposition of a solution drop on its surface as a function of the concentration of ET, RL and TX165. The confirmation of this suggestion can be the values of the quartz surface tension calculated from the Neumann et al. [45,46,47] equation (Equation (3)) based on the contact angle of aqueous solutions of ET, RL and TX165 (Figure 4a,b).
The calculated γ SV values decrease as a function of solution concentration ( C ). It is interesting that the complete spreading of ET aqueous solution takes place when the surface tension of the solution is close to that of quartz calculated from Equation (3). In the case of the aqueous solution of RL and TX165, the values of γ SV calculated from Equation (3) are lower than the minimal surface tension of these solutions and, probably for this reason, complete spreading of quartz by the solution of RL and TX165 is not observed (Figure 2b). The γ SV values calculated from Equation (3) based on the contact angle of aqueous solution of ET, RL and TX165 on the Q surface suggest that behind the solution drop settled on quartz, the layer of a given solute is formed, which decreases the quartz surface tension. The surface tension of the head and tail of RL and TX165 is lower than that of quartz [38]. Thus, the adhesion work of ET, RL and TX165 is greater than their cohesion work, as opposed to water. Hence, the ET, RL and TX165 molecules have a greater ability to migrate along the quartz surface than water molecules, whose work of adhesion to quartz is smaller than that of cohesion. In the case of ET, there is a possibility of adsorption of its vapours behind a solution drop deposited on the quartz surface.
The possibility of formation of an ET, RL or TX165 layer behind a drop of their aqueous solutions deposited on quartz is confirmed by the values of the work of adhesion of these solutions to the quartz surface calculated from the Young-Dupre ( ( γ LV cos θ + 1 = W a ) and the van Oss et al. equations 2 γ LV LW γ SV LW + γ LV + γ SV + γ LV γ SV +   = W a [49,50,51,52] (Figure S1a–c). For the calculation of W a , the measured values of the contact angle of aqueous solution of ET, RL and TX165 as well as the components and parameters of solution surface tension taken from the literature [54,55,57] were used. There is a difference between the values of W a calculated from the Young-Dupre and van Oss et al. equations. Probably, this difference corresponds to the pressure of the layer formed by the ET, RL or TX165 on the quartz surface ( π = Δ W a ). It is interesting that there is linear dependence between the W a obtained from the Young-Dupre equation and γ LV of aqueous solution of ET or TX165 but not for solution of RL (Figure S1d). In the case of W a calculated from the van Oss et al. [49,50,51,52] equation, its changes are not linear for solutions of surfactants and ET but can be described by one function. If we assume that the changes in the quartz surface tension calculated from the Neumann et al. equation (Equation (3)) [45,46,47] are caused by the formation of the ET or RL or TX165 layer on the quartz surface, then the pressure of this layer should be equal to the difference between the quartz surface tension calculated from the contact angles for water and solution at the given concentration ( π = Δ γ SV ). It appeared that the pressure of the surfactants and ET layer on the quartz surface ( π ) determined by the two mentioned ways are similar (Figure 5a,b).
Moreover, this pressure is close to half the difference between the surface tension of water ( γ W ) and the solution ( γ W γ LV 2 ) (Figure S1d). The presence of a layer of surfactants and ET on the quartz surface behind the deposited drop of their solution is also confirmed by the values of the parameter of intermolecular interactions across the quartz-solution interface calculated both on the basis of the contact angle and the components and parameters of the quartz surface tension (Figure S2a,b).
The calculation of ϕ based on Equation (7), in which the contact angles of aqueous solutions of ET, RL and TX165 were used, as well as the constant value of γ SV equal to 47.7 mN/m and the variable values of γ SV obtained from the Neumann et al. [45,46,47] equation (Figure S2a,b).
The other method of ϕ calculation was based on the equation resulting from the equations of van Oss et al. [49,50,51,52] and Girifalco and Good [44], which has the form:
γ LV LW γ SV LW + γ LV + γ SV + γ LV γ SV +   γ SV γ LV = ϕ ,
It appeared that the values of ϕ calculated from Equation (7) at the constant γ SV decrease as a function of ET or surfactant concentration (Figure S2a,b). Because the values of contact angle also decrease as a function of ET and surfactant concentration, it seems that the ϕ values determined in such a way are not real. On the other hand, the ϕ values increase as a function of ET, RL or TX165 concentration if, for its calculation from Equation (7), the variable values of γ SV obtained from Equation (3) are used. These values are close to those obtained from Equation (10). This fact confirms the conclusion drawn above that the layer of ET, RL or TX165 is formed behind the solution-settled drop on the quartz surface, which influences the value of contact angle. Probably for this reason, the complete spreading of the aqueous solution of RL and TX165 is not observed, although the surface tension of the solution is lower than the quartz surface tension. On the other hand, in the case of the ET solution, its complete spreading over the quartz surface occurs at the solution concentration which corresponds to its surface tension equal to or lower than the surface tension of the quartz covered with the ET layer. Hence, the so-called critical surface tension of quartz wetting ( γ C 
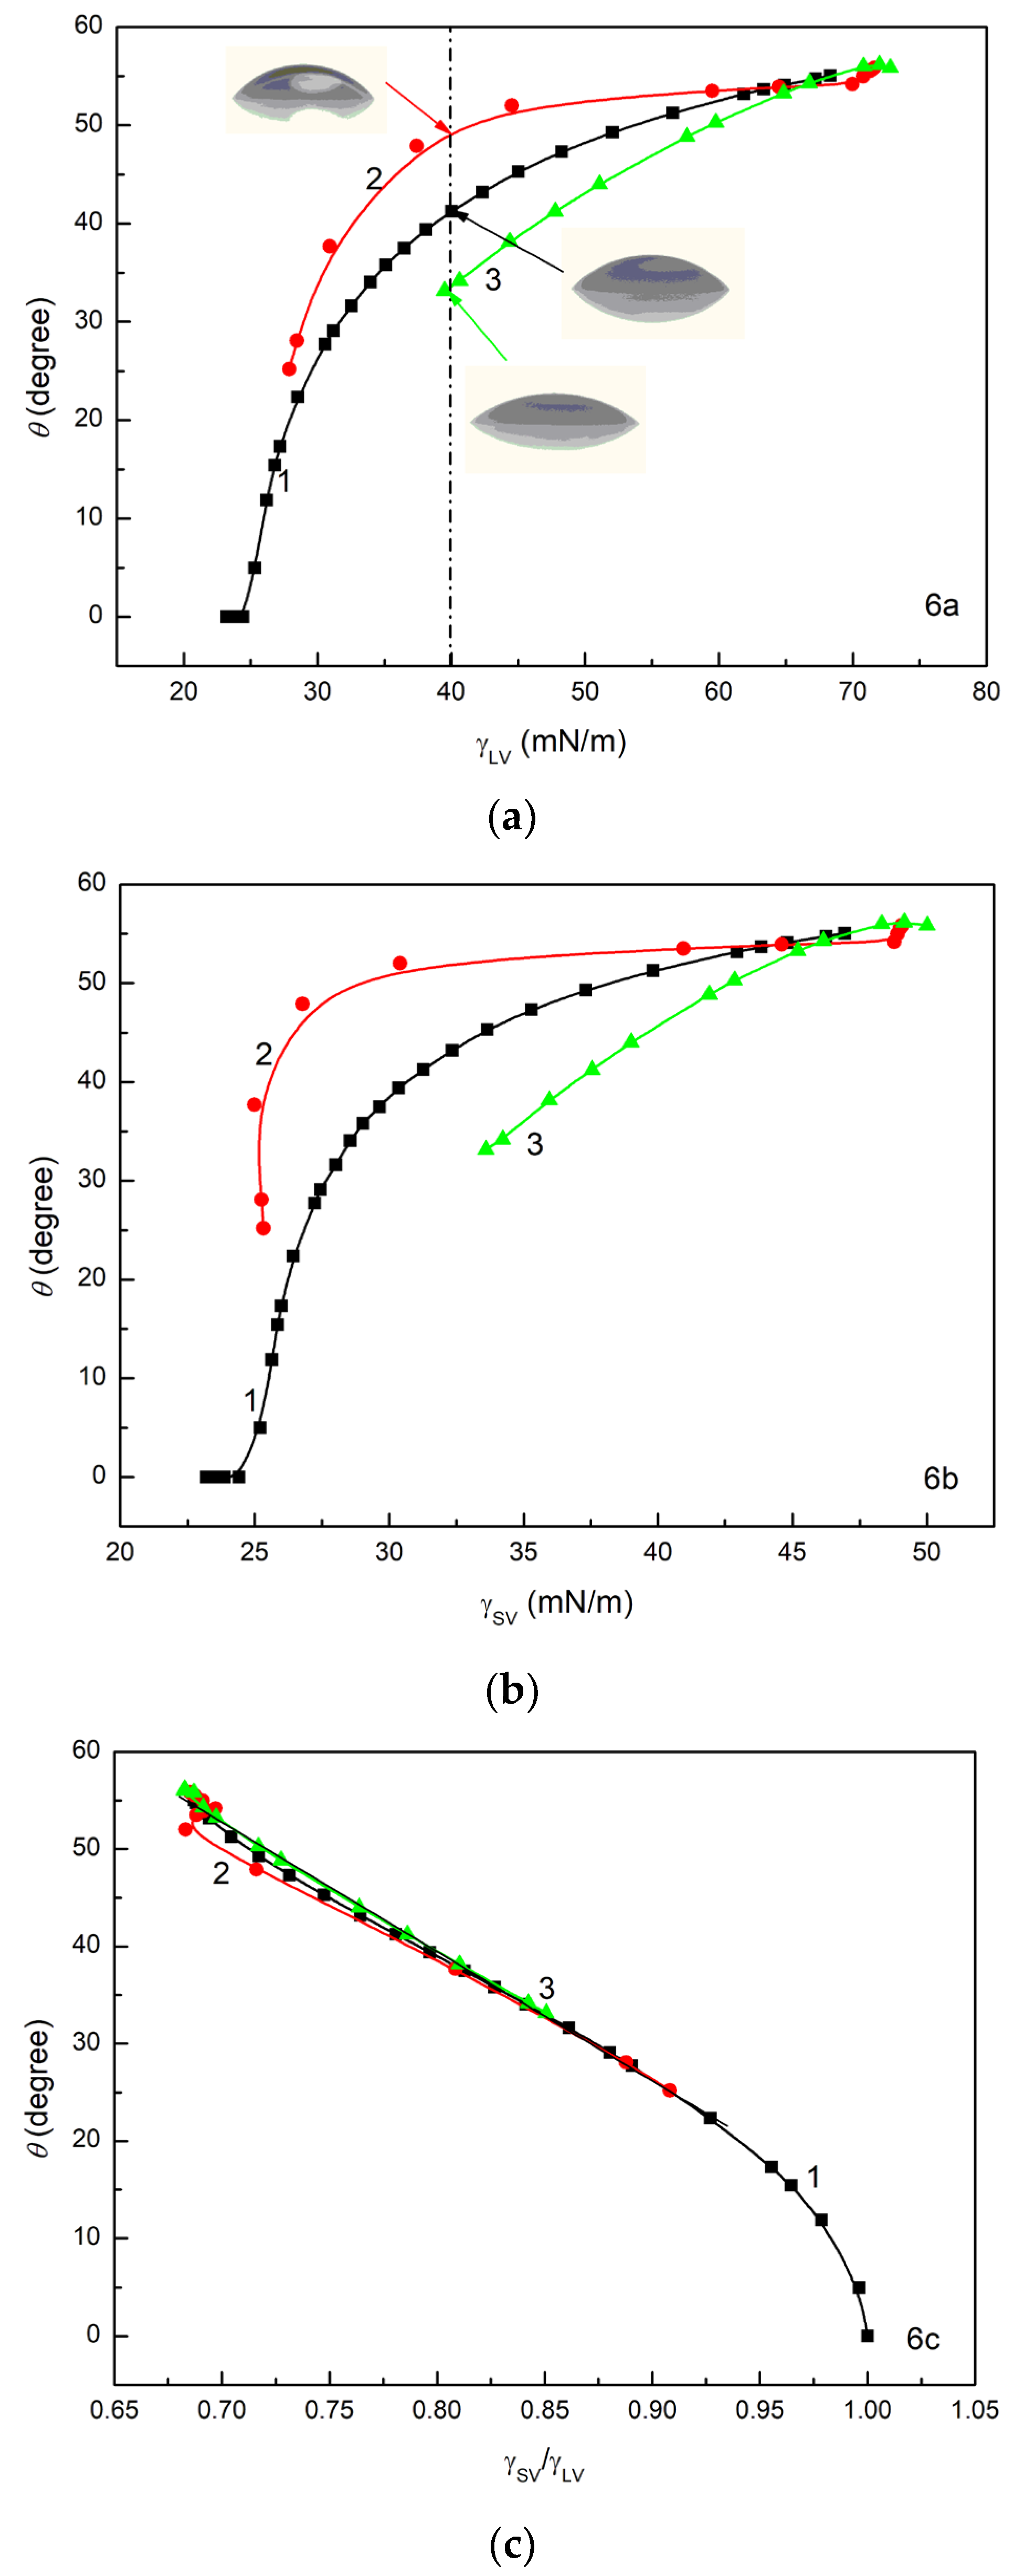
) is not equal to its surface tension but to the surface tension of quartz/layer of a surface-active substance. In such cases, the wetting properties of ET, RL and TX165 depend on the surface tension of ET, RL and TX 165 aqueous solution and its components and parameters as well as the surface tension of quartz covered by these substance layers. The γ LV and γ SV are only independent parameters influencing θ because γ SL depends on these parameters. As follows from Figure 6, the wetting properties of ET, RL and TX165 are the same at a low concentration of their solution (large surface tension). However, with a decrease in the solution surface tension, differences in the wetting properties of ET, RL and TX165 are observed. At the same values of γ LV (Figure 6a) and γ SV (
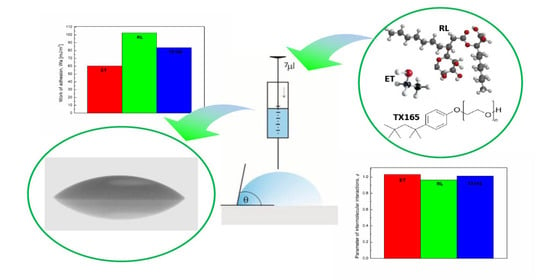
Figure 6b), the greatest θ is observed for RL and the smallest for TX165. This indicates that at a given surface tension of aqueous solution, the wetting properties of TX165 are the best but those for RL are the worst. This is probably associated with repulsive interactions between the electron-donor parameters of RL and TX165 head surface tension and the electron-donor parameter of quartz surface tension as well as with repulsive electrostatic interactions between the RL molecules and quartz surface. However, the contact angle at a given surface tension of ethanol solution is higher than that for TX165 solution at the same surface tension, although the electron-donor parameter of ET surface tension is considerably smaller than this parameter of the head of TX165 surface tension. Because the surface tension of the TX165 tail is close to ET, this effect results probably from attractive electrostatic interactions between the head of TX165 strongly hydrated by H3O+ ions with the negatively charged quartz surface. It is interesting that the ratio of γ SV to γ LV is almost the same for the aqueous solution of ET, RL and TX165. Moreover, the changes in θ as a function of γ SV   γ LV   for RL and TX165 can be described by the linear equation in the whole range of their concentration in the solution (Figure 6c). However, in the case of ET solution, the linear dependence between θ and γ SV   γ LV   exists in the range of ET concentration at which the LW component of its solution surface tension is constant and close to the LW component of water surface tension [57]. In fact, the value of γ SV   γ LV   equal to unity indicates complete wetting of the quartz/surfactant layer by a given solution if γ SL = 0 . It should be emphasized that the wettability of quartz, which, according to the concept of van Oss et al. [49,50,51,52], is treated as a bipolar solid, by the aqueous solutions of ET, RL and TX165, is different than, for example, for nylon 6, which is also a bipolar solid with components and surface tension parameters not much different from those of quartz. The reason for this is probably a highly ordered layer of water on the quartz surface, significantly changing its surface properties, which affects the adsorption mechanism of ET, RL and TX165 molecules at the quartz-air and quartz-solution interfaces.
Knowledge of the wettability of the quartz surface by the aqueous solution of ET, RL and TX165 reflected by the behaviour of their molecules at the solution-air, quartz-air and quartz-solution interfaces can contribute to a better understanding of the wetting properties of multicomponent surfactant mixtures containing anionic and nonionic surfactants and ethanol as additives. This is important from a practical point of view because, in practice, in most cases, mixtures but not individual surfactants are used.

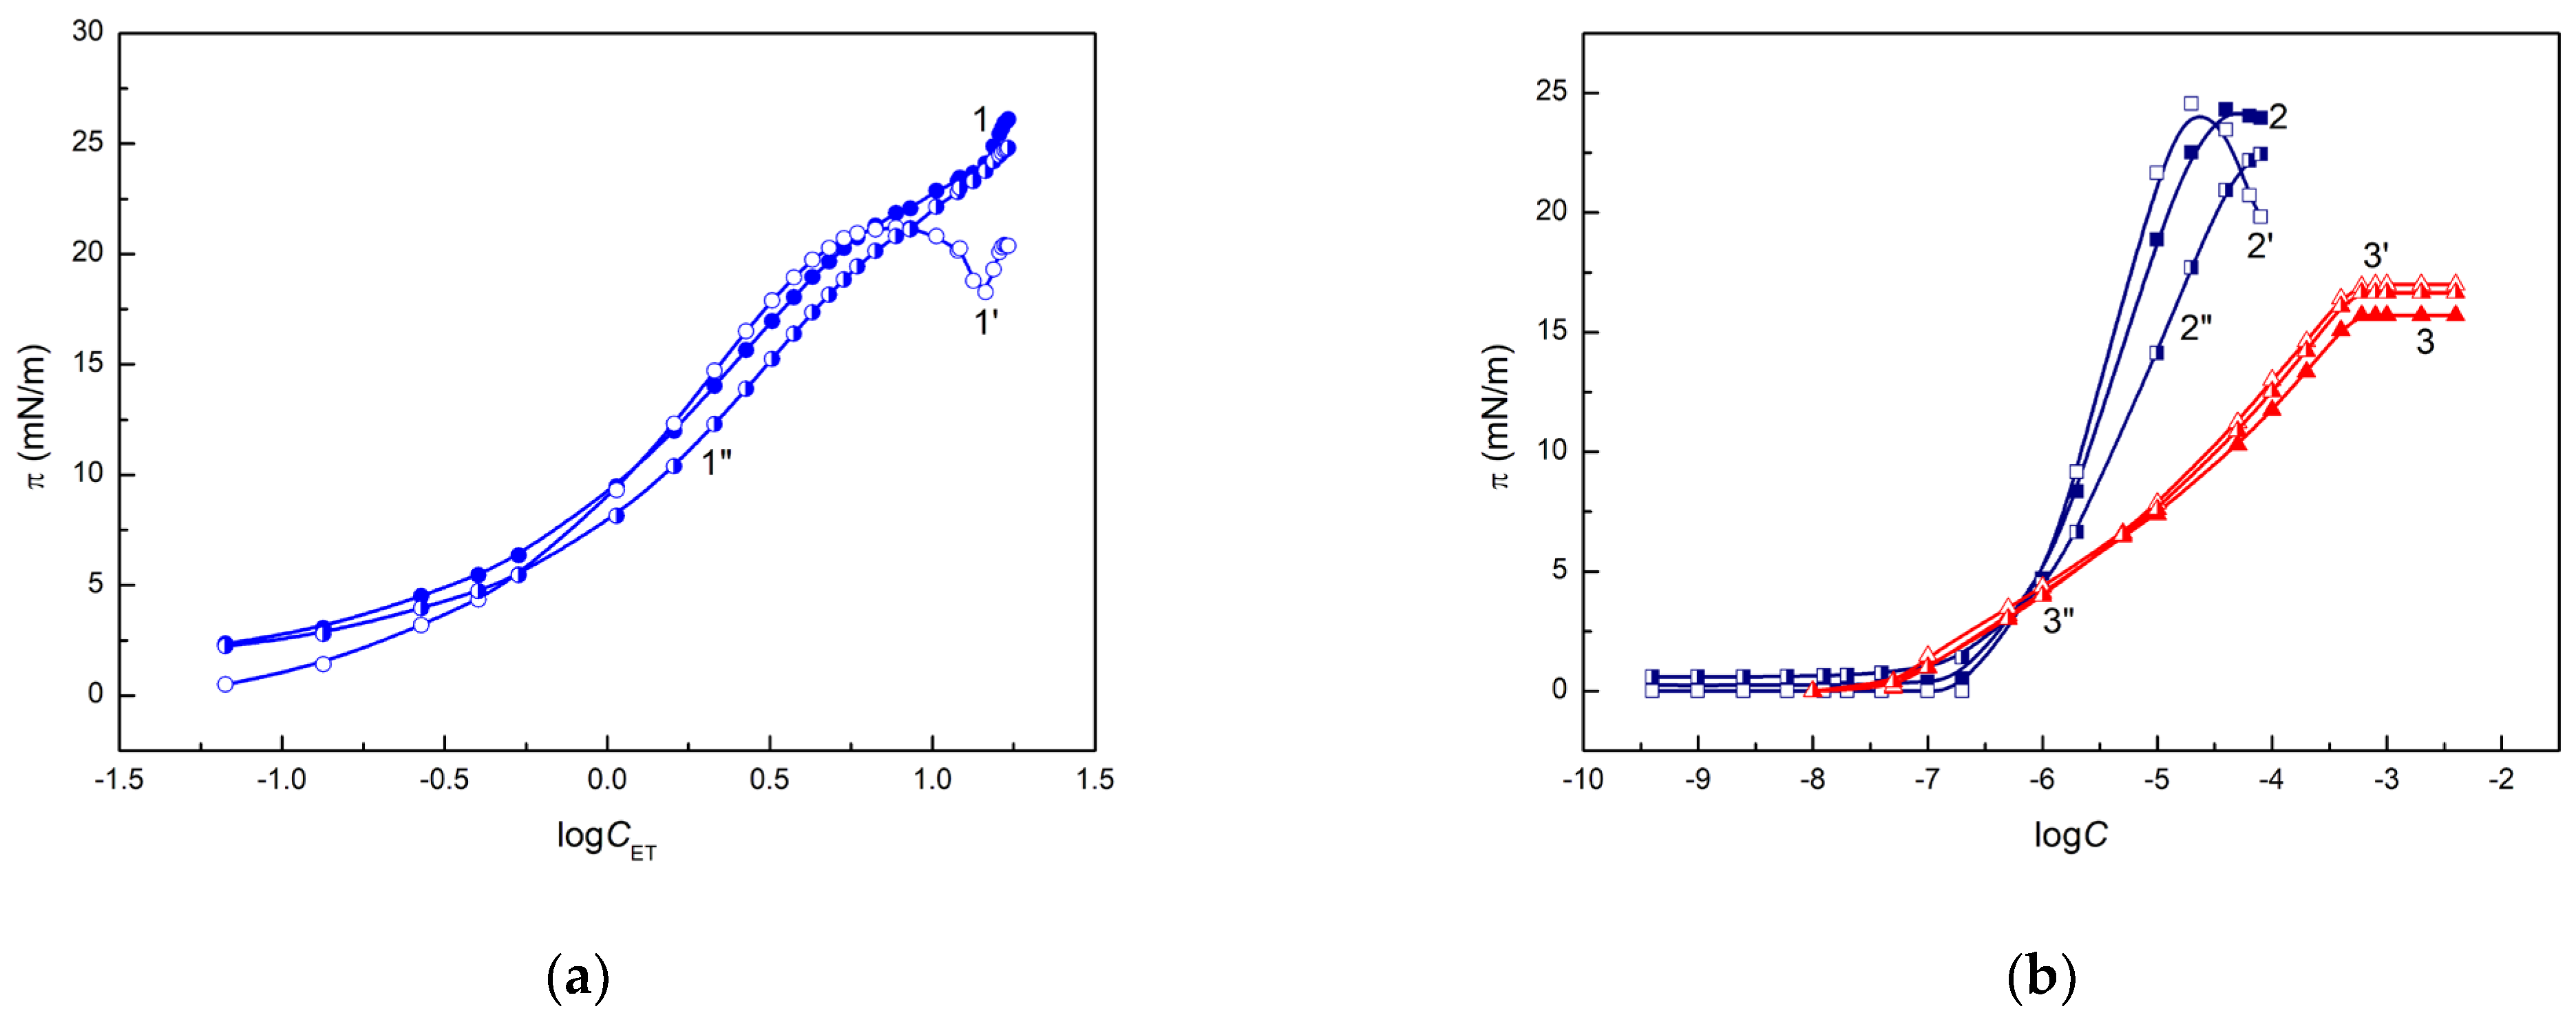
3.3. Concentration of ET, RL and TX165 at the Quart-Air and Quartz-Solution Interfaces and the Gibbs Standard Free Energy of Adsorption

Knowing the pressure ( π ) of ET, RL and TX165 layers at the quartz-air (Q-A) and quartz-solution (Q-S) interfaces, it is possible to determine their concentration (Γ) at these interfaces using, among others, the Frumkin equation, which has the form [42]:
π = R T Γ max ln 1 Γ Γ max ,
where Γ max is the maximum concentration, T is the temperature and R is the gas constant.
One of the problems associated with applying Equation (11) to determine the concentrations of ET, RL and TX165 at the Q-A and Q-S interfaces is to determine their maximum concentrations at these interfaces. Since the ET aqueous solution can be treated as a two-component mixture, the maximum concentration of ET at these interfaces should be equal to its concentration in the bulk phase in terms of two-dimensional concentration [42,43]. Hence, Γ max equal to 7.91 × 10⁻⁶ mole/m2 was taken in the calculations of Γ. In the case of RL and TX165, it appeared that there was linear dependence between π and log C ( C is the mole concentration) in the range of the concentration close to their critical micelle concentration (CMC) [54,55]. Thus, it was possible to determine Γ max for RL and TX165 at the Q-A and Q-S interfaces (Table 1).
For the calculation of Γ at the Q-A interface, the values of π for ET, RL and TX165 solution obtained from the Neumann et al. [45,46,47] equation as well as from the difference of W a calculated from the van Oss et al. [49,50,51,52] and Young and Dupre equations were used. It proved that in the case of ET, its concentration at the Q-A interface is higher than at the Q-S one. However, the concentration of ET at the S-A interface is higher than that at Q-A and Q-S.
On the isotherm of ET concentration at the Q-S interface, the maximum is observed (Figure S3a). The adsorption isotherm of ET suggests that at the quartz-air interface molecules of ET are rarely adsorbed on the quartz/monolayer surface compared with the “bare” quartz surface. However, at the ET concentration approaching its mole fraction in the bulk phase close to unity, the ethanol molecules destroy the ice-like structure of water, and a water-ethanol layer is formed. In consequence, the ET concentration at the quartz-solution interface decreases.
In the case of RL and TX165, their adsorption at the Q-S interface is about twice smaller than at the Q-A one (Figure S3b). It should be added that at the Q-A and Q-S interfaces, RL and TX165 concentration is considerably lower than at the solution-air interface (Figure S3b). Probably, this results from the strong Lewis acid-base interactions of water molecules with the head of RL and TX165 molecules. In the case of RL, some repulsive electrostatic interactions between the quartz surface and head of RL may take place. Behind the solution drop settled on the quartz surface, the interactions of RL and TX165 at the Q-A interface can be stronger than at the Q-S one due to the lack of competitive interactions of RL and TX165 molecules with water.
The measure of the tendency of a given substance to adsorb at any interface is the standard Gibbs free energy of adsorption ( Δ G ads 0 ). This energy is equal to the difference between the standard chemical potential of a given component of the solution in the bulk phase ( μ * ) and in the interface region ( μ 0 ). In the literature, it is possible to find various definitions of the chemical potential for a given component of the surface layer ( μ s ) [43]. For an ideal mixed adsorption layer or a non-ideal one with a small concentration of a given component, its chemical potential can be represented, among others, by the following equation:
μ s = μ 0 + R T ln a s ,
where μ s is the chemical potential of a given component of the mixed surface layer and a s is the activity of a given component of the surface layer.
Because a s = x s f s , Equation (12) assumes the form:
μ s = μ 0 + R T ln x s f s   ,
where x s is the fraction of the surface area occupied by molecules of a given compound at the interface and f s is the activity coefficient of a given substance in the surface layer.
In turn, the chemical potential of the same component in the bulk phase ( μ b ), according to its asymmetric definition, can be expressed as:
μ b = μ * + R T ln a b   ,
where a b = x b f b is the activity of a given component of the bulk phase ( x b is the mole fraction of a given component and f b is the activity coefficient).
It is known that in the thermodynamic equilibrium state μ s =   μ b ; then:
Δ G ads 0 = μ 0 μ * = R T ln x b f b x s f s   ,
Taking into account that x b = C ω , we obtain:
C f b x s f s = ω exp Δ G ads 0 R T ,
where ω is the number of the moles of all components in solution in 1 dm3.
If the solution in the bulk phase and in the surface layer can be treated as ideal, then:
C x s = ω exp Δ G ads 0 R T ,
In the case of aqueous solution of RL and TX165, their C values are lower than 0.1 mole/dm3 and ω value can be treated as constant and equal to the number of water moles in 1 dm3 of solution. Hence, the C x s can be treated as constant in the Langmuir isotherm and Szyszkowski equations [42].
However, in the aqueous solution of ET, which should be rather treated as a mixture of water and ET ω , being the sum of ET and water moles in 1 dm3 of solution is changed as a function of ET concentration. This indicates that C x s values for ET at the Q-A and Q-S interfaces should be changed more than RL and TX165 as a function of their concentration. To determine C x s , C and x s must be known.
For the surface monolayer, x s can be determined based on the surface concentration of a given substance and the limiting area occupied by its molecule ( A 0 ). A 0 is correlated with the structure of a molecule of a given substance as well as its orientation at the interface. In the case of ET, it is easy to establish the A 0 value because this value is the same at each possible orientation of the ET molecule at the interface and is equal to 21 Ǻ2 [38]. The A 0 value for RL and TX165 depends on the orientation of their molecules towards the interface. At the perpendicular orientation of RL and TX165 molecules towards the interface, their A 0 values are equal to 60.09 and 35.70 Ǻ2, respectively [38]. However, at the parallel orientation of the tail of RL and TX165 molecules, this area is equal to 87.30 for RL and 52.12 Ǻ2 for TX165. Taking into account the above-mentioned A 0 values and Γ, it is possible to determine x s values using the expression:
x s = Γ N A 0 ,
where N is the Avogadro number.
The values of C x s determined for ET at both Q-A and Q-S interfaces are constant only in the range of low concentration, and there are small differences between C x s values for the Q-S and Q-A interfaces (Figure S4a). For the Q-A interface and ET at its concentration from C = 1.07 mole/dm3 to pure ET, almost linear dependence between C x s and C takes place, and it does not depend on the method of ET layer pressure determination (see above). In the case of Q-S interface at the ET concentration range higher than its critical aggregation concentration [57], there is a deviation from the linear dependence between C x s and C. This confirms the suggestion that the adsorption behaviour of ET at the Q-S interface in a large concentration range is different from that at the Q-A interface. As mentioned above, the values of ω depend on C of ET and, thus, from a thermodynamic point of view, it should be more interesting to show changes in the x b x s ratio than C x s one as a function of C (Figure S4b). This proved that the changes in x b x s are different from C x s as a function of C, as expected. In the range of ET concentration from zero to the concentration at which the maximum of its Gibbs surface excess concentration takes place [38,57], the values of x b x s for the Q-A and Q-S interfaces are the same and are slightly changed (Figure S4b). On the basis of the data presented in Figure S4a,b, it can be stated that only in a very low concentration range of ET approaching zero, at the first approximation, C x s and x b x s are a little higher than the constant and directly associated with the standard Gibbs free energy of adsorption. As a matter of fact, in the whole range of ET concentration, this energy is related to x b x s f b f s . To show the changes in f b f s as a function of C for ET, it was assumed that for the lowest concentration of ET f b f s = 1 . The values of f b f s determined in such a way are presented in Figure S4c. The changes in f b f s as a function of concentration for both Q-A and Q-S interfaces can be successfully described by the exponential function of the second order.
The changes in C x s for RL and TX165 as a function of log C   are small in the range of RL as well as TX165 concentration lower than their CMC (Figure S5a). These changes do not depend on the type of the interface. To confirm the suggestion resulting from Figure S5a, the f b f s values were determined in a similar way to the case of ET. For RL, the f b f s values are equal to unity in its concentration range, corresponding to the RL unsaturated monolayer at the water-air interface and practically the same for the Q-A and Q-S interfaces as they do not depend on the limiting area of RL molecules (perpendicular and parallel orientations) taken for x s determination (Figure S5b). However, the f b f s values for TX165 are constant only in its very low concentration range in the bulk phase. In fact, similar changes in f b f s for the Q-S and Q-A interfaces of a given surfactant as a function of its concentration in the bulk phase do not indicate the same adsorption tendency at these interfaces. However, the f b f s values equal to unity suggest that in a concentration range of the aqueous solution, the monolayer at the interfaces behaves as an ideal one. For this concentration range, the values of standard Gibb free energy ( Δ G ads 0 ) calculated based on the C x s values can be treated as real ones (Figure S6a,b). It is difficult to establish, for ET, which values of Δ G ads 0 calculated from Equation (17) are real. It is possible to state that these values are similar for the Q-A and Q-S interfaces and a little different than at the water-air interface [57]. In the case of RL, the absolute values of Δ G ads 0 for Q-S interface are lower than for the Q-A one, and both are lower than that at the water-air interface [47,55] (Figure S6b). This fact suggests that there are repulsive electrostatic interactions between the quartz surface and RL molecules, which are more evident at the Q-A interface. The Δ G ads 0 values for TX165 for the Q-A interface are almost the same as for the water-air one. However, absolute values of Δ G ads 0 for the Q-A interface are higher than that at the Q-S one, similar to the case of RL. This indicates that for both RL and TX165, the tendency of their molecules to adsorb at the Q-A interface is greater than that of the Q-S interface. Probably, this results from smaller interactions between the surfactant molecules and air than between water ones. Therefore, the penetration of RL and TX165 molecules from the solution drop settled on the quartz surface causes a larger decrease in free energy of the quartz solution drop-air system than adsorption of these molecules at the quartz-water interface.

4. Conclusions

The results obtained from the measurements and their thermodynamic interpretation allow us to draw many interesting conclusions.
The surface tension of quartz obtained from the contact angle of water, formamide and diiodomethane using different approaches to the interface tension suggests that for the studies of quartz wettability in relation to its surface tension, it must be taken into account that this tension depends on the type of quartz surface and the presence of the water layer on its surface. This tension can also be different, depending on the approach used for its determination.
The contact angle of the aqueous solution of ET, RL and TX165 is different at the same surface tension of the solution, indicating the best wetting properties of TX165 and the worst of RL.
There are practically no differences in the contact angle at the same value of the ratio of quartz surface tension to the solution one between the aqueous solution of ET, RL and TX165. Moreover, the dependence between the contact angle for the aqueous solution of RL and TX165 on quartz and the ratio of quartz surface tension to the solution one is linear in the whole range of concentration of RL and TX165 in the solution. However, for ET at its high concentration in solution, there is deviation from the linear dependence between the contact angle and the ratio of quartz surface tension to the solution surface tension.
Contrary to the opinion of some researchers, complete wetting of quartz with water solutions of active surface substances does not take place at the solution tension equal to the surface tension of the quartz. The reason for this is that some components of the solution move faster on the quartz surface than the solution itself in the process of its spreading. In this case, complete wetting of the quartz surface occurs when the surface tension of the solution is equal to the tension of the quartz covered with a layer of a given component of the solution. For this reason, only the ET solution spreads completely over the surface of the crystal at its given concentration. However, complete wetting of quartz by the RL and TX165 solutions was not observed, despite the fact that their minimum surface tension was lower than the surface tension of quartz.
The ET adsorption at the quartz-air and quartz-solution interfaces is comparable to the adsorption at the air-solution interface and lower in the case of RL and TX165. However, the adsorption of RL and TX165 at the quartz-air interface is higher than at the quartz-solution one.
The ratio of mole fraction of ET in the bulk phase to the fraction of surface area occupied by its molecule is changed as a function of ET concentration in the bulk phase. In the case of RL and TX165, this ratio is constant in the low concentration range, corresponding to the unsaturated monolayer of this surfactant at the solution-air interface. This takes place for both the quartz-air and quartz-solution interfaces.
The greater tendency to adsorb RL and TX165 is confirmed by the standard Gibbs free energy of adsorption. In the case of ET, this energy at the quartz-air and the quartz-solution interfaces is comparable and close to the energy of adsorption at the solution-air interface.
Knowledge of the wetting properties of the quartz surface by the aqueous solution of ET, RL and TX165 reflected by the behaviour of their molecules at the solution-air, quartz-air and quartz-solution interfaces can contribute to a better understanding of the wetting properties of multicomponent surfactant mixtures containing anionic and nonionic surfactants and ethanol as additives. The obtained results can be helpful for determining the synergistic effect in the process of quartz wetting by the aqueous solutions of a mixture of surfactants with the addition of short-chain alcohols. Thus, they can be helpful in selecting the appropriate composition of the aqueous solutions of a mixture of surfactants and additives that will provide the most favourable wetting process in practice. For example, the results obtained may be helpful in determining the most favourable conditions for creating protective coatings on optical fibre cables.

Supplementary Materials

The following supporting information can be downloaded at: https://www.mdpi.com/article/10.3390/colloids7040071/s1. Figure S1: A plot of the adhesion work W a of the aqueous solution of ET, RL, TX165 and the film pressure π vs. the logarithm of their concentration log C as well as adhesion work W a of solution vs. its surface tension ( γ L V ). Figure S2: A plot of the ϕ parameter for the aqueous solution of ET, RL and TX165 vs. the logarithm of their concentration log C . Figure S3: A plot of the surface concentration Γ calculated from the Frumkin equation for the aqueous solution of ET, RL and TX165 vs. the logarithm of their concentration log C . Figure S4: A plot of the values of C x s , x b x s and f b f s for the aqueous solution of ET vs. its concentration C ET . Figure S5: A plot of the values of C x s and f b f s for RL and TX165 vs. the logarithm of their concentration log C . Figure S6: A plot of the Gibbs standard free energy of adsorption Δ G a d s 0 calculated from Equation (17) for ET vs. its concentration C ET as well as for RL and TX165 vs. the logarithm of their concentration log C .

Author Contributions

Conceptualization, A.Z., K.S. and B.J.; methodology, A.Z., K.S. and B.J.; software, A.Z., K.S. and B.J.; validation, A.Z. and K.S.; formal analysis, A.Z., K.S. and B.J.; investigation, A.Z. and K.S.; resources, A.Z. and K.S.; data curation, A.Z., K.S. and B.J.; writing—original draft preparation, A.Z., K.S. and B.J.; writing—review and editing A.Z., K.S. and B.J., visualization, A.Z. and K.S.; supervision, B.J.; project administration, B.J. All authors have read and agreed to the published version of the manuscript.

Funding

This research received no external funding.

Data Availability Statement

Data are contained within the article and supplementary material.

Conflicts of Interest

The authors declare no conflict of interest.

References

  1. Rimola, A.; Costa, D.; Sodupe, M.; Lambert, J.-F.; Ugliengo, P. Silica surface features and their role in the adsorption of biomolecules: Computational modeling and experiments. Chem. Rev. 2013, 113, 4216–4313. [Google Scholar] [CrossRef] [PubMed]
  2. dos Santos da Silva, A.; Livotto, P.R.; dos Santos, J.H.Z. Hybrid silica as cues for understanding the role of water in dry zeolite synthesis. Appl. Surf. Sci. 2020, 508, 145305. [Google Scholar] [CrossRef]
  3. Hartmann, R.; Sirviö, J.A.; Sliz, R.; Laitinen, O.; Liimatainen, H.; Ämmälä, A.; Fabritius, T.; Illikainen, M. Interactions between aminated cellulose nanocrystals and quartz: Adsorption and wettability studies. Colloids Surf. Physicochem. Eng. Asp. 2016, 489, 207–215. [Google Scholar] [CrossRef]
  4. Deng, Y.; Wu, Q.; Li, Z.; Huang, X.; Rao, S.; Liang, Y.; Lu, H. Crystal face dependent wettability of a-quartz: Elucidation by time-of-flight secondary ion mass spectrometry techniques combined with molecular Dynamics. J. Colloid Interface Sci. 2022, 607, 1699–1708. [Google Scholar] [CrossRef] [PubMed]
  5. Mamaeva, V.; Sahlgren, C.; Lindén, M. Mesoporous silica nanoparticles in medicine—Recent advances. Adv. Drug Del. Rev. 2013, 65, 689–702. [Google Scholar] [CrossRef] [PubMed]
  6. Liu, F.; Yang, H.; Wang, J.; Zhang, M.; Chen, T.; Hu, G.; Zhang, W.; Wu, J.; Xu, S.; Wu, X. Salinity-dependent adhesion of model molecules of crude oil at quartz surface with different wettability. Fuel 2018, 223, 401–407. [Google Scholar] [CrossRef]
  7. Morrow, N. Wettability and its effect on oil recovery. J. Pet. Technol. 1990, 42, 1476–1484. [Google Scholar] [CrossRef]
  8. Saraji, S.; Goual, L.; Piri, M.; Plancher, H. Wettability of supercritical carbon dioxide/water/quartz systems: Simultaneous measurement of contact angle and interfacial tension at reservoir conditions. Langmuir 2013, 29, 6856–6866. [Google Scholar] [CrossRef]
  9. Al-Yaseri, A.Z.; Roshan, H.; Lebedev, M.; Barifcani, A.; Iglauer, S. Dependence of quartz wettability and fluid density. Geophys. Res. Lett. 2016, 43, 3771–3776. [Google Scholar] [CrossRef]
  10. Gao, S.; Ma, L.; Wei, D.; Shen, Y. Wettability of quartz particles at varying conditions on the basis of the measurement of relative wetting contact angles and their flotation behaviour. Physcicochem. Probl. Miner. Process. 2019, 55, 278–289. [Google Scholar]
  11. Platias, S.; Vatalis, K.I.; Charalampides, G. Suitability of quartz sands for different industrial applications. Procedia Econ. Financ. 2014, 14, 491–498. [Google Scholar] [CrossRef]
  12. Vatalis, K.I.; Charalambides, G.; Benetis, N.P. Market of high purity quartz innovative applications. Procedia Econ. Financ. 2015, 24, 734–742. [Google Scholar] [CrossRef]
  13. van Oss, C.J. Interfacial Forces in Aqueous Media; Marcel Dekker: New York, NY, USA, 1994. [Google Scholar]
  14. Jańczuk, B.; Zdziennicka, A. A study on the components of surface free energy of quartz from contact angle measurements. J. Mater. Sci. 1994, 29, 3559–3564. [Google Scholar] [CrossRef]
  15. Suzuki, T.; Sugihara, N.; Iguchi, E.; Teshima, K.; Oishi, S.; Kawasaki, M. Measurement of specific surface free energy of ruby and quartz single crystals using contact angle of liquids. Cryst. Res. Technol. 2007, 42, 1217–1221. [Google Scholar] [CrossRef]
  16. Suzuki, T.; Takahashi, K.; Kawasaki, M.; Kagami, T. Specific surface free energy of as-grown and polished faces of synthetic quartz. J. Cryst. Process Technol. 2014, 4, 177–184. [Google Scholar] [CrossRef]
  17. Zdziennicka, A.; Szymczyk, K.; Krawczyk, J.; Jańczuk, B. Some remarks on the solid surface tension determination from contact angle measurements. Appl. Surf. Sci. 2017, 405, 88–101. [Google Scholar] [CrossRef]
  18. Suzuki, T.; Kasahara, T. Determination of the specific surface free energy of natural quartz crystals using measurement of contact angle of liquid droplets. Cryst. Res. Technol. 2010, 45, 1305–1308. [Google Scholar] [CrossRef]
  19. Fowkes, F.M. Calculation of work of adhesion by pair potential summation. J. Colloid Interf. Sci. 1968, 28, 493–505. [Google Scholar] [CrossRef]
  20. Jańczuk, B.; Chibowski, E.; Białopiotrowicz, T. Time dependence wettability of quartz with water. Chem. Pap. 1986, 40, 349–356. [Google Scholar]
  21. Whalen, J.W. Thermodynamic properties of water adsorbed on quartz. J. Phys. Chem. 1961, 65, 1676–1681. [Google Scholar] [CrossRef]
  22. Staszczuk, P.; Jańczuk, B.; Chibowski, E. On the determination of the surface free energy of quartz. Mater. Chem. Phys. 1985, 12, 469–481. [Google Scholar] [CrossRef]
  23. Yang, J.; Meng, S.; Xu, L.F.; Wang, E.G. Ice tessellation on a hydroxylated silica surface. Phys. Rev. Lett. 2004, 92, 146102. [Google Scholar] [CrossRef]
  24. Sarubbo, L.A.; Silva, M.G.C.; Durval, I.J.B.; Bezerra, K.G.O.; Ribeiro, B.G.; Silva, I.A.; Twigg, M.S.; Banat, I.M. Biosurfactants: Production, properties, applications, trends, and general perspectives. Biochem. Eng. J. 2022, 18, 108377. [Google Scholar] [CrossRef]
  25. Drakontis, C.E.; Amin, S. Biosurfactants: Formulations, properties, and applications. Curr. Opin. Colloid Interface Sci. 2020, 48, 77–90. [Google Scholar] [CrossRef]
  26. Sharma, D.; Singh, D.; Singh, G.D.S.; Karamchandani, B.M.; Aseri, G.K.; Banat, I.M.; Satpute, S.K. Biosurfactants: Forthcomings and regulatory affairs in food based industries. Molecules 2023, 28, 2823. [Google Scholar] [CrossRef]
  27. Singh, P.; Cameotra, S.S. Potential applications of microbial surfactants in biomedical sciences. Trends Biotechnol. 2004, 22, 142–146. [Google Scholar] [CrossRef]
  28. Gomaa, E.Z. Antimicrobial and anti-adhesive properties of biosurfactant produced by lactobacilli isolates, biofilm formation and aggregation ability. J. Gen. Appl. Microbiol. 2013, 59, 425–436. [Google Scholar] [CrossRef]
  29. Rodrigues, L.; Banat, I.M.; Teixeira, J.; Oliveira, R. Biosurfactants: Potential applications in medicine. J. Antimicrob. Chemother. 2006, 57, 609–618. [Google Scholar] [CrossRef]
  30. Çelik, P.A.; Manga, E.B.; Çabuk, A.; Banat, I.M. Biosurfactants: Potential role in combating COVID-19 and similar future microbial threats. Appl. Sci. 2021, 11, 334. [Google Scholar] [CrossRef]
  31. Ribeiro, B.G.; Guerra, J.M.C.; Sarubbo, L.A. Biosurfactants: Production and application prospects in the food industry. Biotechnol. Prog. 2020, 36, 3030. [Google Scholar] [CrossRef]
  32. Mendes, A.N.; Filgueiras, L.A.; Pinto, J.C.; Nele, M. Physicochemical properties of rhamnolipid biosurfactant from Pseudomonas aeruginosa PA1 to applications in microemulsions. J. Biomater. Nanobiotechnol. 2015, 6, 64–79. [Google Scholar] [CrossRef]
  33. Abalos, A.; Pinazo, A.; Casals, M.R.; García, F.; Manresa, A. Physicochemical and antimicrobial properties of new rhamnolipids produced by Pseudomonas aeruginosa AT10 from soybean oil refinery wastes. Langmuir 2001, 17, 1367–1371. [Google Scholar] [CrossRef]
  34. Semkova, S.; Antov, G.; Illiev, I.; Tsoneva, I.; Lefterov, P.; Christova, N.; Nacheva, L.; Stoineva, I.; Kabaivanova, L.; Staneva, G.; et al. Rhamnolipid Biosurfactants—Possible natural anticancer agents and autophagy inhibitors. Separations 2021, 8, 92. [Google Scholar] [CrossRef]
  35. Mishra, S.; Lin, Z.; Pang, S.; Zhang, Y.; Bhatt, P.; Chen, S. Biosurfactant is a powerful tool for the bioremediation of heavy metals from contaminated soils. J. Hazard. Mater. 2021, 418, 126253. [Google Scholar] [CrossRef]
  36. Zdziennicka, A.; González-Martín, M.L.; Rekiel, E.; Szymczyk, K.; Zdziennicki, W.; Jańczuk, B. Thermodynamic characterization of rhamnolipid, triton x-165 and ethanol as well as their mixture behaviour at the water-air interface. Molecules 2023, 28, 4987. [Google Scholar] [CrossRef] [PubMed]
  37. Batıgöç, C.; Akba¸s, H.; Boz, M. Thermodynamics of non-ionic surfactant Triton X-100-cationic surfactants mixtures at the cloud point. J. Chem. Therm. 2011, 43, 11800–18003. [Google Scholar] [CrossRef]
  38. Zdziennicka, A.; Jańczuk, B. Modification of adsorption, aggregation and wetting properties of surfactants by short chain alcohols. Adv. Colloid Interface Sci. 2020, 284, 102249. [Google Scholar] [CrossRef]
  39. Pan, B.; Li, Y.; Xie, L.; Wang, X.; He, Q.; Li, Y.; Hejazi, S.H.; Iglauer, S. Role of fluid density on quartz wettability. J. Pet. Sci. Eng. 2019, 172, 511–516. [Google Scholar] [CrossRef]
  40. Vogel, A.I. Preparatyka Organiczna, WYD. 3; WNT: Warszawa, Poland, 2006. [Google Scholar]
  41. Zdziennicka, A.; Krawczyk, J.; Szymczyk, K.; Jańczuk, B. Components and parameters of liquids and some polymers surface tension at different temperature. Colloids Surf. Physicochem. Eng. Asp. 2017, 20, 864–875. [Google Scholar] [CrossRef]
  42. Rosen, M.J. Surfactants and Interfacial Phenomena, 3rd ed.; Wiley-Interscience: New York, NY, USA, 2004; pp. 34–178. [Google Scholar]
  43. Adamson, A.W.; Gast, A.P. Physical Chemistry of Surfaces, 6th ed.; Wiley Interscience: New York, NY, USA, 1997. [Google Scholar]
  44. Girifalco, L.A.; Good, R.J. A theory for the estimation of surface and interfacial energies I. Derivation and application to interfacial tension. J. Phys. Chem. 1957, 61, 904–909. [Google Scholar] [CrossRef]
  45. Li, D.; Neumann, A.W. Equation of state for interfacial tensions of solid-liquid systems. Adv. Colloid Interface Sci. 1992, 39, 299–345. [Google Scholar] [CrossRef]
  46. Kwok, D.Y.; Neumann, A.W. Contact angle measurement and contact angle interpretation. Adv. Colloid Interface Sci. 1999, 81, 167–249. [Google Scholar] [CrossRef]
  47. Kwok, D.Y.; Neumann, A.W. Contact angle interpretation in terms of solid surface tension. Colloids Surf. Physicochem. Eng. Asp. 2000, 161, 31–48. [Google Scholar] [CrossRef]
  48. Owens, D.K.; Wendt, R.C. Estimation of the surface free energy of polymers. J. Appl. Polym. Sci. 1969, 13, 1741–1747. [Google Scholar] [CrossRef]
  49. van Oss, C.J.; Good, R.J. Surface tension and the solubility of polymers and biopolymers: The role of polar and apolar interfacial free energies. J. Macromol. Sci. 1989, 26, 1183–1203. [Google Scholar] [CrossRef]
  50. van Oss, C.J.; Chaudhury, M.K.; Good, R.J. Monopolar surfaces. Adv. Colloid Interface Sci. 1987, 28, 35–64. [Google Scholar] [CrossRef]
  51. van Oss, C.J.; Good, R.J.; Chaudhury, M.K. Additive and nonadditive surface tension components and the interpretation of contact angles. Langmuir 1988, 4, 884–891. [Google Scholar] [CrossRef]
  52. Good, R.J.; van Oss, C.J. The modern theory of contact angles and the hydrogen bond components of surface energies. In Theory and Applications; Schrader, M.E., Loeb, G., Eds.; Plenum Press: New York, NY, USA, 1991. [Google Scholar]
  53. Jańczuk, B.; Wójcik, W.; Zdziennicka, A. Determination of the components of the surface tension of some liquids from interfacial liquid—Liquid tension measurements. J. Colloid Interface Sci. 1993, 157, 384–393. [Google Scholar] [CrossRef]
  54. Zdziennicka, A.; Szymczyk, K.; Krawczyk, J.; Jańczuk, B. Activity and thermodynamic parameters of some surfactants adsorption at the water–air interface. Fluid Phase Equilibria 2012, 318, 25–33. [Google Scholar] [CrossRef]
  55. Mańko, D.; Zdziennicka, A.; Jańczuk, B. Thermodynamic properties of rhamnolipid micellization and adsorption. Colloids Surf. B Biointerfaces 2014, 119, 22–29. [Google Scholar] [CrossRef]
  56. van Oss, C.J.; Constanzo, P.M. Adhesion of anionic surfactants to polymer surfaces and low-energy materials. J. Adhes. Sci. Technol. 1992, 4, 477–487. [Google Scholar] [CrossRef]
  57. Chodzińska, A.; Zdziennicka, A.; Jańczuk, B. Volumetric and surface properties of short chain alcohols in aqueous solution-air systems at 293K. J. Sol. Chem. 2012, 41, 2226–2245. [Google Scholar] [CrossRef] [PubMed]
Figure 1. The values of γ SV (curves 1 and 2 as well as lines 3–5), γ SV LW (line 6), γ SV d (line 6), γ SV n (lines 7 and 8), γ SV AB (line 9), γ SV + (line 10) and γ SV (line 11) for quartz. Curves 1 and 2 are γ SV values calculated from Equation (3) based on the contact angle for W, F and D against their surface tension and LW component of this tension, respectively. Lines 3 and 4 are γ S V values calculated from Equation (4) based on the contact angle of W and D as well as F and D, respectively. Line 5 is the value of γ SV calculated from Equation (5) based on the contact angle of W, F and D. Line 6 are the values of γ SV LW and γ SV d calculated from Equations (4) and (5), respectively. Lines 7 and 8 are the γ SV n values calculated from Equation (4) based on the contact angle W and D as well as F and D respectively. Line 9 is the γ SV AB value calculated based on Equation (5) γ SV AB = 2 γ SV + γ SV . Line 10 is γ SV + value calculated from Equation (5) and line 11 is γ SV calculated from the same equation.
Colloids 07 00071 g001
Figure 2. A plot of the contact angle θ for the aqueous solution of ethanol ((a), curve 1), rhamnolipid ((b), curve 2) and Triton X-165 ((b), curve 3) on the quartz surface vs. the logarithm of their concentration log C .
Colloids 07 00071 g002
Figure 3. A plot of the cosine of the contact angle cos θ for the aqueous solution of ethanol (curve 1), rhamnolipid (curve 2) and Triton X-165 (curve 3) vs. the reciprocal of their solution surface tension 1 γ LV .
Colloids 07 00071 g003
Figure 4. A plot of the quartz surface tension γ SV calculated from the Neumann equation (Equation (3)) based on the contact angle of aqueous solution of ethanol ((a), curve 1), rhamnolipid ((b), curve 2) and Triton X-165 ((b), curve 3) vs. the logarithm of their concentration ( log C ) as well as the value of quartz surface tension calculated from the van Oss et al. equation (Equation (5)) based on the contact angle for water, diiodomethane and formamide (line 4).
Colloids 07 00071 g004
Figure 5. A plot of the film pressure π for aqueous solution of ethanol ((a), curves 1, 1′ and 1″), rhamnolipid ((b), curve s 2, 2′ and 2″) and Triton X-165 ((b), curves 3, 3′ and 3″) vs. the logarithm of their concentration log C . Curves 1, 2 and 3— π = Δ γ SV , curves 1′, 2′ and 3′— π = Δ W a , curves 1″, 2″ and 3″— π = γ W γ LV 2 .
Colloids 07 00071 g005
Figure 6. A plot of the contact angle ( θ ) of aqueous solutions of ET (curve 1), RL (curve 3) and TX165 (curve 3) vs. the surface tension of solution ( γ LV ) (a), the surface tension of quartz covered by the mixed layer ( γ SV ) (b) and the ratio of surface tension of quartz covered by the mixed layer to the solution surface tension ( γ SV / γ LV ) (c).
Colloids 07 00071 g006
Table 1. The contact angle of water ( θ W ), formamide ( θ F ) and diiodomethane ( θ D ) on quartz surface as well as the components and parameters of quartz surface tension ( γ SV ) determined using, Neumann et al., van Oss et al.as well as Owens and Wendt equations.
Contact angle on the quartz surface
θ W θ F θ D
57.0137.2343.00
Surface   tension   of   quartz   ( γ SV ) and is Lifshitz-van der Waals ( γ SV LW ) (dispersion ( γ SV d ) and acid-base ( γ SV AB ) (non-dispersion ( γ SV n )) components as well as electron-acceptor ( γ SV + ) and electron-donor ( γ SV ) parameters of γ SV AB
γ SV γ SV LW or γ SV d γ SV AB or γ SV n γ SV + γ SV
Equation (3)49.30 (W) 47.90 (F) 39.25 (D)
Equation (4)
D-W
41.5338.073.46
Equation (4)
D-F
41.3338.073.26
Equation (5)47.7038.079.631.6114.36
Parameter   of   interactions   across   quartz - liquid   interface   ϕ
γ SV
Equation (3)
Q-WQ-FQ-D
0.954040.990330.89334
γ SV
Equation (5)
0.938430.988260.98481
γ SV
Equation (4)
1.022451.063920.95740
0.95971
Γ max ETRLTX165
Q-AQ-SQ-AQ-SQ-AQ-S
7.91 × 10−67.91 × 10−61.17 × 10−60.55 × 10−60.99 × 10−60.53 × 10−6
Disclaimer/Publisher’s Note: The statements, opinions and data contained in all publications are solely those of the individual author(s) and contributor(s) and not of MDPI and/or the editor(s). MDPI and/or the editor(s) disclaim responsibility for any injury to people or property resulting from any ideas, methods, instructions or products referred to in the content.

