Article

Recyclable Adsorbents for Potash Brine Desalination Based on Silicate Powder: Application, Regeneration and Utilization

by
Akmaral B. Rakhym
1,2,
Zarina Ye. Baranchiyeva
1,2,
Aruzhan K. Kenessova
1,2,
Bagashar B. Zhaksybai
1,2,
Diana N. Dauzhanova
1,2,
Yitzhak Mastai
3 and
Gulziya A. Seilkhanova
1,2,*
1
Faculty of Chemistry and Chemical Technology, Al-Farabi Kazakh National University, Almaty 050040, Kazakhstan
2
Center of Physical Chemical Methods of Research and Analysis, Al-Farabi Kazakh National University, Almaty 050012, Kazakhstan
3
Department of Chemistry and the Institute of Nanotechnology and Advanced Materials, Bar-Ilan University, Ramat-Gan 5290002, Israel
*
Author to whom correspondence should be addressed.
Colloids Interfaces 2023, 7(4), 61; https://doi.org/10.3390/colloids7040061
Submission received: 7 August 2023 / Revised: 21 September 2023 / Accepted: 28 September 2023 / Published: 11 October 2023

Abstract

:
Silicate mineral powders (SMP) from weathered granite soil from Kazakhstan are proposed for the desalination of potash brines containing sodium, potassium and chloride ions. Batch adsorption experiments using acid-treated silicate (AS) achieved a Na+/K+/Cl recovery of ~13/28/6 mg/g. An isothermal study best fitted the Freundlich and Dubinin–Radushkevich models for Na+ and K+/Cl. The kinetic data were best modeled by pseudo-second-order kinetics for Na+/K+ and pseudo-first-order for Cl. Thermodynamic calculations showed spontaneity under natural conditions. For Na+/K+, physisorption is accompanied by ion exchange. To study the possibility of sorbent reuse, several cycles of K+/Na+ adsorption–desorption were carried out under optimal conditions. AS selectively adsorbed potassium ions, maintaining a high effectiveness during five cycles providing K-form silicate fertilizers. Leachates of spent AS contain high concentrations of K/Na/Ca/Mg and other microelements essential for plants. Thus, SMP resolve two issues: the desalination of brine and the provision of fertilizer.

1. Introduction

Potash fertilizers are among the most common fertilizers, along with nitrate and phosphate fertilizers, as these elements are crucial for plants [1]. Raw materials for their production are extracted during potash mining, which produces significant amounts of potash brine [2] that is largely composed of Na+, K+ and Cl [3]. Concentrated potash brines lead to soil degradation, disturb biogeochemical cycling, induce infrastructure corrosion and can render groundwater unsuitable for beneficial use [4,5]. On the other hand potash brines are considered to be resources for extracting various trace elements [6,7,8,9,10], in the so-called “from waste to wealth” approach.
For the purification of saline solutions, the most effective large-scale formats are thermal distillation and membrane desalination [11,12]. Primary thermal technologies include multi-stage flash, multiple effect distillation and vapor compression distillation, whereas membrane-based processes include reverse osmosis, nanofiltration and electrodialysis [11]. However, even large-scale plants produce rejected brine that can be considered a source of microelements for different applications, including in agriculture [13,14,15], the production of construction materials [16,17] and in metal recovery [18].
Industrial brine eco-desalination using adsorbents [19] can greatly reduce salinity by repeating the flow of water into the sorbent material. This approach has received significant attention. Zeolites [20,21,22], kaolinite [23,24,25], magnetite [25], graphene [26,27], coal-based materials [28] and resins [27,29,30,31] are widely used for Na+ and K+ removal. Adsorbents produce a large amount of waste that needs to be disposed. The possibility of regeneration and reuse was studied [22,32]; however, sorbents become ineffective after several adsorption–desorption cycles, forming K or Na saturated minerals. K-loaded silicates were considered to be a slow-release fertilizer and nutrient-retaining soil amendment [33].
Low-grade silicate mineral powders (SMP) were suggested as value-added natural potash fertilizers in deeply weathered tropical soil [34]. SMP are rich in minerals such as mica, feldspar, basalt and glauconite that contain significant amounts of K (5–12%), with high potential for use as fertilizer [35]. However, silicate minerals are considered less effective plant K suppliers on the timescale of crop production as they contain lower amounts of readily available K than commercial fertilizers [35]. Therefore, it makes sense to saturate them with more available exchangeable potassium via the adsorption of K+ ions from potash brines. Thus, SMP treatment of industrial potash solutions resolves two issues: the adsorption of saline ions and economical K-loaded forms of minerals for use as fertilizers.
Here, SMP from weathered granite soil was studied for the adsorption of the main salinity ions, Na+/K+/Cl. This abundant soil, typical to a large region of Kazakhstan, is nearly unused. The aim of this research was to obtain a cheap adsorbent based on SMP through acid activation, which is effective for potash brine desalination. The practical application of the obtained results involves the simplification of the process of sorbent synthesis while reducing the cost of separating minerals, as well as the consumption of disposal by reusing the soil saturated with trace elements as fertilizer. Two issues are thus addressed—brine desalination by abundant SMP and its regeneration and utilization for fertilization.

2. Materials and Methods

2.1. Materials and Chemicals

The silicate powder used in this work was collected near Kyzylsok clay deposit (Uzunagash village, Almaty region, Kazakhstan). Analytical grade HNO3, NaCl, KCl, NH4Cl, HCl, NaNO3 and acetate-ammonium buffer (pH = 4.18) were purchased from Sigma Aldrich (Hamburg, Germany). Experiments were carried out using demineralized water.

2.2. Adsorbent Preparation

The silicate sample was ground in a porcelain mortar to obtain homogeneous powder, sieved down to less than 100 μm, rinsed with deionized water to remove dust and dried in an oven at 100 °C for 24 h. The cleaned and dried silicate powder was mixed with 0.1, 0.5, 1, 2 or 5 M HNO3 solution at a solid–liquid ratio of 1:50 and stirred for 24 h at 250 rpm and at room temperature. Solids were separated using vacuum filtration, rinsed with deionized water until pH ≈ 7, dried in an oven at 100 °C for 24 h and mixed thoroughly, and are denoted as “acid-treated silicate” (AS). Acid treatment was carried out to remove impurities as well as to saturate the surface of minerals with protons for efficient ion exchange with sodium and potassium. Nitrates are also used as fertilizers, and therefore nitric acid was chosen.

2.3. Adsorbent Characterization

A FEI Quanta 3D 200i Dual Beam system (Hillsboro, OG, USA) was used to study the morphology and perform elemental analysis using energy dispersive X-ray spectroscopy (EDAX). X-ray diffraction (XRD) patterns of the samples were investigated in the 2θ range of 3–90° at a step size of 0.02° using a DRON-4 diffractometer (Saint Petersburg, Russia) with a K-beta filter at 40 kV and 15 mA. Phases were identified using the international diffraction data file ICDD 2016 and analyzed using the PCPDFWIN, Search-Match and EVA programs with the PDF-2 diffraction database. Semi-quantitative analysis was carried out using corundum numbers according to the Chung method [36].
FTIR spectra were obtained with a Perkin Elmer Spectrum 65 spectrometer (Waltham, MA, USA) using the KBr method in the IR region of 4000–400 cm−1 at 4 cm−1 resolution. The specific surface area and pore volume were determined using a Quantachrome Nova 4200e device (Boynton Beach, FL, USA) by nitrogen sorption to its relative pressure of 0.2 atm at −196 °C. The samples were outgassed in vacuum at 120 °C for 2 h.
The point of zero charge (PZC) was determined by the addition of salt [37]: 0.2 g of sample was added to 40.0 mL of 0.1 M NaNO3 solution in a series of 50 mL centrifuge tubes. The pH was adjusted with 0.1 M HNO3 and 0.1 M NaOH to values of 2, 3, 4, …, 10 and 11 (±0.1), denoted as pHi. The samples were shaken for 24 h using an Ecros PE-6500 lab shaker (Saint Petersburg, Russia) at 200 vibrations per minute. After settling, the pH values of the supernatant in each tube were measured and denoted as pHf. The PZC was obtained from the plot of ΔpH (=pHf − pHi) against pHi. Experiments were performed in triplicate.
The cation exchange capacity (CEC) was determined using the standard NH4Cl method [38]: 1 g of sample was mixed with 100 mL of 1 M NH4Cl solution. Suspensions were left for 24 h with periodic shaking and centrifuged, and concentrations of Ca2+, Mg2+, Na+ and K+ were determined using a Shimadzu 6200 atomic absorption spectrometer (Kyoto, Japan). The CEC was calculated by adding the concentrations of the released cations and expressed in meq/100 g using the following equation:
CECmeq/100g = (Cppm/eq.wt.) × 10
where Cppm and eq.wt. are the concentration (mg/L) and equivalent weight (g/eq) of the released cation, and 10 is a correction factor considering the mass of the sample and the volume of the solution.
The possible ion exchange reactions during CEC determination tests are:
yNH4+ + xMen+-silicate → xMen+ + yNH4+-silicate
where x, y are stoichiometric coefficients, and Men+ are Na+, K+, Ca2+ or Mg2+. The total CEC is determined as a sum of CECs by each cation.

2.4. Evaluation of Adsorption Performance

Adsorption experiments under ambient conditions were performed using the batch technique. A weighed amount of adsorbent was mixed with KCl or NaCl solutions (10–5000 mg/L) and mixed for 24 h using a magnetic stirrer at 200 rpm. The suspensions were centrifuged at 6000 rpm and supernatants were separated for analysis. The pH was maintained by the addition of HNO3/NaOH for KCl solutions and HNO3/KOH for NaCl solutions to retain the prepared concentrations. The measurement of the exact concentration of the initial solutions was carried out after adjusting the pH.
To study kinetics, aliquots were taken at intervals during the process. To study thermodynamic parameters, adsorption was performed at 25–55 °C. All experiments were repeated in triplicate. Initial and equilibrium ion concentrations were determined using an I-160-MI (И-160-MИ, Moscow, Russia) ionometer with ion-selective electrodes or a Shimadzu-6200 atomic adsorption spectrometer.
The following equations were used for all studied systems:
E = C 0 C e q C 0 × 100 %
q e = C 0 C e q m × V
where E is the extraction degree (%), qe is the amount of adsorbed compound (mg/g), C 0 and C e q are the initial and equilibrium concentration (mg/L), V is the volume (L) and m is the mass of the adsorbent (g).

2.5. Adsorbent Regeneration and Recycling Study

To evaluate the regeneration of the adsorbent, desorption experiments were performed. A weighed amount of the used adsorbent was mixed with a certain volume of HNO3 solution (0.01–0.1 M) for 24 h at 200 rpm using an orbital shaker. The suspensions were centrifuged at 6000 rpm and supernatants were separated for analysis. Desorption values (D, mg/g) were calculated as follows:
D = C × V m
where C is the concentration of desorbed ion (mg/L), V is the volume of acid solution (L) and m is the mass of the adsorbent (g).
The adsorption–desorption experiments were conducted in triplicate using AS adsorbent and model K+/Na+ solutions. In the adsorption step, ions were removed from the solution at previously determined optimum conditions: 10 g of AS was mixed with 1 L of 1000 mg/L solution of Na/KCl at 200 rpm for 3 h at room temperature. The adsorbed amount was determined and the sample was regenerated at previously determined optimum conditions: 10 g of spent AS sample was mixed with 500 mL of 0.05 M HNO3 solution at 200 rpm for 2 h at room temperature and the solid was separated using vacuum filtration, rinsed with water and oven-dried at 100 °C overnight. The concentrations of desorbed Na+ and K+ in the regeneration filtrate were determined using atomic adsorption spectrometry (AAS), as well as the net uptake of both ions by the adsorbent after each cycle. Five cycles of adsorption/desorption were carried out, generating K-form silicate. The leaching test was then performed using the spent AS. Microelements (Na, K, Ca, Mg, Mn, Cu, Fe, Pb) leached from 10 g of AS after five cycles in 4.8 M acetate-ammonium buffer at a solid/liquid ratio of 1:10 were measured.

2.6. Theory and Calculations

Isothermal Adsorption Modeling

For describing the adsorption process isotherm models are of great importance. They show how ions are distributed between the adsorbent and the liquid phase in equilibrium depending on the concentration. Adsorption isotherms were calculated according to the most popular models: Langmuir, Freundlich, Temkin and Dubinin–Radushkevich. Non-linear fits were performed using Python 3 code.
The Langmuir model was developed assuming monolayer adsorption on a homogeneous surface where each molecule has constant enthalpy and sorption activation energy without interaction between adsorbed molecules [39]. The Langmuir model follows the equation below:
q e = k L C e q m a x 1 + k L C e
where k L   is the Langmuir constant and q m a x is the maximum adsorption capacity (mg/g).
The Freundlich model assumes that adsorption occurs on a heterogeneous surface with interaction between adsorbed molecules. The model is not restricted to a monolayer, so it can be applied to multilayer adsorption. The adsorption energy is not constant, but decreases exponentially [40]. The Freundlich model corresponds to the following equation:
q e = k f C e 1 / n
where k f is the Freundlich constant.
The Temkin model was established based on the assumption that the decrease in the heat of adsorption of all molecules in the surface layer is linear and the adsorption is characterized by a uniform distribution of binding energies [41]. The Temkin model follows the equation below:
q e = B t ln A t C e   with   B t = R T b t
where A t is the equilibrium binding constant, R is the universal gas constant (8.314 J/mol∙K) and b t is the Temkin constant.
The Dubinin–Radushkevich model expresses the adsorption mechanism with Gaussian energy distribution on a heterogeneous surface [42]. The Dubinin–Radushkevich model corresponds to Equation (8):
q e = q S exp β ε 2 ,   ε = R T ln 1 + 1 C e
where q S is the theoretical saturation capacity of the isotherm (mg/g), β   is the Dubinin–Radushkevich constant and ε is the Polyani potential (J/mol).

3. Results and Discussion

3.1. The Effect of Acid Activation on the Adsorption Efficiency of Silicate

The desalination ability of the studied sample was tested by the adsorption of Na+, K+ and Cl.
The activation of S with 1 M acid led to an increase in the extraction degree (E, %) of salinity ions at C0 = 100 mg/L from 15.1 to 22.1, 16.2 to 38.1 and 7.2 to 14.6 for Na+, K+ and Cl, respectively (
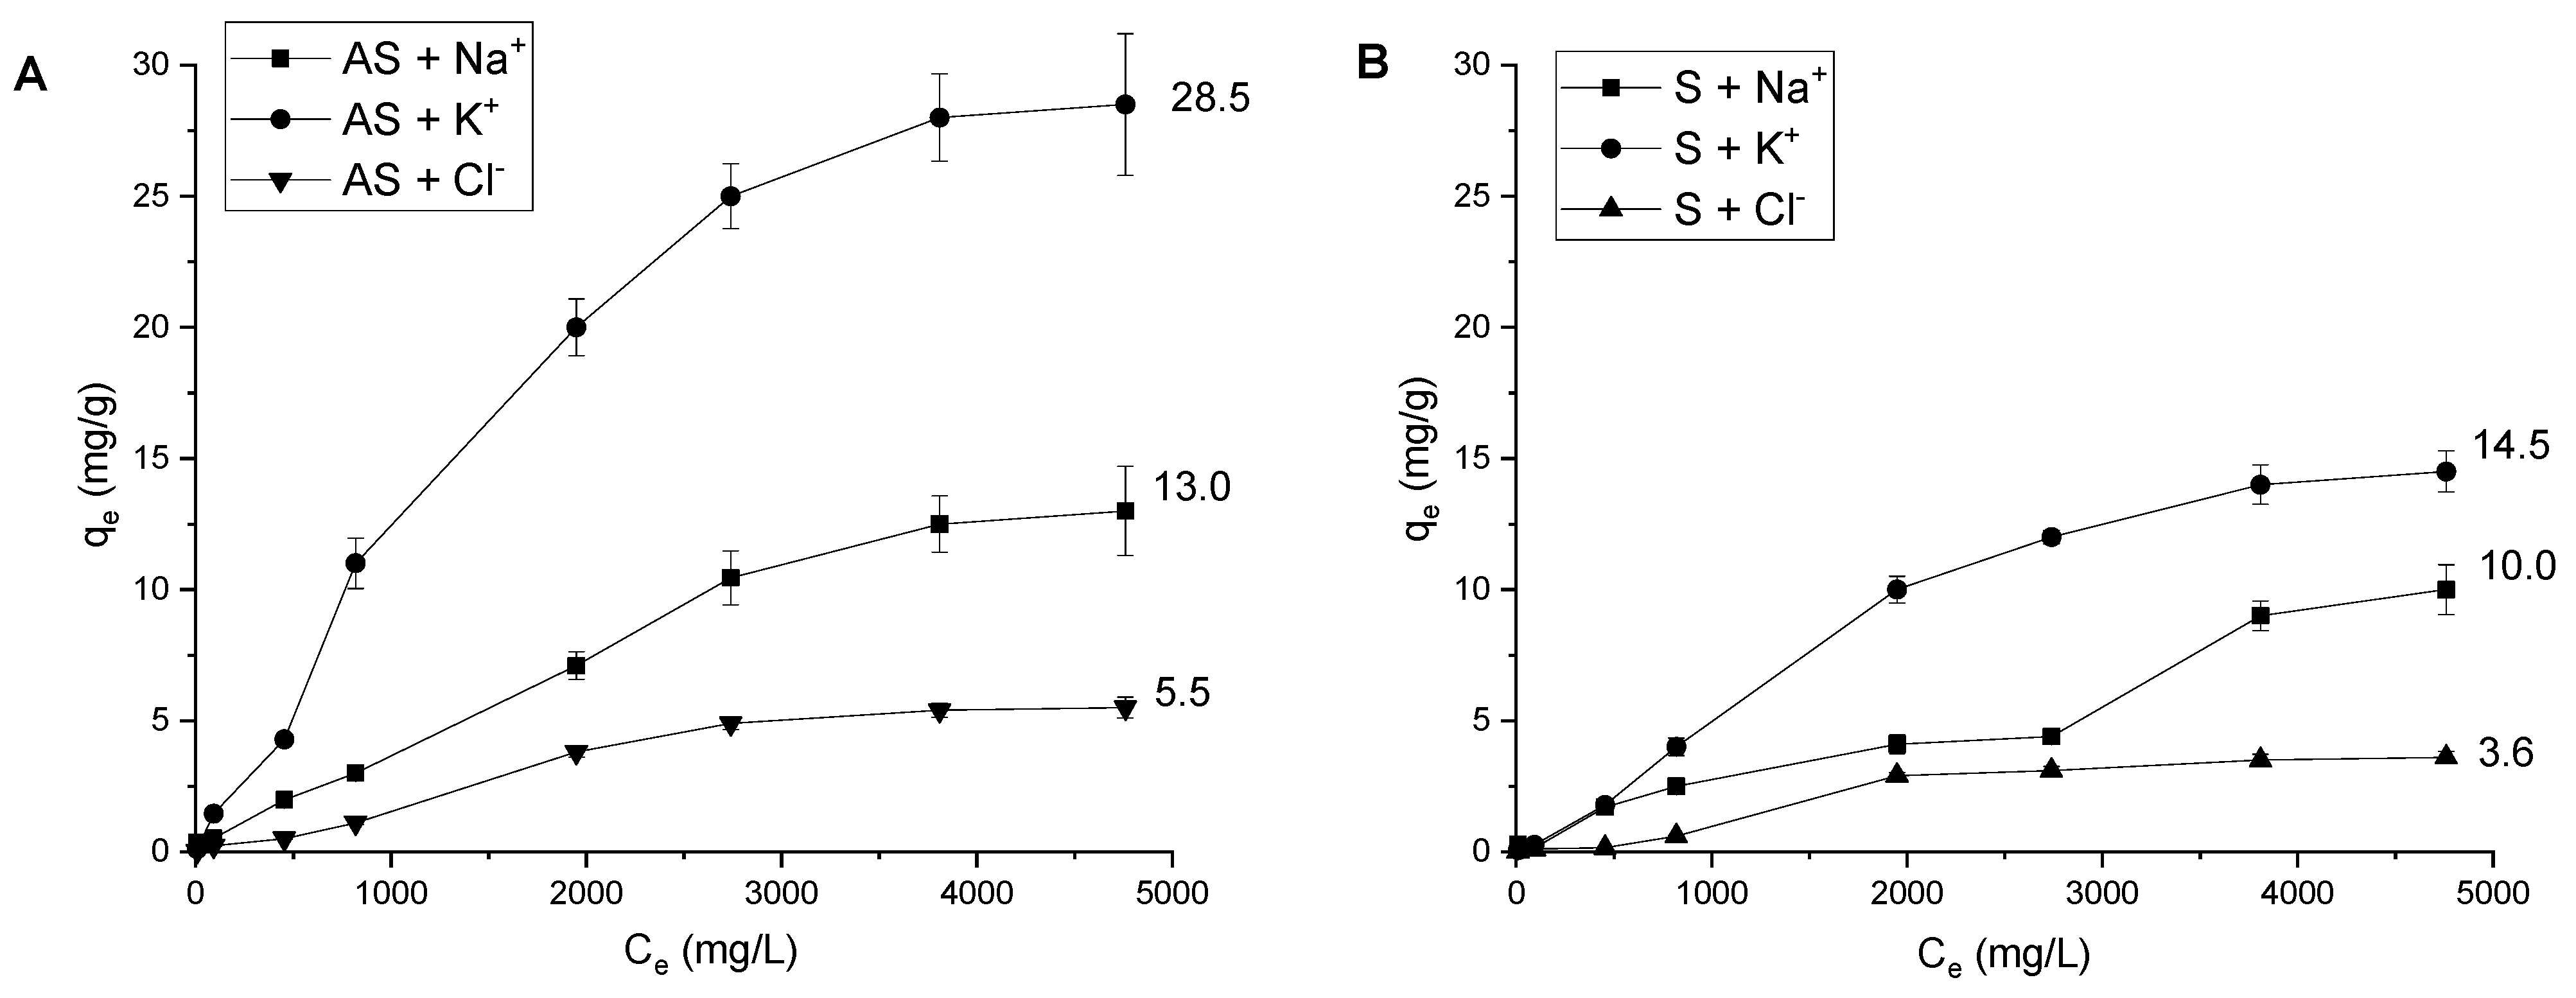
Table 1). Acid activation increased the maximum adsorption capacity (qmax) from 10.0 to 13.0 mg/g for Na+, from 14.5 to 28.5 mg/g for K+ and from 3.5 to 5.5 mg/g for Cl ions.
The assumed mechanism of interaction with the clay was ion exchange for the cations and conjugation/complexation with cations for chloride. Notably, among the three ions the extraction of K+ was the greatest. This is most likely because the potassium ion is larger than the sodium ion [43] and is better attracted by the excess negative charge on the silicate surface. Also, the authors of Ref. [32] found that when studying potassium desorption from zeolite, most of it was transferred to the next adsorption desorption cycle. Hence, K+ was more firmly attached to the sorbent, while sodium was desorbed back. Sodium enters ion exchange reactions more easily [44], and part of it reacted back with hydrogen ions.
The obtained sorbent was compared with other sorbents used for similar purposes in Table 2. Compared to other silicates (clays, zeolites), AS showed a more efficient adsorption of Na+ and K+ (13 and 28.5 mg/g, respectively). Carbon materials exhibited the highest sorption capacity: graphene oxide (830 mg/g for Na+) [45] and carbon material from sewage sludge (84 and 72 mg/g for Na+ and K+, respectively) [46]. A few studies covering the adsorption of chlorides were reported [32,47]. AS showed a chloride adsorption of 5.5 mg/g, higher than hydrotalcite (0.95 mg/g) [47] but significantly lower than layered-double-hydroxide (122.2 mg/g) [32]. Thus, acid-activated S had average adsorption rates of Na+, K+ and Cl ions. However, the process of synthesis and the activation of superior materials is much more resource-intensive than obtaining the sorbent proposed in this work.
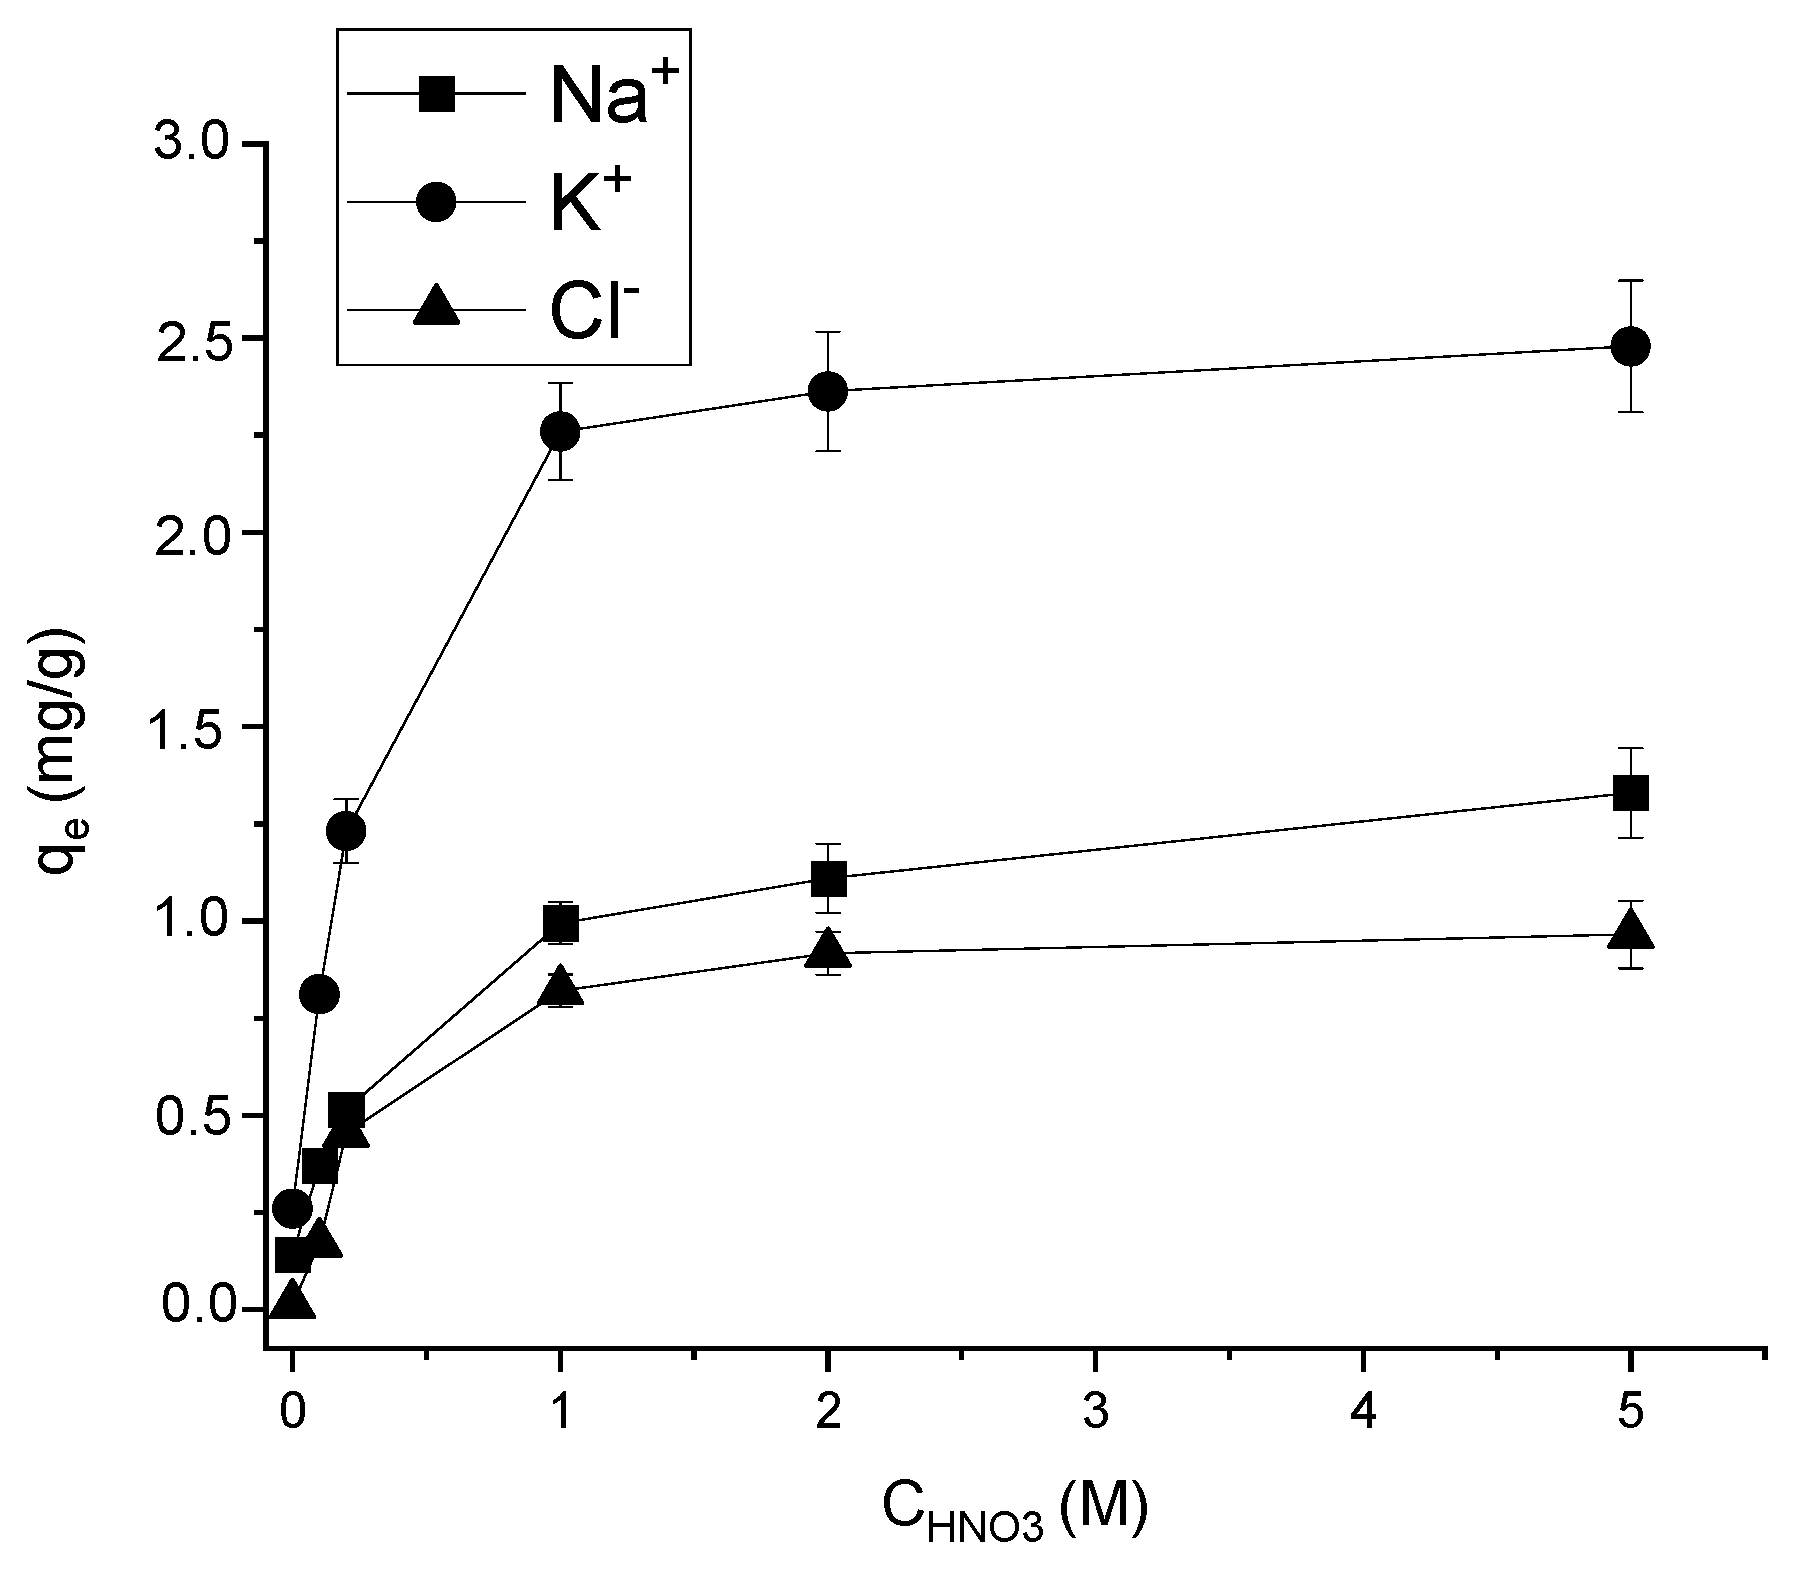
The concentration of acid used for the activation of the silicate is an important factor affecting the adsorption properties of the materials, as well as the cost of the obtained sorbent. The concentration of nitric acid varied from 0.1 to 5 mol/L (Figure 1). An increase in the acid concentration to 1 mol/L significantly raised the adsorption efficiency towards all studied ions. For example, even the lowest amount of acid (0.1 mol/L) increased qe by Na+ ions from 0.14 to 0.37 mg/g. This may indicate a partial dissolution of the components that interfere with the adsorption of ions, as well as an increase in porosity and the specific surface after the interaction of the clay with acid. The concentration sufficient for the most effective improvement of the sorption activity of clay in relation to the studied ions was 1 mol/L. The use of concentrations >1 mol/L was thus economically unfeasible.

3.2. The Effect of Acid Activation on the Characteristics of Silicate

The mineral composition of the sample obtained using XRD analysis is presented in Figure 2 and Table 3 (the detailed peak list is given in Table S1 in the Supporting Information).
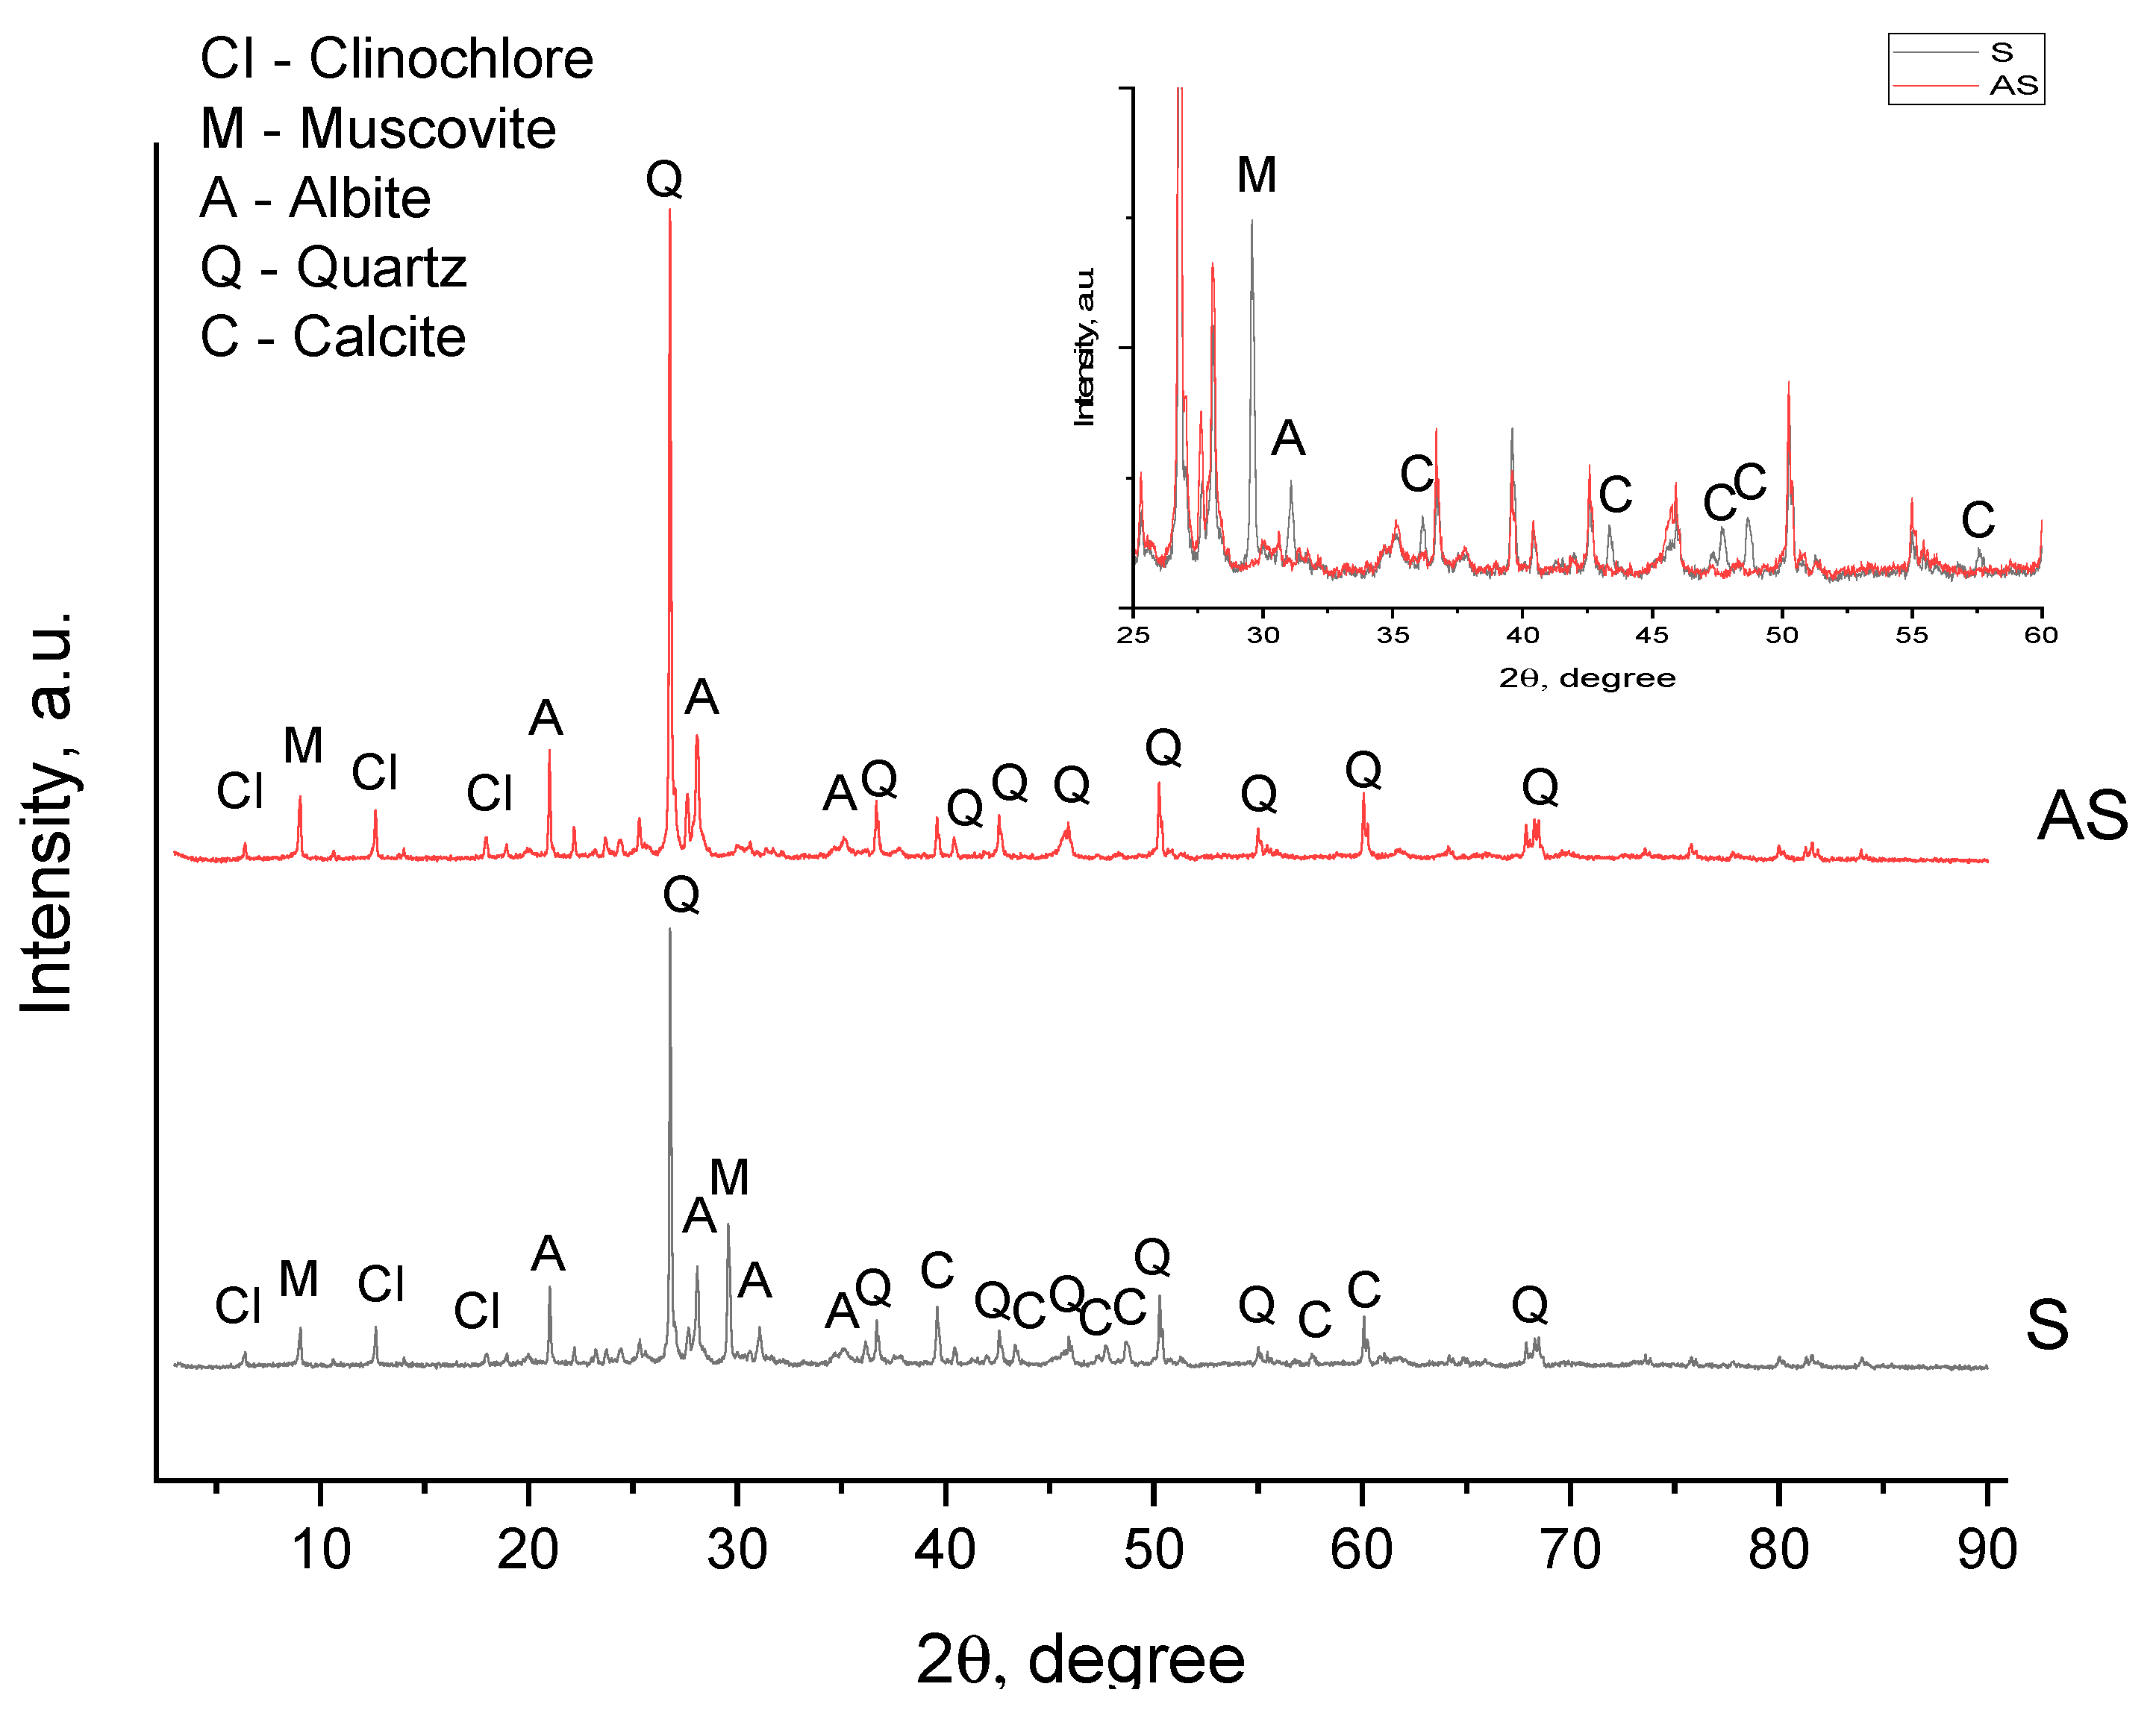
The sample consists mainly of silica in the form of quartz (47.11%), with 20.02% feldspar in the form of albite, 16.37% calcite, 9.42% muscovite and 7.07% of the zeolitic mineral clinochlore ferroan. After acid treatment, the contents of calcite and muscovite decreased to 13.44% and 2.96%, respectively. The intensity of all calcite peaks decreased, and some peaks disappeared (Table S1) at 2θ of 47.3, 47.7, 56.8, 57.6 and 64.8 degrees. It should be noted that during the interaction of the sample with acid, gas bubbles were observed which were most likely carbon dioxide formed as a result of the following reaction:
C a C O 3 + 2 H + C a 2 + + H 2 O + C O 2
The muscovite peaks at 18.4, 25.6, 32.2 and 34.7 degrees disappeared, indicating the partial dissolution of the mineral [49]:
K A l 2 S i 3 A l O 10 ( O H ) 2 + 10 H + K + + 3 A l 3 + + 3 S i ( O H ) 4
As for albite, we noticed an increase in the intensity of most of the peaks, which was possibly due to the dissolution of some amorphous impurities and the increased crystallinity of the sample [44,50]. However, the disappearance of peaks in the 2θ region of 30–33° and 41–43° was observed, which indicated a partial dissolution of albite according to the reaction [51]:
N a A l S i 3 O 8 + 4 H + + 4 H 2 O N a + + A l 3 + + 3 S i ( O H ) 4
For clinochlore and quartz, an increase in the intensity of most characteristic peaks was observed, which was associated with an increase in silicate crystallinity due to acid treatment.
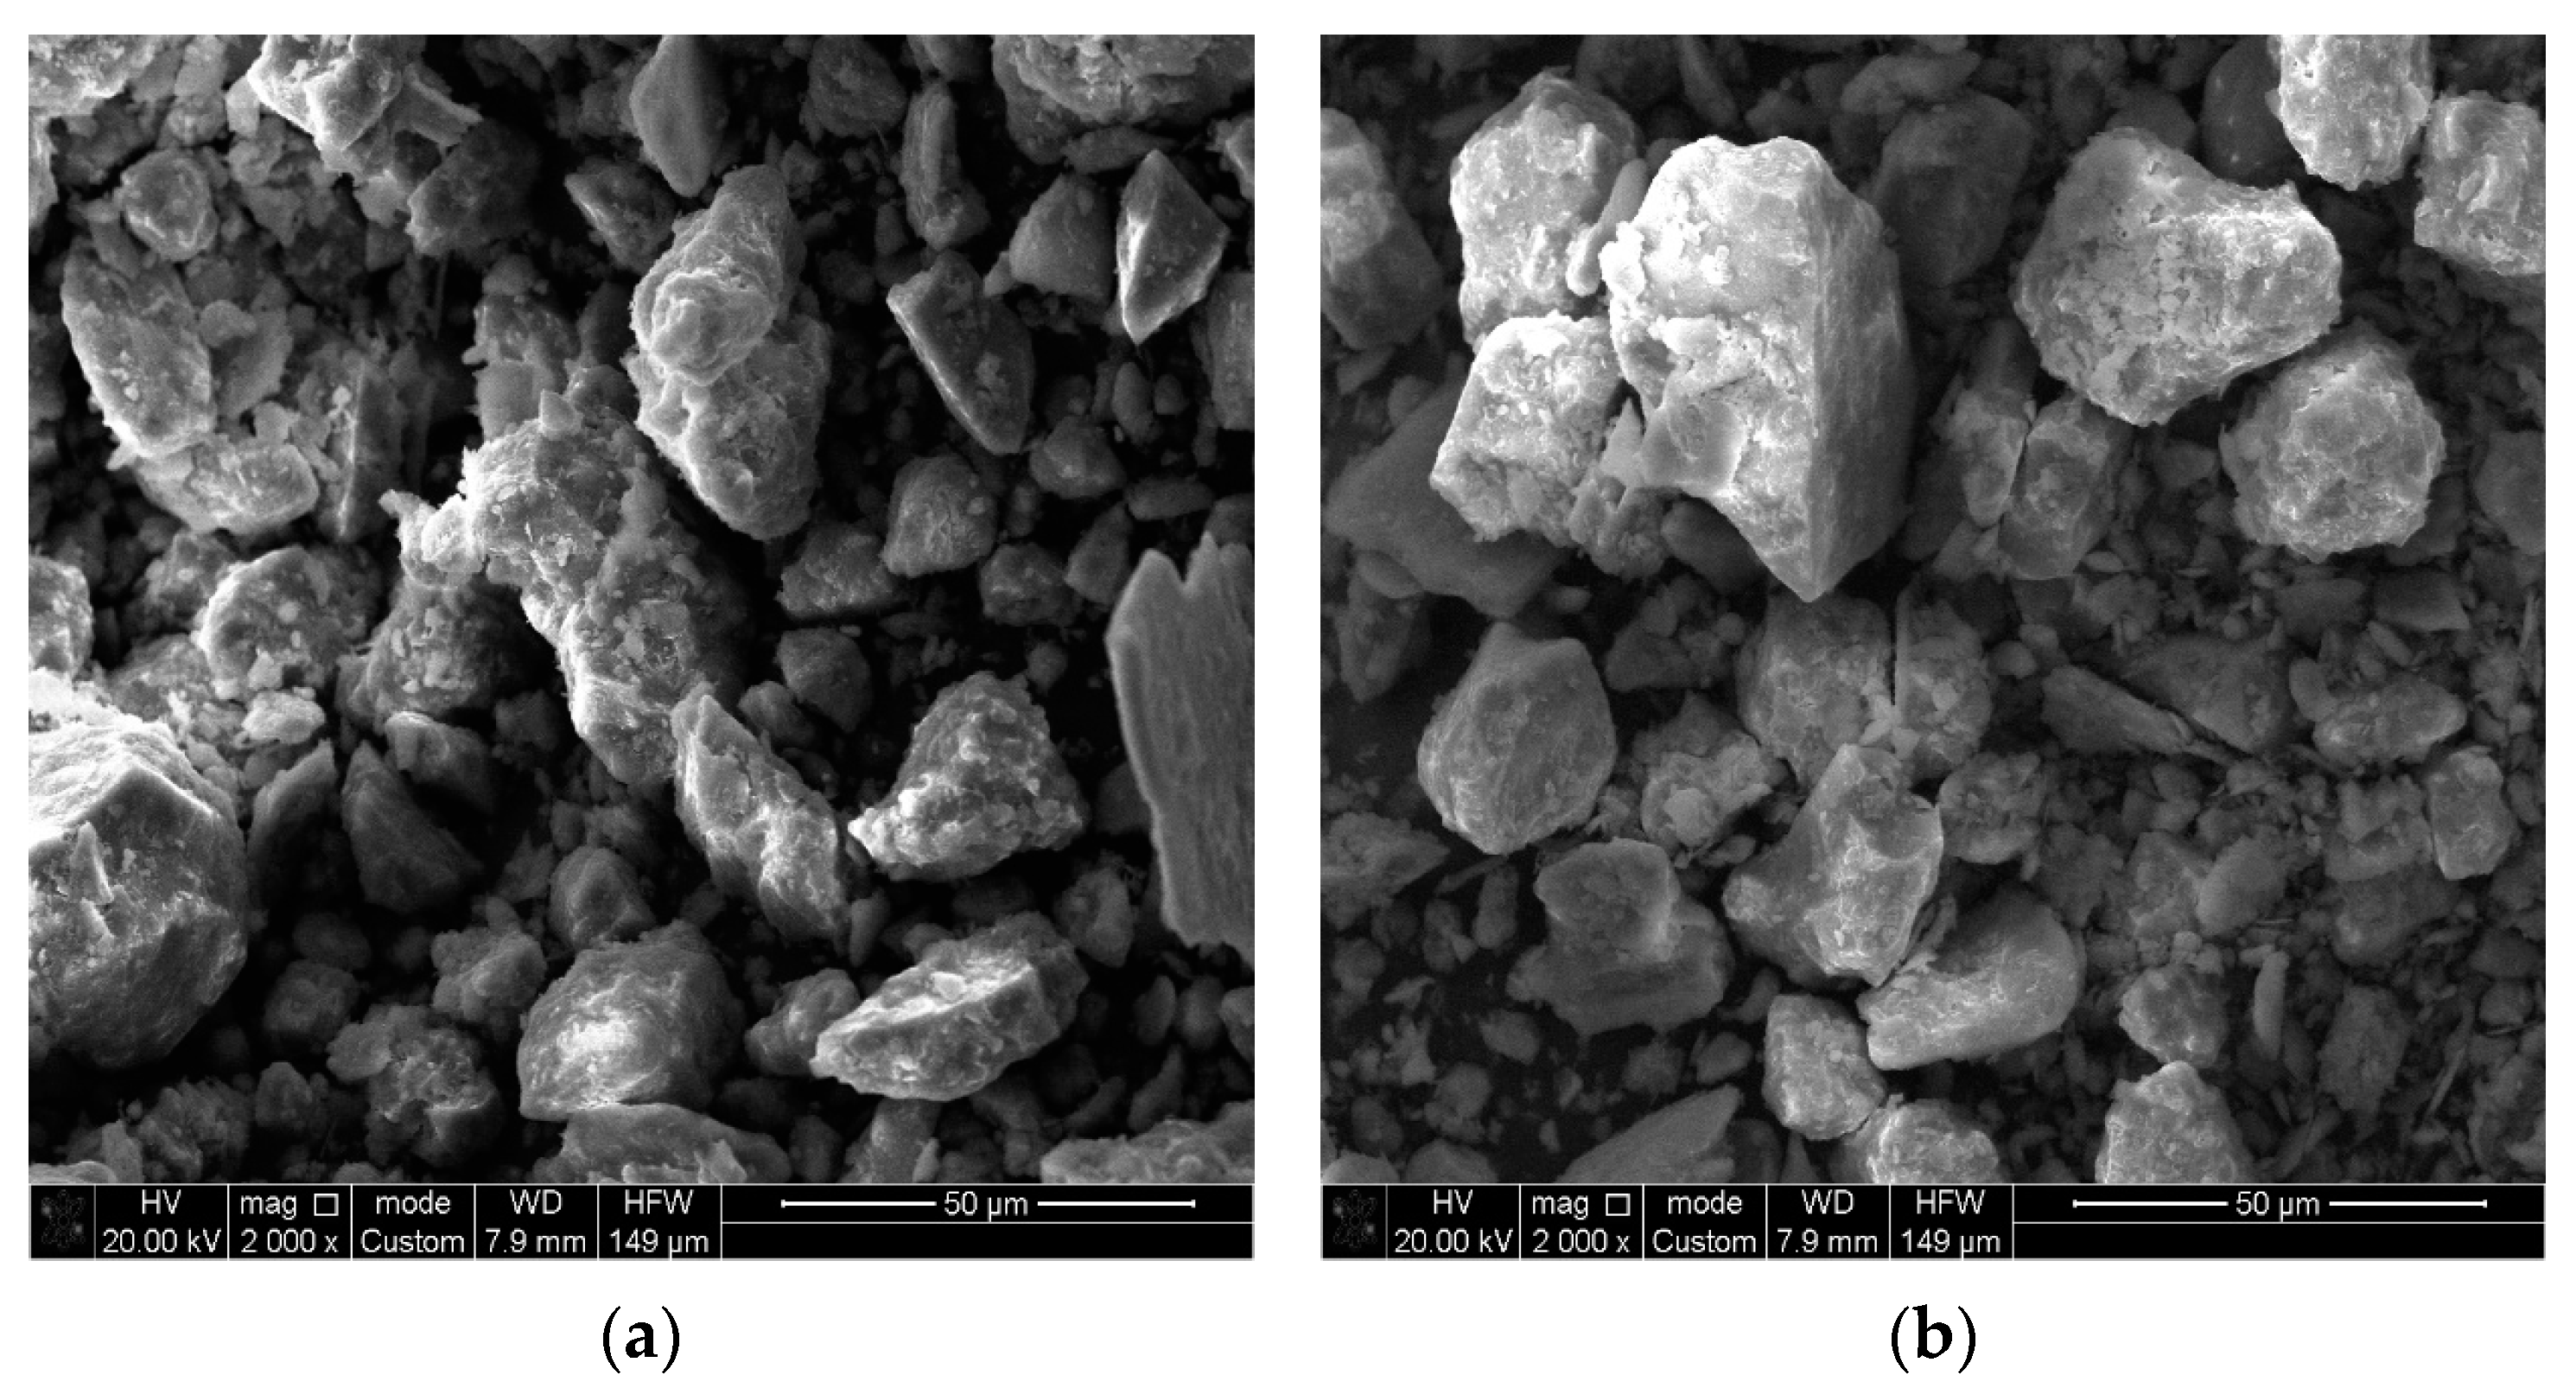
The morphology of raw S (Figure 3a) was characterized by particles of different size and shape. This is quite typical for natural silicate minerals. Almost no changes appeared after acid activation (Figure 3b); however, the surface of AS seemed to become more porous.
The specific surface area of the adsorbents was measured using BET analysis. Acid activation led to an increased specific surface area from 42 to 56 m2/g for S and AS, respectively (Table 4). This remarkable improvement can most likely be attributed to the removal of components occupying pores of the silicate, resulting in more accessible pores and consequently larger surface area.
The zero-charge point (pHpzc), the pH value at which the total net surface charge of the particle is 0, is a very important electrochemical characteristic of minerals. If the pH of the surrounding solution exceeds pHpzc, the mineral adsorbs mainly cations, while below pHpzc it adsorbs predominantly anions [52]. The pHpzc after activation decreased from 10.1 to 5.1 (Table 4). The sorption process was carried out at a pH of 6.85 ± 0.25, and therefore the developed sorbent has a greater ability to adsorb Na+ and K+.
The cation exchange capacity (CEC) of adsorbents represents the number of cations available at a given pH capable of exchanging with other cations. It is usually expressed in milliequivalents per 100 g (meq/100 g) of dry clay. The adsorbed cation replaces or exchanges the initial cation, which balances the charge of the negative layer in the solution. This ability of S particles to retain and exchange positively charged ions is vital as it affects the mobility of positively charged compounds both in soils and in the geochemical cycle of cations in general [53]. The CEC of AS (Table 2, ~168 meq/100 g) was much lower than that of S (~851 meq/100 g). A significant decrease can be seen in calcium and magnesium content due to the partial dissolution of calcite and Ca/Mg hydroxides after acid treatment. The second ion in the CEC ranking was sodium, in accordance with its more facile ion exchange compared to other ions [54,55]. It is interesting that the CEC of K+ increased slightly after acid treatment. This is probably due to the decrease in sodium content that allows K+ ions to enter the ion exchange process.
Initially, S contained mainly Si, O and Al, as well as small amounts of metals including Na, Mg, K, Ca and Fe (Table 5). Notably, after treatment with 1 M HNO3, the content of Ca decreased from 8.48 to 0.69 wt%, which was due to the partial dissolution of calcite. Also, acid treatment resulted in a decrease in carbon content from 10.53 to 5.01 wt% due to the dissolution of some organic impurities.
The content of calcite mineral in the samples was confirmed by the presence of bands at 778, 874, 1434 and 1726 cm−1 [56] (Figure 4). After acid activation, these peaks disappeared, confirming the dissolution of the calcite phase. The intense absorption band with three clearly defined ledges at 470, 526 and 648 cm−1 can be attributed to deformation vibrations of oxygen-silicon groups Si-O-Si (470 cm−1) and Si-O-Al (525 cm−1). The corresponding valence vibrations of these groupings are reflected in the infrared spectrum in the form of a strong intensity band at 1048 cm−1 [57]. The presence of water and hydroxyl groups in the clay composition was confirmed by deformation vibrations of OH groups of water molecules at 1634 cm−1. Deformation fluctuations of hydroxyl groups were manifested in the region of 920 cm−1. The valence oscillation of water hydroxyls was observed as a strong band at 3428 cm−1. The valence oscillation of OH groups corresponds to a peak at 3620 cm−1 [56]. Small peaks at 2940–2500 cm−1 can be attributed to some organic contaminants that dissolve after acid treatment.

3.3. Effect of External Factors on Adsorption Efficiency

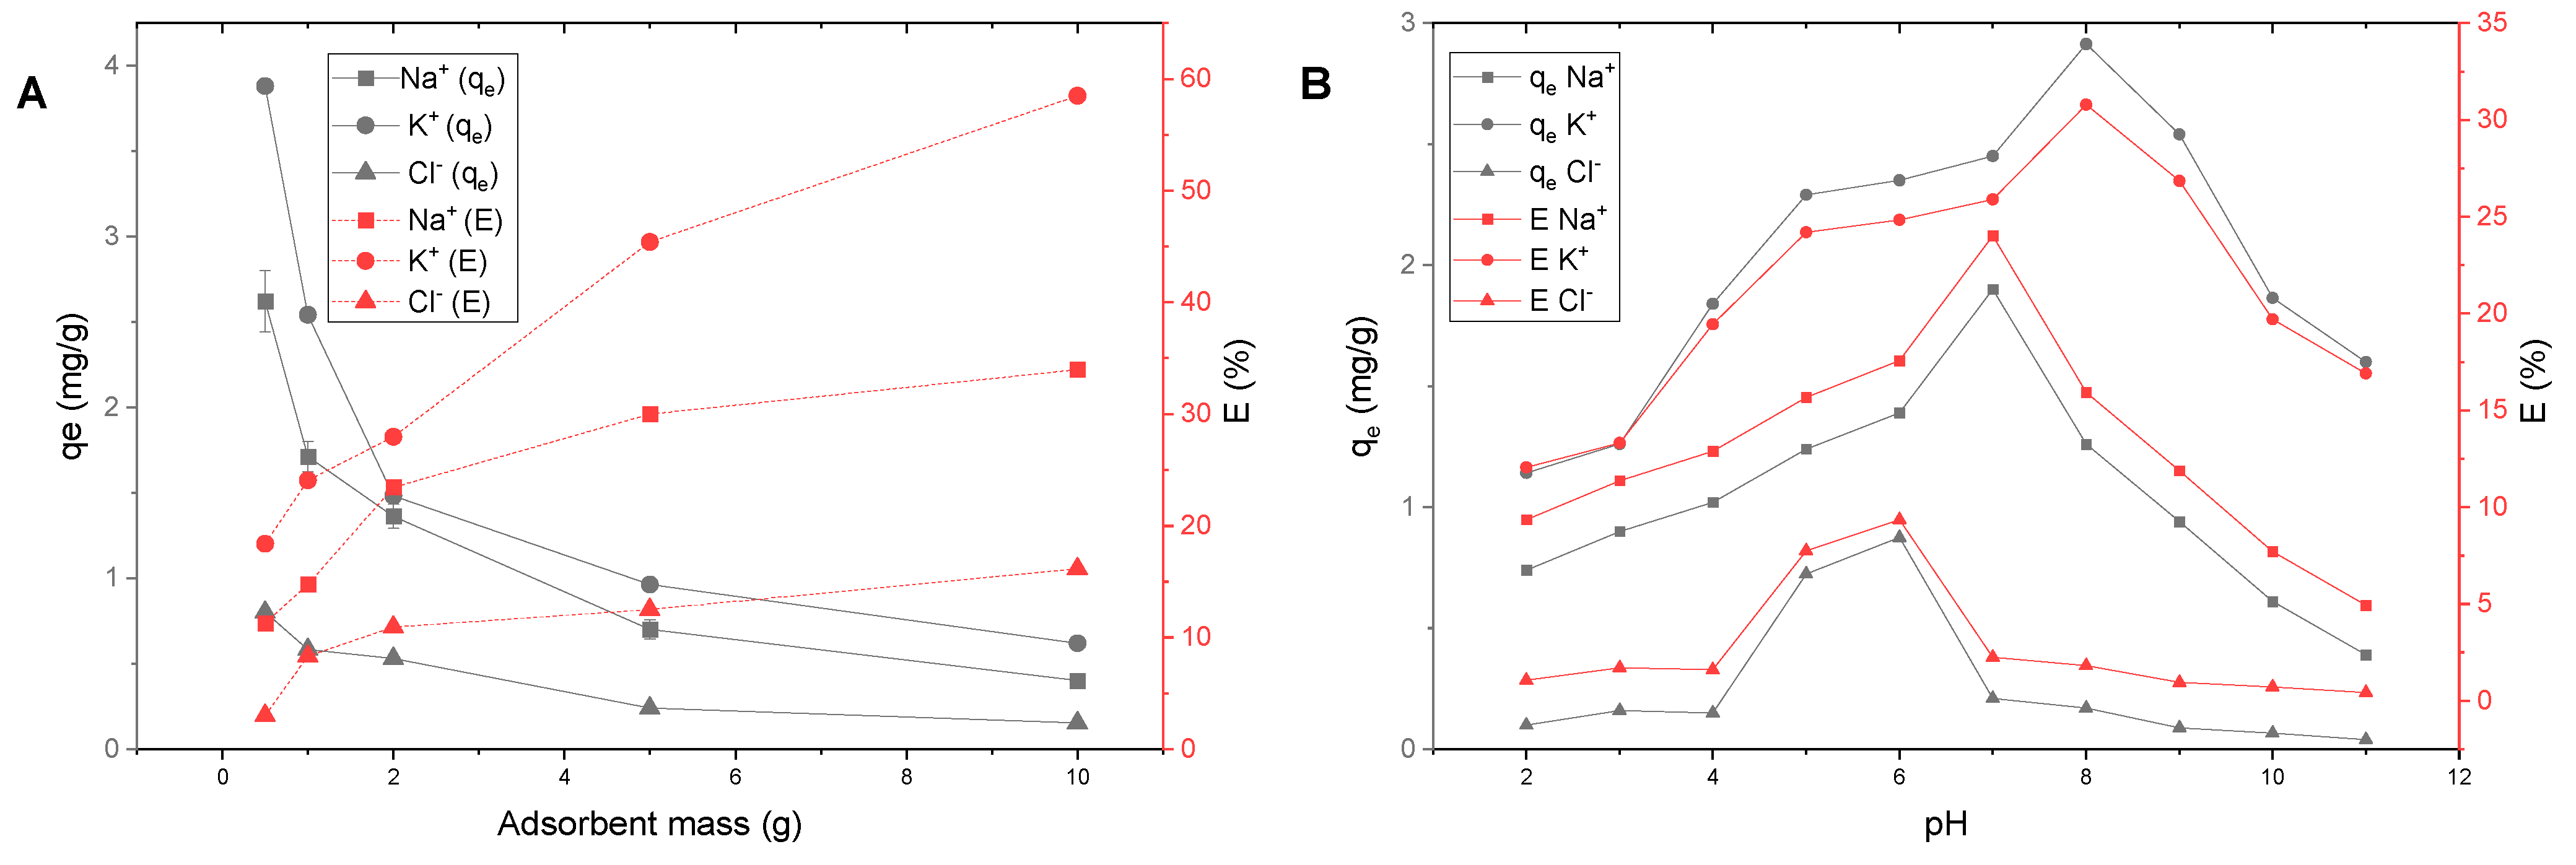
Effect of adsorbent dosage. The change in the mass of the adsorbent significantly affects the adsorption properties (Figure 5A). For all studied ions, an increased adsorbent mass increased the extraction degree (E, %). At the same time, the value of adsorption (qe, mg/g) decreased. This phenomenon can be ascribed to more active adsorbent spots that remain unsaturated during the adsorption process. Similar observations were reported for Cr(VI) adsorption onto activated carbon [58] and Pb2+/Ni2+ adsorption onto zeolite [59]. A solid/liquid ratio of 1:10, i.e., 10 g of adsorbent per 100 mL of solution, was optimal for the efficient adsorption of Na+, K+ and Cl onto AS. Larger amounts of solid would increase the cost, and thus consecutive cycles with the optimal amount of adsorbent are preferable from the points of view of economy and efficiency.
Effect of pH. When analyzing the effect of pH on the adsorption of the studied ions (Figure 5B), it was found that the most favorable pH values were 5–6 for chloride, 7 for sodium and 8 for potassium. If we assume that the interaction between the sorbent and ions occurs due to electrostatic forces, it is necessary to recall the value of the PZC (Table 4), which was 5.12 for AS. At values above the PZC the surface is negatively charged [52] and should adsorb cations. The maximum adsorption of sodium ions was observed at a lower value compared with potassium ions. This may be related to the structure and size of the hydration shells. A hydrated sodium ion has an octahedral structure and a size of 1.09 Å, while hydrated potassium has a square antiprism structure and 1.50 Å size [43]. The much larger K+ ion needs a stronger negative charge; therefore, it is attracted to the surface at a higher pH. The decrease in the degree of adsorption at highly alkaline pH may be associated with supersaturation with hydroxyl groups, which blocks access to the clay surface for cations. It is interesting that during the adsorption of chloride ions the maximum values should have been at pH below 5. However, the optimal pH for chlorides is 5–6, i.e., when the surface is neutral. From this, we conclude that the mechanism of interaction of chloride ions with clay is probably due to conjugation/complexation with cations on the surface of minerals, in particular chlinochlore.
Effect of initial concentration and adsorption isotherms. The adsorption performance depends on the concentration of the adsorbed substance. The studied ions were adsorbed by the same amount of AS and S (Figure 6) at various initial concentrations from 10 to 5000 mg/L. With the increase in solution concentration, the adsorption capacities of S and AS increased gradually due to the greater driving force for adsorption [60]. At high concentrations above 1000 mg/L, the adsorption tended to equilibrium, occupying all available sites on the surface of the adsorbent.
The Langmuir [39], Freundlich [40], Temkin [41] and Dubinin–Radushkevich [42] isotherm models were applied to fit the equilibrium adsorption experimental data (Table S2). The applicability of a particular model was estimated using the approximation coefficient (R2).
Experimental isotherms of AS fit to the used isotherm models in the following order: Freundlich > Dubinin–Radushkevich > Temkin > Langmuir for sodium ions onto S and AS; Dubinin–Radushkevich > Freundlich > Temkin > Langmuir for potassium ions onto S and AS; Dubinin–Radushkevich > Freundlich > Temkin > Langmuir for chloride ions onto AS; and Dubinin–Radushkevich > Temkin > Freundlich > Langmuir for chloride ions onto S. The application of the Langmuir isotherm model gave negative R2 values for all ions, and therefore it does not describe the process [61]. Temkin isotherm R2 values were also poor for AS isotherms: 0.72, 0.80 and 0.72 for Na+, K+ and Cl, respectively. In case of adsorption onto S, the Temkin isotherm showed good fit with R2 = 0.96 for chloride ions. The other two models showed good fit with R2 > 0.9. In such cases, it is not enough to choose the fitting model only using R2 [62]. To resolve this issue, theoretical qmax values calculated with the obtained equations at the highest initial concentration of the ions (5000 mg/L) were compared to the experimental maximum adsorption capacities. Average relative errors (AREs) were calculated using Equation (13):
A R E = 100 n i = 1 n q m a x . e x p q m a x . c a l q m a x . e x p i
where q m a x . e x p / q m a x . c a l are experimental/calculated maximum adsorption capacities.
Based on the AREs, the best isotherm for Na+ ions onto both materials was the Freundlich model, i.e., a multilayer adsorption on a heterogeneous surface with energetically unequal sites [40]. For K+ and Cl ions, the smallest ARE values were obtained for the Dubinin–Radushkevich model. This isotherm is an empirical model, which generally applies to express the adsorption mechanism with a Gaussian energy distribution onto a heterogeneous surface. It characterizes an imperative parameter E as the specific mean free energy, which is utilized to differentiate among physical and chemical adsorption. The Dubinin–Radushkevich model enables the determination of the adsorption energy E = 1 2 β (J/mol). When the magnitude of E is <8 kJ/mol, the adsorption process is one of physical adsorption, and when E lies between 8 kJ/mol and 16 kJ/mol, the process is chemical adsorption [63]. In the case of both K+ and Cl, E values were less than 8 kJ/mol. This means that the mechanism of their adsorption was physisorption, particularly ion exchange.
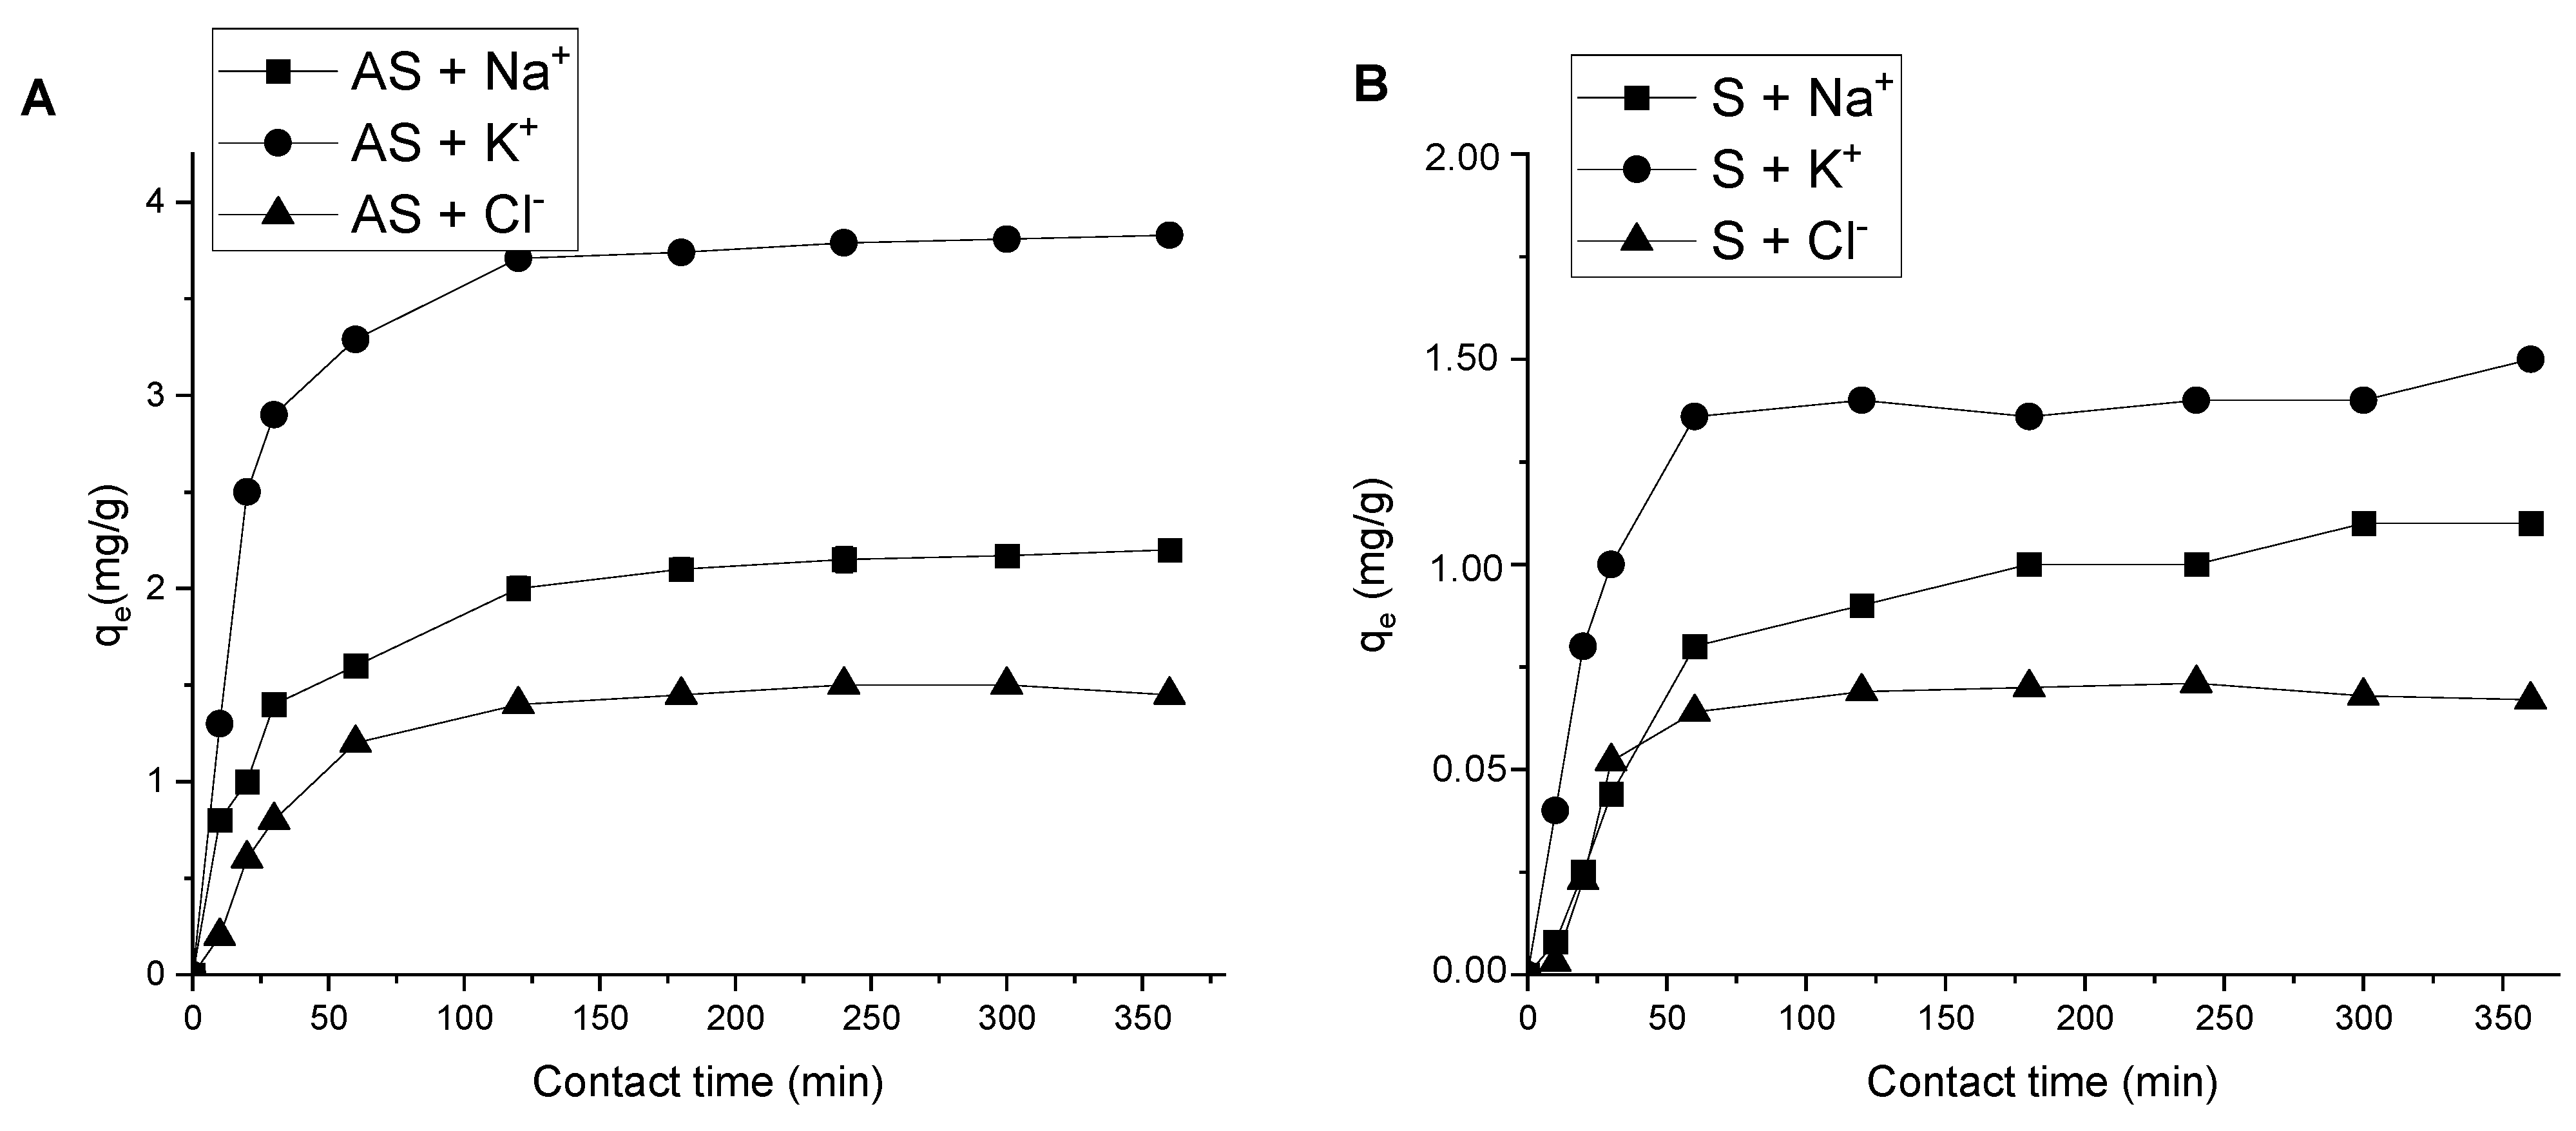
Effect of contact time and adsorption kinetics. The effect of contact time on the adsorption capacity of AS and S for Na+, K+ and Cl (Figure 7) revealed that at >120 min the adsorption reached its maximum value and almost no change occurred in 360 min. This means that the system reached equilibrium in the first two hours.
Pseudo-first order [64] and pseudo-second order [65] models were used to fit the experimental data to identify the adsorption kinetics (Table 6). The most popular models in the literature are linear forms of Equations (14) and (15) for pseudo-first and pseudo-second order kinetics, respectively:
ln q e q t = ln q e k 1 t
t q t = t q e + 1 k 2 q e 2
where k1 and k2 are the pseudo-first and pseudo-second order rate constants, qt is the amount of adsorbed solute and qe is its value at equilibrium.
A comparison of the results in Table 6 shows that in the case of adsorption of the studied ions onto S, the pseudo-second order model described the experimental data. For kinetic curves of sodium and potassium adsorption onto AS, the pseudo-second order equation makes it possible to describe the experimental data with significantly higher correlation coefficients (R2). This indicates that the process is better described by the pseudo-second order reaction model and is dominated by external diffusion kinetics. The same results were obtained for other clay minerals by Nel et al. [48]. For chloride ions’ adsorption onto AS, the process progressed according to the pseudo-first order model.
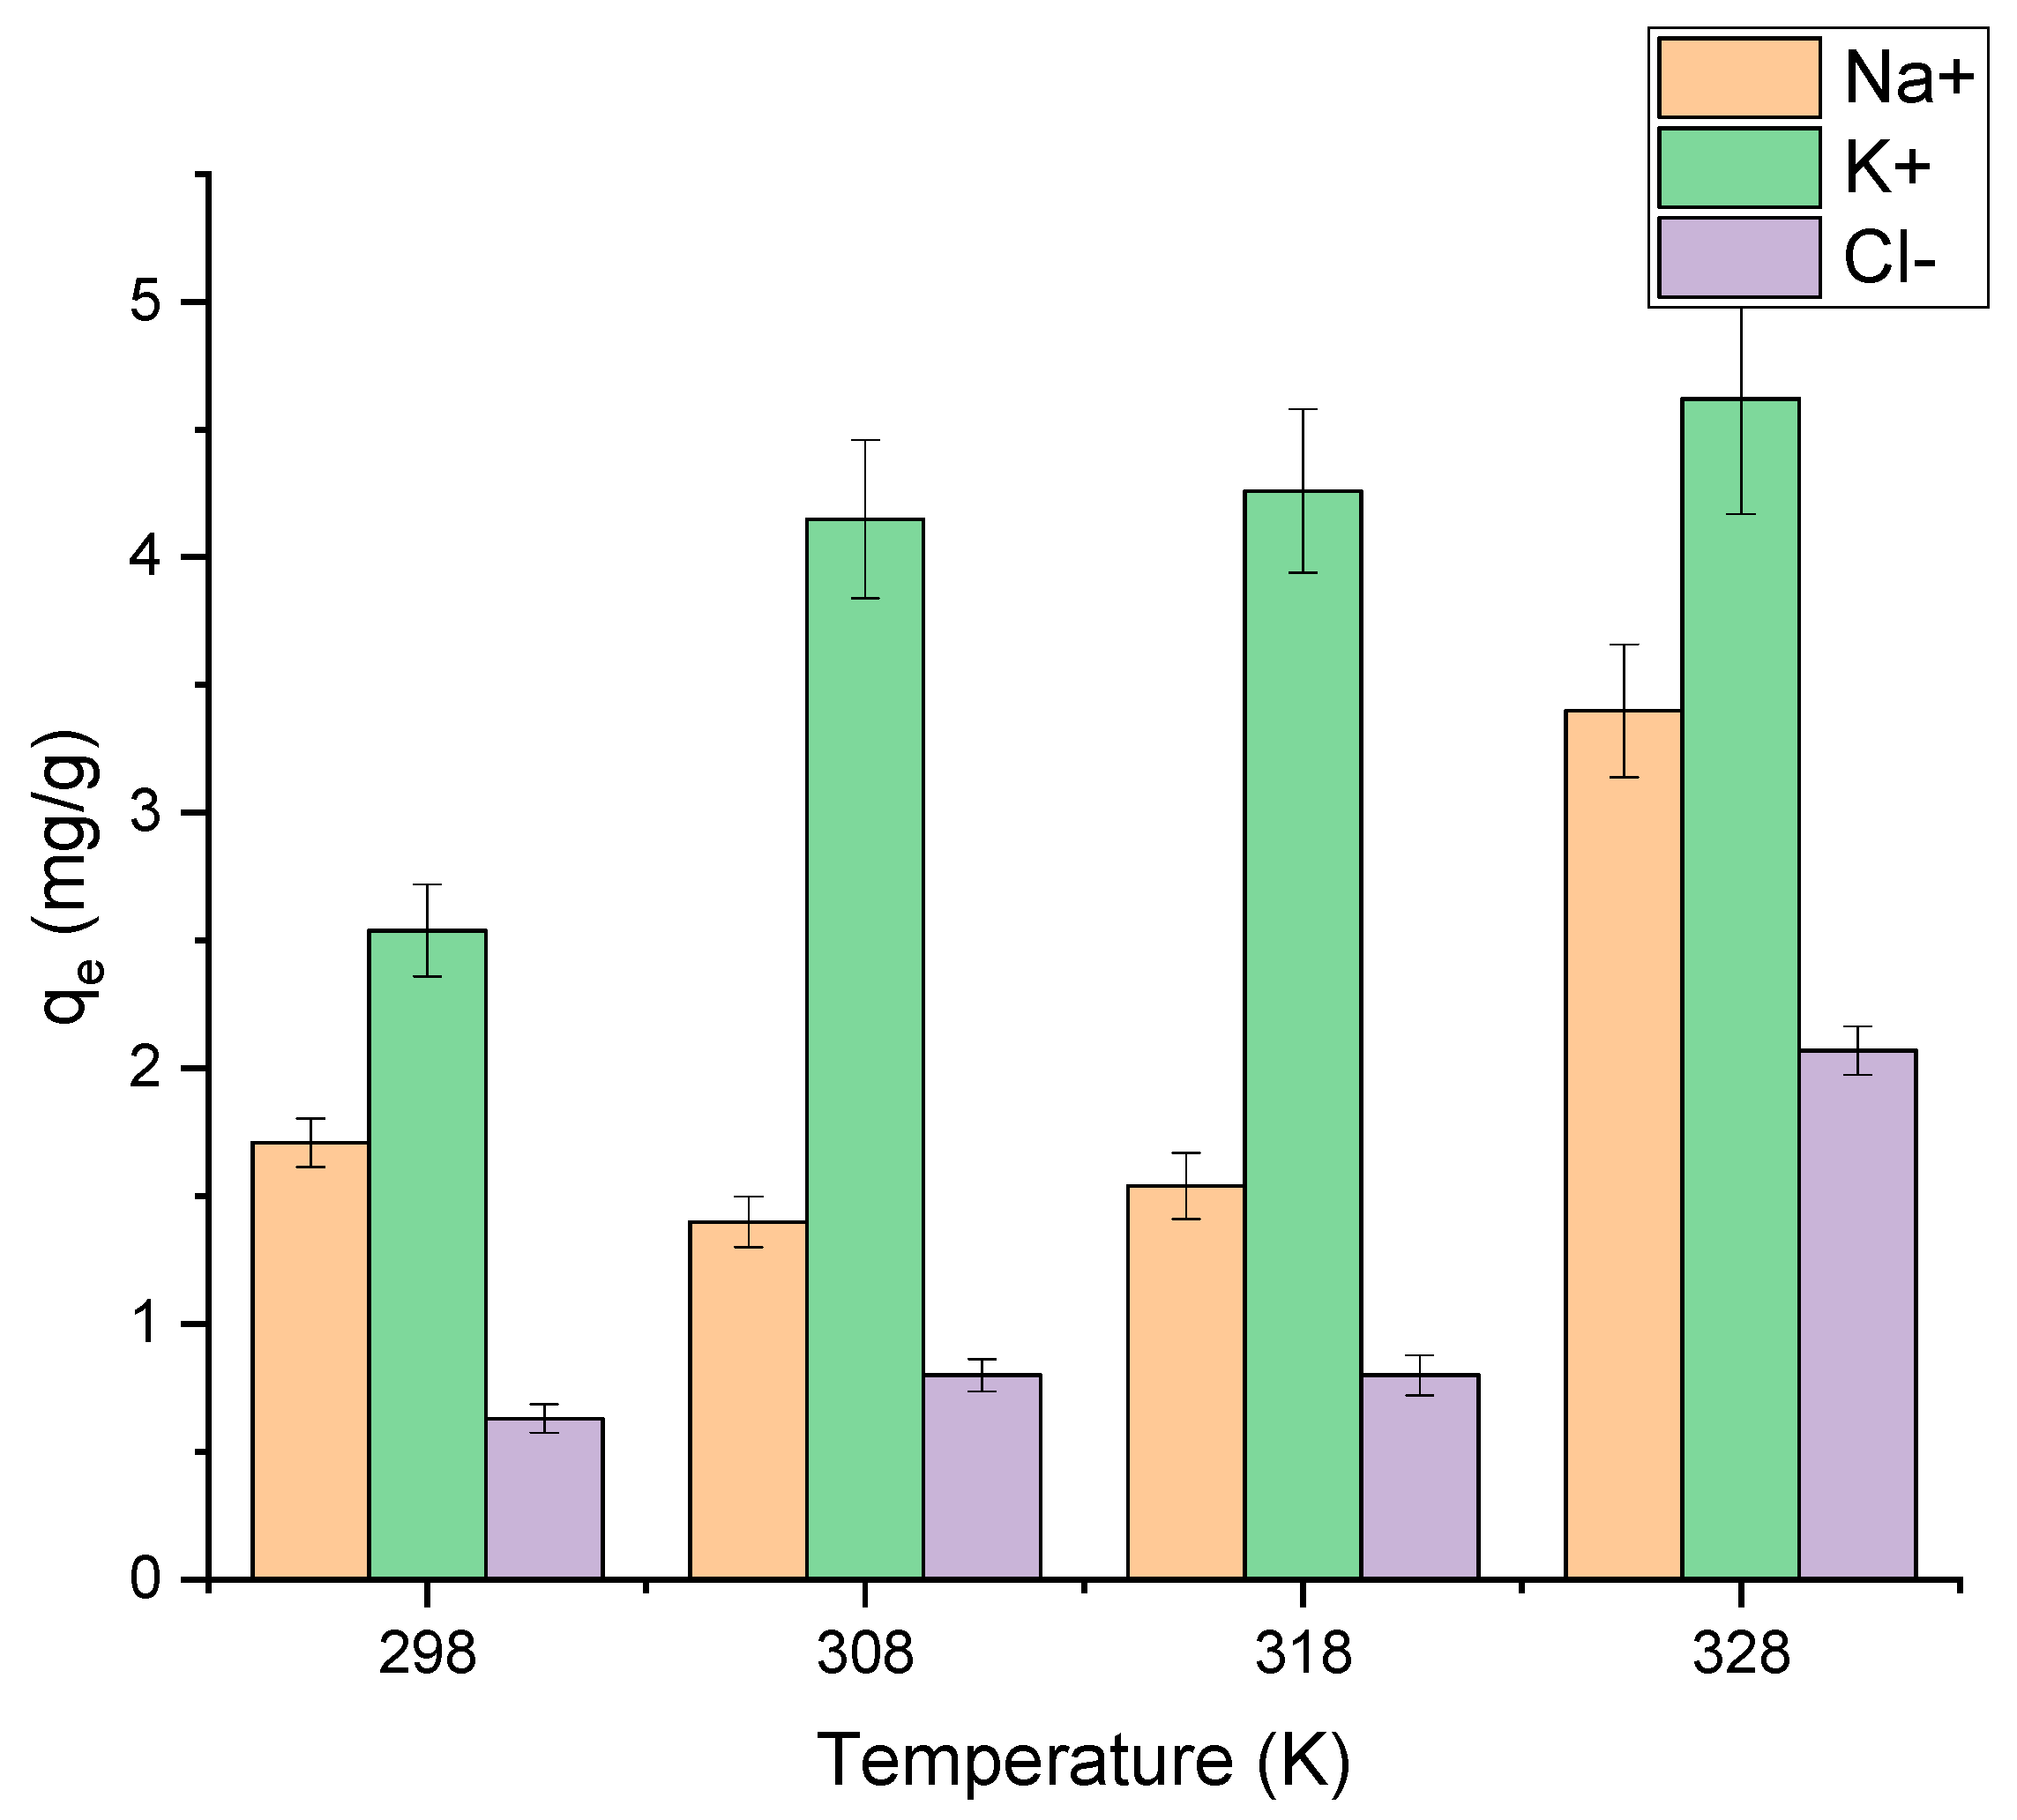
Effect of temperature and adsorption thermodynamics. The adsorption was studied at 298, 308, 318 and 328 K (Figure 8). For potassium ions, temperatures of 308 K and higher were favorable, while for sodium and chloride ions the adsorption proceeded better at the highest temperature (328 K).
It is well known that in an isolated system where energy cannot be gained or lost, the Gibbs free energy change is the fundamental criterion of spontaneity. Reactions occur spontaneously at a given temperature if the standard change (ΔG°) is negative [66]. Values of ΔG° were calculated using Equation (16):
G 0 = R T l n K e ,   w h e r e   K e = q e C e
The standard enthalpy (ΔH°) and entropy (ΔS°) were calculated using Equation (18) (linear form of (17)):
G 0 = H 0 T S 0
l n K e = S 0 R H 0 R T
The negative values of Δ (Table 7) reflected the nature of the sorption process of Na+, K+ and Cl ions, which takes place spontaneously in the forward direction. We can see that the Δ value obtained in this work was negative for sodium and potassium ions and positive for chloride ions. This indicates that the adsorption of Na+ and K+ was exothermic, while it was endothermic for Cl ions. In general, the value of ΔH° lies in the range of 2–20 kJ/mol for physical adsorption and 80–200 kJ/mol for chemical adsorption. Therefore, based on the absolute ΔH° values, the adsorption of the studied ions onto AS surface is through physisorption.
Positive values of ΔS° for Cl indicated increased disorder in the surface/solution interface [67] due to the passage of a large number of ions from the sorbent into the solution, indicating active ion exchange processes. The negative adsorption entropy for Na+ and K+ indicated decreased randomness at the solid/solution interface during adsorption [68].
Regeneration of adsorbent. To study the regeneration and the possibility of sorbent reuse, the optimal conditions for Na+/K+ desorption were investigated (Figure 9). As the values of Cl adsorption are small, the desorption of chloride ions was not studied.
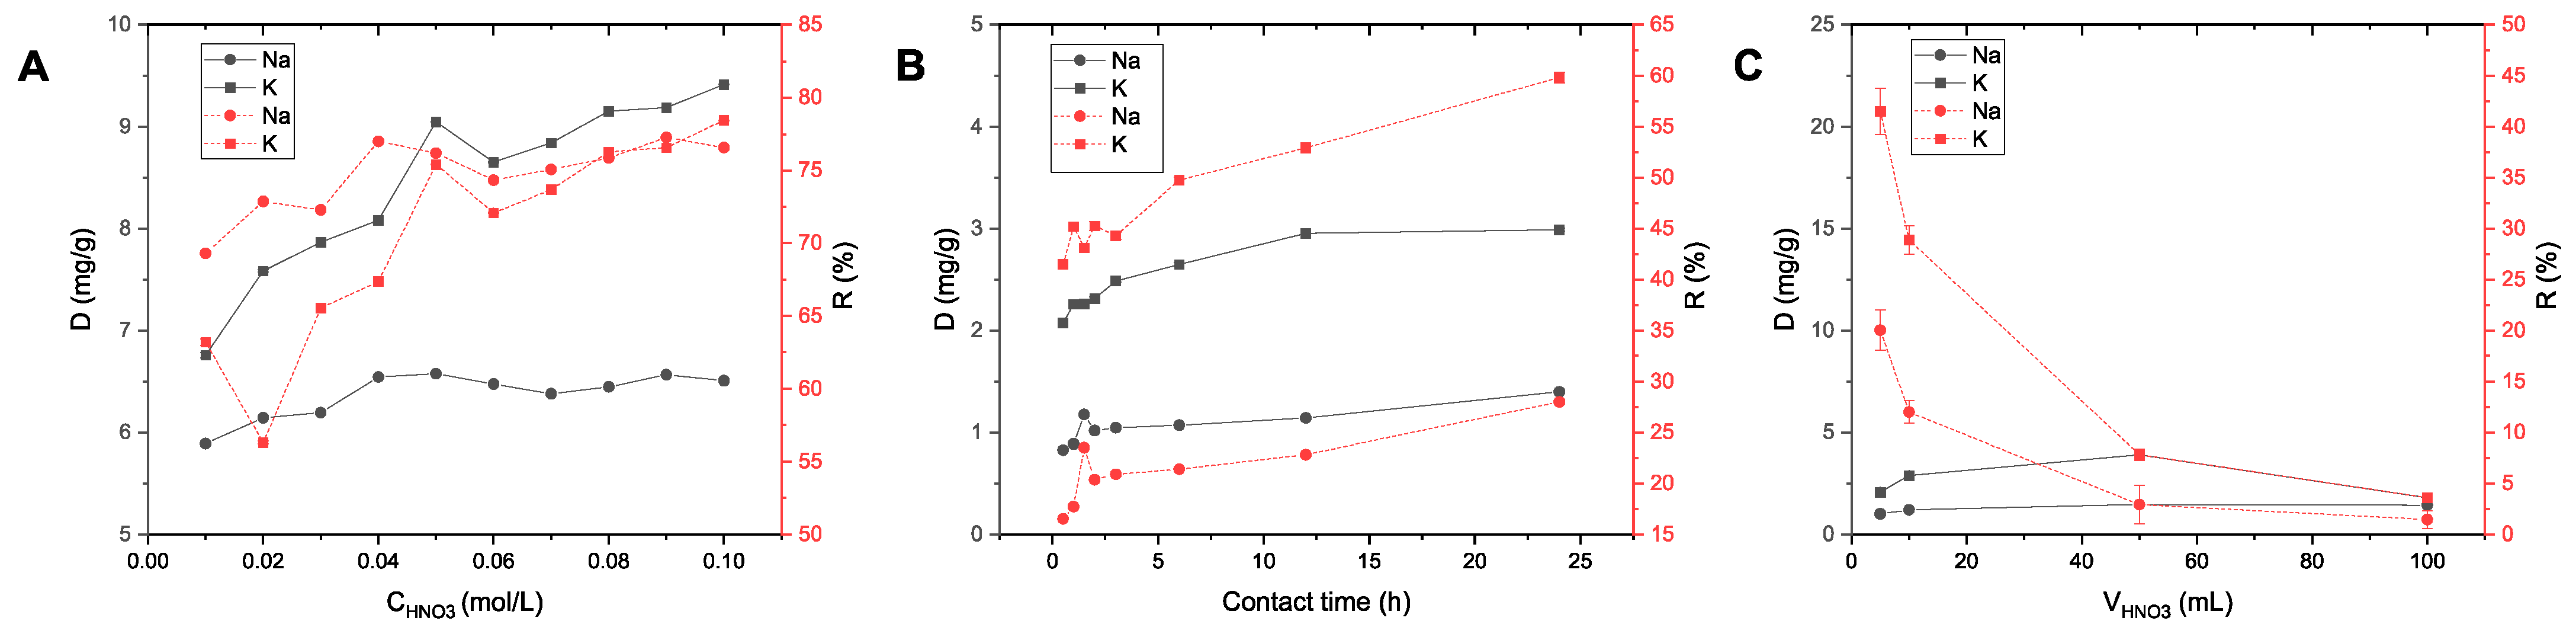
Water is spent during adsorption regeneration, and therefore the desorption process was optimized in an attempt to use the lowest amount of pure water and maintain efficiency. At first, the influence of acid concentration for desorption was investigated using a sorbent/acid ratio of 1:5, i.e., a relatively small amount of solution per sorbent. Desorption values for potassium were much higher than for sodium since the amount of adsorbed potassium was also higher. With increased acid concentration, an increase in the desorption of both ions was observed. However, above 0.05 M, the values essentially reached a plateau, with slight fluctuations. Therefore, 0.05 M was chosen as the optimal acid concentration for further studies.
Next, the sorbent/solution ratio was optimized (Figure 9B). In this case, an increase in desorption with increased volume of acid up to 50 mL/g of sorbent was observed. However, with a further increase in volume to 100 mL, a decrease in desorption was observed for potassium ions, and no change was observed for sodium. This most likely reflects the favorable ratio of 1:50 for complete ion exchange and saturation of the surface with H+ ions. At an increased acid volume, the equilibrium shifted and the desorption of H+ and the reverse process of K+ adsorption occurred (in accordance with the well-known principle of Le Chatelier).
When studying the influence of the contact time of the sorbent with acid, it was found that the majority of the ions were desorbed in the first two hours (more than 70%); therefore this time was chosen as optimal.
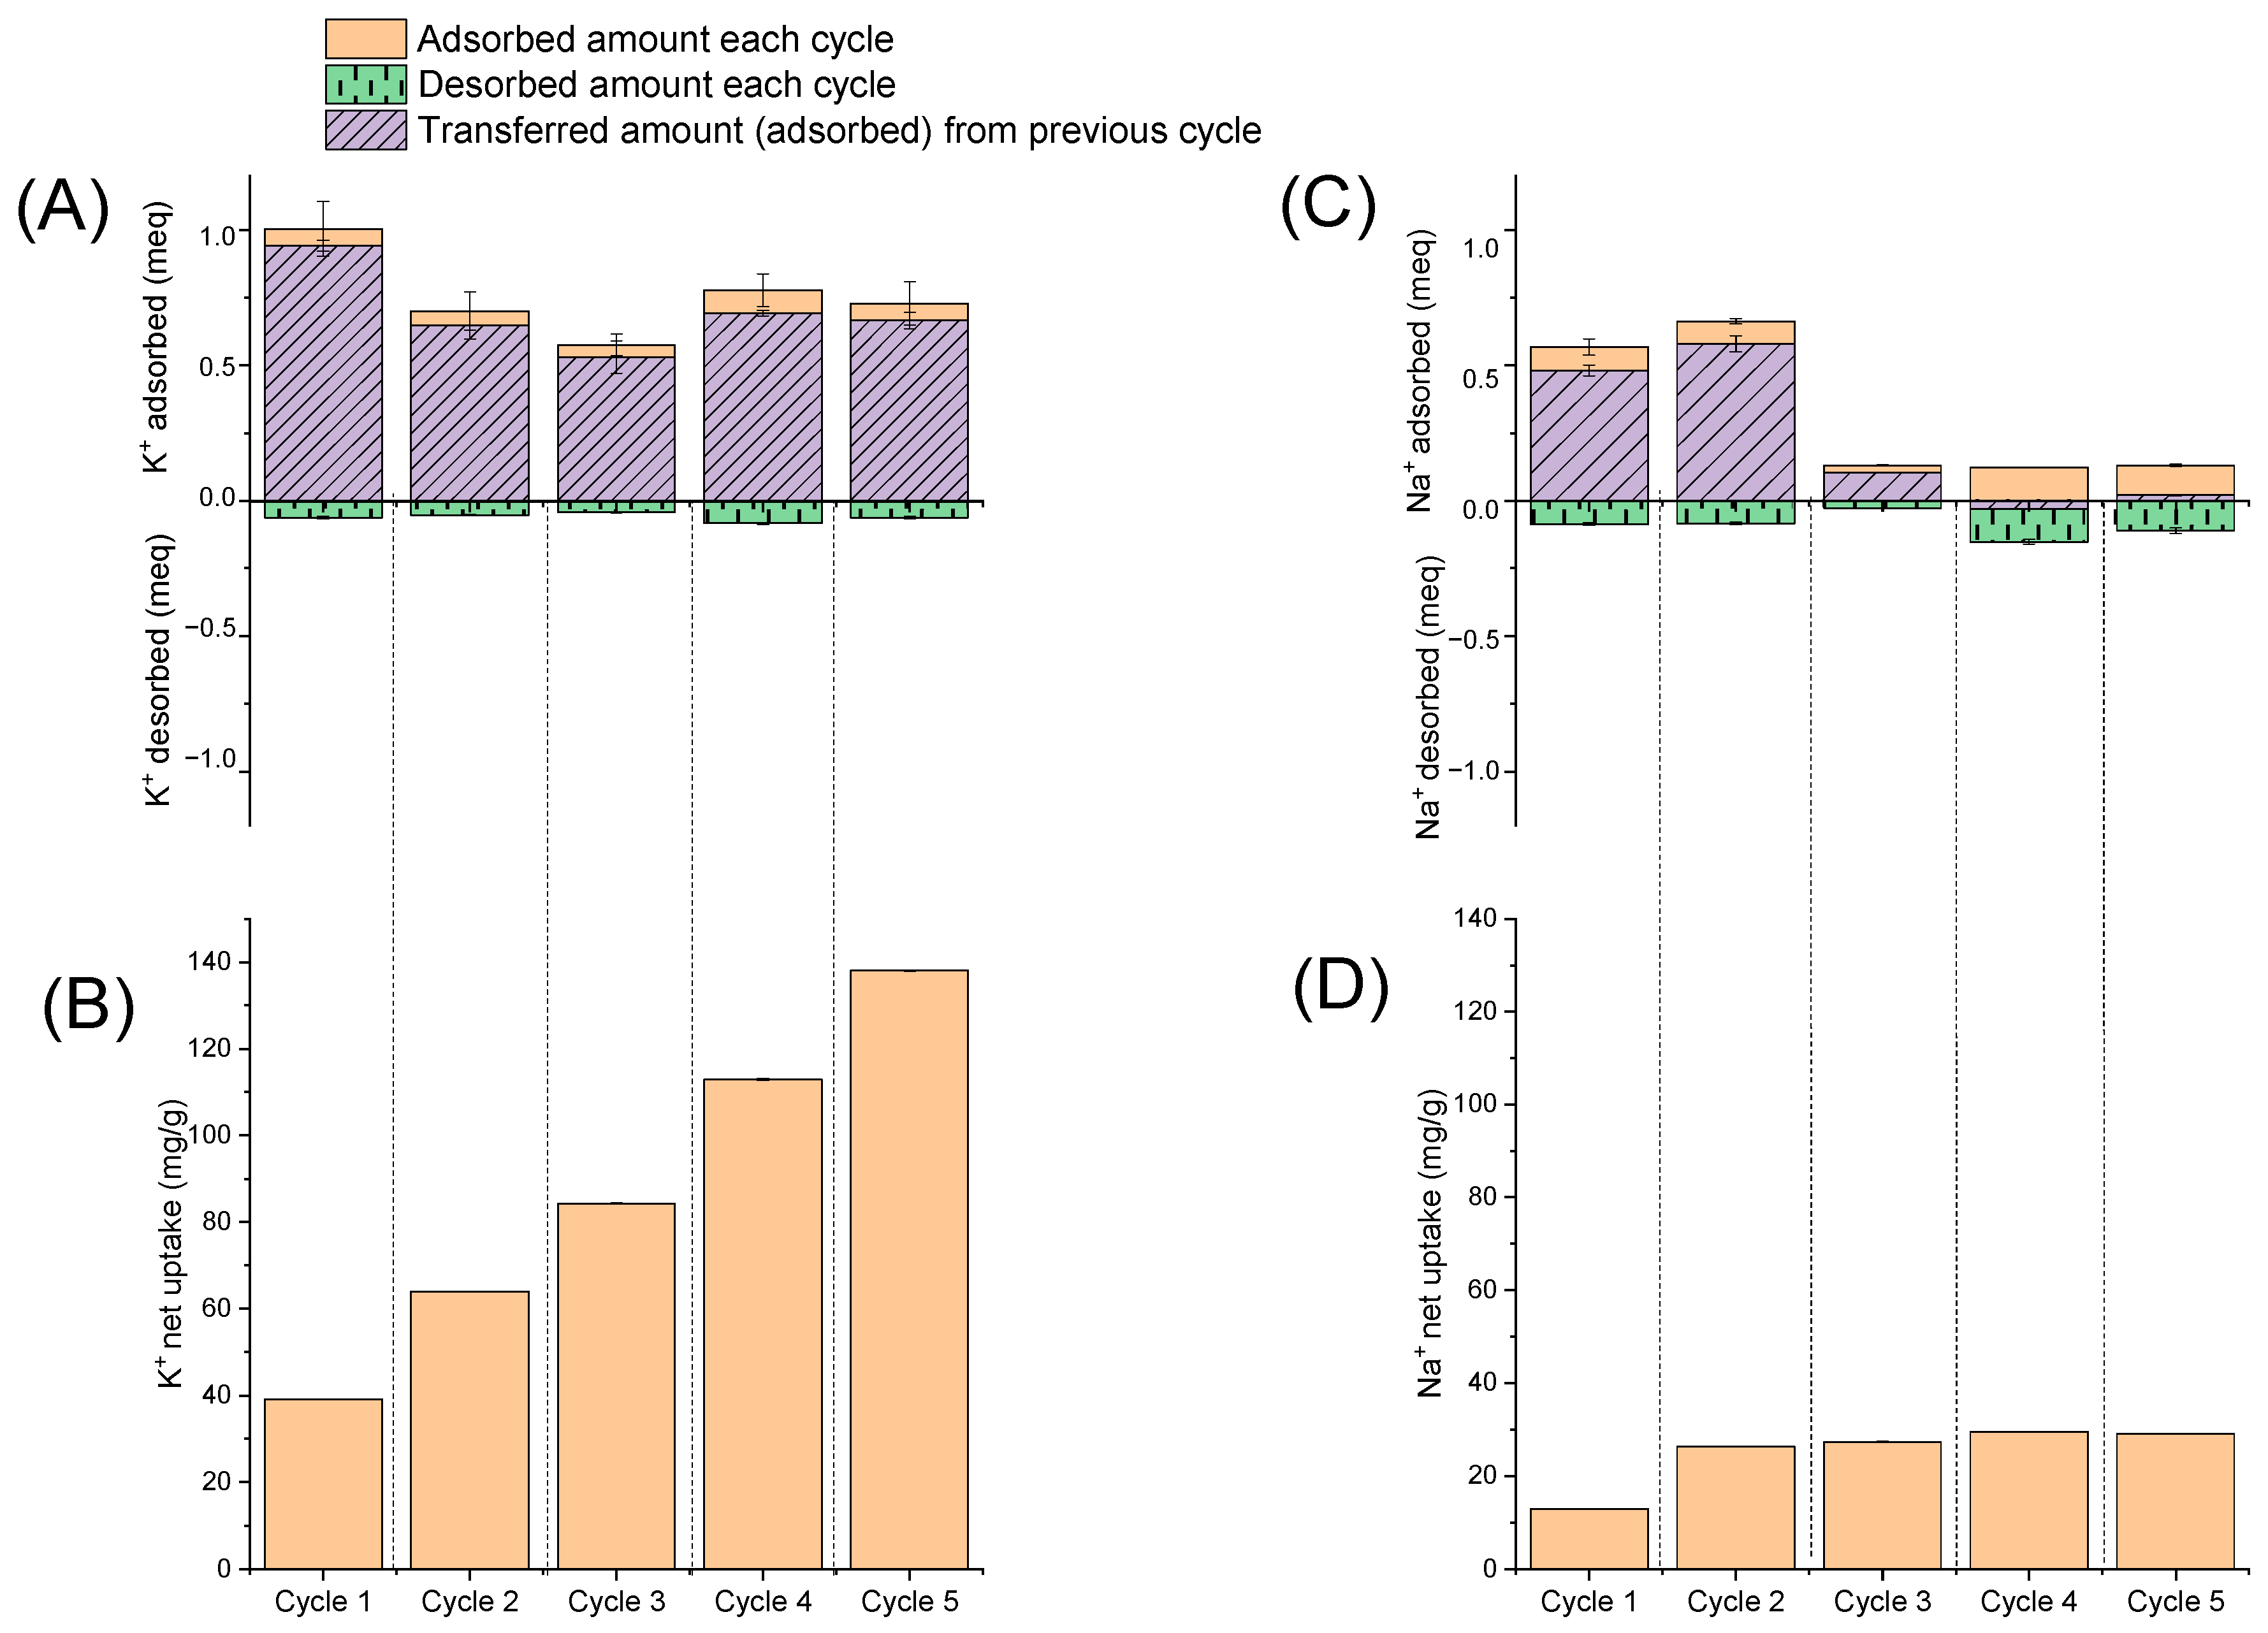
To study the possibility of sorbent reuse, several cycles of adsorption–desorption of potassium and sodium ions were carried out under optimal conditions (Figure 10): C0 = 1000 mg/L, solid/liquid 1:100, contact time 3 h (adsorption); acid concentration 0.05 M, solid/liquid 1:50, contact time 2 h (desorption).
For each cycle, the amounts of desorbed Na+ and K+ (in meq) are presented in Figure 10A,C. The net uptake of Na+ and K+ (in mg/g) is presented in Figure 10B,D. For sodium ions, the adsorption decreased after the second cycle and remained stably low until the fifth cycle. Desorption values were between 0.1 and 0.2 meq for all cycles, which is about 15% of the net uptake. In the case of potassium, the adsorption efficiency decreased after the first cycle and remained stable until the fifth cycle, despite relatively small desorption values (about 0.1 meq—1% of net uptake). Thus, the sorbent lost its effectiveness with respect to sodium ions but adsorbed well and retained potassium ions even after five cycles of adsorption–desorption. Thus, AS can be used to selectively adsorb potassium ions from brine to produce K-form silicates that can be further assessed as a potassium nutrient source in other applications.
To test the potential for recycling spent sorbent, leachates were prepared in ammonium acetate buffer and their trace element composition was analyzed (Table 8). The amounts shown were exchangeable forms of the metal microelements, which in addition to sodium and potassium included calcium, magnesium, manganese, copper and iron. Before adsorption, the AS sample had greater amounts of exchangeable forms of Ca/Mg/K. After the separate adsorption of sodium and potassium ions, their concentration greatly increased. The NaCl content is of interest, because the standards for potash fertilizers require a NaCl content of less than 3.5% [69]. The AS contained 1.09 wt% of Na (Table 4), and the maximum adsorption capacity was 28.5 mg/g by Na+ and 5.5 mg/g by Cl (Figure 7). Hence, the maximum content in AS can reach 2.82 wt% of sodium and 0.55% of chloride. Also, only bioavailable exchangeable forms of micronutrients should be counted while using fertilizers. In our case, the maximum content of sodium in leachates was about 2.7 g per 1 kg of AS (Table 8), which is only 0.27%.
Notably, the concentration of sorbed K+ was nearly 70% greater than sorbed Na+. After the adsorption of both ions, the content of K+ was significantly higher (2156 mg/kg) than Na+ (485 mg/kg), indicating a selective adsorption. K-release from AS was comparable to other SMP (waste mica, feldspar [34]) and was sufficient for use as a long-term fertilizer. As a result of the selective K+ adsorption from brine, it was possible to increase the content of the exchangeable form of K by ~10-fold (to 2156 mg/kg). The decrease in the content of calcium and magnesium after adsorption indicated the ion exchange mechanisms of sodium and potassium adsorption on the AS.
Depending on the type of soil and its deficits, the form and amount of AS injection should be chosen to improve its properties. Thus, after completing the full cycle of work as a sorbent for potash brine impact or saline water desalination, AS can be used as a long-term fertilizer—a source of trace elements for plant life. The lifecycle of the proposed sorbent (see graphical abstract) includes the extraction of silicate near the Kyzylsok deposit, acid activation, the transport of the sorbent to a potash quarry where an industrial potash brine is formed, from which a good amount of potassium can be obtained, the adsorption of saline ions, regeneration and adsorption (5 cycles) and the utilization of spent sorbent saturated with a bioavailable exchangeable form of K as fertilizer.

4. Conclusions

This study showed the possibility of using available, cheap, practically unused SMP from weathered granite soil as a sorbent for the desalination of industrial potash brines. The result was a recovery of 13 mg/g of Na, 28.5 mg/g of K and 5.5 mg/g of Cl ions using acid-treated silicate (AS).
The results provided a good indication of the different operating conditions required for the efficient removal of the studied ions. An isothermal study provided the best fit of the Freundlich model for Na+ adsorption, and the Dubinin–Radushkevich model for K+ and Cl. The kinetic data were best modeled by pseudo-second-order kinetics for Na+ and K+ and by the pseudo-first-order for Cl. Thermodynamic calculations showed the spontaneity of the process under natural conditions. For chloride ions, adsorption occurred due to complexation/conjugation with cations, and for Na+ and K+ it included ion exchange processes.
A study of sorbent desorption (regeneration) and reuse showed that AS loses its effectiveness with respect to sodium ions after two cycles, but it adsorbs well and retains potassium ions even up to five adsorption–desorption cycles. Thus, AS can be used to selectively adsorb potassium ions from brines to produce K-form silicates that can be further assessed as a potassium nutrient source in other applications.
Ammonium acetate extracts of spent sorbents contain high concentrations of potassium ions, as well as other trace elements useful for plant development, which makes it possible to utilize the used sorbent as a long-term potassium fertilizer. However, further research is needed in this direction.
The results of this work showed new prospects for the application of unused resources in the form of SMP from soils for the development of technologies for the desalination of industrial brines, as well as for the production of potash fertilizers.

Supplementary Materials

The following supporting information can be downloaded at: https://www.mdpi.com/article/10.3390/colloids7040061/s1, Table S1: XRD peaks of raw silica (S) and acid-treated silica (AS); Table S2: Parameters obtained when fitting the experimental data to the non-linear equations of isotherm models.

Author Contributions

Conceptualization, A.B.R. and G.A.S.; Methodology, A.B.R., G.A.S., Z.Y.B. and A.K.K.; Validation, G.A.S. and Y.M.; Investigation, A.K.K., B.B.Z., D.N.D. and Z.Y.B.; Resources, G.A.S. and Y.M.; Data curation, A.K, A.B.R. and Z.Y.B.; Writing—original draft preparation, A.B.R. and Z.Y.B.; Writing—review and editing, G.A.S. and Y.M.; Visualization, A.B.R.; Supervision, G.A.S. and Y.M.; Project administration, A.B.R., G.A.S. and Y.M.; Formal analysis, A.K.K., A.B.R., B.B.Z., D.N.D. and Z.B; Funding acquisition, G.A.S. All authors have read and agreed to the published version of the manuscript.

Funding

This research was funded by the Science Committee of the Ministry of Education and Science of the Republic of Kazakhstan (Grant No. AP09260116).

Institutional Review Board Statement

Not applicable.

Data Availability Statement

The data presented in this study are available within the article and supplementary material.

Acknowledgments

The authors thank R. Nadirov for kind help with the interpretation of the results and A. Muratuly for providing python code The authors are grateful to the National Open-Type Nanotechnology Laboratory (NNLOT) at Al-Farabi Kazakh National University (KazNU) for providing SEM/EDAX analysis using the scanning electron microscope FEI Quanta 3D 200i Dual system. We thank the Laboratory of Physical-Chemical Methods of Analysis of the Faculty of Chemistry and Chemical Technology at Al-Farabi KazNU for providing FTIR and AAS analysis.

Conflicts of Interest

The authors declare that they have no conflict of interest.

References

  1. Vitosh, M.L. NPK Fertilizers; Cooperative Extension Service; Michigan State University: East Lansing, MI, USA, 1996.
  2. Association, I.F.I. Environmental Aspects of Phosphate and Potash Mining; UNEP: Athens, Greece, 2001; ISBN 928072052X. [Google Scholar]
  3. Tallin, J.E.; Pufahl, D.E.; Barbour, S.L. Waste management schemes of potash mines in Saskatchewan. Can. J. Civ. Eng. 1990, 17, 528–542. [Google Scholar] [CrossRef]
  4. Kaushal, S.S. Increased salinization decreases safe drinking water. Environ. Sci. Technol. 2016, 50, 2765–2766. [Google Scholar] [CrossRef] [PubMed]
  5. White, P.J.; Broadley, M.R. Chloride in soils and its uptake and movement within the plant: A review. Ann. Bot. 2001, 88, 967–988. [Google Scholar] [CrossRef]
  6. Myers, C.; Nakagaki, T. Negative emissions using Mg sourced from desalination brine or natural evaporite deposits. In Proceedings of the 15th Greenhouse Gas Control Technologies Conference, Abu Dhabi, United Arab Emirates, 5–8 October 2020; pp. 15–18. [Google Scholar]
  7. Wang, X.; Ni, W.; Jin, R.; Liu, B. Formation of Friedel’s salt using steel slag and potash mine brine water. Constr. Build. Mater. 2019, 220, 119–127. [Google Scholar] [CrossRef]
  8. Kumar, A.; Naidu, G.; Fukuda, H.; Du, F.; Vigneswaran, S.; Drioli, E.; Lienhard, J.H. Metals recovery from seawater desalination brines: Technologies, opportunities, and challenges. ACS Sustain. Chem. Eng. 2021, 9, 7704–7712. [Google Scholar] [CrossRef]
  9. Nakhjiri, A.T.; Sanaeepur, H.; Amooghin, A.E.; Shirazi, M.M.A. Recovery of precious metals from industrial wastewater towards resource recovery and environmental sustainability: A critical review. Desalination 2022, 527, 115510. [Google Scholar] [CrossRef]
  10. Ihsanullah, I.; Mustafa, J.; Zafar, A.M.; Obaid, M.; Atieh, M.A.; Ghaffour, N. Waste to wealth: A critical analysis of resource recovery from desalination brine. Desalination 2022, 543, 116093. [Google Scholar] [CrossRef]
  11. Likhachev, D.S.; Li, F.-C. Large-scale water desalination methods: A review and new perspectives. Desalin. Water Treat. 2013, 51, 2836–2849. [Google Scholar] [CrossRef]
  12. Thimmaraju, M.; Sreepada, D.; Babu, G.S.; Dasari, B.K.; Velpula, S.K.; Vallepu, N. Desalination of water. In Desalination and Water Treatment; IntechOpen: Rijeka, Croatia, 2018; pp. 333–347. [Google Scholar] [CrossRef]
  13. Jiménez-Arias, D.; Morales-Sierra, S.; García-Machado, F.J.; García-García, A.L.; Luis, J.C.; Valdés, F.; Sandalio, L.M.; Hernández-Suárez, M.; Borges, A.A. Rejected brine recycling in hydroponic and thermo-solar evaporation systems for leisure and tourist facilities. Changing waste into raw material. Desalination 2020, 496, 114443. [Google Scholar] [CrossRef]
  14. Jiménez-Arias, D.; Sierra, S.-M.; García-Machado, F.J.; García-García, A.L.; Borges, A.A.; Luis, J.C. Exploring the agricultural reutilisation of desalination reject brine from reverse osmosis technology. Desalination 2022, 529, 115644. [Google Scholar] [CrossRef]
  15. Da Silva Dias, N.; dos Santos Fernandes, C.; de Sousa Neto, O.N.; da Silva, C.R.; da Silva Ferreira, J.F.; da Silva Sá, F.V.; Cosme, C.R.; Souza, A.C.M.; de Oliveira, A.M.; de Oliveira Batista, C.N. Potential Agricultural Use of Reject Brine from Desalination Plants in Family Farming Areas BT—Saline and Alkaline Soils in Latin America: Natural Resources, Management and Productive Alternatives; Taleisnik, E., Lavado, R.S., Eds.; Springer International Publishing: Cham, Switzerland, 2021; pp. 101–118. ISBN 978-3-030-52592-7. [Google Scholar]
  16. Ruan, S.; Yang, E.-H.; Unluer, C. Production of reactive magnesia from desalination reject brine and its use as a binder. J. CO2 Util. 2021, 44, 101383. [Google Scholar] [CrossRef]
  17. Singh, I.; Hay, R.; Celik, K. Recovery and direct carbonation of brucite from desalination reject brine for use as a construction material. Cem. Concr. Res. 2022, 152, 106673. [Google Scholar] [CrossRef]
  18. Bello, A.S.; Zouari, N.; Da’ana, D.A.; Hahladakis, J.N.; Al-Ghouti, M.A. An overview of brine management: Emerging desalination technologies, life cycle assessment, and metal recovery methodologies. J. Environ. Manag. 2021, 288, 112358. [Google Scholar] [CrossRef] [PubMed]
  19. Wibowo, E.; Rokhmat, M.; Sutisna; Murniati, R.; Khairurrijal; Abdullah, M. Thermally Activated Clay to Compete Zeolite for Seawater Desalination. Adv. Mater. Res. 2015, 1112, 154–157. [Google Scholar] [CrossRef]
  20. Gibb, N.P.; Dynes, J.J.; Chang, W. Synergistic desalination of potash brine-impacted groundwater using a dual adsorbent. Sci. Total Environ. 2017, 593–594, 99–108. [Google Scholar] [CrossRef] [PubMed]
  21. Paul, B.; Dynes, J.J.; Chang, W. Modified zeolite adsorbents for the remediation of potash brine-impacted groundwater: Built-in dual functions for desalination and pH neutralization. Desalination 2017, 419, 141–151. [Google Scholar] [CrossRef]
  22. Siemens, A.M.; Dynes, J.J.; Chang, W. Sodium adsorption by reusable zeolite adsorbents: Integrated adsorption cycles for salinised groundwater treatment. Environ. Technol. 2021, 42, 3083–3094. [Google Scholar] [CrossRef] [PubMed]
  23. Xing, H.; Liu, H.; Zhang, X.; Deng, H.; Hu, H.; Yao, H. Enhanced sodium adsorption capacity of kaolinite using a combined method of thermal pre-activation and intercalation-exfoliation: Alleviating the problems of slagging and fouling during the combustion of Zhundong coal. Fuel 2019, 239, 312–319. [Google Scholar] [CrossRef]
  24. Zhang, X.; Liu, H.; Xing, H.; Wang, G.; Deng, H.; Hu, H.; Li, X.; Yao, H. Correlations between the sodium adsorption capacity and the thermal behavior of modified kaolinite during the combustion of Zhundong coal. Fuel 2019, 237, 170–177. [Google Scholar] [CrossRef]
  25. Zhang, X.; Liu, H.; Xing, H.; Li, H.; Hu, H.; Li, A.; Yao, H. Improved sodium adsorption by modified kaolinite at high temperature using intercalation-exfoliation method. Fuel 2017, 191, 198–203. [Google Scholar] [CrossRef]
  26. Ryu, C.; Rim, S.-B.; Kang, Y.; Yu, C.-J. First-principles study of sodium adsorption on defective graphene under propylene carbonate electrolyte conditions. RSC Adv. 2023, 13, 5627–5633. [Google Scholar] [CrossRef] [PubMed]
  27. Li, S.; Zhao, J.; Li, L.; Dong, W. Sodium adsorption and intercalation in bilayer graphene doped with B, N, Si and P: A first-principles study. J. Electron. Mater. 2020, 49, 6336–6347. [Google Scholar] [CrossRef]
  28. Zhao, D.; Zhao, H.; Ye, J.; Song, W.; Miao, S.; Shen, H.; Zhao, Y.; Kang, M.; Li, Z. Oxygen functionalization boosted sodium adsorption-intercalation in coal based needle coke. Electrochim. Acta 2020, 329, 135127. [Google Scholar] [CrossRef]
  29. Guo, T.; Wang, S.; Ye, X.; Liu, H.; Gao, X.; Li, Q.; Guo, M.; Wu, Z. Competitive adsorption of Li, K, Rb, and Cs ions onto three ion-exchange resins. Desalin. Water Treat. 2013, 51, 3954–3959. [Google Scholar] [CrossRef]
  30. Xu, S.; Ning, S.; Wang, Y.; Wang, X.; Dong, H.; Chen, L.; Yin, X.; Fujita, T.; Wei, Y. Precise separation and efficient enrichment of palladium from wastewater by amino-functionalized silica adsorbent. J. Clean. Prod. 2023, 396, 136479. [Google Scholar] [CrossRef]
  31. Chen, Y.; Ning, S.; Zhong, Y.; Li, Z.; Wang, J.; Chen, L.; Yin, X.; Fujita, T.; Wei, Y. Study on highly efficient separation of zirconium from scandium with TODGA-modified macroporous silica-polymer based resin. Sep. Purif. Technol. 2023, 305, 122499. [Google Scholar] [CrossRef]
  32. Gibb, N.P.; Dynes, J.J.; Chang, W. A recyclable adsorbent for salinized groundwater: Dual-adsorbent desalination and potassium-exchanged zeolite production. Chemosphere 2018, 209, 721–729. [Google Scholar] [CrossRef] [PubMed]
  33. Ahmed, O.H.; Azrumi, N.A.B.; Jalloh, M.B.; Jol, H. Using clinoptilolite zeolite for enhancing potassium retention in tropical peat soil. Adv. Trop. Soil Sci. 2015, 3, 112–127. [Google Scholar]
  34. Basak, B.B.; Sarkar, B.; Maity, A.; Chari, M.S.; Banerjee, A.; Biswas, D.R. Low-grade silicate minerals as value-added natural potash fertilizer in deeply weathered tropical soil. Geoderma 2023, 433, 116433. [Google Scholar] [CrossRef]
  35. Basak, B.B.; Sarkar, B. Scope of Natural Sources of Potassium in Sustainable Agriculture BT—Adaptive Soil Management: From Theory to Practices; Rakshit, A., Abhilash, P.C., Singh, H.B., Ghosh, S., Eds.; Springer: Singapore, 2017; pp. 247–259. ISBN 978-981-10-3638-5. [Google Scholar]
  36. Chung, F.H. Quantitative interpretation of X-ray diffraction patterns of mixtures. I. Matrix-flushing method for quantitative multicomponent analysis. J. Appl. Crystallogr. 1974, 7, 519–525. [Google Scholar] [CrossRef]
  37. Bakatula, E.N.; Richard, D.; Neculita, C.M.; Zagury, G.J. Determination of point of zero charge of natural organic materials. Environ. Sci. Pollut. Res. 2018, 25, 7823–7833. [Google Scholar] [CrossRef] [PubMed]
  38. Kragović, M.; Pašalić, S.; Marković, M.; Petrović, M.; Nedeljković, B.; Momčilović, M.; Stojmenović, M. Natural and modified zeolite—Alginate composites. Application for removal of heavy metal cations from contaminated water solutions. Minerals 2018, 8, 11. [Google Scholar] [CrossRef]
  39. Langmuir, I. The constitution and fundamental properties of solids and liquids. II. liquids. J. Am. Chem. Soc. 1917, 39, 1848–1906. [Google Scholar] [CrossRef]
  40. Freundlich, H.M.F. Over the Adsorption in Solution. J. Phys. Chem. 1906, 57, 385–471. [Google Scholar]
  41. Temkin, M.I.; Pyzhev, V. Kinetics of Ammonia Synthesis on Promoted Iron Catalysts. Acta Physicochim. USSR 1940, 12, 327–356. [Google Scholar]
  42. Dubinin, M.M.; Radushkevich, L.V. The equation of the characteristic curve of the activated charcoal. Proc. Acad. Sci. Phys. Chem. Sect. 1947, 55, 331–337. [Google Scholar]
  43. Persson, I. Hydrated metal ions in aqueous solution: How regular are their structures? Pure Appl. Chem. 2010, 82, 1901–1917. [Google Scholar] [CrossRef]
  44. Rakhym, A.B.; Seilkhanova, G.A.; Mastai, Y. Physicochemical evaluation of the effect of natural zeolite modification with didodecyldimethylammonium bromide on the adsorption of Bisphenol-A and Propranolol Hydrochloride. Microporous Mesoporous Mater. 2021, 318, 111020. [Google Scholar] [CrossRef]
  45. Zahed, M.; Parsamehr, P.S.; Tofighy, M.A.; Mohammadi, T. Synthesis and functionalization of graphene oxide (GO) for salty water desalination as adsorbent. Chem. Eng. Res. Des. 2018, 138, 358–365. [Google Scholar] [CrossRef]
  46. Méndez, A.; Gascó, G. Optimization of water desalination using carbon-based adsorbents. Desalination 2005, 183, 249–255. [Google Scholar] [CrossRef]
  47. Tsutsui, D.; Takaaki, W. Desalination of seawater using calcined hydrotalcite with different MG/AL ratio esteem. Acad. J. 2017, 13, 195–204. [Google Scholar]
  48. Nel, M.; Frans, B.W.; Fosso-Kankeu, E. Adsorption Potential of Bentonite and Attapulgite Clays Applied for the Desalination of Sea Water. In Proceedings of the 6th Int’l Conf. on Green Technology, Renewable Energy & Environmental Engg, Cape Town, South Africa, 27–28 November 2014; pp. 171–175. [Google Scholar]
  49. Knauss, K.G.; Thomas, J.W. Muscovite dissolution kinetics as a function of pH and time at 70 °C. Geochim. Cosmochim. Acta 1989, 53, 1493–1501. [Google Scholar] [CrossRef]
  50. Csavdari, A.; Rakhym, A.; Seilkhanova, G. Preliminary Assessment of Modified Kazakh Natural Zeolites as Possible Sorbents for MnO4- Removal from Aqueous Solutions. Studia Universitatis Babeș-Bolyai Chemia 2018, 63, 181–192. [Google Scholar] [CrossRef]
  51. Chen, Y.; Brantley, S.L. Temperature- and pH-dependence of albite dissolution rate at acid pH. Chem. Geol. 1997, 135, 275–290. [Google Scholar] [CrossRef]
  52. Chutia, P.; Kato, S.; Kojima, T.; Satokawa, S. Arsenic adsorption from aqueous solution on synthetic zeolites. J. Hazard. Mater. 2009, 162, 440–447. [Google Scholar] [CrossRef] [PubMed]
  53. Bergaya, F.; Vayer, M. CEC of clays: Measurement by adsorption of a copper ethylenediamine complex. Appl. Clay Sci. 1997, 12, 275–280. [Google Scholar] [CrossRef]
  54. Peng, S.; Tang, Z.; Jiang, W.; Wu, D.; Hong, S.; Xing, B. Mechanism and performance for adsorption of 2-chlorophenol onto zeolite with surfactant by one-step process from aqueous phase. Sci. Total Environ. 2017, 581–582, 550–558. [Google Scholar] [CrossRef] [PubMed]
  55. Fard, R.F.; Aminabad, M.S.; Hadi, M.; Gholami, M.; Mirzaei, N. Sorption of acid dye by surfactant modificated natural zeolites. J. Taiwan Inst. Chem. Eng. 2015, 59, 186–194. [Google Scholar] [CrossRef]
  56. Steele, D.; Lindon, J.C.; Tranter, G.E.; David, W. Koppenaa IR Spectroscopy, Theory. In Encyclopedia of Spectroscopy and Spectrometry, 3rd ed.; Elsevier: Amsterdam, The Netherlands, 2017; Volume 11, pp. 463–468. [Google Scholar]
  57. White, R.L. Chromatography-IR, Methods and Instrumentation. In Encyclopedia of Spectroscopy and Spectrometry, 3rd ed.; Elsevier: Amsterdam, The Netherlands, 2017; Volume 12, pp. 251–255. [Google Scholar] [CrossRef]
  58. Gorzin, F.; Bahri, M.M.; Abadi, R. Adsorption of Cr(VI) from aqueous solution by adsorbent prepared from paper mill sludge: Kinetics and thermodynamics studies. Adsorpt. Sci. Technol. 2017, 36, 149–169. [Google Scholar] [CrossRef]
  59. Khan, S.; Idrees, M.; Bilal, M. Revealing and elucidating chemical speciation mechanisms for lead and nickel adsorption on zeolite in aqueous solutions. Colloids Surf. A Physicochem. Eng. Asp. 2021, 623, 126711. [Google Scholar] [CrossRef]
  60. Kang, Y.R.; Mu, B.; Zhu, G.; Zhu, Y.F.; Wang, A.Q. Preparation and Properties of Antibacterial Polyhexamethylene Biguanide/Palygorskite Composites as Zearalenone Adsorbents. Clays Clay Miner. 2022, 70, 182–195. [Google Scholar] [CrossRef]
  61. Simonin, J.P. On the comparison of pseudo-first order and pseudo-second order rate laws in the modeling of adsorption kinetics. Chem. Eng. J. 2016, 300, 254–263. [Google Scholar] [CrossRef]
  62. Revellame, E.D.; Fortela, D.L.; Sharp, W.; Hernandez, R.; Zappi, M.E. Adsorption kinetic modeling using pseudo-first order and pseudo-second order rate laws: A review. Clean. Eng. Technol. 2020, 1, 100032. [Google Scholar] [CrossRef]
  63. Chabani, M.; Amrane, A.; Bensmaili, A. Kinetic modelling of the adsorption of nitrates by ion exchange resin. Chem. Eng. J. 2006, 125, 111–117. [Google Scholar] [CrossRef]
  64. Lagergren, S.Y. Zur Theorie der sogennanten Adsorption gelöster Stoffe. K. Sven. Vetenskapsakad. Handl. 1898, 24, 1–39. [Google Scholar]
  65. Ho, Y.S.; Mckay, G. Pseudo-second order model for sorption processes. Process Biochem. 1999, 34, 451–465. [Google Scholar] [CrossRef]
  66. Horsfall, M.; Abia, A.A.; Spiff, A.I. Kinetic studies on the adsorption of Cd2+, Cu2+ and Zn2+ ions from aqueous solutions by cassava (Manihot sculenta Cranz) tuber bark waste. Bioresour. Technol. 2006, 97, 283–291. [Google Scholar] [CrossRef]
  67. Zarei, M.; Djafarzadeh, N.; Khadir, L. Removal of direct blue 129 from aqueous medium using surfactant-modified zeolite: A neural network modeling. Environ. Health Eng. Manag. J. 2018, 5, 101–113. [Google Scholar] [CrossRef]
  68. Turku, I.; Sainio, T.; Paatero, E. Thermodynamics of tetracycline adsorption on silica. Environ. Chem Lett 2007, 5, 225–228. [Google Scholar] [CrossRef]
  69. Scherer, H.W. Fertilizers and Fertilization; Hillel, D.B.T.-E., Ed.; Elsevier: Oxford, UK, 2005; pp. 20–26. ISBN 978-0-12-348530-4. [Google Scholar]
Figure 1. Effect of acid concentration on AS adsorption (solid/liquid = 1:100; T = 298 K; pH = 6.85 ± 0.25; C0 (Na+, K+, Cl) = 100 mg/L; contact time = 3 h).
Colloids 07 00061 g001
Figure 2. X-ray diffraction patterns of silicate before (S) and after (AS) acid activation.
Colloids 07 00061 g002
Figure 3. SEM images of silicate before (a) and after (b) acid activation.
Colloids 07 00061 g003
Figure 4. IR spectra of the silicate samples after (AS) and before (S) acid activation.
Colloids 07 00061 g004
Figure 5. Effect of external factors on Na+, K+ and Cl adsorption onto AS: (A) adsorbent mass (T = 298 K; C H N O 3 = 1 mol/L; pH = 6.85 ± 0.25; C0 (Na+, K+, Cl) = 100 mg/L; contact time = 3 h); (B) pH (solid/liquid = 1:100; T = 298 K; C H N O 3 = 1 mol/L; C0 (Na+, K+, Cl) = 100 mg/L; contact time = 3 h).
Colloids 07 00061 g005
Figure 6. Effect of initial ion concentration on Na+, K+ and Cl adsorption onto AS (A) and S (B) (solid/liquid = 1:100; T = 298 K; C H N O 3 = 1 mol/L; pH = 6.85 ± 0.25; contact time = 3 h).
Colloids 07 00061 g006
Figure 7. Effect of contact time on Na+, K+ and Cl adsorption onto AS (A) and S (B) (solid/liquid = 1:10; T = 298 K; C H N O 3 = 1 mol/L; pH = 6.85 ± 0.25; C0 (Na+, K+, Cl) = 100 mg/L).
Colloids 07 00061 g007
Figure 8. Effect of temperature on Na+, K+, Cl adsorption onto AS (solid/liquid = 1:100; C H N O 3 = 1 mol/L; pH = 6.85 ± 0.25; C0 (Na+, K+, Cl) = 100 mg/L; contact time = 3 h).
Colloids 07 00061 g008
Figure 9. Effect of external factors on K+/Na+ desorption from AS: (A) acid concentration (solid/liquid = 1:5; contact time = 24 h; C0 = 1000 mg/L); (B) solid/liquid ratio (contact time = 2 h, CHNO3 = 0.1 M, C0 = 1000 mg/L); (C) contact time (solid/liquid = 1:100, CHNO3 = 0.1 M, C0 = 1000 mg/L).
Colloids 07 00061 g009
Figure 10. Five consecutive adsorption (A,B) and desorption (C,D) cycles with AS.
Colloids 07 00061 g010
Table 1. Extraction degree of salinity ions with silicate (S) and acid-activated silicate (AS), solid/liquid 1:100; T = 298 K; pH = 6.85 ± 0.25; C0 = 5000 mg/L; contact time= 3 h.
AdsorbentE, %qmax, mg/g
Na+K+ClNa+K+Cl
S15.11 ± 1.8316. 19 ± 2.317.27 ± 1.0810.0 ± 1.214.5 ± 2.03.5 ± 0.2
AS22.14 ± 2.2538.06 ± 1.9414.59 ± 3.1113.0 ± 1.728.5 ± 2.75.5 ± 0.4
Table 2. Comparison of maximum adsorption capacities of Na+, K+ and Cl ions using various adsorbents.
MaterialActivation MethodQe Na mg/gQe K mg/gQe Cl mg/gReference
Kyzylsok silicate soilAcid
HNO3
13.0028.505.50This work
Bentonite-5.61 a0.91 a-[48]
Attapulgite-15.22 a0.87 a-[48]
Layered-double-hydroxideCalcination--122.20[32]
Natural clinoptiloliteNa+ followed by acid (HCl)8.7021.20-[32]
HydrotalciteCalcination14.059.400.95[47]
Graphene oxideChitosan functionalization830.00--[45]
Carbon material from sewage sludgePyrolysis84.00 a72.00 a-[46]
a The value was not given by the authors and was calculated based on the other results reported in the reference.
Table 3. Mineral composition of S and AS.
MineralContent, %
SAS
Quartz47.1156.91
Albite20.0219.16
Calcite16.3713.44
Muscovite9.422.96
Clinochlore7.077.53
Table 4. CEC, PZC and textural characteristics of S and AS.
ParameterSAS
CEC (meq/100 g)850.88 ± 0.54168.19 ± 0.08
Na+186.56 ± 0.32122.71 ± 0.07
K+13.800 ± 0.00413.980 ± 0.001
Ca2+543.78 ± 0.238.850 ± 0.0005
Mg2+106.73 ± 0.0322.650 ± 0.001
Surface area, m2/g4256
pHpzc10.11 ± 0.05 5.12 ± 0.02
Table 5. Elemental (EDAX) analysis of silicate before (S) and after (AS) acid activation.
Element, wt%CONaMgAlSiKCaFeTi
S10.5341.120.881.737.3920.022.308.486.381.16
AS5.0141.541.091.8710.2929.652.910.696.270.67
Table 6. Kinetic parameters of Na+, K+ and Cl ions’ adsorption onto AS.
SampleOrderParameterNa+K+Cl
SPseudo-firstEquationy = −0.0109x − 2.3903y = −0.0083x − 2.6842y = −0.0119x − 3.6142
k1, min−1 × 1021.090.831.19
qe, mg/g0.090.070.03
R20.91950.66560.5453
Pseudo-secondEquationy = 7.0022x + 641.36y = 6.5197x + 119.23y = 14.483x + 43.916
k2, g × mg−1 × min−1 × 1027.9537.264.65
qe, mg/g0.140.150.07
R20.91430.99620.9973
ASPseudo-firstEquationy = −0.0186x + 0.5702y = −0.0268x + 1.0486y = −0.0231x + 0.3752
k1, min−1 × 1021.862.682.31
qe, mg/g1.772.851.46
R20.96860.96280.9881
Pseudo-secondEquationy = 0.4026x + 10.694y = 0.2373x + 3.9705y = 0.483 x + 28.948
k2, g × mg−1 × min−1 × 1021.523.100.81
qe, mg/g2.484.212.07
R20.99500.99770.9277
Table 7. Thermodynamic parameters of Na+, K+ and Cl adsorption onto AC.
ParameterNa+K+Cl
298 K308 K318 K328 K298 K308 K318 K328 K298 K308 K318 K328 K
Δ G 0 , kJ/mol1.066.716.869.728.5610.6810.7311.434.034.504.657.60
Δ S 0 , J/mol∙K59.3426.12−105.26
Δ H 0 , J/mol2.611.85−2.81
Table 8. Content of microelements in leachates from spent AS samples.
Microelement Content, mg/kg
ASNa-FormK-FormNa-K-Form
Na88.72667.667.944485.6
K223.2541.054448.752156.25
Mg546.55493.1345.45129.99
Ca598256.058112.998252.3
Mn11.2313.598.1163.85
Cu0.3980.8280.2520.66
Fe25.32244.16235.5517.208
Disclaimer/Publisher’s Note: The statements, opinions and data contained in all publications are solely those of the individual author(s) and contributor(s) and not of MDPI and/or the editor(s). MDPI and/or the editor(s) disclaim responsibility for any injury to people or property resulting from any ideas, methods, instructions or products referred to in the content.

