Article

In Situ Dilatometry Measurements of Deformation of Microporous Carbon Induced by Temperature and Carbon Dioxide Adsorption under High Pressures

Frumkin Institute of Physical Chemistry and Electrochemistry, Leninskii Prospect, 31, Build. 4, Moscow 119071, Russia
*
Author to whom correspondence should be addressed.
Colloids Interfaces 2023, 7(2), 46; https://doi.org/10.3390/colloids7020046
Submission received: 28 February 2023 / Revised: 19 May 2023 / Accepted: 7 June 2023 / Published: 13 June 2023

Abstract

:
Adsorption-based carbon dioxide capture, utilization, and storage technologies aim to mitigate the accumulation of anthropogenic greenhouse gases that cause climate change. It is assumed that porous carbons as adsorbents are able to demonstrate the effectiveness of these technologies over a wide range of temperatures and pressures. The present study aimed to investigate the temperature-induced changes in the dimensions of the microporous carbon adsorbent Sorbonorit 4, as well as the carbon dioxide adsorption, by using in situ dilatometry. The nonmonotonic changes in the dimensions of Sorbonorit 4 under vacuum were found with increasing temperature from 213 to 573 K. At T > 300 K, the thermal linear expansion coefficient of Sorbonorit 4 exceeded that of a graphite crystal, reaching 5 × 10⁻⁵ K at 573 K. The CO2 adsorption onto Sorbonorit 4 gave rise to its contraction at low temperatures and pressures or to its expansion at high temperatures over the entire pressure range. An inversion of the temperature dependence of the adsorption-induced deformation (AID) of Sorbonorit-4 was observed. The AID of Sorbonorit-4 and differential isosteric heat of CO2 adsorption plotted as a function of carbon dioxide uptake varied within the same intervals of adsorption values, reflecting the changes in the state of adsorbed molecules caused by contributions from adsorbate–adsorbent and adsorbate–adsorbate interactions. A simple model of nanoporous carbon adsorbents as randomly oriented nanocrystallites interconnected by a disordered carbon phase is proposed to represent the adsorption- and temperature-induced deformation of nanocrystallites with the macroscopic deformation of the adsorbent granules.

1. Introduction

Carbon dioxide originated as a result of nature and anthropogenic activity. It is believed that increased carbon dioxide emissions contribute to climate change [1]. Three strategies to mitigate carbon dioxide emissions are proposed: (1) improvement of fossil fuel utilization and power efficiency of engines; (2) carbon dioxide sequestration; (3) carbon dioxide utilization in valuable branches of human activities [2]. Indeed, carbon dioxide has many applications. For example, it is used in medicine as a vasodilating agent [3]; intraoperative carbon dioxide insufflation was found to help to prevent surgical complications, including surgical site infection [4]. Carbon dioxide is utilized as renewable feedstock to produce chemicals and plastics [5,6] and unconventional biomass-derived fuels and biomaterials, following the concept of sustainable bioenergy [7,8,9]. Injecting carbon dioxide into depleted shale reservoirs or unminable coal seams is an important method to enhance oil and natural gas recovery [10,11,12,13]. This method is based on the dynamic displacement processes governed by the pressure gradient and competitive adsorption: gas shale and coal bed have a higher adsorption affinity for carbon dioxide compared to that of methane [11,12]. For example, the so-called “huff-n-puff” technology involves the underground injection of CO2 followed by displacing previously adsorbed methane and forming a CO2–CH4 mixture that causes a subsequent increase in the concentration of free methane within the rock [11,13,14]. It should be noted that the injection of CO2 in shale is one of the methods used to store CO2 in porous media [15,16].
All of the aforementioned uses of CO2 include adsorption processes. Most of these processes take place at high pressures. Therefore, in making efforts to develop new high-pressure adsorption-based technologies and to improve the existing ones, researchers need to consider the adsorption-induced deformation (AID) of adsorbents. This phenomena should be taken into account both when predicting the performance of the adsorbent, including its integrity [17,18], and evaluating the thermodynamic state functions of adsorption processes [19,20].
From almost a century’s worth of research, which began with the pioneering works of Mechan [21] and Bangham [22,23,24], it can be stated with confidence that there is a wealth of experimental evidence to suggest that an adsorbent, being a source of adsorption forces, experiences changes during adsorption. According to numerous macro- and microscopic experimental studies and computer simulations (see the reviews [25,26,27]), the adsorption of various gases and vapors can result in both expansion (as observed for the first time by Mechan and Bangham for charcoals [21,22,23,24]) and contraction (as reported by Lakhanpal and Flood for activated carbons [25]). The AID sign depends on the ratio of the sizes of pores and adsorbate molecules, as well as on the thermodynamic conditions of the adsorption process [25]. Therefore, a precise prediction of the AID sign and magnitude requires knowledge about the mechanism of this effect based on experimental data for various adsorbents. The deformation effects induced by CO2 adsorption have been explored for activated carbons [21,22,28,29,30,31], zeolites [32,33], zeolite membranes [34], and flexible metal-organic frameworks [35,36]. In order to establish the general pattern of AID phenomena, one needs to employ microscopic (X-ray diffraction [37], small angle X-ray scattering [38], small-angle neutron scattering [31]) and macroscopic (dilatometry [39], ellipsometric porosimetry [40]) experimental techniques. These methods offer the possibility of registering changes in the adsorbent state at different scales. At the same time, it is not possible to directly compare the results of microscopic and macroscopic measurements because these two methods exhibit different sensitivities to anisotropic AID effects [27,41] and the pore size distribution [42].
It would make sense to thoroughly investigate the AID effect in an adsorbent with a certain type of pores over a wide range of pressures and temperatures. For this purpose, we employed the macroscopic dilatometry method to examine the AID effect in a carbon adsorbent, which contains predominantly slit-like micropores, from the early stage of adsorption to the high-pressure region. We selected carbon dioxide and a carbon adsorbent in the context of the relevance of these effects for the above-mentioned technologies for enhancing oil and natural gas recovery and CO2 geological storage.
We started with a thorough characterization of the adsorbent using scanning electron microscopy (SEM) and low-temperature nitrogen adsorption. We then carried out the carbon dioxide measurements within a wide temperature range, including sub- and supercritical states of carbon dioxide up to a pressure of 0.1 Mpa. We used experimental data and an approach based on Dubinin’s theory of the volume filling of micropores [43,44] to calculate the carbon dioxide adsorption up to high pressures. We employed a dilatometer to assess the changes in the sizes of the adsorbent induced by temperature in order to take into account the thermal expansion when measuring the AID of the carbon adsorbent at different temperatures up to 6 Mpa.
Finally, we calculated the thermodynamic state functions of the carbon dioxide adsorption on the microporous carbon adsorbent using the well-known formula by Bakaev, which includes the effects of the non-ideality of a gaseous phase and the non-inertness of an adsorbent [45]. Here, the non-inertness of the adsorbent characterizes its inability to maintain its dimensions during adsorption or with a change in temperature, i.e., adsorption- or temperature-induced deformation.

2. Materials and Methods

2.1. Adsorbent

We studied a commercial carbon adsorbent, Sorbonorit 4, produced by Cabot Norit Nederland B.V. (Amersfoort, The Netherlands) from a peat-based carbon-rich raw material via thermochemical activation [46]. Sorbonorit 4 cylindrical pellets, which were 6.8 in length and 3.7 mm in diameter, were used in the adsorption, temperature- and adsorption-induced deformation measurements.

2.2. Adsorptive

In the experiments, we used high purity carbon dioxide (99.995%), purchased from Linde Gas Rus (Balashikha, Moscow Region, Russia), as an adsorptive. The basic physicochemical properties of carbon dioxide are summarized in Table 1.

2.3. Methods

2.3.1. Characterization of Adsorbent

The porous structure characteristics of Sorbonorit 4 were acquired from the data on nitrogen vapor adsorption at 77 K, obtained with the use of a Quantachrome IQ commercial porous structure analyzer. Dubinin’s theory of volume filling of micropores (TVFM) [43,44] was used to calculate the following microporosity parameters of the adsorbent: the micropore volume W0 [cm3/g], the standard characteristic energy of adsorption E0 [kJ/mol], and the micropore width X0 [nm].
The microporosity parameters were evaluated from the experimental data on low-temperature nitrogen vapor adsorption using the general TVFM equation, namely the Dubinin–Astakhov equation [43,44]:
a = a 0 e x p A / E n ,
where A = RT ln (PS/P) [kJ/mol] is the differential molar work of adsorption; a0 [mmol/g] is the limiting value of adsorption at the temperature T [K], which depends on the specific volume of micropores W0; E [kJ/mol] is the characteristic energy of gas adsorption. It was found that, for activated carbons, the index of power (n), which depends on surface chemistry and the extent of uniformity of the pore structure, is equal to 2. Therefore, we used Equation (1) with n = 2, i.e., the Dubinin–Radushkevich (D-R) equation.
According to TVFM applied to a model of slit-like pores, the characteristic energy of adsorption of the test adsorptive is related to the effective half-width of micropores by the following formula:
E ( k J / m o l ) = 12 β X 0 ,
where β is the affinity coefficient for the test adsorptive (in this case, nitrogen vapors) with respect to the reference benzene vapors:
β = E E 0 = Π Π 0 .
Note that E0 is the standard characteristic energy of adsorption for benzene vapors; ∏ and ∏0 [(J1/4 × cm5/2)/mol] are the parachors of the test adsorptive (in this case, nitrogen vapors) and standard benzene vapors, respectively, which can be calculated as follows [50]:
Π = M · σ 1 4 ρ L ρ v a p o r ,
Here, σ [J/m2] is the surface tension; ρL and ρvapor are the densities of liquid and vapor at the boiling temperature.
The limiting value of adsorption on the line of saturation vapor pressure at the boiling point temperature Tb and the pressure Ps(Tb) is determined under the condition that, on the line of saturation and at T = Tb, the density of the adsorbate ρad is close to the density of the liquid ρL:
a 0 T = W 0 ρ ad W 0 ρ L .
The differential work of adsorption is calculated as follows:
A = R T l n f S f ,
Here, R is the universal gas constant; fS is the fugacity of the saturated adsorbed gas (vapor); f is the fugacity of the equilibrium phase.
The Brunauer–Emmett–Teller (BET) method [51] combined with the Rouquerol criterion [52] was employed to calculate the specific surface area SBET [m2/g]. The pore size distribution (PSD) function was derived using the quenched solid density functional theory (QSDFT) [53] for micropores. The mesopore structure of the adsorbent was characterized using a Kelvin equation-based approach [54]; the PSD function for mesopores was estimated by applying the Barret–Joyner–Halenda (BJH) method [55].
The surface morphology of Sorbonorit 4 and its elemental composition were studied via scanning electron microscopy (SEM) using a Quanta 650 FEG microscope (FEI Company, US) equipped with an Oxford Energy Dispersive X-ray (EDX) detector. The images were obtained at an accelerating voltage of 30 kV. The elemental composition was estimated as an average of three measurements.
The isotherms of carbon dioxide adsorption onto Sorbonorit 4 were measured gravimetrically using a custom-designed setup [56,57]. The measurements were carried out over the range of sub- and supercritical states of the adsorptive within a temperature range from 216.4 K (slightly below the ternary point of carbon dioxide) to 393 K up to a pressure of 0.1 MPa. The accuracy of the experimental measurements was calculated following the State Standards [58], and its value did not exceed 1.5 % with a confidence level of 0.95.

2.3.2. Measurements of the Sorbonorit 4 Deformation Induced by the Carbon Dioxide Deformation and Temperature

The isotherms of the deformation of the adsorbent granules induced by adsorption and temperature were measured using a custom-made dilatometer bench [39]. The scheme of the bench and the principle of its operation have been described in detail in previous works [39,59]. Here, we only provide a brief description. The bench consists of an induction-type dilatometer connected to a vacuum post and a gas supply system. The induction-type dilatometer is capable of performing measurements over a wide range of pressures (from 0.1 Pa to 10 MPa). The main element of the dilatometer is an induction-type displacement sensor, which consists of a reciprocating rod, a magnetic core, and an inductive coil arrangement outside the dilatometer housing. The magnetic core is connected to the rod mounted in the guidelines. The rod rests on a support plate contiguous to the adsorbent granules, which are arranged vertically in a pressure-tight measuring cell. Before a set of measurements, the Sorbonorit 4 granules were subjected to an adsorption stabilization procedure consisting of 25 adsorption/desorption cycles over a pressure range of 0.1 to 5 MPa at room temperature. By stabilizing the porous structure, we ensured the reproducibility of the experiments. Before each measurement of the set, the adsorbent granules were regenerated at elevated temperatures (up to 573 K) under vacuum for at least 6 h. Then, the cell with the adsorbent was filled with carbon dioxide under pressure. After reaching thermodynamic equilibrium in the measuring cell, the adsorption-induced deformation of Sorbonorit 4 caused the rod to move, thereby actuating the magnetic core. This displacement caused changes in electrical inductance within the inductive coil arrangement. The changes in the signal were used to determine the changes in the linear size of the Sorbonorit 4 granules at the specified temperature and pressure. It should be noted that pressure and temperature values were recorded. Thus, by progressively increasing the portions of injected carbon dioxide, we evaluated the changes in the size of the adsorbent granules as a function of the pressure at a given temperature.
The CO2 adsorption-induced deformation of Sorbonorit 4 was measured within a temperature range from 216.4 to 393 K and two pressure ranges corresponding to the subcritical and supercritical states: from 0.1 Pa up to the saturated vapor pressure at the corresponding temperature and from 0.1 Pa to 6 MPa, respectively. The deformation of the adsorbent was assumed to be isotropic, and this statement is in agreement with previously published estimates [60] and confirmed by experimental data [41]. The confidence level for estimating the magnitude of linear deformation of the adsorbent was ±5·10−7 m, which is in agreement with the State Standards [61]. On average, the measurement uncertainty of the relative linear deformation of the adsorbent was uc(η) = 2.0%, and the expanded uncertainty was U(η) = 6.0% at a confidence level of 0.95 [58]. The deformation of the Sorbonorit 4 granules induced by temperature was investigated under vacuum conditions at a residual pressure less than 1 Pa within a temperature range from 213 K to 573 K. Prior to the measurements, the sample was also regenerated under the same conditions—573 K and <0.1 Pa.

3. Results and Discussion

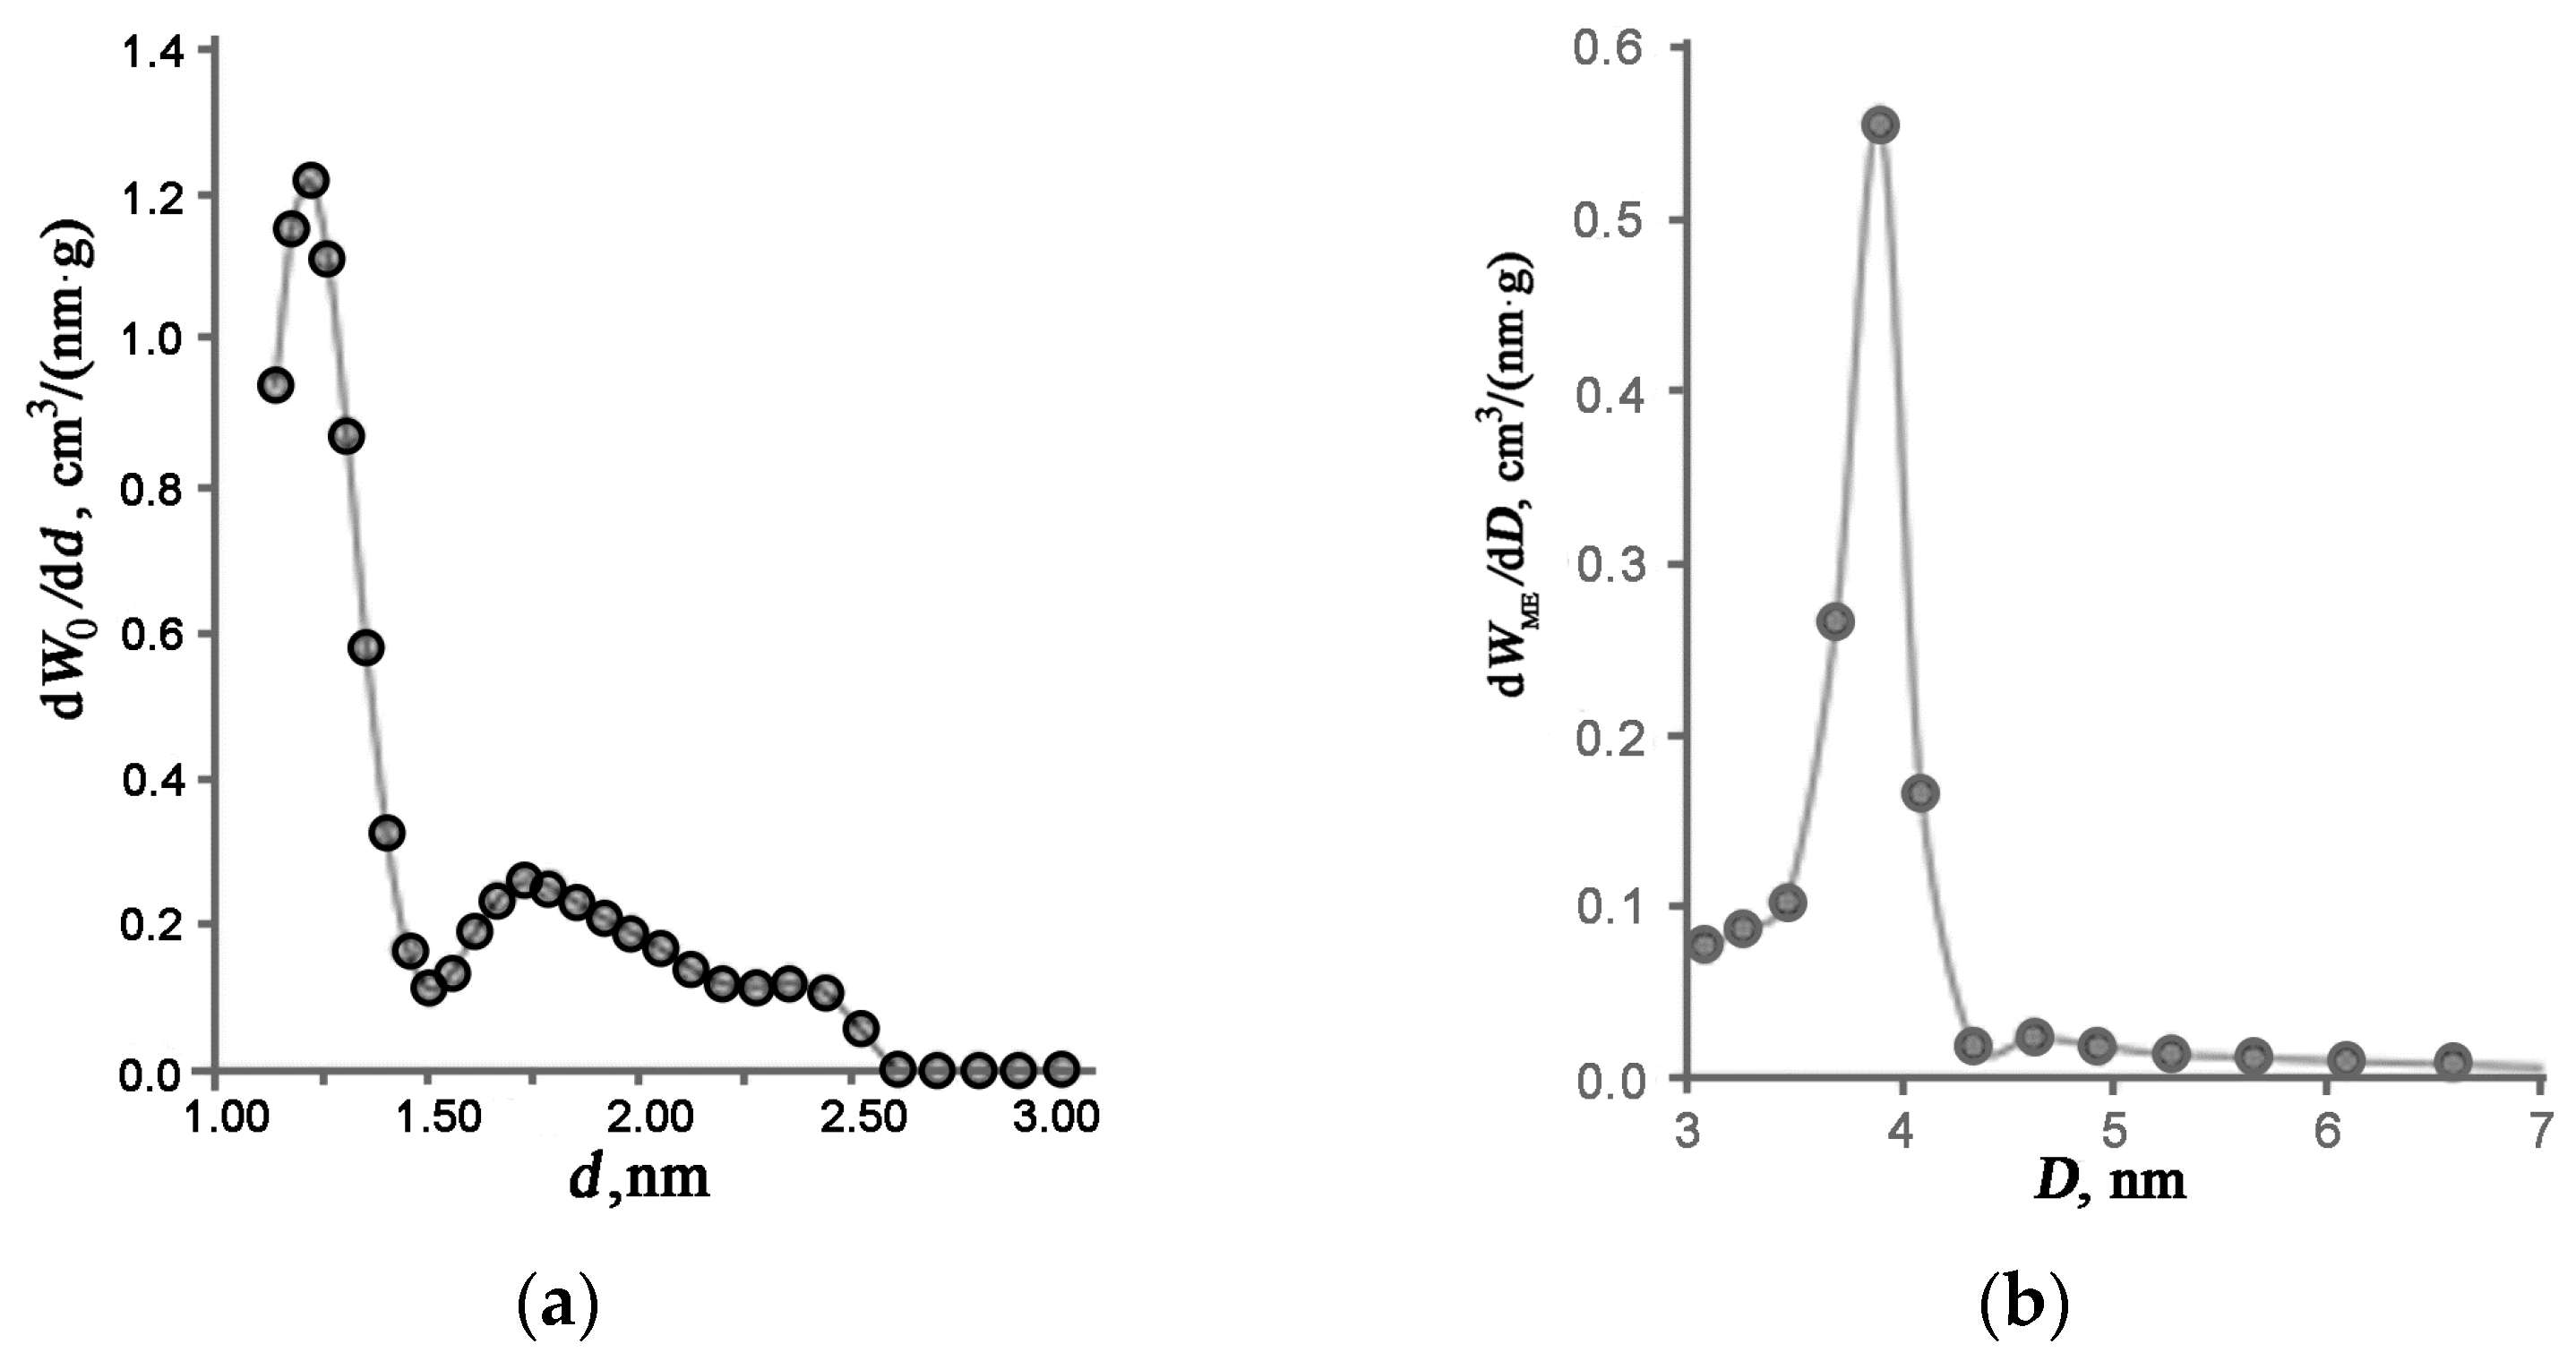
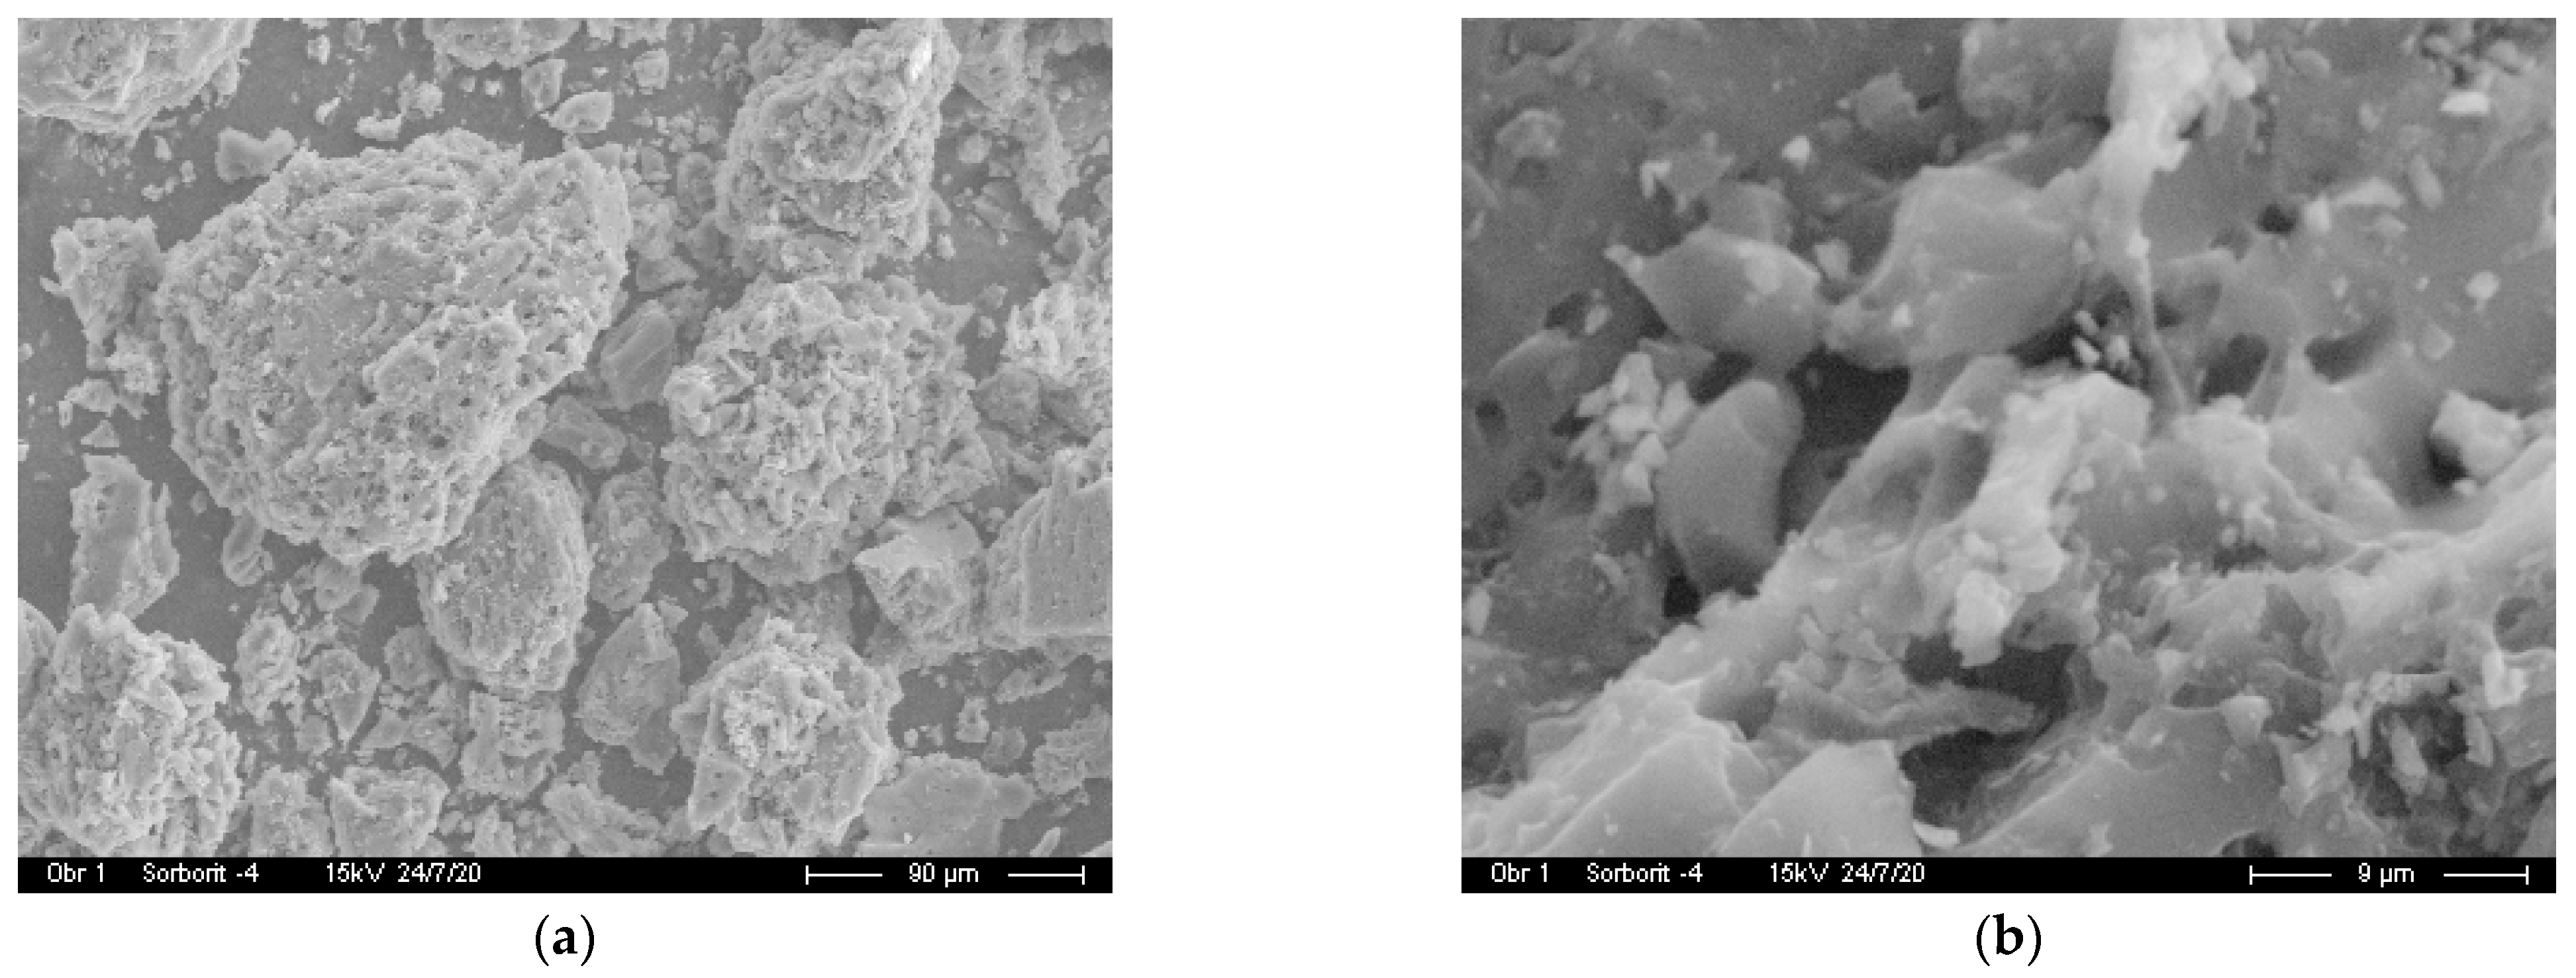
3.1. Characterization of the Adsorbent

Figure 1 shows the isotherms of standard nitrogen vapor adsorption/desorption at 77 K, which were used to calculate the structure and energy characteristics of the adsorbent.
The Γ-shaped (or type I) isotherm [62] of adsorption of nitrogen vapors at 77 K represented in linear coordinates within the initial values of relative pressure P/PS up to 0.3 indicates the presence of a developed micropore volume in Sorbonorit 4. A weakly defined H4 loop of the capillary condensation hysteresis [62] was observed in the pressure range close to the saturated vapor pressure, which was attributed to mesopores.
Table 1 summarizes the parameters of porous structure of Sorbonorit 4, which were evaluated from the low-temperature nitrogen adsorption isotherm.
Figure 2 shows the pore size distributions in Sorbonorit 4 evaluated for micropores (a) and mesopores (b) using the QSDFT and the BJH methods, respectively.
As follows from Figure 2, the pore structure of Sorbonorit 4 is characterized by the PSD function, with one well-defined peak corresponding to the micropore size d M A X N L D F T of 1.22 nm and a relatively wide peak corresponding to the mesopore size d M A X B J H of 3.9 nm. The average pore width calculated by applying the TVFM equations amounted to 1.1 nm (see Table 2), which is close to the value of d M A X N L D F T . As follows from Figure 2b and Table 2, the mesopore volume is less than 5% of the total pore volume. Dubinin showed that if the adsorbent pore structure involves mesopores with a surface area less than 25 m2/g, the adsorption in mesopores is insignificant compared to that in micropores [48], meaning that it can be neglected in the calculation of adsorption processes. Therefore, Sorbonorit 4 is primarily microporous, with a few mesopores acting as transport pores.
The SEM investigations of Sorbonorit 4 (Figure 3a,b) revealed that its surface is composed of various particle aggregates ranging in size from 10 to 30 μm. At higher magnification (Figure 3b), the stacked grains with a size of 1–5 μm are viewable. These irregular grains have a surface that is uneven and covered with cracks and cavities.
Table 3 presents the results of the EDX study on the elemental composition of Sorbonorit 4.
As follows from Table 3, Sorbonorit 4 is mostly carbon. The presence of other impurities is caused by the diverse composition of peat as a raw material and the activation method. There are many experimental studies evidencing that the presence of oxygen in carbon adsorbents has a direct effect on the adsorption capacity, including carbon dioxide [63,64].

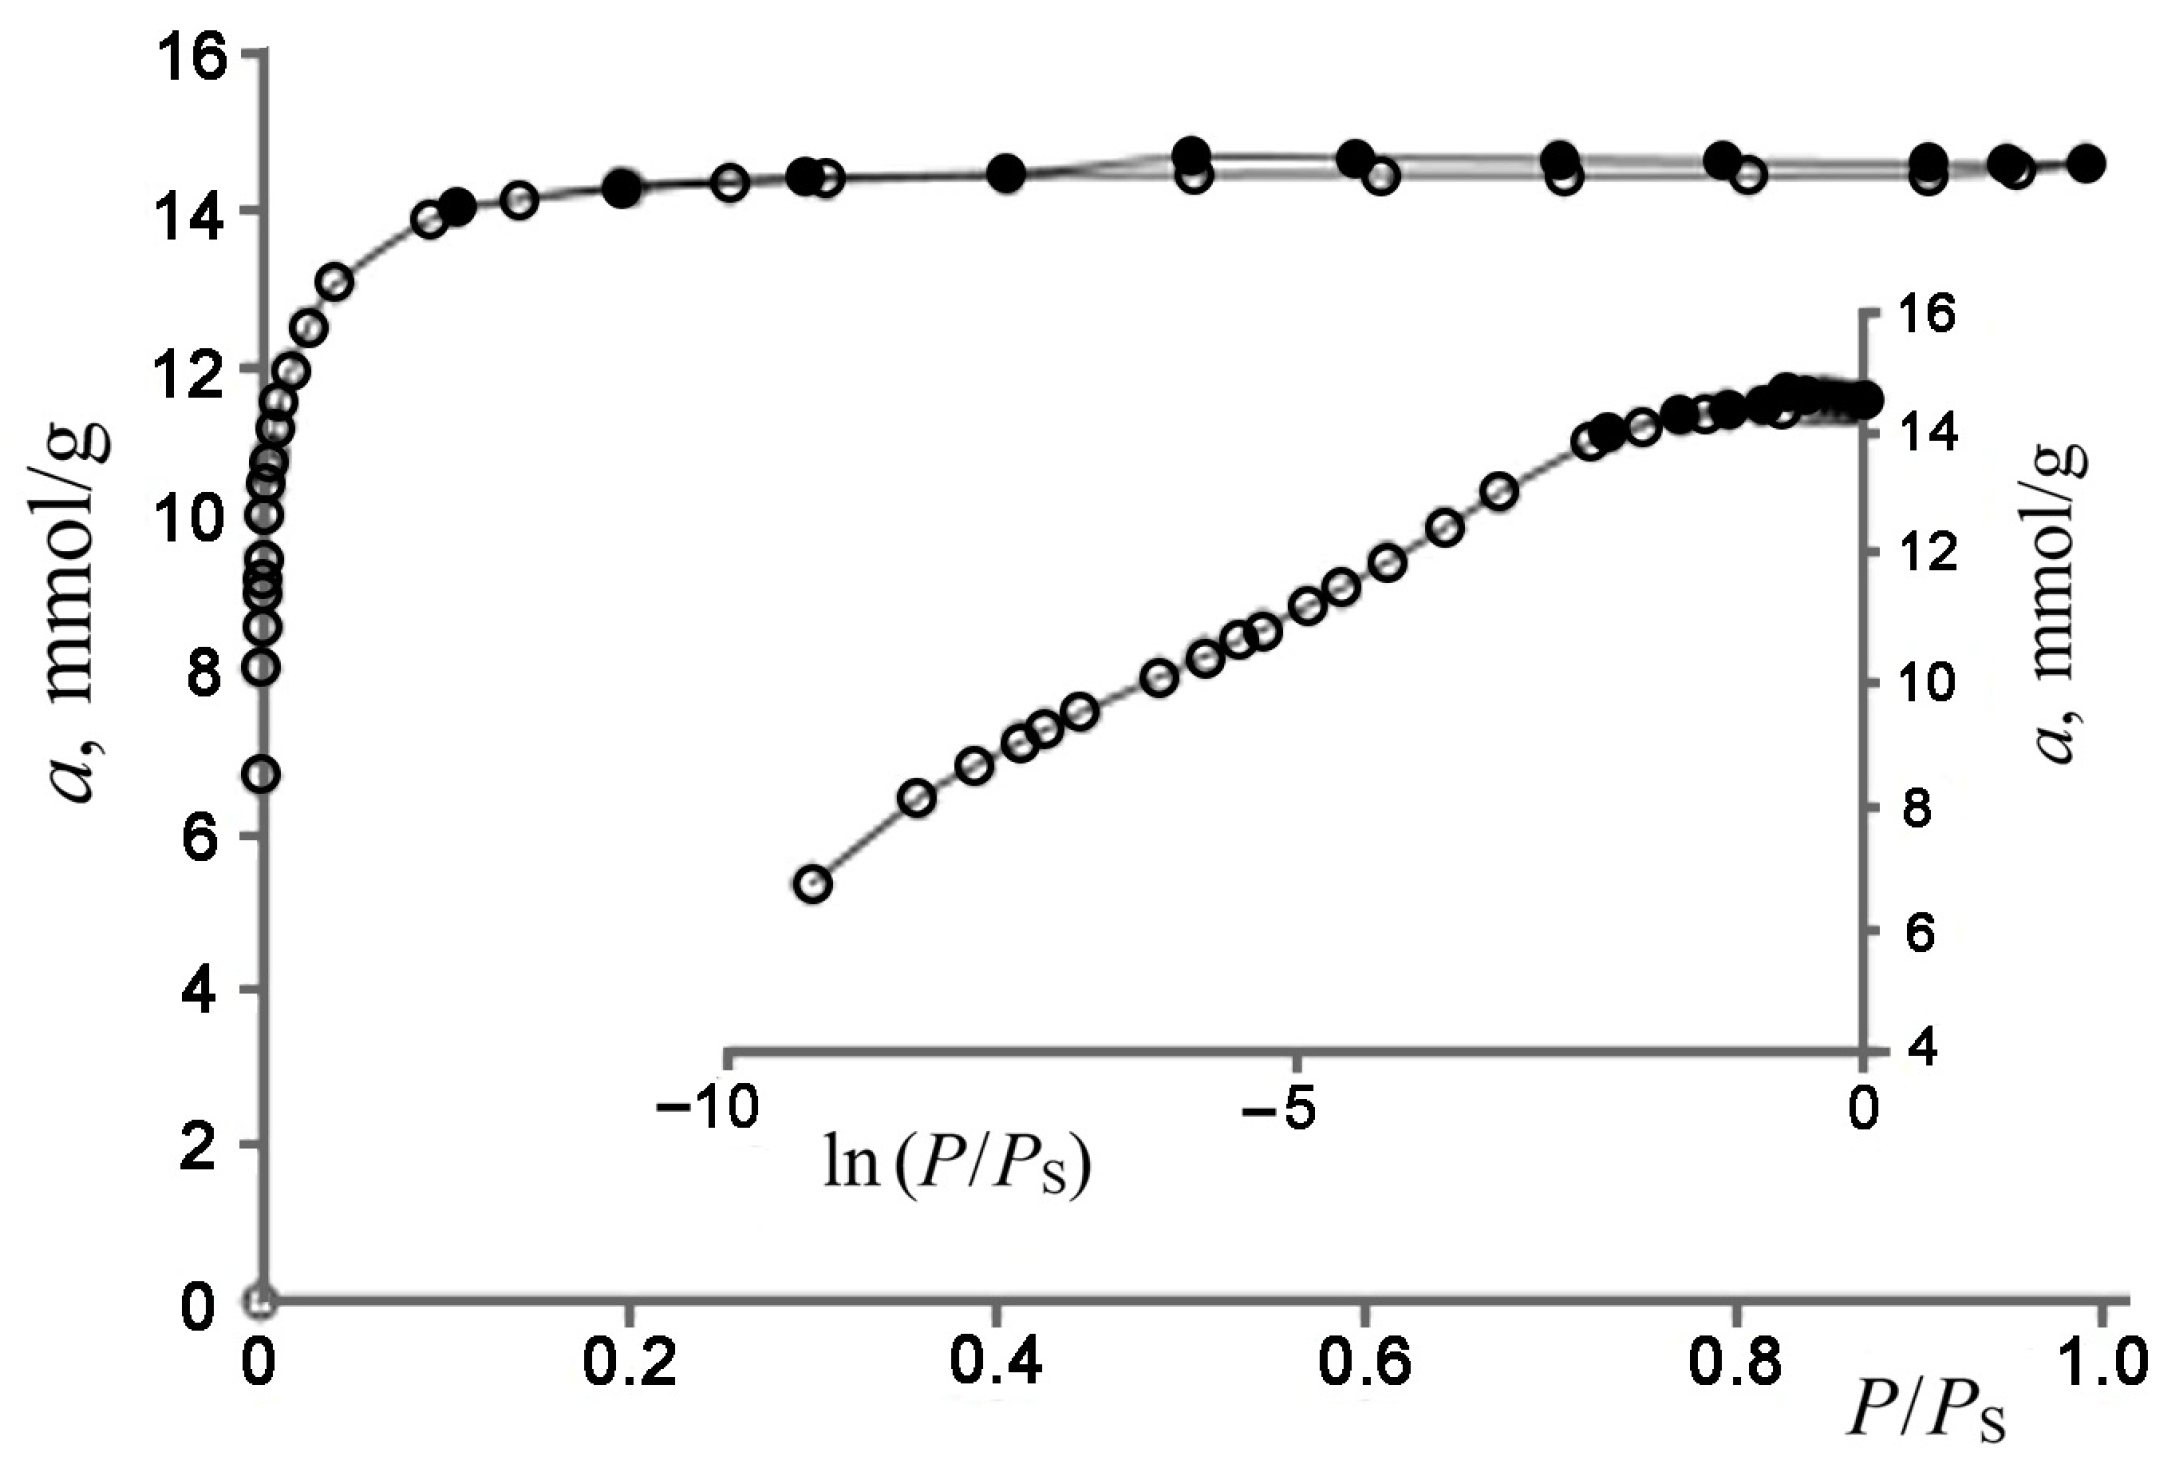
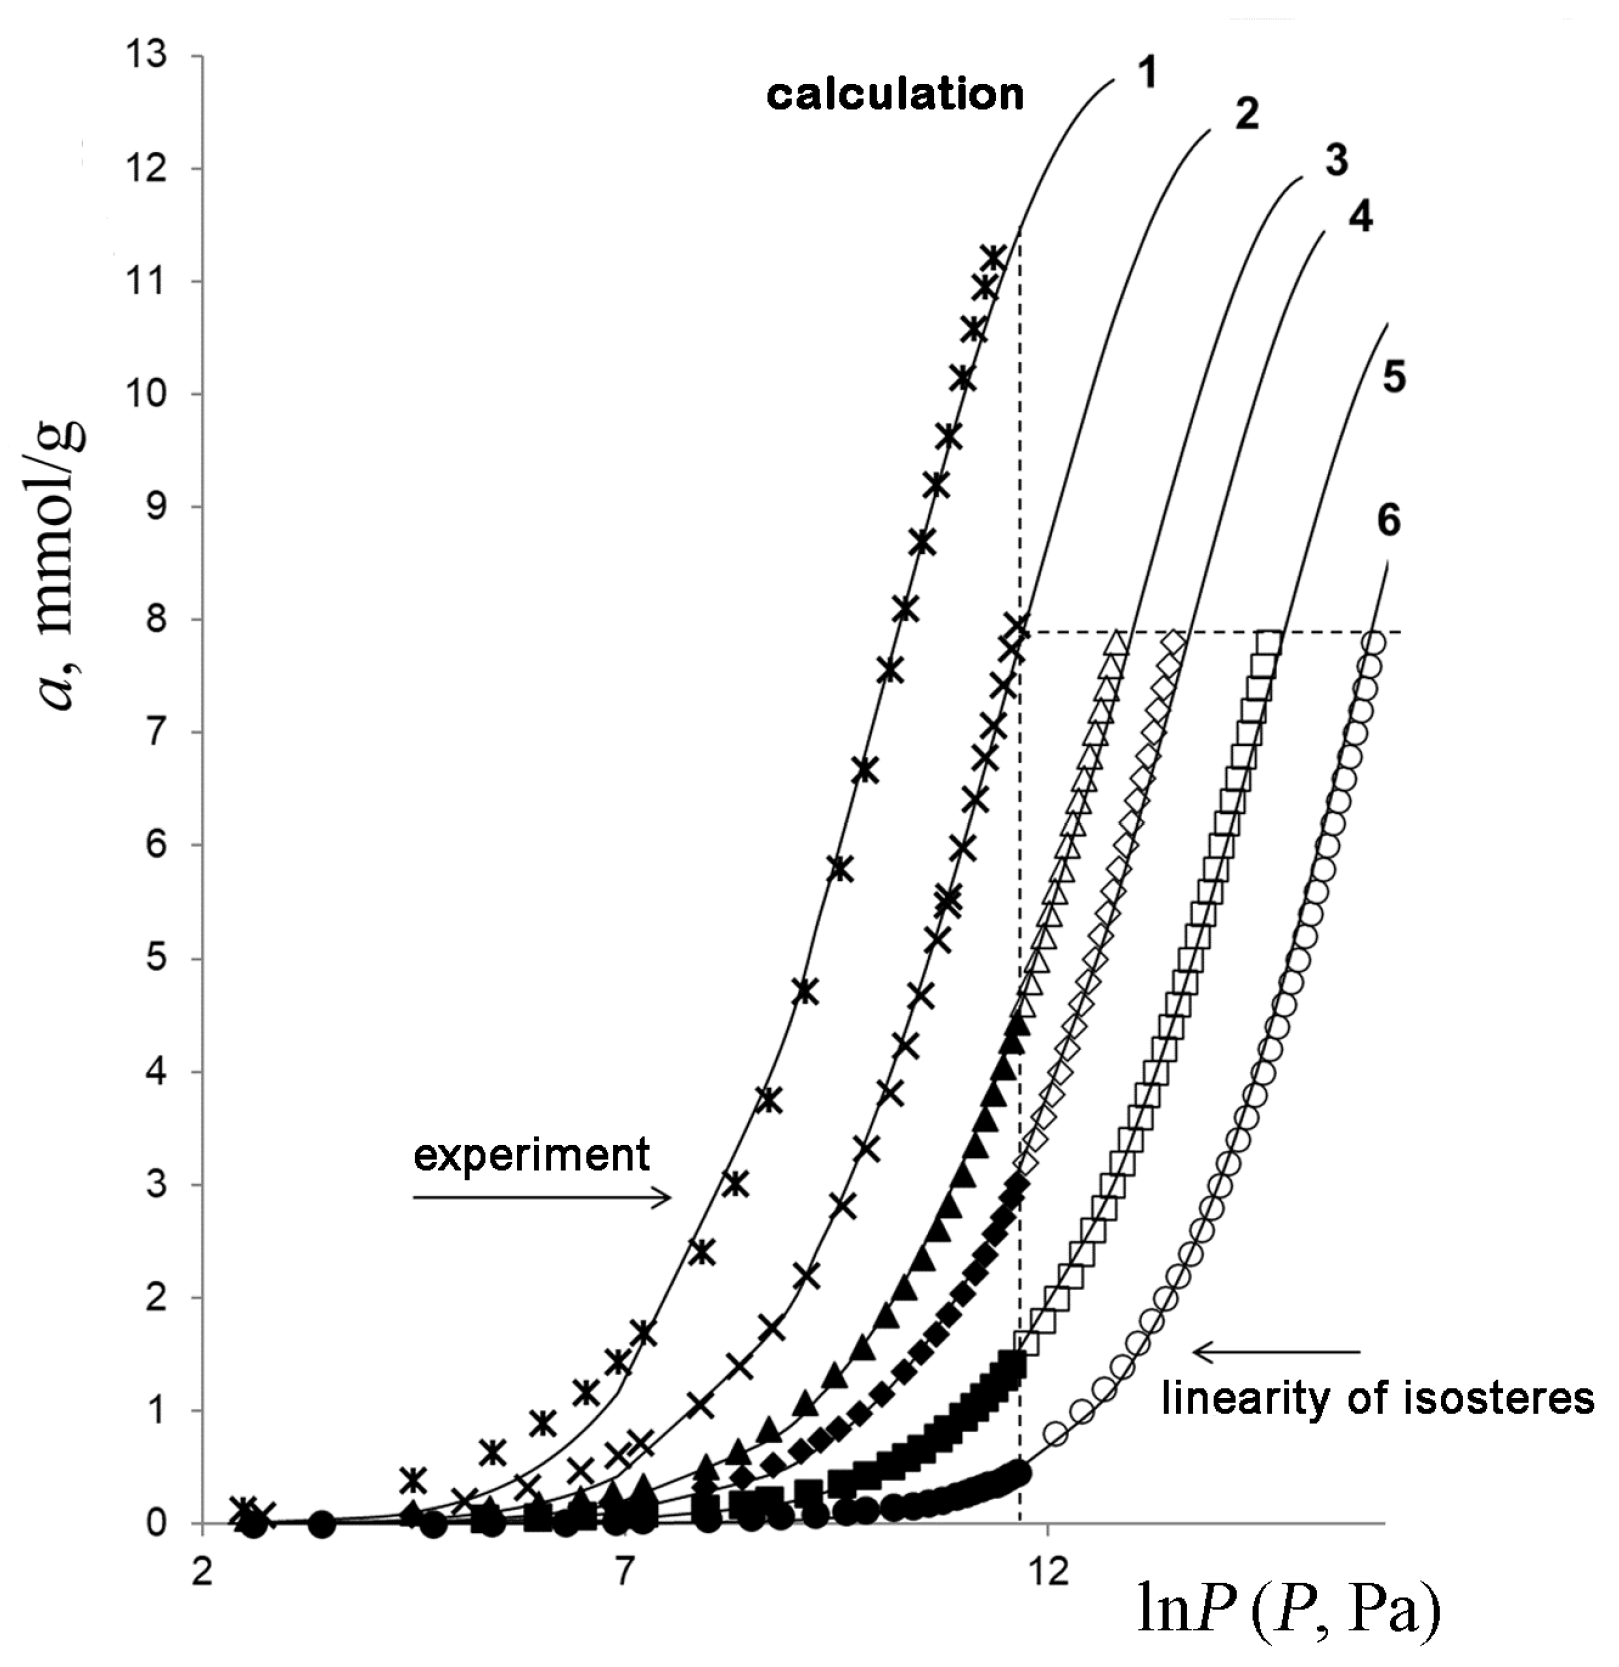
3.2. Carbon Dioxide Adsorption onto Sorbonorit 4

The experimental data of carbon dioxide adsorption onto Sorbonorit 4 measured within a temperature range from 216.4 to 393 K were used to plot the isosteres. As follows from Figure 4, the isostere plots lnP = f(1/T)∣a=const for carbon dioxide adsorption are linear throughout a wide range of temperatures and pressures, including the ranges of temperature: Tλ < T < Tcr, and Tcr < T. It should be noted that the linearity of the isosteres of adsorption, which is preserved upon transition to the supercritical (P > Pcr, T > Tcr) state of the adsorbing substance, is an intrinsic feature of adsorption in microporous adsorbents [65,66,67]. The linearity of the isosteres of adsorption makes it possible to calculate the adsorption equilibrium from the minimal set of experimental data.
To calculate the carbon dioxide adsorption equilibrium under sub- and supercritical conditions up to 20 MPa, we used the linearity of the isosteres and the TVFM equations.
We applied Equations(1)–(6) to the structural and energy characteristics of Sorbonorit 4 deduced from the data on low-temperature nitrogen vapor adsorption (see Table 2) and the physicochemical characteristics of carbon dioxide (Table 1) to calculate the carbon dioxide adsorption equilibrium over the sub- and supercritical conditions.
As indicated in Section 2.3.1, at boiling point, the limiting adsorption can be calculated using Equation (5). However, within a temperature range from the boiling point Tb to the critical value Tcr, the limiting adsorption was evaluated using the Dubinin–Nikolaev formula [68]:
a 0 T = a 0 T b e x p α ( T T b ) ,
Here, α [1/K] is the thermal coefficient of limiting adsorption: α > 1, i.e., the adsorption values decrease as the temperature increases. Within a temperature range TbTTcr, the value of α is assumed to be constant [68]:
α = d l n a 0 d T = c o n s t .
The isotherms of carbon dioxide adsorption at temperatures T > Tcr (supercritical state) were also calculated using Equation (1), where the saturated pressure Ps was determined by the linear extrapolation of a function:
ln P s T = M N T .
Here, M and N are the constants, which may be evaluated for carbon dioxide from two characteristic points: (Tb, Ps) and (Tcr, Pcr). The limiting adsorption a0 at the saturation pressure was found by linear extrapolation of the Dubinin–Nikolaev Equation (7).
When calculating the adsorption equilibrium in the region of supercritical temperatures using Equation (1), we also considered the temperature dependence of both the characteristic energy E and the exponent n [69].
Figure 5 shows the experimental data and the results of calculations of carbon dioxide adsorption over temperatures ranging from 216.4 to 393 K and at pressures up to 20 MPa. As can be seen, the results of calculations using the TVFM equations (solid lines) coincide with both the experimental data on carbon dioxide adsorption (dark symbols) and the results obtained from the extrapolation of linear isosteres (light symbols).
It should be noted that the isotherms of carbon dioxide adsorption onto Sorbonorit 4 represented as a = f (lnp) have a characteristic S-shape. With increasing temperature, the curves move almost in parallel towards high pressures.

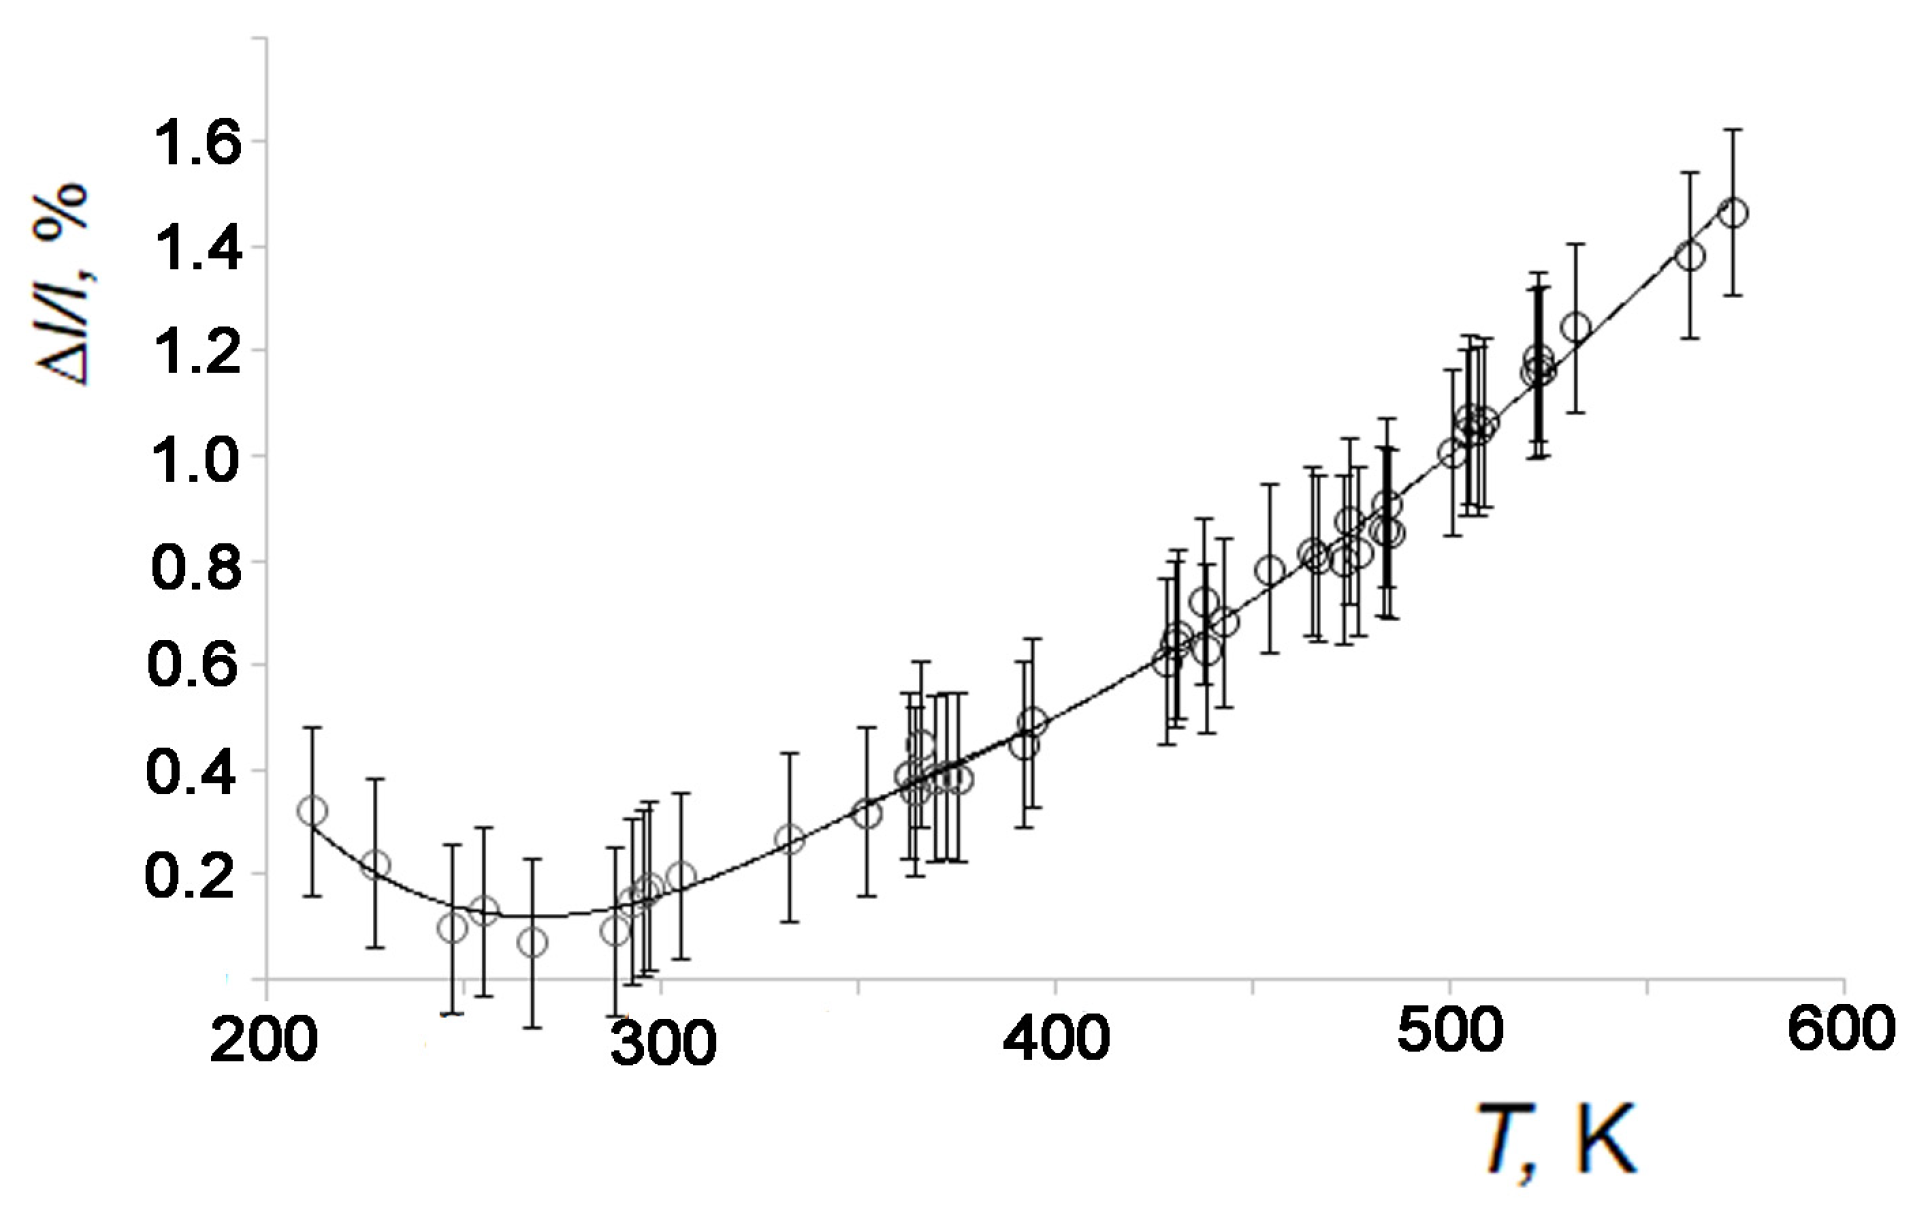
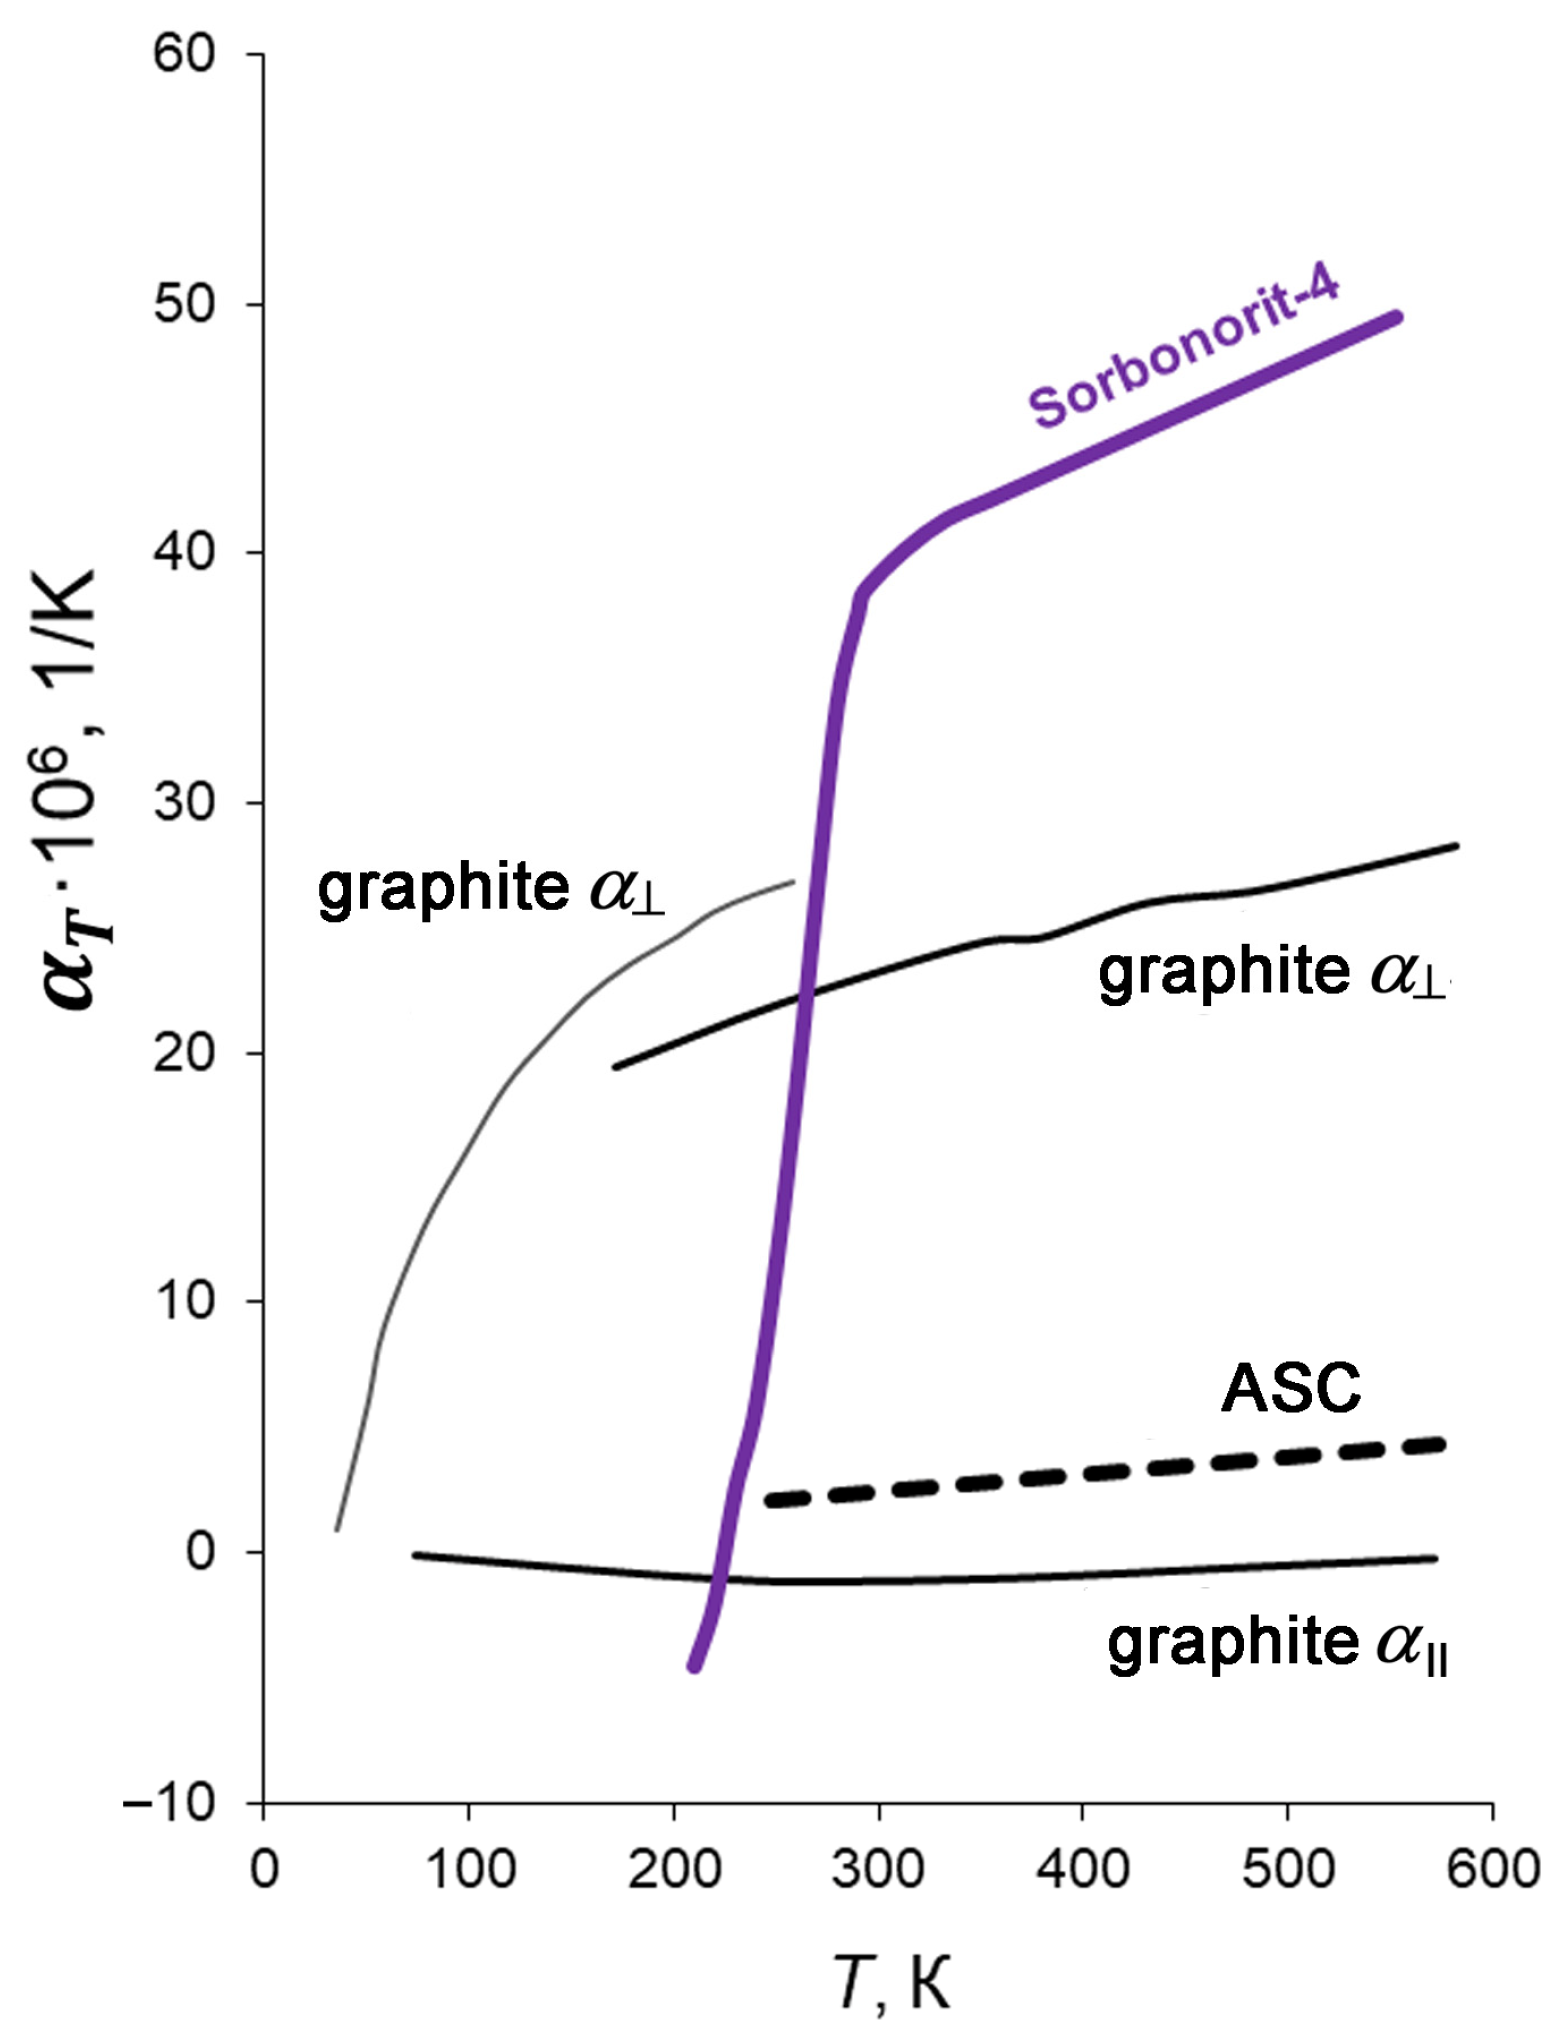
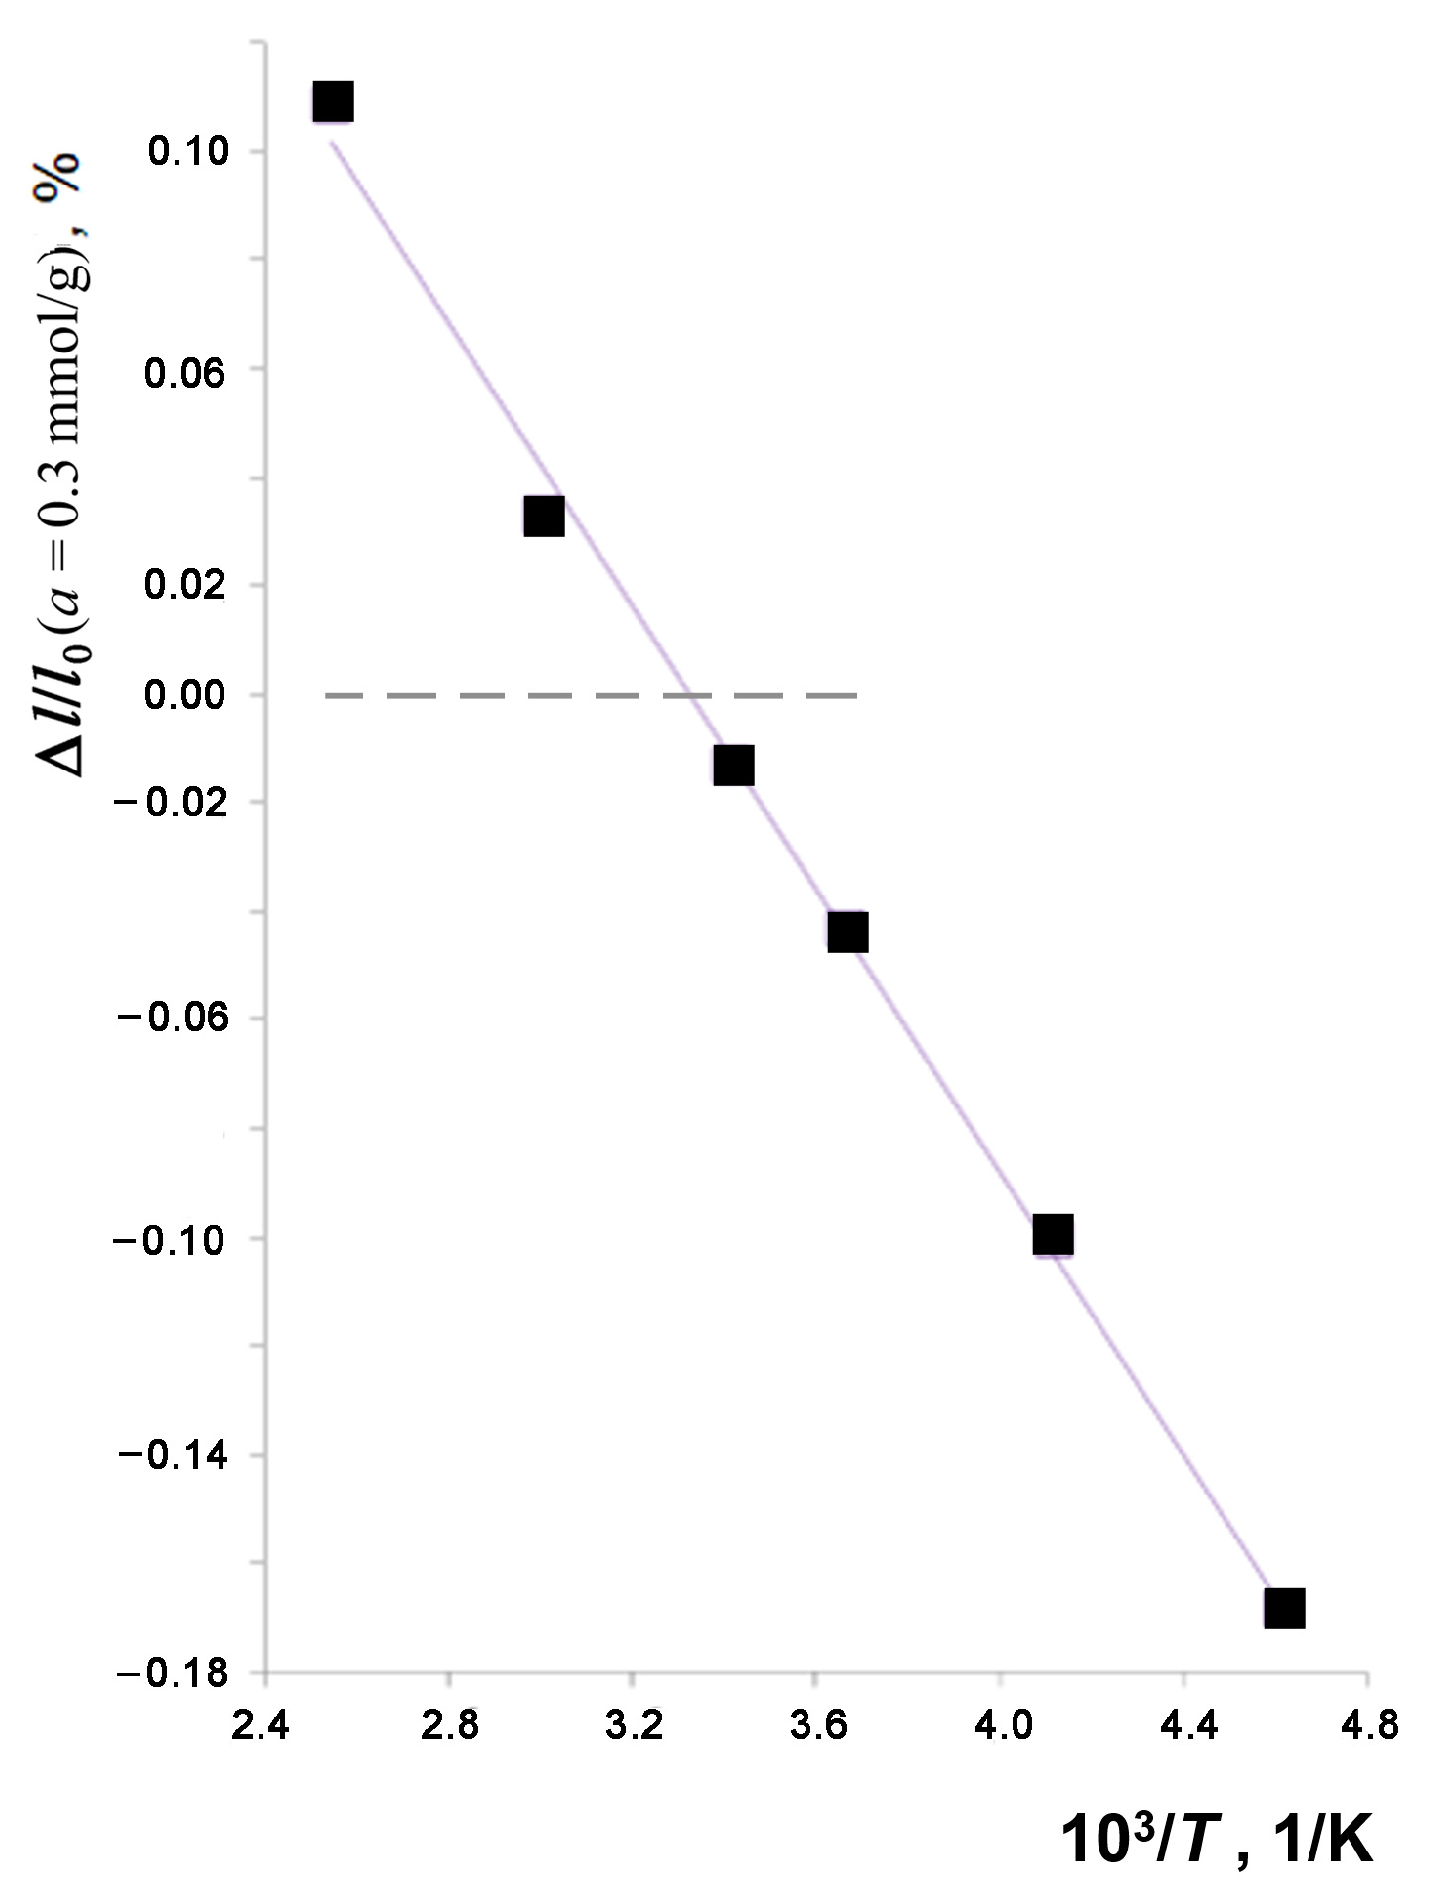
3.3. Temperature-Induced Deformation of Sorbonorit 4

Figure 6 depicts the results of the temperature-induced strain of Sorbonorit 4 measured under vacuum; the constant error determined from the measurements with a quartz mockup was taken into consideration according to a route described in recent work [20]. One can see that, within the entire temperature range from 213 to 573 K, an increase in temperature causes a non-monotonic change in its value (up to 267–280 K), while the relative deformation magnitude decreases to 0.08–0.10%. However, the subsequent rise in temperature causes the expansion amplitude to increase by up to 1.5 %—observed at 593 K.
The thermal linear expansion coefficient (TLEC) of Sorbonorit 4, αT [1/K], was calculated using the experimental plot Δl/l0 = f(T):
α T = 1 l 0 d l d T = 1 Δ T Δ l l 0
Figure 7 shows the results of these calculations compared with those for a silicon carbide-derived activated carbon (denoted as ASC) [20] and the data for a graphite crystal in a plane parallel and perpendicular to a main crystallographic axis [70,71]: αII, and α, respectively.
As follows from Figure 7, when T > 300 K, α < αASC < αII < αTsorbonorit. It is well known that exceptionally low thermal expansion, wide variation of magnitude, and high structure sensitivity are intrinsic features of the carbon structures [72]. Therefore, the discrepancy between the TLEC values of Sorbonorit 4 and graphite can be attributed to the textural properties of the carbon adsorbent: (1) polycrystalline structure; (2) presence of the amorphous phase; (3) developed porosity, which includes intracrystalline micropores (crystal defects) and intercrystallite meso- and macropores. Indeed, according to estimations [41], the granules of activated carbons (including Sorbonorit 4) contain 1016 graphite nanocrystallites with a size of 0.6–3 nm and 1020 randomly oriented slit-like pores per gram. The orientation of the nanocrystallites in the granules is equiprobable, and the nanocrystallites are surrounded by an amorphous carbon phase [73,74].
The discrepancy between the TLEC values of Sorbonorit 4 and ASC can be attributed to the differences in their structure, chemical composition, and density inherited from the raw materials and activation methods. The pyrolysis of amorphous peat with a loose structure at 973–1173 K results in the formation of the intermediary product composed of graphite-like nanocrystallites and residual amorphous phase. The subsequent thermochemical activation of the char is accompanied by the formation of intracrystalline slit-like micropores and intercrystallite mesopores [75,76]. The ASC carbon adsorbent prepared by the thermochemical leaching of Si atoms from the wurtzite-type silicon carbide crystals [77] is characterized by a higher density, a more homogeneous chemical and phase composition, and a relatively narrow pore size distribution [78]. The high rigidity of the ASC adsorbent is inherited from its crystalline precursor. Indeed, the activation process leads to a contraction of the sample by no more than 2% compared to the precursor [77]. Therefore, unlike Sorbonorit 4, the rigid carbon structure of the ASC adsorbent is less sensitive to variations in temperature over the entire range of studied temperatures.
Nevertheless, the TLEC values for Sorbonorit 4 do not exceed 5 × 10⁻⁶ 1/K, so we ignored this effect when studying the adsorption-induced deformation of Sorbonorit 4 at different temperatures.

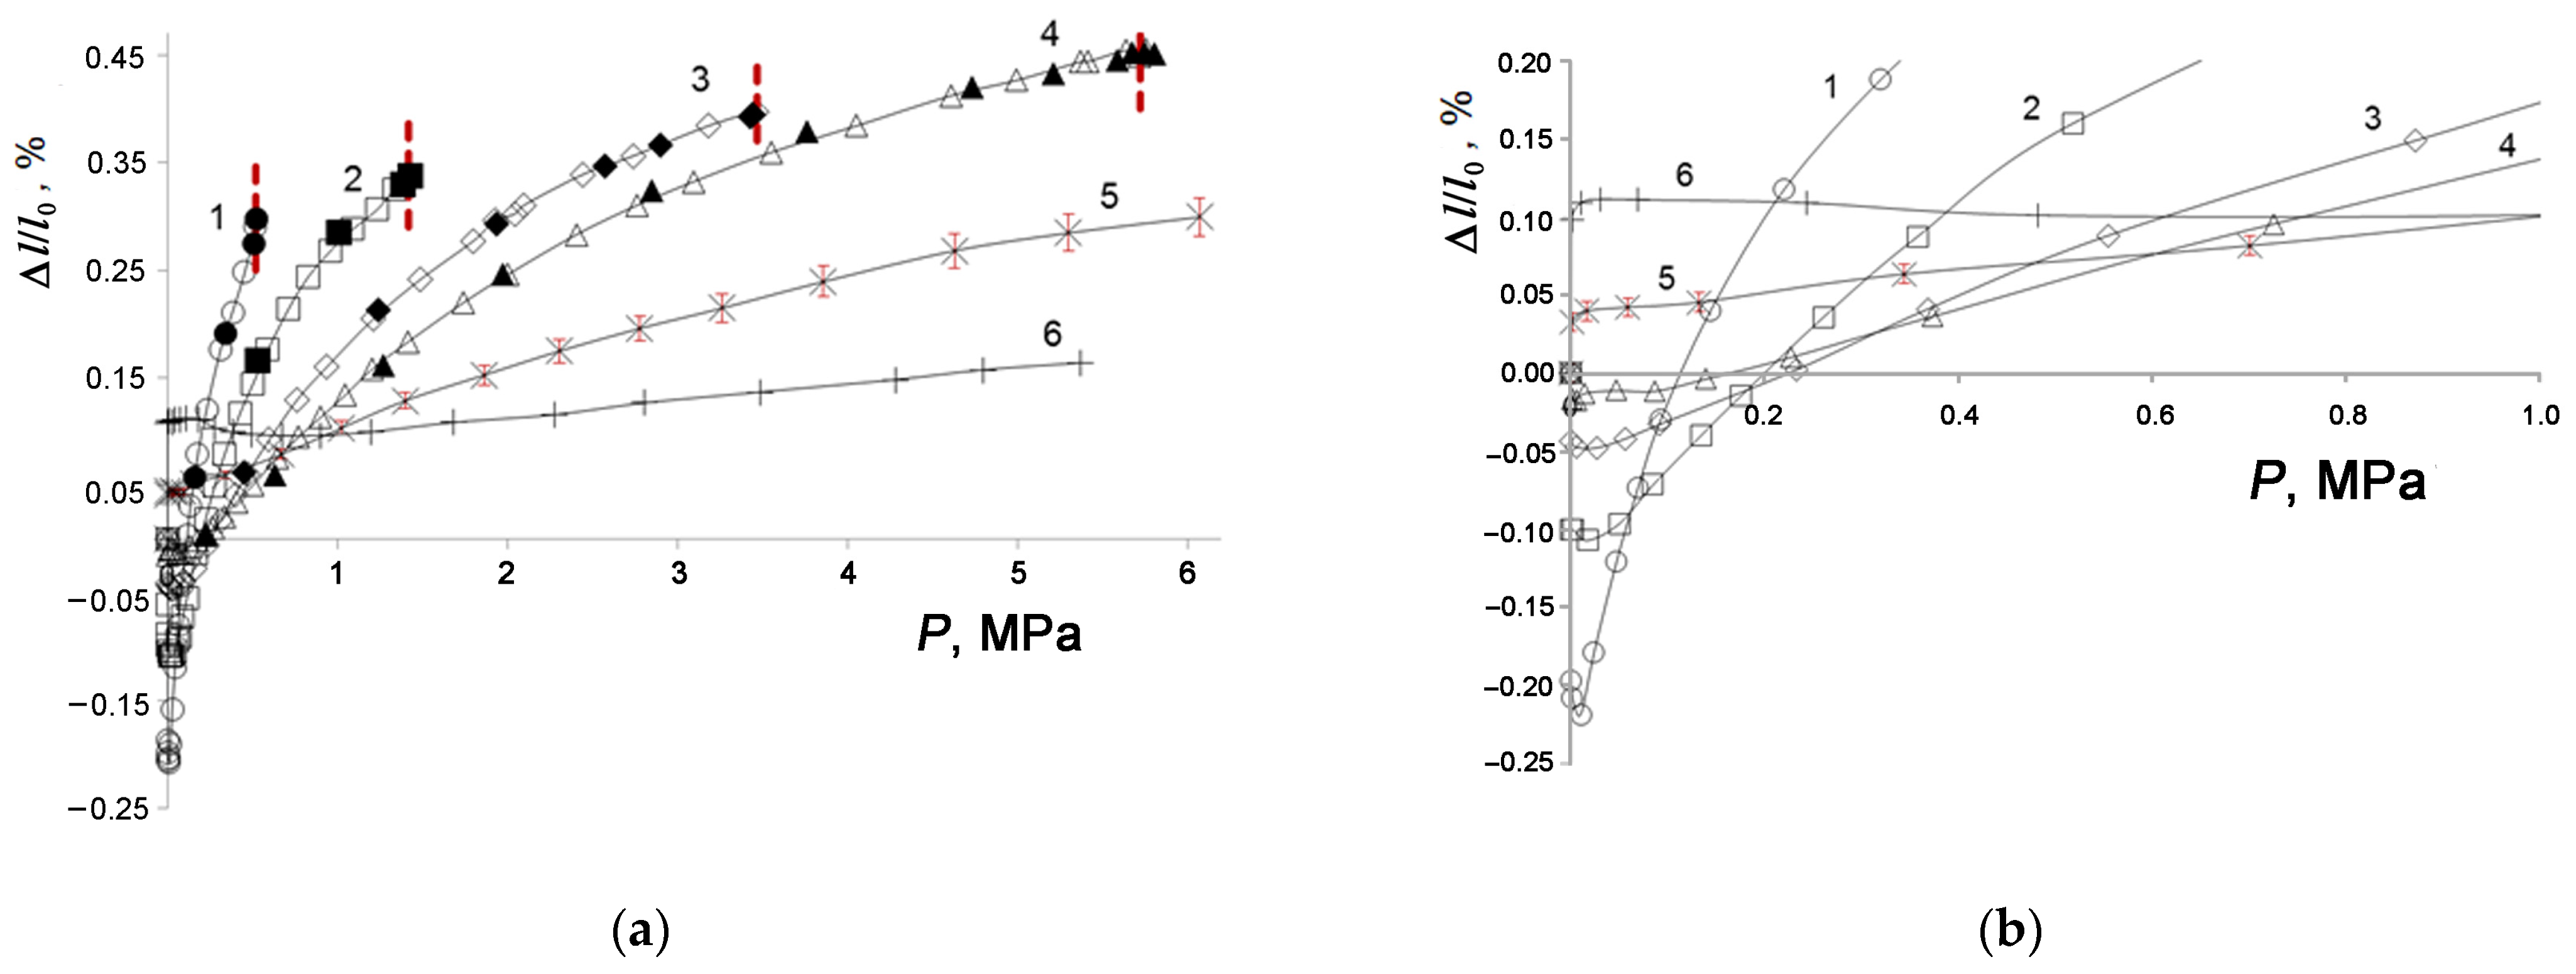
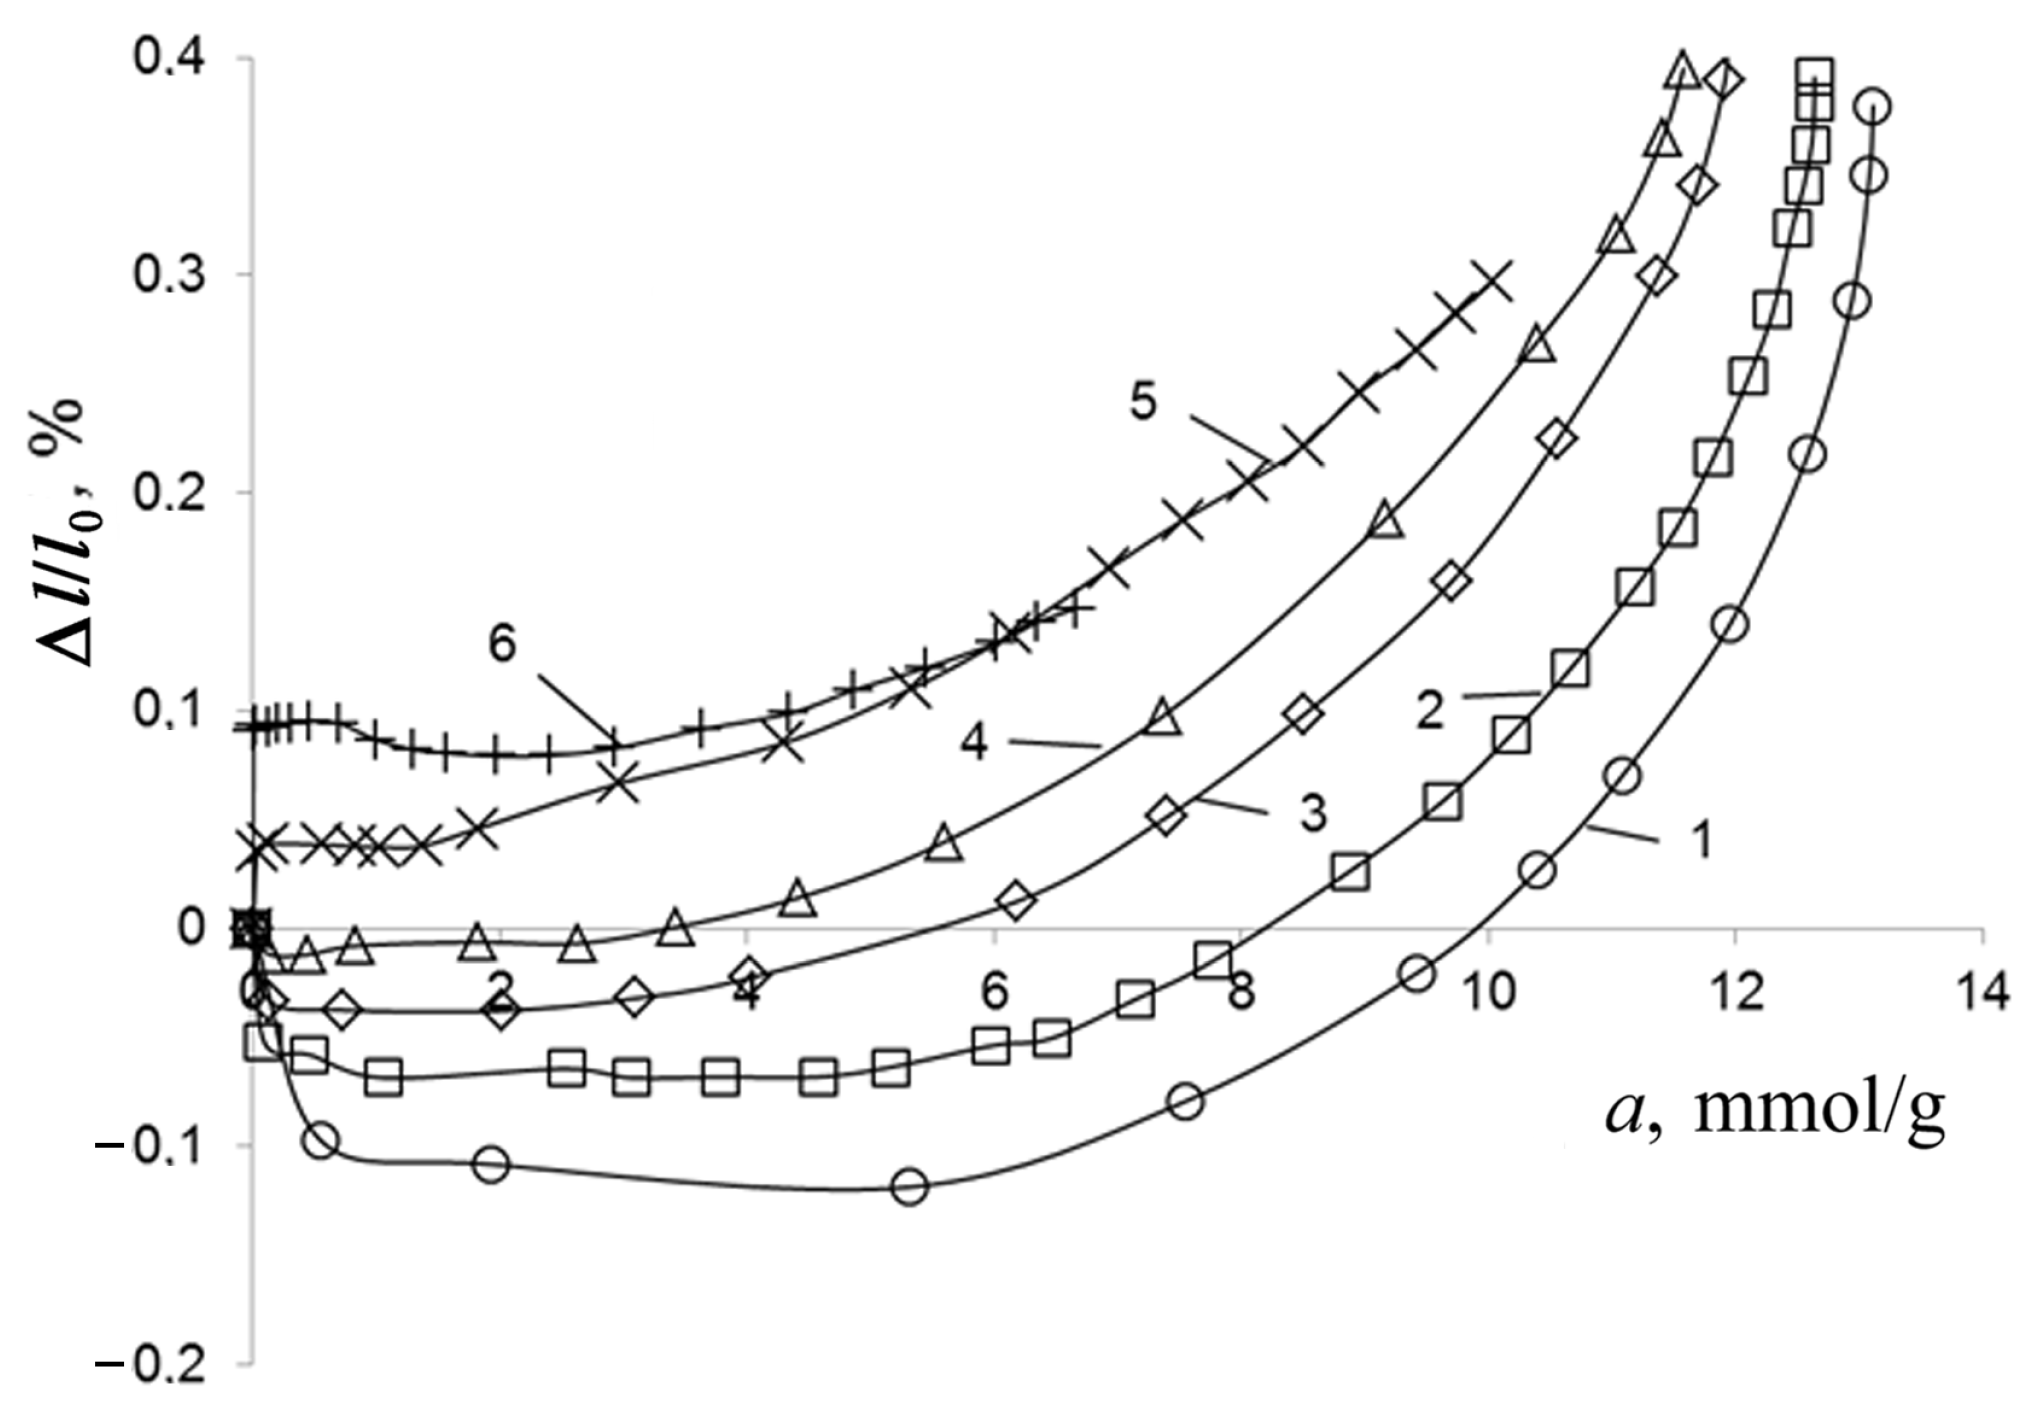
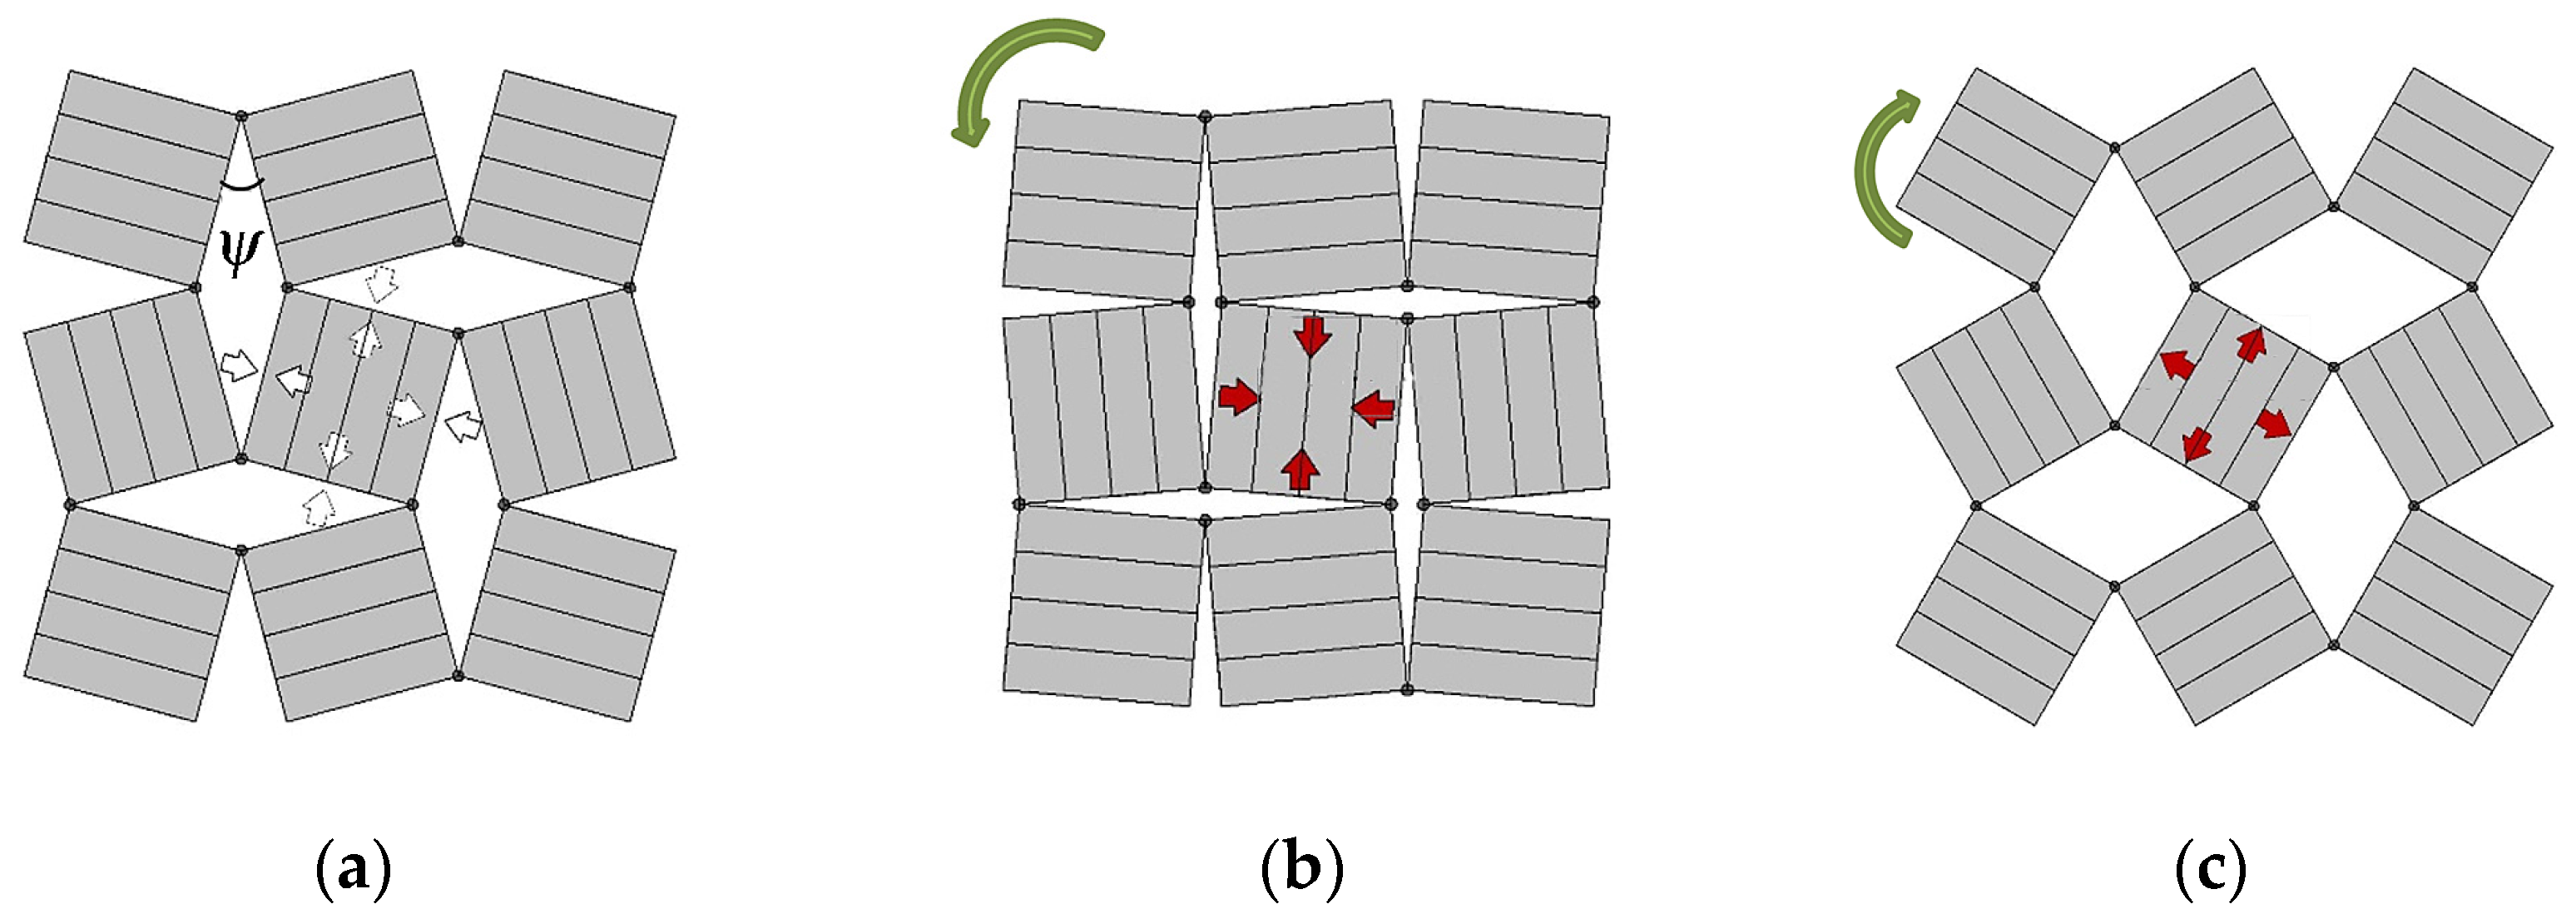
3.4. Adsorption-Induced Deformation of Sorbonorit 4

Figure 8a,b show the relative changes in the size of the Sorbonorit 4 granules upon the adsorption of carbon dioxide as a function of pressure within the entire range of pressures from 1 Pa to 6 MPa (a) and at the initial stage of adsorption over a pressure range of from 0.1 Pa to 1 MPa (b). The AID isotherms were measured at temperatures ranging from 213 to 393 K.
As can be seen from Figure 8, at low temperatures (curves 1–4), the AID magnitude is negative at low pressures (for example, p < 0.15 MPa—curve 1), indicating the contraction of Sorbonorit 4 at the initial stage of adsorption. However, with increasing pressure, the contraction magnitude reached a maximum value (a minimum on the AID curves) and then became smaller. Finally, the contraction of the adsorbent changed, resulting in its expansion. The initial contraction magnitude and the magnitude of the expansion at the final adsorption stage are comparable (Figure 8a). At the beginning of the adsorption process (Figure 8b), the contraction magnitudes fixed at the same pressure decreased with increasing temperature up to 0 (curves 1–4), whereas the expansion became more pronounced afterward (curves 5 and 6). At high pressures (Figure 8a), an increase in temperature led to a decrease in the expansion magnitude. As follows from Figure 8a,b, this inversion of the AID curves occurs within the pressure range of 0.4 to 1 MPa. The inversion of the AID curves was also disclosed for other carbon adsorbents, but the region of pressure was different. For example, the inversion of the AID curves for the ASC carbon adsorbent during the adsorption of CO2 and CH4 was observed within the range of 0.2 to 0.5 MPa [41] and 0.1 to 0.3 MPa [78], respectively. It should be noted that the two carbon adsorbents have almost the same micropore volume (0.49 and 0.51 cm3/g [41,78]), but these adsorbents differ in terms of pore width (X0 = 0.55 and 0.41 nm), characteristic energies of adsorption (21.8 and 29.0 kJ/mol), PSDs, and densities. Therefore, the energy parameters, which dictate the adsorption process at the initial stage and, most likely, the mechanical properties of the adsorbents (e.g., compressibility) determine the extension of the inversion region.
The transition from the initial contraction of Sorbonorit 4 observed at temperatures below 293 K to its expansion with increasing pressure can be considered a result of a change in the balance of the intermolecular interactions in the adsorption system during the process. Indeed, the contraction of the adsorbent can be considered a manifestation of the attraction between the CO2 molecules and the carbon atoms that form the walls of a micropore. It should be noted that the pore width in Sorbonorit 4 (2X0 or d M A X N L D F T ) and the dimensions of a CO2 molecule (d, dkin, and lm) are comparable (see Table 1 and Table 2). An increase in pressure, and thus the number of adsorbed molecules, leads to a decrease in the average distance between the adsorbed molecules and an enhancement of the repulsion. As a result, the contraction effect mitigates and transforms into the expansion of the adsorbent.
As the temperature rises, the region of initial contraction becomes narrower so that, at T~300 K, the adsorbent expands within the entire range of pressures. Moreover, at T~333 and 393 K, Sorbonorit 4 first abruptly expands by 0.04 and 0.08%, respectively, (see Figure 8b, curves 5 and 6). This effect can be perceived as a consequence of the influence of increasing molecular mobility on the balance of the interaction forces in the adsorption system. A further increase in pressure further expanded the adsorbent, the magnitude of which is determined by both the internal pressure of the adsorbate and the temperature-dependent compressibility of the adsorbent.
It should be noted that similar temperature-dependent contraction–expansion effects were found by Folman and Yates for porous glasses during the adsorption of polar molecules (CH3Cl, SO2, CCl2F2, and NH3) [32] and by Pulin et al. for zeolite during CO2 adsorption [33,79].
The contraction–expansion of the adsorbent induced by the CO2 adsorption can be analyzed as a function of the amounts of adsorbed molecules. For this purpose, we plotted the AID magnitude Δl/l0 versus the value of CO2 adsorption a = f(P). The results are shown in Figure 9.
As follows from Figure 9, the adsorption of the first CO2 molecules (i.e., when a = 0.1–0.3 mmol/g) onto Sorbonorit 4 resulted in its jump-like contraction or expansion depending on temperature. The jump-like deformation was not observed only at a temperature of about 300 K. We interpret this effect as a manifestation of the energy transition from a one-component system containing the only adsorbent to a two-component system containing the adsorbent and the adsorbate. It was found that, over the range of the investigated temperatures, the magnitude of the initial jump-like deformation at a constant number of adsorbed CO2 molecules (at a = 0.3 mmol/g) is a linear function of the reciprocal temperature (see Figure 10).
The macroscopic manifestation of the AID effects can be interpreted by using a model of carbon adsorbent [44,73] represented schematically in Figure 11. As mentioned above, carbon adsorbent can be conceived of as a mixture of randomly oriented graphite-like nanocrystallites connected by an amorphous phase consisting of complex aromatic-aliphatic carbon radicals. The proportions of ordered and amorphous phases are determined by the nature of the raw materials and the activation method. The nanocrystallites include from 2 to 4–5 graphite layers with micropores; hence, the size of nanocrystallites ranges from 0.7 to 3 nm. Aromatic-aliphatic radicals form the less dense domains, and their size is commensurate with the size of the molecules between the crystallites. These domains serve as an interlinkage between the nanocrystallites. It should be noted that such a random arrangement of nanocrystallites linked via disordered matter is associated with the presence of voids (meso- or macropores).
After regeneration, the microporous carbon adsorbent under vacuum is in a so-called pre-stressed state, which is determined by its textural properties, including the porosity and the temperature [80]. Figure 11 illustrates a simplified model of a microporous carbon adsorbent as a set of nanocrystallites (depicted as grey-colored square regions) with aligned micropores. The nanocrystallites are inclined to each other at a certain angle ψ. The junctions of the nanocrystallites are in a disordered phase; shown as corner-sharing black circles. The mutual arrangement of the nanocrystallites or, more precisely, the angle ψ between them depends on the temperature-dependent volume compression modulus [41] (Figure 11a). The voids (meso- and macropores) between the nanocrystallites act as transport pores for adsorbate molecules, allowing them enter micropores in the nanocrystallites. At low temperatures, the first adsorbed molecules exert the van der Waals attractive forces upon the carbon atoms of the opposite micropore walls. The contraction of micropores results in the shrinkage of the nanocrystallites accompanied by their rotation relative to each other and a decrease in the angle ψ due to the bonding of the nanocrystallites and the low thermal mobility (Figure 11b). As a result, one can observe the macroscopic contraction of the adsorbent sample. At low temperatures, the initial jump-like deformation and the magnitude of the maximum contraction are both larger than those at elevated temperatures. Indeed, with rising temperature (Figure 11c), the intensity of thermal motions both of adsorbed molecules and carbon atoms of the pore walls increase, and the interactions between the carbon layers in the nanocrystallites become weaker. Therefore, the entry of the first adsorbed molecules into the pore leads to the expansion of the pore and the entire nanocrystallite. The expansion of the nanocrystallites is accompanied by their rearrangement with an increase in the angle ψ and, as a result, the macroscopic expansion of the granule (see Figure 11c). It should be noted that this simple model is also suitable for interpreting the temperature-induced deformation of carbon adsorbents.
In addition to this mechanism, various defects of the pore walls, such as intercalated heteroatoms, unburned layers of carbon, and functional groups located at the edges of graphite-like crystallite layers, contribute to the initial adsorption-induced deformation. Firstly, in the early stages of adsorption, the presence of impurities and defects in graphite crystallites in a carbon adsorbent, which serve as the adsorption centers for carbon dioxide [81], increases the amount of adsorbed carbon dioxide molecules. As a result, the impact of the adsorbate on the adsorbent, which is referred to as the adsorption stress [82], is also augmented. Secondly, the presence and number of intercalated heteroatoms and unburned carbon layers can affect the stiffness of the carbon adsorbent and, as a consequence, its response to the adsorption stress. Future comparative investigations of different carbon adsorbents using structural methods may support this general assertion with accurate quantitative data.
It is worth noting that despite the smallness of the deformation induced by adsorption in micropores, this effect may be essential for the above-mentioned CO2-CH2 gas exchange process applied for enhancing coal-bed methane extraction [83]. The swelling of the coal induced by the adsorption in micropores can close the transport meso- and macropores, thereby reducing the carbon dioxide injectivity of the coal bed.
The adsorption-induced deformation data of nanoporous materials are often used for evaluating their elastic properties, which are essential for practical applications. In the previous study [41], the triaxial compression modulus of Sorbonorit 4 was evaluated. Its value was found to be temperature-dependent, as evidenced by the fact that it decreased from 42 to 10 GPa as the temperature increased from 216.6 to 293 K. The obtained values of the compression modulus of Sorbonorit 4 are close to those reported by Neimark for microporous activated carbon prepared from silicon carbide [84].

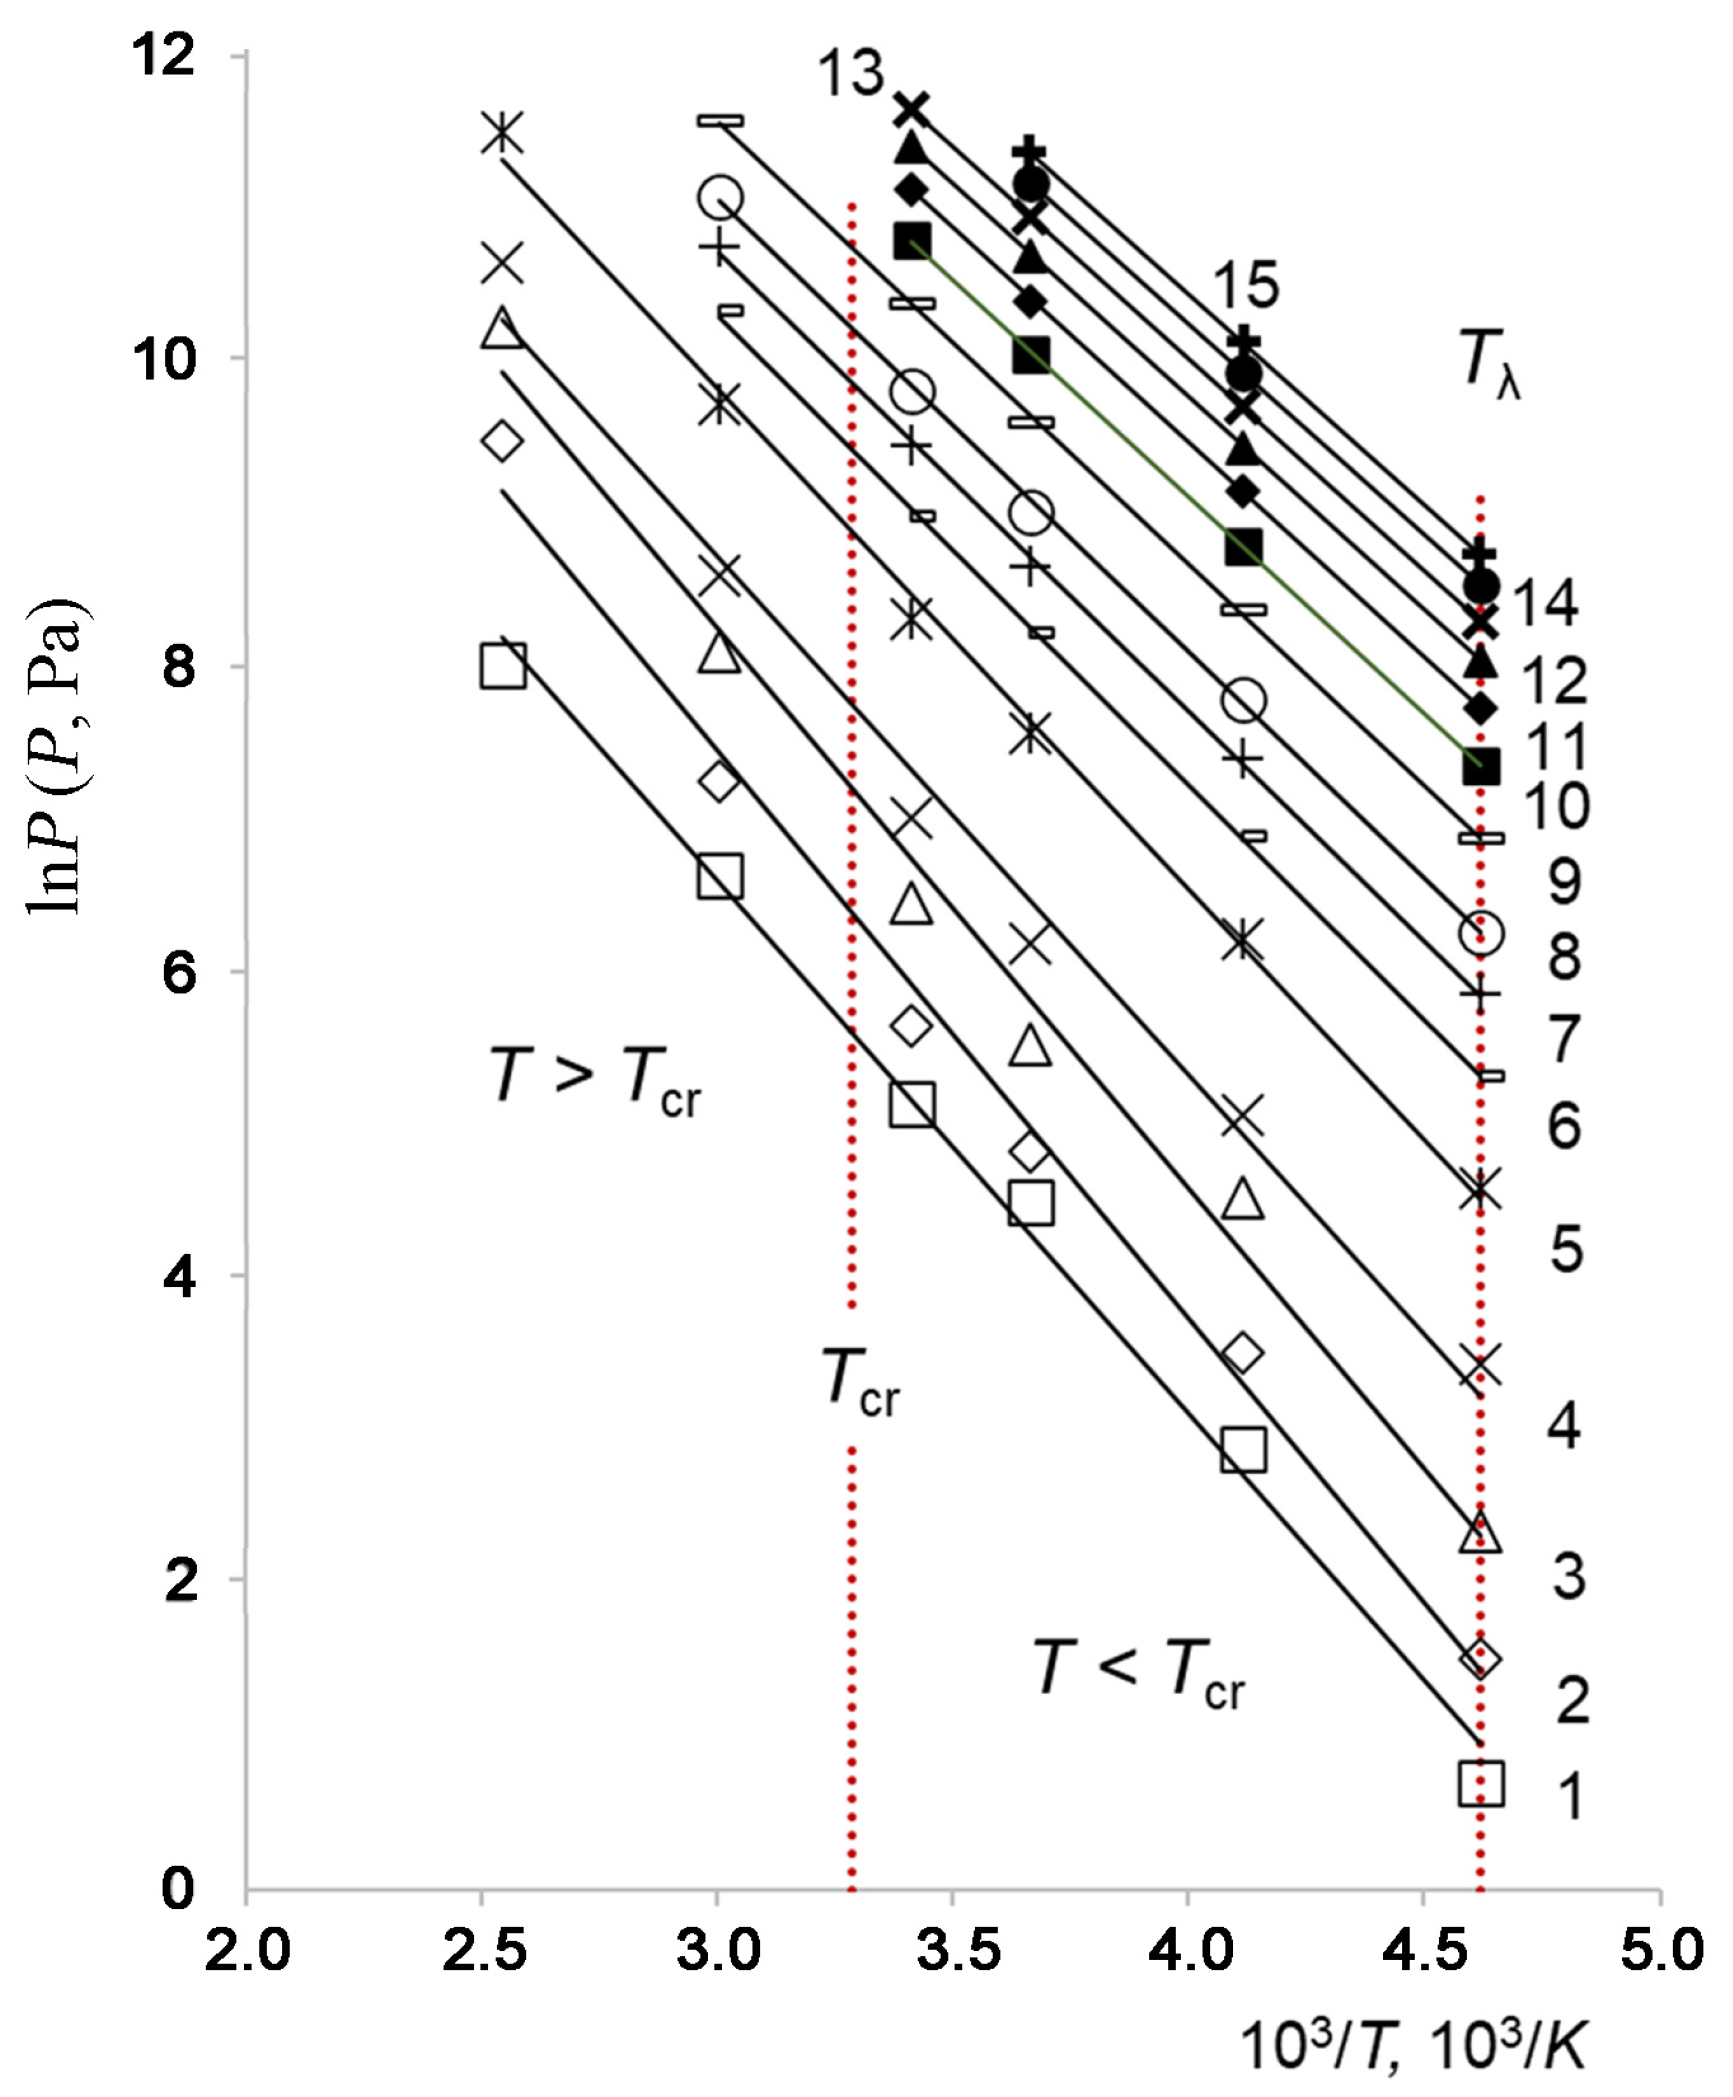
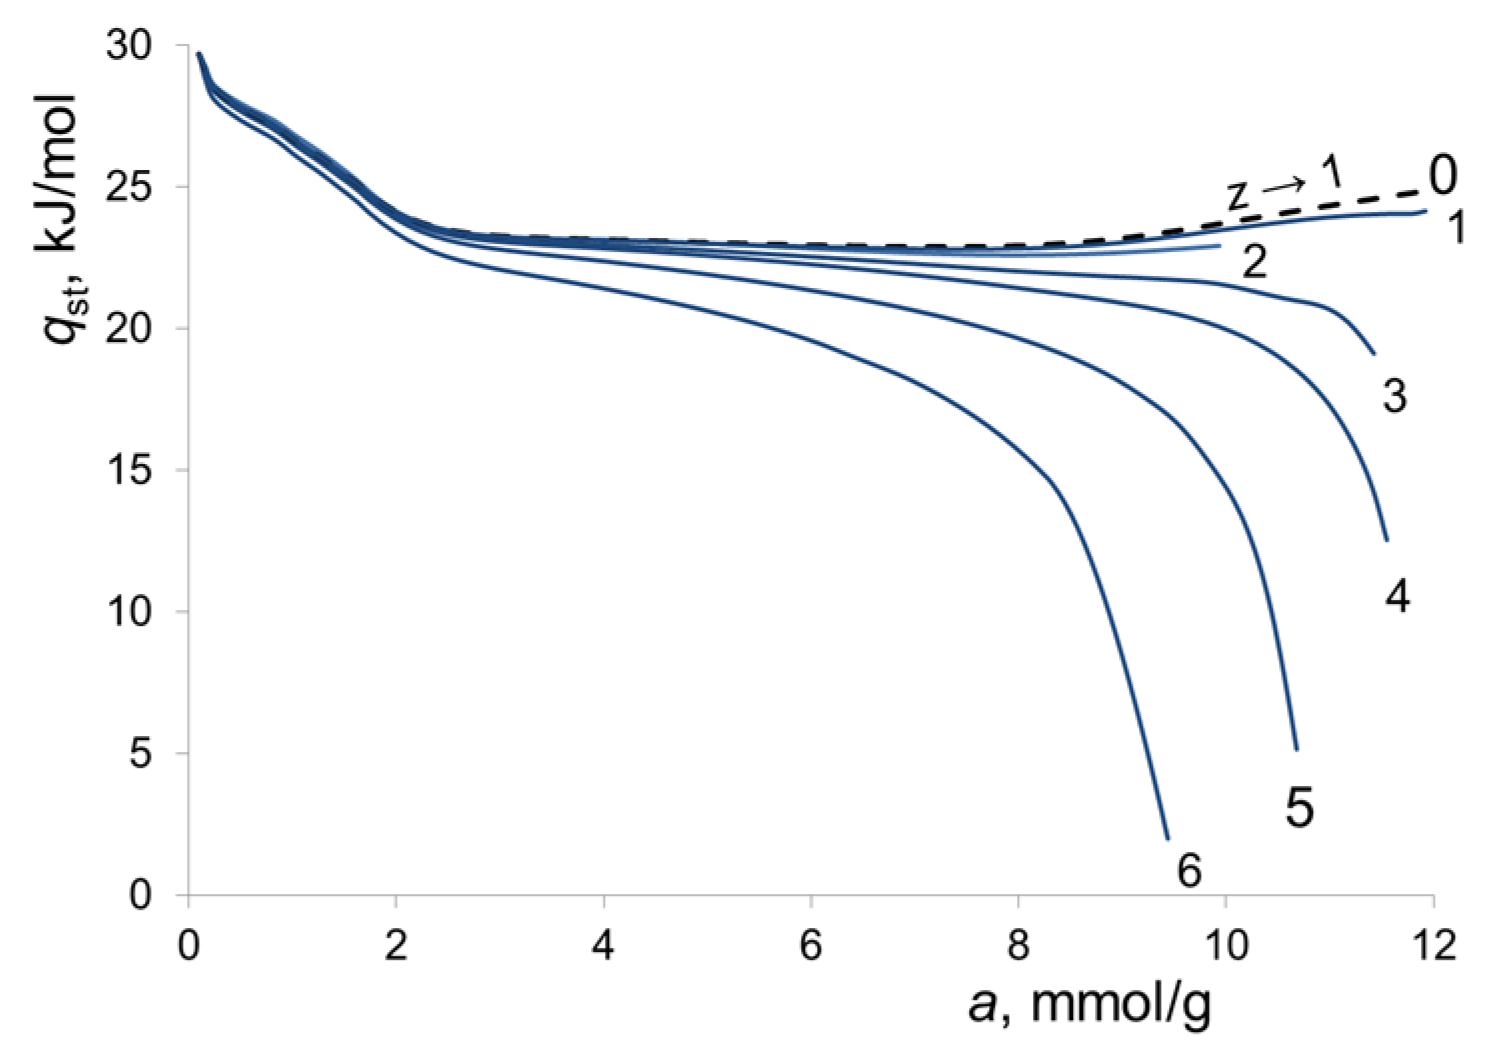
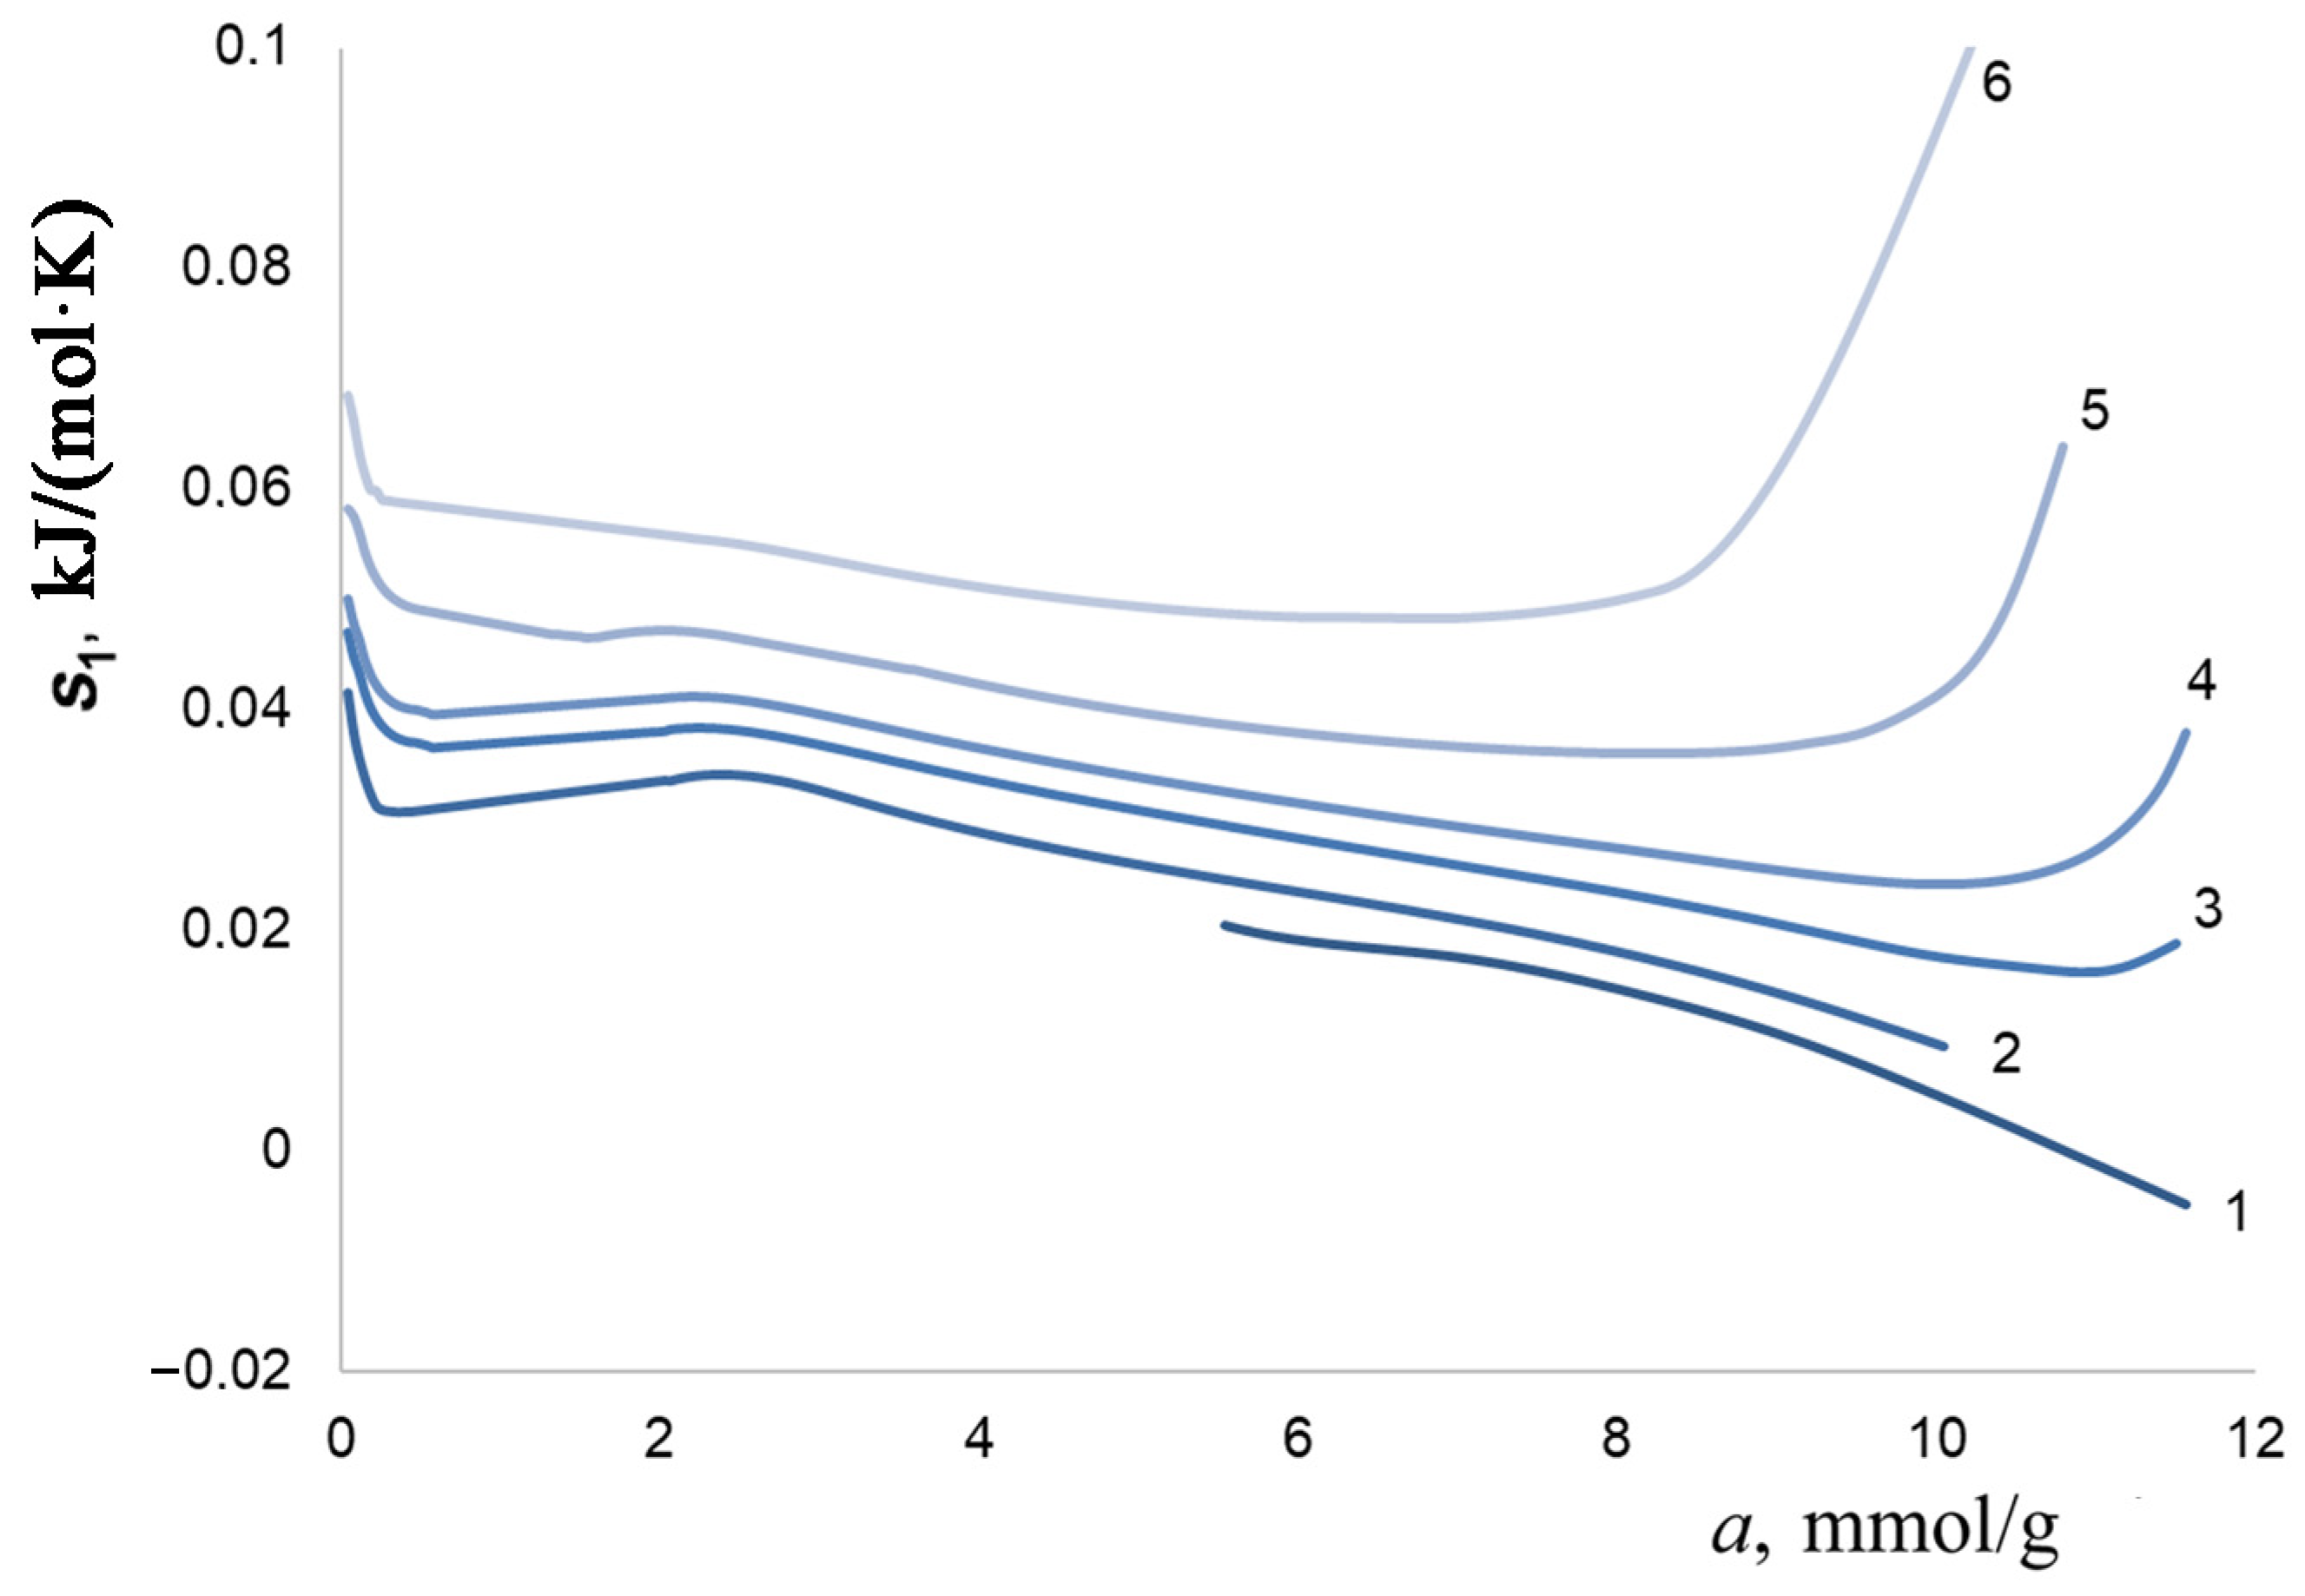
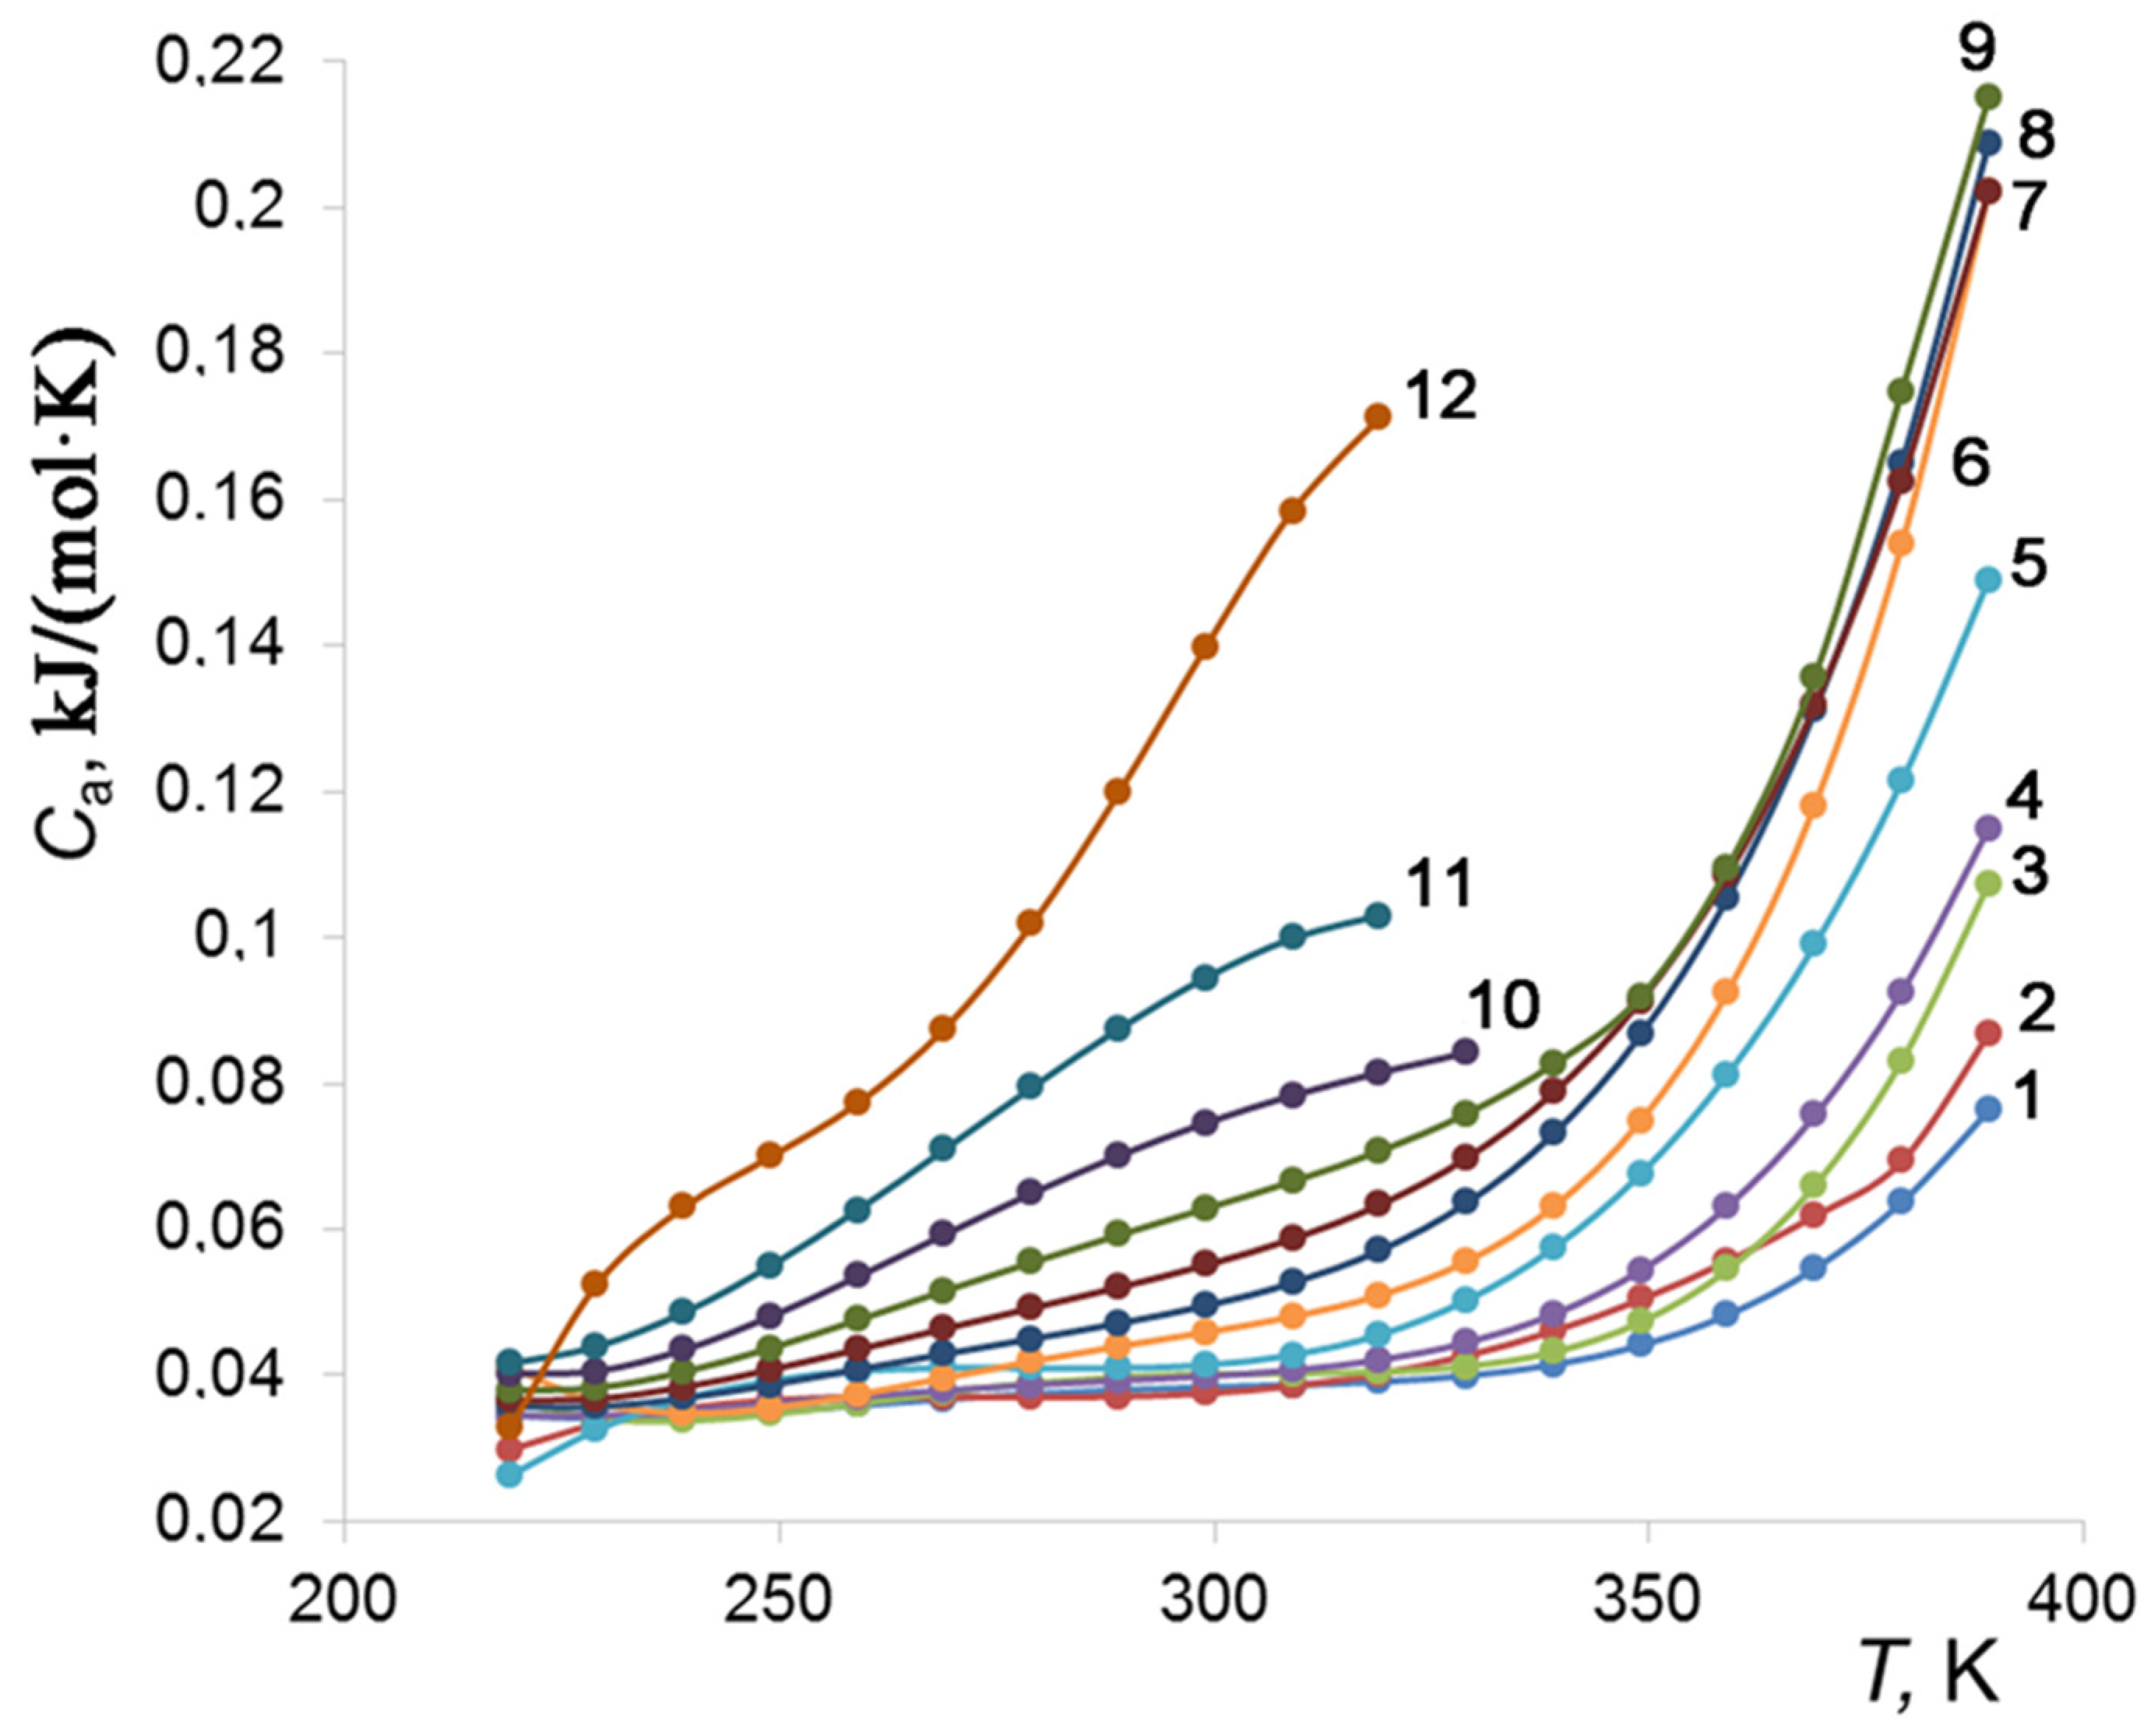
3.5. Thermodynamic Behaviors of the CO2–Sorbonorit 4 Adsorption System

As shown above, the effects of the initial jump-like deformation of the Sorbonorit 4 carbon adsorbent induced by the carbon dioxide adsorption are determined by many factors, including the intermolecular interactions between the carbon dioxide molecules and the pore walls. Information on the specific features of the adsorbent–adsorbate interactions can be obtained from the analysis of the differential isosteric molar heat of adsorption as a function of the adsorption value. Indeed, isosteric differential heat of adsorption is often interpreted as the energy required for the adsorbate molecules to move from the equilibrium bulk phase to the adsorbed state under the following specified thermodynamic conditions: constant temperature, pressure, and amount of adsorbed substance or value of adsorption. The fundamental problem of describing the properties of the adsorbed state is solved by dividing the adsorption system into the bulk and adsorption phases, since the latter is characterized by the corresponding state parameters in relation to those of the bulk phase. It is assumed that molecules in the bulk phase are outside the adsorption field created by the adsorbent [85,86]. According to the definition by Hill, the differential molar isosteric heat of adsorption, qst [kJ·mol−1], is the difference between the molar enthalpy of the equilibrium gas phase hg and the differential molar enthalpy of the adsorption phase H 1 a T [85,86]:
q s t = h g H 1 a T = h g h 1 ,
As noted in the Introduction, the most complete formula for calculating the differential molar isosteric heat of adsorption over a wide range of temperatures and pressures was proposed by Bakaev [45]:
q s t = R · Z · l n P 1 / T a · 1 V a a T / ν g P a T · V a T · V a T a
Here, R [J·(mol·K)−1] is the universal gas constant; Z = P·νg/(RT) is the compressibility of the equilibrium gas phase under specified P,T-conditions; νg [m3·kg−1] is the specific gas phase volume; Va = V0(P,T)/ma [cm3·g−1] is the reduced volume of the adsorbent–adsorbate system; V0 is the volume of the regenerated adsorbent with pores; and ma is the mass of the regenerated adsorbent. Data on the compressibility Z(P,T) and the specific volume of the equilibrium CO2 gas phase νg are available in the NIST Chemistry WebBook [87].
Obviously, Bakaev’s formula considers all of the factors that affect the value of differential molar isosteric heat of adsorption: isothermal adsorption-stimulated deformation (∂Va/∂a)T, temperature isosteric deformation (∂Va/∂T)a, the slopes of the isotherm of adsorption (∂P/∂a)T and isostere [lnP/(1/T)]a, and the non-ideality of a gas phase Z(P,T).
If the impacts of the non-ideality of the gas phase, thermal, and adsorption non-inertness (deformation) of the adsorption system are negligible, Equation (12) is reduced as follows:
q s t = R · Z · l n P 1 / T a P a T · V a ,
As follows from Figure 12, the largest discrepancy between the curves 1 and 0 is observed at high pressures. Let us compare the contributions of the non-ideality of the gaseous phase and the non-inertness of the adsorbent to the isosteric heat of adsorption at various temperatures using the data summarized in Table 4.
As follows from Table 4, the compressibility of the gaseous phase produces the greatest effect on the calculated isosteric heat of adsorption, up to ~85% at 333 K. The effects of temperature- and adsorption-induced deformations on the values of qst are almost commensurable. Their cumulative contribution does not exceed 4% and can be neglected.
It is known that changes in the heat of adsorption during the adsorption process reflect variations in the balance of the adsorbate–adsorbent and adsorbate–adsorbate interactions. At the beginning of adsorption, the value of qst drops sharply by ~1.5 kJ/mol upon the pore loading with CO2 to a value of 0.3 mmol/g. This effect is associated with the occupation of high-energy adsorption sites by adsorbing molecules, resulting in the jump-like deformation of Sorbonorit 4 (see Figure 9). The synchronicity of these processes points to the fact that the abrupt drop in the heat of adsorption is caused by the endothermic contribution of the adsorption-induced deformation of the adsorbent.
The subsequent decrease in the heat of CO2 adsorption from 29 to 23 kJ·mol−1 up to the adsorption value a = 2 mmol/g (see Figure 12) points to the non-uniformity of the adsorption sites. In fact, a carbon dioxide molecule has a rather large quadruple, which allows it to be involved in strong electrostatic interactions with heteroatoms incorporated into the carbon framework. Ma et al. revealed that the oxygen-containing functional groups present in porous carbon materials tightly entrap CO2 through electrostatic interactions and contribute about 37% to the carbon dioxide capture [81]. On the other hand, micropores with a width close to the adsorbate molecule size play an important role as adsorption sites for carbon dioxide through dispersion interactions.
A further increase in the pressure leading to the progressive loading of pores of Sorbonorit 4 does not result in significant changes in the heat of CO2 adsorption at low temperatures (curves 1–3, Figure 12). Rather, it is accompanied by a slow decrease in its value to 20–15 kJ·mol−1 at elevated temperatures (curves 4–6) within a range of CO2 uptake of 2–8 mmol·g−1. This behavior can be attributed to the increased mutual attraction between the adsorbate molecules, which results in the formation of so-called adsorption associates [88]. Then, at high adsorption values, e.g., a > 8 mmol·g−1, the function qst(a) exhibits a steep decrease at T ≥ 273 K, indicating a growth in repulsive forces caused by a reduction in average distance between the adsorbed molecules and pore walls. With rising temperatures, these effects are observed at the lower pore fillings, which can be attributed to an increased contribution of thermal molecular motion.
It should be noted that the isosteric heat of adsorption does not depend on the temperature at the initial stage of the adsorption process. However, the changes in the value of qst become temperature-dependent, as the carbon dioxide molecules occupy the high-energy adsorption centers. The divergence of the qst(a) curves can be attributed to changes in the temperature-dependent contributions from the gas phase compressibility Z and the derivative (∂P/∂a)T in the second term of the equation that determines the steepness of the isotherm (see Equation (12)).
When a molecule passes from the bulk phase to the adsorbed phase, a significant loss in the differential molar entropy s1 takes place. By examining the entropy as a function of CO2 uptake, one can gain insight into the state of the adsorbate molecules in the pore under the influence of adsorption potential created by the pore walls. The differential molar entropy of the CO2–Sorbonorit 4 adsorption system was calculated from the following well-known formula [86]:
s 1 = s g q st / T ,
where sg is the entropy of the bulk gas.
The values of s1 plotted as a function of CO2 uptake in Figure 13 reflect the changes in the state of CO2 molecules during their adsorption caused by the interaction with the adsorption sites compared to the bulk phase.
As follows from Figure 13, there is a sharp decrease in entropy at the adsorption value of about 0.3 mmol/g, indicating the transition of the CO2 molecules to a bound state at the high-energy adsorption sites. In the range of adsorption values of 2–10 mmol/g, the entropy drop slows down significantly (or even increases slightly at low temperatures) with the gradual filling of the pore space with CO2, resulting in the enhancement of the CO2–CO2 interactions. The difference in the behaviors of the s1(a) values observed at a > 8 mmol/g for curves 1 and 2, on the one hand, and curves 3–6, on the other hand, can be explained by different degrees of thermal molecular motion averaging of adsorbate–adsorbent and adsorbate–adsorbate interactions at low and elevated temperatures.
The heat capacity of the adsorption system is a crucial parameter that determines the thermal stability of the system during adsorption/desorption cycles. Unlike the heat capacity of any bulk phase, the heat capacity of the adsorption system depends not only on pressure and temperature but also on the number of adsorbed molecules. Thus, a complete thermodynamic description of the adsorption system includes an analysis of the differential molar isosteric heat capacity, Ca, as a function of all these parameters. The Ca value was calculated using the Kirchhoff equation [88]:
C a = h g T a q st T a ,
Here, hg is the enthalpy of the gaseous phase.
Figure 14 shows the temperature dependence of the differential molar isosteric heat capacity of the CO2–Sorbonorit 4 adsorption system for various amounts of adsorbed carbon dioxide.
It is clear from the figure that increased CO2 uptake enhances the temperature dependence of Ca for the CO2–Sorbonorit 4 adsorption system. At the value of adsorption a = 1 mmol/g, the heat capacity increases from 0.037 to 0.075 kJ/mol/K as the temperature rises from 216.4 to 373 K, and when the CO2 uptake reaches 10 mmol/g, the value of Ca increases by ~6 times, with an increase in temperature by 100 °C. The obtained results can be interpreted as follows: At the early stage of adsorption, qst does not depend on temperature (see Figure 12). Hence, the initial growth of Ca with rising temperature is determined by the temperature dependence of the enthalpy of carbon dioxide in the gaseous phase. However, as the amount of adsorbed carbon dioxide increases, the function qst becomes strongly dependent on temperature, as illustrated by Figure 12, and this dependence makes a dominant contribution to Ca(T).

4. Conclusions

In situ dilatometry measurements revealed that the microporous peat-derived carbon adsorbent, which was in a pre-stressed state after regeneration under vacuum, exhibited non-monotonic temperature-dependent deformation behaviors both during temperature change under vacuum and during carbon dioxide adsorption over a wide pressure range.
By comparing the thermal linear expansion coefficient of Sorbonorit 4 with that of silicon carbide-derived activated carbon, we found that the temperature-induced deformation behaviors of carbon porous materials are related to the phase and chemical composition, pore size distribution, and mechanical properties inherited from their precursors and affected by the synthesis route.
A detailed examination of the deformation of Sorbonorit 4 at the early stages of carbon dioxide adsorption revealed a jump-like deformation of Sorbonorit 4, the magnitude of which was found to be linearly dependent on reciprocal temperature. The derived linear relationship can be used for predicting the initial AID magnitude of the adsorbent at any temperature.
The initial jump-like changes in the sizes of Sorbonorit 4 during CO2 adsorption coincided with the abrupt decrease in the differential molar isosteric heat of CO2 adsorption, indicating the endothermic contribution of the adsorption-induced deformation. Both the dependencies of the adsorption-induced deformation of Sorbonorit 4 and the differential isosteric heat of carbon dioxide adsorption on the amounts of adsorbed molecules reflect the variations in the state of carbon dioxide molecules determined by the changes in the ratio between the adsorbate–adsorbent and adsorbate–adsorbate interactions.
The inversion of the adsorbent contraction–expansion transition during adsorption, occurring within the pressure range of 0.4 to 1 MPa, was interpreted in terms of the temperature-dependent effect of enhanced molecular mobility both on the intermolecular interactions of the adsorbed carbon dioxide molecules with the micropore walls and the adsorbent skeleton rigidity.
A simple qualitative model, which represented a carbon adsorbent as a set of graphite-like nanocrystallites connected by amorphous matter, made it possible to qualitatively explain the relationship between the adsorption- and temperature-induced deformation of nanocrystallites and the macroscopic deformation of the adsorbent granules.
The observed effects of contraction and expansion of carbon adsorbents and their temperature-dependent inversion during carbon dioxide adsorption should be taken into consideration when designing facilities for adsorption-based technologies for carbon dioxide capture and storage using commercial microporous carbon adsorbents and the thermal modes of their operation.

Author Contributions

Conceptualization, A.F. and A.S.; methodology, A.S. and I.M.; software, I.M.; validation, A.F. and E.K.; formal analysis, A.S.; investigation, A.S.; resources, A.F.; data curation, A.F. and E.K.; writing—original draft preparation, A.S.; writing—review and editing, E.K.; visualization, A.S.; supervision, A.F.; project administration, A.F.; funding acquisition, A.F. All authors have read and agreed to the published version of the manuscript.

Funding

This research was supported within the framework of the State Assignment of the Ministry of Science and Higher Education of the Russian Federation, no. 122011300053-8.

Data Availability Statement

The data presented in this study are available upon request from the corresponding authors.

Acknowledgments

The experiments were carried out using equipment from the Center of Physical Methods of Investigations of the A.N. Frumkin Institute of Physical Chemistry and Electrochemistry of the Russian Academy of Sciences. We thank V.V. Vysotskii for helping with the SEM experiments and providing constructive suggestions.

Conflicts of Interest

The authors declare no conflict of interest. The funders had no role in the design of the study; in the collection, analyses, or interpretation of data; in the writing of the manuscript; or in the decision to publish the results.

References

  1. Solomon, S.; Plattner, G.-K.; Knutti, R.; Friedlingstein, P. Irreversible climate change due to carbon dioxide emissions. Environ. Sci. 2009, 106, 1704–1709. [Google Scholar] [CrossRef] [PubMed] [Green Version]
  2. Biniek, K.; Davies, R.; Henderson, K. Why Commercial Use Could Be the Future of Carbon Capture? Available online: https://www.mckinsey.com/capabilities/sustainability/our-insights/why-commercial-use-could-be-the-future-of-carbon-capture (accessed on 20 February 2023).
  3. Pollock, R.A.; Jackson, R.T.; Clairmont, A.A.; Nicholson, W.L. Carbon Dioxide as an Otic Vasodilator: Otic Blood Flow as Measured by the Microsphere Technique. Arch. Otolaryngol. 1974, 100, 309–313. [Google Scholar] [CrossRef] [PubMed]
  4. Persson, M.; van der Linden, J. Wound ventilation with carbon dioxide: A simple method to prevent direct airborne contamination during cardiac surgery? J. Hosp. Infect. 2004, 56, 131–136. [Google Scholar] [CrossRef]
  5. Darensbourg, D.J.; Holtcamp, M.W. Catalysts for the reactions of epoxides and carbon dioxide. Coord. Chem. Rev. 1996, 153, 155–174. [Google Scholar] [CrossRef]
  6. Langanke, J.; Wolf, A.; Hofmann, J.; Bohm, K.; Subhani, M.A.; Muller, T.E.; Leitner, W.; Gurtler, C. Carbon dioxide (CO2) as sustainable feedstock for polyurethane production. Green Chem. 2014, 16, 1865–1870. [Google Scholar] [CrossRef]
  7. Bharti, R.K.; Srivastava, S.; Thakur, I.S. Production and characterization of biodiesel from carbon dioxide concentrating chemolithotrophic bacteria, Serratia sp. ISTD04. Bioresour. Technol. 2014, 153, 189–197. [Google Scholar] [CrossRef] [PubMed]
  8. Kumar, M.; Smita Sundaram, S.; Edgard Gnansounou, E.; Christian Larroche, C.; Thakur, I.S. Carbon dioxide capture, storage and production of biofuel and biomaterials by bacteria: A review. Bioresour. Technol. 2018, 247, 1059–1068. [Google Scholar] [CrossRef]
  9. Koley, S.; Khadase, M.S.; Mathimani, T.; Raheman, H.; Mallick, N. Catalytic and non-catalytic hydrothermal processing of Scenedesmus obliquus biomass for bio-crude production—A sustainable energy perspective. Energy Convers. Manag. 2018, 163, 111–121. [Google Scholar] [CrossRef]
  10. Li, S.; Li, B.; Zhang, Q.; Li, Z.; Yang, D. Effect of CO2 on heavy oil recovery and physical properties in huff-n-puff processes under reservoir conditions. J. Energy Res. Technol. 2018, 140, 072907. [Google Scholar] [CrossRef]
  11. Iddphonce, R.; Wang, J.; Zhao, L. Review of CO2 injection techniques for enhanced shale gas recovery: Prospect and challenges. J. Nat. Gas Sci. Eng. 2020, 77, 103240. [Google Scholar] [CrossRef]
  12. Vandamme, M.; Brochard, L.; Lecampion, B.; Coussy, O. Adsorption and strain: The CO2-induced swelling of coal. J. Mech. Phys. Solids 2010, 58, 1489–1505. [Google Scholar] [CrossRef] [Green Version]
  13. Huo, P.; Zhang, D.; Yang, Z.; Li, W.; Zhang, J.; Jia, S. CO2 geological sequestration: Displacement behavior of shale gas methane by carbon dioxide injection. Int. J. Greenh. Gas Control. 2017, 66, 48–59. [Google Scholar] [CrossRef]
  14. Zhang, W.; Mehrabian, A. Full coupling of CO2–CH4 transport and sorption with solid deformation in gas shale enhances natural gas recovery and geological CO2 storage capacity. J. Nat. Gas Sci. Eng. 2022, 106, 104736. [Google Scholar] [CrossRef]
  15. Gunawardene, O.H.P.; Gunathilake, C.; Vikrant, K.; Amaraweera, S.M. Carbon Dioxide capture through physical and chemical adsorption using porous carbon materials: A review. Atmosphere 2022, 13, 397. [Google Scholar] [CrossRef]
  16. Tao, H.; Qian, X.; Zhou, Y.; Cheng, H. Research progress of clay minerals in carbon dioxide capture. Renew. Sust. Energ. Rev. 2022, 164, 112536. [Google Scholar] [CrossRef]
  17. Mouhat, F.; Bousquet, D.; Boutin, A.; Bouessel du Bourg, L.; Coudert, F.-X.; Fuchs, A.H. Softening upon adsorption in microporous materials: A counterintuitive mechanical response. J. Phys. Chem. Lett. 2015, 6, 4265–4269. [Google Scholar] [CrossRef] [PubMed] [Green Version]
  18. Larsen, J.W. The effects of dissolved CO2 on coal structure and properties. Inter. J. Coal Geol. 2004, 57, 63–70. [Google Scholar] [CrossRef]
  19. Shkolin, A.V.; Fomkin, A.A.; Potapov, S.V. Thermodynamics of krypton adsorption on microporous carbon adrbent at high pressures. Russ. Chem. Bull. 2017, 66, 607–613. [Google Scholar] [CrossRef]
  20. Men’shchikov, I.; Shkolin, A.; Khozina, E.; Fomkin, A. Peculiarities of thermodynamic behaviors of xenon adsorption on the activated carbon prepared from silicon carbide. Nanomaterials 2021, 11, 971. [Google Scholar] [CrossRef]
  21. Mechan, F.T. Expansion of charcoal on sorption of carbon dioxide. Proc. R. Soc. 1927, A115, 199–205. [Google Scholar]
  22. Bangham, D.H.; Fakhoury, N. The expansion of charcoal accompanying sorption of gases and vapours. Nature 1928, 122, 681–682. [Google Scholar] [CrossRef]
  23. Bangham, D.H.; Fakhoury, N. The swelling of charcoal. Part I.—Preliminary experiments with water vapour, carbon dioxide, ammonia, and sulphur dioxide. Proc. R. Soc. Lond. Ser. A 1930, 130, 81–89. [Google Scholar]
  24. Bangham, D.H. The Gibbs adsorption equation and adsorption on solid. Trans. Faraday Soc. 1937, 33, 805–809. [Google Scholar] [CrossRef]
  25. Gor, G.Y.; Huber, P.; Bernstein, N. Adsorption-induced deformation of nanoporous materials—A review. Appl. Phys. Rev. 2017, 4, 011303. [Google Scholar] [CrossRef] [Green Version]
  26. Kolesnikov, A.L.; Budkov, Y.A.; Gor, G.Y. Models of adsorption-induced deformation: Ordered materials and beyond. J. Phys. Condens. Matter 2021, 34, 063002. [Google Scholar] [CrossRef]
  27. Vandamme, M. Coupling between adsorption and mechanics (and vice versa). Cur. Opin. Chem. Eng. 2019, 24, 12–18. [Google Scholar] [CrossRef] [Green Version]
  28. Lakhanpal, M.L.; Flood, E.A. Stresses and strains in adsorbate–adsorbent systems: IV. Contractions of activated carbon on adsorption of gases and vapors at low initial pressures. Can. J. Chem. 1957, 35, 887–899. [Google Scholar] [CrossRef]
  29. Yakovlev, V.Y.; Fomkin, A.A.; Tvardovskii, A.V. Adsorption and deformation phenomena at the interaction of CO2 and a microporous carbon adsorbent. J. Coll. Int. Sci. 2003, 268, 33–36. [Google Scholar] [CrossRef]
  30. Balzer, C.; Wildhage, T.; Braxmeier, S.; Reichenauer, G.; Olivier, J.P. Deformation of Porous Carbons upon Adsorption. Langmuir 2011, 27, 2553–2560. [Google Scholar] [CrossRef]
  31. Bahadur, J.; Melnichenko, Y.B.; He, L.; Contescu, C.I.; Gallego, N.C.; Carmichael, J.R. SANS Investigations of CO2 Adsorption in Microporous Carbon. Carbon 2015, 95, 535–544. [Google Scholar] [CrossRef] [Green Version]
  32. Folman, M.; Yates, D.J.C. Expansion-contraction effects in rigid adsorbents at low coverages. Trans. Farad. Soc. 1958, 54, 429–440. [Google Scholar] [CrossRef]
  33. Pulin, A.L.; Fomkin, A.A.; Sinitsyn, V.A.; Pribylov, A.A. Adsorption and adsorption-induced deformation of NaX zeolite under high pressures of carbon dioxide. Russ. Chem. Bull. 2001, 50, 60–62. [Google Scholar] [CrossRef]
  34. Sorenson, S.G.; Payzant, E.A.; Noble, R.D.; Falconer, J.L. Influence of crystal expansion/contraction on zeolite membrane permeation. J. Memb. Sci. 2010, 357, 98–104. [Google Scholar] [CrossRef]
  35. Serre, C.; Bourrelly, S.; Vimont, A.; Ramsahye, N.A.; Maurin, G.; Llewellyn, P.L.; Daturi, M.; Filinchuk, Y.; Leynaud, O.; Barnes, P.; et al. An Explanation for the Very Large Breathing Effect of a Metal–Organic Framework during CO2 Adsorption. Adv. Mater. 2007, 19, 2246–2251. [Google Scholar] [CrossRef]
  36. Ramsahye, N.A.; Maurin, G.; Llewellyn, P.L.; Loiseau, T.; Serre, C.; Férey, G. On the breathing effect of a metal-organic framework upon CO2 adsorption: Monte Carlo compared to microcalorimetry experiments. Chem. Commun. 2007, 3261–3263. [Google Scholar] [CrossRef]
  37. Dolino, G.; Bellet, D.; Faivre, C. Adsorption strains in porous silicon. Phys. Rev. 1996, B 54, 17919–17929. [Google Scholar] [CrossRef]
  38. Prass, J.; Muter, D.; Erko, M.; Paris, O. Apparent lattice expansion in ordered nanoporous silica during capillary condensation of fluids. J. Appl. Crystallog. 2012, 45, 798–806. [Google Scholar] [CrossRef]
  39. Shkolin, A.V.; Men’shchikov, I.E.; Fomkin, A.A. Method to measure the deformation of nanoporous materials induced by the adsorption of gases and vapors. Nanobiotechnol. Rep. 2022, 17, 916–922. [Google Scholar] [CrossRef]
  40. Mogilnikov, K.P.; Baklanov, M.R. Determination of Young’s modulus of porous low-k films by ellipsometric porosimetry. Electrochem. Solid State Lett. 2002, 5, F29–F31. [Google Scholar] [CrossRef]
  41. Shkolin, A.V.; Men’shchikov, I.E.; Khozina, E.V.; Yakovlev, V.Y.; Fomkin, A.A. Isotropic and anisotropic properties of adsorption-induced deformation of porous carbon materials. Adsorption 2023, 1–17. [Google Scholar] [CrossRef]
  42. Kowalczyk, P.; Ciach, A.; Neimark, A.V. Adsorption-Induced Deformation of Microporous Carbons: Pore Size Distribution Effect. Langmuir 2008, 24, 6603–6608. [Google Scholar] [CrossRef] [PubMed]
  43. Dubinin, M.M. Physical adsorption of gases and vapors in micropores. Prog. Surf. Membr. Sci. 1975, 9, 1–70. [Google Scholar]
  44. Dubinin, M.M. Fundamentals of the theory of adsorption in micropores of carbon adsorbents: Characteristics of their adsorption properties and microporous structures. Carbon 1989, 27, 457–467. [Google Scholar] [CrossRef]
  45. Bakaev, V.A. Molecular Theory of Physical Adsorption. Ph.D. Thesis, Moscow State University, Moscow, Russia, June 1989. (In Russian). [Google Scholar]
  46. Downarowicz, D. Adsorption characteristics of propane-2-ol vapours on activated carbon Sorbonorit 4 in electrothermal temperature swing adsorption process. Adsorption 2015, 21, 87–98. [Google Scholar] [CrossRef] [Green Version]
  47. Bell, I.H.; Wronski, J.; Quoilin, S.; Lemort, V. Pure and pseudo-pure fluid thermophysical property evaluation and the open-source thermophysical property library CoolProp. Ind. Eng. Chem. Res. 2014, 53, 2498–2508. [Google Scholar] [CrossRef] [Green Version]
  48. Kel’tsev, N.V. Osnovy Adsorbtsionnoi Tekhniki (Fundamentals of Adsorption Techniques); Khimiya USSR: Moscow, Russia, 1976; p. 592. [Google Scholar]
  49. Poling, B.E.; Prausnitz, J.M.; O’Connell, J.P. The Properties of Gases and Liquids, 5th ed.; McGraw-Hill: New York, NY, USA, 2001. [Google Scholar]
  50. Sugden, S. The Parachor and Valency; G. Routledge: London, UK, 1930; p. 224. [Google Scholar]
  51. Brunauer, S.; Emmett, P.H.; Teller, E. Adsorption of gases in multimolecular layers. J. Am. Chem. Soc. 1938, 60, 309–319. [Google Scholar] [CrossRef]
  52. Rouquerol, J.; Llewellyn, P.; Rouquerol, F. Is the BET equation applicable to microporous adsorbents? Stud. Surf. Sci. Catal. 2007, 160, 49–56. [Google Scholar]
  53. Neimark, A.V.; Lin, Y.; Ravikovitch, P.I.; Thommes, M. Quenched solid density functional theory and pore size analysis of micro-mesoporous carbons. Carbon 2009, 47, 1617–1628. [Google Scholar] [CrossRef]
  54. Gregg, S.J.; Sing, K.S.W. Adsorption, Surface Area and Porosity, 2nd ed.; Academic Press: London, UK; New York, NY, USA, 1982; p. 303. [Google Scholar]
  55. Barrett, E.P.; Joyner, L.G.; Halenda, P.P. The determination of pore volume and area distributions in porous substances. I. Computations from nitrogen isotherms. J. Am. Chem. Soc. 1951, 73, 373–380. [Google Scholar] [CrossRef]
  56. Shkolin, A.V.; Fomkin, A.A.; Men’shchikov, I.E.; Kharitonov, V.M.; Pulin, A.L. A bench for Measuring Adsorption of Gases and Vapors by the Gravimetric Method and Its Operation Procedure. Patent RF no. 2732199, 14 September 2020. [Google Scholar]
  57. Shkolin, A.V.; Fomkin, A.A. Measurement of Carbon-Nanotube Adsorption of Energy-Carrier Gases for alternative energy systems. Meas. Tech. 2018, 61, 395–401. [Google Scholar] [CrossRef]
  58. GOST 34100.3-2017/ISO/IEC Guide 93-3:2008; Part 3. Guide to the Expression of Uncertainty in Measurement. ISO: Geneva, Switzerland, 2008. Available online: https://files.stroyinf.ru/Data/651/65118.pdf (accessed on 18 June 2018).
  59. Shkolin, A.V.; Men’shchikov, I.E.; Khozina, E.V.; Yakovlev, V.Y.; Simonov, V.N.; Fomkin, A.A. Deformation of Microporous Carbon Adsorbent Sorbonorit 4 during Methane Adsorption. J. Chem. Eng. Data. 2022, 67, 1699–1714. [Google Scholar] [CrossRef]
  60. Shkolin, A.V.; Fomkin, A.A. Description of Adsorption-Stimulated Deformation of Microporous Adsorbents Based on Generalized Potential of Intermolecular Interactions (6, n). Prot. Met. Phys. Chem. Surf. 2016, 52, 193–198. [Google Scholar] [CrossRef]
  61. GOST ISO 11095:1996; Statistical Methods. Linear Calibration Using Reference Materials. ISO: Geneva, Switzerland, 1996. Available online: https://gostassistent.ru/doc/a6da0522-2d64-4f80-bdbe-5a156b96299a (accessed on 10 June 2018).
  62. Thommes, M.; Kaneko, K.; Neimark, A.V.; Oliver, J.P.; Rodrigues-Reinoso, F.; Rouquerol, J.; Sing, K. Physisorption of gases, with special reference to the evaluation of surface area and pore size distribution (IUPAC Technical Report). Pure Appl. Chem. 2015, 87, 1051–1069. [Google Scholar] [CrossRef] [Green Version]
  63. Shafeeyan, M.S.; Houshmand, A.; Daud, W.M.A.W.; Shamiri, A. A review on surface modification of activated carbon for carbon dioxide adsorption. J. Anal. Appl. Pyrol. 2010, 89, 143–151. [Google Scholar] [CrossRef]
  64. Giraldo, L.; Vargas, D.P.; Moreno-Piraján, J.C. Study of CO2 Adsorption on Chemically Modified Activated Carbon with Nitric Acid and Ammonium Aqueous. Front. Chem. 2020, 8, 543452. [Google Scholar] [CrossRef]
  65. Shkolin, A.V.; Fomkin, A.A.; Yakovlev, V.Y. Analysis of adsorption isosteres of gas and vapor on microporous adsorbents. Russ. Chem. Bull. 2007, 56, 393–396. [Google Scholar] [CrossRef]
  66. Shkolin, A.V.; Fomkin, A.A.; Tsivadze, A.Y.; Anuchin, K.M.; Men’shchikov, I.E.; Pulin, A.L. Experimental study and numerical modeling: Methane adsorption in microporous carbon adsorbent over the subcritical and supercritical temperature regions. Prot. Met. Phys. Chem. Surf. 2016, 52, 955–963. [Google Scholar] [CrossRef]
  67. Men’shchikov, I.E.; Fomkin, A.A.; Tsivadze, A.Y.; Shkolin, A.V.; Strizhenov, E.M.; Pulin, A.L. Methane adsorption on microporous carbon adsorbents in the region of supercritical temperatures. Prot. Met. Phys. Chem. Surf. 2015, 51, 393–398. [Google Scholar] [CrossRef]
  68. Nikolaev, K.M.; Dubinin, M.M. Concerning adsorption properties of carbon adsorbents 3. A study of adsorption isotherms of gases and vapors on active carbons over a wide interval of temperatures, including the critical region. Russ. Chem. Bull. 1958, 7, 1124–1133. [Google Scholar] [CrossRef]
  69. Men´shchikov, I.E.; Fomkin, A.A.; Arabei, A.B.; Shkolin, A.V.; Strizhenov, E.M. Description of methane adsorption on microporous carbon adsorbents on the range of supercritical temperatures on the basis of the Dubinin–Astakhov equation. Prot. Met. Phys. Chem. Surf. 2016, 52, 575–580. [Google Scholar] [CrossRef]
  70. Pierson, H.O. Handbook of Carbon, Graphite, Diamond, and Fullerenes: Properties, Processing, and Applications, 1st ed.; Noyes Publications: Park Ridge, NJ, USA, 1993; pp. 59–60. [Google Scholar]
  71. Bailey, A.C.; Yates, B. Anisotropic Thermal Expansion of Pyrolytic Graphite at Low Temperatures. J. Appl. Phys. 1970, 41, 5088–5091. [Google Scholar] [CrossRef]
  72. Novikova, S.I. Thermal Expansion of Solids; Nauka: Moscow, Russia, 1974; p. 293. (In Russian) [Google Scholar]
  73. Menéndez-Díaz, J.A.; Martín-Gullón, I. Chapter 1. Types of Carbon Adsorbents and Their Production. In Interface Science and Technology, 1st ed.; Bandosz, T.J., Ed.; Elsevier: London, UK, 2006; Volume 7, pp. 1–47. [Google Scholar] [CrossRef]
  74. Men’shchikov, I.E.; Shiryaev, A.A.; Shkolin, A.V.; Vysotskii, V.V.; Khozina, E.V.; Fomkin, A.A. Carbon adsorbents for methane storage: Genesis, synthesis, porosity, adsorption. Korean J. Chem. Eng. 2021, 38, 276–291. [Google Scholar] [CrossRef]
  75. Uraki, Y.; Tamai, Y.; Ogawa, M.; Gaman, S.; Tokurad, S. Activated carbon from peat. BioResources 2009, 4, 205–213. [Google Scholar]
  76. Bergna, D.; Hu, T.; Prokkola, H.; Romar, H.; Lassi, U. Effect of Some Process Parameters on the Main Properties of Activated Carbon Produced from Peat in a Lab-Scale Process. Waste Biomass Valorization 2020, 11, 2837–2848. [Google Scholar] [CrossRef] [Green Version]
  77. Fedorov, N.F.; Ivakhnyuk, G.K.; Gavrilov, D.N.; Tetenov, V.V.; Smetanin, G.N.; Samonin, V.V.; Babkin, O.E.; Zaitzev, Y.A. Carbon Adsorbents from Inorganic Compounds of Carbon. In Carbon Adsorbents and their Industrial Applications; Nauka: Moscow, Russia, 1983; pp. 20–33. (In Russian) [Google Scholar]
  78. Shkolin, A.V.; Fomkin, A.A. Deformation of auk microporous carbon adsorbent induced by methane adsorption. Col. J. 2009, 71, 119–124. [Google Scholar] [CrossRef]
  79. Pulin, A.L.; Fomkin, A.A. Thermodynamics of CO2 adsorption on zeolite NaX in wide intervals of pressures and temperatures. Russ. Chem. Bull. 2004, 53, 1630–1634. [Google Scholar] [CrossRef]
  80. Naum, R.G.; Jun, C.K. Thermal expansion of Polycrystalline Graphite. J. Appl. Phys. 1970, 41, 5092–5095. [Google Scholar] [CrossRef]
  81. Ma, X.; Yang, Y.; Wu, Q.; Liu, B.; Li, D.; Chen, R.; Wang, C.; Li, H.; Zeng, Z.; Liqing Li, L. Underlying mechanism of CO2 uptake onto biomass-based porous carbons: Do adsorbents capture CO2 chiefly through narrow micropores? Fuel 2020, 282, 118727. [Google Scholar] [CrossRef]
  82. Ravikovitch, P.I.; Neimark, A.V. Density functional theory model of adsorption deformation. Langmuir 2006, 22, 10864–10868. [Google Scholar] [CrossRef]
  83. Sampath, K.; Perera, M.; Ranjith, P.; Matthai, S.; Rathnaweera, T.; Zhang, G.; Tao, X. CH4–CO2 Gas exchange and supercritical CO2 based hydraulic fracturing as CBM production-accelerating techniques: A review. J. CO2 Util. 2017, 22, 212–230. [Google Scholar] [CrossRef]
  84. Neimark, A.V.; Grinev, I. Adsorption-Induced Deformation of Microporous Solids: A New Insight from a Century-Old Theory. J. Phys. Chem. 2020, 124, 749–755. [Google Scholar] [CrossRef]
  85. Hill, T.L. Theory of Physical Adsorption. In Advances in Catalysis and Related Subjects; Frankenburg, W.G., Komarewsky, V.I., Rideal, E.K., Eds.; Academic Press: New York, NY, USA, 1952; Volume 4, pp. 211–258. [Google Scholar]
  86. Myers, A.L. Thermodynamics of adsorption in porous materials. AIChE J. 2002, 48, 145–160. [Google Scholar] [CrossRef]
  87. National Institute of Standards and Technology. Search for Species Data by Chemical. In NIST Chemistry WebBook; National Institute of Standards and Technology: Gaithersburg, MA, USA, 2018. [Google Scholar]
  88. Fomkin, A.A. Adsorption of gases, vapors and liquids by microporous adsorbents. Adsorption 2005, 11, 425–436. [Google Scholar] [CrossRef]
Figure 1. Standard isotherms of adsorption (light symbols)/desorption (dark symbols) of nitrogen vapors onto Sorbonorit 4 at 77 K represented in linear coordinates and semi-log coordinates (in the inset).
Colloids 07 00046 g001
Figure 2. The PSD function calculated by the QSDFT method for micropores (a) and the BJH method for mesopores (b) in Sorbonorit 4.
Colloids 07 00046 g002
Figure 3. SEM images of the surface of Sorbonorit 4 at a scale bar of 90 μm (a) and 9 μm (b).
Colloids 07 00046 g003
Figure 4. Isosteres of carbon dioxide adsorption onto Sorbonorit 4 at the values of adsorption a, mmol·g−1: 0.05 (1), 0.1 (2), 0.15 (3), 0.2 (4), 0.4 (5), 0.6 (6), 0.8 (7), 1.0 (8), 1.4 (9), 1.8 (10), 2.2 (11), 2.6 (12), 3.0 (13), 3.4 (14), 3.8 (15). Dashed red lines separate the regions of sub- and supercritical state of adsorbed molecules: Tλ < T < Tcr and T > Tcr, respectively.
Colloids 07 00046 g004
Figure 5. The carbon dioxide adsorption onto Sorbonorit 4 versus pressure represented in semilog coordinates at temperatures T, K: 216.4 (1), 243 (2), 273 (3), 293 (4), 333 (5), and 393 (6). The dark symbols show the experimental data; the light symbols are the values of adsorption evaluated based on the linearity of the isosteres of adsorption; the solid lines are the results of calculation using Equations (1)–(9); the dashed lines separate the data obtained by these three methods.
Colloids 07 00046 g005
Figure 6. The temperature-induced strain of Sorbonorit 4 measured under vacuum. The bars show the expanded uncertainty of measurements.
Colloids 07 00046 g006
Figure 7. Temperature dependence of TLEC of Sorbonorit 4 under vacuum conditions (violet line) compared with the data for a graphite crystal in a plane parallel and perpendicular to the main crystallographic axis: αII and α (respective black lines) [70,71]; microporous carbon adsorbent ASC (dashed black line) [20].
Colloids 07 00046 g007
Figure 8. The adsorption-induced strain of the Sorbonorit 4 adsorbent versus CO2 pressure (a) from 0.1 Pa to 6 MPa and (b) from 0.1 Pa to 1 MPa, measured at a temperature T, K: 216.4 (1), 243 (2), 273 (3), 293 (4), 333 (5), and 393 (6). Symbols are the experimental data on deformation obtained during adsorption (light symbols) and desorption (dark symbols). Solid lines are the spline-approximation. The dashed lines (a) mark the pressure of saturated vapor at the corresponding temperature. The bars on curve 5 (b) show the expanded measurement uncertainty.
Colloids 07 00046 g008
Figure 9. The AID value of Sorbonorit-4 (symbols) versus the carbon dioxide uptake at temperatures T, K: 216.4 (1), 243 (2), 273 (3), 293 (4), 333 (5), 393 (6). The solid lines are the spline approximation.
Colloids 07 00046 g009
Figure 10. The initial jump-like AID of Sorbonorit-4 (symbols) at the CO2 adsorption a = 0.3 mmol/g versus reciprocal temperature. The solid line is the linear approximation. The dashed line shows the zero deformation.
Colloids 07 00046 g010
Figure 11. Schematic representation of macroscopic deformation of a model carbon microporous adsorbent: adsorbent in a pre-stressed state under vacuum after regeneration at a certain temperature, white arrows indicate the forces inside and outside the nanocrystallite (a); the initial contraction of nanocrystallites (at low temperatures) (b); the expansion of nanocrystallites (at elevated temperatures and/or high pressures) (c). Red arrows indicate the direction of nanocrystallite deformation and green arrows indicate the direction of rotation of nanocrystallites (b,c).
Colloids 07 00046 g011
Figure 12. The differential molar isosteric heat of carbon dioxide adsorption onto Sorbonorit 4 versus the adsorption value at temperatures, K: 216.4 (1), 243 (2), 273 (3), 293 (4), 333.0 (5), 393 (6), calculated by Equation (12). The curve 0 shows the results of the calculation of qst by Equation (13), i.e., without corrections for the non-ideality of the gaseous phase and the non-inertness of the adsorbent at 216.4 K.
Colloids 07 00046 g012
Figure 13. The differential molar isosteric entropy of the CO2–Sorbonorit 4 adsorption system versus the CO2 uptake at temperatures, K: 216,4 (1); 243 (2); 273 (3); 293 (4); 333 (5); 393 (6).
Colloids 07 00046 g013
Figure 14. Calculated temperature dependences of the differential molar heat capacity, Ca, of the CO2–Sorbonorit 4 adsorption system for various values of CO2 uptake, mmol/g: 1.0 (1); 1.5 (2); 2.0 (3); 2.5 (4); 3.0 (5); 4.0 (6); 5.0 (7); 6.(8); 7.0 (9); 8.0 (10); 9.0 (11); 10.0 (12).
Colloids 07 00046 g014
Table 1. Physicochemical properties of carbon dioxide [47,48,49].
MTb, KTcr, Kρcr, kg/m3Pcr,
MPa
Tλ, Kd/lm,
Å/Å
dkin,
Å
44,011194.65304.194687.382216.553.1/4.13.3
M is a molecular mass of carbon dioxide; Tb [K] is the boiling point; Tcr [K] is the critical temperature; Pcr [MPa] is the critical pressure; ρcr [kg/m3] is the critical density; Tλ [K] is the ternary point; d [Å] is the critical diameter along the smallest axis of a molecule (it is commonly used to assess a possibility of an adsorptive molecule to penetrate into the pores of an adsorbent and its value is measured experimentally by the ability to be adsorbed in window-cage type zeolites [48]) and lm [Å] is the length of a molecule; dkin [Å] is the kinetic diameter of a molecule.
Table 2. The parameters of porous structure of Sorbonorit 4 evaluated from the standard isotherm of nitrogen vapors at 77 K.
AdsorbentSBET,
m2/g
W0, cm3/gX0, nmE0, kJ/molWS,
cm3/g
WME,
cm3/g
SME,
m2/g
d M A X N L D F T , nm d M A X B J H ,
nm
Sorbonorit 412000.490.5521.80.510.02101.223.9
Here, SBET is the specific BET surface [51,52]; W0 is the micropore volume; X0 is the micropore half-width; E0 is the characteristic energy of adsorption [43,44]; WS is the total pore volume; WME is the mesopore volume; SME is the specific mesopore surface [54]; d M A X N L D F T is the micropore size, which corresponds to the maximum of the PSD function evaluated by the QSDFT method elaborated for micro-mesoporous adsorbents [53]; d M A X B J H is the mesopore size, which corresponds to the maximum of the PSD function provided by the use of the BJH method [55].
Table 3. The elemental composition of Sorbonorit 4 according to the EDX data.
ElementAmount, at.%
C89.35
O9.11
K0.23
Other impurities1.21
Table 4. The maximum percent contribution of the non-ideality of the CO2 gaseous phase (ΔZ) and non-inertness of the Sorbonorit 4 adsorbent exhibited as the temperature- and adsorption-induced deformations, Δη(T) and Δη(a), and their summarized contribution (Δη(a+T)) to the differential molar isosteric heat of carbon dioxide adsorption onto Sorbonorit 4 within a temperature ranging from 216.4 to 393 K and up to a pressure of 6 MPa.
T, KΔqst, %
ΔZ, %Δη(T), %Δη(a), %Δη(a+T), %
216.4−2.920.02−0.05−0.03
243−2.910.02−0.020
273−19.320.21−0.67−0.46
293−42.650.74−1.38−0.64
333−84.942.59−0.192.40
393−41.513.810.043.85
Disclaimer/Publisher’s Note: The statements, opinions and data contained in all publications are solely those of the individual author(s) and contributor(s) and not of MDPI and/or the editor(s). MDPI and/or the editor(s) disclaim responsibility for any injury to people or property resulting from any ideas, methods, instructions or products referred to in the content.

