Article

The Viscosity and Self-Diffusion of Some Real Colloidal Ferrofluids

by
Luis D. Ávalos González
,
Martin Hernández-Contreras
* and
Karen Meza Martínez
Departamento de Física, Centro de Investigación y Estudios Avanzados del Instituto Politécnico Nacional, Ciudad de México 14-740, Mexico
*
Author to whom correspondence should be addressed.
Colloids Interfaces 2022, 6(4), 62; https://doi.org/10.3390/colloids6040062
Submission received: 3 September 2022 / Revised: 2 October 2022 / Accepted: 27 October 2022 / Published: 31 October 2022

Abstract

:
One primary concern in colloid science is understanding the relationship of its macroscopic rheology and diffusion behavior with the observed microscopic arrangements of the nanoparticles in the fluid. This manuscript addresses the study of these dynamical properties through a first-principle stochastic method. Both properties directly relate to the observed fluid structure factor, which depends on a few known material parameters. However, in the literature, this static quantity is reported up to the first prominent peak of its small momentum transfer of the scattered radiation, leading to inaccurate determination of the transport properties. Here, it is proposed to use the rescaled mean spherical approximation under the requirement of fitting the experimental data of the structure beyond the dependence of more significant wave numbers. The predicted viscosity agrees with the observed ones at a low volume fraction of particles for ferrofluids dispersed in polymer solvents. This rheological quantity is inversely related to the self-diffusion coefficient of a tracer particle.

Graphical Abstract

1. Introduction

Nowadays, the experimental study of rheology in well-characterized ferrofluids is amply documented, either in the presence or absence of external magnetic fields [1]. Ferrofluids consist of nanometer-sized magnetic particles dispersed in a solvent. Nonetheless, modeling the viscosity and transport properties of the self-diffusion of the magnetic particles has not yet reached the same level of understanding. Important tools which depend on a physically motivated fixing parameter to study the viscosity of magnetic fluids are the Rosenzweig model and Chow’s polymer rheology model properly adapted to ferrofluids [1]; however, measurements of the diffusion coefficient at diverse thermodynamic conditions of solvent properties, the colloid volume fraction, and dipolar strength are not known. With this motivation, this manuscript proposes a stochastic model to determine the self-diffusion and viscosity of monodisperse ferrofluids. These transport properties rely upon the accurate knowledge of the microstructure of the ferrofluid given by the structure factor. According to our understanding, in the literature, scarce publications of comprehensive experimental studies on the microstructure and its relation to the dynamics in the same well-characterized magnetic fluid are noticeable. This manuscript aims to contribute to developing a first-principle approach to understanding the rheology of ferrofluids.
Therefore, a proposed dynamical model will be helpful if it is based on the comprehensive experimental data of the fluid structure and contrasted with the observed dynamics. Scattering techniques of neutrons, small-angle X-rays, and forced Raleigh experiments yield access to the structure factor of ferrofluids [2,3,4]. A significant drawback of this observed static property is its limited, short momentum transfer dependence due to the limited resolutions of the scattering radiation techniques at larger magnitudes. These techniques only provide the prominent structure factor peak in the low-wave-vector regime and neglect the tail, which contains non-negligible spatial information.
For this reason, this manuscript resorts to one of the most numerically economical methods that is accurate enough to determine the structure factor of the colloid. This manuscript uses a rescaled mean spherical approximation fit of known experimental structure factors to accurately assess the total wave number contributions. As a result, the present study renders a novel prediction of diffusion and viscosity of the ferrofluid without arbitrary adjustable parameters. The prediction depends solely on material data of the volume fraction of particles and dipole strength associated with the structure factor. Thus, a comparison of this model for the viscosity of ferrofluids dispersed in polymer solutions shows their agreement at a low volume fraction of particles and how they deviate at higher concentrations. Previous studies on such rheology properties use a thermodynamically motivated fixing parameter to explain the same experimental data [1,5]. Appendix A introduces the stochastic method used in this manuscript. Its principal physical results are summarized as follows: During its diffusion, a tracer colloidal particle experiences interaction with the cloud of others surrounding it, contributing to a friction ∆ζ. Additionally, the hydrodynamic friction ζ s ϕ contributes to the slowing down of its motion due to the solvent (sol) with a viscosity η s o l .   It also depends on the concentration of the other particles at the volume fraction ϕ . That is to say, ζ = ζ s + Δ ζ gives the total friction on the tracer particle. References [6,7] demonstrated that the diffusion coefficient of the tracer particle at the longtime (so-called overdamped diffusion regime) satisfies a Stokes–Einstein relationship D = k B T / ζ , whose explicit form is:
D D s = 1 + 1 36 π ϕ 0 d x x 2 S x 1 2 S x μ T + 1 1
where μ T = D / D s and D s = k B T / ζ s .   The second term in the square bracket on the right-hand side of (1) is the   ratio   Δ ζ / ζ s . k B is the Boltzmann constant, and T is the absolute temperature. Notice that Equation (1) is given precisely in terms of the structure factor S x , which presently is an unknown quantity to the theory of Equation (1). The present manuscript does not concern the measurement of the structure factor. However, an independent study in References [2,3,4] reported the measurement for several magnetic colloids. The main difficulty is its insufficient and limited wave number k measurement associated with the experimental techniques. The following section describes how to extend it to a larger k through the so-called rescaled mean spherical approximation (RMSA) by a fit of the experimental S x of [2,3,4]. In Equation (1), the short-time friction ζ s considers the hydrodynamic interaction among the magnetic particles, which is vital for concentrated colloids. This property has not been measured for ferrofluids yet. Therefore, this manuscript resorts to its experimental counterpart corresponding to an equivalent hard sphere colloidal suspension of polystyrene particles given in Ref. [8] without an electrical charge. The Carnahan–Starling pair correlation function g ϕ = 1 0.5 ϕ / 1 + ϕ 3 also gives an approximated theoretical value ζ s = ζ 0 g ϕ [9]. For a very-low-concentrated suspension, ζ s ζ 0 = 3 π η s o l d acquires the Stokes form of a free-diffusing particle where d is the particle diameter, ϕ = π ρ d 3 / 6 , and ρ = N / V is the number density for a colloid constituted by N colloidal particles occupying a sample volume V . References [6,7] showed that the total tracer friction has a linear relationship with the static viscosity of ferrofluids and has the simple expression:
η = ζ 0 + Δ ζ , 3 π d = η s o l D 0 D = η s o l   D D s D s D 0
In Equation (2), due to the hydrodynamic interactions (HI) among all the particles, the normalized self-diffusion coefficient D s / D 0 includes the modification of the Stokes free-particle friction ζ 0 = k B T / D 0 .
Because of the diffusion, Equation (1) and the viscosity of Equation (2) show a dependency on S x , which enters as an external input to this theory. A route to this knowledge is given by the analytical rescaled mean spherical approximation (RMSA) of the structure factor of hard spheres introduced by Hayter and Penfold [10]. Hansen and Hayter [11] demonstrated that it could accurately reproduce the experimental stricture factor of a fluid made of particles with the Yukawa repulsive interaction. This method rescales, with a parameter s , the wave number k , volume fraction η’, ionic electrolyte strength κ′, diameter of the particle d , and the parameters of the original system, k = k s , γ = γ s , κ = κ s , ϕ = η s 3 , d = d s , to preserve the analytical mean spherical approximation of Hayter and Penfold [11] for the structure factor S k = 1 / 1 24 η   c k with:
c k = A s i n k k cos k k 3 + B 2 k 2 1 k c o s k + 2 s i n k 2 k k 3 + η A 24 k 3 + 4 1 6 k 2 s i n   k 1 12 k 2 + 24 k 4 k c o s k 2 k 3 + C κ c o s h κ s i n k k sinh k cos k k k 2 + k 2 + F κ s i n h κ s i n k k ( cosh κ cos k 1 ) k κ 2 + k 2 + F c o s k 1 k 2 γ e κ κ sin k + k cos k k κ 2 + k 2
which describes a colloidal dispersion of particles with repulsive pair-interaction energy in electrolytes:
β U x = γ e κ x x ,       x > 1 ,
where x = r / d and β = 1 / k B T . The factors A, B, C, and F have involved expressions whose definitions are in Ref. [11].

2. Materials and Methods

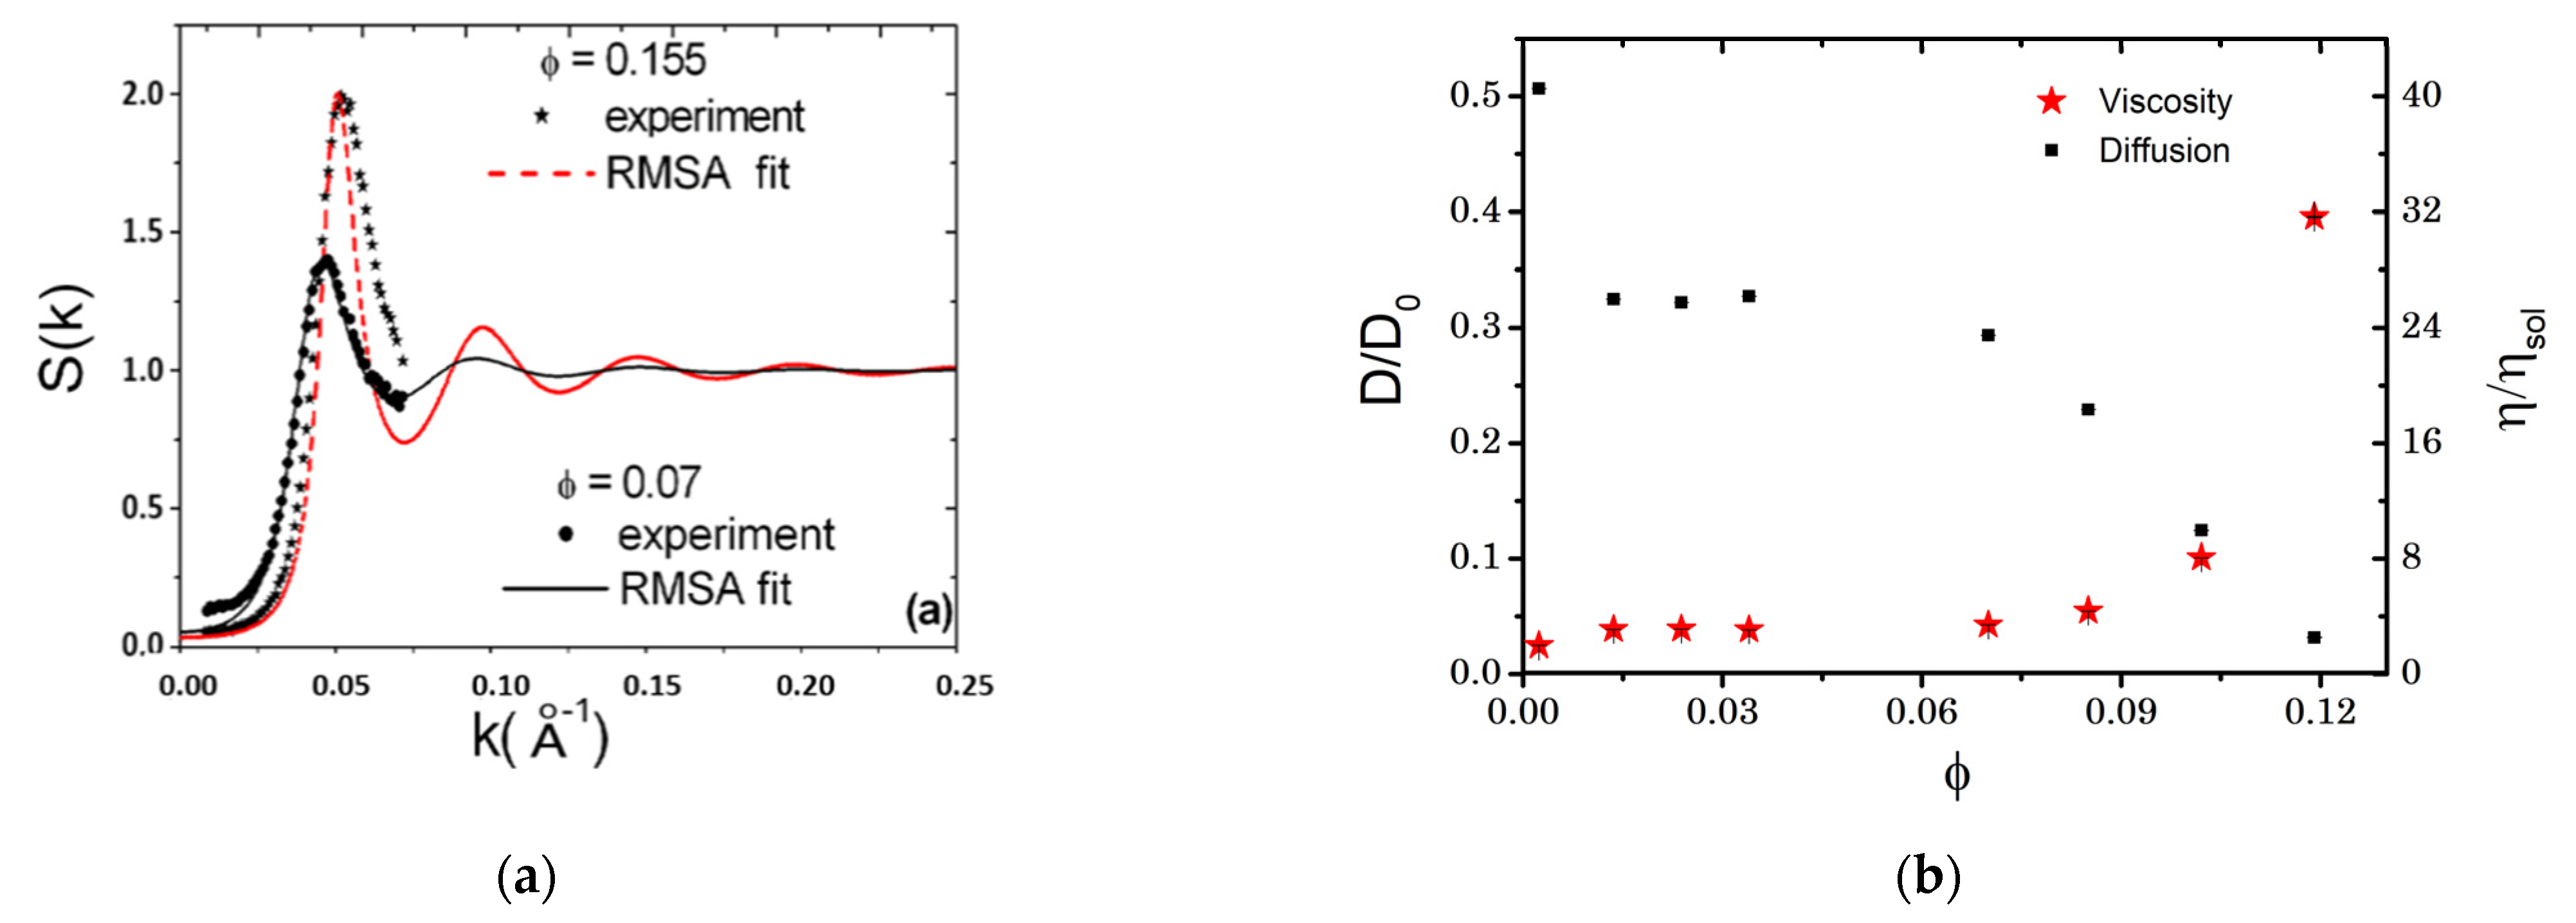
This section calculates a tracer particle’s self-diffusion coefficient and, from it, the bulk viscosity of some real ferrofluids. The first two systems studied are suspensions of maghemite ( γ F e 2 O 3 ) nanoparticles at volume fraction concentrations of ϕ = 0.007     and   0.155 in an aqueous trisodium citrate electrolyte (pH 7) at temperature T = 298   K with concentrations of 0.0025 M and 0.025 M, respectively. Data were taken from Cousin, F. et al. [12]. Adapted with permission from Ref. [12]. Copyright 2022 by the American Physical Society (Figure 1a).
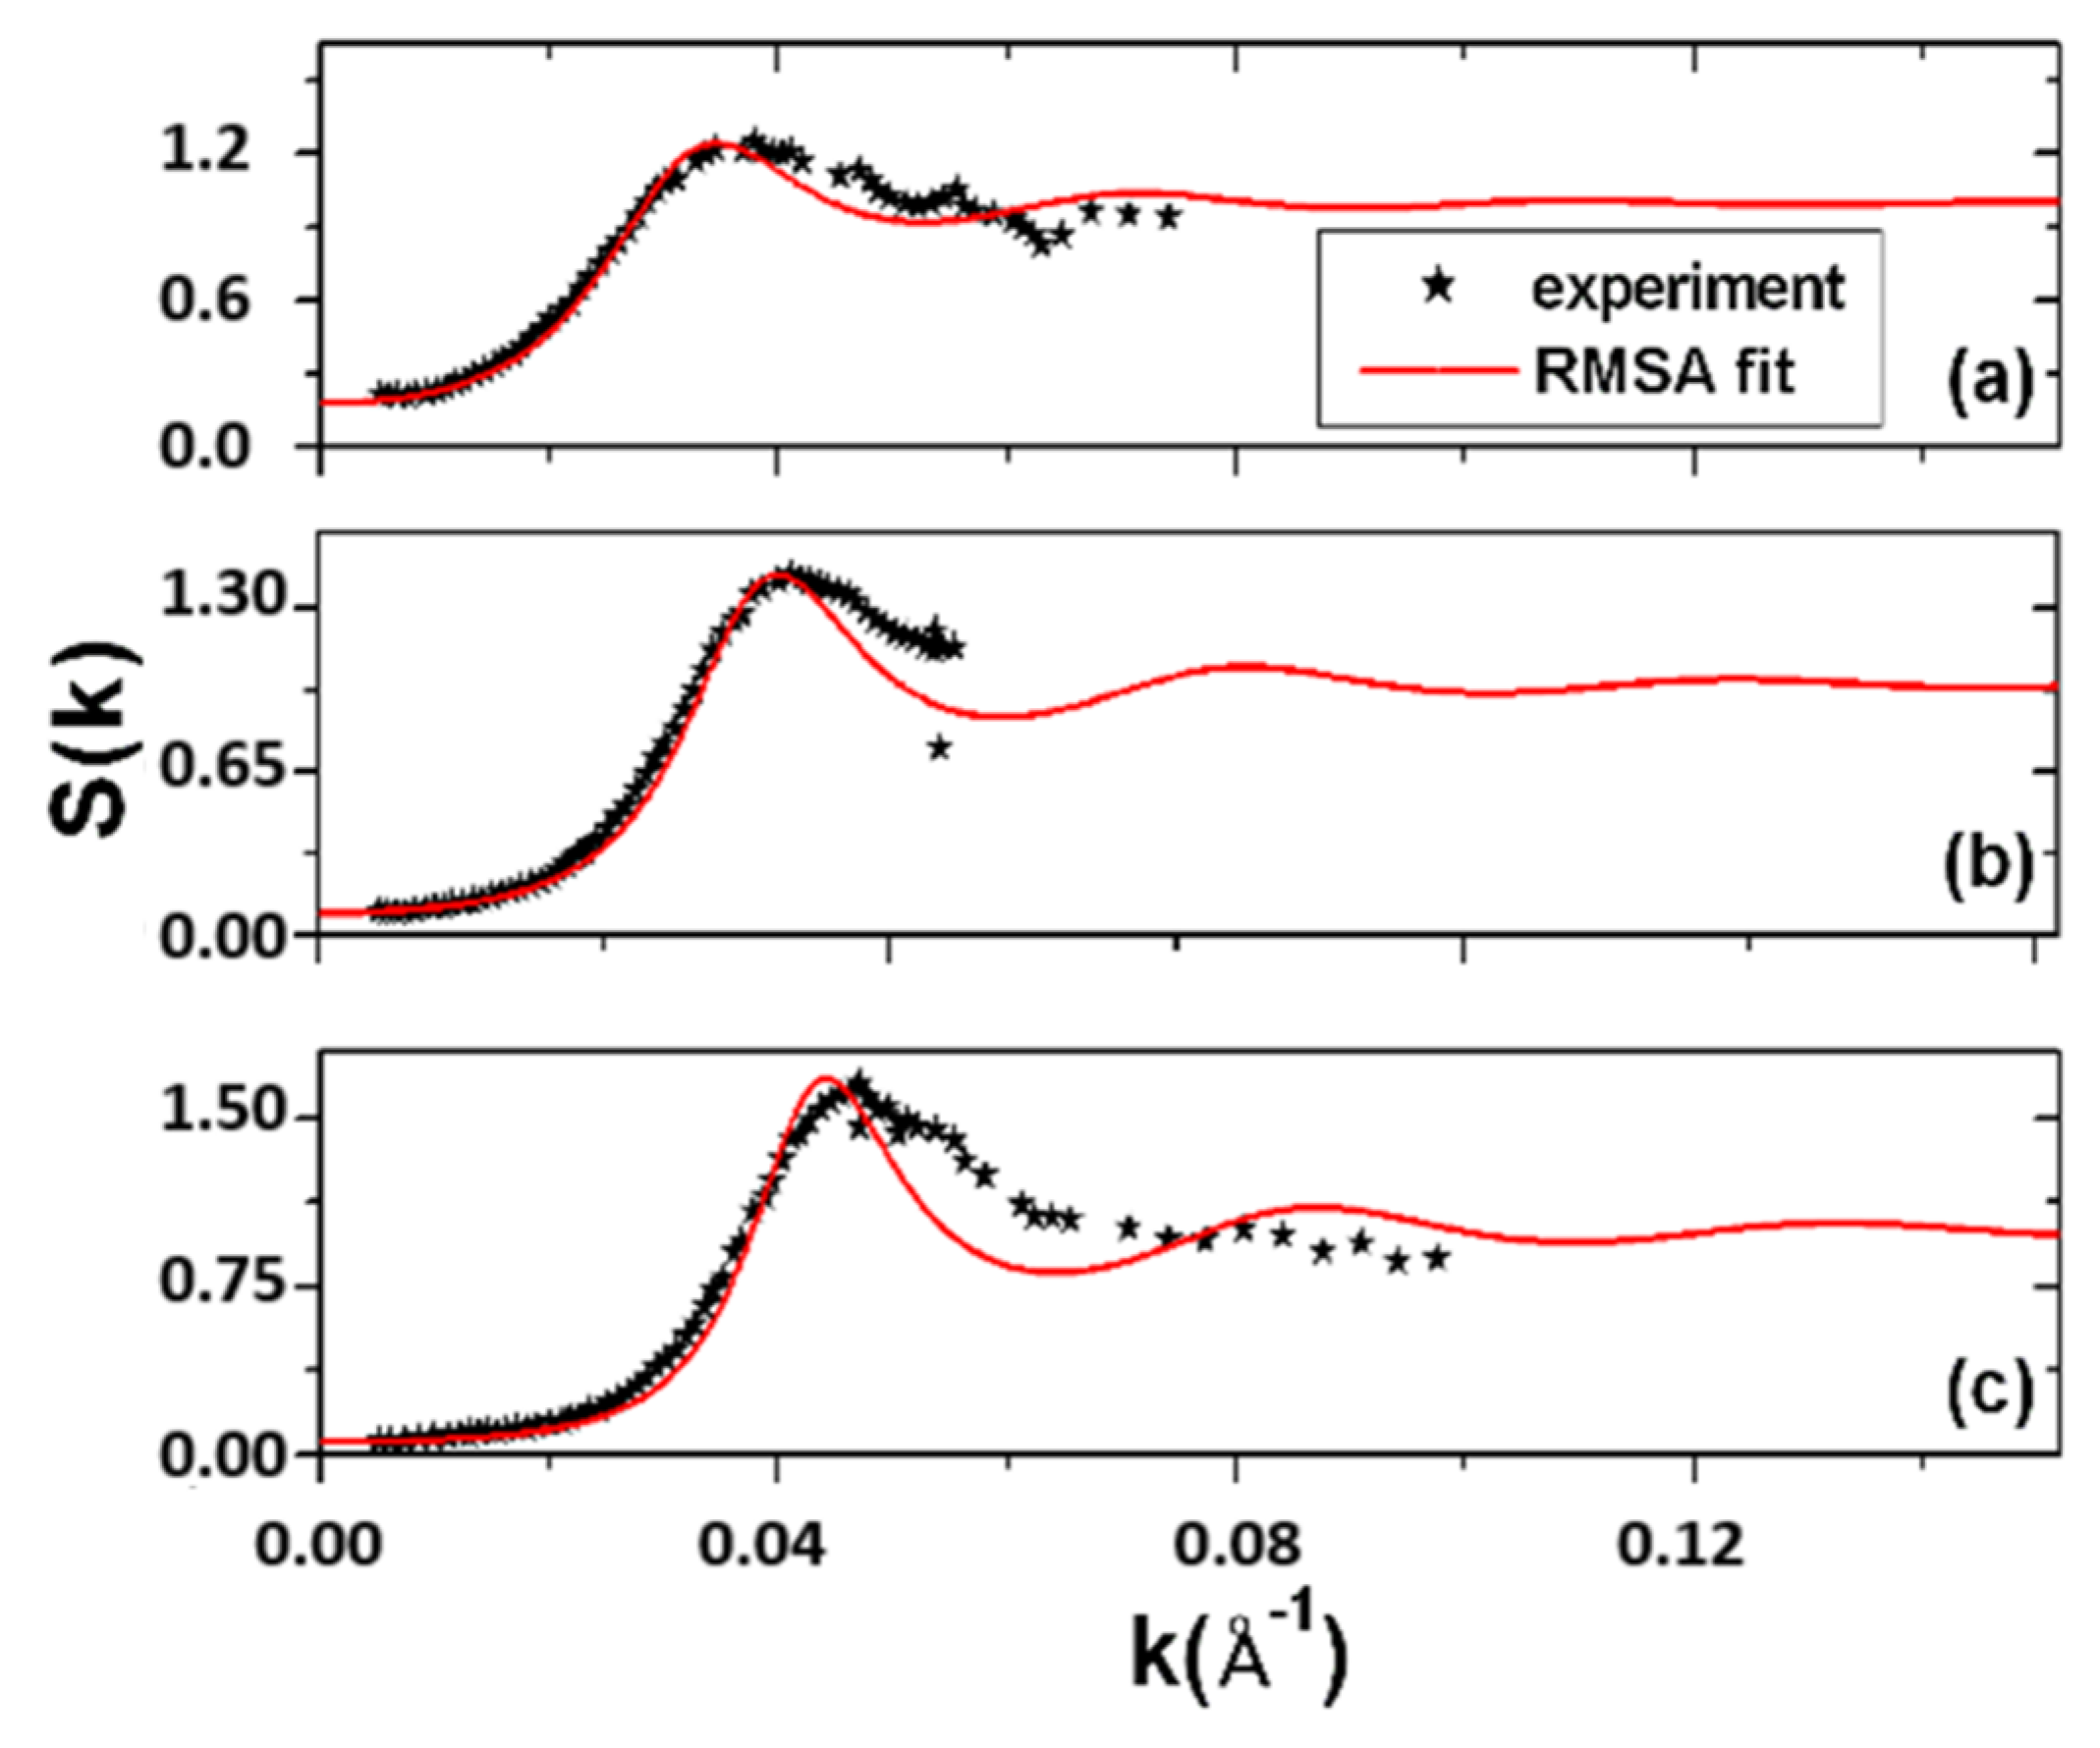
Figure 1 depicts both ferrofluids’ small-angle neutron scattering experimental structure factors. Figure 1a also displays the best fit of the experimental S k using Equation (3); see Appendix B. These fittings indicate that the leading pair-wise interaction between colloidal particles is a long-range repulsion represented by the potential energy of Equation (4). A picture with a long black line fits the actual colloid concentration of ϕ = 0.07, where particles have a reported mean diameter d = 69 . The results for the parameters in Equation (3) are: A = −18.476 441, B = 13.90703556, C = 2.001670513, and F = −1.99056432, with the rescaled values η = 0.205708299 , κ = 3.738041955 , γ = 180.3806936 , and s = 0.69815 . The fit of the more concentrated suspension at ϕ = 0.155 corresponds to a dashed line (red color online) where the values of the parameters of Equation (3) need to now be A = −30.1038152, B = 29.61722598, C= 0.564610346, and F = −0.56460917, and η = 0.328224489 , κ = 10.24267095 , γ = 136047.7841 , and s = 0.77873 . In this last case, the citrate concentration is 0.025 M, and the particle diameter d = 88 . Figure 1a shows that RMSA is good enough for the less-concentrated suspension and its prediction at a higher colloid concentration deteriorates, finding only an agreement with the high of the first peak of the measured structure. Furthermore, we calculated self-consistently from Equation (1) the normalized self-diffusion coefficient of a tracer particle departing from its free diffusion D / D 0 . References [6,7] demonstrated that for the concentrated ferrofluids and due to hydrodynamic interactions (HIs) among particles, the diffusion constant reads D / D 0 = D / D s ( D s / D 0 ). Therefore, using Equation (1) requires first knowing the input value of the experimental short-time diffusion coefficient D s / D 0 . For ferrofluids, it is not known. However, we interpolated seven of its functional values as a function of the volume fraction ϕ from the experiments of a rigid sphere-like suspension made of polystyrene particles reported by Van Megen, W. et al. [8]. Adapted with permission from Ref. [8]. Copyright 2022 by Royal Society of Chemistry. These are the pairs: ϕ , D s / D 0 = (0.013611, 0.972147), (0.023820, 0.953164), (0.034028, 0.934285), (0.07, 0.868598), (0.085072, 0.84146), (0.102086, 0.811099), and (0.119101, 0.781029). On the other hand, the RMSA fitting of S k for ϕ = 0.07 implies that there is a mapping of the factors s , A, B, C, and F onto the potential energy in Equation (4) with the rescaled amplitude of interaction γ = 180.380694 and dimensionless rescaled screening length κ = 3.738042 . This fact permits studying of the model systems derived from the actual colloidal suspension by varying only the volume fractions. Each of the above seven volume fractions ϕ corresponds to a different rescaled one given by η = ϕ   / s 3   that leads to the new structure factor S k = 1 / 1 24 η c k through Equation (3). To determine the longtime self-diffusion coefficients with the inclusion of the effects of the hydrodynamic interaction, D / D 0 = D / D s D s / D 0 , Equation (1) is integrated numerically up to a 0.001 precision from its previous result, starting with μ T = D / D 0 = 1 (see Appendix C). 
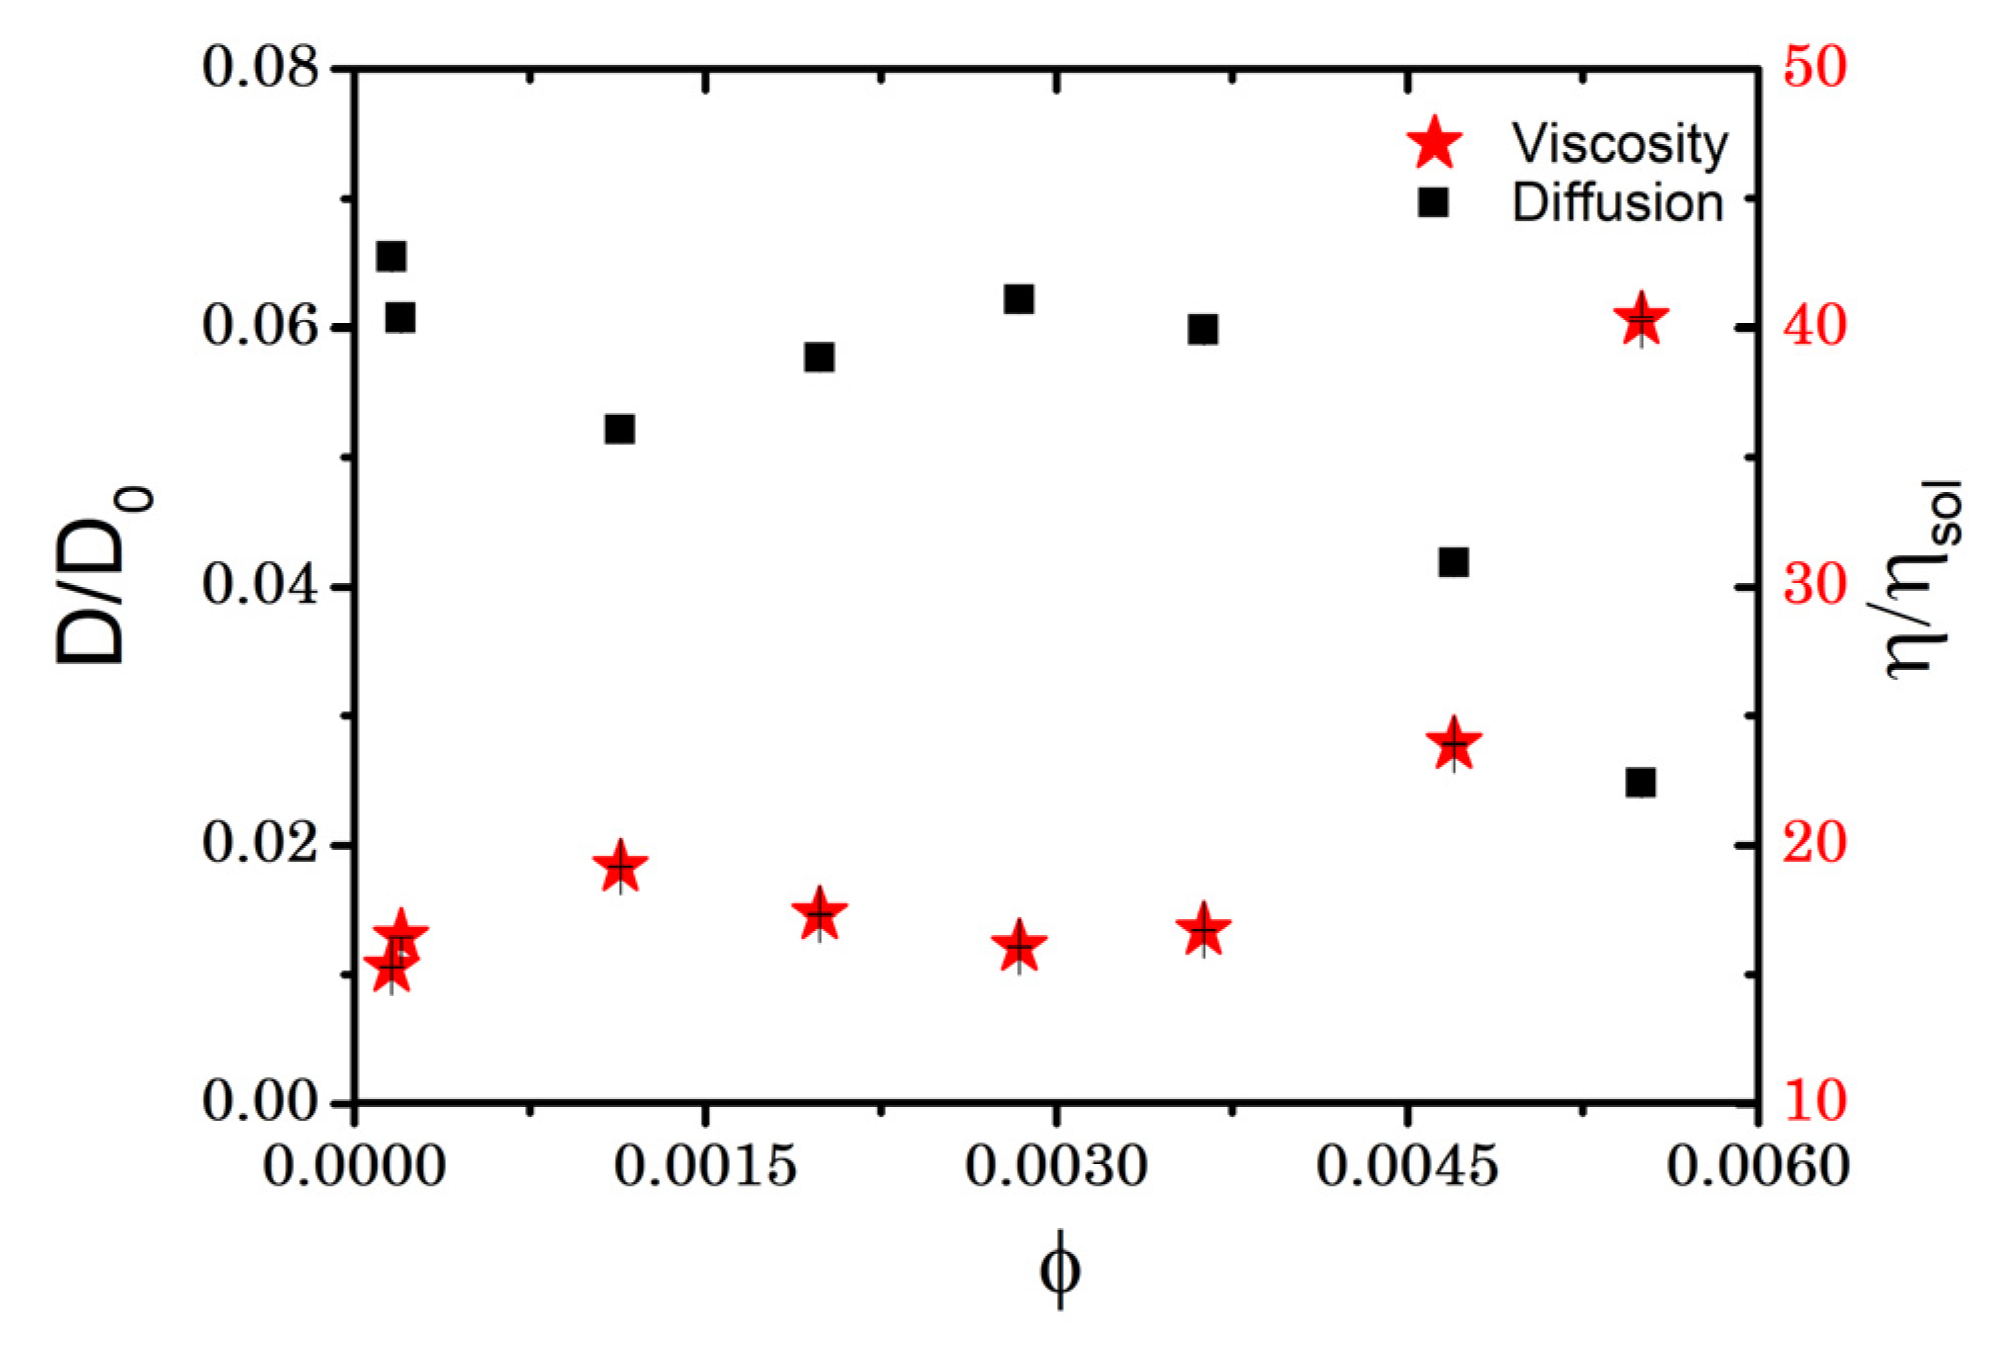
Figure 1b shows their values. On the other hand, the diffusion constants D / D 0 without the HI D s / D 0 = 1 are 0.333974, 0.337617, 0.350233, 0.337763, 0.272075, 0.153156, and 0.040574. According to our model of the static viscosity given in Equation (2), η / η s o l is inversely related to the above self-diffusion coefficient, and Figure 1b yields its concentration dependence for the inclusion of hydrodynamic interactions. Standard error bars of D / D 0 and η / η s o l   are on the order of 10 5 and they appear in Figure 1b. The errors result from recalculating each plotted value of D / D 0 and η / η s o l in Figure 1b at the five lower values of ϕ Δ for each of the seven ϕ in steps Δ = 10 5 . For each of the five ϕ Δ , the initial condition of the numerical difference of the fitted S k   versus the experimental one was the minimum in each of the five cases, which requires the additional boundary condition of the radial distribution function at the rescaled diameter d to be g x = r / d = 1 = 0 (see Appendix B).
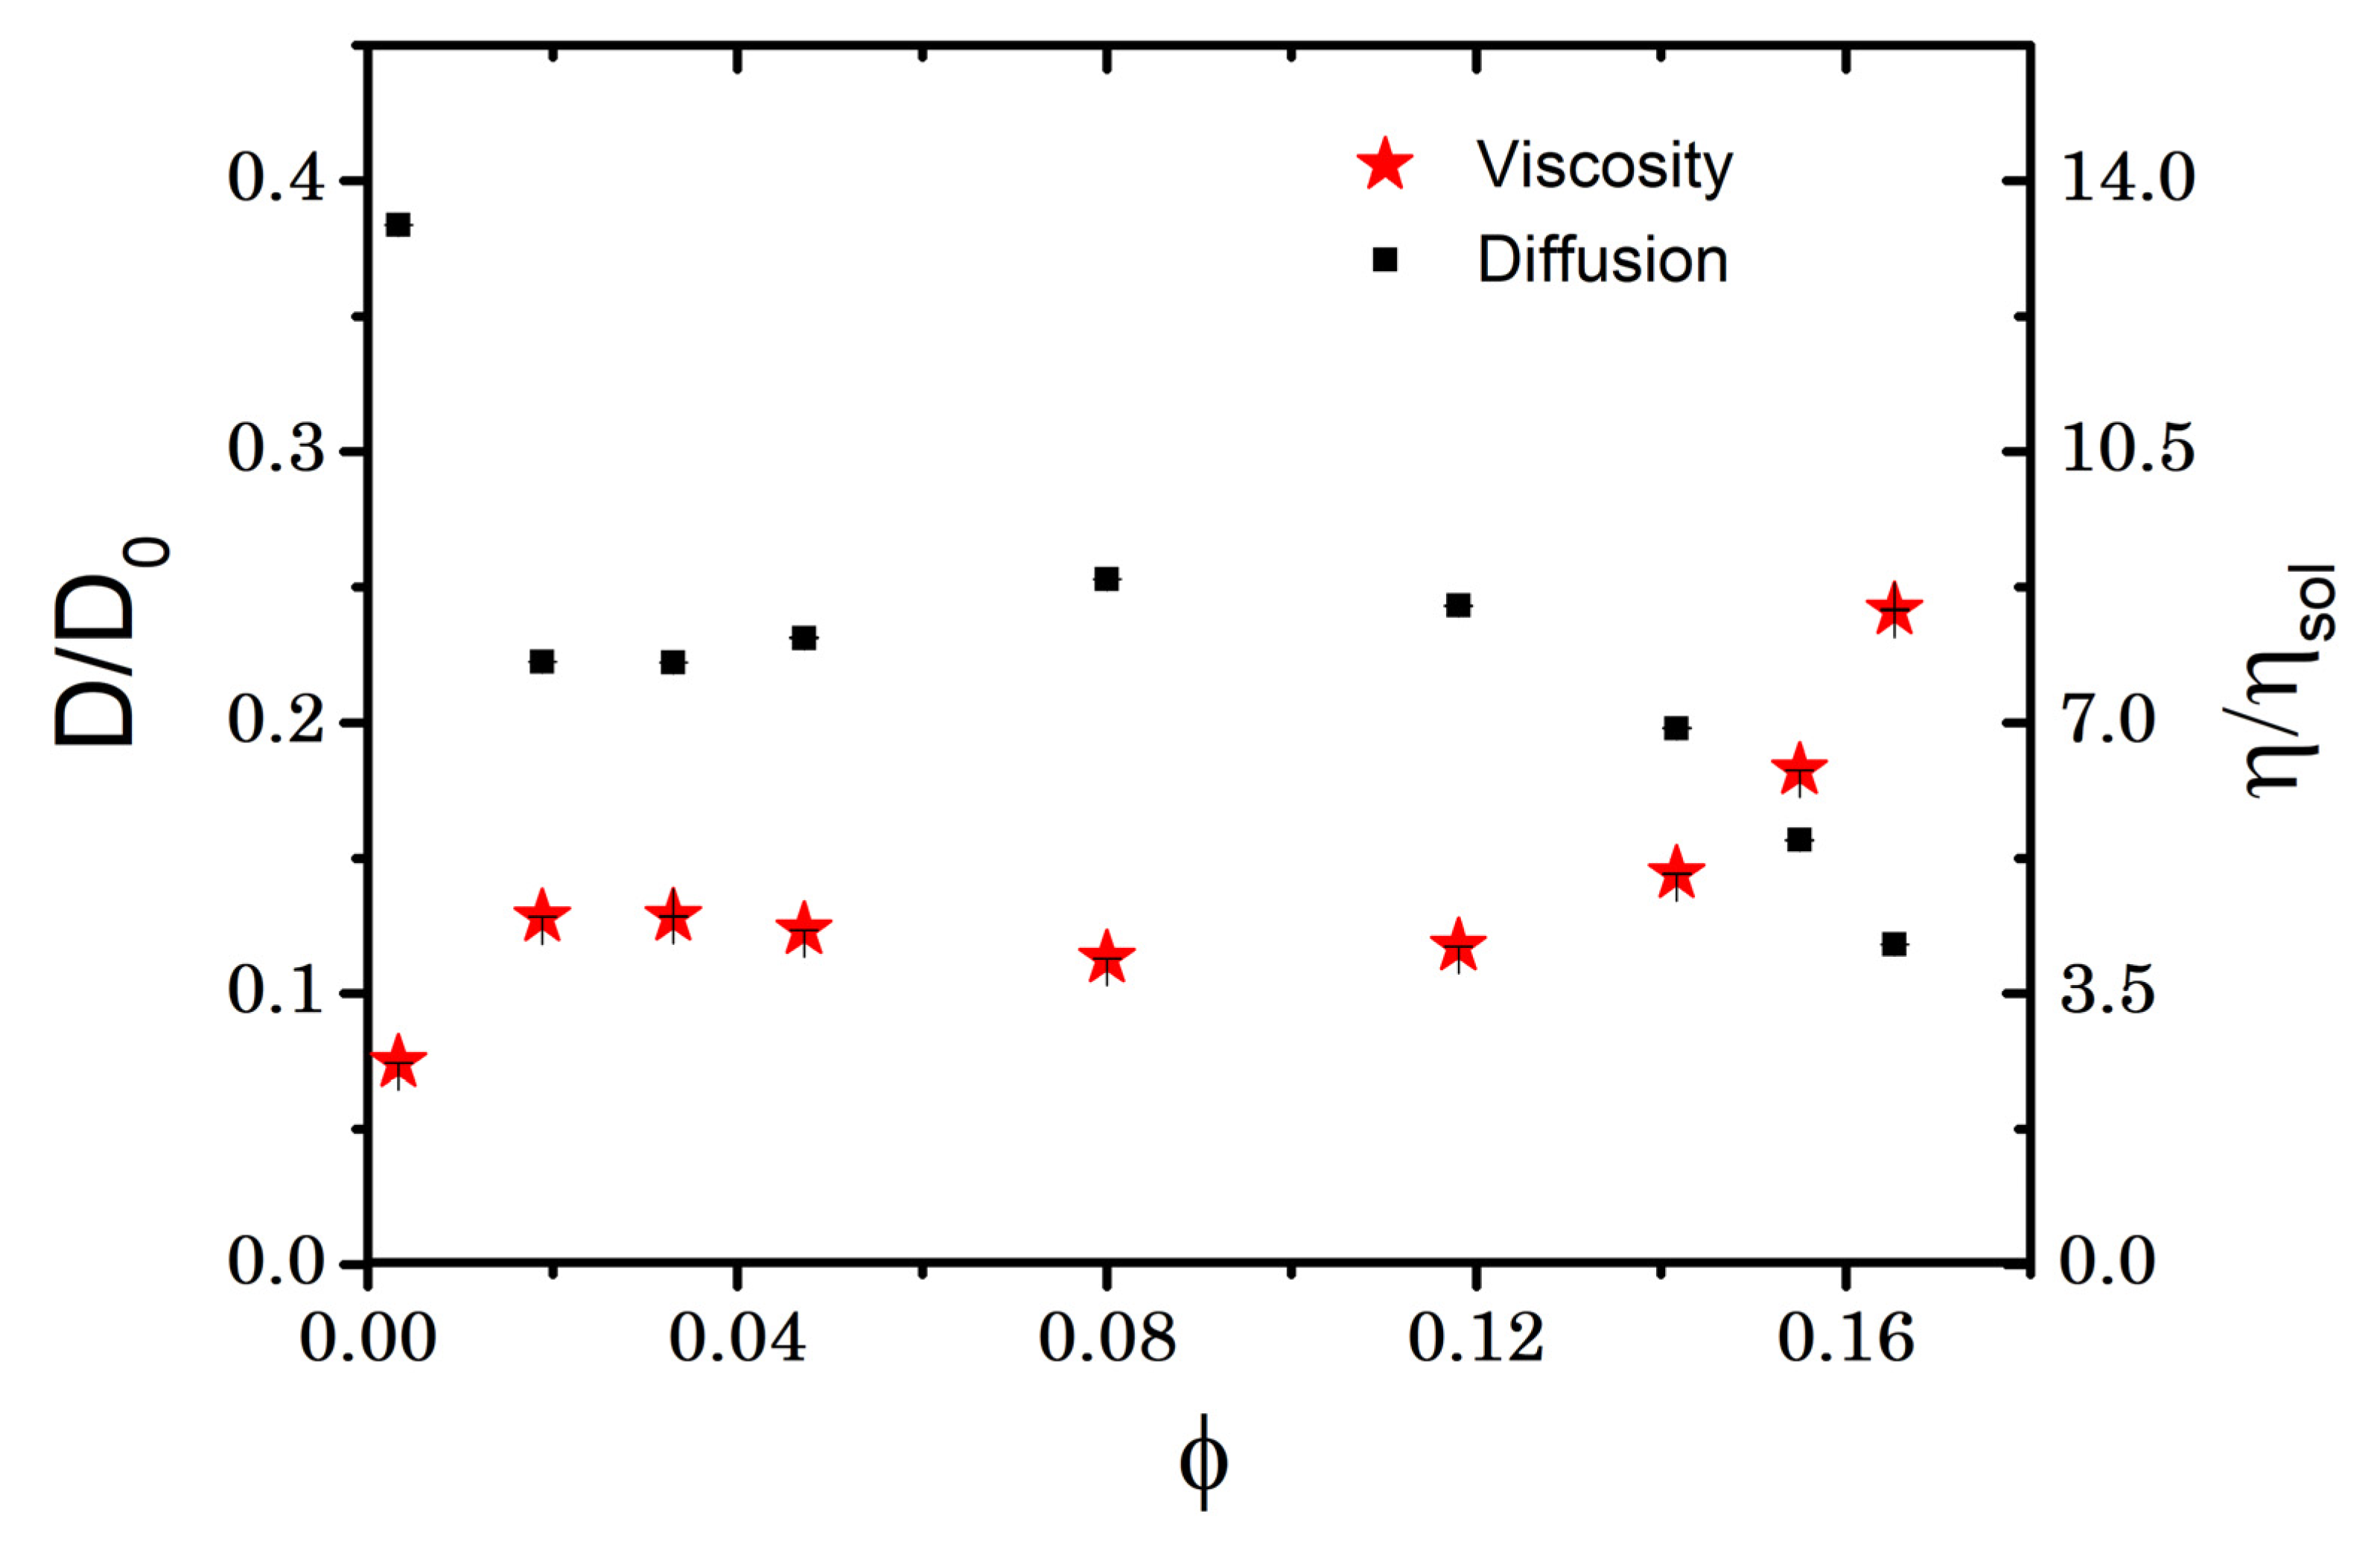
Figure 2 yields the prediction of the self-diffusion and viscosity.
Figure 2 shows the same seven volume fractions as those of Figure 1b, but now for the second system, whose structure factor was fitted with the RMSA dashed line, also depicted in Figure 1a. In 
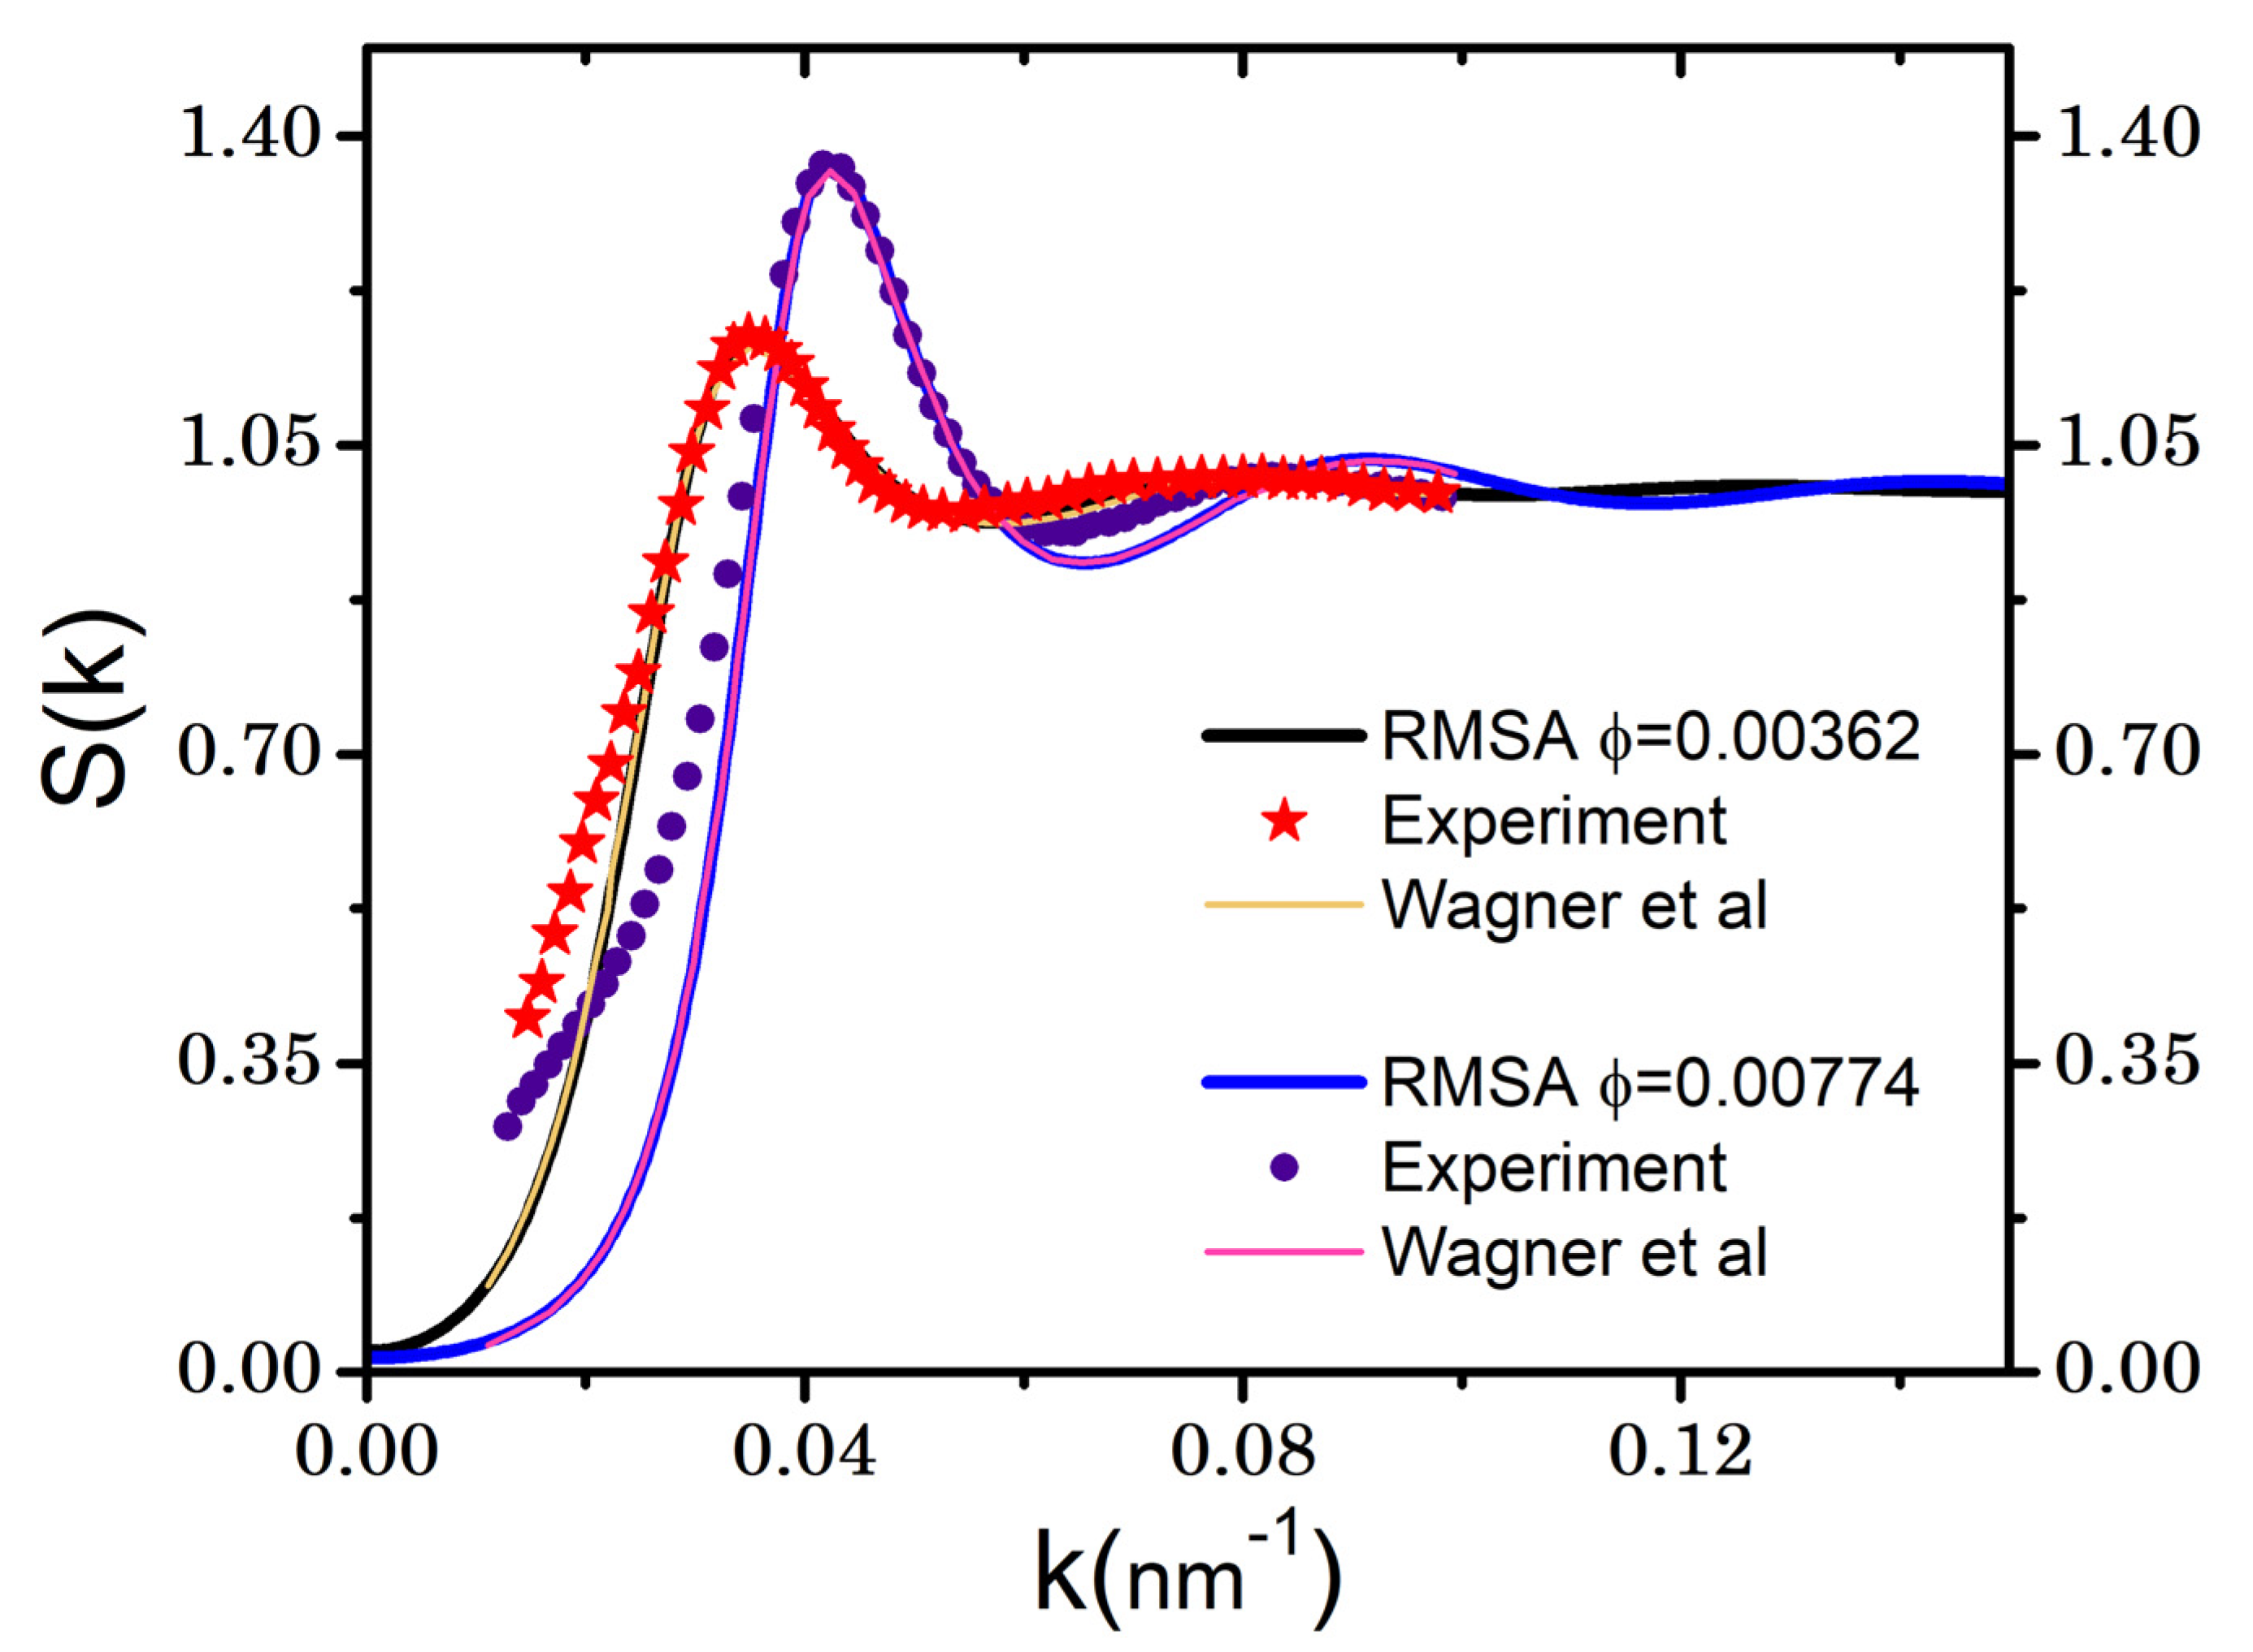
Figure 3, we provide the results for the ferrofluid.
This was reported by Wagner, J. et al. [3], and made of cobalt ferrite nanoparticles (Co F e 2 Q 4 ) with a silica core–shell dispersed in water at a counterion concentration of 5 × 10 7  M. The physical parameters of the ferrofluid are: charge per particle 51 e ( e , the electronic charge); water dielectric constant ϵ = 78 ; particle diameter d = 413 ; counterion charge 1 e ; and temperature T = 298   K . Adapted with permission from Ref. [3]. Copyright 2022 IOP Publishing, Ltd. In contrast to the previous colloids, the volume fraction is now very low, where ϕ = 0.00362 at room temperature T = 298   K . The RMSA fitting of the experimental S(k) is shown in the plot with a continuous black and blue line in Figure 3. The results for the constant parameters, in this case, were A = −5.69819788, B = 3.492354362, C = 0.369312106, F = −0.3689106, η = 0.127399712 , κ = 4.351245361 , γ   = 169.8507697 , and s = 0.30515 . A numerical analysis similar to Figure 1 and Figure 2 yields the predicted self-diffusion and viscosity plotted in Figure 4.
On the other hand, the highest concentrated case (dashed line, red color line in Figure 3) with ϕ = 0.00774 has, accordingly, values of   D / D 0 = D / D s D s / D 0 = 0.053156 and a viscosity of η / η s o l = 18.812284. Yet, the experimental studies of Mériguet et al. [4] allowed us to follow-up on the increasing colloid concentration effect on the rheology of the maghemite nanoparticles   γ F e 2 O 3 dispersed in an aqueous citrate electrolyte at a concentration of 0.03 M. The physical parameters of the ferrofluid are the increasing ϕ = 0.097, 0.158, and 0.203; the charge per particle 80 e , 65 e , 68 e   e is the electronic charge. The water dielectric constant ϵ = 78.3 and the particle diameter d = 134 , 126 , 120 . The counterion charge is 1 e . The temperature T = 298   K . Adapted with permission from Ref. [4]. Copyright 2022 Elsevier Science & Technology journals. The theoretical results constitute Table 1, and they include the standard error.
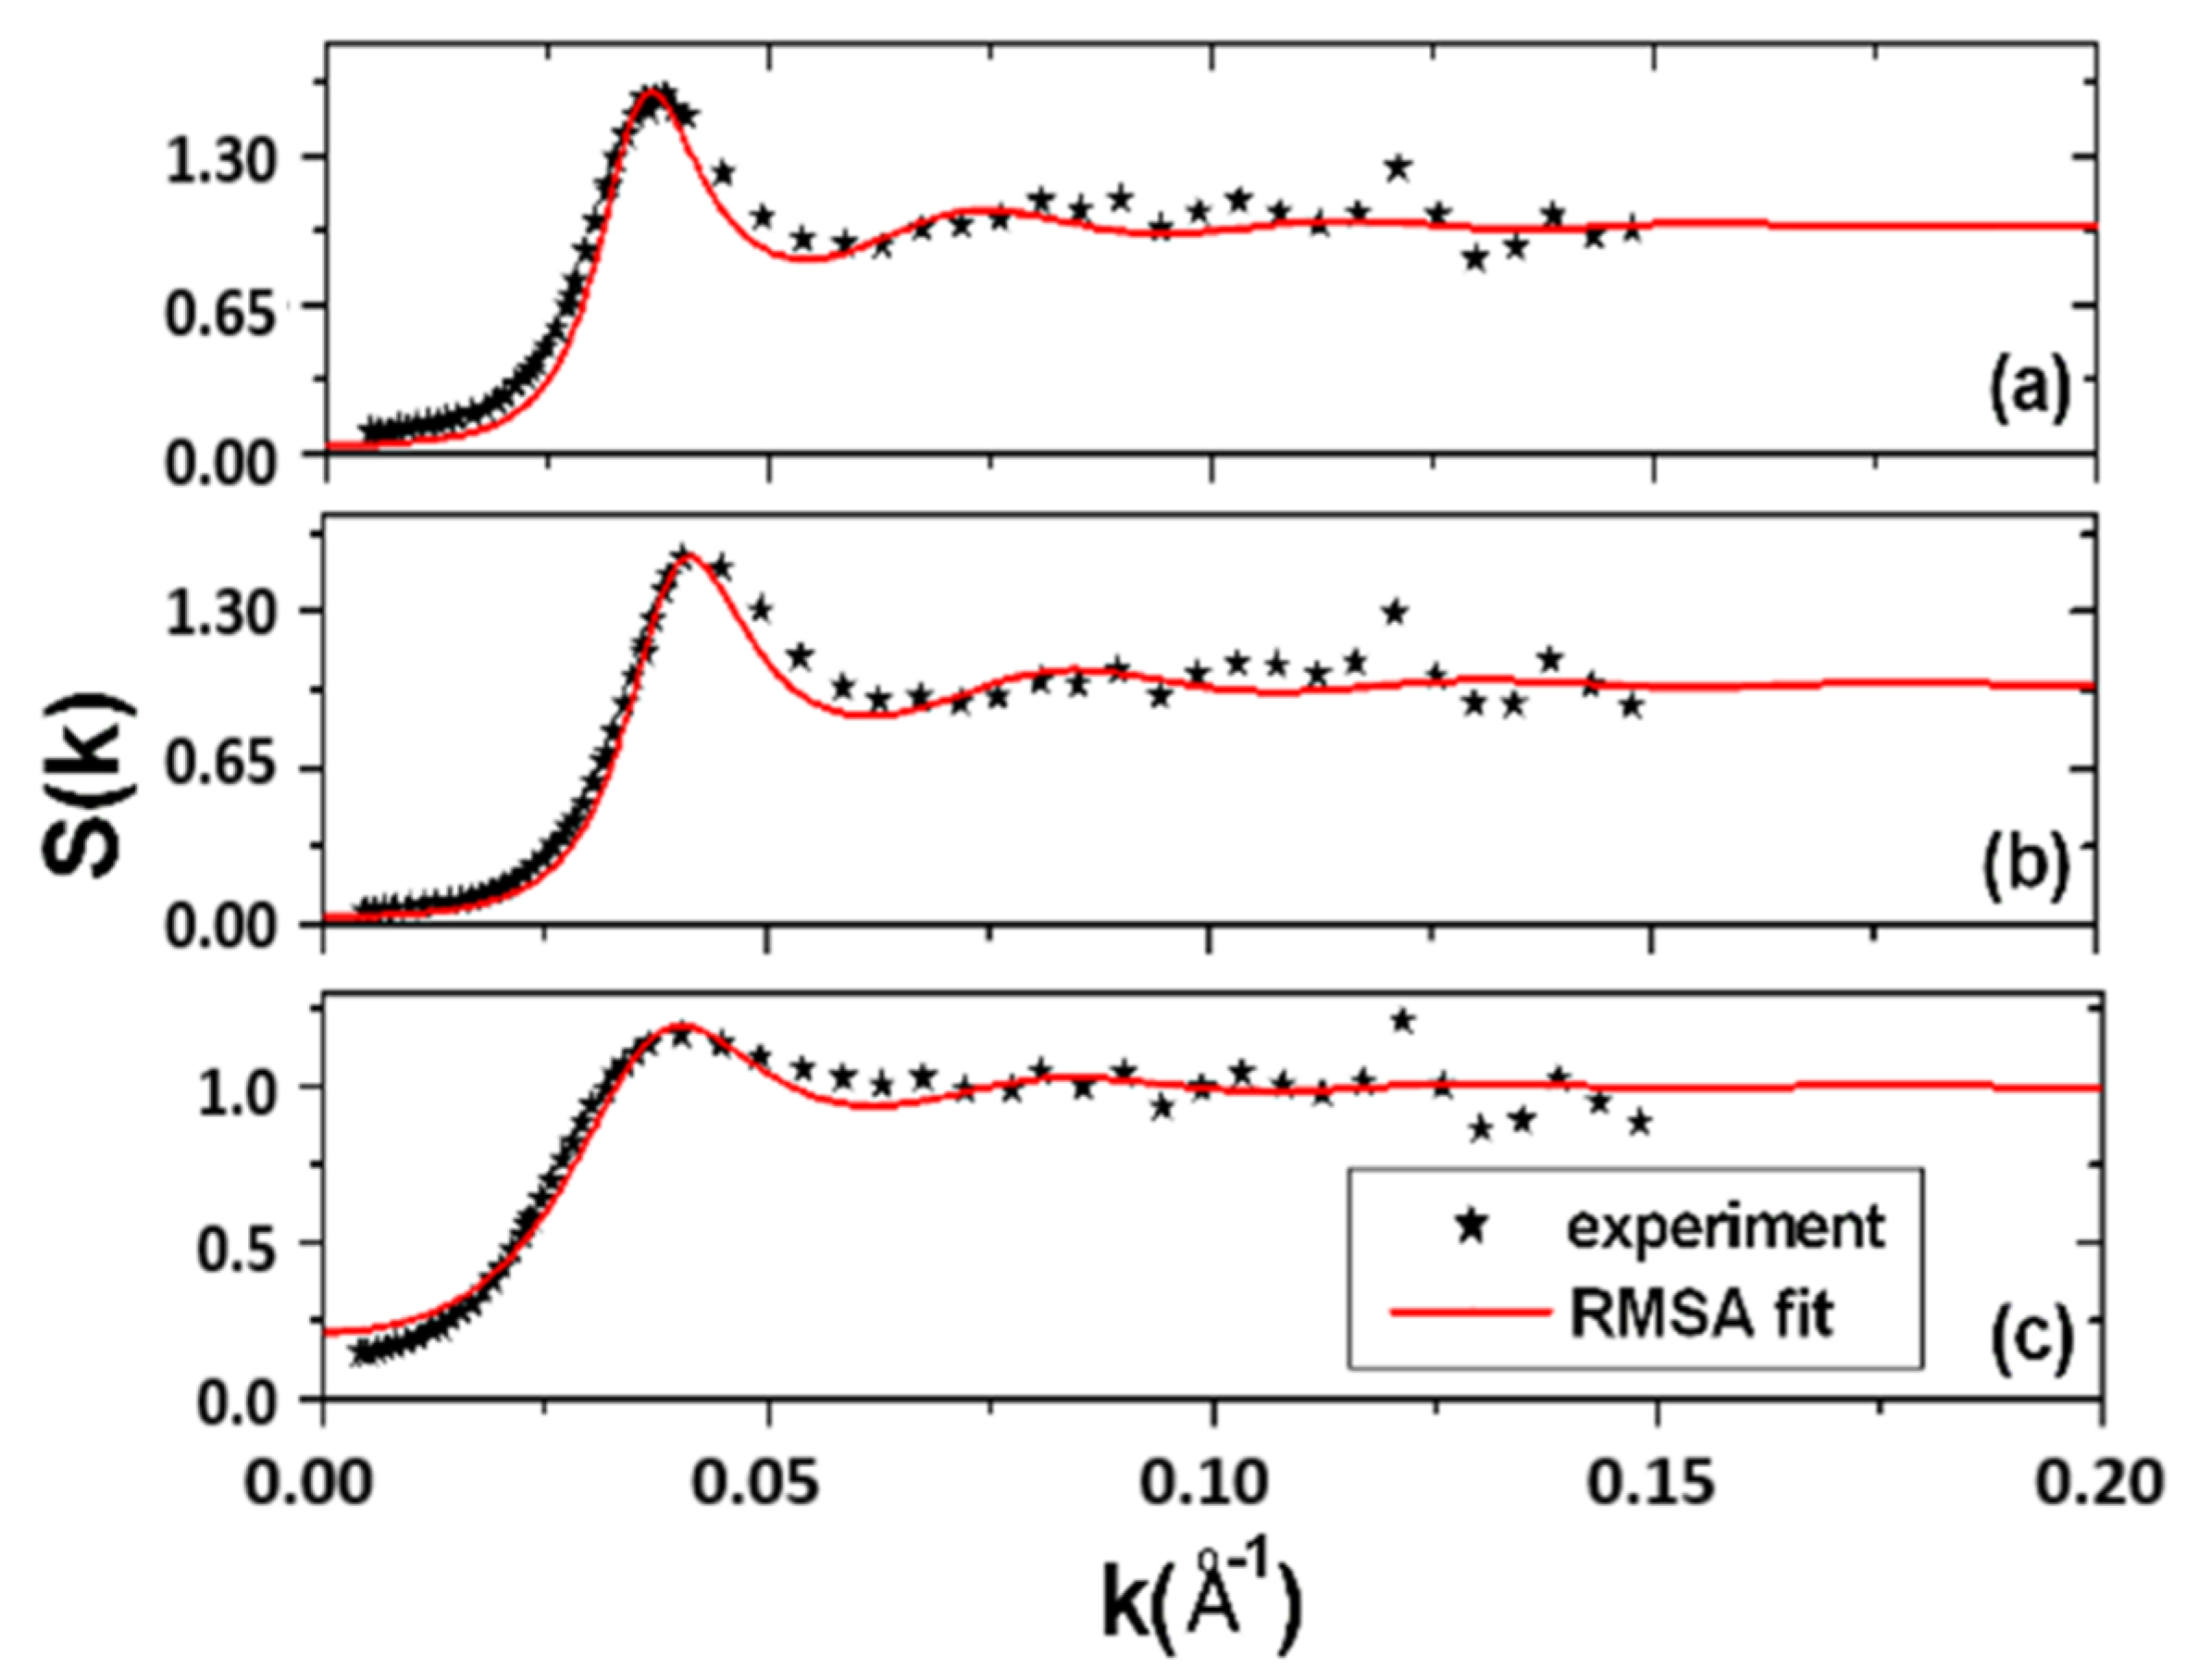
Figure 5 shows the RMSA fit of the structure factors to the measured ones.
Figure 6 yields the microstructure for another set of experiments (see Ref. [2]) that we used.
The physical parameters of the ferrofluid are, for the increasing ϕ = 0.109, 07, and 0.219: charge per particle of 40 e , 40 e , 30 e ; water dielectric constant ϵ = 78.3 ; particle diameter d = 124 , 134 , 120 ; and counterion concentration of (0.03M, 0.003M, 0.003M), respectively. The counterion charge is 1 e . The temperature T = 298   K . Adapted with permission from Ref. [2]. Copyright 2022 IOP Publishing, Ltd. The theoretical results constitute Table 2, and they include the standard error.
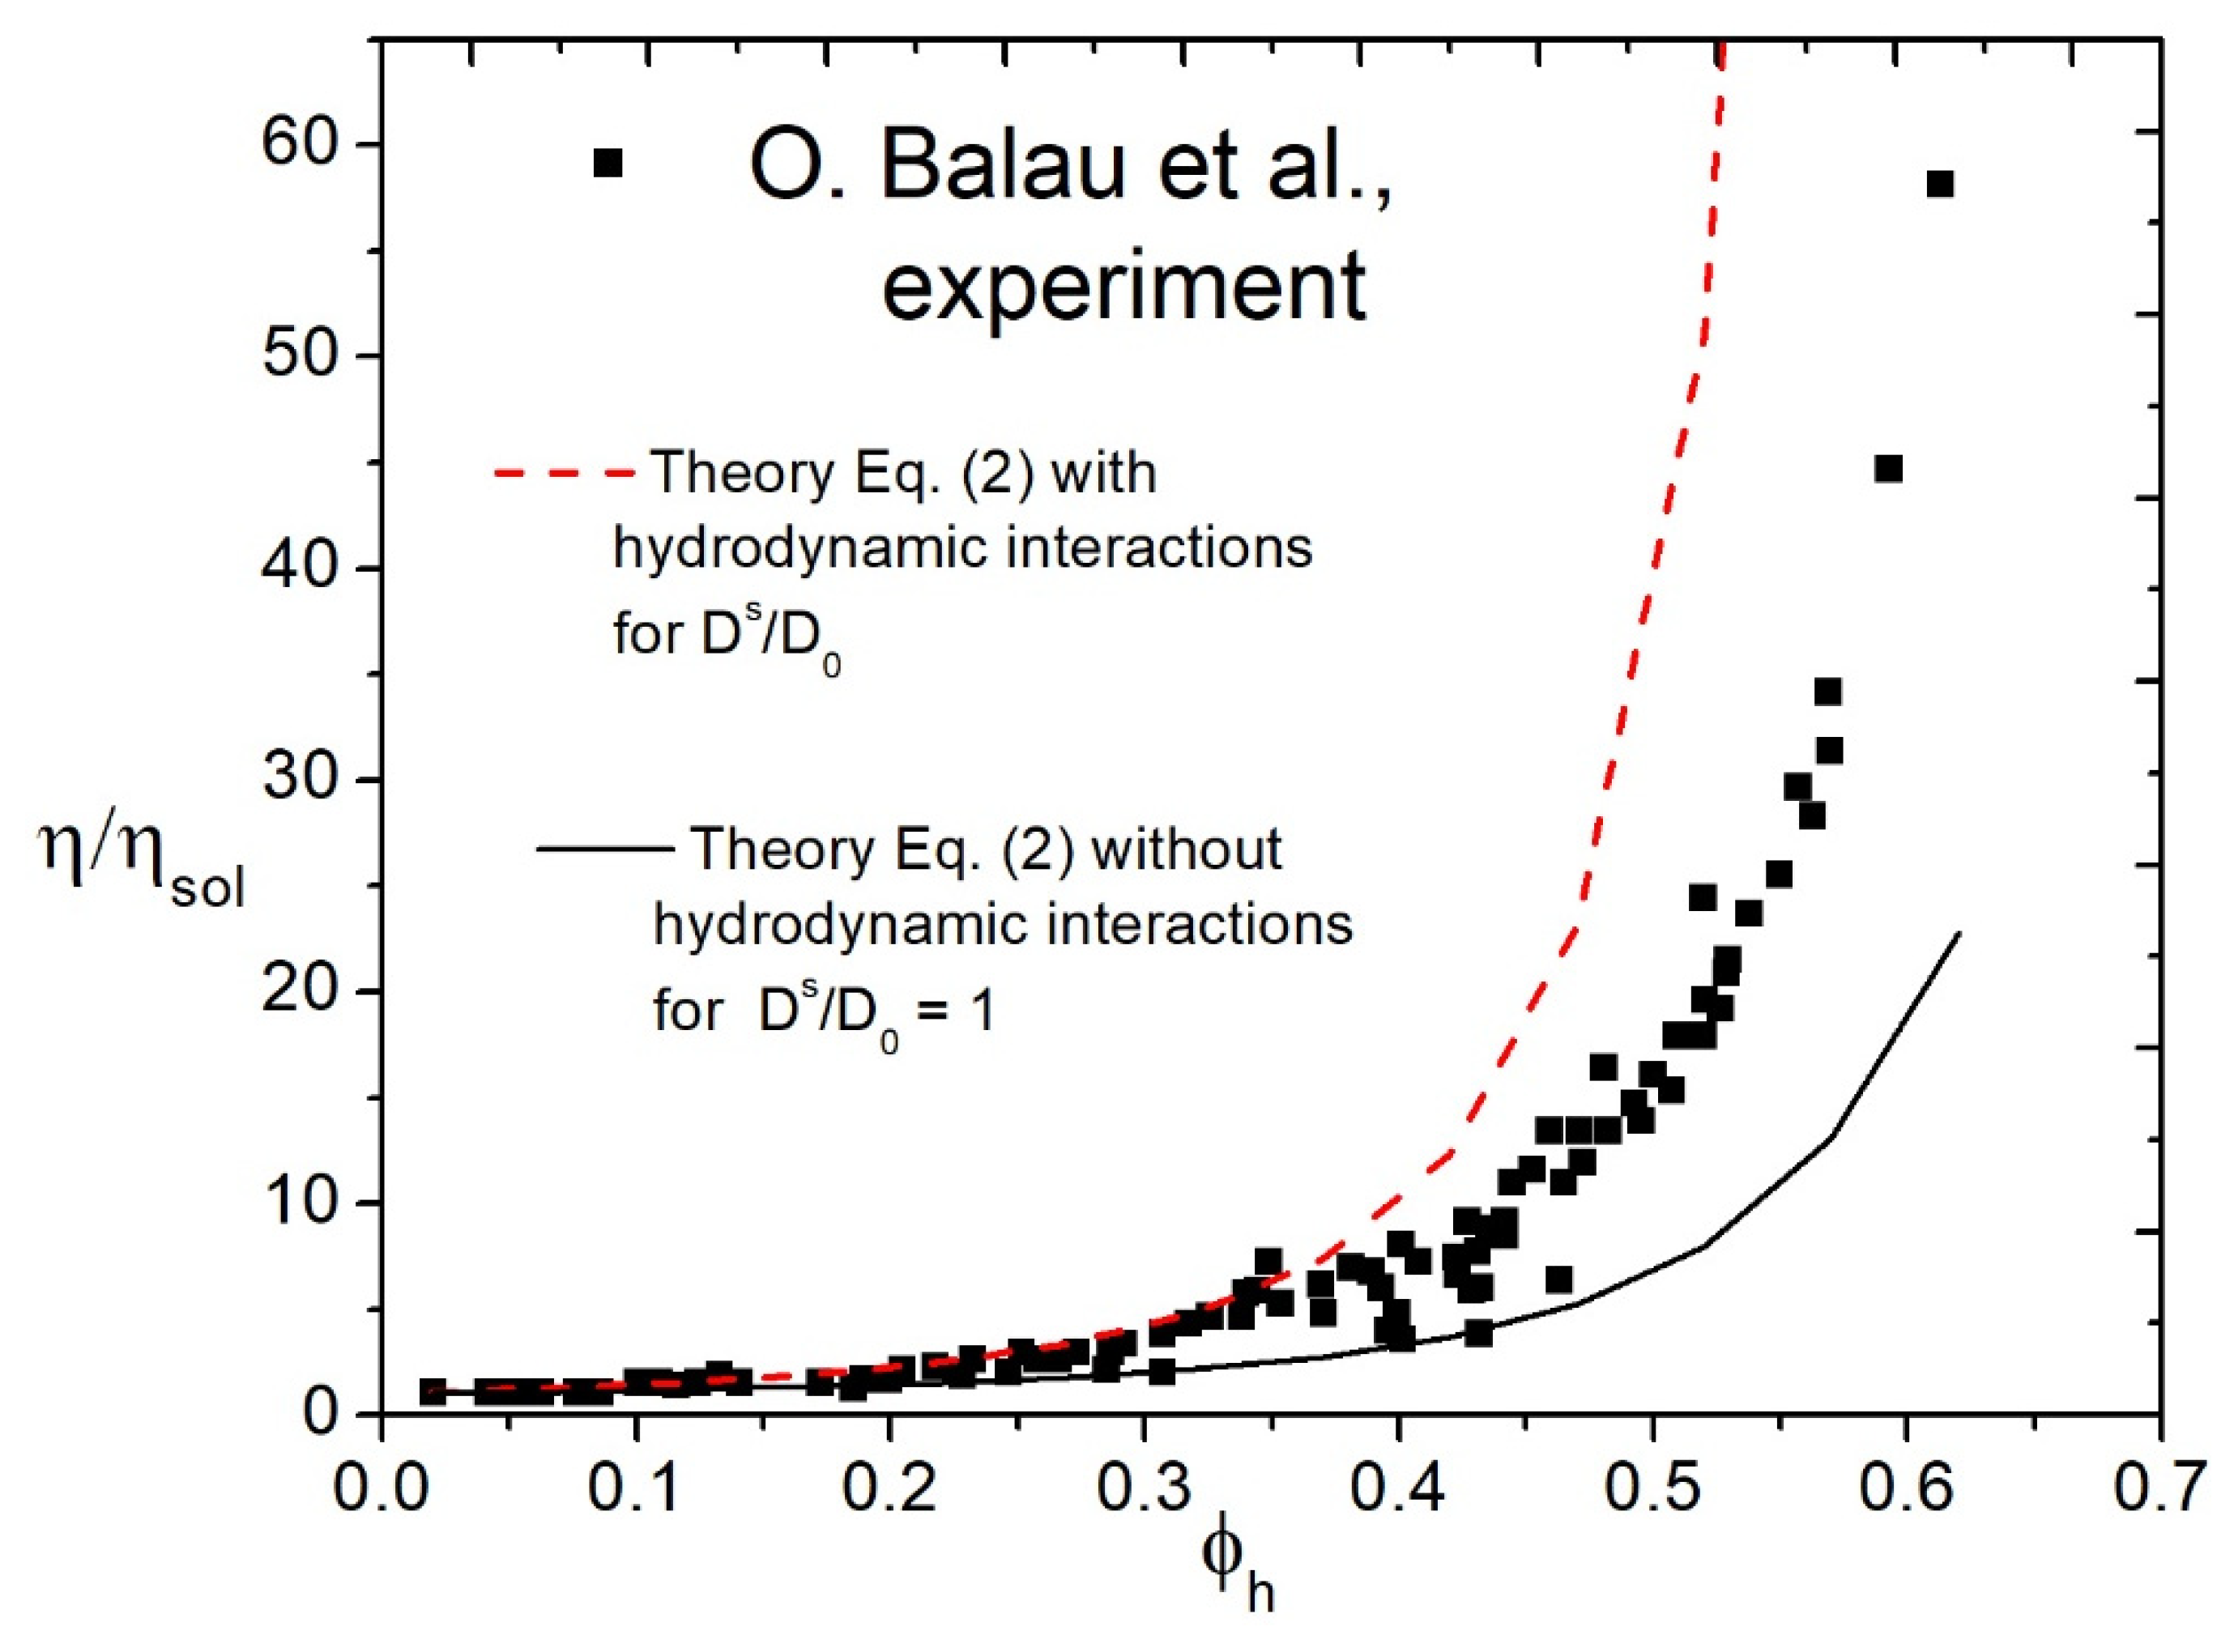
As a final test on the usefulness of the proposed rheology model based on Equations (1) and (2). Figure 7 provides its comparison with the viscosity versus hydrodynamic volume fraction Φ h of the ferrofluid F e 3 O 4 in polymeric solvents of transformer oil, pentanol, heptanol, dioctyl sebacate, and distilled water. The physical parameters of the ferrofluid are: Φ h = 1 + 2 δ / d 3 Φ , polymer double-layer thickness δ = p 1 / 3 1 d / 2 , volume fraction Φ = π ρ d 3 / 6 with particle diameter d = 86 , p 3.4 , and temperatures in the range from 263 K to 343 K. Experimental data reproduced from Balau O. et al. [5].
The viscosity prediction in Figure 7 comes from Equation (2). The numerical calculation uses a model of soft spherical particles with a repulsive interaction at short distances of separation of the Weeks–Chandler–Andersen type U(r) − U(r = σ 1 / 6 ), where U(r) = 4ϵ[ ( σ / r ) 12 ( σ / r ) 6 ] is the Lennard-Jones potential. Further use of the analytical mean spherical approximation of Ref. [10] allows for obtaining the direct correlation function c k as a function of Φ h and the structure factor S k = 1 / 1 24 Φ h c k , which substituted in Equation (2) yields η / η s o l for every Φ h without any adjustable parameter. We observe good agreement between the predicted viscosity from the model of Equation (2) with the experiments of Balau et al. [5] for low volume fractions in the range of 0 . Φ h 0.3 ; however, the theory of Equation (2) deteriorates for a larger Φ h . Reference Balau et al. [5]. Adapted with permission from Ref. [5]. Copyright 2022 World Scientific Publishing Co.

3. Results and Discussion

Figure 1a Figure 2, Figure 3, Figure 4, Figure 5 and Figure 6 illustrate the predictions of the proposed stochastic rheology model using Equations (1) and (2) for the diffusion and viscosity of ferrofluids, and are free of arbitrary adjustable parameters. However, there is a gap in the comprehensive studies on the clearly characterized experimental models of ferrofluids. As seen in Section 2, the experimental static structure factors in the literature [2,3,4,12] show insufficient access to maximum wave numbers, pointing to an exciting topic of empirical characterization research. These may include accurate structure factor determination and their rheological properties under controlled thermodynamic conditions. Partially, these errors on S(k), which translate into the resolution of the possible magnitude of the viscosity, are corrected by the best fit with the RMSA theory of the empirical S k . As shown above, from low to moderate concentrations of colloids, RMSA is sufficient to predict D / D 0 = D / D s D s / D 0 , and η / η s o l . However, it fails for higher concentrations. It is evident in Figure 7, where assuming a soft sphere repulsion between particles, the simple MSA leads to a predicted η / η s o l that agrees roughly with the experimental data of Balau et al. [5], but only for hydrodynamic volume fractions Φ h ~ 30 % as it fails for the larger Φ h . One reason might be a substantial contribution to the viscosity due to the underlying polymer network formed in the solvent and not captured by the MSA. Figure 1a, Figure 3, Figure 5, and Figure 6 show that the interactions between particles in the ferrofluids are of a strong, long-range repulsion of the type in Equation (4). Indeed, this manuscript’s fit of S(k) (see Figure 3) coincides quantitatively with the one obtained by Wagner et al. [3]. It is an open research question to consider ferrofluids where the particle magnetic dipole is strong enough that its effect on the self-diffusion and viscosity is not negligible. In such a situation, the dipolar interaction is long range and may compete with the electrostatic repulsion in Equation (4). As a result, aggregates appear (chains and clusters of particles) that modify the viscosity. Summarizing the results, Equations (1) and (2) provide a new method to study the viscosity in ferrofluids through the use of the structure factor of the colloid. For the viscosity, its practical measure may use the dissipative modulus of the colloid at longtime (equivalent short frequencies) [6]:
G ω η s o l t B D 0 D ω *
where the frequency ω * : = ω t B ω is roughly the inverse of the diffusive relaxation time t B = d 2 / D 0 of the particles. We point out that Equation (5) yields a way to know such a transport property, namely, D / D 0 or η / η s o l .

4. Conclusions

The results depicted in Figure 1a, Figure 2, and Figure 4 present a new method to study the tracer particle self-diffusion D / D 0 and viscosity η / η s o l in thermally equilibrated ferrofluids without external magnetic fields. These transport properties depend critically on the accurate determination of the fluid’s structure factor S(k). For known maghemite ferrofluids in aqueous citrate electrolytes, Figure 1a shows its fitting with the help of the RMSA liquid theory and provides its whole wave-vector resolution. The RMSA performance is better for low volume fractions, ϕ = 0.07, of particles and deteriorates for higher concentrations. Using the best-fitted (k) at ϕ = 0.07 allows for the underlying potential between particles given by Equation (4). Therefore, Equations (1) and (2), which are expressed in terms of (k), and consequently, the potential, render a first-principle link with the microscopic origin of the particle diffusion and viscosity of the ferrofluid. This approach yields a new method for studying viscosity in ferrofluids. For the colloid at the concentration ϕ = 0.07, Equations (1) and (2) demonstrated in Figure 2 the practical application to predict the rheology of this system. Figure 3 and Figure 4 for cobalt ferrite nanoparticles illustrate a second realization of the proposed stochastic methods of Equations (1) and (2), describing the rheology of another interesting aqueous magnetic fluid. Yet, the self-diffusion and viscosity predictions in Table 1 and Table 2 of a maghemite ferrofluid in a citrate aqueous electrolyte may motivate its experimental confirmation in the future. This conclusion resides in Figure 7, which demonstrates that the viscosity model can successfully explain experimental data for a low hydrodynamic volume fraction Φ h ~ 30 % of complex ferrofluids with polymer solvents with minimum structural information. A possible extension of this approach includes polydisperse ferrofluid effects and the presence of external electric and magnetic fields.

Author Contributions

Conceptualization, M.H.-C.; methodology, L.D.Á.G. and K.M.M.; validation, M.H.-C., L.D.Á.G. and K.M.M.; formal analysis, M.H.-C., L.D.Á.G. and K.M.M.; investigation, M.H.-C., L.D.Á.G. and K.M.M.; data curation, M.H.-C., L.D.Á.G. and K.M.M.; writing—original draft preparation, M.H.-C. and L.D.Á.G.; writing—review and editing, M.H.-C. All authors have read and agreed to the published version of the manuscript.

Funding

This research received no external funding.

Data Availability Statement

Not applicable.

Conflicts of Interest

The authors declare no conflict of interest.

Appendix A

Here, the longtime diffusion coefficient, Equation (1), is derived. The total forces that impart Brownian motion on the spherical tracer particle of mass m with velocity v t contain several terms. These are the dissipative forces due to the solvent friction ζ s ,   the force f s t due to impacts of solvent molecules on the tracer surface, and the direct interaction forces arising from the potential U r , Equation (4), created by all other particles around the tracer:
  m d v t d t = ζ s v t + f s t + d r U r n r ; t
where = x , x , x is the translational gradient operator. The instantaneous local concentration of the cloud of particles around the tracer is n r ; t = i = 1 N δ r t r i . Thermal fluctuations produce deviations of the concentration δ n r ; t = n r ; t n e q r from its static value n e q r =   n r ; t , which is the thermal equilibrium average. δ n r ; t   satisfies the equation of conservation of the number of particles ∂ δ n r ; t / t = J . The current of particles is J = V   n r ; t , and V is the average velocity of any of the particles. At fluctuation onset, the average friction force on the particle arises from the gradient of the colloid electrochemical potential μ , that is to say, ζ s V = μ . Thus, the current is J = −n(r;t) k B T ζ s 1 β μ r ; n r ; t . Linearization of the current up to the first order in δ n r ; t leads to δ n r ; t / t = n e q r D s δ β μ r ; n t + g t , with D s = k B T ζ s 1 , and Gaussian noise g t was added to represent the random diffusive fluxes. Statistical mechanics of liquids yield the derivative δ β μ r ; n t ] = d r σ 1 r , r   δ n r ; t . σ 1 represents the inverse of the static correlation function of liquid theory σ( r , r )=<δn( r , 0) δn( r , 0)>. Solving the above diffusion equation and substitution in the linearized version of Equation (A1) up to the first order in δ n r ; t yields the result:
m d v t d t = ζ s v t + f s t 0 t d t   Δ ζ t t Δ v t + F t .
The additional force satisfies the fluctuation–dissipation relationship F t F t = k B T Δ ζ t t . The time-dependent friction on the tracer due to direct interaction with the others surrounding it is the third-order diagonal matrix:
Δ ζ t = k B T d r d r d r n e q r σ 1 r , r χ r , r ; t n e q r  
χ r , r ; t gives the temporal relaxation of the cloud of particles around the tracer. It is related to the so-called intermediate scattering function (expressed in reciprocal space f( k ) = d r   Exp i k Δ r f r ), which for homogeneous isotropic fluids without an external magnetic field is:
F k ; t = 1 N δ n k ; t δ n k ; 0 = 1 ρ χ k ; t σ k .
Its initial value F k ; t = 0 = S k is the structure factor of the magnetic colloid. In Ref. [6], its explicit form appears as:
χ   k ; t = S k   E x p k 2       D s   t     1   /   S k   +   μ T   .
Its further substitution in Equation (A3) takes the longtime limit ( t ) of the friction contribution Δ ζ t   due to particle interactions, yielding the static scalar Δ ζ as one-third of the trace of Equation (A3) integrated over time. That is to say, Δ ζ = Tr 0 d t Δ ζ t / 3 , which is the second term in the square bracket on the right-hand side of Equation (1).

Appendix B

The scheme to numerically determine the structure factor S k in the rescaled mean spherical approximation that fits the experimental one is as follows:
First, determine the contact value of the pair correlation function g r using the physical material parameters of the colloid; volume fraction η and ionic strength κ, at an increased diameter of the particle d such that g r = d = p 1 + p 2   C + p 3   F yields a non-negative value. For this purpose, solve the quartic equation, ω 4   F 4 +   ω 3   F 3 +   ω 2   F 2 + ω 1   F + ω 0   = 0 , for instance, with commercial software. Pick the most prominent positive real solution for F. Such a value of F fixes the magnitudes of p1, p2, and p3 and the factors A, B, and C, that appear in Equation (3). The explicit form of all those constants are in Ref. [10]. Then, select a rescaled diameter d = d and increase its value further by updating s = d / d .   With   this   value   of   s ,   set   k   = k / s , γ / s = γ , κ / s = κ , and ϕ / s 3 = η ,   and   use   them   in   S k = 1 / 1 24 η   c k , together with Equation (3), until the rescaled pair correlation function at r = d satisfies the boundary condition to be zero, that is to say:
      g x = r / d = 1 = 1 + 1 12   π   η   x 0 d Q   S Q 1   Q   s i n Q   x = 0 ,   with   Q : = k d .
To numerically evaluate the above integral in Equation (A6), replace it with a discrete sum as exemplified in the algorithm of Appendix C, with a maximum value of Q : = k d = 20 .

Appendix C

The numerical solution scheme to integrate Equation (1) is:
  • Determine numerical values of parameters s , k , η’, κ’ d ,   A ,   B ,   C ,   a n d   F from the fit of S k = 1 / 1 24   η   c k with Equation (3) for the experimental structure factor, using the maximum dimensionless wave number kmax: k * = k d = 40 for all cases of Figure 1, Figure 2, Figure 3, Figure 4, Figure 5 and Figure 6. Use N = 1000 values of k   i * ,   i = 1 , ,   N ,   d k = : k   i = 4 * k   i = 3 *   and   ϕ : = η s 3 .
  • Set variable; iteration = 10.
    Evaluate the integral of Equation (1) starting from the initial condition μ T : = D / D s = 1.
    For 1 to iteration:
                           Δ ζ = 0
              For i = 1 to N:
                                            K 2 = ( k   i * ) 2
                          Evaluate S k   i * = 1 / 1 24   η   c k   i *
                           Δ ζ = Δ ζ + dk K2   S k   i * 1 2 / μ T   S k   i * + 1
              End For
    Δ ζ := Δ ζ / 36   π   ϕ
    μ T : = 1 / 1 + Δ ζ
    End For
  • Output D / D 0 = μ T . Correct with hydrodynamic interactions using interpolated D s / D 0 : = D s _ D 0 ϕ = A 1 + B 1 * ϕ + B 2 * ϕ   , A1 = 0.99762, B1 = −1.87828, and B2 = 0.50146. For every ϕ , the longtime self-diffusion is D / D 0 = μ T   ( D s / D 0 ). The viscosity is:
    η = η s o l μ T D s D 0

References

  1. Odenbach, S. Ferrofluids: Magnetically Controllable Fluids and Their Applications, 2nd ed.; Springer: Berlin/Heidelberg, Germany, 2002; pp. 1–253. [Google Scholar]
  2. Meriguet, G.; Dubois, E.; Dupuis, V.; Perzynski, R. Rotational arrest in a repulsive colloidal glass. J. Phys. Condens. Matter 2006, 18, 10119–10132. [Google Scholar] [CrossRef]
  3. Wagner, J.; Fischer, B.; Autenrieth, T.; Hempelmann, R. Structure and dynamics of charged magnetic colloids. J. Phys. Condens. Matter 2006, 18, S2697–S2711. [Google Scholar] [CrossRef] [Green Version]
  4. Meriguet, G.; Dubois, E.; Bourdon, A.; Demouchy, G.; Perzynski, R. Forced Rayleigh scattering experiments in concentrated magnetic fluids: Effect of interparticle interactions on the diffusion coefficient. J. Magn. Magn. Mater. 2005, 289, 39–42. [Google Scholar] [CrossRef]
  5. Balau, O.; Bica, D.; Koneracka, M.; Kopcansky, P.; Susan-Resiga, D.; Vekas, L. Rheological and magnetorheological behaviour of some magnetic fluids on polar and nonpolar carrier liquids. Int. J. Mod. Phys. B 2002, 16, 2765–2771. [Google Scholar] [CrossRef]
  6. Peredo-Ortíz, R.; Hernández-Contreras, M.; Hernández-Gómez, R. Magnetic viscoelastic behavior in a colloidal ferrofluid. J. Chem. Phys. 2020, 153, 184903. [Google Scholar] [CrossRef] [PubMed]
  7. Peredo-Ortíz, R.; Meza Martínez, K.; Hernández-Contreras, M. Viscoelastic moduli of homogeneous ferrofluids. Rom. J. Phys. 2021, 66, 610. [Google Scholar]
  8. Van Megen, W.; Underwood, S.M.; Ottewil, R.M.; Williams, N.S.J.; Pusey, P.N. Particle diffusion in concentrated dispersions. Faraday Discuss. Chem. Soc. 1987, 83, 47–57. [Google Scholar] [CrossRef]
  9. Mazur, P.; Geigenmuller, U. A simple formula for the short-time self-diffusion coefficient in concentrated suspensions. Physica A 1987, 146, 657–661. [Google Scholar] [CrossRef]
  10. Hayter, J.B.; Penfold, J. An analytic structure factor for macroion solutions. Mol. Phys. 1981, 42, 109–118. [Google Scholar] [CrossRef]
  11. Hansen, J.P.; Hayter, J.B. A rescaled MSA structure factor for dilute charged colloidal dispersions. Mol. Phys. 1982, 46, 651–656. [Google Scholar] [CrossRef]
  12. Cousin, F.; Dubois, E.; Cabuil, V. Tuning the interactions of a magnetic colloidal suspension. Phys. Rev. E 2003, 68, 021405. [Google Scholar] [CrossRef] [PubMed]
Figure 1. Structure factor, self-diffusion, and viscosity of ferrofluid. (a) Depicts the comparison between experimental structure factor S k from Cousin, F. et al. [12] and rescaled mean spherical approximation liquid theory as a function of wave number k . (b) The theoretical fit of S k was used to determine the self-diffusion coefficient D / D 0 (black square) of Equation (1), and viscosity η / η s o l (star symbol) of Equation (2), including experimental hydrodynamic interactions among particles of hard polystyrene spheres from Van Megen, W. et al. [8]. Ref. [12] adapted with permission. Copyright 2022 by the American Physical Society. Ref. [8] adapted with permission. Copyright 2022 by Royal Society of Chemistry. In Figure 1b, error bars are less than the symbol sizes.
Colloids 06 00062 g001
Figure 2. Predicted self-diffusion coefficient D / D 0 (black square) of Equation (1), and viscosity η / η s o l (star symbol) of Equation (2) for the structure factor fit with RMSA given by the dash (red color online) in Figure 1a with ϕ = 0.155. The corresponding potential of Equation (4) has an amplitude γ = 13607.7841 and screening factor κ = 10.24267 . Using the potential of Equation (4), seven additional ϕ values lead to a new predicted S k . Consequently, it was necessary to interpolate seven D s / D 0 as a function of ϕ to determine D / D 0 . The error bars are less than the symbol sizes.
Colloids 06 00062 g002
Figure 3. Experimental data of S k given by star and dot symbols was taken from Wagner, J. et al. [3]. Adapted with permission from Ref. [3]. Copyright 2022 IOP Publishing, Ltd. Present manuscript’s fits of S k with the RMSA theory (continuous black and blue lines) shows perfect coincidence with the fits (magenta and red color lines) made by Wagner, J. et. al. [3]. Adapted with permission from Ref. [3]. Copyright 2022 IOP Publishing, Ltd.
Colloids 06 00062 g003
Figure 4. Self-diffusion coefficient (mark ■) and viscosity (spot ★) for system parameters γ = 14.05132 and κ = 0.96709 in potential energy function Equation (4) corresponding to the present manuscript’s fitted RMSA S k for the system with volume fraction ϕ = 0.00362 of Figure 3. From this ferrofluid, seven other different particle concentrations were studied. Error bars are roughly the same size as symbols.
Colloids 06 00062 g004
Figure 5. Theory of RMSA with continuous lines fits the experimental S k at three magnetic colloid volume fractions ϕ; 0.097, (a), 0.158 (b), 0.203 (c). Data with symbols ★ reported by Meriguet, G. et al. [4]. Adapted with permission from Ref. [4]. Copyright 2022 Elsevier Science & Technology journals.
Colloids 06 00062 g005
Figure 6. The liquid theory of RMSA fits the experimental S k taken from Meriguet, G. et al. [2] at three ferrofluid volume fractions ϕ; 0.109 (a), 0.17 (b), 0.219 (c). Calculations of the colloid diffusion constant with Equation (1) and viscosity, Equation (2), are reported in Table 2. Adapted with permission from Ref. [2]. Copyright 2022 IOP Publishing, Ltd.
Colloids 06 00062 g006
Figure 7. Comparison of the relative bulk viscosity as a function of the hydrodynamic concentration of magnetic particles in the fluid against the experimental data (symbol ∎) taken from Balau O. et al. [5]. Calculations of the colloid viscosity use Equation (2) with the structure factor given by the analytical mean spherical approximation and soft repulsion of the Weeks–Chandler–Andersen potential, as explained in the text.
Colloids 06 00062 g007
Table 1. Maghemite ferrofluid at T = 298 K , using experimental data from Meriguet, G. et al. [4] for S k and its fit with RMSA given in Figure 5. From the low to high Φ, the parameters in potential Equation (4) are ( γ , κ ) = 9.9307 ,   42060.621 , 9.1645 ,   27454.6523 ,   and   9.0739 , 33659.3519 .
Φ D / D 0   =   D / D s D s / D 0
with Experimental HI
for D s / D 0
η / η s o l   =   D 0 / D
with Experimental HI
η / η s o l   =   1 / g Φ
0.0970.473378 ± 4.27 × 10−52.112476 ± 0.000192.238865
0.1580.355309 ± 1.146 × 10−52.814451 ± 9.079 × 10−53.097647
0.2030.260957 ± 2.595 × 10−53.832048 ± 0.000384.332215
Table 2. Maghemite ferrofluid at T = 298   K , using experimental data from Meriguet, G. et al. [2] for S k and its fit with RMSA given in Figure 6. From low to high, Φ parameters in potential Equation (4) are ( γ , κ ) = 8.1843 ,   6838.3094 , 4.3263 ,   405.06416 ,   and   3.8567 , 252.8522 .
Φ D / D 0   =   D / D s D s / D 0
with Experimental HI
for D s / D 0
η / η s o l   =   D 0 / D
with Experimental HI
η / η s o l   =   1 / g Φ
0.1090.602362 ± 4.926 × 10−51.660131 ± 1.357 × 10−51.773798
0.170.306733 ± 3.702 × 10−53.260164 ± 0.000393.614409
0.2190.335417 ± 1.8402.981363 ± 0.000163.403315
Publisher’s Note: MDPI stays neutral with regard to jurisdictional claims in published maps and institutional affiliations.

