Article

Deposition of Colloidal Magnetite on Stainless Steel in Simulated Steam Generator Conditions—Experiments and Modeling

1
Institute of Electrochemistry and Energy Systems, Bulgarian Academy of Sciences, 1113 Sofia, Bulgaria
2
Department of Physical Chemistry, University of Chemical Technology and Metallurgy, 1756 Sofia, Bulgaria
*
Author to whom correspondence should be addressed.
Colloids Interfaces 2022, 6(4), 59; https://doi.org/10.3390/colloids6040059
Submission received: 19 September 2022 / Revised: 17 October 2022 / Accepted: 19 October 2022 / Published: 21 October 2022

Abstract

:
Sludge formation via colloidal magnetite deposition in steam generators is an important phenomenon that significantly influences the thermohydraulic properties and corrosion of structural materials. This paper aims to verify a model of sludge deposition and consolidation with emphasis on its most significant parameters and their experimental estimation. In-situ electrochemical impedance spectroscopic (EIS) measurements are employed for quantitative evaluation of magnetite deposition kinetics on stainless steel in ammonia-ethanolamine (AMETA) secondary coolant at different temperatures. Parameterization of the model by quantitative comparison of the mixed-conduction model (MCM) with experimental data is discussed. Model predictions are compared with literature data from laboratory experiments and plant operation. Conclusions are drawn about the applicability of the model for quantitative assessment of sludge deposition and consolidation rates.

1. Introduction

The functions of the steam generator (SG) in a two-loop nuclear power plant of a pressurized reactor (PWR) type are to produce steam using heat generated by nuclear fission reactions during the reactor operation, and to play a role in the removal of residual heat from the fission products both in normal reactor shutdown and in the case of a compromise of the reactor core. Since the SG is located on the boundary between the nuclear (radioactive system of the primary loop) and conventional (non-radioactive system of the secondary loop) parts of the plant, it has two vital roles for its operation and security:
  • To provide a barrier for separating radioactivity in the primary loop from the secondary loop to prevent leakage;
  • To transfer heat from the primary to the secondary loop and maintain a level of security in normal operations and some post-emergency scenarios.
Therefore, the structural integrity of the SG and its internal components is critical in ensuring the safety and optimal operation of a nuclear power plant [1].
As a result of the corrosion of components made of carbon and/or low-alloy steels in the SG, soluble iron and magnetite (Fe3O4) particles accumulate in the secondary loop coolant. These particles are carried by the stream and deposited on the supports of the tube bundles or the pre-heater cartridges, creating problems associated with flow continuity, thermohydraulic properties and corrosion. Recent accidents of pipe bundles in PWR plants are described as the result of high-frequency fatigue associated with flow redistribution and the clogging of pipes due to a violation of the structure of the supports of the SG tube bundles [2,3,4]. Modern corrosion problems include intercrystallite corrosion and stress corrosion cracking at the low levels of the steam generator pipes in Canadian Deuterium-Uranium (CANDU) reactors, as well as pitting corrosion in some PWR plants [1,2,3,4].
Despite considerable research efforts on the subject in recent years [5,6,7,8,9,10,11,12], currently, no generally applicable models of sludge deposition and consolidation processes have been proposed. The development of this type of model would include a quantitative assessment of the possibilities of minimizing the formation of magnetite particles and their deposition on the SG surfaces by optimizing the water chemistry and hydrodynamics (assessing the influence of different types of amines, the use of dispersants, etc.). In this regard, the main objective of this study is the development, parameterization, validation and verification of a quantitative model of colloidal magnetite deposition and consolidation on stainless steel SG tube material using dedicated laboratory experiments.

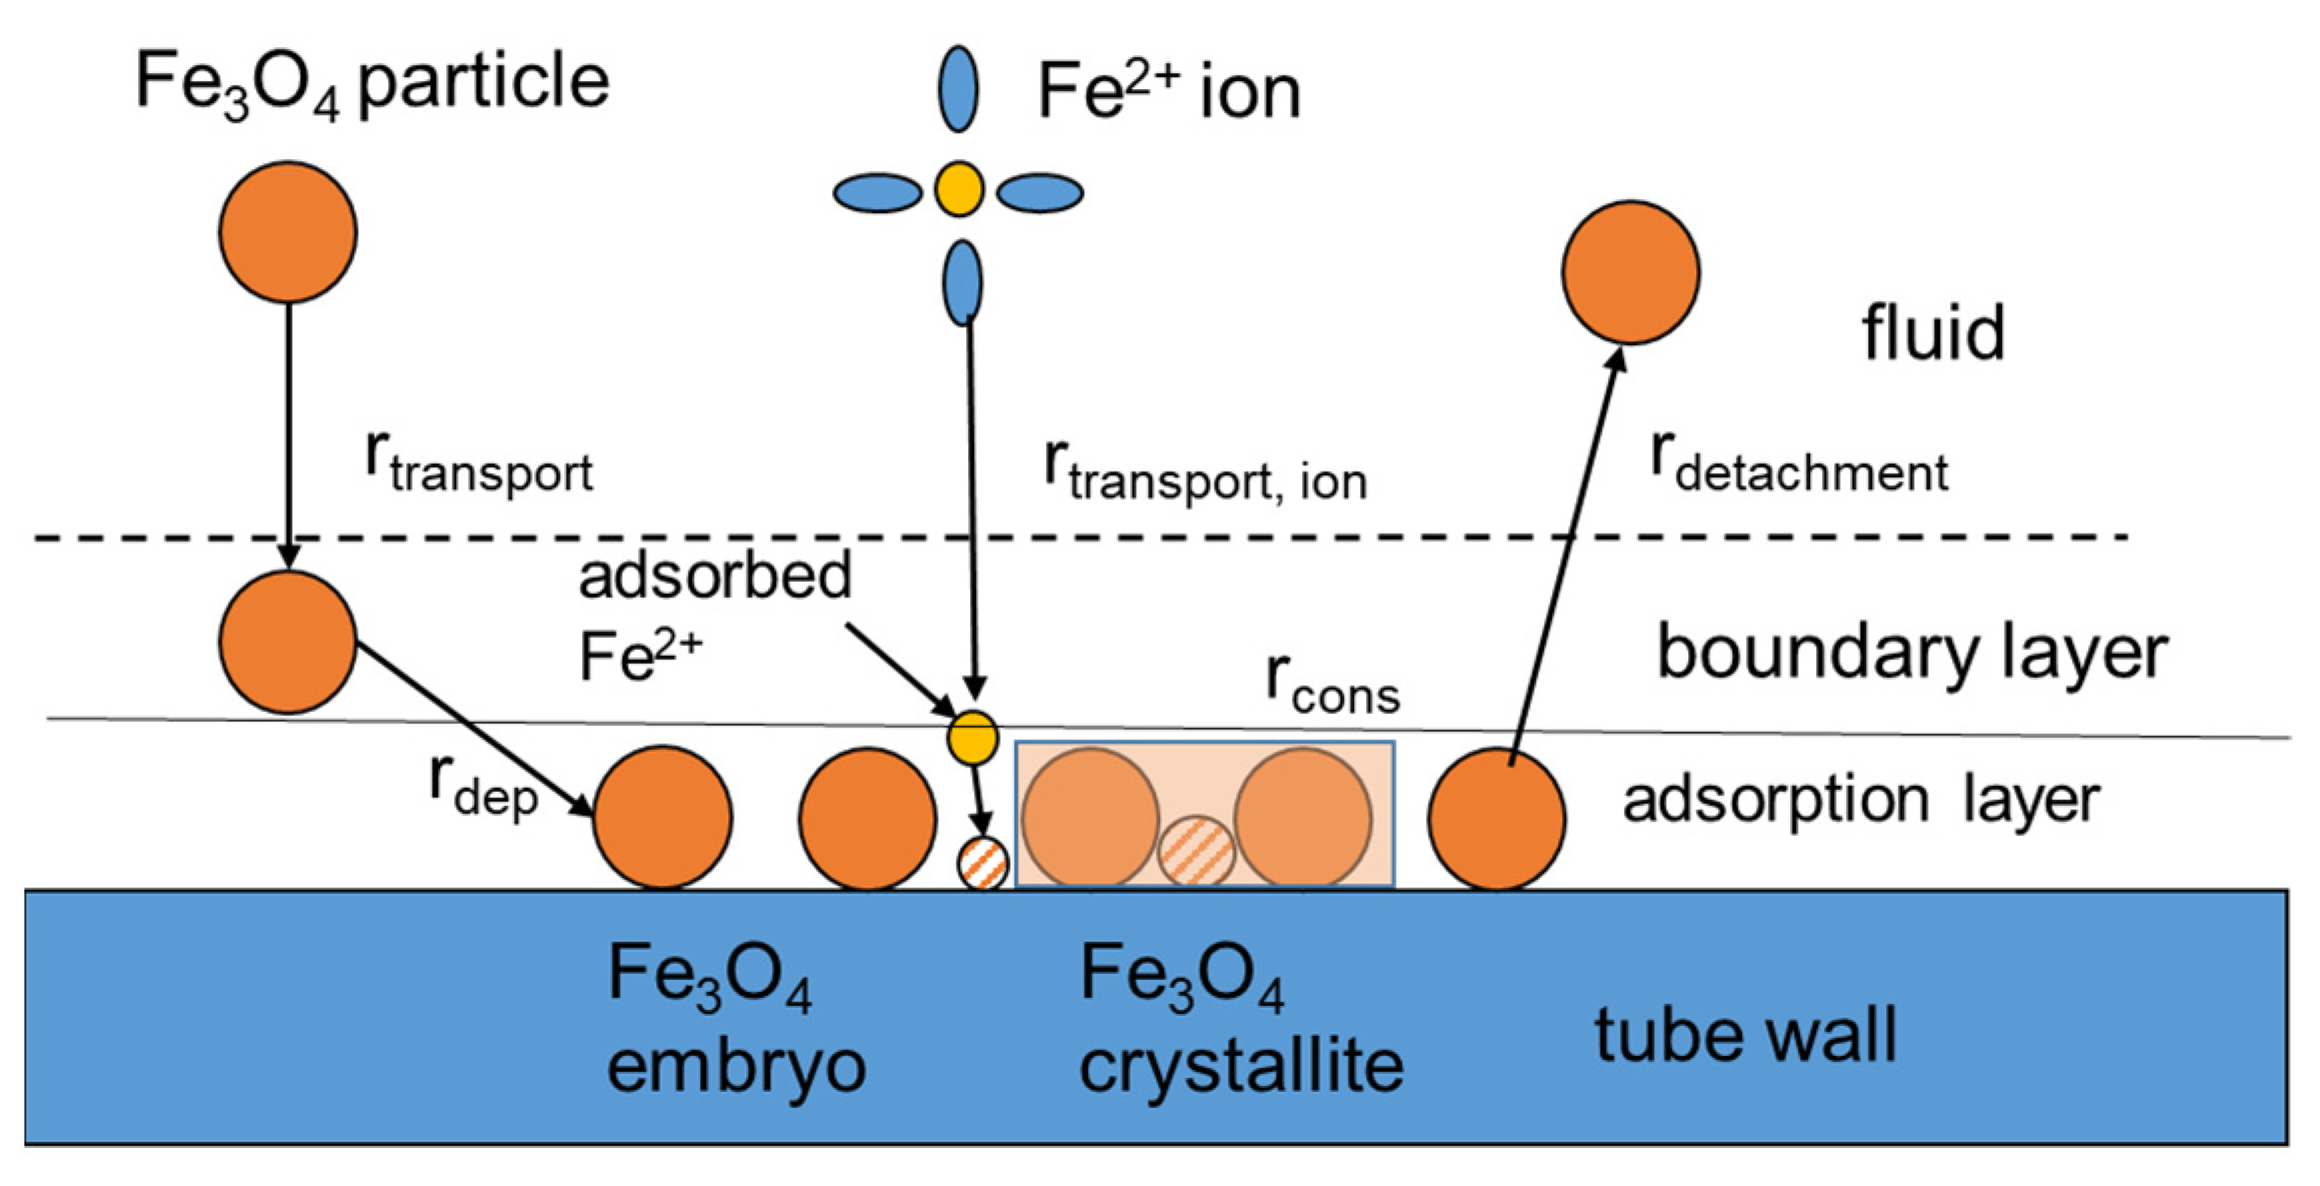
2. Theoretical Background

The kinetic model of deposition and consolidation has been already described in detail in our previous paper [9], therefore, only a short overview is given here. A simplified scheme of the processes considered in the model is presented in Figure 1. The main assumption of the model is that during the initial stage of the process, when the fluid containing colloidal magnetite particles and dissolved iron ions comes into contact with the tube, deposition of sludge particles takes place. On the other hand, secondary crystallization of magnetite due to oversaturation of the boundary layer with soluble iron occurs after a certain induction period, as shown in a number of studies of sludge formation [1,13]. This germ formation and growth process leads to the consolidation of the slurry, with the crystals of Fe(OH)2 and Fe3O4 acting as the binder of individual sludge particles, making it more difficult for them to detach from the surface.
This model deals with the specific case in which an energy barrier occurs due to the presence of electrostatic repulsion between colloidal particles and the surface of the tube material. Since such interactions occur at very small distances compared to the thickness of the diffusion layer, the surface boundary layer approximation (SFBLA) [14] is applied. In turn, consolidation of the particles is assumed to be the result of crystallization of a magnetite-type oxide, which has the ability to bind individual magnetite particles together, preventing their detachment from the surface. Several authors [15,16,17,18] suggest that the crystallization of magnetite is governed by the mechanism of Johnson–Mehl–Kolmogorov–Avrami (JMKA) for simultaneous nucleation and growth [19]. It is assumed that the rate-determining stage of the process is dehydration of Fe(OH)2, which is the main soluble form of Fe in slightly alkaline high-temperature, high-pressure electrolytes, such as the secondary coolant of nuclear plants:
3 Fe ( OH ) 2 , aq Fe 3 O 4 + 2 H + + 2 e - + 2 H 2 O
In addition, the detachment rate of a particle that has undergone consolidation by the JMKA mechanism is considered to be zero. To summarize, the following general equation for the deposition and consolidation process was proposed [9]:
m d ( t ) m p = k a k d 1 α ( t ) 1 e k d 1 α ( t ) t
where md (t) is the deposited mass as a function of time (kg m−2) and mp is the mass concentration of particles in the fluid (kg m−3). The rate constants of deposition (ka) and detachment (kd), as well as the fraction of particles that consolidate (α) are expressed as follows [9]:
k a = 2 k T / 3 π η d p 2 Φ b π k T e Φ b k T
k d = k a h min Φ min π k T e Φ min k T
α ( t ) = 1 exp k c t n
In these equations, dp is the diameter of the depositing particle (a typical value is in the order of 100 nm); η is the dynamic viscosity, Φ b = U max , the value of the repulsion maximum estimated via differentiation of the total interaction energy vs. distance curve; Φ min = U min is the value of the attraction minimum estimated via differentiation of the total interaction energy vs. distance curve; hmin is the location of the minimum on the distance axis; kc is the rate constant of consolidation; and n is the exponential factor. The total interaction energy per unit area between a planar surface and a spherical particle (separated by a distance h) is computed as a sum of the retarded Van der Waals (VdW), Lewis acid–base (AB) and constant potential electrostatic double layer interaction energy (EDL) expressions [9]:
U P S = U V d W + U E D L + U A B
U V d W = A H d p 12 h 1 1 + 14 h / Λ
U E D L = π ε ε 0 d p 2 ζ s u r f + ζ p 2 ln 1 + e κ h + ζ s u r f ζ p 2 ln 1 e κ h
U A B ( h ) = π d p Δ G A B e h 0 h λ
In these equations, AH is the Hamaker constant, Λ is the characteristic wavelength of retardation of VdW forces, ξj (j = s,p) is the zeta-potentials of the surface and the particle, κ is the Debye length, λ is the decay length of acid-base interactions in water, and the Gibbs energy is a function of the polar (donor-acceptor) components of the surface energy of the interacting media. The zeta potentials of the particles were measured in simulated SG conditions in our previous paper [9] and typical values of −0.01…−0.02 V were obtained in ammonia and ethanolamine solutions at 150–200 °C. The zeta potential of stainless steel in similar media was assumed to be equal to the recently reported values for Alloy 690 [20] that are of the same sign and order of magnitude.
This study is devoted to the validation of the proposed model using measurements of the kinetics of initial stages of magnetite deposition on stainless steel in simulated SG conditions by in-situ electrochemical impedance spectroscopic measurements.

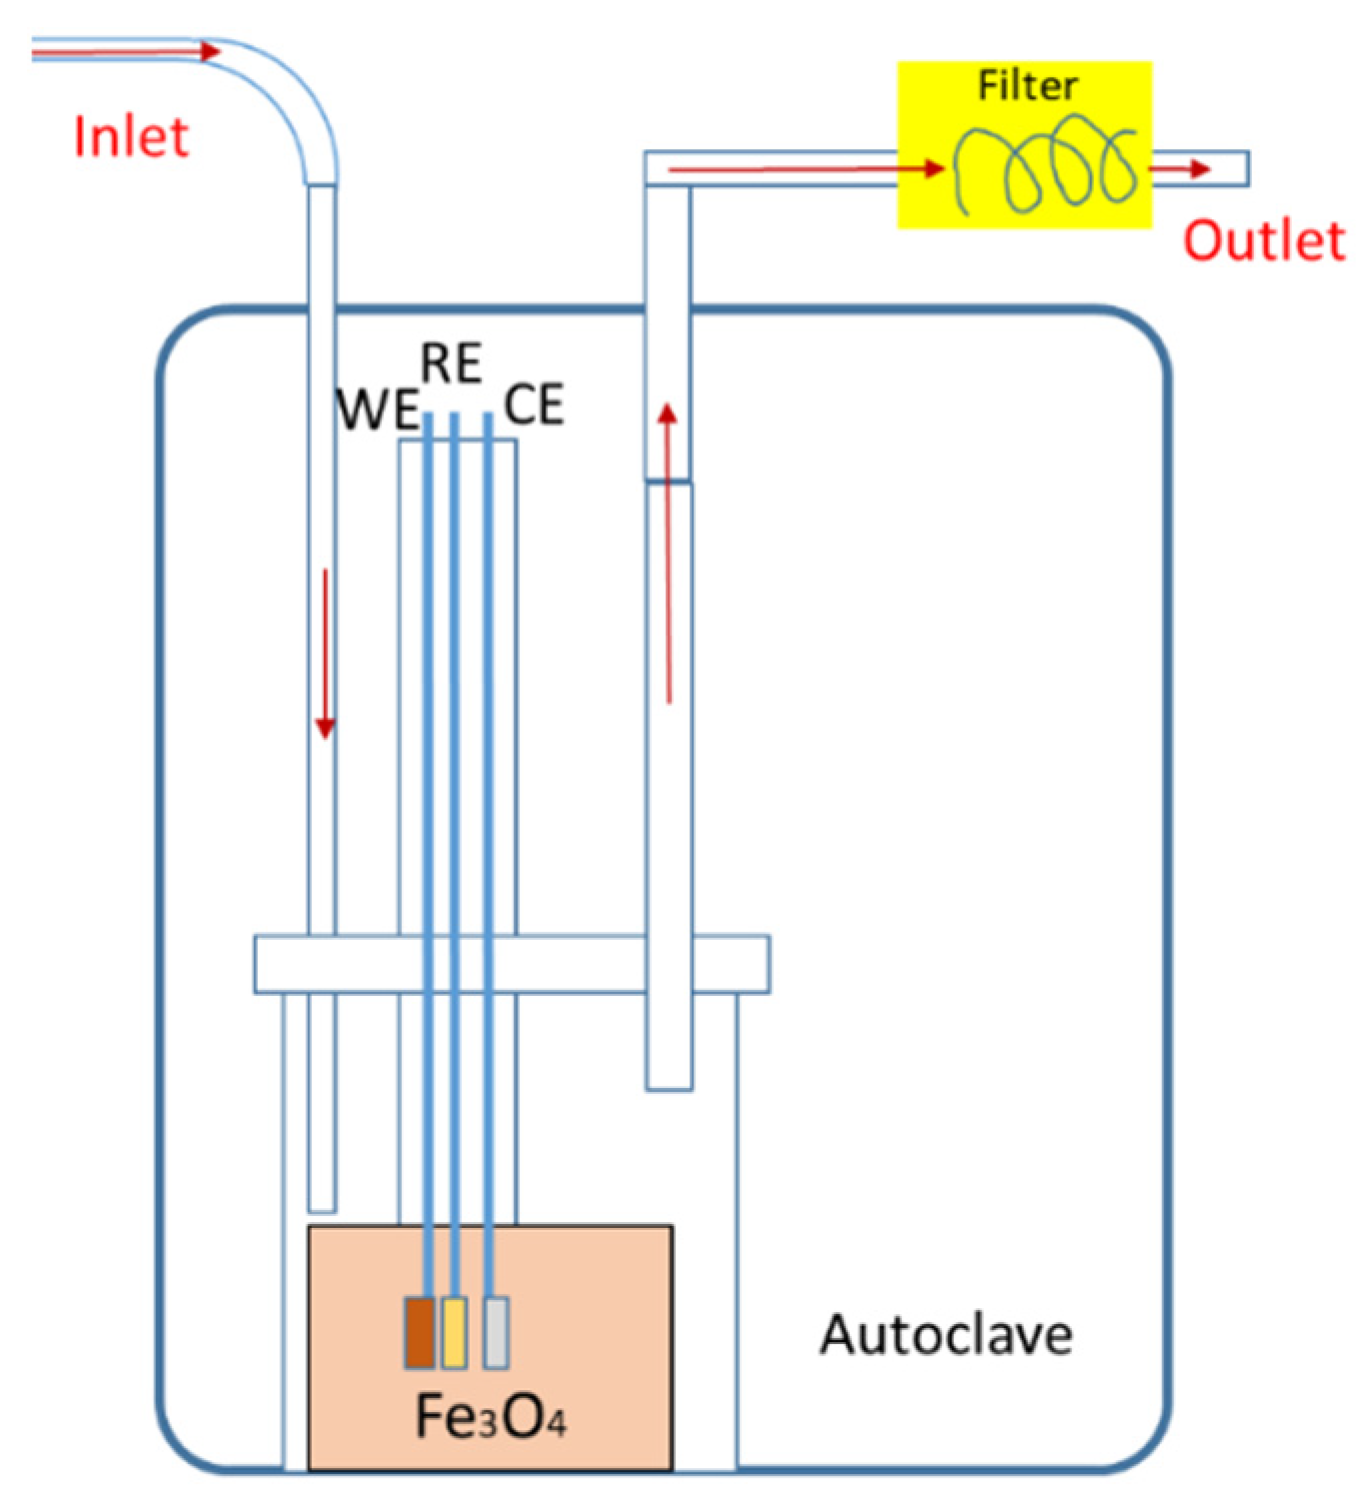
3. Materials and Methods

The kinetics of magnetite deposition on stainless steel (SG tube material) were investigated in the temperature interval 130–180 °C using a laboratory made recirculation loop connected to a measurement autoclave ((PARR, USA, manufactured from AISI 316L, volume 3.75 dm3, Figure 2). The temperature interval was chosen to coincide with the reported maximum flow-assisted corrosion rates in the steam generator. A PTFE cell with a volume of 0.15 dm3 is positioned at the bottom of the autoclave.
During measurement, the autoclave was completely filled with electrolyte, which played the role of an input flow buffer. A certain amount of magnetite (99.5%, Ventron GmbH) with a particle diameter of about 0.5 μm was also put in the cell. A particulate filter was installed at the output of the autoclave to capture magnetite particles with a diameter > 0.25 μm caught by the flow.
The working electrodes were cut from plates made of AISI 316L. The chemical composition of the alloy estimated by glow discharge optical emission spectroscopy is presented in Table 1. Pre-treatment of electrodes consisted of degreasing, mechanical polishing with type 2000 emery paper and washing with de-ionized water. Pt (99.9%) was used as a counter-electrode and a cathodically polarized Pd (99.9%) served as a reversible hydrogen electrode (RHE). The polarization of Pd vs. an additional Pt electrode was carried out with −10 μA, using a DC current source (LakeShore Cryotronics). Before each measurement, this type of electrode was calibrated at ambient temperature against a AgCl/Ag/3 M KCl electrode. The composition of the electrolyte simulating an ammonia–ethanolamine (AMETA) secondary coolant is summarized in Table 2. N2H4, NH3 and HO(CH2)2NH2 (p.a., Sigma Aldrich, St. Louis, MO, USA) that contained less than 0.00005% of Fe and Cu and de-ionized water (room temperature conductivity less than 0.2 µS cm−1) were used for its preparation. The concentration of magnetite was either 0.1 or 1.0 g dm−3.
The magnetite deposition process is followed by electrochemical impedance measurements at the open-circuit potential. According to literature data, this type of measurement gives the most accurate in-situ information about the initial stages of the process [21]. Impedance measurements were performed using an Ivium CompactStat.h10030 potentiostat in floating mode, driven by IviumSoft 4.89 software (Ivium Technologies, Eindhoven, The Netherlands). The linearity of impedance measurements was verified by acquiring spectra with signal amplitudes between 20 and 50 mV (rms), and the stationarity of the system was checked by the Kramers–Kronig transformation test embedded in the software. After mounting the electrodes and filling the system with electrolyte, it was pressurized to 90 bar and heated to 80 °C, followed by purging with 99.999% Ar for 16 h. The concentration of dissolved oxygen in the system after this procedure was less than 0.01 mg kg−1. However, the purging of the feedwater in the tank with Ar continued throughout the experiment duration. Next, the temperature in the measuring autoclave was gradually increased, with the value of 180 ± 1 °C at a pressure of 90 ± 0.2 bar being attained in 2.5–3.5 h. After reaching the operating temperature, impedance spectra were taken periodically during deposition up to 24 h. Both galvanostatic zero current mode (i.e., open circuit) and potentiostatic measurements at the corrosion potential were used. The spectra were measured in a frequency range of 0.5 mHz to 11 kHz with an ac signal of 40 mV (rms) or 1 μA (rms). Spectra measured by both methods were identical within the reproducibility limit (±1% by impedance magnitude and ±2° by phase shift). Complex least-square fitting of the spectra with respect to the equations of the mixed-conduction model were performed using Originlab 9.8 software.

4. Results and Discussion

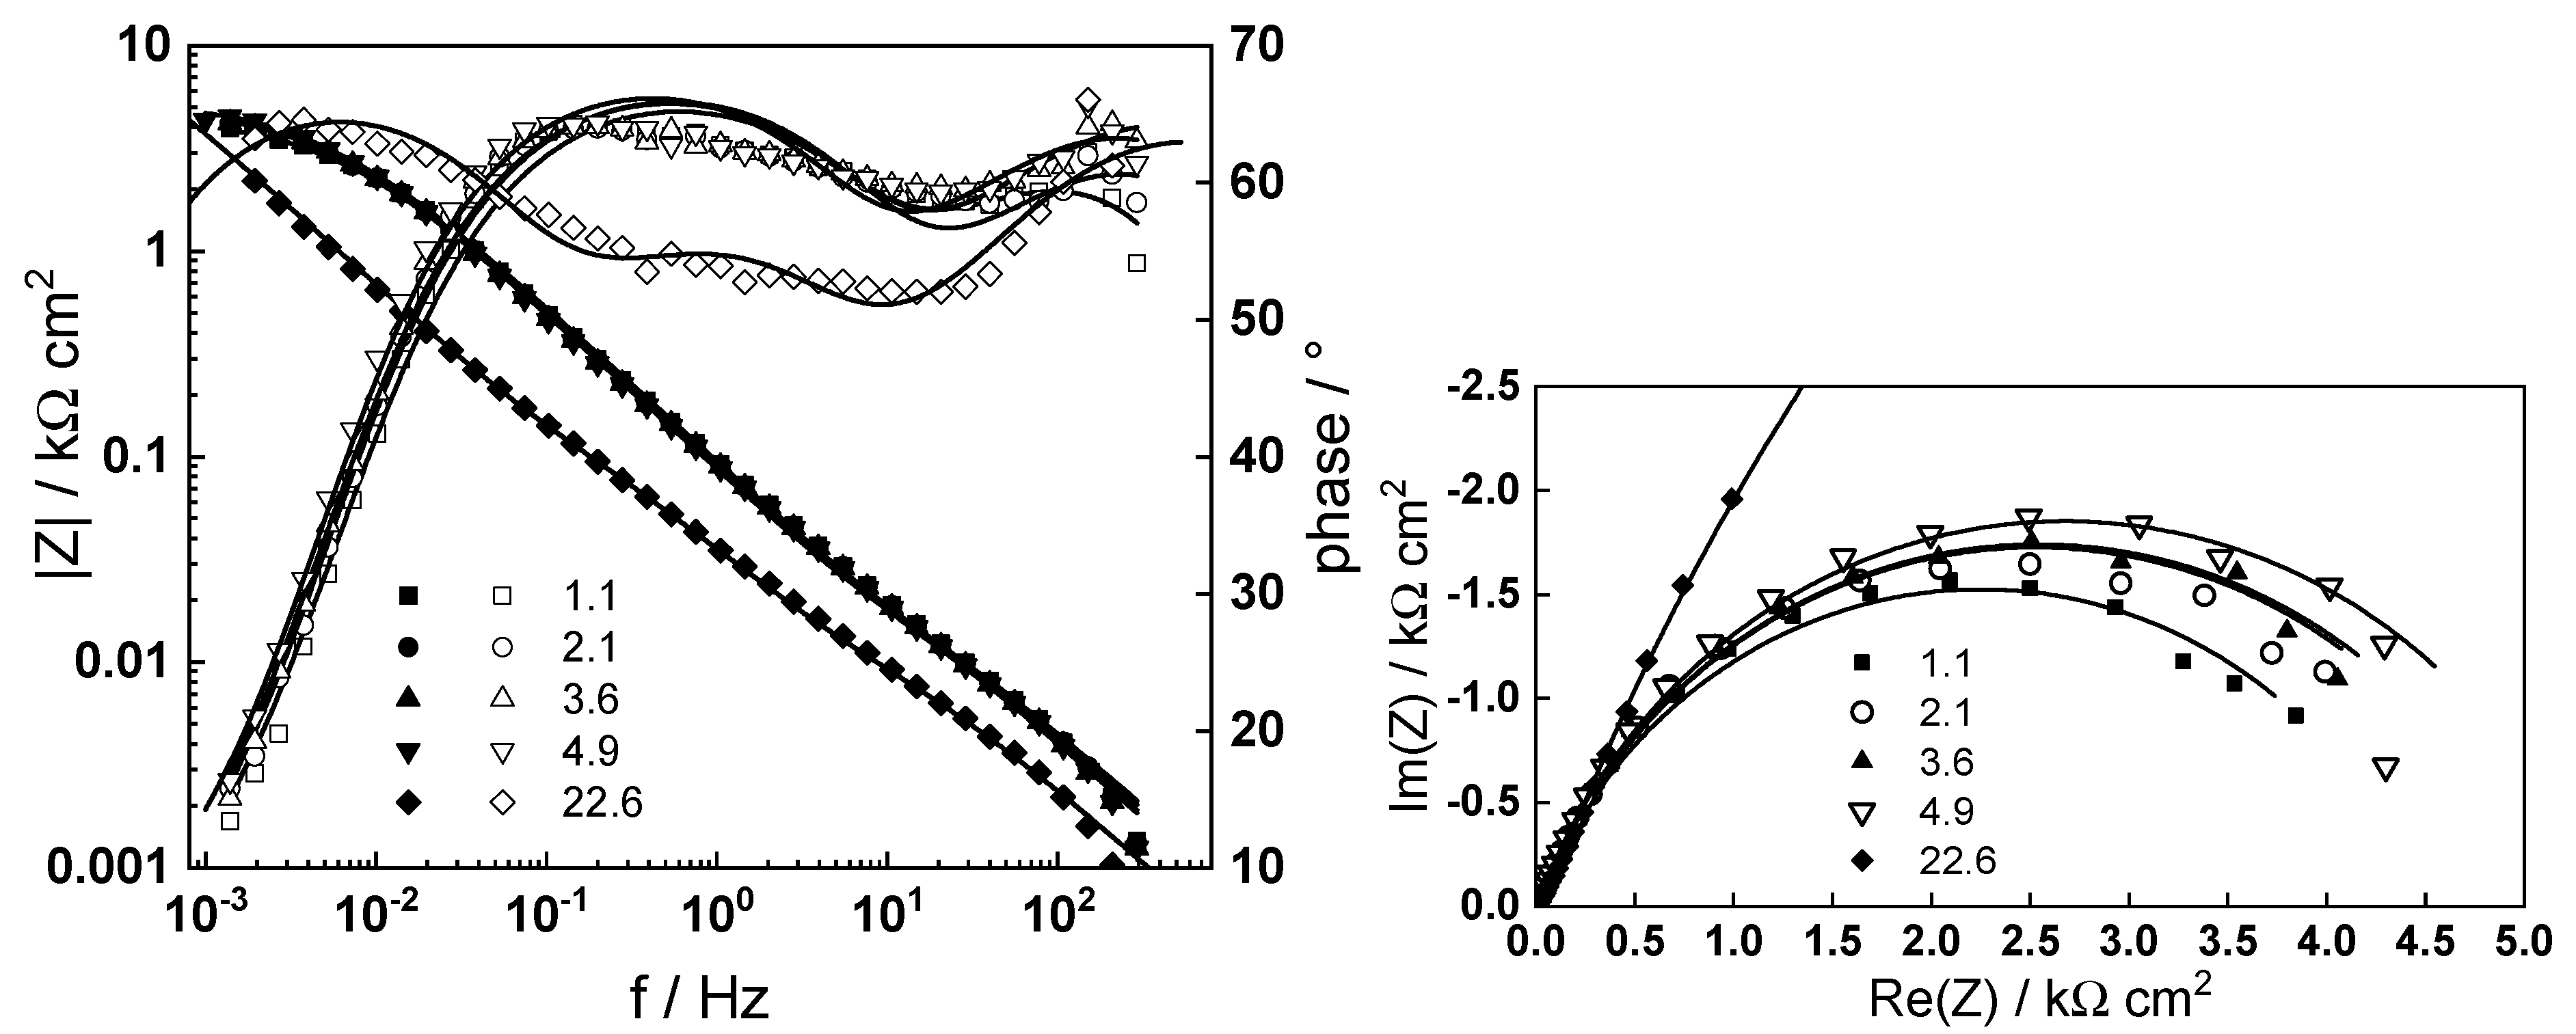
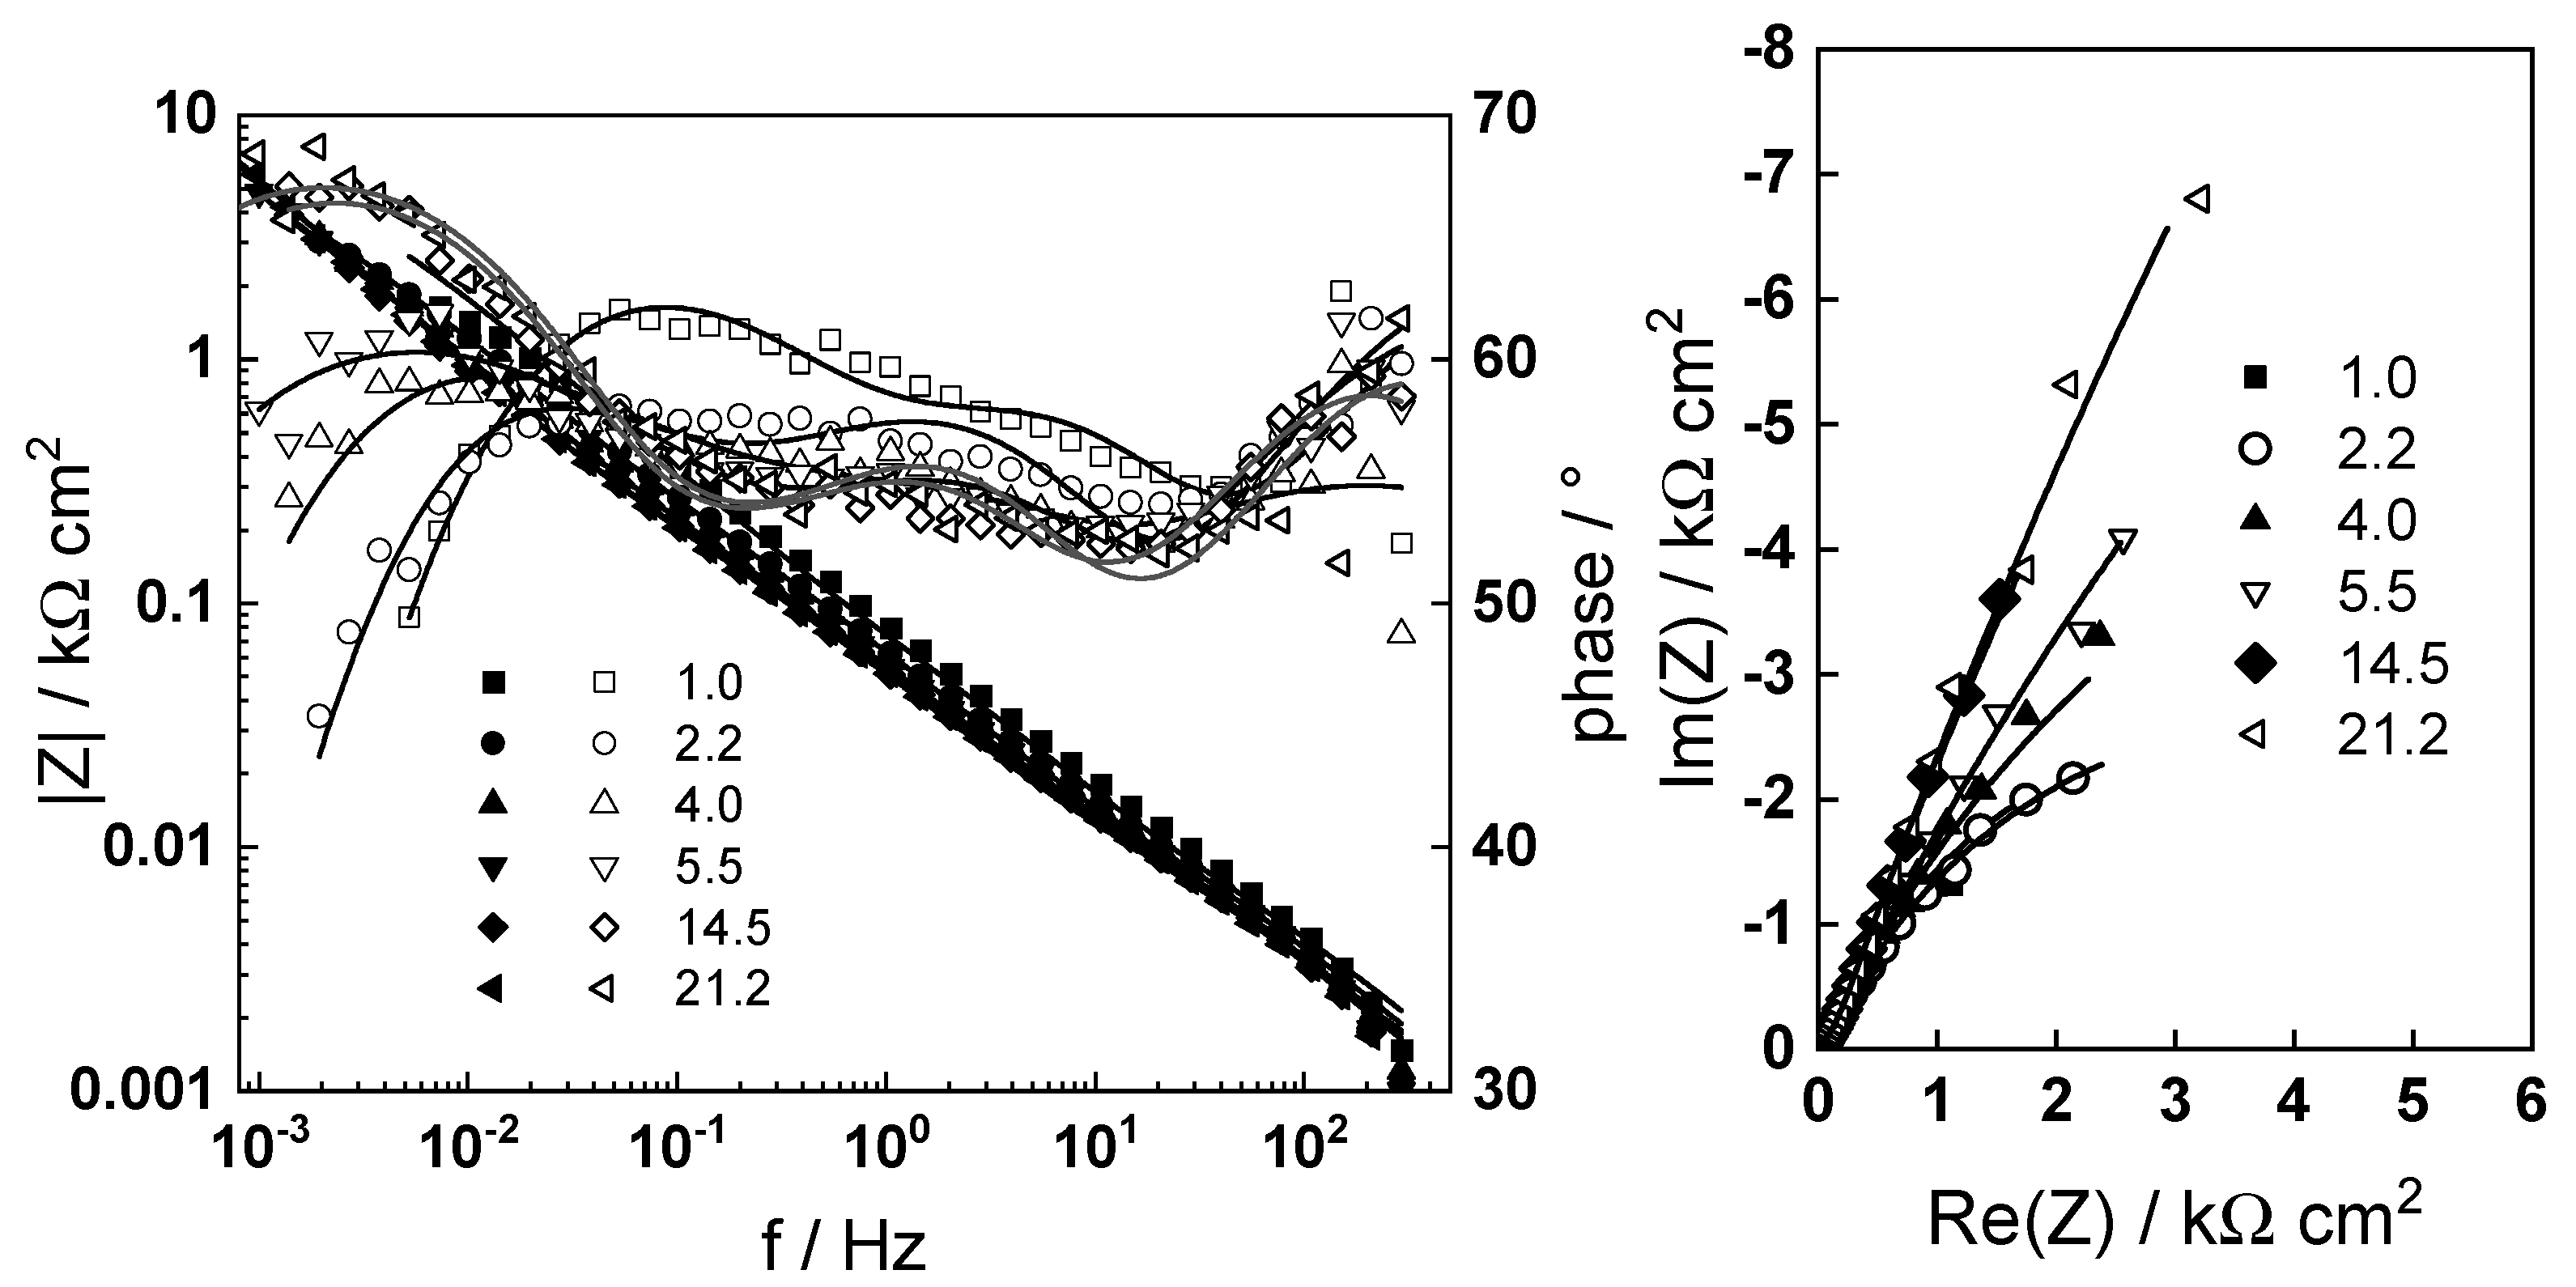
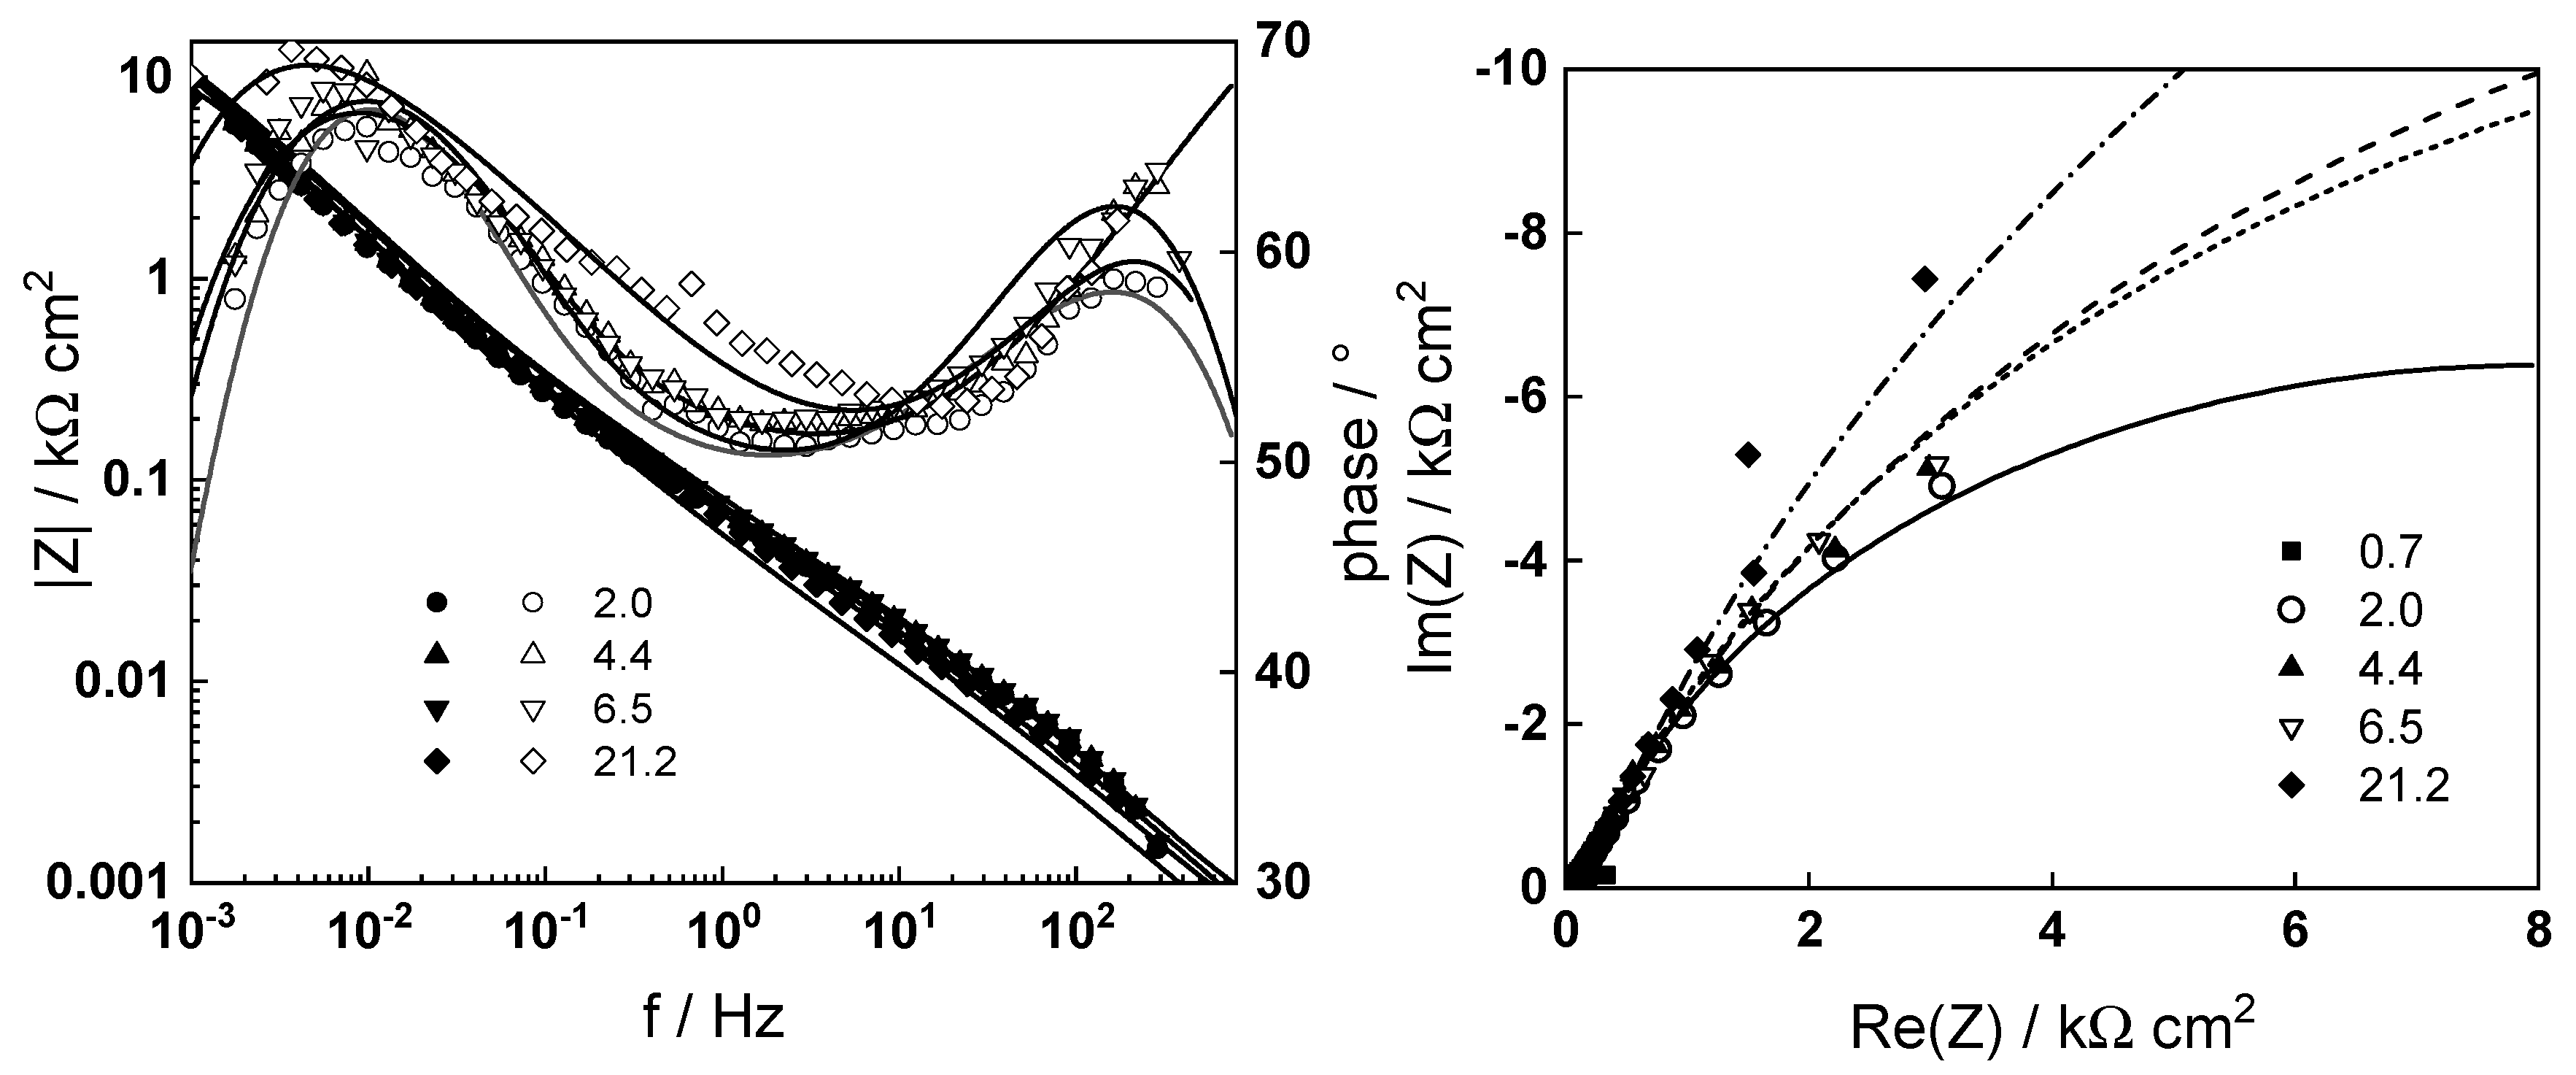
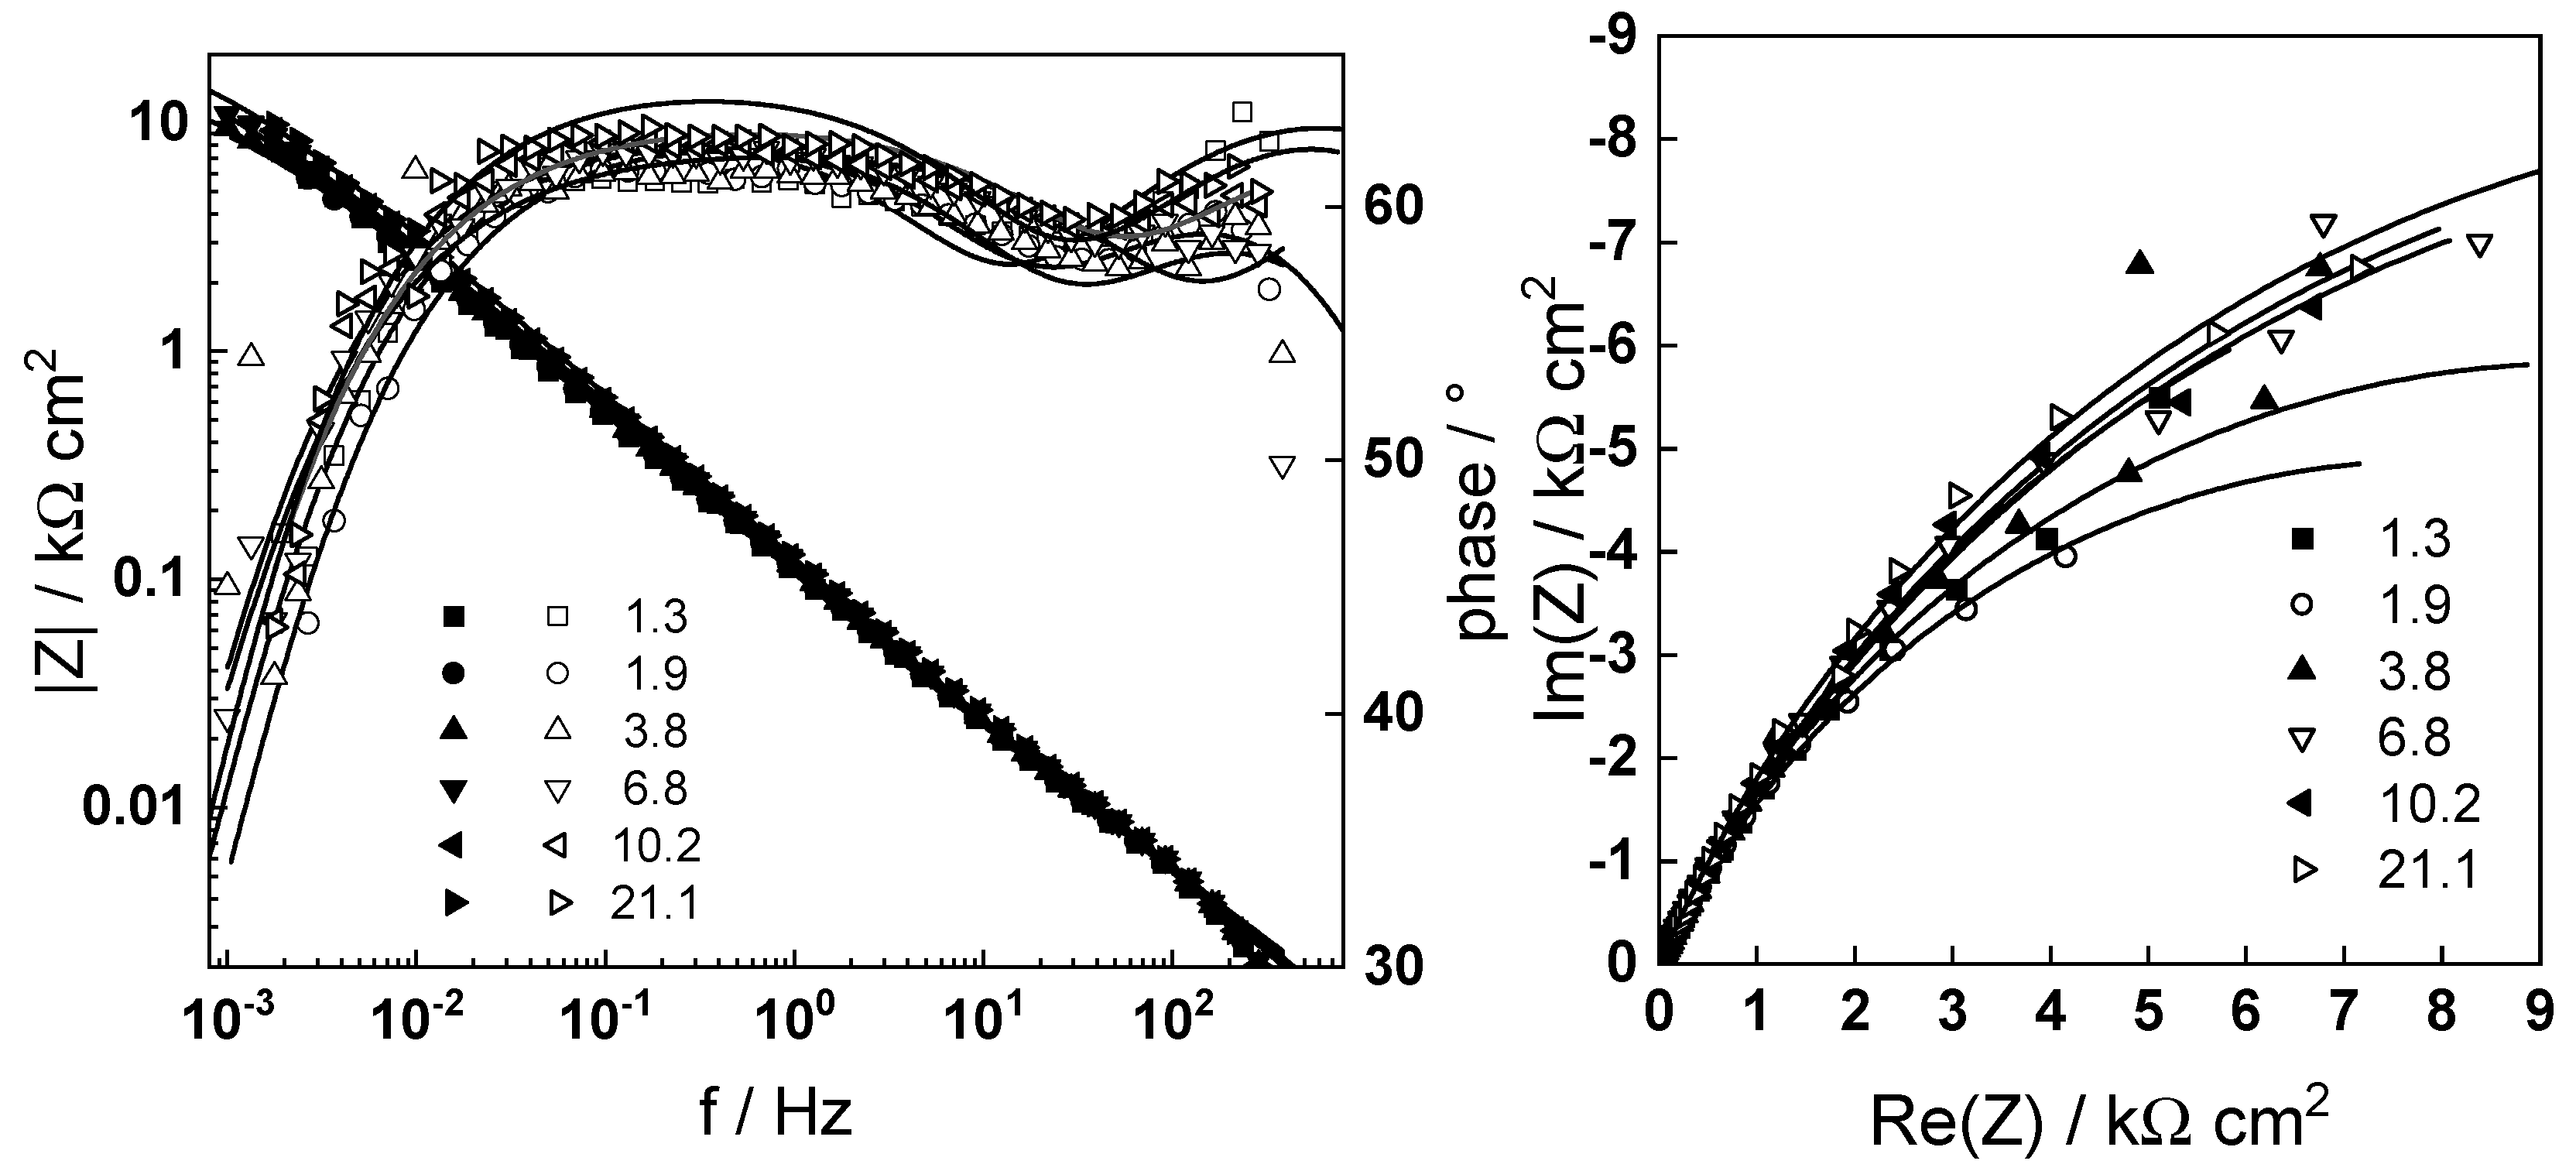
4.1. Electrochemical Impedance Spectra of AISI 316L during Magnetite Deposition

Electrochemical impedance spectra of AISI 316L at 130 °C in the AMETA electrolyte both in the absence and the presence of 1.0 g dm−3 Fe3O4 are presented in Figure 3 and Figure 4, both in Bode coordinates (magnitude and phase shift of impedance dependent on frequency) and in the complex plane. For the convenience of comparing the spectra measured at different temperatures, the ohmic resistance of the electrolyte is 95% compensated. In the absence of magnetite particles, impedance spectra depend only slightly on oxidation time and the total polarization resistance of the system (expressed as the impedance magnitude at f → 0) varies between 4.0 and 5.0 kΩ cm2 in qualitative agreement with the results of AISI 304L in ammonia water at 300 °C without the addition of magnetite [21]. In the presence of 1.0 g dm−3 magnetite, polarization resistance increases continuously with oxidation time, which is an indication of gradual coverage of the oxide/electrolyte interface with magnetite particles that block the active sites for the charge transfer processes. Extrapolated polarization resistance values after 24 h of oxidation are several times higher than those in the absence of magnetite, which is also in qualitative agreement with the AISI 304L results in ammonia with 0.3 g dm−3 Fe3O4 at 300 °C [21].
By deconvolution of impedance spectra, three time constants are detected in the phase shift vs. frequency curves. The high-frequency time constant is associated with the electrical properties of the protective sublayer of oxide, the time constant at intermediate frequencies most likely reflects the processes of charge transfer across the film/coolant interface, and the low-frequency time constant is due to the transport of ionic defects in the protective sublayer.
Electrochemical impedance spectra of AISI 316L in AMETA at 180 °C in both the absence and presence of 0.1 and 1.0 g dm−3 Fe3O4 are presented in Figure 5, Figure 6 and Figure 7. The results are qualitatively analogous to those at 130 °C: in the absence of magnetite, the influence of oxidation time on impedance spectra is small, while in the presence of Fe3O4, the polarization resistance increases continuously and reaches values 7–8 times higher than in its absence. This fact again illustrates the significant coverage of the surface with magnetite particles. The number and type of time constants in the impedance spectra is analogous to that observed at 130 °C, allowing the data to be interpreted with the same transfer function. It is worth noting that, except in the initial stages of oxidation, the influence of the magnetite content on the impedance spectra is relatively weak.

4.2. Interpretation of Impedance Spectra

In analogy to the previous corrosion assessments of low-alloy and stainless steels in environments simulating steam generator conditions [22,23,24,25], the mixed-conduction model for oxide films (MCM) was applied for a quantitative interpretation of the experimental data. If the growth/dissolution of the protective oxide layer and dissolution of metal through the oxide (corrosion release) are considered for a magnetite oxide, the following reactions occur at alloy/film and film/coolant interfaces:
( M / F )   Fe m k F e Fe i + 2   e ( M / F )   3 Fe m k O 3 Fe Fe ( Fe 3 O 4 ) + 4 V O · · + 8   e ( F / S )   Fe i k 2 Fe Fe aq y + + ( y 2 ) e ( F / S )     4 H 2 O + 4 V O · · k 2 O 4 O O ( Fe 3 O 4 ) + 8 H + ( F / S )   Fe 3 O 4 + 2 H + + 2 e - + 2 H 2 O k S 3 Fe ( OH ) 2 , aq
The interfacial processes are coupled to transport oxygen and iron through the oxide by diffusion–migration via oxygen vacancy ( V O · · ) or iron interstitial ( Fe i ) mechanisms. Accordingly, the transfer function describing the impedance of the system acquires the following form:
Z = R e l + Z f + Z F / S ,   Z F / S = 1 j ω C F / S + R F / S 1 ,   Z f = Z e 1 + Z i o n , O 1 + Z i o n , F e 1 1
In the equations above, the impedance at the film/coolant interface ZF/S is represented as a parallel combination of an interfacial capacitance CF/S and a charge transfer resistance RF/S. On the other hand, the impedance of the protective film (Zf) is a parallel combination of the impedance of its electronic properties, Ze, and two impedances of ion transport pertinent to the transfer of oxygen by vacancy (Zion,O) and iron by interstitial mechanism (Zion,Fe). The detailed expressions for these impedances are given below:
Z e R T 2 j ω F E L C s c ln 1 + j ω ρ d ε ε 0 exp 2 K L 1 + j ω ρ d ε ε 0 ,   K = F R T E , ρ d = R T F 2 D e k 2 O + k 2 F e k O + k F e
Z i o n , O R T 4 F 2 k O ( 1 α ) 1 + 1 + 4 j ω D O K 2 ,   Z i o n , M R T 4 F 2 k F e ( 1 α ) 1 + 1 + 4 j ω D F e K 2
where De, DO and DFe are the diffusion coefficients of electronic current carriers, oxygen vacancies and iron interstitials; L is the thickness of the protective film; E is the electric field strength; ε is its dielectric permittivity; and α is the part of the potential consumed as a drop at the film/coolant interface. As usual, the rate constants of reactions at the alloy/protective film and protective film/coolant interfaces are exponential functions of the respective potential drops.
k F e = k F e 0 exp 2 α F e F R T 1 α E E L ,   k O = k O 0 exp 2 α O F R T 1 α E E L , k 2 O = k 2 O 0 exp 2 α 2 O F R T α E , k 2 F e = k 2 F e 0 exp 2 α 2 F e F R T α E
The comparison of experimental and calculated impedance spectra (Figure 3, Figure 4, Figure 5, Figure 6 and Figure 7) demonstrates the ability of the proposed model to reproduce both the magnitude and frequency distribution of experimental data. Therefore, estimates of kinetic parameters, calculated by non-linear regression of experimental data with regard to model equations, can be used to predict the rate of oxidation and corrosion of structural materials (carbon, low-alloy and stainless steel) in secondary circuit of PWR plants. Since the main objective of this study is to assess the rate of deposition of magnetite on steam generator tube material, and taking into account the influence of magnetite addition on the evolution of impedance spectra over time (mainly on polarization resistance), we focused on the values of charge transfer resistance RF/S as a function of time, magnetite content and oxidation temperature (Figure 8).

4.3. Comparison of the Deposition Model with Experimental Data

Based on the data presented, the degree of coverage of the surface with deposited magnetite (θ) can be estimated by the retardation of the charge transfer reactions by the blocking species:
θ = 1 / R F / S 0 1 / R F / S 1 / R F / S 0
where R F / S 0 is the respective interfacial charge transfer resistance in the absence of magnetite. The coverage–time dependencies calculated according to the equation above are presented in Figure 9 as a function of temperature and magnetite content. A maximum coverage of about 0.9 is reached after ca. 10 h at 130 °C and 6–7 h at 180 °C. Magnetite content seems to have a relatively smaller influence on the type of curves and the value of the maximum coverage when compared to the temperature.
The coverage–time dependencies are used to validate the magnetite deposition model proposed in the theoretical background section. Starting with Equation (2) and defining the coverage as the mass of the deposited magnetite, normalized by that of a monolayer magnetite (mθ=1) defined by the expression:
m θ = 1 = M F e 3 O 4 β max
where MFe3O4 is the molar mass of magnetite and βmax is the surface concentration of active adsorption sites at the protective film/electrolyte limit (about 0.9 nmol cm−2 for a magnetite type oxide [26]), we obtain:
θ ( t ) = k a m p m θ = 1 k d 1 α ( t ) 1 e k d 1 α ( t ) t ,   α ( t ) = 1 exp k c t n
In the present case, the mass of the suspended particles is mp = 0.1–1.0 mg cm−3 and mθ=1 = 0.23 µmol cm−2.
The data from Figure 9 are subjected to non-linear regression with respect to equation, and the rate constants ka, kd, as well as the parameters of the consolidation process (kc and n) are treated as fitting parameters. The results of the regression are presented in the figure with continuous lines and demonstrate the model’s ability to predict the initial stages of magnetite deposition on AISI 316L at 130 and 180 °C in the AMETA coolant. The estimates of kinetic parameters are collected in Table 3.
It can be concluded that rate constants increase with temperature according to the general kinetic expectations. The smallest increase is associated with the rate constant of consolidation, which probably relates to the higher mobility of iron ions at higher temperatures and a weaker consolidation trend. In addition, the deposition rate constant at 180 °C decreases as the magnetite concentration in the coolant increases, which could be explained by agglomeration of particles at higher concentrations (the rate constant ka is inversely proportional to particle size according to Equation (3)).

5. Conclusions

In this study, an attempt was made to verify a previously proposed quantitative model of particle deposition and consolidation by quantitative comparison with in-situ data on the initial stages of deposition of magnetite particles on stainless steel in simulated steam generator conditions. The following conclusions can be drawn from the experimental and calculational results:
  • Electrochemical impedance spectroscopy is a suitable method to follow the initial stages of magnetite deposition, provided that the data are interpreted with a suitable transfer function in order to obtain reliable estimates of electrochemical reactions at the film/solution interface that are gradually blocked by the deposition process.
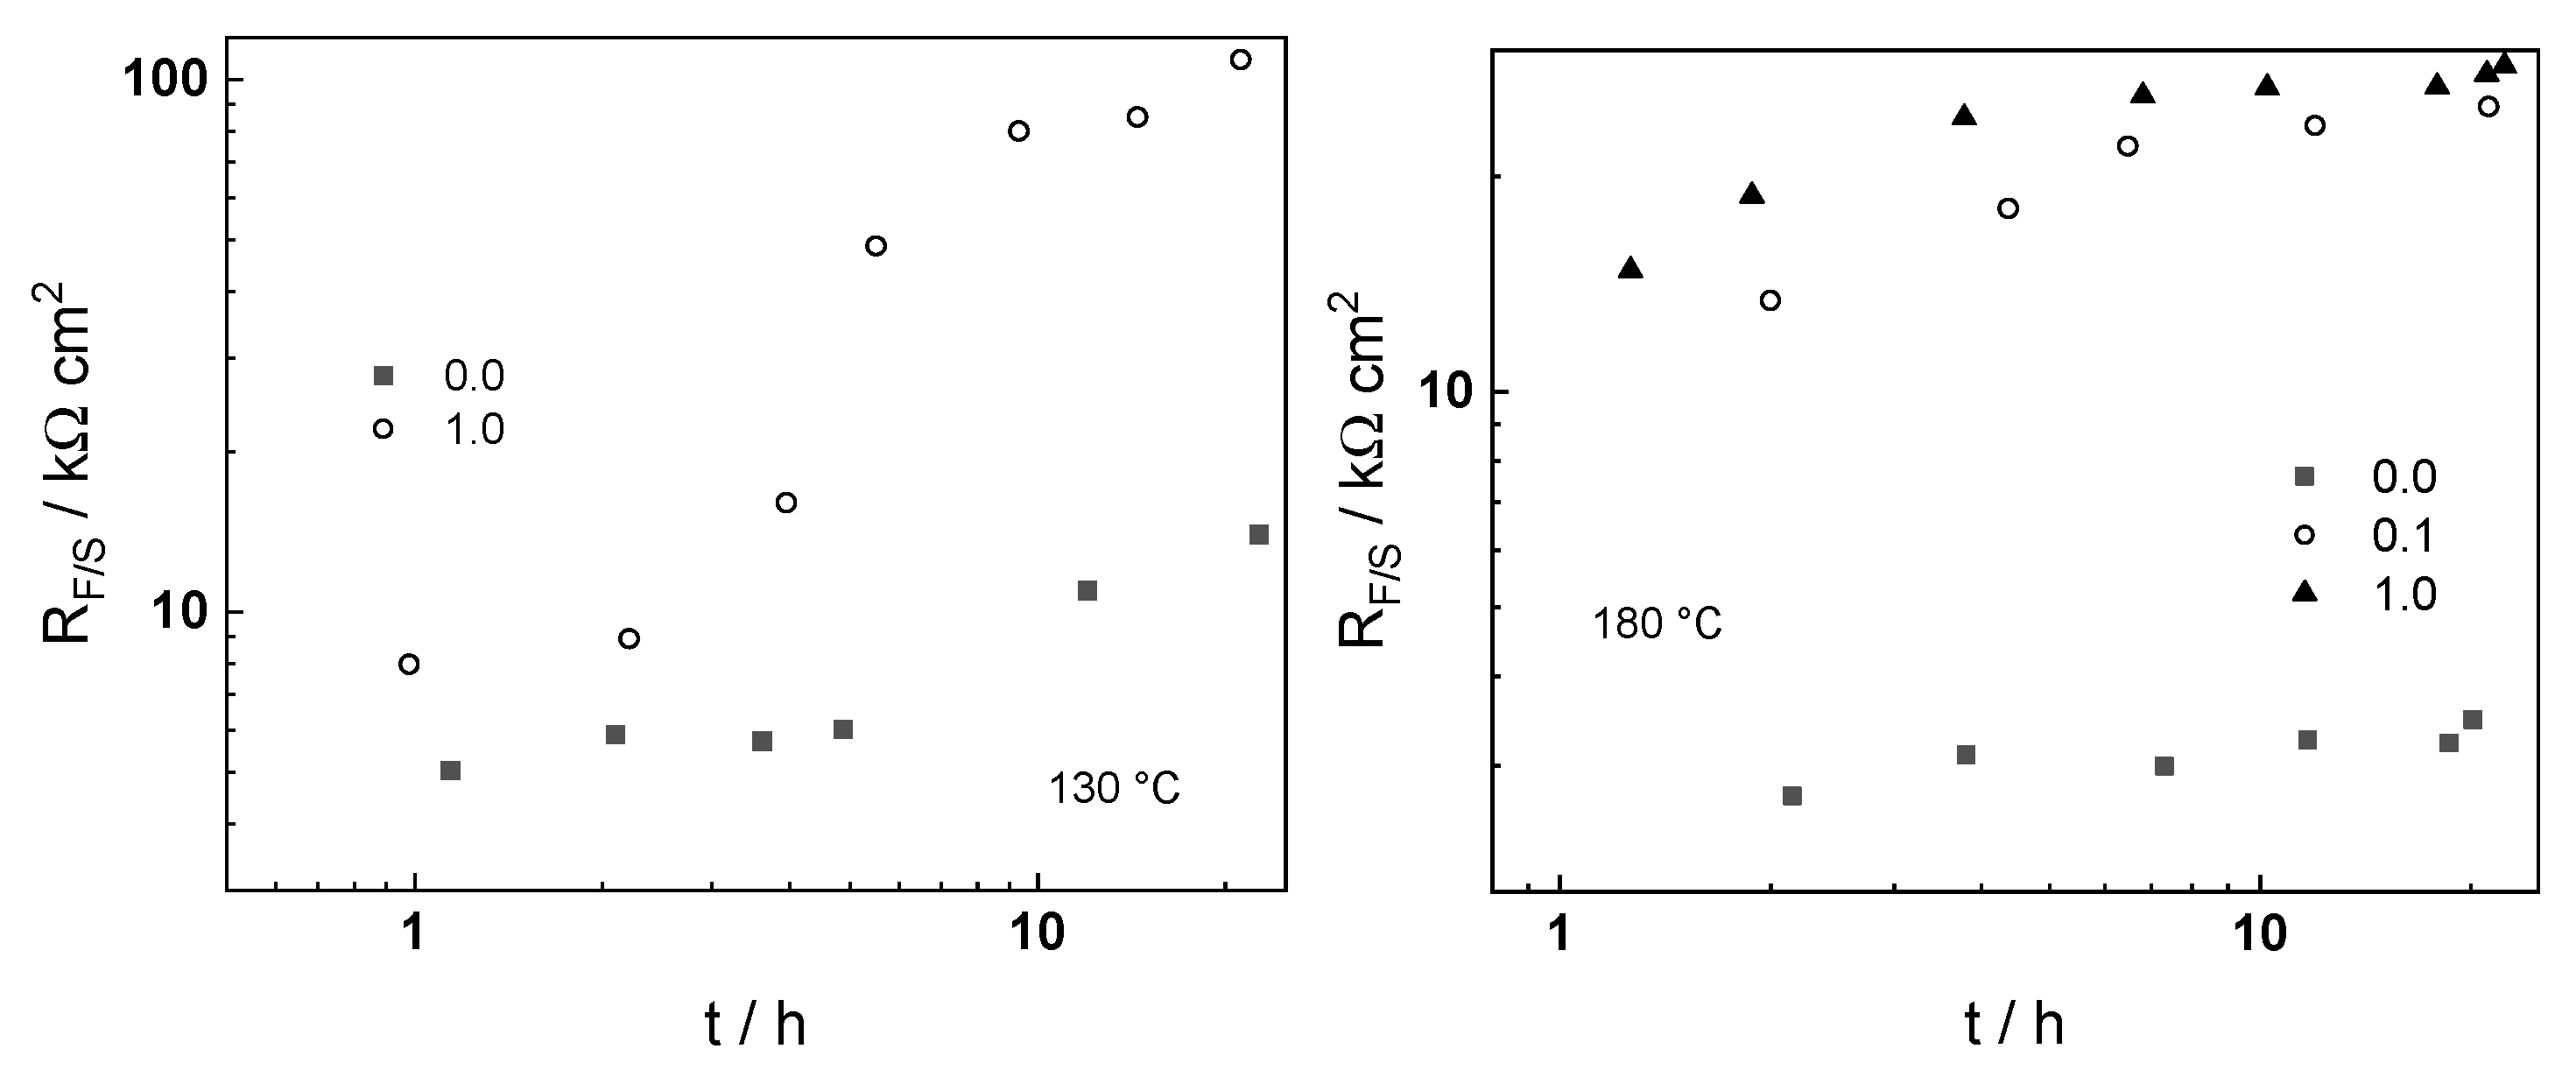
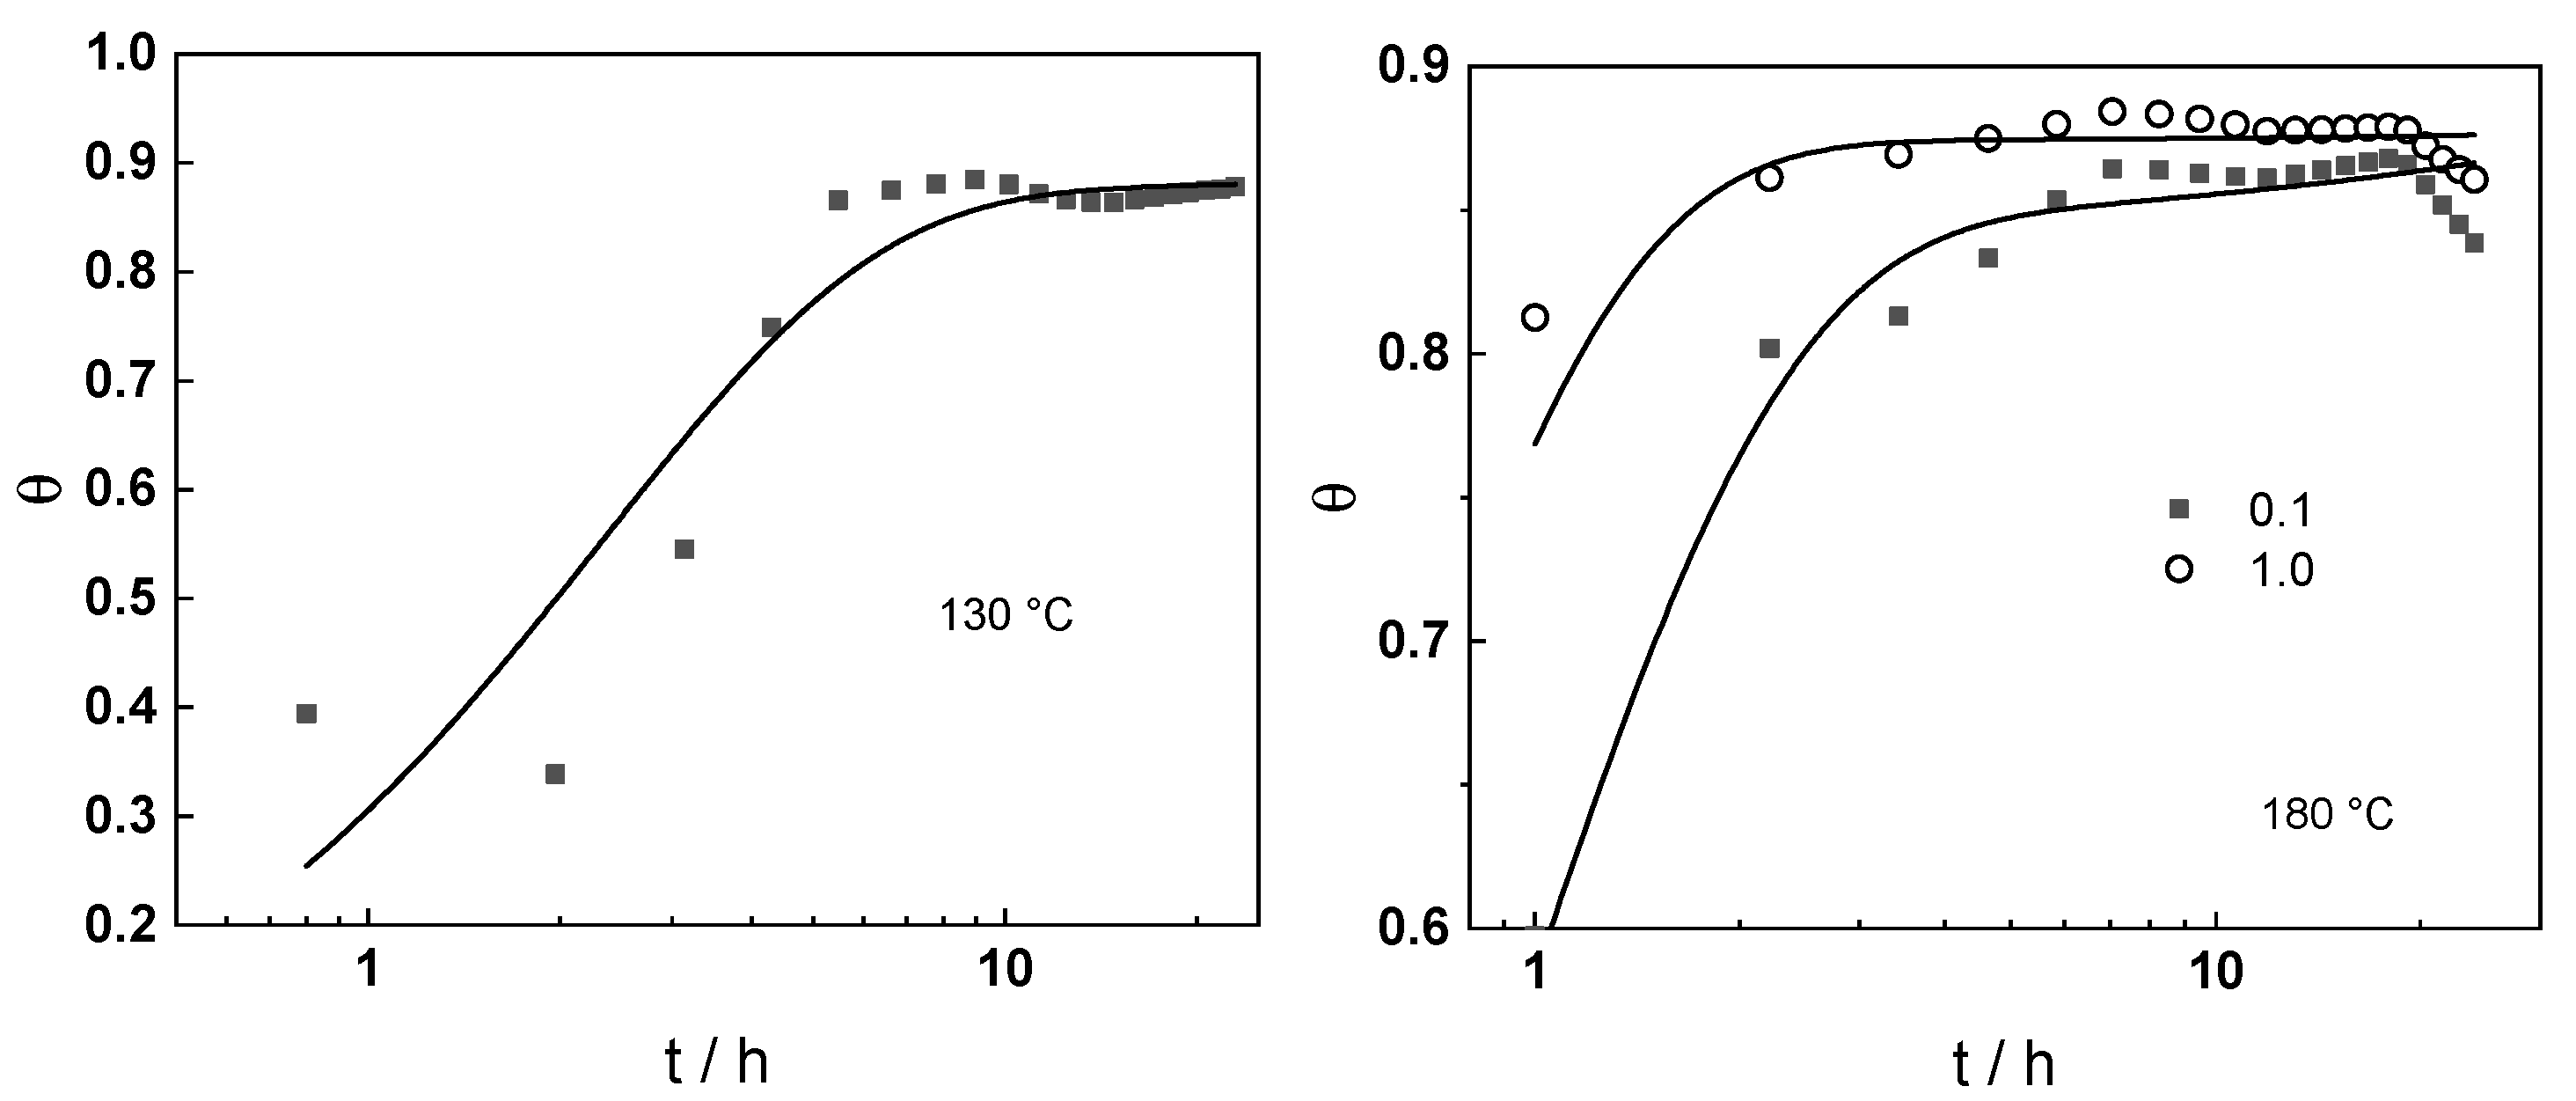
  • Interpretation of the time evolution of charge transfer resistance at the film/solution interface during magnetite deposition allowed the estimation of the time-dependence of the degree of coverage with particles.
  • The coverage-time curves are quantitatively compared to the kinetic equation that forms the basis of the proposed model, and reliable estimates of the rate constants of deposition, detachment and consolidation are obtained.
  • The rate constants increase with temperature, with the extent of increase being the smallest for the rate constant of consolidation, most likely related to the higher mobility of iron ions leading to a weaker consolidation tendency at a higher temperature.
  • It is worthwhile to mention that measurements of the type reported in this study have proven to be difficult to obtain at operational temperatures of steam generators (240–260 °C), most likely due to the considerably faster rate of the deposition process. Alternative techniques to assess the kinetics of deposition are actively sought within the frames of our project, and the results will be reported in the near future.

Author Contributions

Conceptualization, I.B. and M.B.; methodology, M.B.; software, M.B.; validation, V.K. and I.B.; formal analysis, I.B.; investigation, V.K.; data curation, V.K.; writing—original draft preparation, M.B.; writing—review and editing, I.B and V.K. All authors have read and agreed to the published version of the manuscript.

Funding

This research was funded by The National Scientific Fund of Bulgaria, grant number KП-06-H59/4-2021 “Deterministic modeling of degradation of structural materials for energy systems in high-temperature electrolytes”.

Informed Consent Statement

Not applicable.

Data Availability Statement

The data presented in this study are available on request from the corresponding author.

Conflicts of Interest

The authors declare no conflict of interest.

References

  1. Turner, C.W. Fouling of Nuclear Steam Generators: Fundamental Studies, Operating Experience and Remedial Measures Using Chemical Additives. AECL Rev. 2013, 2, 61–88. [Google Scholar] [CrossRef] [Green Version]
  2. Turner, C.W.; Klimas, S.J.; Brideau, M.G. Thermal Resistance of Steam-Generator Tube Deposits under Single-Phase Forced Convection and Flow-Boiling Heat-transfer. Can. J. Chem. Eng. 2000, 78, 53–60. [Google Scholar] [CrossRef]
  3. Xie, Y.; Zhang, J. Corrosion and deposition on the secondary circuit of steam generators. J. Nucl. Sci. Technol. 2016, 53, 1455–1466. [Google Scholar] [CrossRef] [Green Version]
  4. Jeon, S.-H.; Hong, S.; Kwon, H.-C.; Hur, D.H. Characteristics of steam generator tube deposits in an operating pressurized water reactor. J. Nucl. Mater. 2018, 507, 371–380. [Google Scholar] [CrossRef]
  5. Yang, G.; Pointeau, V.; Tevissen, E.; Chagnes, A. A review on clogging of recirculating steam generators in Pressurized-Water Reactors. Prog. Nucl. Energy 2017, 97, 182–196. [Google Scholar] [CrossRef] [Green Version]
  6. Jeon, S.-H.; Son, Y.-H.; Choi, W.-I.; Song, G.D.; Hur, D.H. Simulating Porous Magnetite Layer Deposited on Alloy 690TT Steam Generator Tubes. Materials 2018, 11, 62. [Google Scholar] [CrossRef] [Green Version]
  7. Jeon, S.-H.; Shim, H.-S.; Lee, J.-M.; Han, J.; Hur, D.H. Simulation of Porous Magnetite Deposits on Steam Generator Tubes in Circulating Water at 270 °C. Crystals 2020, 10, 729. [Google Scholar] [CrossRef]
  8. Lee, J.-M.; Jeon, S.-H.; Kim, K.-S.; Han, J.; Hur, D.H. Effects of pH control agents on magnetite deposition on steam generator tubes. Ann. Nucl. Energy 2020, 143, 107486. [Google Scholar] [CrossRef]
  9. Bojinov, M.; Jäppinen, E.; Saario, T.; Sipilä, K. Identification of key parameters of magnetite deposition on steam generator surfaces—Modeling and preliminary experiments. Colloids Surf. A Physicochem. Eng. Asp. 2020, 586, 124239. [Google Scholar] [CrossRef]
  10. Lee, Y.-B.; Lee, J.-M.; Hur, D.-H.; Lee, J.-H.; Jeon, S.-H. Effects of Advanced Amines on Magnetite Deposition of Steam Generator Tubes in Secondary System. Coatings 2021, 11, 514. [Google Scholar] [CrossRef]
  11. Ren, L.; Wang, S.; Xu, J.; Zhang, T.; Guo, Q.; Zhang, D.; Si, J.; Zhang, X.; Yu, H.; Shoji, T.; et al. Fouling on the secondary side of nuclear steam generator tube: Experimental and simulated study. Appl. Surf. Sci. 2022, 590, 153143. [Google Scholar] [CrossRef]
  12. Jia, W.; Ren, L.; Xu, J.; Wang, S.; Shoji, T.; Guo, Q.; Zhang, T.; Zhang, D.; Yu, H.; Sun, D. Study on the relationship between Fe3O4 fouling and NiFe2O4 oxide layer in the secondary circuit of nuclear steam generator. Surf. Sci. 2022, 717, 122001. [Google Scholar] [CrossRef]
  13. Epstein, N. Elements of Particle Deposition onto Nonporous Solid Surfaces Parallel to Suspension Flows. Exp. Therm. Fluid Sci. 1997, 14, 323–334. [Google Scholar] [CrossRef]
  14. Adamczyk, Z. Particle adsorption and deposition: Role of electrostatic interactions. Adv. Colloid Interface Sci. 2003, 100–102, 267–347. [Google Scholar] [CrossRef]
  15. Nishino, Y.; Sawa, T.; Ohsumi, K.; Iton, H. Reaction Rates of Amorphous Iron Hydroxide with Nickel and Cobalt Ions in High Temperature Water. J. Nucl. Sci. Technol. 1989, 26, 1121–1129. [Google Scholar] [CrossRef]
  16. Ahmadi, R.; Masoudi, A.; Hosseini, H.R.M.; Gu, N. Kinetics of magnetite nanoparticles formation in a one-step low temperature hydrothermal process. Ceram. Int. 2013, 39, 4999–5005. [Google Scholar] [CrossRef]
  17. Lu, J.-F.; Tsai, C.-J. Hydrothermal phase transformation of hematite to magnetite. Nanoscale Res. Lett. 2014, 9, 230–238. [Google Scholar] [CrossRef] [Green Version]
  18. Frandsen, C.; Legg, B.A.; Comolli, L.R.; Zhang, H.; Gilbert, B.; Johnson, E.; Banfield, J.F. Aggregation-induced growth and transformation of β-FeOOH nanorods to micron-sized α-Fe2O3 spindles. CrystEngComm 2014, 16, 1451–1458. [Google Scholar] [CrossRef] [Green Version]
  19. Farjas, J.; Roura, P. Numerical model of solid phase transformations governed by nucleation and growth: Microstructure development during isothermal crystallization. Phys. Rev. B 2007, 75, 184112. [Google Scholar] [CrossRef] [Green Version]
  20. Lee, J.-M.; Lim, D.-S.; Jeon, S.-H.; Hur, D.H. Zeta Potentials of Magnetite Particles and Alloy 690 Surfaces in Alkaline Solutions. Materials 2020, 13, 3999. [Google Scholar] [CrossRef]
  21. Raman, B.; Hall, D.M.; Shulder, S.J.; Caravaggio, M.F.; Lvov, S.N. An experimental study of deposition of suspended magnetite in high temperature-high pressure boiler type environments. Colloids Surf. A Physicochem. Eng. Asp. 2016, 508, 48–56. [Google Scholar] [CrossRef]
  22. Järvimäki, S.; Saario, T.; Sipilä, K.; Bojinov, M. Effect of hydrazine on general corrosion of carbon and low-alloyed steels in pressurized water reactor secondary side water. Nucl. Eng. Des. 2015, 295, 106–115. [Google Scholar] [CrossRef]
  23. Jäppinen, E.; Ikäläinen, T.; Järvimäki, S.; Saario, T.; Sipilä, K.; Bojinov, M. Corrosion behavior of carbon steel coated with octadecylamine in the secondary circuit of a pressurized water reactor. J. Mater. Eng. Perform. 2017, 26, 6037–6046. [Google Scholar] [CrossRef]
  24. Bojinov, M.; Jäppinen, E.; Saario, T.; Sipilä, K.; Toivonen, A. Effect of lead and applied potential on corrosion of carbon steel in steam generator crevice solutions. Corros. Sci. 2019, 159, 108117. [Google Scholar] [CrossRef]
  25. Jäppinen, E.; Ikäläinen, T.; Lindfors, F.; Saario, T.; Sipilä, K.; Betova, I.; Bojinov, M. A comparative study of hydrazine alternatives in simulated steam generator conditions—Oxygen reaction kinetics and interaction with carbon steel. Electrochim. Acta 2021, 369, 137697. [Google Scholar] [CrossRef]
  26. Mansour, C.; Lefèvre, G.; Pavageau, E.M.; Catalette, H.; Fédoroff, M.; Zanna, S. Sorption of sulfate ions onto magnetite. J. Colloid Interface Sci. 2009, 331, 77–82. [Google Scholar] [CrossRef] [PubMed]
Figure 1. A simplified scheme of the proposed model.
Colloids 06 00059 g001
Figure 2. Scheme of the measurement setup.
Colloids 06 00059 g002
Figure 3. Electrochemical impedance spectra of AISI 316L at 130 °C in AMETA water chemistry in the absence of magnetite particles. (left)—impedance magnitude (full symbols) and phase shift (open symbols) vs. frequency, (right)—complex plane representation. Points—experimental data, solid lines—best-fit calculation with respect to the MCM equations discussed in the text. The legend is oxidation time (h).
Colloids 06 00059 g003
Figure 4. Electrochemical impedance spectra of AISI 316L at 130 °C in AMETA water chemistry in the presence of 1.0 mg/dm−3 magnetite particles. (left)—impedance magnitude (full symbols) and phase shift (open symbols) vs. frequency, (right)—complex plane representation. Points—experimental data, solid lines—best-fit calculation with respect to the MCM equations discussed in the text. The legend is oxidation time (h).
Colloids 06 00059 g004
Figure 5. Electrochemical impedance spectra of AISI 316L at 180 °C in AMETA without magnetite particles. (left)—impedance magnitude (full symbols) and phase shift (open symbols) vs. frequency, (right)—complex plane representation. Points—experimental data, solid lines—best-fit calculation with respect to the MCM equations discussed in the text. The legend is oxidation time (h).
Colloids 06 00059 g005
Figure 6. Electrochemical impedance spectra of AISI 316L at 180 °C in AMETA with 0.1 g dm−3 magnetite particles. (left)—impedance magnitude (full symbols) and phase shift (open symbols) vs. frequency, (right)—complex plane representation. Points—experimental data, solid lines—best-fit calculation with respect to the MCM equations discussed in the text. The legend is oxidation time (h).
Colloids 06 00059 g006
Figure 7. Electrochemical impedance spectra of AISI 316L at 180 °C in AMETA with 1.0 g dm−3 magnetite particles. (left)—impedance magnitude (full symbols) and phase shift (open symbols) vs. frequency, (right)—complex plane representation. Points—experimental data, solid lines—best-fit calculation with respect to the MCM equations discussed in the text. The legend is oxidation time (h).
Colloids 06 00059 g007
Figure 8. Time dependences of the charge transfer resistance at the protective film/coolant interface at 130 (left) и 180 °C (right) without and with 0.1 and 1.0 g dm−3 Fe3O4 addition.
Colloids 06 00059 g008
Figure 9. Time dependence of the degree of coverage with magnetite at 130 (left) and 180 °C (right) in the presence of 0.1 and 1.0 g dm−3 Fe3O4 in the electrolyte. Points—experimental data, lines—best-fit calculation according to the equation.
Colloids 06 00059 g009
Table 1. Chemical composition of the AISI 316L tube material (wt.%, balance Fe).
ElementCCrCuMnNiPSSiMo
Content/wt.%0.01516.50.261.710.50.030.0030.502.6
Table 2. Composition of the AMETA coolant.
ConstituentN2H4NH3HO(CH2)2NH2
Concentration/mg kg−10.104.00.40
Table 3. Best-fit values of kinetic parameters of deposition, detachment and consolidation of magnetite on AISI 316L in the AMETA coolant at 130 and 180 °C.
Parameter130 °C, 1.0 g dm−3180 °C, 0.1 g dm−3180 °C, 1.0 g dm−3
107 ka/cm s−10.23 ± 0.0024.1 ± 0.0051.0 ± 0.02
104 kd/s−11.13 ± 0.022.07 ± 0.014.96 ± 0.008
109 kc/s−12.0 ± 0.024.0 ± 0.025.0 ± 0.02
n (-) 0.6 ± 0.0020.67 ± 0.0030.67 ± 0.002
Publisher’s Note: MDPI stays neutral with regard to jurisdictional claims in published maps and institutional affiliations.

