1. Introduction
Brodie first reported the oxidation of graphite to form graphene oxide (GO) over 150 years ago in an attempt to determine the molecular weight of carbon [
1] and GO now plays a central role in a significant number of graphite-based studies [
2,
3]. Despite this, relatively few investigations focus on the graphite oxidation mechanism: most reports focus on applications and processing techniques. With this in mind, we examine the oxidation of graphite by a commonly used modified Hummers method [
4,
5], focusing on the kinetics of graphite oxidation to GO. Using relevant characterization methods such as XRD, Raman spectroscopy, SEM, TGA, and FTIR, we show how the structure and homogeneity of GO evolve with increasing oxidation time. The oxidation of graphite is commonly used to facilitate exfoliation and impart hydrophilicity to aid in the processing of graphite [
6,
7,
8]. Oxidation adds various functionalities to the graphene sheets, frequently changing the hybridization of the carbons comprising the sheets from sp
2 to sp
3 while also increasing the inter-sheet spacing. Descriptions of the preparation and characterization of GO in the literature are often brief, often with only a passing mention of reaction parameters and characterization results.
Past studies of GO synthesis have primarily examined the final GO structure rather than examining intermediate oxidation stages [
2,
3,
9,
10,
11]. A recent example is a study that analyzed the effect of commonly used reagents on the final product and suggested the optimum conditions for GO synthesis [
12]. Studies aimed at elucidating the mechanism of oxidation are rare. They include the work of Dimiev et al., who showed that GO synthesis techniques’ quenching and purification processes significantly affect GO properties and structure [
13]. Other examples include the work of Rourke et al. [
14] and Guo et al. [
15] who described the formation of oxidation debris and its effect on the surface activity of GO sheets. Justh et al. reported the characterization of GO at various steps of oxidation, workup, and reduction, observing the changing structure of GO with each step [
16]. Investigations specifically considering reaction time are more rare and have focused on narrowly defined properties. This includes the work of Jeong et al., where the energy gap of GO was tuned by adjusting oxidation time [
10], Guo et al., who showed that the morphology and surface topography of hollow GO spheres was affected by the oxidation time of the GO [
17], and Shao et al. who used FT-IR to monitor the disappearance of C=C stretching bands [
4].
A recently published study by Li et al. is one of very few to study the kinetics of graphite oxidation explicitly [
18]. In this study, the authors monitor the disappearance of the oxidant KMnO
4 with time at various temperatures and sulfuric acid concentrations. The study also uses an optical examination of individual graphite flakes at different reaction times to study the degree of oxidation of the graphite. The authors conclude that the oxidation involves diffusion of active species at a constant rate into the galleries of the graphite, with the rate being diffusion controlled above a particular oxidant concentration. Structural analysis using XRD, TGA, and XPS was presented, but the findings did not draw any conclusions. Other work has shown the effect of reaction time on the stability of GO dispersions [
18,
19,
20] and the relationship between reaction time and the size of GO sheets [
21,
22].
In the study reported here, we performed time-resolved investigations of the oxidation process while examining multiple aspects of the GO to determine the effect that oxidation time had on individual graphene sheets and the sample as a whole. We used a commonly employed modified Hummers’ method for the graphite oxidation and sampled the reaction at various times to characterize the state of the material as the reaction proceeded. Like most approaches, the modified Hummers’ approach involves strong acids and oxidizers, resulting in a final product containing a distribution of lateral sizes, stacking heights, and degrees of oxidation. Our study reports several novel findings, such as a plateauing of the extent of graphite oxidation with increasing time, a continuing evolution of the oxygen functionality without further oxidation of the GO, an increase in the uniformity of individual GO sheets with increased reaction time, and the apparent stabilization of the structure of isolated GO after approximately two hours of oxidation.
3. Results and Discussion
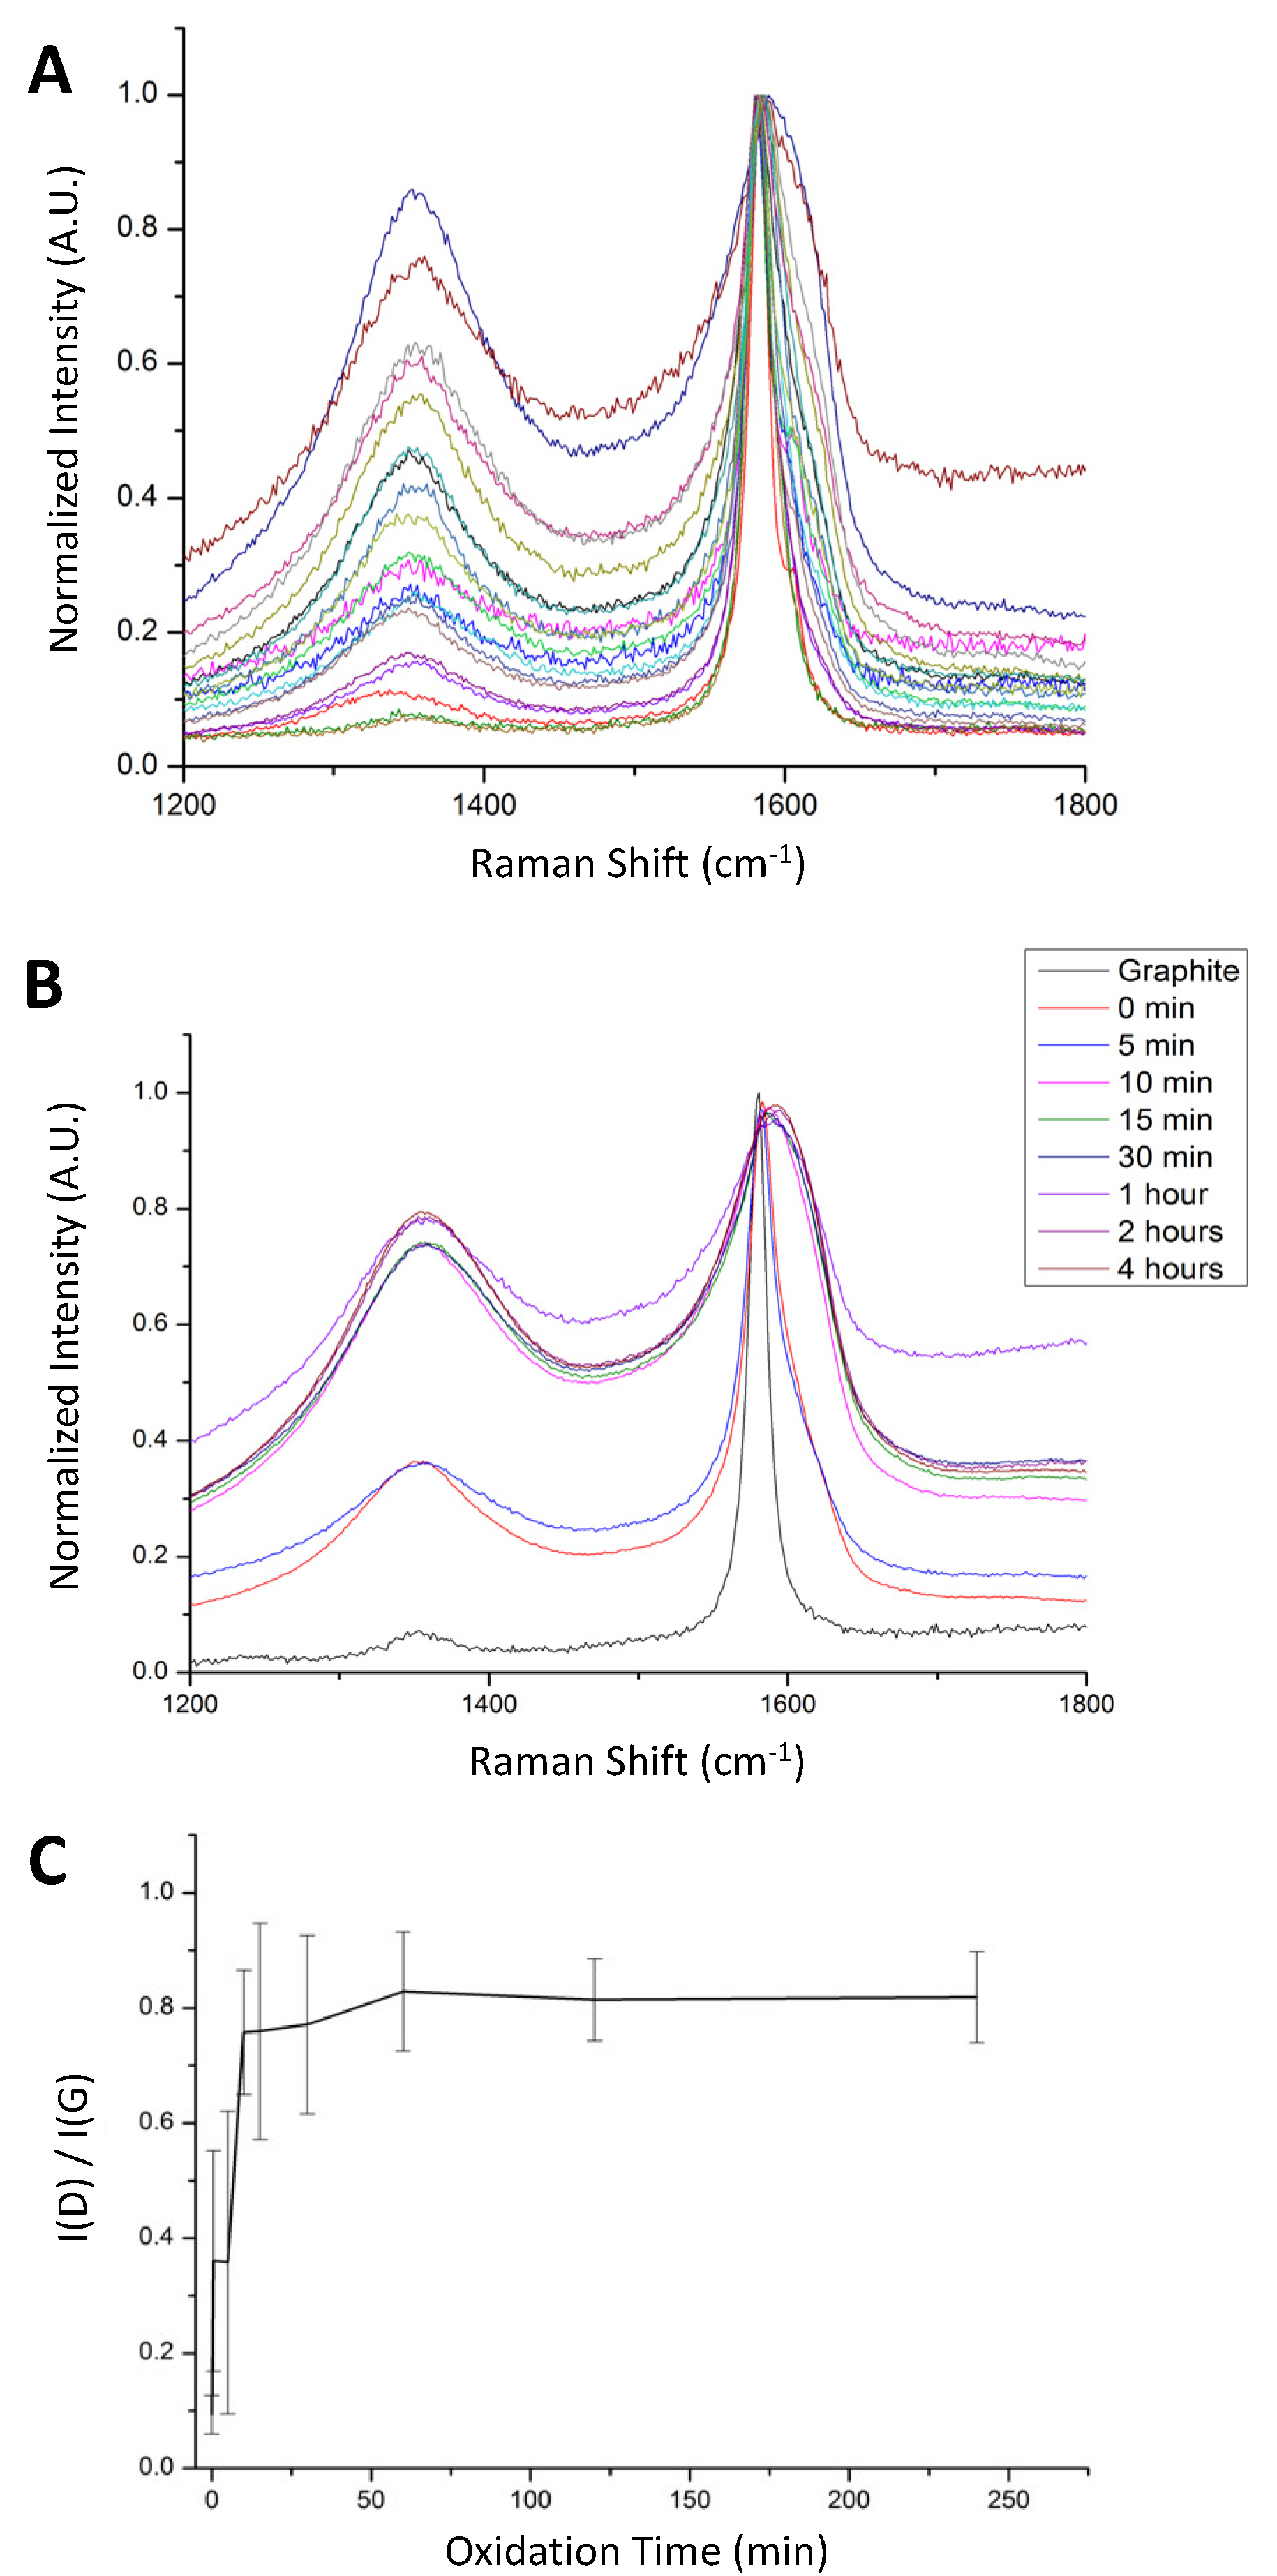
Raman spectroscopy allowed us to monitor the disruption of the sp
2 carbon network in the graphite samples as oxidation proceeded. Raman spectroscopy is an important technique for characterizing GO, and comparing the intensity of the D-band, I(D), that corresponds to a disrupted sp
2 network [
24], with the G-band, I(G), that corresponds to an intact sp
2 network, indicates the degree of graphene functionalization [
25]. As shown in
Figure 1A, spectra from different regions of a single GO sample spread on a glass surface shows a broad range of I(D)/I(G) values. The sample shown was taken immediately after adding the oxidant and worked up by standard techniques and named the 0-min oxidation time sample. Within this single sample, some regions appeared to consist mainly of pristine graphite with no observable D-band, while other regions showed a D-band nearly as intense as the G-band, indicating that oxidation occurred quickly in some sheets but very slowly in others.
Previous studies by Dimiev and Tour [
25] proposed that the oxidation of graphite flakes starts at the edges and works in, meaning that the oxidation of individual graphene sheets is not immediately uniform. That mechanism would predict that different regions of a GO sheet would give rise to different Raman spectra, but would not necessarily predict that different sheets within the same GO sample would give very different I(D)/I(G) values. Recognizing that within the same batch of GO there is a large variety of material is of critical importance for application studies using GO. This variation in the degree of oxidation as a function of time was investigated by comparing the Raman spectra of samples taken at different reaction times. For each sample, Raman spectra were obtained from multiple regions and averaged.
Figure 1B shows the averaged results using aliquots taken from 0 to 4 h. The increase in the intensity of the D peak relative to the G peak with increasing oxidation time would be expected as the oxidation proceeds [
5]. However, the increase was observed to level out, reaching a maximum after approximately thirty minutes, suggesting that the disruption of the sp
2 carbon network was largely finished within the first thirty minutes of oxidation.
Additionally, not necessarily expected was the increase in uniformity of the GO with increasing reaction time. A plot of I(D)/I(G) as a function of oxidation time, shown in
Figure 1C, shows a steady increase in the formation of defects with time and a concurrent decrease in the variation within each sample. Although it has long been understood that there is a range of oxidation extents within each GO sample [
26,
27], this is the first time the heterogeneity has been shown to decrease with increased oxidation time.
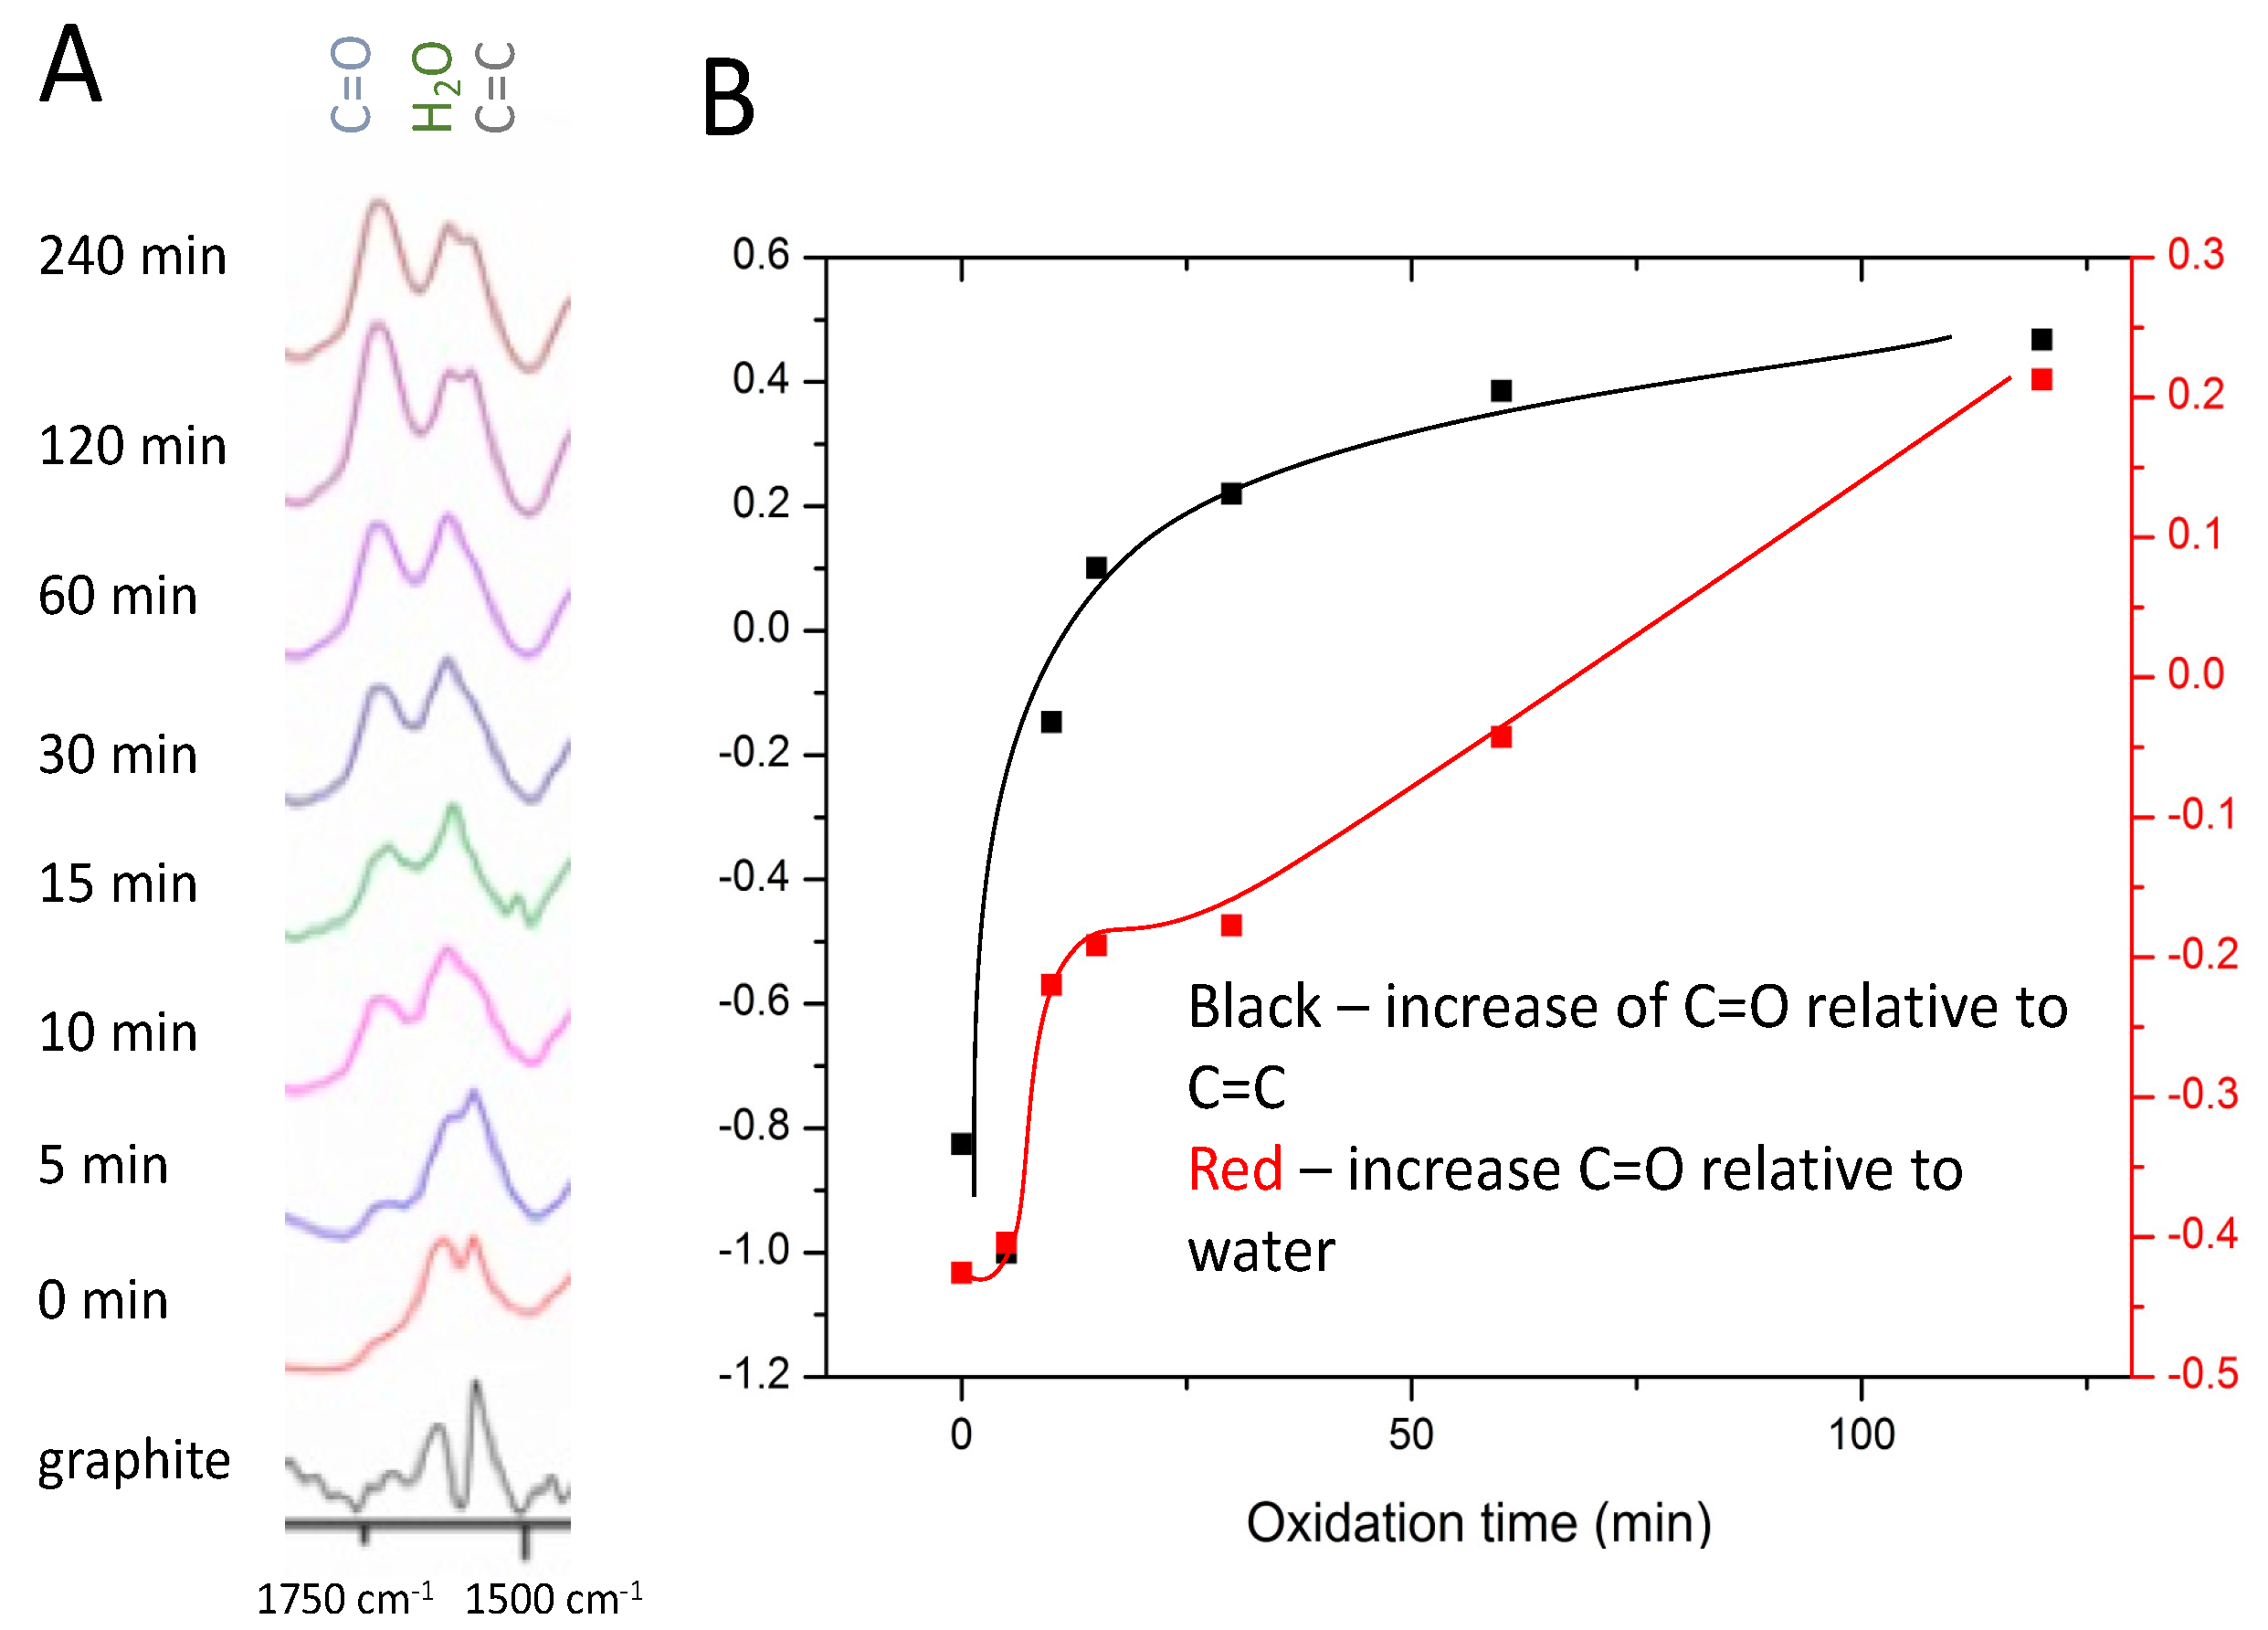
While the Raman spectra showed a plateauing of oxidation extent after approximately 30 min, FTIR spectra indicated a continued evolution of the functional groups. This continued for up to 120 min, as shown in
Figure 2A. It is important to note that natural flake graphite can contain numerous peaks in the FTIR, as per previous studies [
28]. Of those peaks, we concentrated on three: a peak at approximately 1550 cm
−1 assigned to sp
2 hybridized C=C in-plane vibrations [
29], a peak at approximately 1730 cm
−1 assigned to non-conjugated carboxylic carbonyl stretching [
30,
31], and a peak at approximately 1620 cm
−1 assigned to water [
32].
The evolution of the three functional groups relative to one another was investigated by plotting the slope of a line between the peak maxima of two peaks versus time to give a relative comparison of the growth (or decline) of the functional groups. The approach employed to generate the plot shown in
Figure 2B is described in more detail in
Figure S1.
The black line in the plot shown in
Figure 2B shows the decline of sp
2 C=C groups at 1550 cm
−1 relative to the increase in carboxylic carbonyl groups at 1730 cm
−1 during the reaction. The relative change was initially rapid, slowing after approximately 30 min, reflecting our results from Raman spectroscopy. The water peak at 1620 cm
−1 in
Figure 2A initially appeared as a small shoulder at 0 and 5 min but was fully resolved from 10 min onward, eventually surpassing the height of the carbon-carbon double bond peak. The peak at 1620 cm
−1 was used as an indication of the amount of water in the GO [
33]. Surprisingly, a comparison of the water and the carbonyl peaks, shown by the red line in
Figure 2B, showed an increase with time of carbonyl relative to water. This increase occurred in stages, with the rate of increase being fast initially, slowing to near zero from approximately 20 to 30 min, then steadily increasing after 30 min.
The observed decrease in the slope of the red line after approximately 30 min has more than one possible explanation. The first possibility is that both the carbonyl and the water content are increasing with increasing oxidation time. This would mean that the initially fast relative change and leveling off of the red line at approximately 30 min indicates changing relative rates rather than growth of one peak with the other declining. Another possibility is that hydrophilic hydroxyl groups are being replaced with less hydrophilic carbonyl groups, resulting in less water content in the GO as the oxidation proceeds. The positive slope of the black line beyond 30 min would thus be a result of an increase of carbonyl at the expense of hydroxyl groups rather than continued oxidation of the sp2 network. This would correlate with the Raman spectra plateauing after 30 min, suggesting that while the disruption of the conjugated carbon network by oxidation may be largely finished after 30 min, the type of oxygen functional groups continues to change.
The observed plateau in the overall extent of oxidation was also corroborated by thermogravimetric analysis, TGA, as shown in
Figure S2. The precursor graphite does not decompose at temperatures below 600 °C, but significant weight loss occurred for GO samples even after very short oxidation times due to the loss of adsorbed water and beginning and labile oxygen functional groups. Longer oxidation times further increased the weight loss but with only small increases after 15 min. This observation correlates well with the Raman spectra shown in
Figure 1, with little change observed after approximately 30 min. It further suggests, by comparison to FTIR results, that the number of oxygen functional groups in the GO had stabilized after 15 to 30 min, although it is not until approximately 60 min that the TGA curves began to lie on top of one another. Before that, higher temperatures were required to decompose a certain fraction of the GO, a result that might be expected as the decomposition temperature of isolated carboxyl groups would be lower than for conjugated ketones.
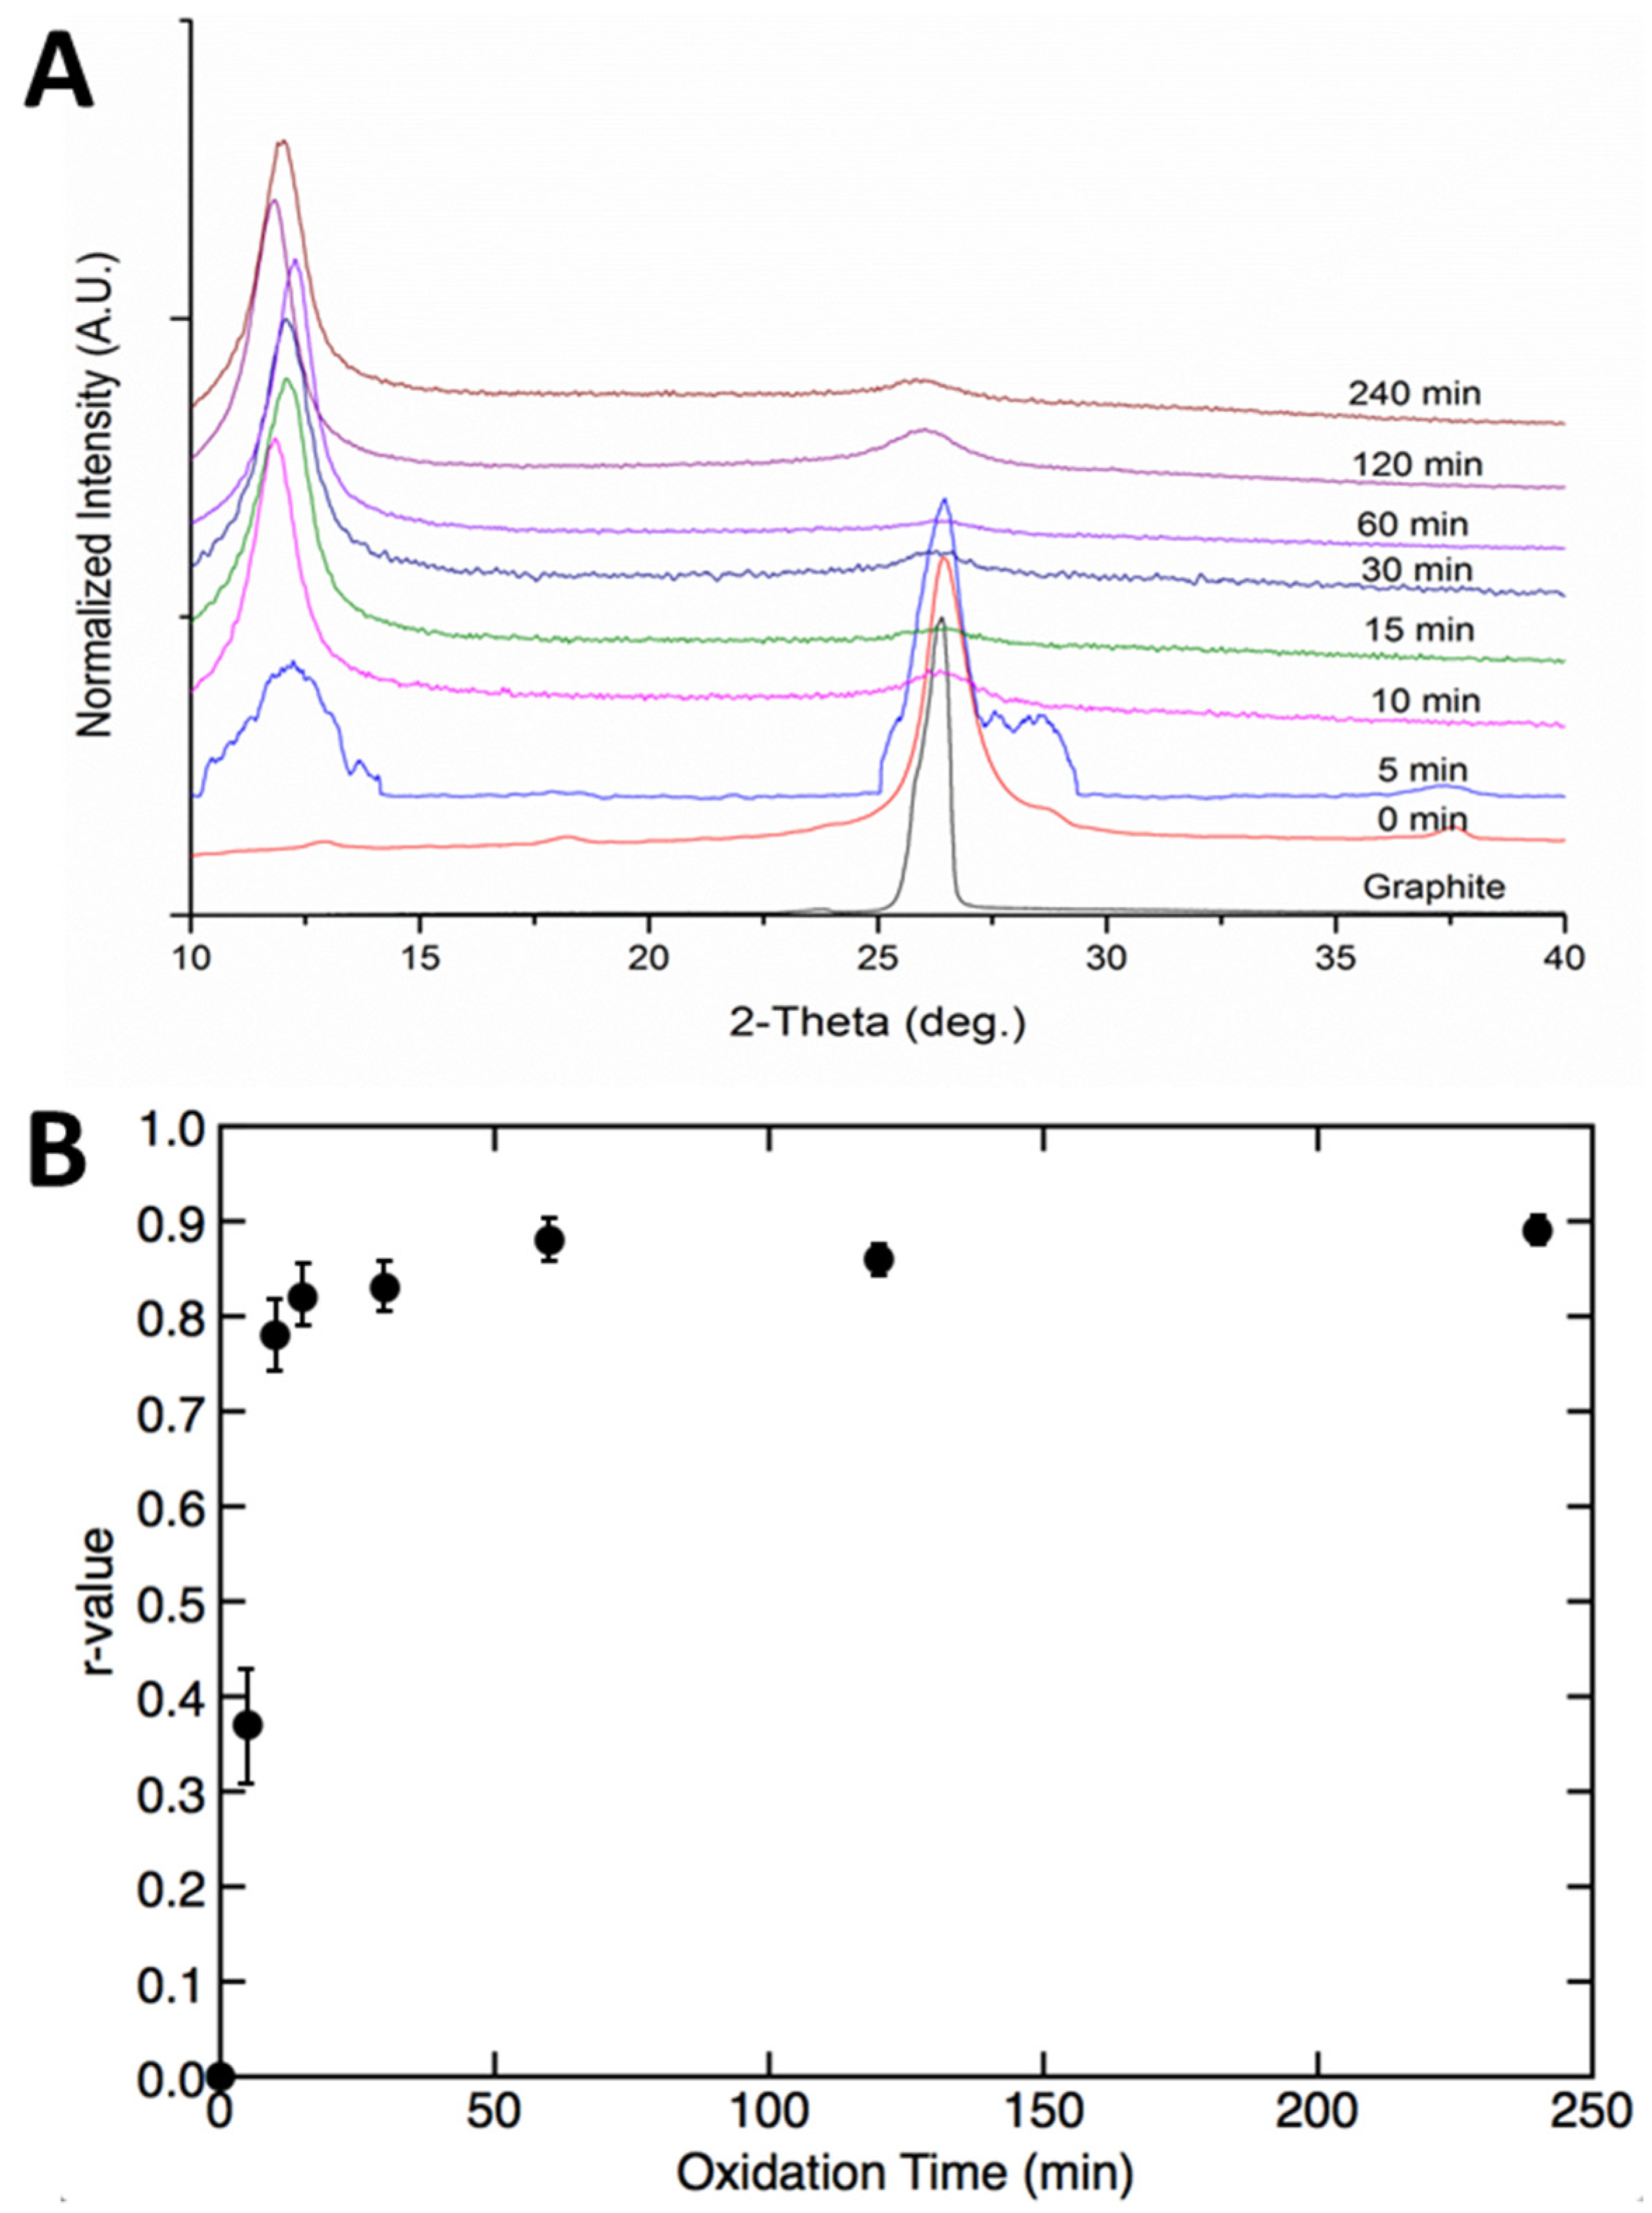
Further evidence that the introduction of oxygen functional groups to the sp
2 network had largely stopped after 30 min came from the change in interlayer spacing with time. X-ray diffraction (XRD) was used to determine the spacing present in samples removed at various times, and the results are shown in
Figure 3A. The initial graphite sample showed a sharp peak located at a 2θ value of 26.8°, corresponding to a distance between adjacent sheets of 3.34 Å. Oxidation quickly led to a change in sheet spacing, with the XRD pattern of the 0 min sample (sample was taken as quickly as possible following the addition of the oxidizer) already showing a broadened peak. The introduction of oxygen groups and sp
3 hybridized carbon caused an increase in sheet spacing and the appearance of a new peak associated with GO [
32].
The XRD pattern of GO after five minutes of oxidation appeared to be an outlier. A new peak at a lower 2θ value of 10–13°, known as the GO peak and corresponding to a d-spacing of 6.5–8 Å, had begun to emerge but was ill-defined and broad. More surprisingly, the peak associated with pristine graphite showed a significant broadening and the appearance of a shoulder. This result was confirmed after repeating the reaction and measurement several times. While the cause of the high 2θ value shoulder was not entirely clear, we suspect it was a result of incomplete diffusion of the oxidizer, causing splaying of the sheet edges at early times. Previous work [
26] reported that after adding the first weight equivalent of oxidizer to graphite, a broad curve between 15 and 28° 2θ appeared, indicating the formation of an amorphous phase. While that study analyzed material that was not worked up in aqueous solution, our study analyzed material that had been worked up with conventional aqueous quenching. Thus, while the absolute value of the spacing was expected to be different, the oxidation conditions were comparable. Further oxidation time in our sample resulted in a sharpening of the 10–13° 2θ peak associated with GO, and a steady disappearance of the initial graphite peak. This was also consistent with the findings of the previous study employing their unquenched GO, where additional equivalents of oxidizer sharpened the XRD GO peak.
To quantify the extent of GO formation with time, we compared, within each sample, the XRD peak areas arising from unmodified graphite and oxidized graphite. We plotted the r-value versus oxidation time, where r = A
GO/(A
GO + A
G), with A
GO being the area of the GO peak, and A
G the area of the graphite peak [
5]. This plot is shown in
Figure 3B and corresponds well with the plot derived from the I(D)/I(G) ratios of the Raman spectra shown in
Figure 1C. This plot of oxidation versus time suggests much faster oxidation than expected based on the oxidation times typically reported in the literature.
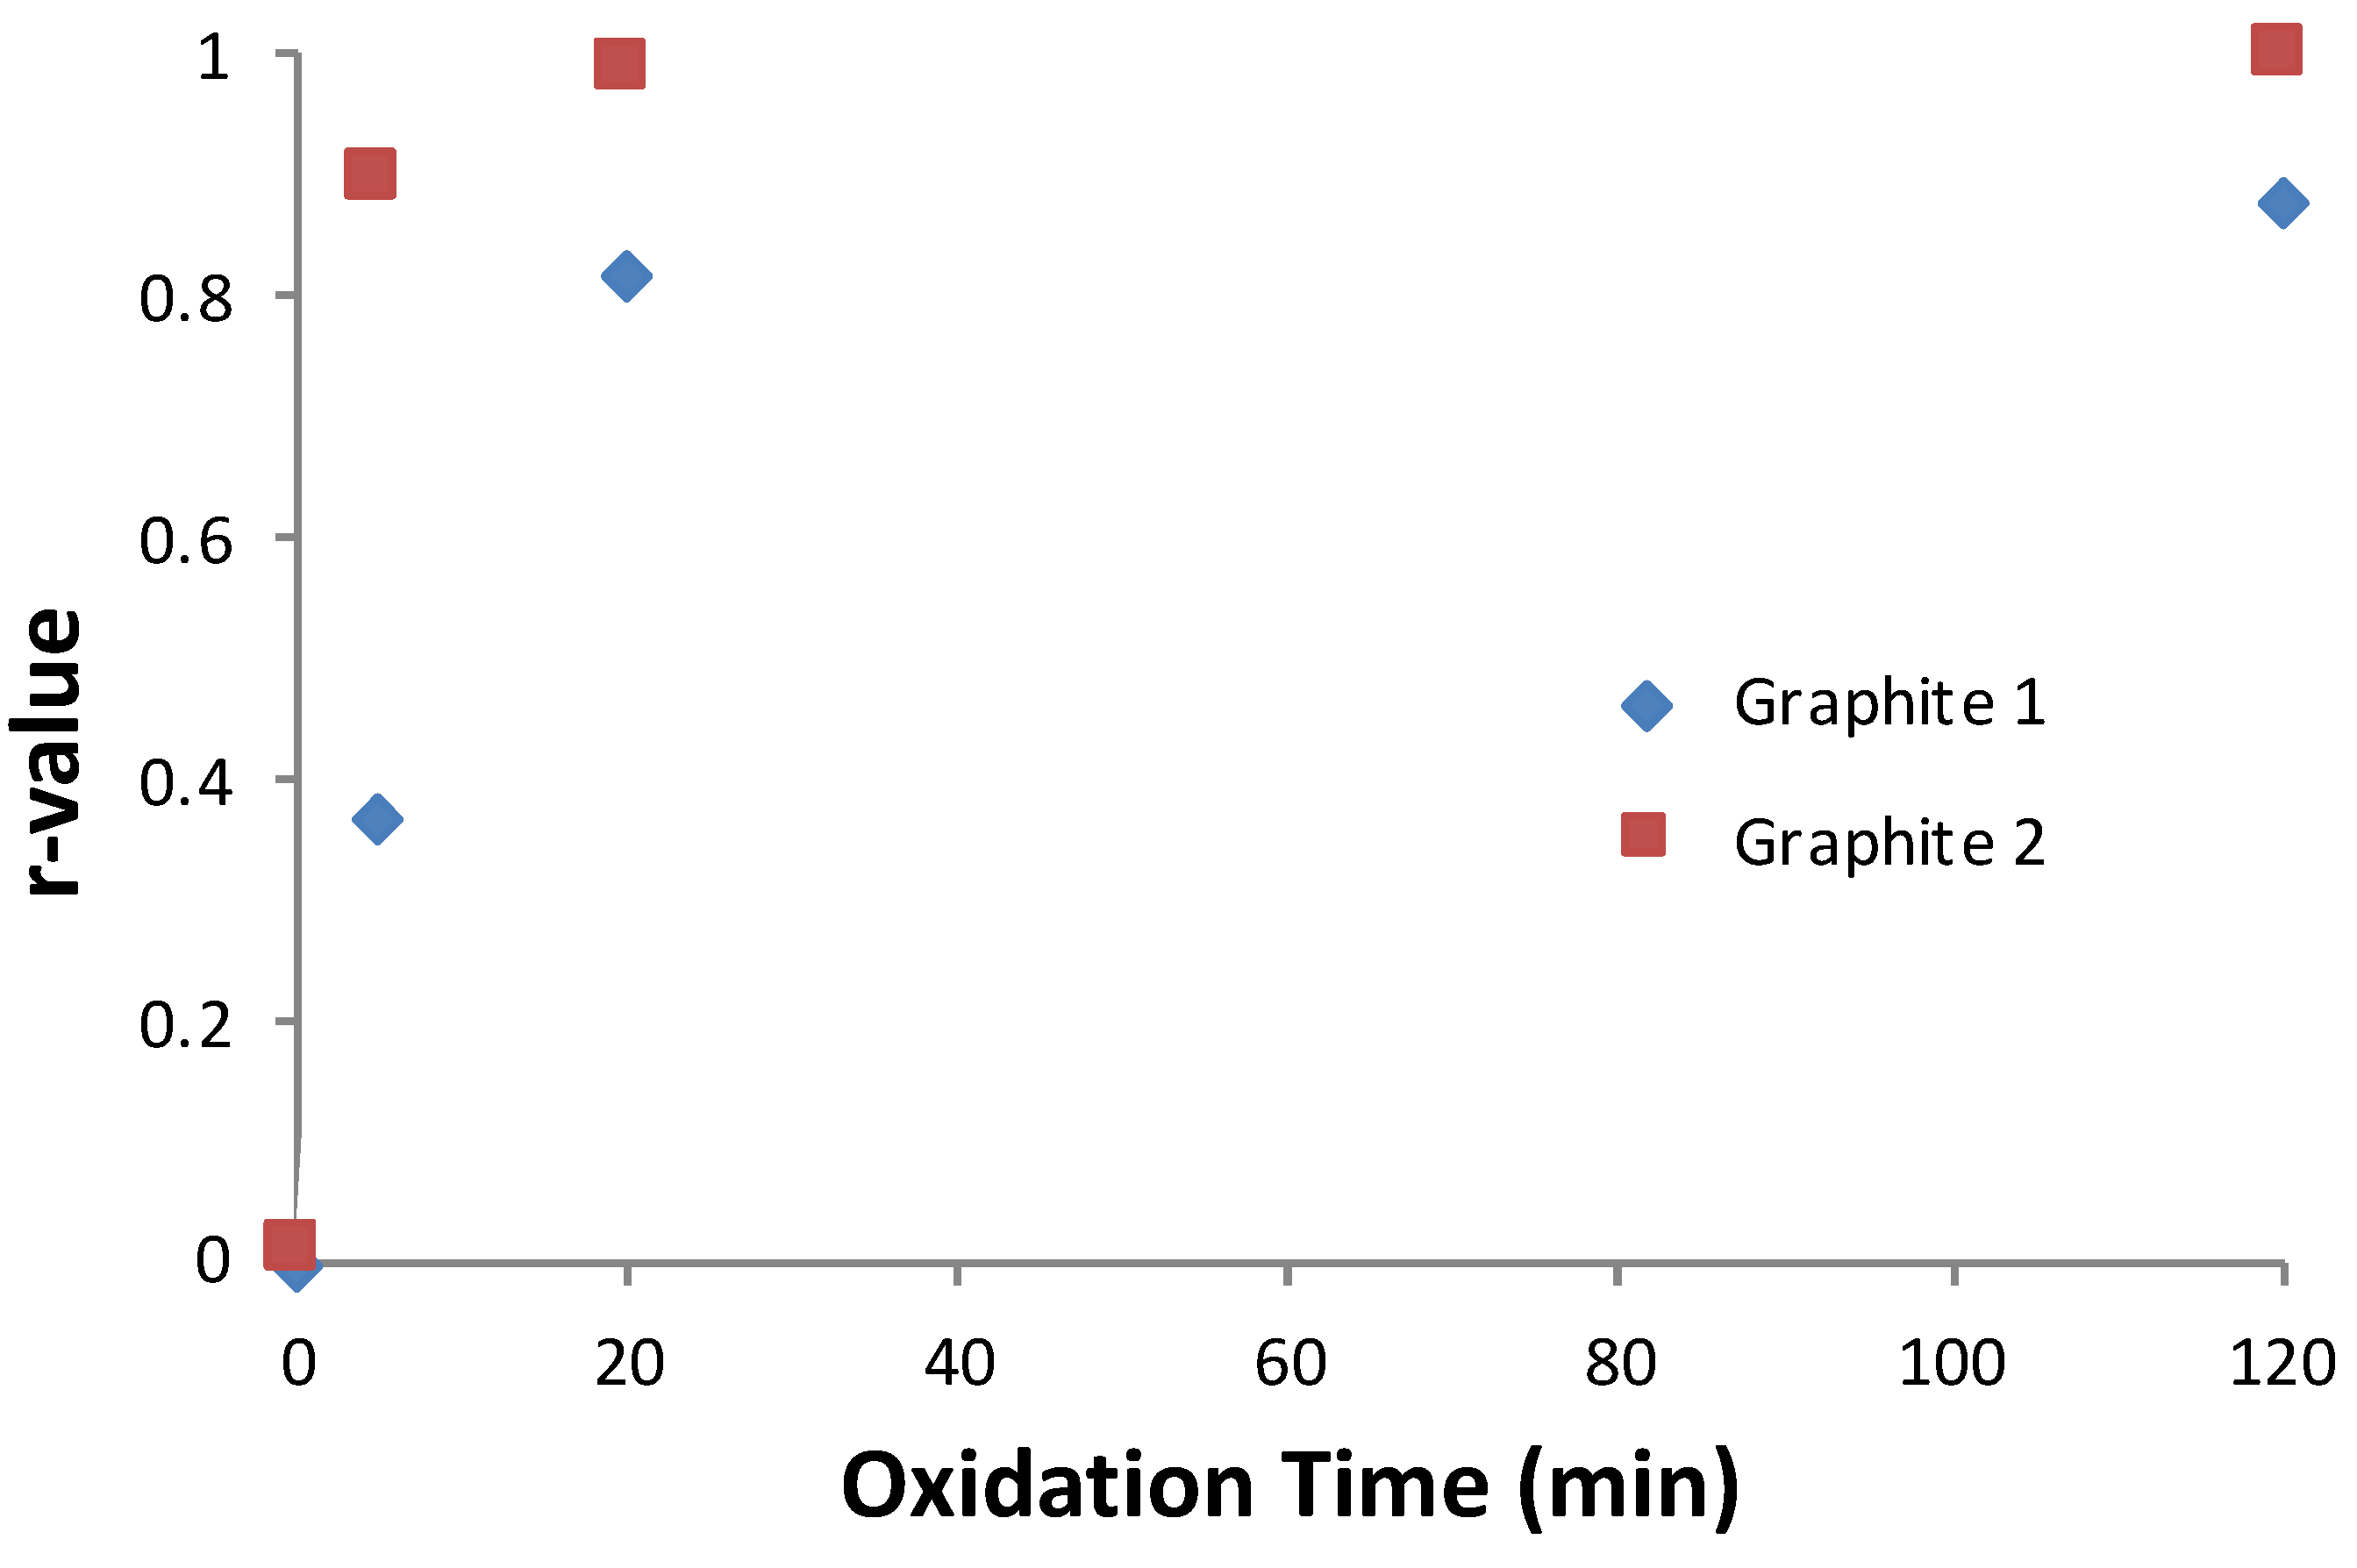
How this oxidation rate varied with graphite flake size was investigated using the same approach of plotting an r-value vs. time for graphite with different flake sizes. Based on the mechanism of oxidant diffusion, one would expect to find a difference.
Figure 4 demonstrates the effect of changing the graphite flake size. Here, graphite 1 (50 µm average size) and graphite 2 (15 µm average size) were used as the starting material in the oxidation. By changing the graphite and keeping other oxidation variables the same, we observed that the smaller flake graphite reached the plateau sooner than the larger flake. Additionally, the smaller graphite flake obtained a significantly higher r-value. The 15 µm graphite oxidized to an r-value of approximately 0.90 within 5 min and reached a value of 0.99 by 20 min. In contrast, the larger 50 µm graphite reached an r-value of only ~0.4 after 5 min, and within 20 min began to plateau near an r-value of 0.8, indicating a greater dispersity of sheet spacing.
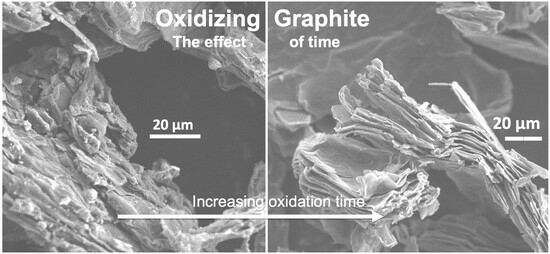
SEM images, shown in
Figure S3, support the X-ray diffraction data, suggesting that a rapid change in the structure of the graphite occurred during the early oxidation. Untreated graphite appeared to have even and uniform sheet edges, but immediately upon the addition of the oxidizing agent, the basal plane became wrinkled and distorted. The edges of the sheets also appeared less even and contained both bunched and spaced regions. This trend continued through longer oxidation times, producing more uniform basal plane deformations and uncorrelated edges.
A visual analysis of the effect of oxidation time was also informative. One milligram of GO sample, each from different reaction times were sonicated separately in 3 mL of DI water for fifteen minutes. Photographs of these suspensions, taken immediately after sonication and after five days of settling, are shown in
Figure S4. As can be seen, the pristine graphite settles, and the resulting 0-min and 5-min samples appear far less dispersed than the others. The degree of GO dispersion increases with oxidation time, suggesting that the hydrophilicity increases with oxidation time. These results also suggest that after approximately 10 min, the rate of graphite modification by oxidation slowed.


