Review

Proposed Methods for Testing and Comparing the Emulsifying Properties of Proteins from Animal, Plant, and Alternative Sources

1
Department of Food Science, University of Massachusetts, Amherst, MA 01003, USA
2
Department of Food Science and Bioengineering, Zhejiang Gongshang University, 18 Xuezheng Street, Hangzhou 310018, China
*
Author to whom correspondence should be addressed.
Colloids Interfaces 2022, 6(2), 19; https://doi.org/10.3390/colloids6020019
Submission received: 9 February 2022 / Revised: 12 March 2022 / Accepted: 21 March 2022 / Published: 24 March 2022
(This article belongs to the Special Issue Biocolloids and Biointerfaces)

Abstract

:
The food industry is trying to reformulate many of its products to replace functional ingredients that are chemically synthesized or isolated from animal sources (such as meat, fish, eggs, or milk) with ingredients derived from plant or microbial sources. This effort is largely a result of the demand for foods that are better for the environment, human health, and animal welfare. Many new kinds of plant- or microbial-derived proteins are being isolated for potential utilization as functional ingredients by the food industry. A major challenge in this area is the lack of standardized methods to measure and compare the functional performance of proteins under conditions they might be used in food applications. This information is required to select the most appropriate protein for each application. In this article, we discuss the physicochemical principles of emulsifier functionality and then present a series of analytical tests that can be used to quantify the ability of proteins to form and stabilize emulsions. These tests include methods for characterizing the effectiveness of the proteins to promote the formation and stability of the small droplets generated during homogenization, as well as their ability to stabilize the droplets against aggregation under different conditions (e.g., pH, ionic composition, temperature, and shearing). This information should be useful to the food industry when it is trying to identify alternative proteins to replace existing emulsifiers in specific food applications.

Graphical Abstract

1. Introduction

An important trend in the modern food industry is the creation of foods designed to reduce the negative impacts of the food supply on the environment, human health, and animal welfare [1,2,3]. A major thrust in this area is the replacement of animal-derived ingredients (such as those from meat, fish, eggs, or milk), with those from alternative sources (such as plants, algae, and microbes) [4,5,6]. Proteins are one of the most versatile functional ingredients found in foods and so there is a strong focus on finding alternatives to animal proteins [4,7]. Animal proteins may be naturally present within whole foods (such as meat, fish, eggs, or milk) or they may be isolated and used as functional ingredients (such as gelatin, lysozyme, caseinate, or whey proteins) [3]. These proteins make important contributions to the desirable physicochemical, textural, and sensory attributes of many foods due to the diverse range of functional attributes, such as emulsification, foaming, thickening, gelling, structure forming, water holding, and oil retention [7]. Moreover, they contribute to the nutritional content of foods by providing calories and essential amino acids [8]. Consequently, it is important that any alternative proteins provide the same desirable functional and nutritional attributes as animal proteins. Proteins derived from animals, such as those isolated from milk (casein and whey protein), egg (ovalbumin), and meat (gelatin) are commonly used as emulsifiers in the food industry because they are amphiphilic molecules that can adsorb to oil-water interfaces, reduce the interfacial tension, and protect the oil droplets from aggregation. One of the major challenges in this area is that there are no widely recognized analytical methods available to measure and compare the functional attributes of animal and alternative proteins under conditions where they may be used in real food applications. As a result, it is difficult to select an alternative protein to replace an animal protein in specific food products.
In this article, we propose a series of analytical tests that can be used to characterize the ability of alternative proteins to form and stabilize emulsions. We also propose a standardized format for presenting the data from these tests so that the functional performance of different proteins can be compared under similar conditions. This is important because the ability of proteins to form and stabilize oil-in-water emulsions is critical in many kinds of food products. For instance, proteins can be used as emulsifiers in soft drinks, coffee creamers, dressings, sauces, desserts, and nutritional beverages, as well as in meat, egg, and dairy analogs [3,9]. Moreover, they can be used as emulsifiers in emulsion-based delivery systems, such as those used to encapsulate, protect, and deliver hydrophobic bioactive agents like oil-soluble vitamins, omega-3 lipids, and nutraceuticals [10,11].
Typically, protein-based emulsifiers must perform two important functions when creating emulsions [12,13]. First, they should rapidly adsorb to the surfaces of the oil droplets generated during homogenization, thereby forming small protein-coated oil droplets. Second, they should protect the oil droplets from aggregation during food production, storage, distribution, and utilization. In some foods, however, controlled droplet aggregation is desirable because it leads to a highly viscous or gelled product with desirable textural attributes (e.g., desserts, yogurts, and cheeses). Consequently, standardized methods are needed to characterize both the emulsion forming and emulsion stabilizing properties of alternative proteins. This information could then be utilized to select the most appropriate protein for a specific application.
In this article, we begin by discussing the physicochemical principles of emulsifier performance and then present a series of protocols that can be used to characterize the composition and functionality of protein-based ingredients.

2. Physicochemical Principles of Emulsifier Performance

Protein-based emulsifiers should be able to facilitate the formation of emulsions and enhance their stability (Figure 1). In this section, we therefore provide an overview of the physicochemical basis for the ability of emulsifiers to form and stabilize oil-in-water emulsions. This knowledge is important when establishing an appropriate analytical protocol to characterize and compare the performance of different alternative emulsifiers.

2.1. Formation of Emulsions

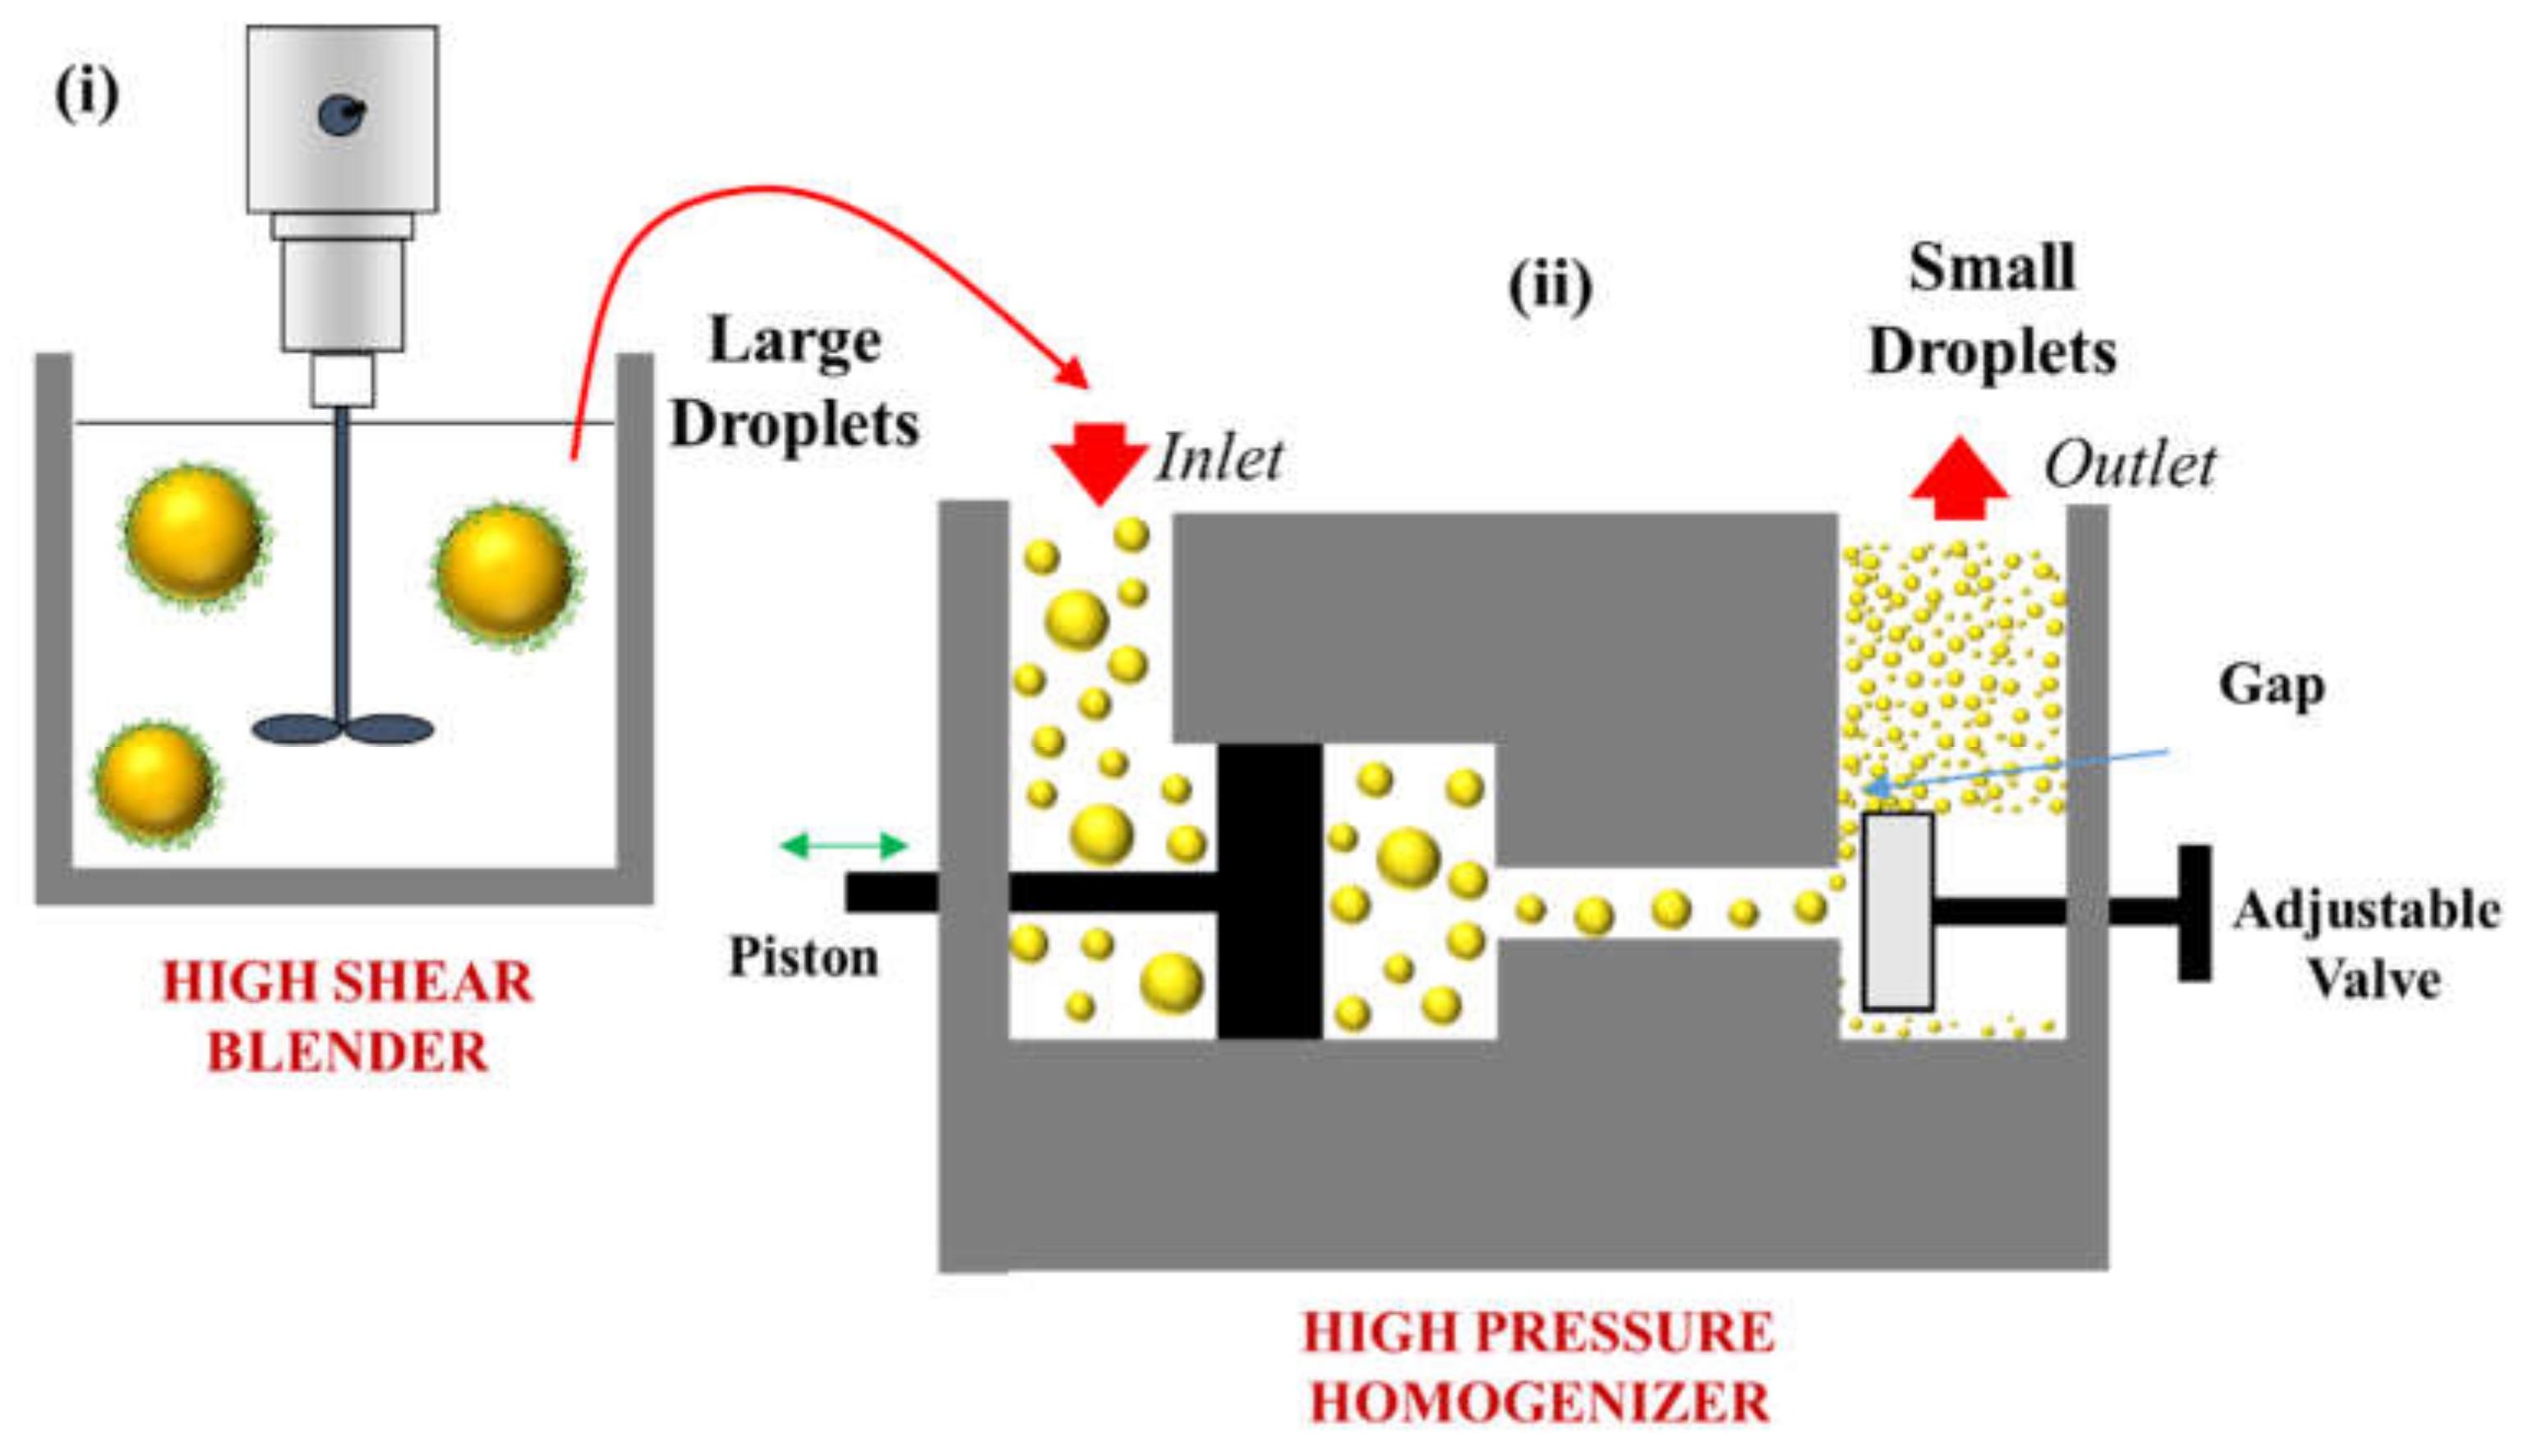
2.1.1. Principles of Homogenization

Protein-stabilized emulsions are usually formed by homogenizing oil and water phases using a mechanical device known as a homogenizer [14,15]. Homogenizers are designed to breakup and intermingle the oil and water phases, as well as to reduce the size of the oil droplets [16,17]. Proteins are normally dissolved or dispersed in the water phase prior to homogenization because their outer surfaces are predominantly hydrophilic (although they also need to have some exposed hydrophobic groups to make them surface active, but not too many or they will tend to aggregate). Various kinds of homogenizers can be used to form oil-in-water emulsions, including high-shear blenders, colloid mills, high-pressure valve homogenizers (HPVHs), microfluidizers, and sonicators [16,17,18]. Within each of these categories there are different instrument designs, and each type of instrument can be operated differently (e.g., energy intensity, duration, and temperature). This makes it challenging to develop standardized test protocols because different laboratories have access to different homogenizers. Significant advances have been made towards understanding the fundamental transport phenomena govering the mechanisms of droplet formation during homogenization processes, including interfacial tension, inertia, and viscous force effects [16]. Nevertheless, more research is still required to understand the relative importance of different physical processes in different homogenizers. In the future, it would be advantageous to establish standardized operating conditions for each kind of homogenizer that would make the results comparable with other types of homogenizers.
Most homogenizers can be used to produce oil-in-water emulsions using proteins as emulsifiers. Nevertheless, there are some factors that should be considered when selecting the most appropriate one for a specific application. Proteins can be hydrolyzed, denatured, and/or aggregated within homogenizers as a result of the intense local temperatures and pressures generated, which may adversely impact their ability to form and stabilize emulsions [19]. This is especially true when emulsions are homogenized at high energy intensities for long times [20]. Proteins may also become denatured and aggregated during homogenization because they adsorb to oil-water interfaces and undergo conformational changes due to the alteration in their local thermodynamic environment [21,22,23,24]. It is therefore important to consider any potential adverse effects of homogenization on protein functionality when selecting an appropriate test for characterizing their ability to form emulsions.

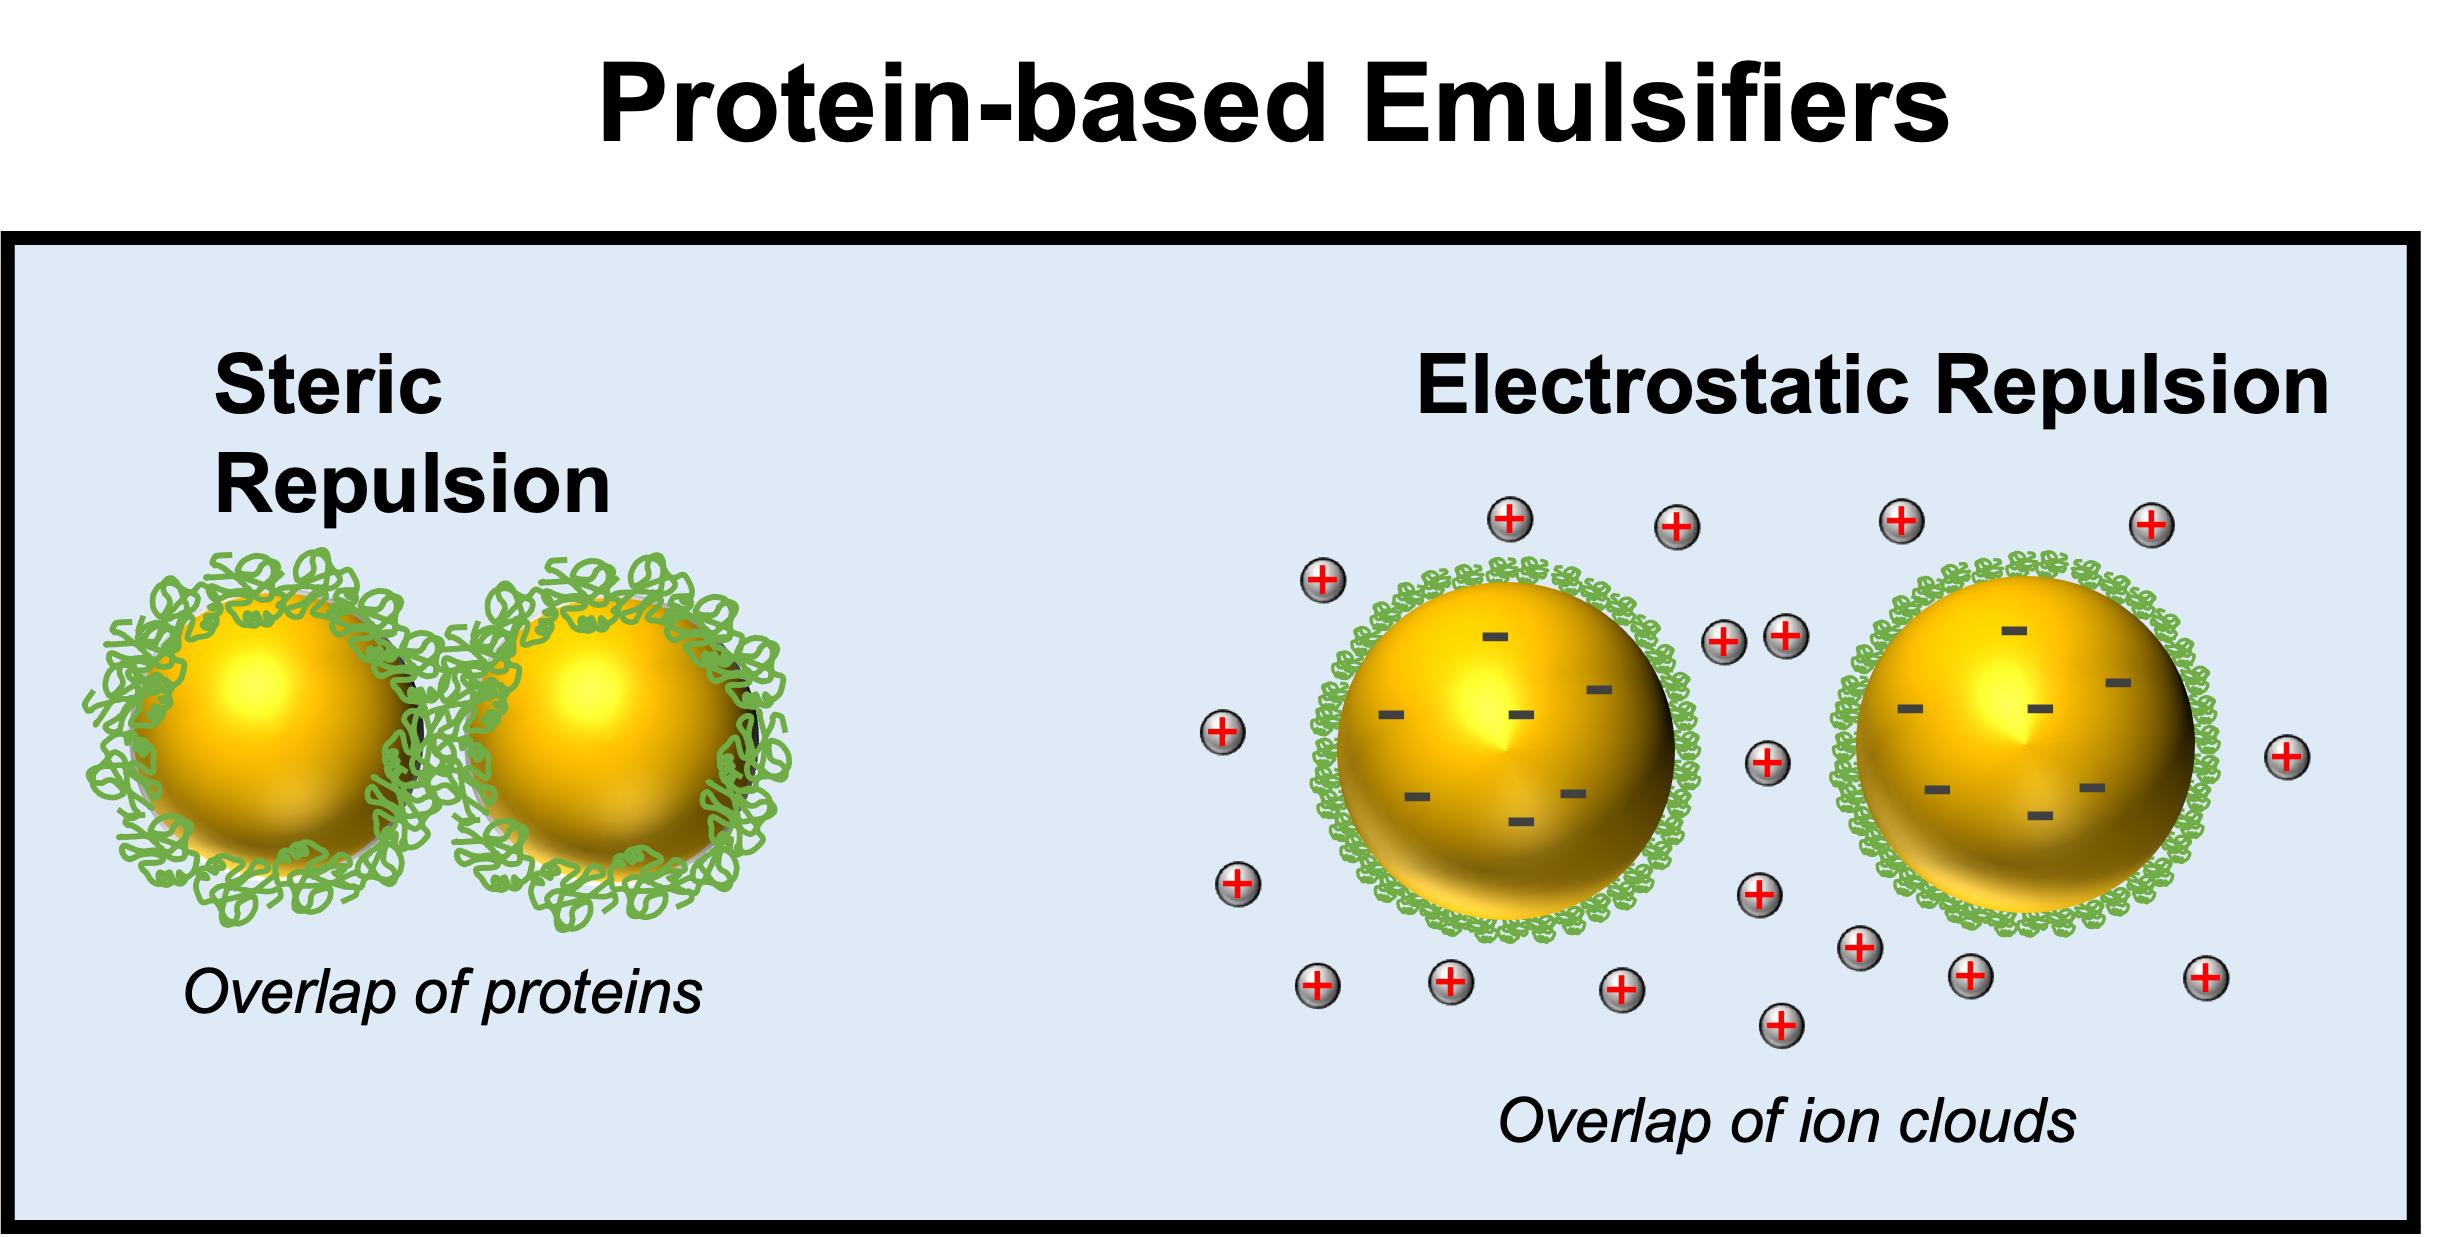
2.1.2. Role of Emulsifier in Emulsion Formation

In this section, the impact of the properties of protein-based emulsifiers on the size of the oil droplets produced during homogenization is considered (Figure 2). We use a HPVH as an example as this kind of homogenizer is the most widely used in industry for producing food emulsions (Figure 3). It should be noted, however, that similar physicochemical events occur inside other types of homogenizers during emulsion formation [15,18].
Initially, the protein should be dissolved or dispersed in the water phase because the surfaces of most food proteins are predominantly hydrophilic. Ideally, the protein should be completely dissolved in the water phase, as this improves its functional performance. In many cases, however, proteins are not completely soluble in water and so there may be a fraction in a molecular form and another fraction in a particulate form. The ratio of these two fractions in a protein ingredient will impact its ability to form emulsions. For this reason, researchers often centrifuge and/or filter protein dispersions prior to homogenization to remove the insoluble fraction [25]. Alternatively, the relative amounts of the soluble and insoluble fractions could be measured and reported.
Sometimes, particulate forms of proteins are used to create emulsions [26]. In this case, protein particles adsorb to the droplet surfaces rather than protein molecules, and the resulting colloidal dispersions are referred to as Pickering emulsions. Typically, the oil droplets produced using protein particles are much bigger than those produced using protein molecules [27], which is unsuitable for some applications because they would rapidly cream (e.g., soft drinks, plant-based milks, or nutritional beverages). Conversely, the resistance of protein-coated oil droplets to coalescence is much higher for particle-based than for molecular-based protein emulsifiers [28,29]. In summary, it is important to characterize the aggregation state of the proteins being tested when forming emulsions.
Typically, the oil phase and protein-containing water phase are then blended using a high-shear blender to form a coarse emulsion (Figure 3), which commonly contains quite large oil droplets (d > 2 μm). After this process, some of the protein will be adsorbed to the surfaces of the oil droplets and some of it will remain in the water phase surrounding them (Figure 2). The coarse emulsion is then poured into the inlet of a HPVH, which uses a pump to force it through a narrow orifice under high pressure (Figure 3). As the emulsion passes through the orifice it experiences a large reduction in pressure, which generates a complex mixture of disruptive stresses, including cavitation, turbulence, and shear stresses, which cause fragmentation of the large oil droplets [16,30]. The size of the oil droplets generated within the homogenizer depends on the balance between these disruptive stresses and interfacial restoring effects, such as the Laplace pressure [31,32].

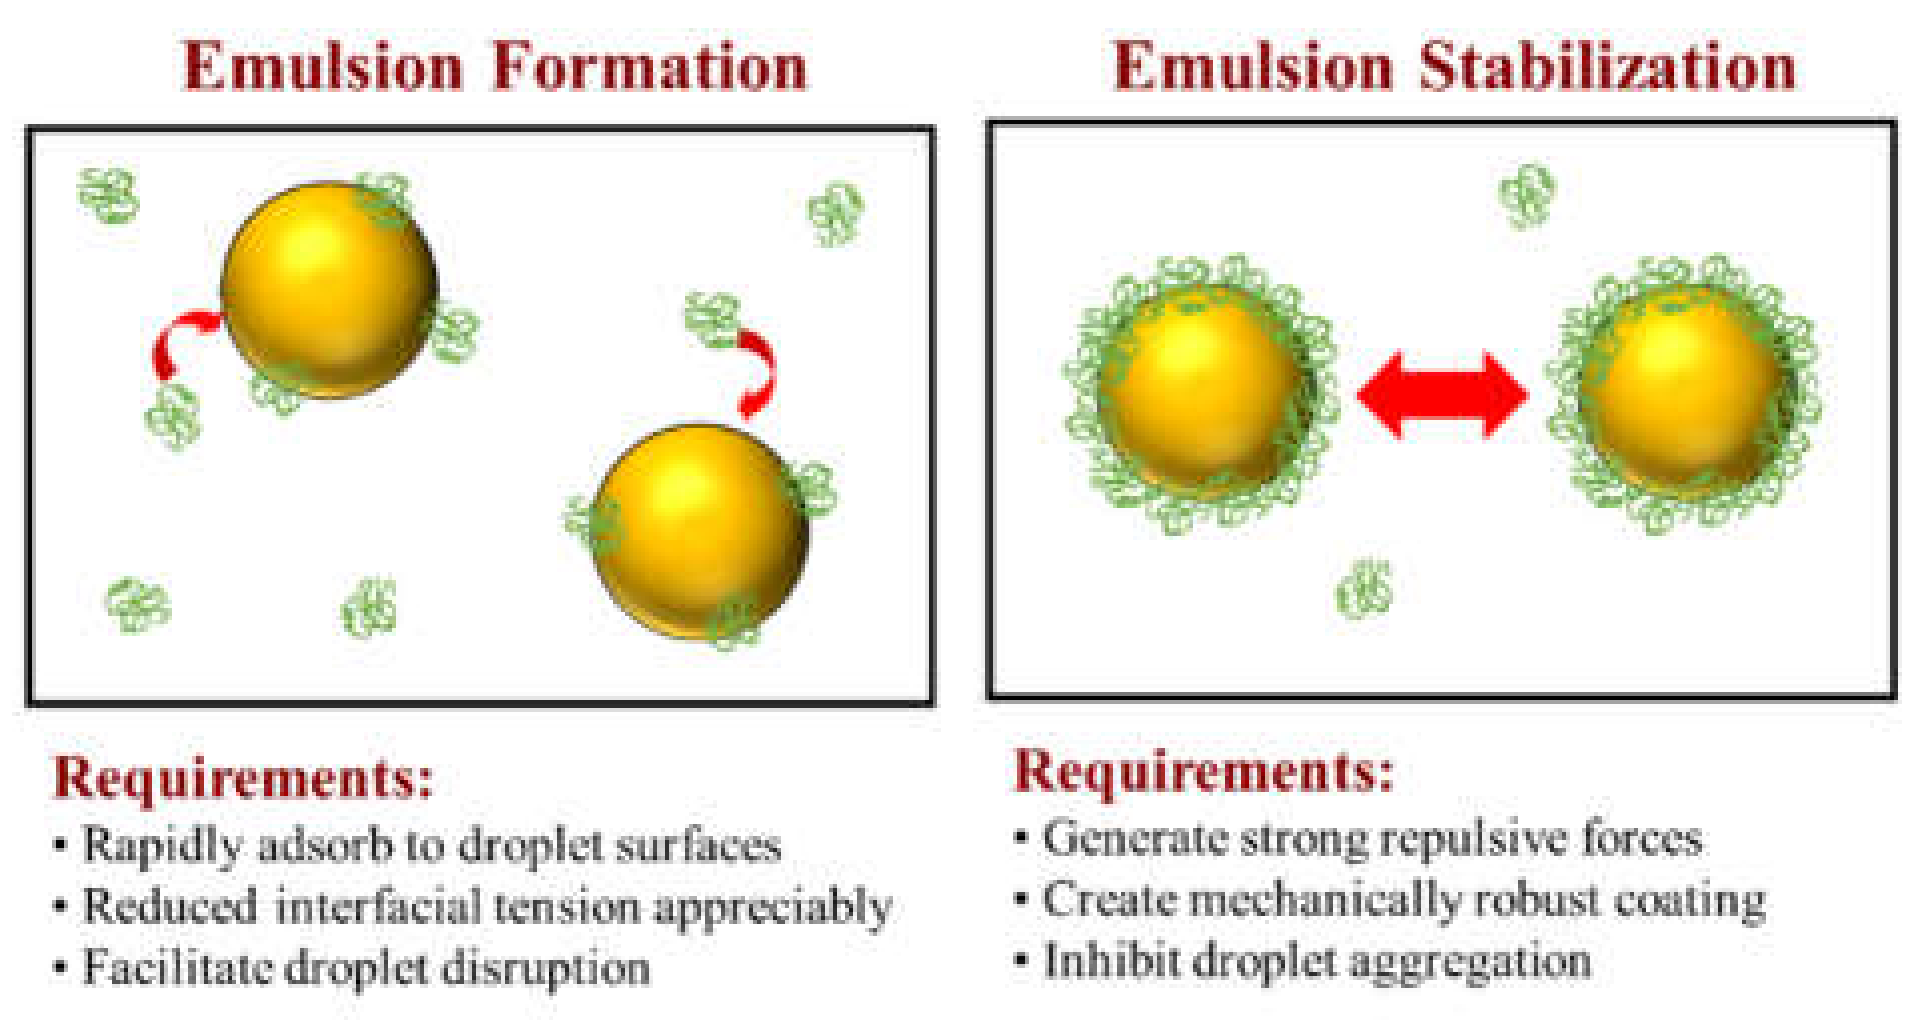
Promotion of Droplet Disruption

The interfacial restoring stresses are a result of the positive free energy associated with the thermodynamically unfavorable contact between oil and water molecules at the droplet surfaces, which arises because of the hydrophobic effect [18]. As a result, oil droplets have a strong tendency to adopt a spherical shape when dispersed in water because this shape minimizes the contact area between the oil and water phases. To a first approximation, the magnitude of the interfacial restoring effect can be taken to be the Laplace Pressure (ΔPL):
Δ P L = 4 γ d
In this equation, γ is the oil-water interfacial tension and d is the diameter of the oil droplets [33]. Inside a homogenizer, large oil droplets are broken down into smaller ones when the disruptive stresses exceed ΔPL [16,31,32]. Based on Equation (1), one would expect smaller oil droplets to be produced under fixed homogenization conditions when the interfacial tension is lower. This can be achieved by using a more polar oil or by using an emulsifier that can rapidly adsorb to the oil droplet surfaces during homogenization and reduce the interfacial tension by an appreciable amount. In general, the adsorption rate and interfacial tension reduction of proteins depend on their molecular and physicochemical characteristics, such as molar mass, conformation, aggregation state, charge, surface hydrophobicity, as well as environmental conditions such as aqueous phase viscosity and temperature.
The disruptive stresses generated by a homogenizer depend on its design and the operating conditions used (such as homogenization pressure or sonication intensity). If an emulsion is repeatedly exposed to these disruptive stresses (e.g., by continuously passing it through the homogenizer) and there is sufficient emulsifier present, then the size of the droplets will decrease until they reach a certain level where the disruptive stresses balance the interfacial restoring effects. Under these conditions, the droplet size is mainly determined by the disruptive stresses generated by the homogenizer, although emulsifier type does have some effect because it influences the magnitude of the Laplace pressure through the interfacial tension (Equation (1)).

Inhibition of Droplet Coalescence

The size of the oil droplets produced during homogenization also depends on the tendency for coalescence to occur inside the homogenizer [16,34,35,36]. When larger oil droplets are broken down into smaller ones there is an increase in the oil-water interfacial area (Figure 2). Consequently, the surfaces of the newly formed oil droplets are not completely covered with emulsifier molecules. The stability of these emulsions to coalescence inside the homogenizer depends on the rate of emulsifier adsorption relatative to the rate of droplet-droplet collisions [37]. If the oil droplets collide with their neighbors before there is time for their surfaces to be fully covered by emulsifier, then they tend to coalesce with each other, leading to an increase in droplet size [31,38]. Conversely, if the emulsifiers adsorb so quickly that the droplet surfaces are completely covered before they have a chance to collide with their neighbors, they may be stable to coalescence. Of course, it is also important to use a protein-based emulsifier that generates strong repulsive interactions between the protein-coated oil droplets under the solution conditions employed (e.g., pH, ionic strength, or temperature). Otherwise, droplet aggregation may occur even when the droplet surfaces are completely covered by emulsifier.

Factors Affecting Emulsifier Performance

The rate at which proteins adsorb to oil droplet surfaces during homogenization, their effectiveness at reducing the interfacial tension, and their ability to prevent droplet aggregation all depend on the molecular characteristics of the proteins used. For instance, the size, aggregation state, charge, and surface hydrophobicity of proteins are likely to impact their ability to form and stabilize small droplets during homogenization [39]. In the remainder of this section, we examine some of the most important factors that are known to impact the ability of protein-based emulsifiers to form small droplets during homogenization.
Emulsifier concentration: When forming food emulsions, it is important to include enough emulsifier to cover all the small oil droplets generated within the homogenizer, while not including too much, otherwise there may be an increase in ingredient costs and off-flavors. A solution containing a fixed amount of emulsifier can only cover a certain amount of oil-water interface, which depends on the nature of the emulsifier used. The oil-water interfacial area that needs to be covered is governed by the droplet concentration and size. Typically, the amount of emulsifier required to stabilize the droplets increases with increasing droplet concentration and decreasing droplet size. Assuming that the droplet size is limited by the amount of emulsifier present, the smallest droplet diameter that can be reached during homogenization can be described by the following expression [18]:
d m i n = 6 Γ s a t ϕ c s
In this equation, dmin is the surface-weighted mean diameter (d32), Γsat is the surface load of the emulsifier when the droplet surfaces are saturated (in kg m−2), φ is the volume fraction of the disperse phase (unitless), and cS is the total concentration of emulsifier in the emulsion (in kg m−3). Equation (2) predicts that the minimum droplet size that can be produced during homogenization decreases as the surface load of the emulsifier and volume fraction of the disperse phase decrease, as well as when the emulsifier concentration increases.
There are several assumptions underlying the derivation of this equation that should be considered when using it. First, it is assumed that the oil droplets generated inside the homogenizer are only stable to aggregation once their surfaces are fully coated with emulsifier. At lower surface concentrations, it is assumed that droplets coalesce with their neighbors when they collide with them. In practice, full coverage of the oil droplet surfaces by an emulsifier may not be required to inhibit droplet coalescence within a homogenization. Even so, it is likely to be close to full coverage. Second, the equation assumes that the size of the droplets produced during homogenization is limited by the emulsifier concentration, rather than by the intensity of the disruptive forces generated by the homogenizer. In some cases, a homogenizer may not be able to generate small droplets because of limitations in its mechanical design, and so adding more emulsifier to the aqueous phase will not reduce the droplet size. Third, the equation assumes that all the emulsifier molecules adsorb to the oil droplet surfaces. In practice, some of them may remain in the aqueous phase (Figure 2). Fourth, it assumes that the emulsifier molecules form a monolayer around the oil droplets. But some emulsifiers are known to form multilayers, especially when used at high concentrations [40,41]. Multilayer formation may also depend on other factors, such as pH, ionic strength, and temperature, as these affect the tendency for the protein molecules to associate with each other. Consequently, the surface load of an emulsifier may depend on its concentration and the solution conditions used. This phenomenon is important to recognize when comparing the surface loads of different kinds of proteins.
Predictions of the change in droplet diameter with emulsifier concentration for an emulsion with a fixed disperse phase volume fraction (oil content = 10 vol%) are shown in Figure 4 for model protein-based emulsifiers with different surface loads. These predictions indicate that the size of the droplets should decrease with increasing emulsifier concentration and decreasing surface load. Consequently, if one is trying to produce an emulsion with a certain droplet size and concentration, then the amount of emulsifier required will depend on the surface load of the emulsifier: the higher the surface load, the more emulsifier is required. Protein-based emulsifiers vary considerably in their surface loads and so this is an important parameter to compare their effectiveness. There are several reasons that the minimum droplet size predicted by the above equation may not be reached in practice: (i) the emulsifier molecules are unable to adsorb fast enough to the droplet surfaces during homogenization, leading to some droplet coalescence; (ii) a fraction of the emulsifier molecules stay in the aqueous phase and are not adsorbed; (iii) the homogenizer is unable to generate strong enough disruptive forces.
Experimental measurements of the change in droplet size with emulsifier concentration under quite similar homogenization conditions (microfluidization at 10,000 or 12,000 psi with 3 passes) are shown for several proteins in Figure 5. These results clearly show that protein type has a major influence on the size of the oil droplets produced during homogenization, which may partly be due to differences in their surface load, as well as their adsorption kinetics, surface activity, or interfacial tension reduction.

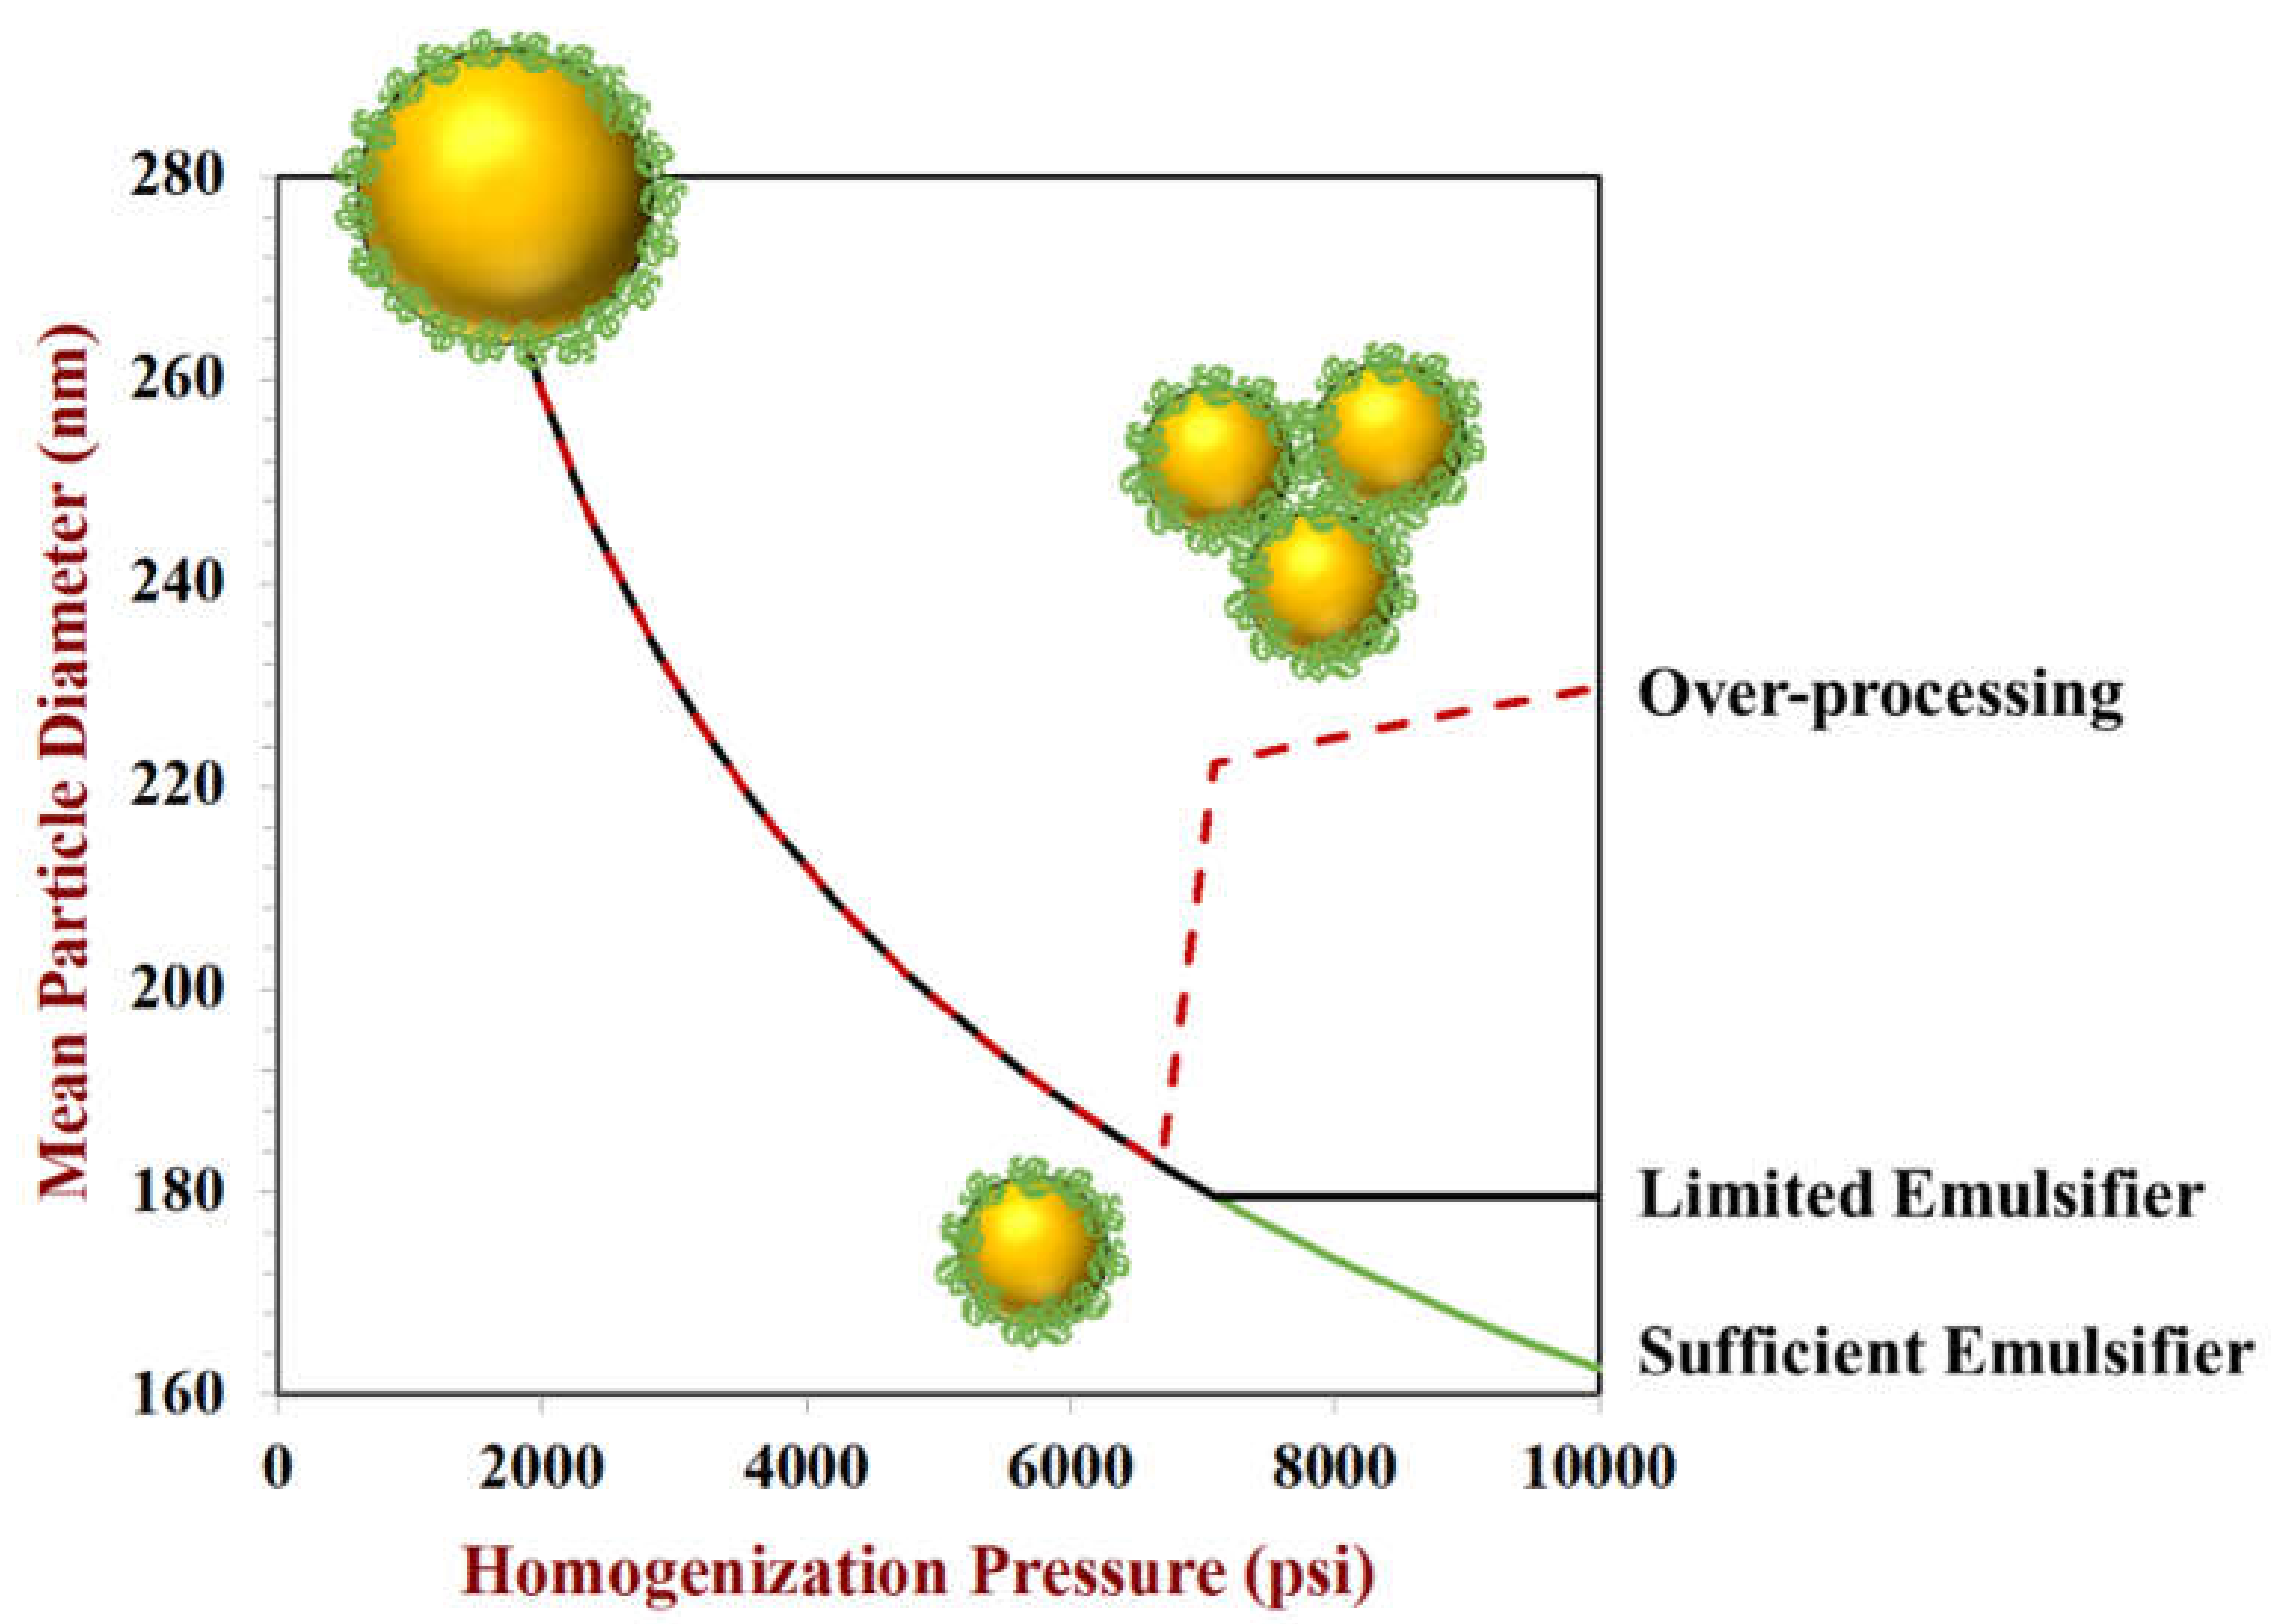
2.1.3. Role of Homogenization Conditions

Homogenization conditions also play an important role in determining the size of the oil droplets in emulsions. In particular, the type of homogenizer used, the intensity of the disruptive forces generated, and the duration of homogenization are all important factors [16,17,42]. The disruptive force intensity and duration depend on homogenizer type. For high pressure valve homogenizers and microfluidizers it is mainly governed by the operating pressure and number of passes used, whereas for sonicators it is mainly governed by the power and application time of the high-intensity ultrasonic waves. The droplet size usually decreases with increasing disruptive force intensity and duration, but the nature of this relationship depends on emulsifier type and concentration [18]. Several potential situations that might occur during high pressure valve homogenization or microfluidization are shown in Figure 6.
Sufficient Emulsifier Conditions: When the amount of emulsifier present in the system is always more than enough to cover all the oil droplet surfaces generated during homogenization, then the droplet size continually decreases as the operating pressure is raised. However, once the maximum operating pressure a homogenizer can attain is reached, the droplet size cannot decrease any further. Under sufficient emulsifier conditions, the droplet size is primarily governed by the homogenization pressure and there is typically a linear relationship between the logarithm of the droplet size and the logarithm of the operating pressure. Even so, the size of the droplets produced under these emulsifier conditions also depends somewhat on the nature of the emulsifier used, as well as the physicochemical properties of the oil and water phases. The ease of droplet disruption during homogenization usually increases as the interfacial tension and oil-to-water viscosity ratio decreases [42,43]. Thus, smaller oil droplets can be produced for emulsifiers that decrease the interfacial tension by a larger amount, and when the viscosity of the oil phase becomes more like that of the water phase. Moreover, the rate at which the emulsifier adsorbs to the oil droplet surfaces during homogenization is important as this governs the interfacial tension decrease during the formation of new oil/water interfaces as droplets are disrupted and their surface areas increase, as well as the resistance of the droplets to coalescence when they collide with their neighbors. If the emulsifier adsorbs too slowly, then the interfacial tension will not be fully decreased before the next droplet fragmentation event occurs and the droplet surfaces will not be fully covered before the next droplet-droplet collision event occurs. Consequently, proteins that adsorb quickly and reduce the interfacial tension by a large amount tend to produce smaller droplets during homogenization [44,45].
Limited Emulsifier Conditions: When the amount of emulsifier present in the system is insufficient to fully cover all the oil droplet surfaces produced during homogenization, then the droplet size is mainly governed by emulsifier concentration rather than homogenization conditions [37]. Under these conditions, almost all the emulsifier included in the original system will be adsorbed to the surfaces of the oil droplets. As a result, the size of the droplets cannot be decreased any further because there is not sufficient emulsifier to stabilize the surfaces of any more droplets. In this situation, the homogenizer usually generates many small droplets but many of them coalesce with their neighbors because their surfaces are not fully covered with emulsifier (Figure 2). Droplet coalescence will occur until there is enough emulsifier present to cover all the droplet surfaces. To a first approximation, the smallest droplet size that can be achieved under these conditions can be predicted using Equation (2).
Over-processing: Occasionally, the size of the droplets produced by homogenization initially decreases when the homogenization pressure is raised, but then it increases [46]. This phenomenon is known as over-processing and is usually a result of droplet aggregation occurring at high pressures, which often arises due to a decrease in the functional performance of the emulsifiers. When homogenizers are operated at high pressures there is often a considerable rise in temperature because of the heat generated due to friction as the fluids move at high speeds. Under these conditions, protein molecules may undergo conformational changes (such as thermal denaturation), which increase their surface hydrophobicity, thereby increasing their tendency to aggregate with each other. As a result, large protein aggregates may be formed that cannot rapidly adsorb to the oil droplet surfaces nor reduce the interfacial tension efficiently. In addition, homogenizing for extended periods can also lead to an increase in droplet size, which may be because the rise in temperature leads to thermal denaturation and aggregation of the proteins or because repeated adsorption/desorption at the oil-water interfaces leads to surface denaturation and aggregation of the proteins [21]. Consequently, it is important to optimize the homogenization conditions to avoid over-processing effects, as this can reduce product quality, increase costs, and decrease energy efficiency.
In general, homogenization is an extremely complex dynamic process where droplet formation, disruption, and coalescence occur simulataneously due to the action of complex fluid flow and force profiles inside the mechanical device. As a result, it is often difficult to understand the relative importance of the various physical phenomenon occurring to the final droplet size distribution. However, valuable insights into the behavior of droplets can be obtained using microfluidic devices that apply well-defined flow and force profiles to oil and water phases in the presence of emulsifiers. The application and insights of these microfluidic methods have been reviewed in detail recently, and interested readers are referred to these articles [47,48].

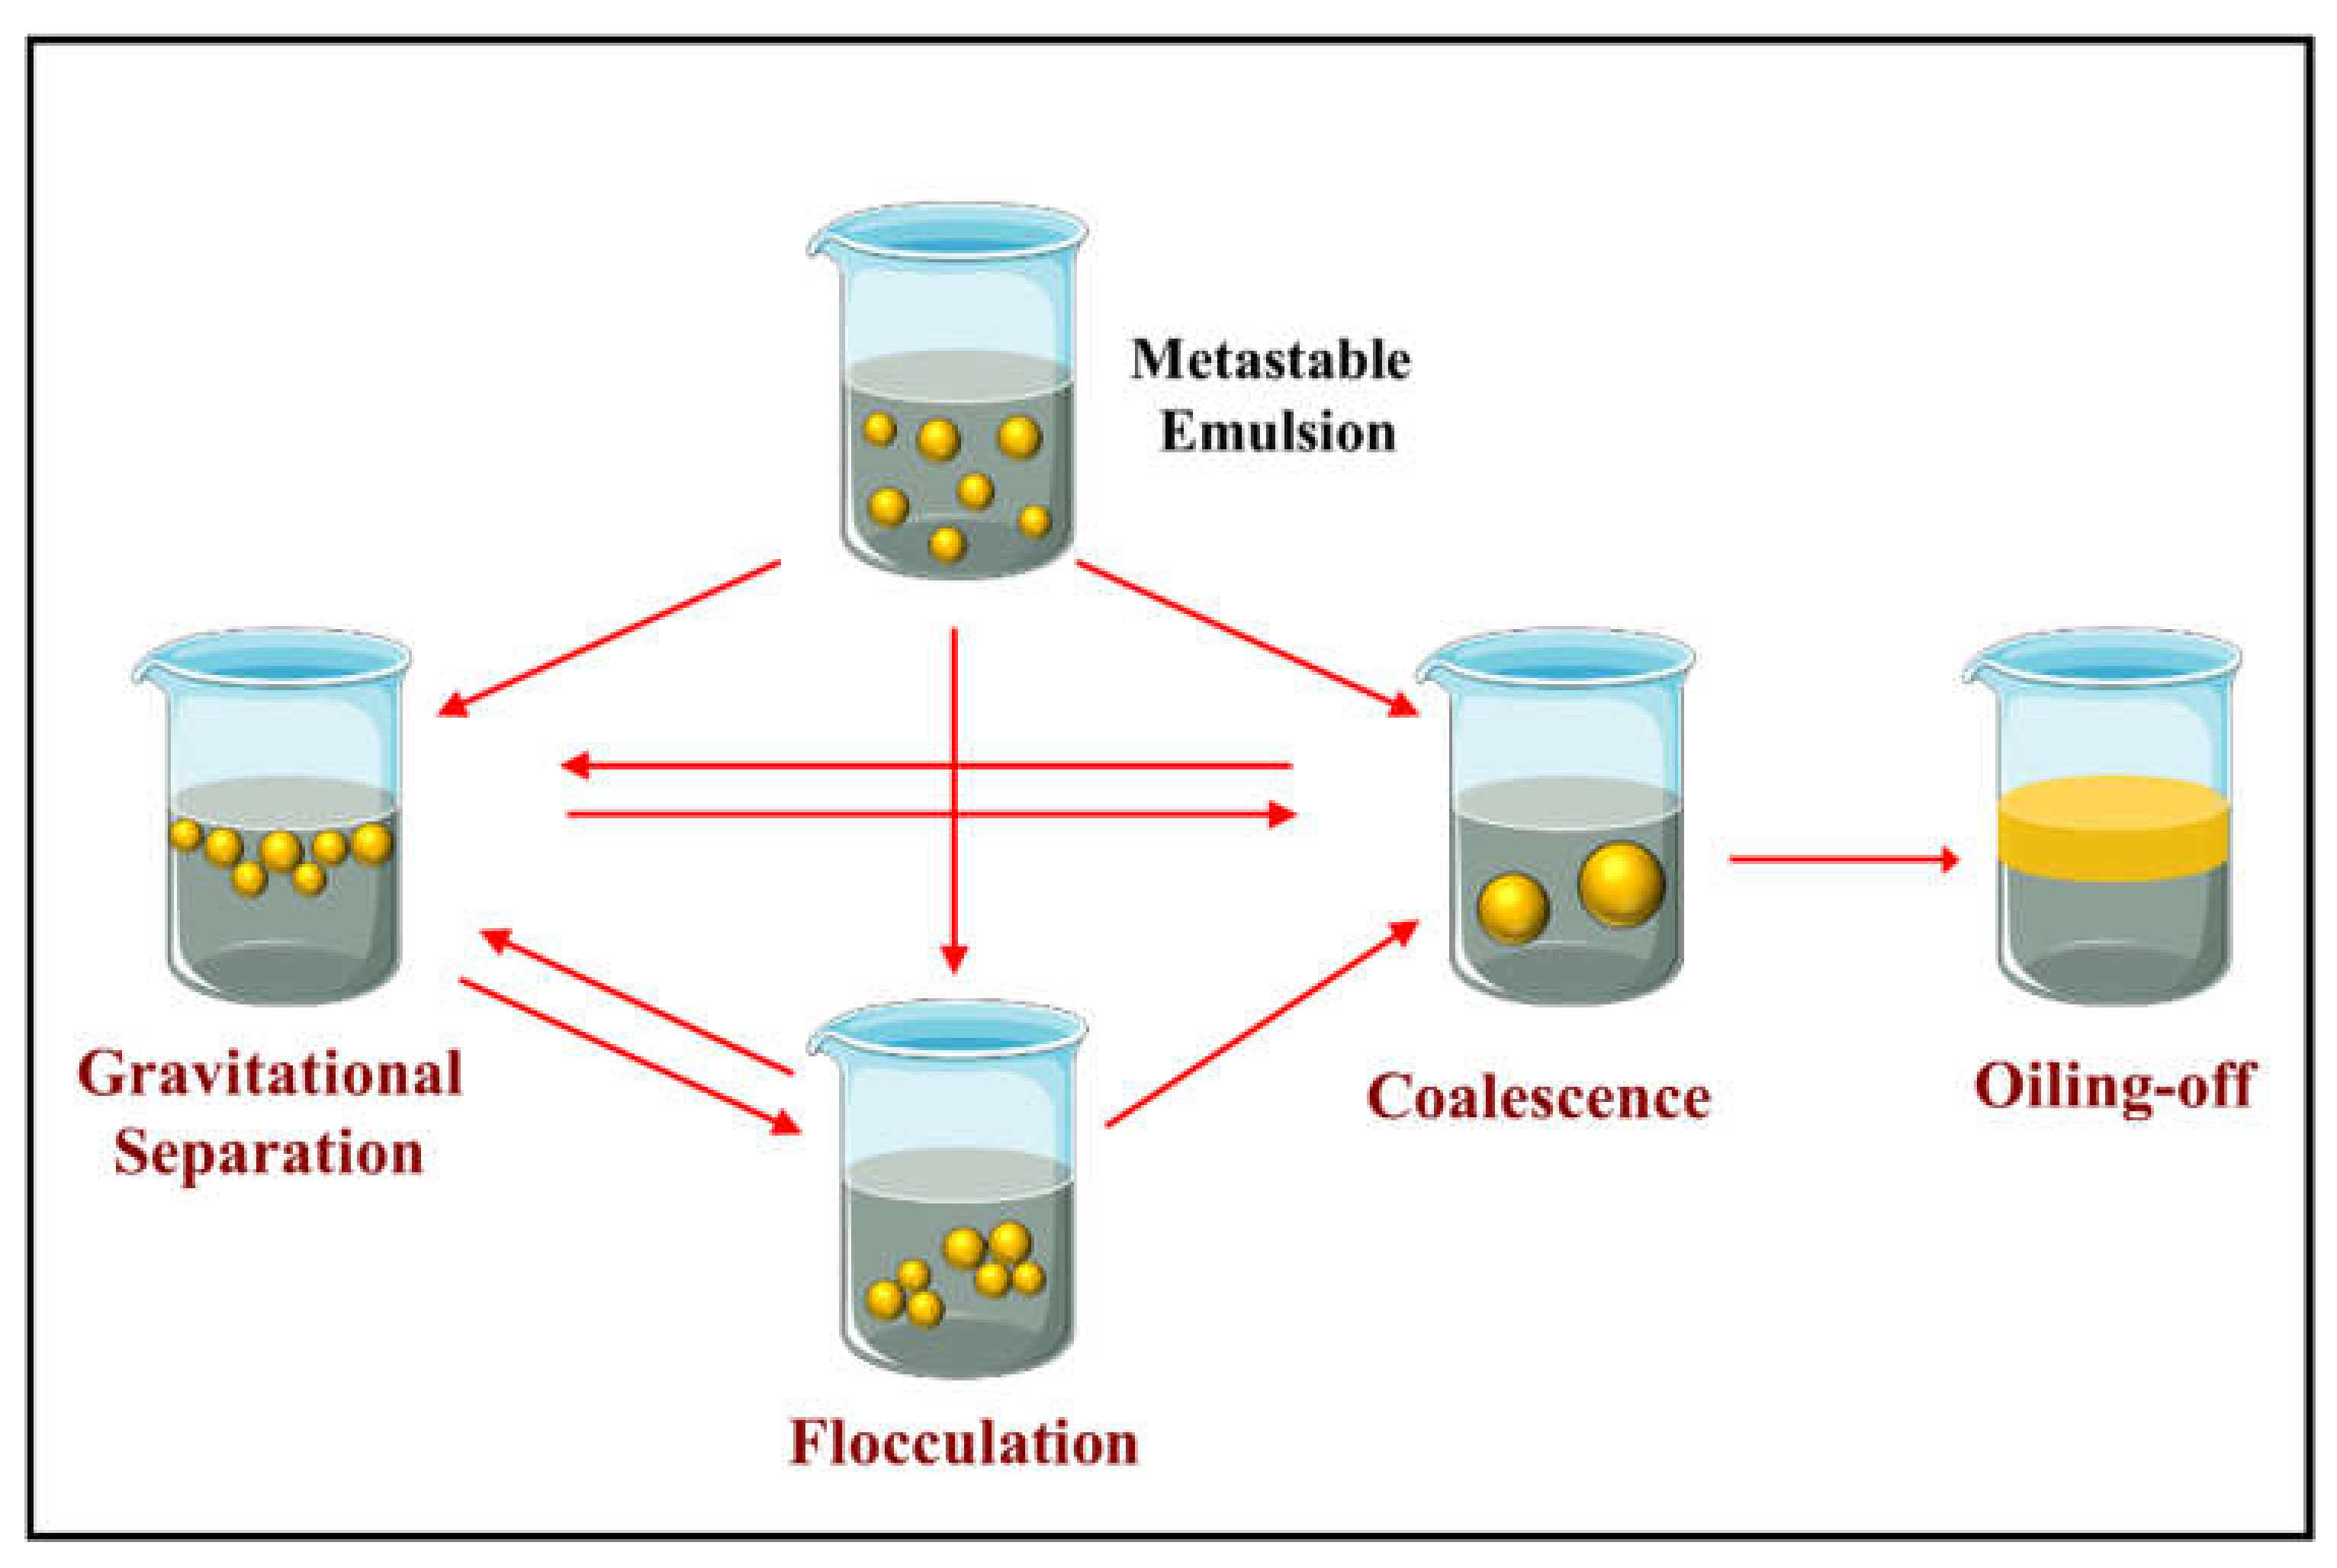
2.2. Stabilization of Emulsions

Once small oil droplets have been successfully formed by homogenization, it is usually necessary to ensure they remain stable throughout a food product’s intended lifespan [33,49,50]. For instance, they may be expected to remain stable during the manufacturing process, throughout storage and distribution, and when they are utilized by the consumer. Emulsions may experience various environmental stressors during their lifespan that may promote their deterioration, including changes in solution conditions (e.g., pH and ionic strength), variations in temperature (e.g., chilling, freezing, pasteurization, sterilization, or cooking), changes in environmental conditions (e.g., light and oxygen levels), exposure to mechanical stresses (e.g., flow through a pipe, shearing, and vibrations during transport), and food matrix interactions (e.g., mineral ions, polysaccharides, and polyphenols). Emulsion deterioration may involve one or more physicochemical and biological processes, such as creaming, sedimentation, flocculation, coalescence, partial coalescence, Ostwald ripening, phase inversion, chemical degradation, and microbial contamination. The most important physicochemical mechanisms of emulsion instability are summarized in Figure 7. The susceptibility of protein-stabilized emulsions to these processes depends on their initial composition and microstructure, as well as their history after manufacture. Each emulsion should therefore be designed to remain stable over the conditions it might experience during its lifespan, including alterations in pH, ionic composition, ingredient interactions, temperature, dilution/concentration, mechanical stresses, and water activity. Protein-based emulsifiers vary somewhat in their ability to resist these changes in solution and environmental conditions. Consequently, it is important to select the most appropriate one for the specific food or beverage they are going to be used in. Several mechanisms by which protein-based emulsifiers may impact the physicochemical stability of food emulsions are highlighted here.

2.2.1. Gravitational Separation

Gravitational separation is one of the most common instability mechanisms observed in emulsified foods and beverages, and so manufacturers must carefully design their products to prevent it. The driving force for gravitational separation is the density contrast between the oil droplets and the fluid that surrounds them. For dilute emulsions, the velocity (v) that droplets move upwards is described by Stokes’ Law [33]:
V S t o k e s = g ρ 2 ρ 1 d 2 18 η 1
In this equation, g is the acceleration due to gravity, ρ is the density, d is the diameter of the droplets, η is the shear viscosity, and the subscripts 1 and 2 refer to the fluid surrounding the droplets (the continuous phase) and the droplets (the disperse phase), respectively. The sign of the creaming velocity determines whether the droplets tend to move upwards (+) or downwards (−) and are therefore susceptible to creaming or sedimentation, respectively (Figure 7). Stokes’ law predicts that the creaming velocity should decrease with decreasing density contrast, decreasing droplet size, and increasing continuous phase viscosity. The type of protein-based emulsifier used to formulate an emulsion impacts the rate of gravitational separation in several ways:
Droplet size: The type and concentration of emulsifier used influences the size of the droplets produced during homogenization. The creaming rate is proportional to the droplet diameter squared (Equation (3)). Consequently, the more effective the emulsifier is at reducing the droplet size during emulsion preparation, the stronger the resistance of the emulsion to gravitational separation.
Droplet aggregation state: The nature of the emulsifier used impacts the stability of the oil droplets to aggregation when exposed to different environments (Section 2.2.2). Droplet aggregation increases the particle size, which should increase the rate of creaming (Equation (3)), provided that the droplet concentration is not so high that a particle network is formed that inhibits the movement of the droplets. Consequently, for dilute emulsions, the more effective the emulsifier is at increasing the steric and electrostatic repulsion between the oil droplets, the stronger the resistance of the emulsion to gravitational separation.
Droplet density contrast: The density of oil is usually lower than that of water and so emulsions are susceptible to creaming (Figure 7). In contrast, protein-based emulsifiers are denser than water. Consequently, if the protein coating around the oil droplets makes up an appreciable contribution to the total volume of the particle (droplet + coating), then the overall density of the particle may be closer to that of the water, thereby slowing creaming. This effect only tends to be important in emulsions that contain small droplets (<200 nm) covered by thick interfacial layers (>20 nm) [14,51].
Aqueous phase rheology: If an emulsion contains a relatively high concentration of non-adsorbed emulsifier and the emulsifier is an effective thickening or gelling agent, then the viscosity of the continuous phase may increase appreciably. As a result, this may lead to a decrease in the rate of gravitational separation. For most globular proteins, this effect is unlikely to be important unless they are used at a high concentration and the system is heated to unfold and aggregate them.

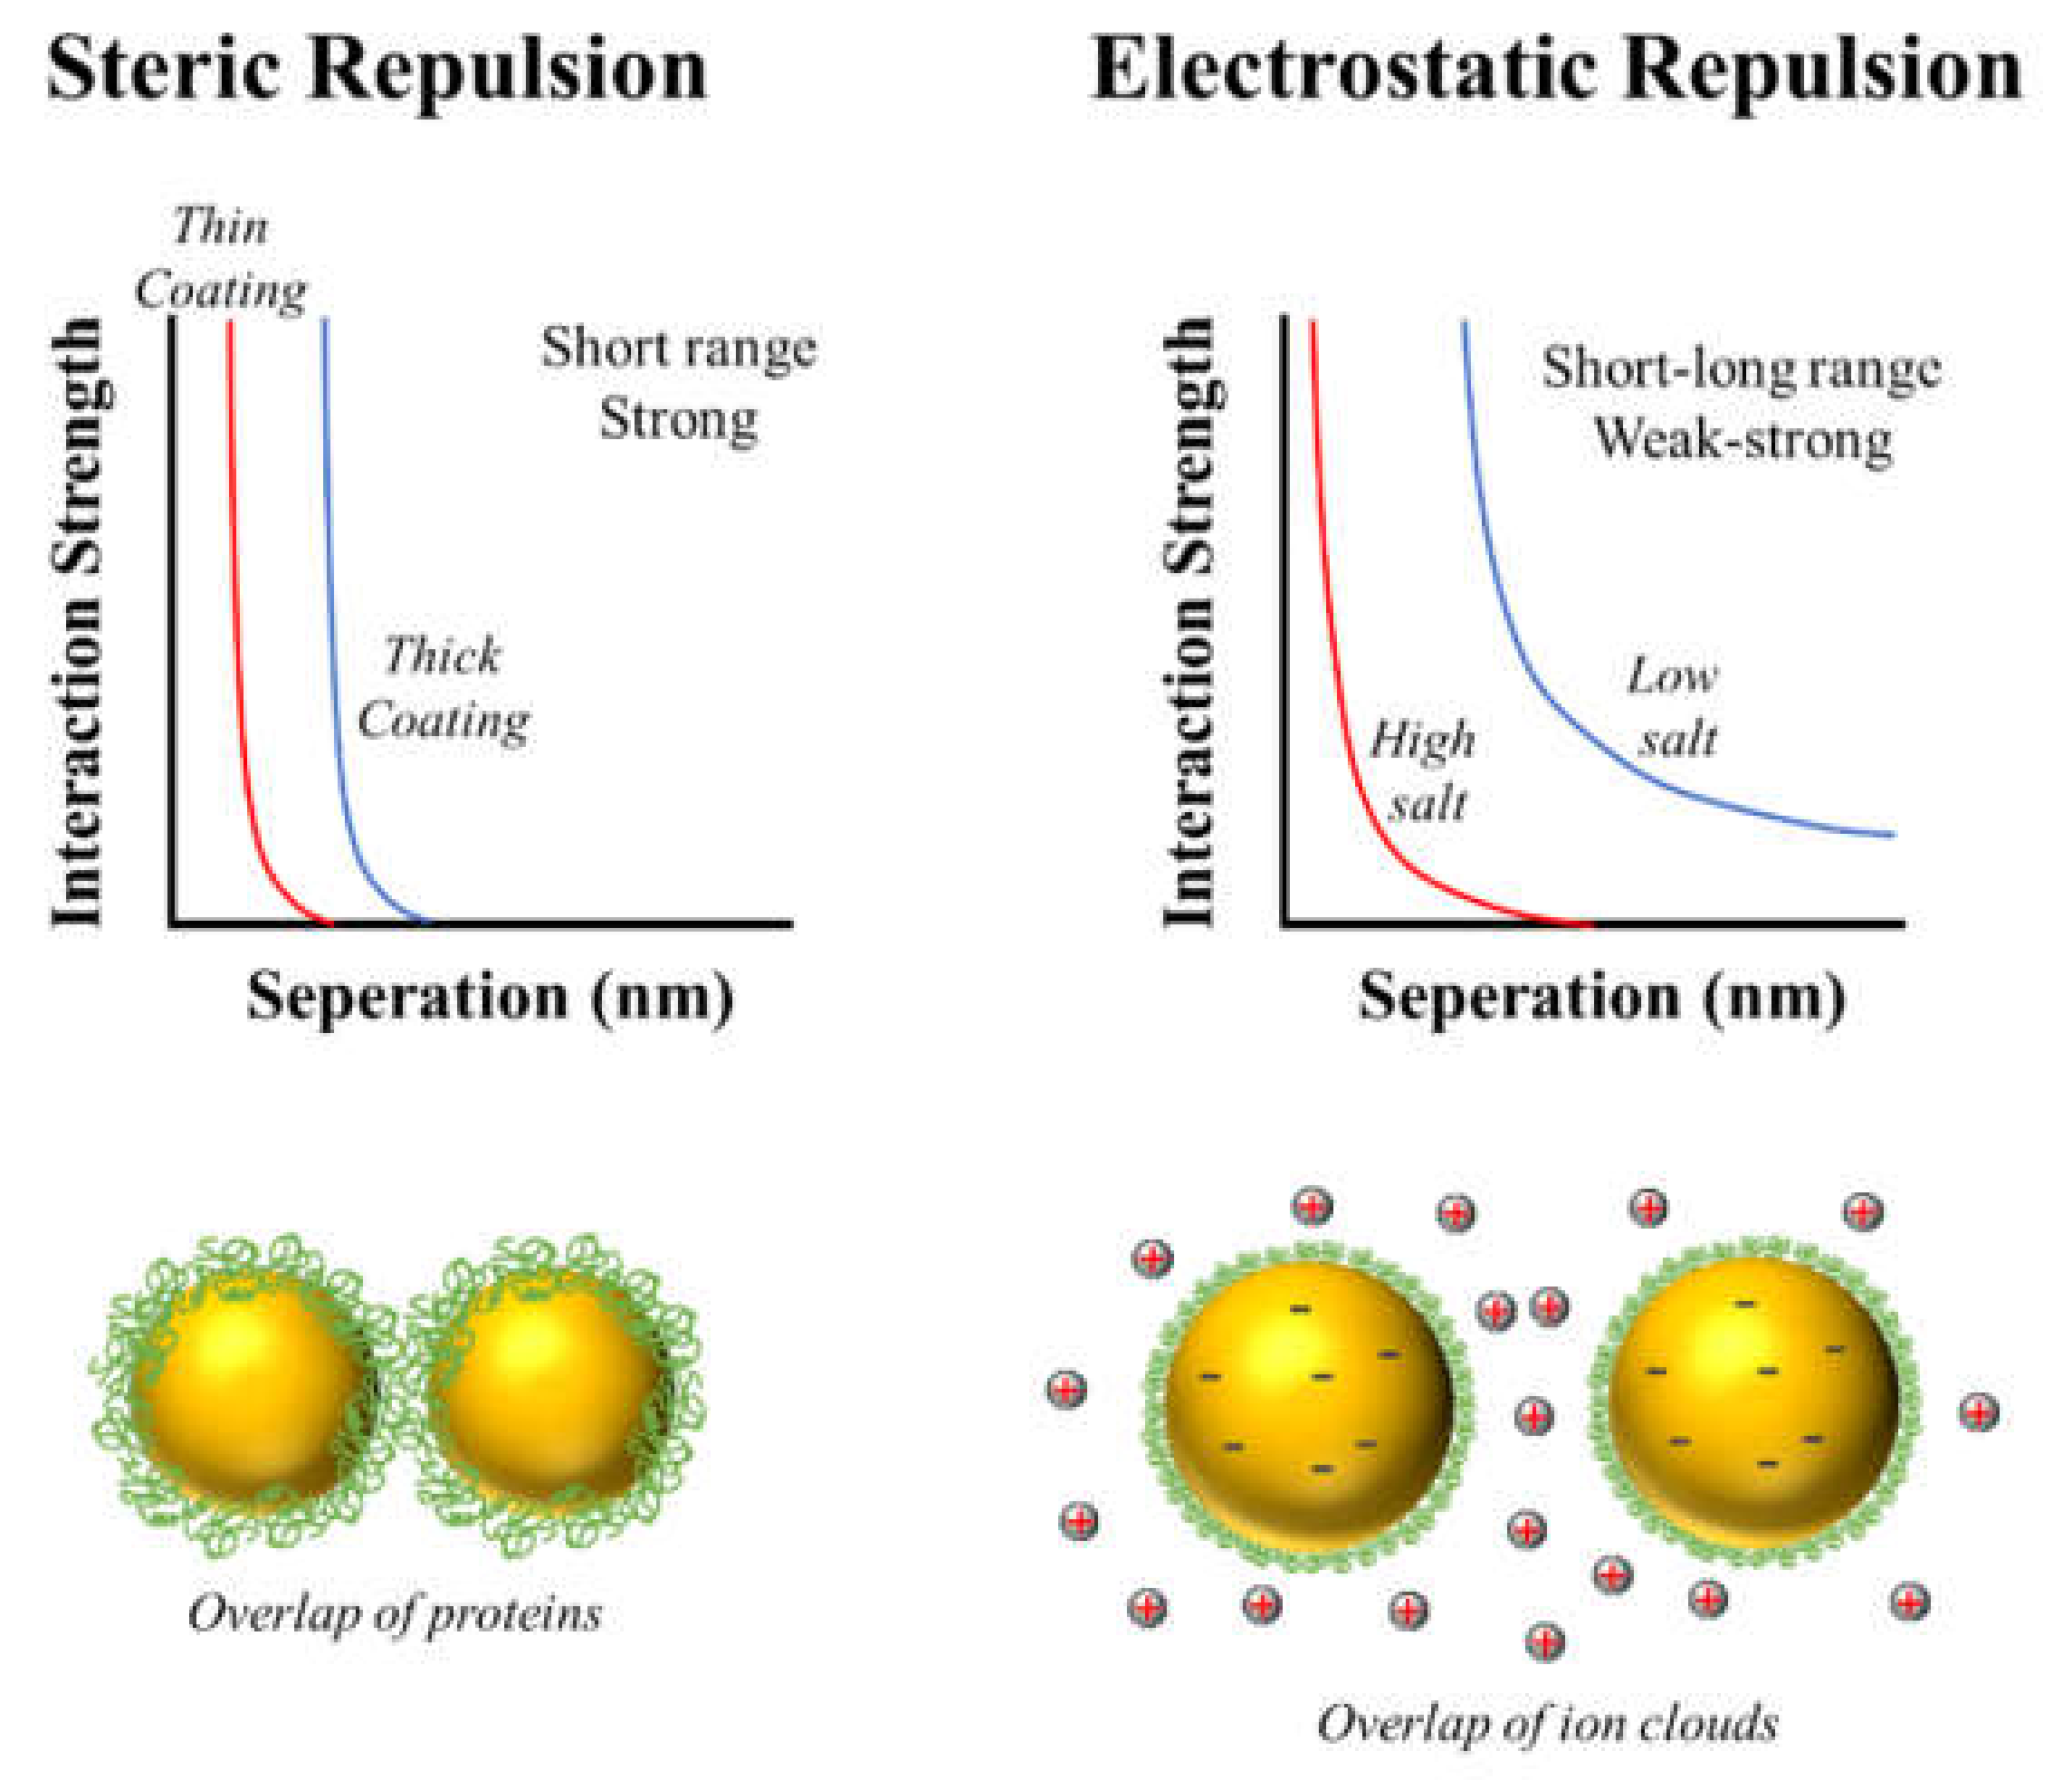
2.2.2. Droplet Aggregation

Another common instability mechanism in oil-in-water emulsions is the tendency for the droplets to aggregate with each other (Figure 7). Several kinds of droplet aggregation may occur, including flocculation, coalescence, and partial coalescence [18,50,52,53]. Flocculation occurs when several droplets come together and form a clump, with each of the individual droplets remaining intact [49,50]. Coalescence occurs when several smaller droplets come into contact and then merge with each other, leading to the generation of a single larger droplet [37,54]. These large oil droplets may then coalesce with other large oil droplets leading to an oil layer on top of the emulsion, which is usually referred to as oiling-off (Figure 7). Partial coalescence occurs when several partly crystallized oil droplets collide with each other and form a clump [53]. Typically, a solid fat crystal protruding from one droplet penetrates a liquid oil region in another droplet, thereby forming a link between them. The partly crystalline droplets do not completely merge into each other because of the mechanical resistance generated by the 3D fat crystal network inside them [53,55]. The type of emulsifier used to create an oil-in-water emulsion can impact the tendency for droplet aggregation to occur in several ways:
Modulation of colloidal interactions: The nature of the emulsifier that coats the oil droplets plays an important role in determining the attractive and repulsive forces between them [56]. Emulsifier-coated oil droplets have a propensity to aggregate with each other when the attractive forces dominate, but remain as individual entities when the repulsive forces dominate [33]. Protein-based emulsifiers can prevent droplet aggregation by generating a combination of electrostatic and steric repulsive forces (Figure 8). Typically, the strength of the electrostatic repulsion depends on the magnitude of the charge on the emulsifier-coated oil droplets, whereas the strength of the steric repulsion depends on the thickness of the interfacial layer (Figure 8). In some situations, protein-based emulsifiers can also promote droplet aggregation by generating attractive forces. For instance, globular proteins often expose non-polar patches to the surrounding water phase after they adsorb to droplet surfaces (“surface denaturation) or after they are heated (“thermal denaturation”), which generates a strong hydrophobic attractive force between the droplets [57,58]. Consequently, it is important to have analytical tools that can measure these parameters, such as particle electrophoresis and dynamic light scattering, which are described in detail later. At present, there is no well-established method for measuring the surface hydrophobicity of emulsifier-coated oil droplets.
Modulation of interfacial layer properties: The type, concentration, and interactions of the emulsifier molecules adsorbed to the oil droplet surfaces impact the thickness, rheology, and robustness of the interfacial layer. Some interfacial layers are relatively thin, fragile, and easy to disrupt, whereas others are relatively thick, strong, and difficult to disrupt. The properties of the interfacial layer determine the tendency for droplets to fuse together after they come into contact, which impacts their resistance to coalescence or partial coalescence.
The impact of emulsifiers on some of the most important attractive and repulsive forces that impact the stability of protein-stabilized emulsions are discussed in the remainder of this section.

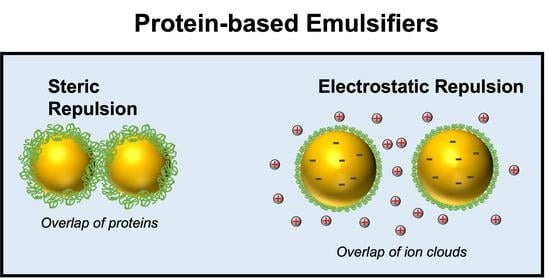
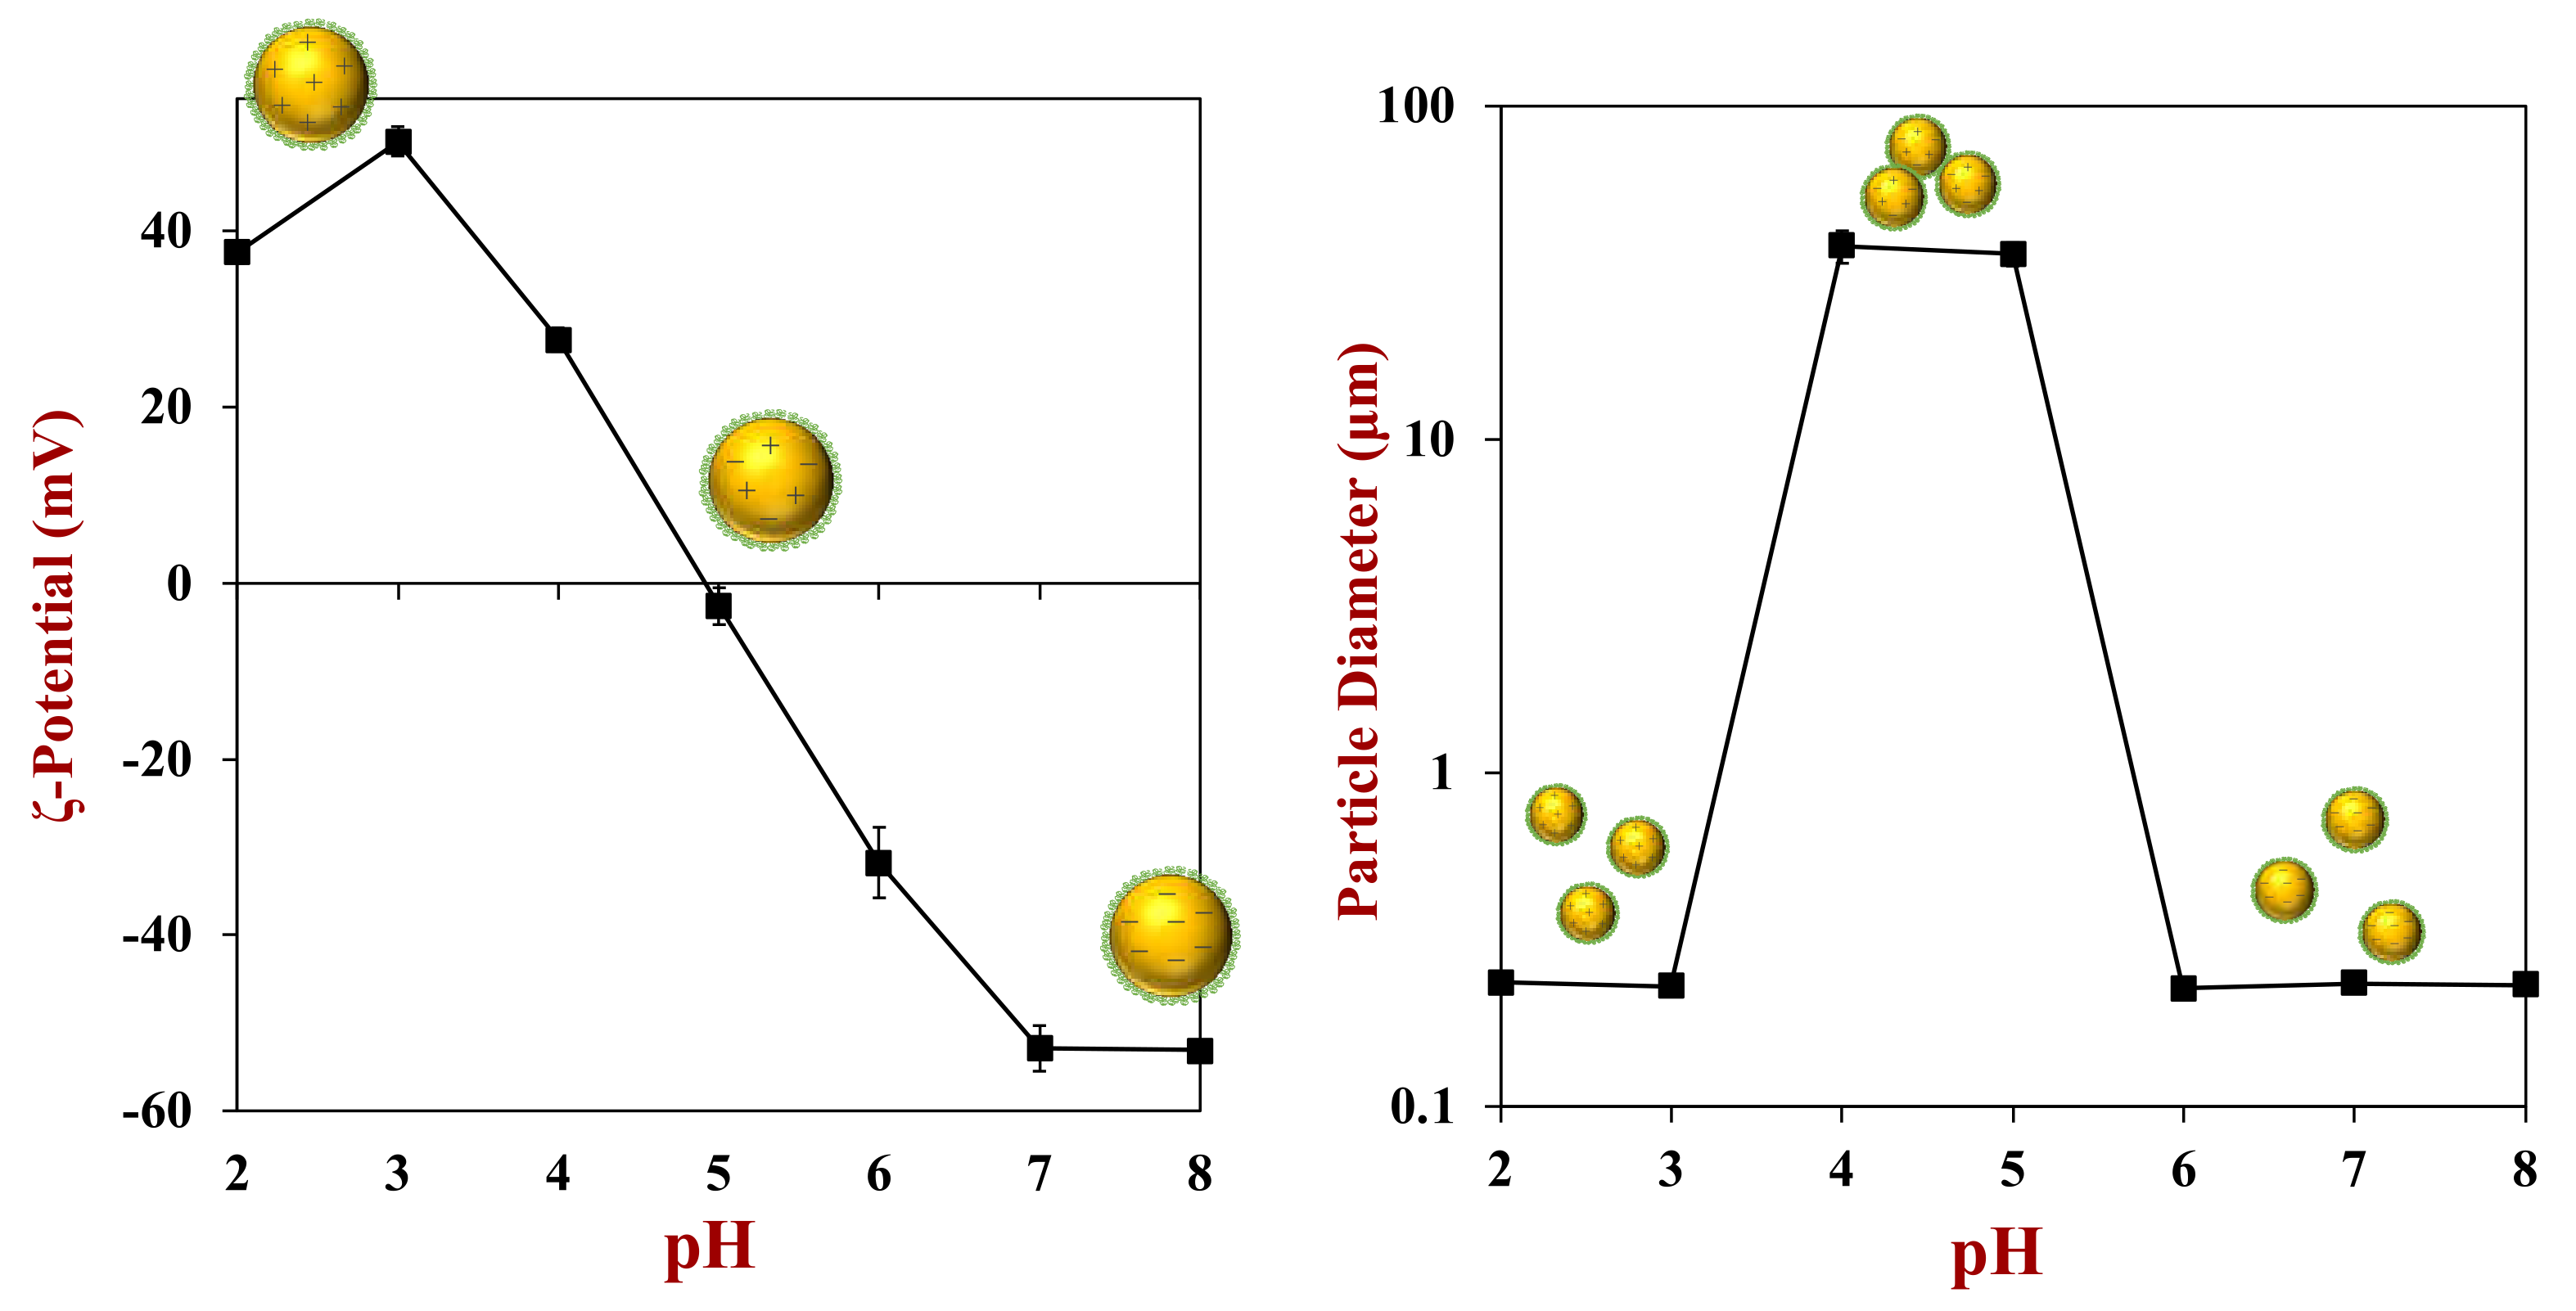
Electrostatic Interactions

The sign, strength, and range of the electrostatic forces in oil-in-water emulsions depend on the electrical characteristics of the droplet surfaces, as well as the ionic strength of the aqueous phase [33,56]. For protein-coated oil droplets, the surface charge usually goes from positive to negative as the pH is increased from acidic to basic, with a point of zero charge near the isoelectric point (pI) of the adsorbed protein layer (Figure 9). As a result, the electrostatic repulsion is relatively strong at pH values well below the pI (where all the droplets are strongly positive) and at pH values well above the pI (where all the droplets are strongly negative). Conversely, the electrostatic repulsion is relatively weak at pH values close to the pI (where all the droplets have little charge). Consequently, protein-coated oil droplets are often stable to aggregation at pH values well below and well above the pI but not at pH values near the pI. In general, the magnitude of the droplet charge (weak to strong) at a particular pH depends on the number of ionized groups per unit surface area, which depends on protein type. In particular, the numbers of amino and carboxyl groups on their polypeptide chains are important, as well as the pH of the aqueous phase relative to the pKa value of the ionizable groups. Typically, a protein with more charged groups will be able to generate stronger electrostatic repulsive forces. The electrical characteristics of protein-coated oil droplets are usually quantified by measuring their surface potential (ζ-potential) as a function of pH under controlled solution conditions (such as ionic composition and temperature).
The strength of the electrostatic interactions between protein-coated oil droplets is usually reduced when salt ions are added to the aqueous phase because of electrostatic screening effects, i.e., the accumulation of oppositely charged counter-ions around the charged groups (Figure 8). Multivalent counter-ions (like Ca2+) are particularly effective at screening electrostatic interactions. In addition, they can promote flocculation at pH values above the pI of the protein-coated oil droplets by acting as cationic salt bridges between the anionic droplet surfaces. Consequently, it is particularly important to consider the ionic composition of the aqueous phase when designing and testing oil-in-water emulsions assembled from proteins.
In general, the greater the ζ-potential of the droplets and the lower the ionic strength of the surrounding aqueous phase, the stronger the electrostatic repulsion between the droplets and the more resistant they are to aggregation. To avoid droplet aggregation, it is therefore usually important that the pH of the food product is far from the pI of the protein-coated oil droplets (usually 2 pH units below or above) and that the ionic strength is relatively low (<100 mM), but this depends on protein type.

Steric Repulsion

The strength and range of the steric repulsive forces acting between emulsifier-coated oil droplets are mainly governed by the structural organization and thickness of the adsorbed emulsifier molecules [33,56]. To prevent droplet aggregation through steric repulsion alone, the interfacial layer should be thicker than the range of the attractive van der Waals attraction (and hydrophobic) between the droplets, which is typically on the order of tens of nanometers, e.g., around 10 to 50 nm [18]. Consequently, emulsifiers that form thin layers, like most proteins (a few nanometers thick), are unable to prevent droplet aggregation through steric repulsion alone. In contrast, emulsifiers that form thick layers, like amphiphilic polysaccharides (tens of nanometers thick), are able to prevent droplet aggregation through this mechanism [12]. For this reason, it is important that protein-coated oil droplets have a high charge to generate a strong electrostatic repulsion. In the absence of this charge, the droplets aggregate because the attractive forces dominate the repulsive ones. However, the thin layer of protein molecules may still be able to inhibit droplet aggregation by generating a strong steric repulsion that stops the oil droplets from merging. Thick interfacial coatings may also inhibit partial coalescence of oil droplets by reducing the ability of the fat crystals in one droplet to penetrate another droplet [53,59].

Hydrophobic Interactions

The surfaces of the droplets in most oil-in-water emulsions are predominantly hydrophilic because they are coated by amphiphilic emulsifiers that orientate themselves so that the non-polar groups contact the oil phase, whereas the polar groups contact the water phase. This is especially true for emulsions stabilized by small molecule surfactants that have a distinct hydrophobic tail and a hydrophilic head. At saturation, the surface of the droplets is then covered by the hydrophilic head groups. In contrast, protein-based emulsifiers have highly heterogeneous surfaces with numerous polar and non-polar regions (Figure 10). As a result, there are often non-polar patches facing the water phase after they have adsorbed to an oil-water interface. These non-polar patches lead to an attraction between the emulsifier-coated oil droplets due to the hydrophobic effect, which may cause them to aggregate [33,56]. The surface hydrophobicity of protein-coated oil droplets may be further increased by surface or thermal denaturation of the adsorbed proteins [57,58,60,61]. Surface denaturation occurs because the protein molecule undergoes a molecular rearrangement after adsorbing to the oil-water interface to decrease the number of non-polar groups in contact with water. However, the partial unfolding of globular proteins can sometimes increase the number of non-polar groups that are orientated towards the water phase, thereby increasing the surface hydrophobicity. Heating an emulsion above the thermal denaturation temperature of the adsorbed proteins typically causes a more extensive unfolding of the protein molecules (Figure 11A), which can lead to a large increase in surface hydrophobicity. It is for this reason that many emulsions stabilized by proteins undergo extensive aggregation after heating, especially when the repulsive interactions (such as electrostatic or steric repulsion) are relatively weak (Figure 11B). Hydrophobic interactions are less important for flexible random coil-like proteins, like casein, because they do not unfold upon heating. They are also less important for other kinds of natural emulsifiers such as phospholipids and polysaccharides for the same reason.

Covalent Interactions

Proteins have a diverse range of chemical groups on their surfaces, including sulfhydryl groups in cysteine, amino groups in lysine, and phenyl groups in phenylalanine [62]. Under appropriate conditions, some of these groups undergo chemical reactions that may alter the performance of the emulsifier. For instance, many proteins contain reactive free sulfhydryl groups (-SH) or disulfide bonds (-S-S-) [63,64]. Two sulfhydryl groups can react with each other to form a new disulfide bond, whereas a sulfhydryl group and a disulfide bond can undergo interchange reactions that change the location of the disulfide bonds. The formation of disulfide bonds between neighboring proteins adsorbed to the same oil droplet can improve the resistance of emulsions to aggregation by reducing the number of reactive surface groups and by increasing the robustness of the interfacial layer [57,58]. In contrast, the formation of disulfide bonds between proteins located at the surfaces of different oil droplets can promote irreversible aggregation because the droplets are held tightly together by strong covalent bonds [64].
The covalent bonds formed between protein molecules are relatively short-range, which means they only form after the reactive groups come close together. For this reason, they often only occur when other kinds of molecular interactions have brought the proteins into proximity, such as van der Waals, electrostatic, hydrogen bonding, or hydrophobic attraction. For instance, experiments with globular milk proteins (β-lactoglobulin) have shown that disulfide bonds only form between different protein-coated oil droplets when they are flocculated as a result of a weakening of the electrostatic repulsion and hydrophobic attraction between them [57,58].
Other kinds of chemical reactions may also influence the ability of proteins to function as emulsifiers, including oxidation, hydrolysis, and crosslinking reactions [65]. The relative importance of these reactions depends on protein type, food matrix composition (such as pH and ion composition), and environmental conditions (such as heat, light, and oxygen). Consequently, it is important when designing appropriate test methods to consider any environmental stresses that may promote chemical changes of a protein-based emulsifier. It is also important to have analytical methods that can provide information about changes in the properties of the proteins due to these interactions, such as changes in their chemical composition, molecular weight, and aggregation state.

2.2.3. Overall Interactions

In general, any colloidal interaction is characterized by its sign (positive to negative), strength (weak to strong), and range (short to long). The net interaction between two protein-coated droplets can therefore be quite complex, as it is the sum of several different kinds of interactions that vary in these parameters [18]. For protein-coated oil droplets, the most important colloidal interactions are van der Waals attraction, hydrophobic attraction, steric repulsion, and electrostatic repulsion. However, in some systems other interactions may also be important, such as bridging and depletion flocculation in emulsions containing adsorbing or non-adsorbing biopolymers, respectively. To produce a stable emulsion, it is important that the repulsive interactions (steric and electrostatic) are stronger and longer range than the attractive interactions (van der Waals and hydrophobic). A layer of adsorbed proteins is usually capable of inhibiting flocculation under conditions where there is a strong electrostatic repulsion between the droplets, i.e., pH values far from the isoelectric point and low ionic strengths. In contrast, droplet flocculation often occurs under conditions where the electrostatic interactions are weak (close to the isoelectric point and high ionic strength) because the protein layers are too thin to create a long-range steric repulsion.
Proteins from different sources vary in their molecular dimensions, electrical characteristics, and surface hydrophobicities, which leads to differences in interfacial thickness, packing, charge, and hydrophobicity. As a result, the protein type impacts the colloidal interactions between protein-coated oil droplets, thereby determining their aggregation stability under different conditions. As an example, differences in the pH-stability of oil-in-water emulsions stabilized by different kinds of animal and plant proteins are shown in Figure 12. Ideally, it would be useful to develop structure-function relationships to relate the molecular features of proteins to their functional performance as emulsifiers, but more work is still required in this area.

2.2.4. Ostwald Ripening

Another cause of instability in some emulsions is Ostwald ripening (OR), which leads to a growth in the average droplet size over time. The origin of this effect is the transfer of oil molecules from the smaller droplets to the larger droplets due to diffusion through the intervening aqueous phase [66,67,68]. This process occurs because the water-solubility of oil molecules is higher around the surfaces of small droplets than large droplets and so there is a concentration gradient in the system. The Ostwald ripening rate, therefore, depends on the solubility of the oil molecules in the aqueous phase. It is relatively slow for oils with a low water-solubility, such as triacylglycerol molecules containing long- or -medium chain fatty acids (like those in corn, sunflower, olive, safflower, vegetable, or coconut oil). In contrast, it can occur relatively quickly in emulsions containing oils that have a relatively high water-solubility, such as flavor or essential oils (like those in lemon, lime, thyme, or clove oil) [43,69,70]. To a first approximation, the increase in droplet size with time due to Ostwald ripening is described by the following expression [71]:
d t 3 = d 0 3 + 64 γ V m 2 S D 9 R T t
In this equation, d(0) is the initial droplet diameter, d(t) is the droplet diameter after time t, γ is the oil-water interfacial tension, Vm is the molar volume of the oil molecules, S is the water-solubility of the oil phase, D is the diffusion coefficient of the oil molecules through the aqueous phase, R is the gas constant, and T is the absolute temperature. This equation predicts that the Ostwald ripening rate increases as the water-solubility of the oil molecules increases. Typically, this is the most important factor impacting the Ostwald ripening rate because the water-solubility of oil may vary by orders of magnitude depending on its structure [68]. However, the above equation also predicts that emulsifier type impacts the growth rate by influencing the interfacial tension. Emulsifier type may also impact Ostwald ripening because it influences the mechanical properties of the interfacial layer. If the interfacial layer is relatively rigid, then it may inhibit the shrinkage or growth of the oil droplets, thereby slowing down Ostwald ripening [68,70,72].

2.3. Desirable Attributes of Protein-Based Emulsifiers

In summary, a protein-based emulsifier should be an amphiphilic molecule that can quickly adsorb to the oil droplet surfaces generated during homogenization. It should then decrease the interfacial tension, which lowers the Laplace pressure and facilitates further droplet breakup, thereby promoting the formation of smaller oil droplets. The protein should also form a protective coating around the oil droplets that inhibits their tendency to aggregate with their neighbors. Moreover, the protein may also provide protection against chemical degradation of the lipids, through a variety of mechanisms (such as steric hindrance, antioxidant activity, and chelation). The amount of emulsifier required to create a stable emulsion with a specific droplet size and concentration depends on its surface load (Γ), which depends on the molecular dimensions and interfacial packing of the proteins (Figure 13).

3. Recommended Protocols for Testing and Comparing Emulsifier Performance

At present, there are no standardized methods available to test and compare the functional performance of different emulsifiers. Instead, researchers tend to use different analytical methods and experimental protocols in their studies, which makes it difficult to compare results from different laboratories. Ideally, it would be advantageous to have a set of standardized methods to test and compare the performance of emulsifiers under similar conditions so their suitability for different applications can be established. For this reason, we propose a series of methods that can be used to test the functional performance of protein-based emulsifiers based on the authors decades of experience working in this area.

3.1. Initial Ingredient Properties

Typically, when working with protein-based emulsifiers they arrive in a powdered form, which must then be dissolved or dispersed in an appropriate aqueous solution prior to emulsion formation. These protein powders are usually isolated from natural materials using a series of different processing steps, which may alter their composition and properties (Figure 14). The nature of the initial powder plays an important role in determining the functional performance of the food proteins, including their emulsifying properties. Consequently, it is usually necessary to carry out an initial analysis of the protein powder prior to using it. In this section, analytical methods for testing the most important physical and chemical properties of protein powders are highlighted.

3.1.1. Proximate Analysis

As well as proteins, powdered protein ingredients may also contain several other constituents that can impact their functional performance, including carbohydrates, lipids, minerals, and water. Knowledge of the composition of these ingredients is therefore critical to ensure that they behave as expected. Ingredient manufacturers typically provide a report of the proximate analysis of the proteins they are supplying, such as their protein, carbohydrate, lipid, moisture, and ash content. If this information is not supplied, or one wants to know the precise composition of the ingredient being used, then proximate analysis can be carried out using standardized methods [73,74]. For instance, the protein content can be determined using Kjeldahl, Dumas, or spectrophotometry methods, the lipid content can be determined using the Soxhlet or other solvent extraction methods, the moisture content can be determined by oven drying or Karl Fischer titration methods, the ash content can be determined using a muffle furnace, and the carbohydrate content can be determined as the difference or using various chemical methods. Alternatively, information about the composition of protein powders can be obtained more quickly using non-destructive infrared spectroscopy methods, which simultaneously measure the protein, moisture, fat, ash, and fiber content [75]. However, these instruments must be calibrated using powders of known composition before they can be used, which is often done by the instrument supplier. The choice of a particular combinaton of methods to carry out the proximate analysis of a protein ingredient depends on many factors, including their cost, ease of use, availability, sensitivity, and accuracy. Typically, Kjehdalh or Dumas for protein, oven drying for moisture, Soxhlet for fat, muffle furnace for ash, and weight difference for carbohydrate are convenient choices for this purpose.

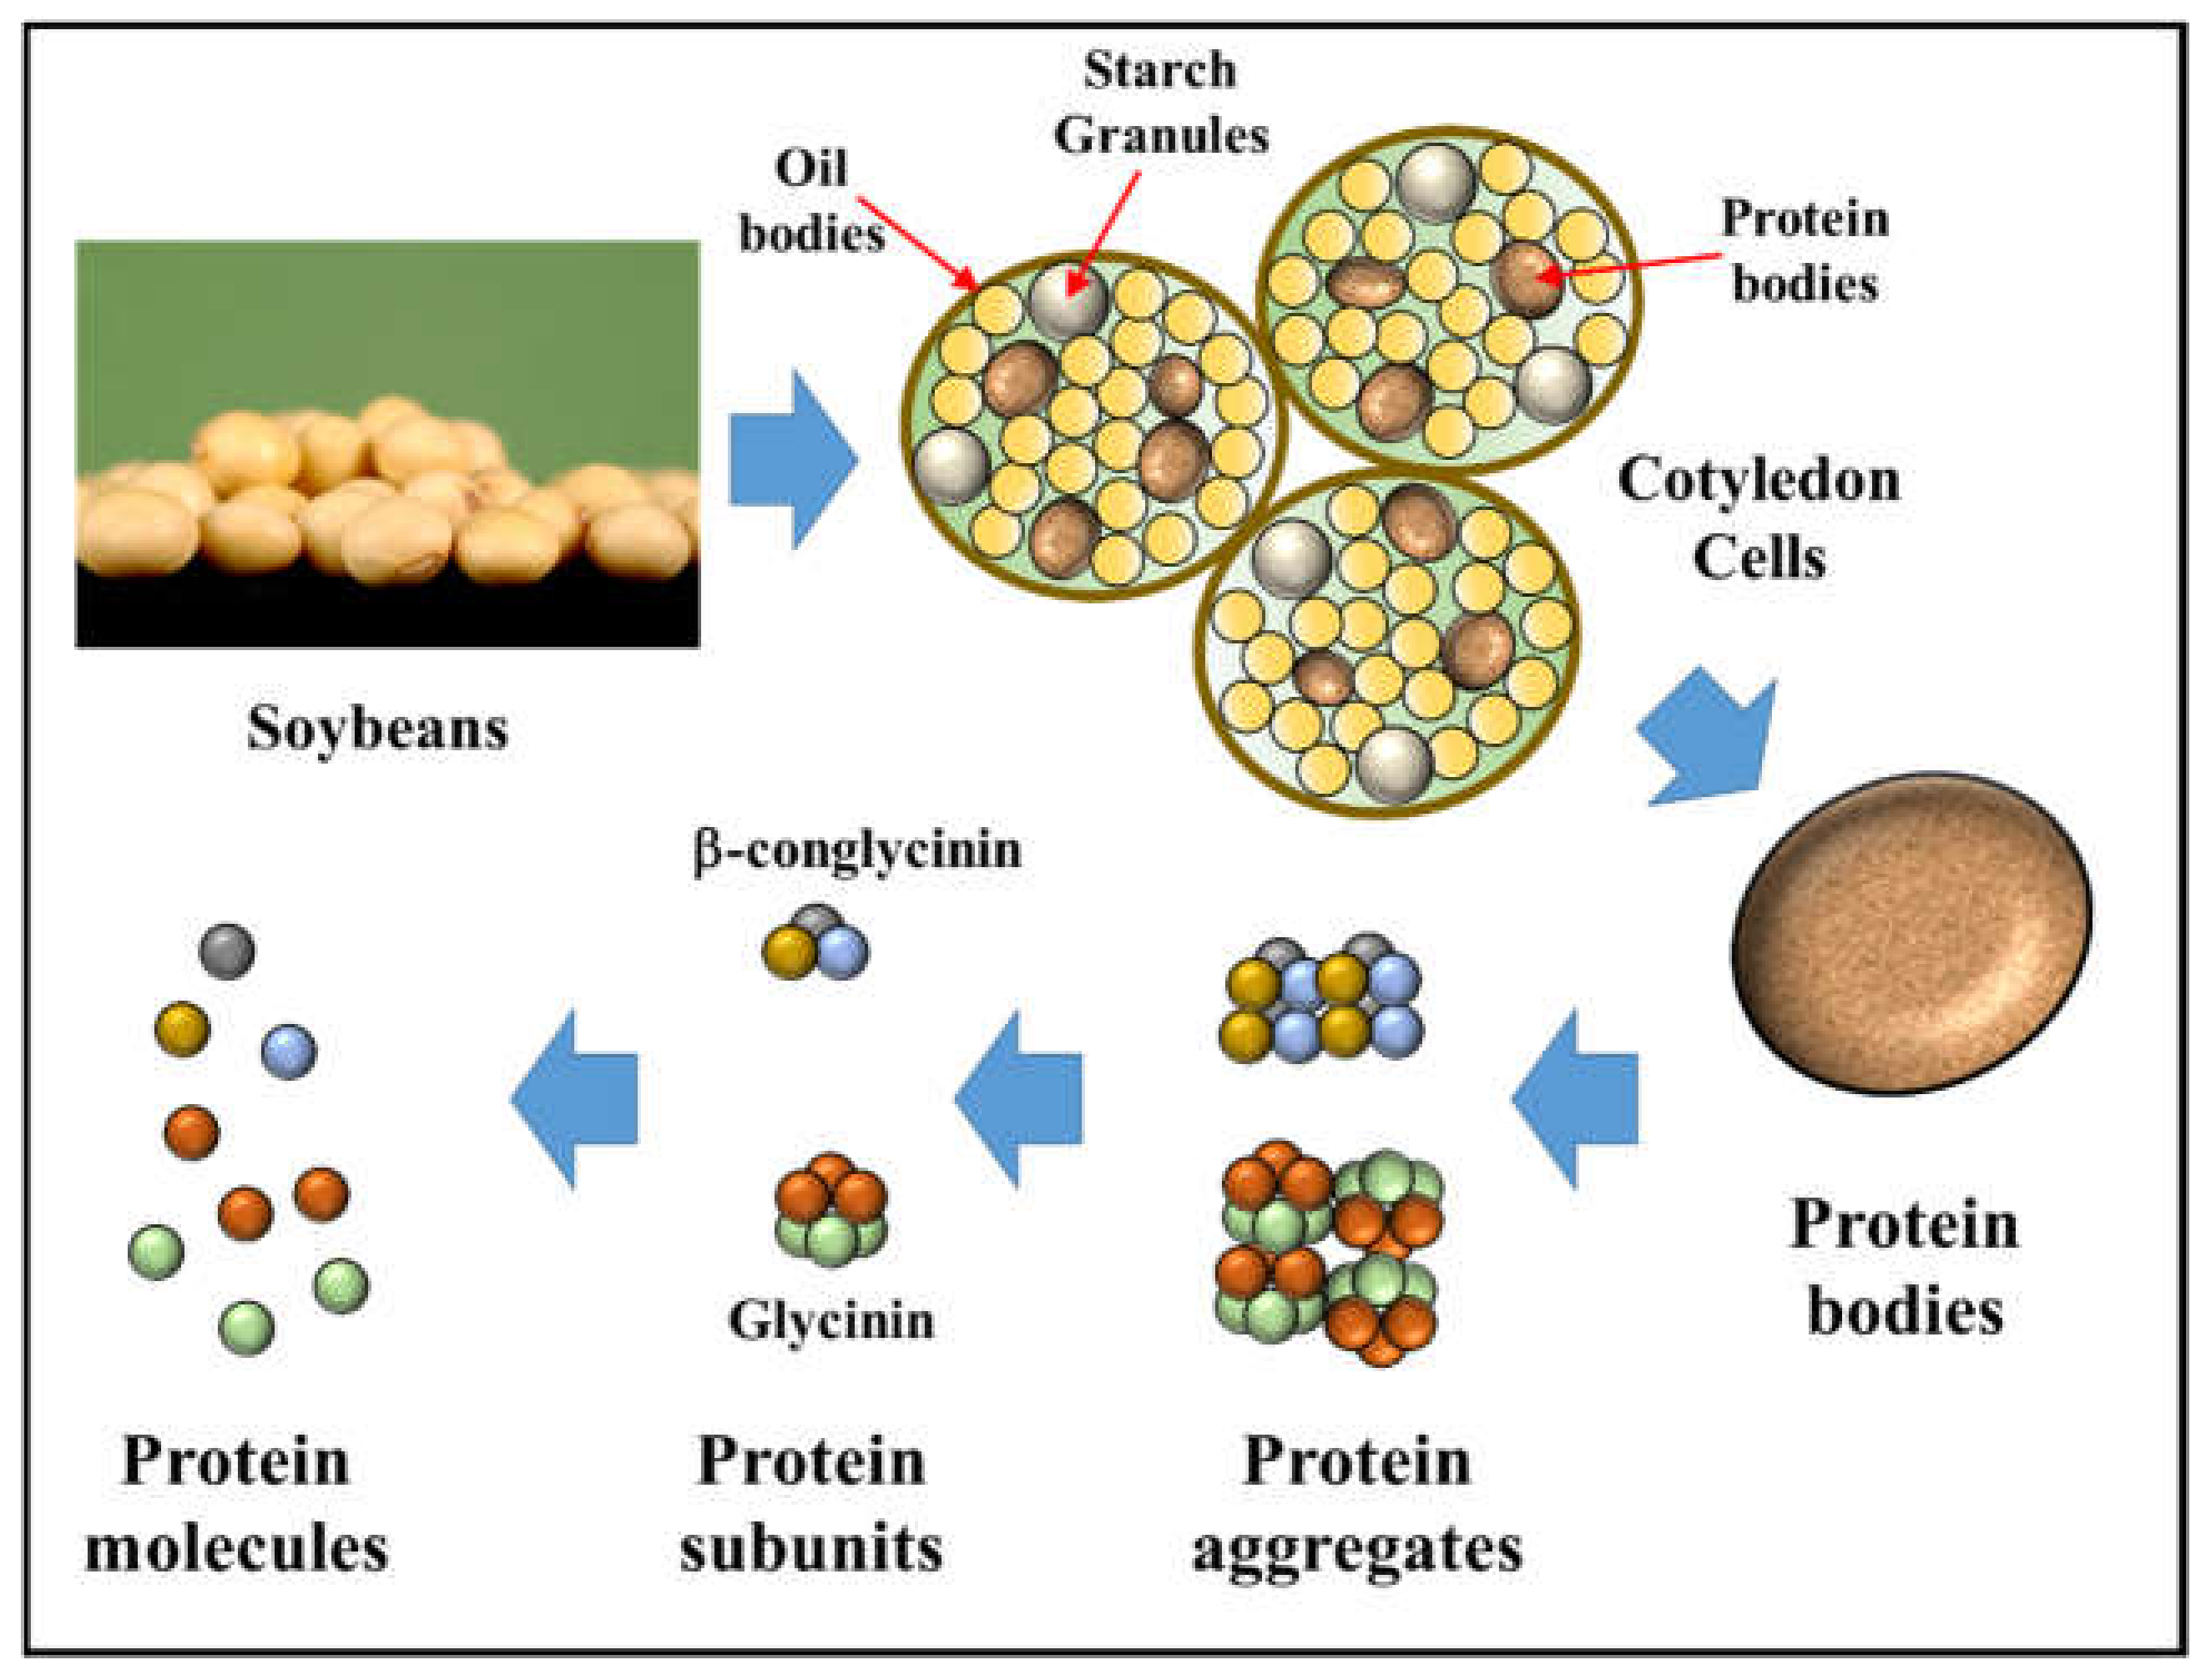
3.1.2. Protein Composition

Most sources of food proteins contain a mixture of different kinds of protein molecules, e.g., whey protein ingredients contain β-lactoglobulin, α-lactalbumin, bovine serum albumin, immunoglobins, and other proteins. Similarly, most plant protein ingredients contain numerous kinds of proteins [3]. Each protein fraction has a different molecular structure, physicochemical properties, and functional attributes. Consequently, it is important to know the type and amount of the different protein fractions present. Several analytical methods are available to determine the protein composition of powdered ingredients [73]. The most common method is sodium dodecyl sulfate-polyacrylamide gel electrophoresis (SDS-PAGE) since it is relatively inexpensive and simple to perform. In this method, the proteins are mainly separated based on their molecular weights. Basically, the protein is mixed with a solution containing SDS and a reducing agent such as dithiothreitol or 2-mercaptoethanol. The reducing agent disrupts any disulfide linkages within or between proteins, which allows individual polypeptide chains to completely unfold. The SDS is an anionic surfactant that binds to the polypeptide chains in the form of micelles, which is driven mainly by the hydrophobic effect. As a result, all protein molecules gain a strong negative charge, which causes them to adopt an extended structure and prevents their aggregation. The number of anionic groups per unit length of the polypeptide chain is quite similar for all protein molecules, so they have a similar linear charge density. The solution of treated proteins is then applied to a polyacrylamide gel, which contains crosslinked polymer molecules and has a particular pore size. Then, an electrical potential is applied across the gel, which causes the negatively charged SDS-coated proteins to move towards the positively charged electrode. The movement of the proteins through the gel is hindered by the porous gel network by an amount that depends on their molecular weight: the larger the protein molecules, the slower they move. After the proteins have been adequately separated, the electric field is switched off, the gel is removed, and then it is stained with a suitable protein label, such as Coomassie blue. The molecular weight of the test proteins can be determined by running another gel under the same conditions with a series of proteins of known molecular weight. Sometimes, the individual proteins can be further characterized by cutting out a spot from the gel and then passing the sample through a mass spectrometer. Alternatively, a plate reader can be used to measure the signal intensity of each peak, which can then be related to protein concentration.
Size exclusion chromatography (SEC) can also be used to separate proteins based on their molecular dimensions [76,77]. In this case, a protein solution is passed through a column containing beads with defined pore sizes. The small proteins can enter the beads and so their movement through the column is hindered. In contrast, the large proteins cannot enter the beads and so they move through the column more quickly. After separation, the concentration of proteins in each peak can be determined using different kinds of detectors, such as UV-visible, fluorescence, or refractive index detectors [78]. In some devices, it is possible to carry out multiangle light scattering analysis of the proteins in each peak, which provides direct information about their molecular weight and conformation. Alternatively, a series of proteins of known molecular weight can be passed through the column and the positions of the peaks determined. The molecular weight of an unknown protein can then be determined from the resulting calibration curve. After separation by SEC, detailed information about protein properties can also be obtained by coupling the instrument to a mass spectrometer [78].
Other methods are also available that separate and identify proteins based on other molecular characteristics. For instance, isoelectric focusing can be used to separate proteins based on their electrical characteristics, whereas a combination of isoelectric focusing and SDS-PAGE can be used to separate them based on both their charge and molecular weight characteristics.

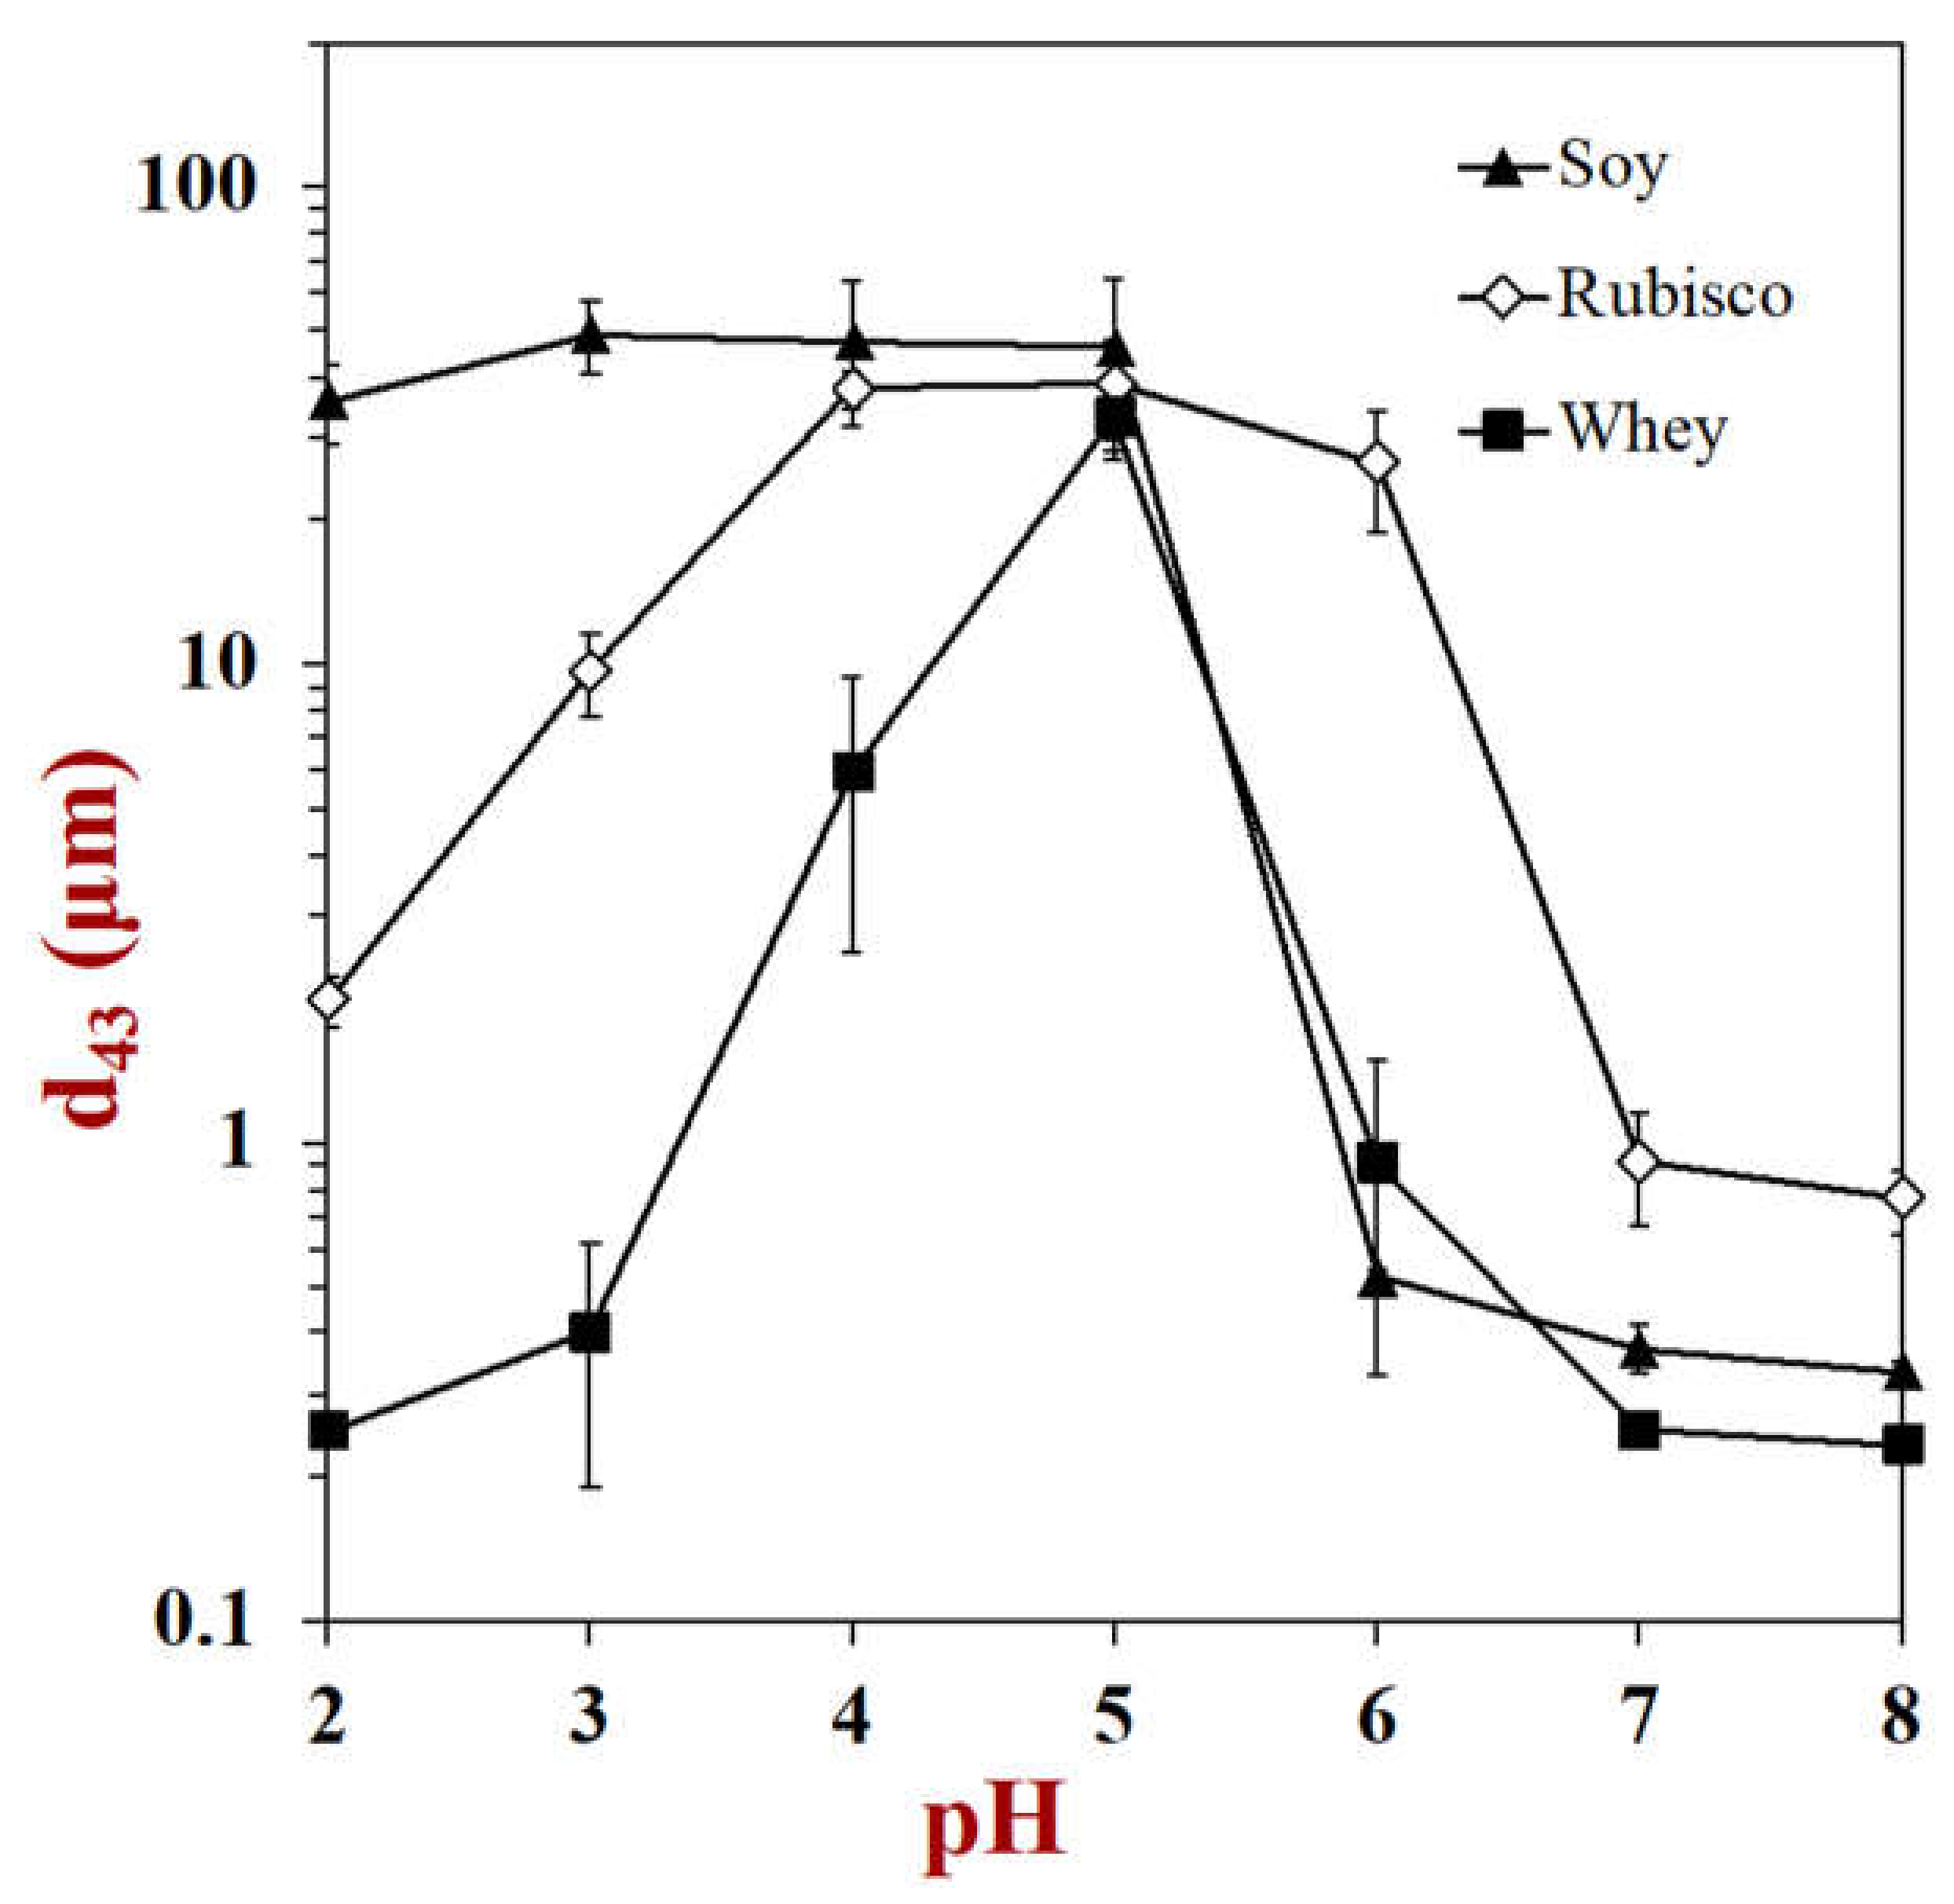
3.1.3. Protein Solubility

The solubility of proteins plays a major role in determining their functional attributes [79]. Typically, a protein should be soluble in water to function as a good emulsifier. The solubility of proteins depends on their molecular characteristics, especially the number of charged, polar, and non-polar groups on their surfaces [80]. It also depends on solution conditions, such as pH, ionic strength, and temperature, as these conditions influence the surface characteristics of proteins, as well as the magnitude and range of electrostatic and hydrophobic interactions. Typically, the water-solubility of a protein increases as the number of polar and charged groups on their surfaces increases and the number of non-polar groups decreases because this strengthens the electrostatic repulsion and weakens the hydrophobic attraction between them. Consequently, it is important to measure the solubility of proteins under different solution and environmental conditions. Typically, the impact of pH and salt content on protein solubility are the most common parameters studied.
The solubility of proteins is usually measured using centrifugation methods [80,81]. First, a fixed amount of protein powder (e.g., 1 wt%) is dispersed into a solution of known pH and ionic strength at ambient temperature and stirred using a magnitude stirrer (e.g., for 1 h). The pH is then measured and adjusted back to the required value if necessary. The protein dispersion is then stored for a fixed time (e.g., 24 h at 4 °C) to allow any soluble proteins to fully dissolve. It is then removed from the refrigerator and allowed to equilibrate to ambient temperature (e.g., 2 h at 25 °C) before being centrifuged under fixed conditions (e.g., 20,000× g for 30 min) [82]. The supernatant can then be collected, filtered (No. 1 Whatman filter paper), and the protein content measured using a suitable method. Typically, a micro-Kjeldahl or UV-visible spectrophotometer method (such as the direct, Biuret, BCA, Lowry, Bradford, or dye binding methods) is used for this purpose. For the spectrophotometer method, it is important to develop an appropriate calibration curve or know the extinction coefficient for the protein being analyzed. The solubility can then be calculated:
S o l u b i l i t y = 100 × C S C T
Here CS is the concentration of the soluble protein in the supernatant and CT is the total protein concentration in the system. If the powdered ingredient is pure protein, then CT is known. Otherwise, CT must be measured, which can sometimes be achieved by using the same colorimetric method as for the supernatant (provided that any insoluble proteins are made soluble by the components in the assay). Typically, the protein solubility should be measured as a function of pH (e.g., from pH 2 to 8 in 1 pH unit increments) and salt concentration (e.g., from 0 to 400 mM in 50 mM increments) to obtain a 2D solubility map. This type of map is useful for specifying the conditions where a protein is soluble and therefore has the functional performance required.

3.1.4. Protein Aggregation State

The proteins in powdered ingredients may be present as individual molecules (monomers), small molecular clusters (dimers, trimers, etc.), or large aggregates depending on their biological origin, the methods used to isolate and purify them, the solution composition (e.g., pH and ionic strength), and the environmental conditions (e.g., temperature) (Figure 14). The aggregation state of proteins influences their functional performance and so it is important to be able to quantify it. Several analytical methods are available for providing this kind of information. Non-denaturing polyacrylamide gel electrophoresis can be used to provide some information about the aggregation state of proteins [83]. This is like SDS-PAGE but no SDS or reducing agent is added. As a result, the proteins in solution should be present in their original (aggregated) states, rather than as unfolded isolated molecules. A solution of proteins is applied to the polyacrylamide gel and then an electrical potential is applied, which causes the proteins to move through the gel. In this case, the proteins are separated based on their charge, molecular weight, conformation, and aggregation state. Larger protein entities move through the gel slower than smaller ones, which enables information to be obtained about their aggregation state. One limitation of this approach is that some proteins do not enter the gel because they might be too large or do not carry enough charge. Size exclusion chromatography can also be used to separate proteins based on their aggregation state, but in this case the large protein entities move through the column faster than the smaller ones [77]. Alternatively, light scattering methods can be used to provide insights into the aggregation state of proteins, such as dynamic or static light scattering [84]. Dynamic light scattering is based on measurements of the diffusion coefficient of protein entities: larger particles move slower than smaller ones. Static light scattering is based on differences in the scattering patterns (intensity versus angle) of different sized protein entities when a laser beam is passed through a dilute sample. However, light scattering is sometimes limited by the sample concentration (too low or too high).For more detailed information about the nature of the aggregates formed, electron microscopy or atomic force microscopy can be used [84].

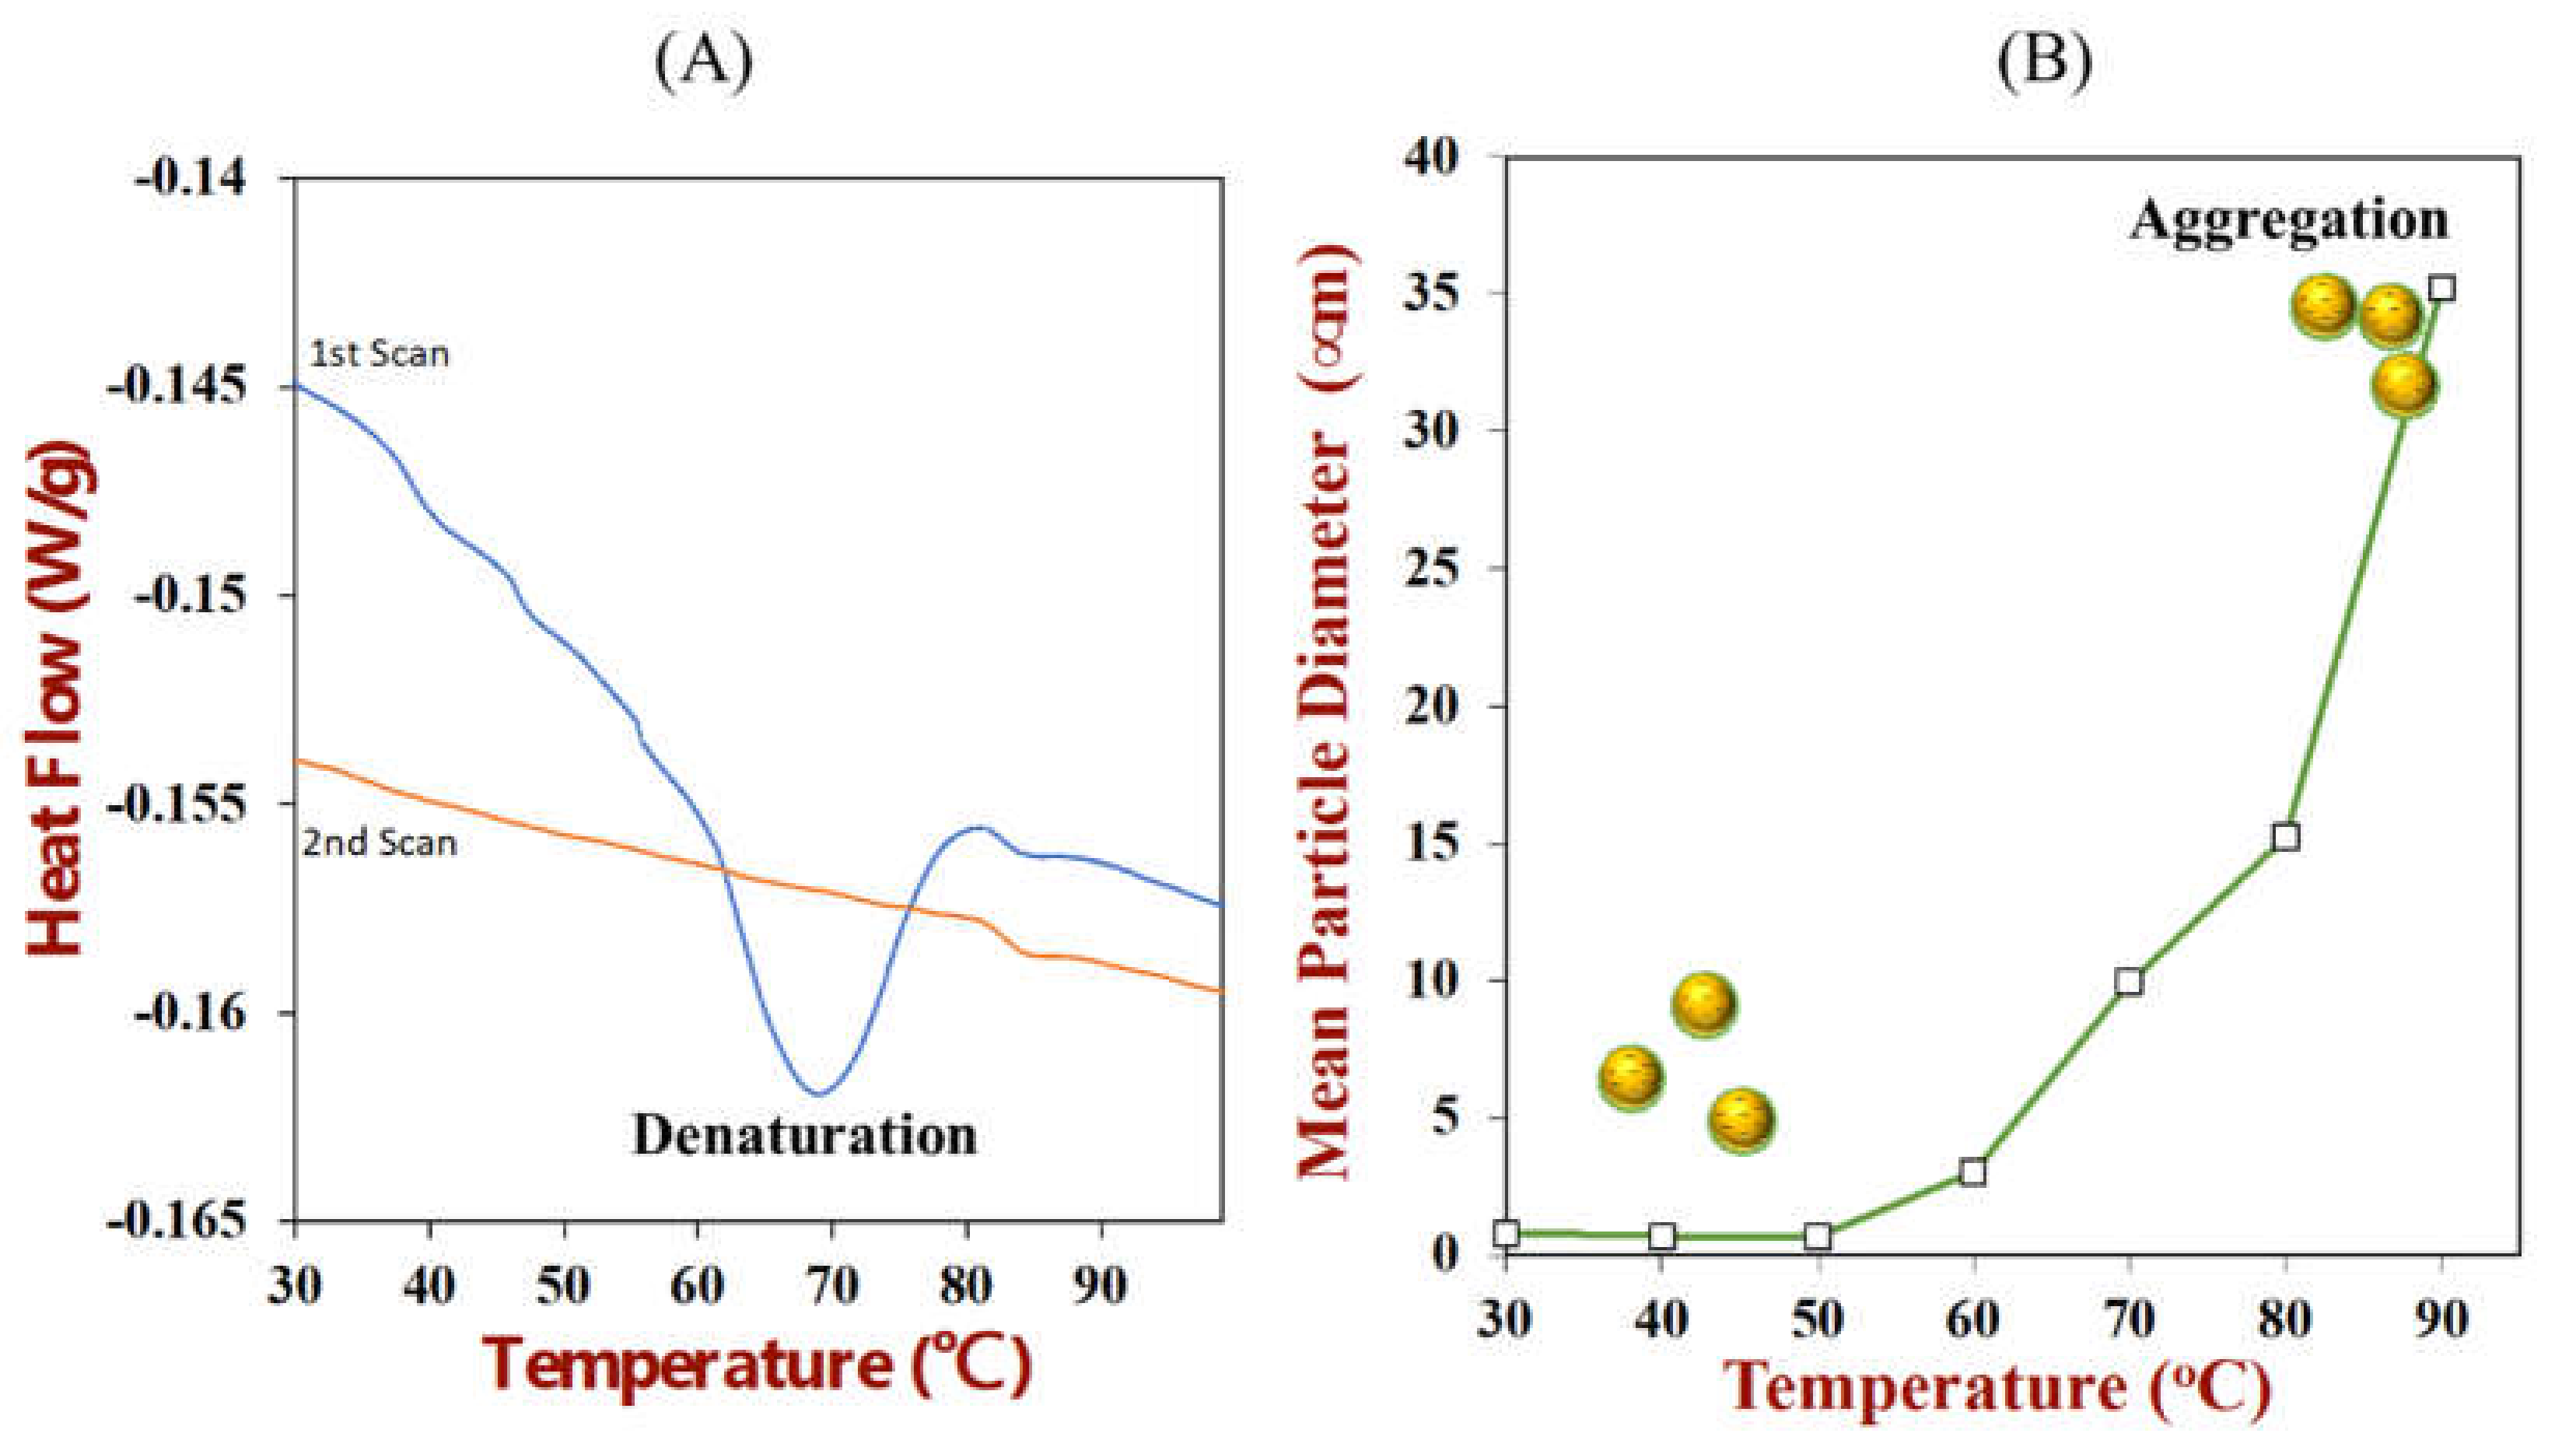
3.1.5. Protein Denaturation

For many applications, it is important that the proteins are in their native state for them to exhibit the required functional attributes, e.g., emulsifying, foaming, and gelling. Globular proteins are often denatured during their isolation and purification, which therefore alters their ability to act as emulsifiers. For this reason, it is usually important to measure whether a protein is in its native or denatured state. Differential scanning calorimetry (DSC) is the most common analytical instrument used for this purpose. In this method, a known amount of protein is usually dispersed within a buffer solution of known pH and ionic composition. Dilute protein solutions (e.g., 10 to 1000 μg/mL or 0.001 to 0.1%) can be analyzed using ultra-sensitive micro-DSC instruments, whereas more concentrated ones (e.g., 5 to 200 mg/mL or 5 to 20%) can be analyzed using conventional DSC instruments. Typically, the protein solution is placed in a sample cell and distilled water (or a buffer solution) is placed in a reference cell. Both cells are then heated together at a controlled rate, and the heat flow required to keep the two cells at the same temperature is measured. Thus, if an exothermic or endothermic transition occurs within the protein solution, a negative or positive heat flow is applied to the sample cell. A DSC scan therefore involves measuring the change in the heat flow (q) versus temperature (Figure 11A), which can be changed into a molar heat capacity versus temperature profile. When the protein is in its native state an endothermic transition is observed around its thermal denaturation temperature. The enthalpy of this transition is proportional to the amount of protein that undergoes the transition. Conversely, no transition is observed when a denatured protein is heated (Figure 11A).
The unfolding of proteins can also be monitored using other methods, such as measuring changes in fluorescence, circular dichroism, or infrared signals with temperature [85,86,87], but these methods are less routinely used for the analysis of food proteins. In summary, the composition, solubility, aggregation state, and denaturation state of proteins should be assessed before characterizing their emulsifying properties.

3.2. Impact of Emulsifier on Emulsion Formation

A good emulsifier should usually be capable of forming emulsions containing small droplets during homogenization. Ideally, the minimum amount of emulsifier required to form these small oil droplets should also be known, because this would reduce ingredient costs by only using the amount required. In this section, we highlight methods that can be used to measure and compare the performance of emulsifiers at forming emulsions. As mentioned earlier, it is often important that a protein is soluble prior to forming an emulsion, or that the fraction of soluble and insoluble protein is known (Role of Emulsifier in Emulsion Formation section). Consequently, it is useful to use standardized conditions to disperse the protein in an aqueous solution, such as mixing time, temperature, and speed, as well as solution conditions (such as pH and ionic strength). It is then important to measure the fraction of soluble and insoluble protein within the resulting solution used to formulate the emulsion.

3.2.1. Emulsifying Capacity
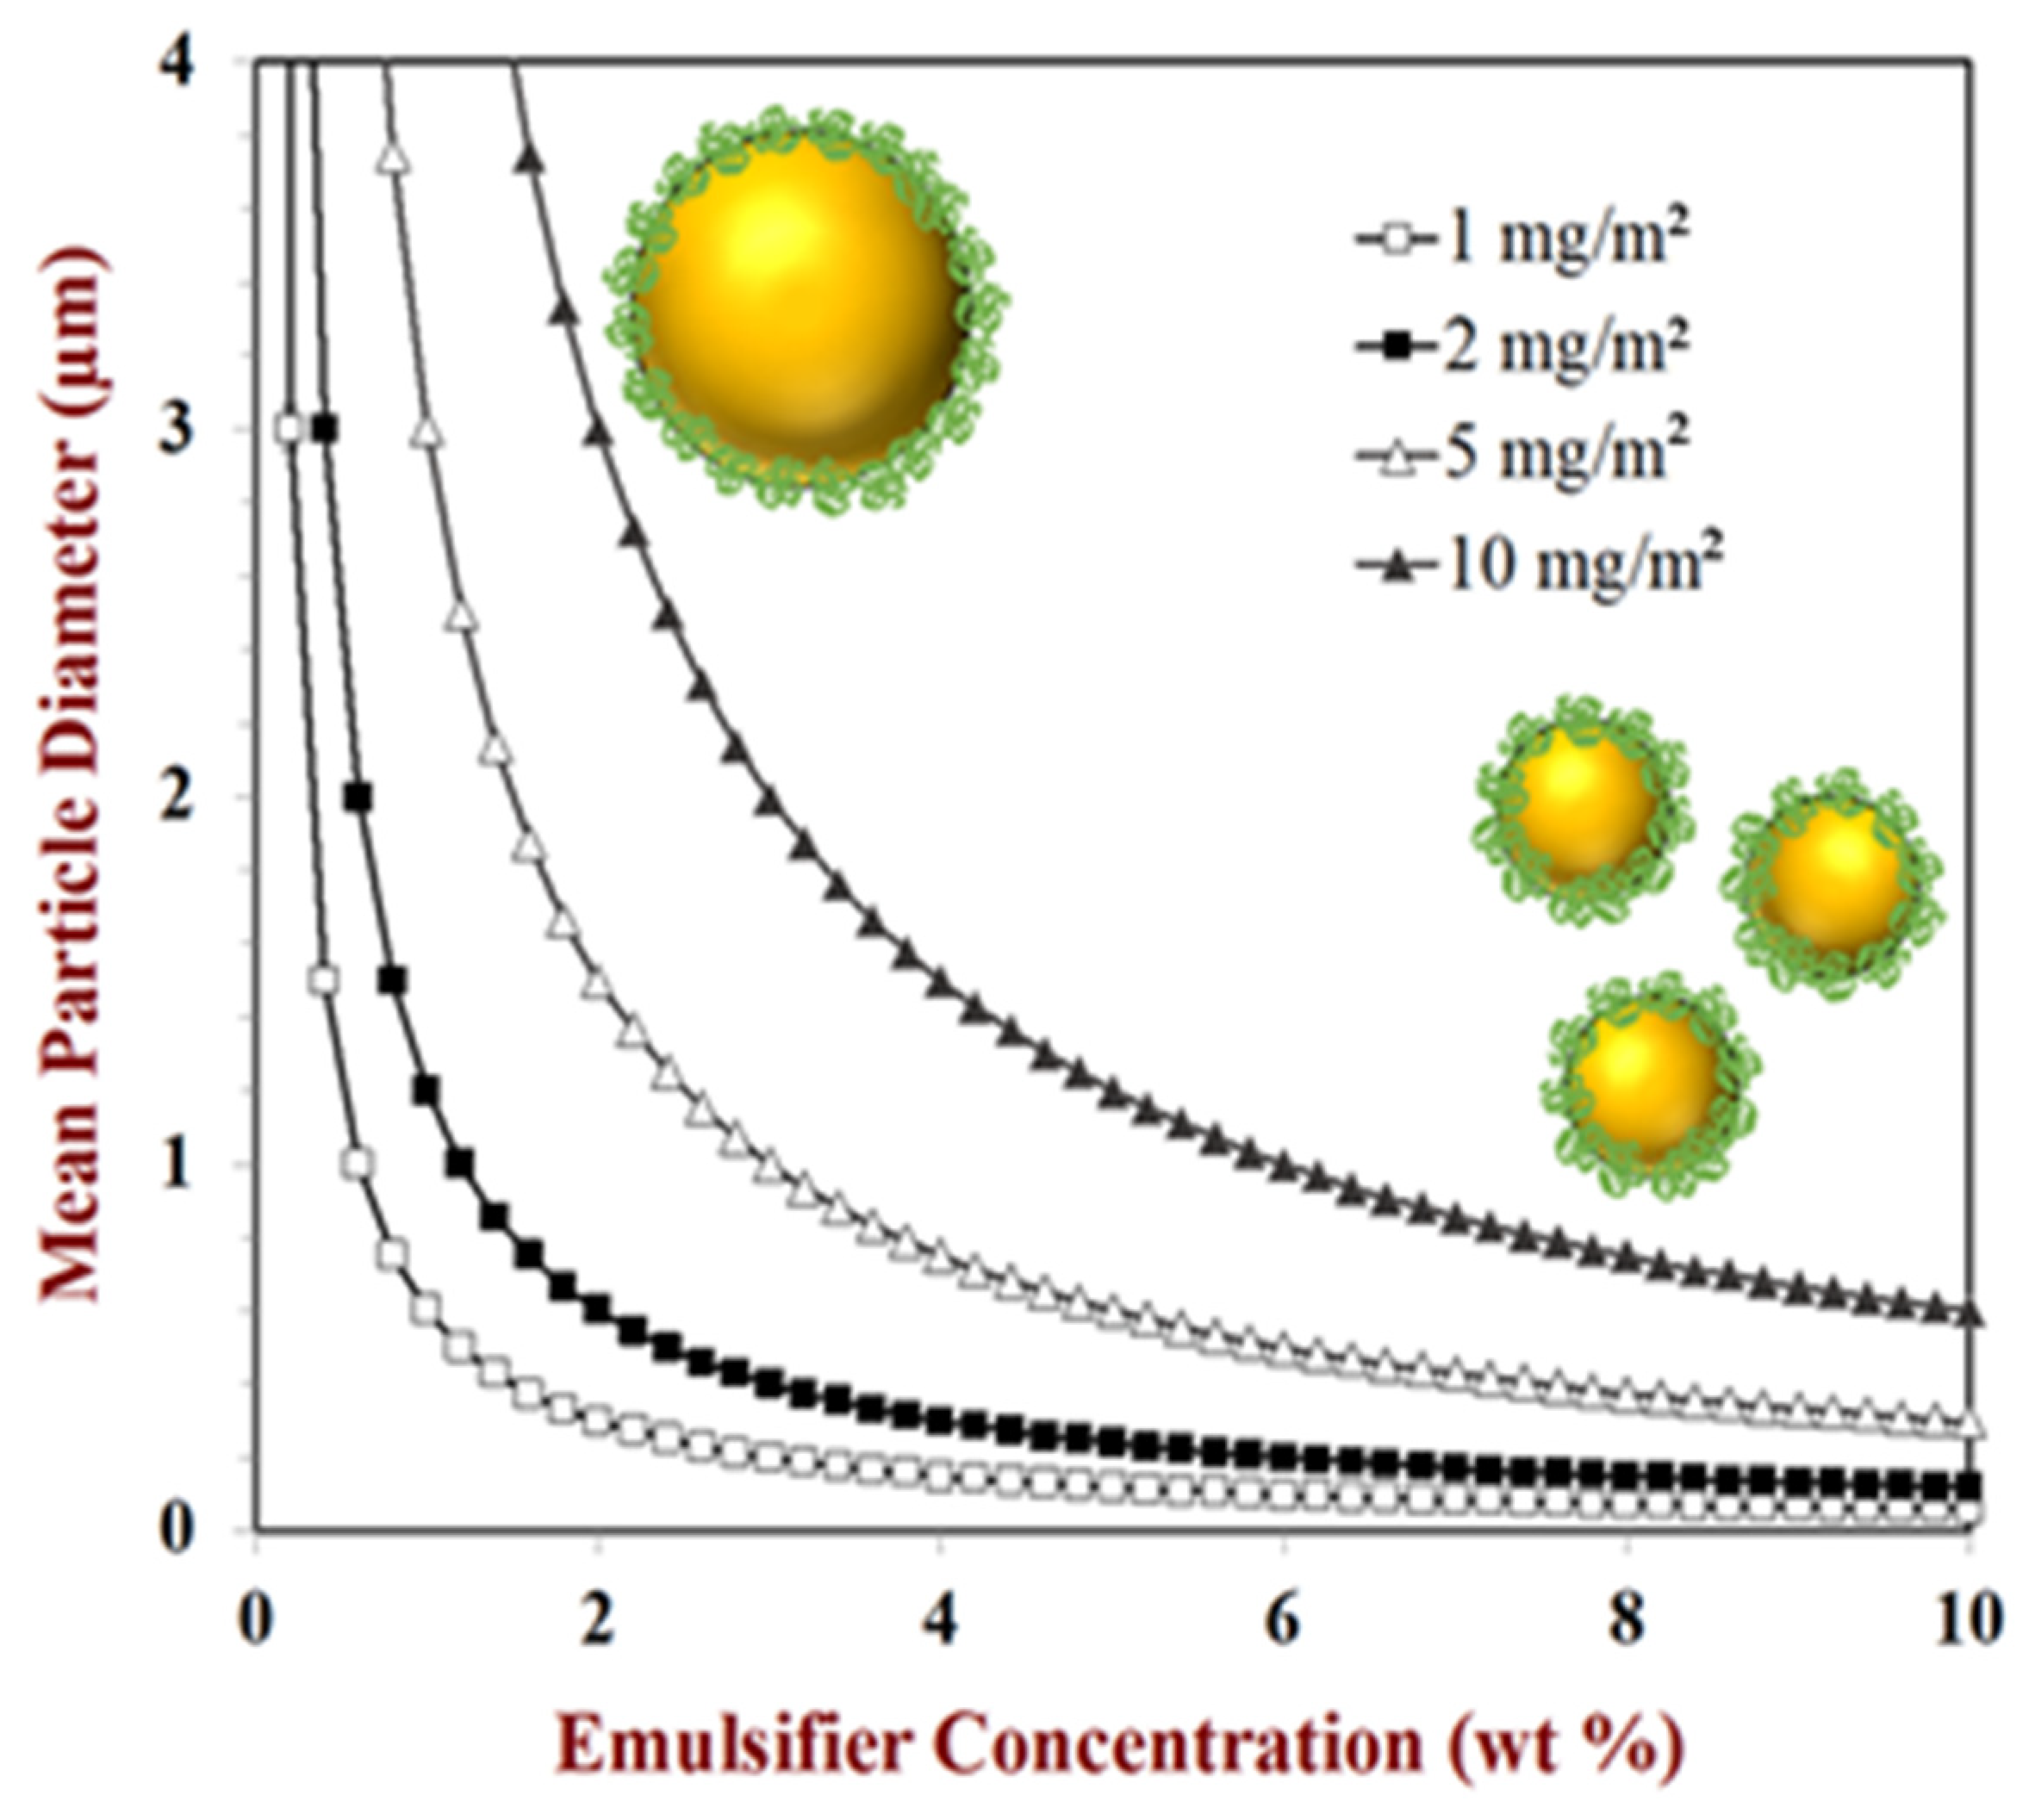
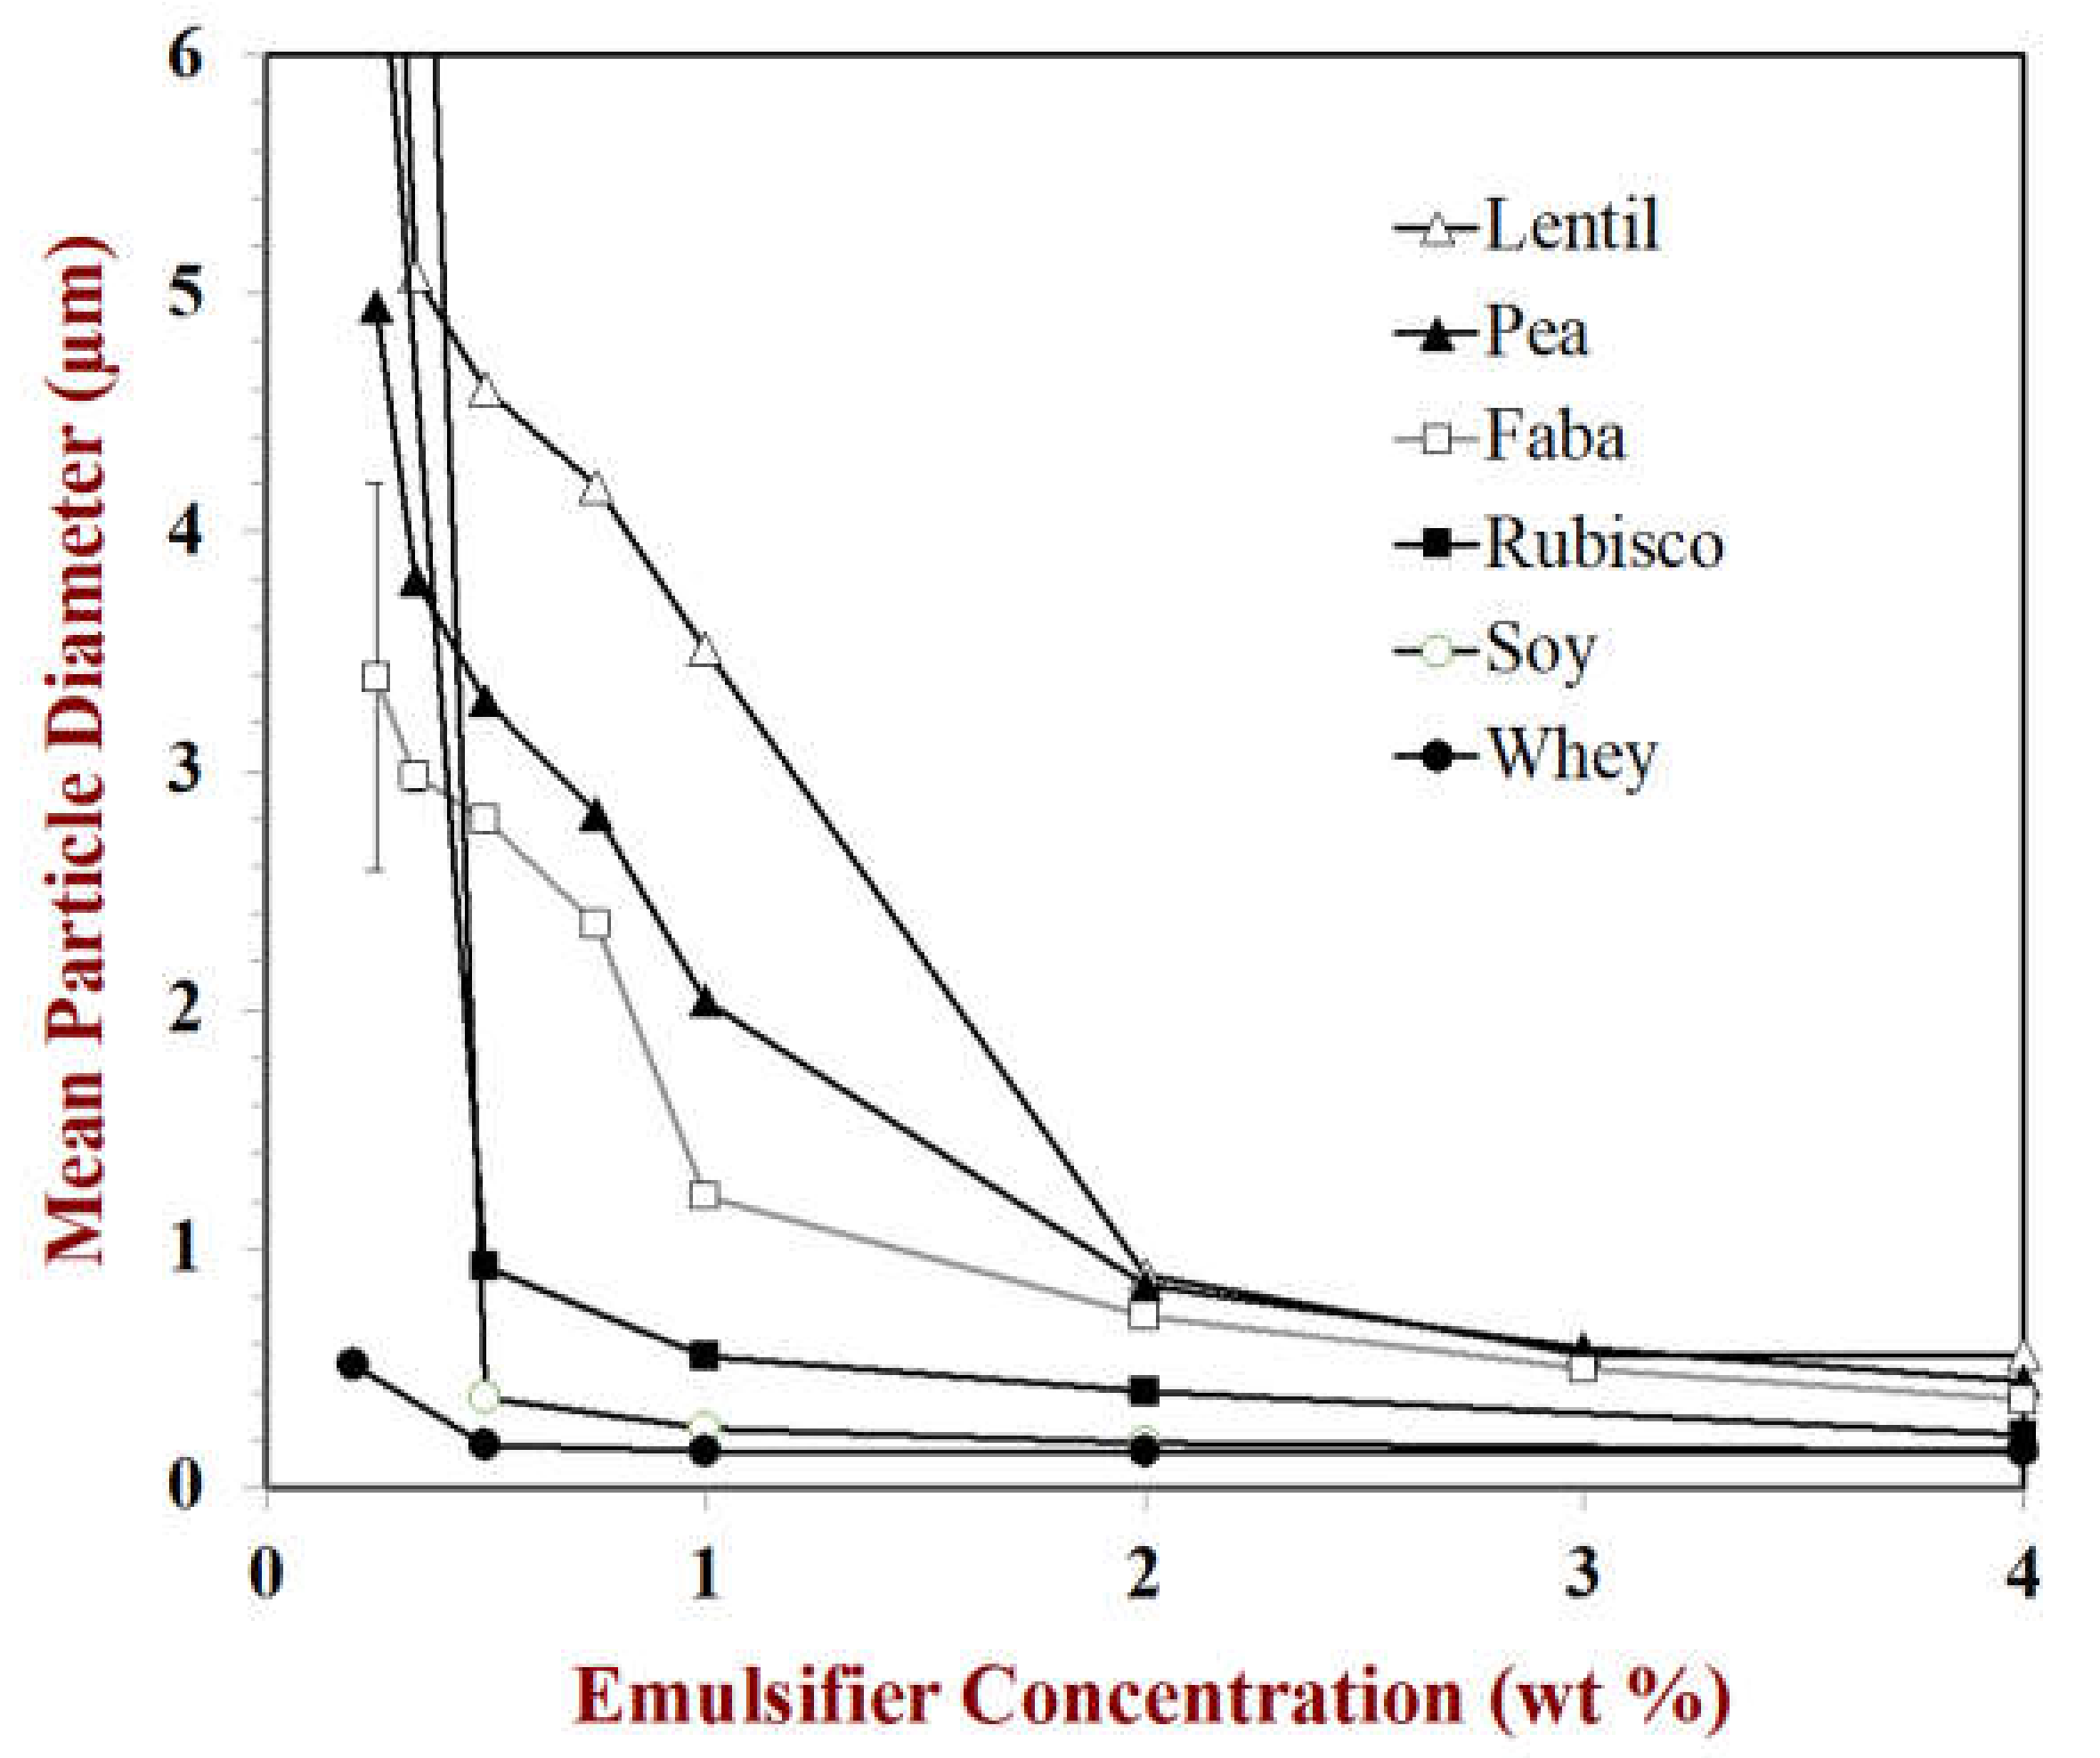
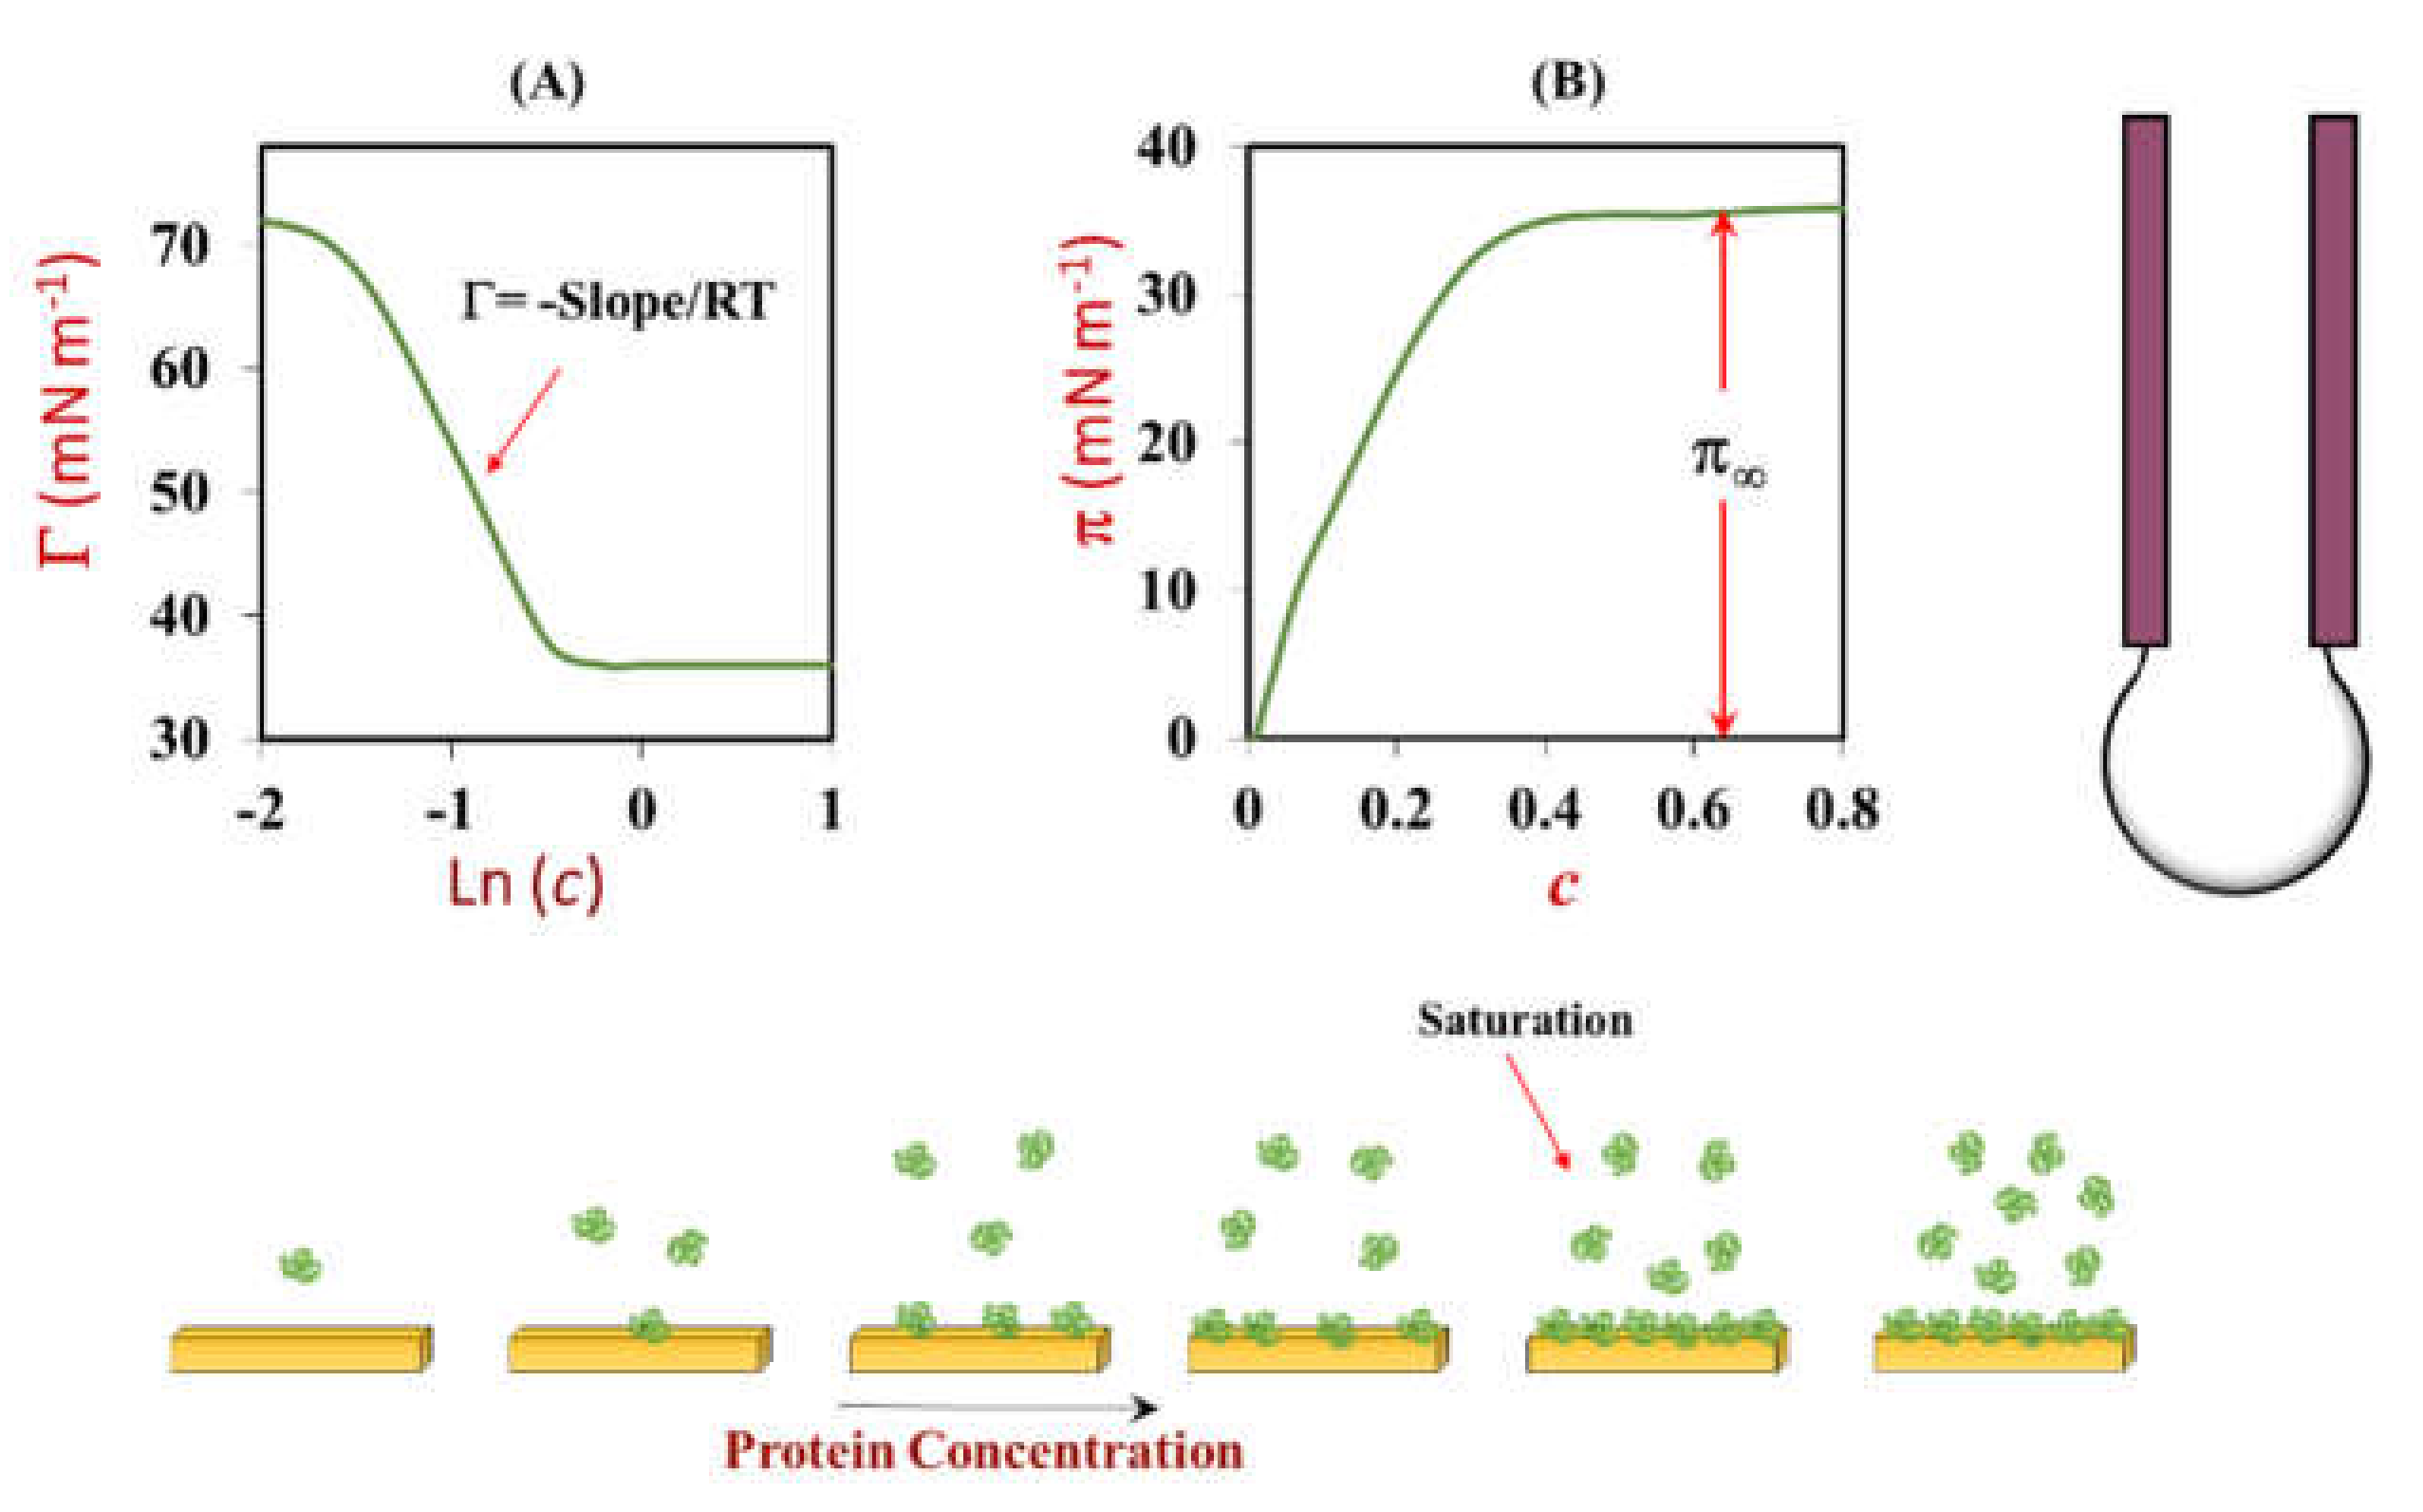
A traditional approach of providing information about the amount of emulsifier required to form a stable emulsion is known as the emulsifying capacity method. The emulsifying capacity is defined as the maximum amount of oil that can be converted into a stable oil-in-water emulsion using a fixed amount of emulsifier under fixed homogenization conditions [18]. The emulsifying capacity can be measured by placing a fixed mass of aqueous emulsifier solution (e.g., 40 g of 1 wt% protein solution) into a container with fixed dimensions (e.g., a 400 mL glass beaker) and then titrating an oil at a controlled rate (e.g., 1 mL per min) into this solution while continuously blending using a high-shear mixer operating at a fixed speed (e.g., 1600 rpm) [88]. The mixer will generate oil droplets with a certain size, depending on its design, and rotation speed. As long as there is enough emulsifier present to stabilize the droplets, a stable oil-in-water emulsion will be formed. But once all the protein has been used up, the oil droplets cannot be stabilized any longer, and any additional oil added will separate. The end point can therefore be determined by measuring the appearance of an oil phase on the surface of the emulsion or by measuring the change in electrical conductivity. The electrical conductivity remains relatively high while an oil-in-water emulsion remains in the beaker but decreases steeply when phase inversion to a water-in-oil emulsion occurs [88]. The volume of oil (VO) required to reach the end point (in mL) can then be determined and the emulsifying capacity (EC) calculated:
E C = V O m E
Here, mE is the mass of emulsifier used (in g). Thus, the EC value is expressed as mL of oil per gram of emulsifier. This method is very simple to implement and does not require any expensive equipment. However, it is difficult to standardize because the emulsifying capacity depends on the conditions used to carry out the experiment, such as the rate the oil phase is added, the type of mixing device used, the type of container used, the shear rate of the mixer, and the method used to detect the end point [89]. Several of these factors are important because they influence the size of the oil droplets generated, which influences the size of the surface area that needs to be covered. More emulsifier is needed to cover smaller droplets because they have a greater surface area. Nevertheless, the method is useful for comparing different kinds of proteins under similar conditions in one set of experiments. However, we would highly recommend measuring the surface load (see next section), rather than the emulsifying capacity when comparing proteins because it is less dependent on the conditions used.

3.2.2. Surface Load

Definition

The surface load of an emulsifier provides a more reliable method of quantifying the amount of emulsifier required to form a particular emulsion [18]. The surface load (ΓS) is defined as the mass of emulsifier per unit surface area of emulsion at saturation (e.g., mg m−2). It can be calculated using the following expression:
Γ S = C A d 32 6 ϕ
Here, CA is the concentration of emulsifier adsorbed to the droplet surfaces, expressed as mass per unit volume of emulsion (mg m−3), φ is the disperse volume fraction, and d32 is the surface-weighted mean droplet diameter (m):
d 32 = i = 1 n n i d i 3 i = 1 n n i d i 2
Here, ni and di are the number and diameter of the droplets in the ith size category of the measured particle size distribution. This value is often reported by static light scattering instruments designed to measure particle size. The above equations show that the concentration of emulsifier required to create an emulsion with a fixed droplet concentration (φ) and size (d32) increases as the surface load of the emulsifier increases. For most proteins, the surface load varies from around 1 to 10 mg m−2, with larger individual proteins or aggregated proteins having higher values. In the remainder of this section, we highlight methods for estimating the surface load of a protein using theoretical calculations or experimental measurements.

Theoretical Calculations

An estimate of the surface load of a globular protein can be obtained by assuming they are monodisperse spheres that are closely (hexagonal) packed at the oil-water interface:
Γ S = m ϕ S S = M W ϕ S N A π r 2
Here, m and S are the mass and cross-sectional area of an individual protein molecule, and φS is the fraction of the surface covered by spheres at maximum packing (around 0.91, i.e., 91%). Assuming they are spherical, the mass and the cross-sectional area of the protein molecules would be m = 4πr3ρP/3 and S = πr2, respectively. Here, r and ρP (≈ 1500 kg m−3) are the radius and density of the protein molecules. Substituting these values in Equation (9) gives:
Γ S = 4 ϕ S ρ P r 3
An expression for the radius of the proteins can be obtained by rearranging the following equation: m = MW/NA = 4πr3ρP/3, where MW is the molecular weight of the protein and NA is Avogadro’s number. Substituting this value in Equation (10) gives:
Γ S = 4 ϕ S ρ P 3 3 M W 4 π ρ P N A 3
When the molecular weight is expressed in kg mol−3, the surface load (in mg m−2) can be estimated using the following simple expression:
Γ S 1.16 M W 3
As an example, for β-lactoglobulin (MW = 18 kg mol−3), bovine serum albumin (MW = 66.4 kg mol−3) and pea legumin hexamer (MW = 350 kg mol−3) the calculated surface loads are 3.0, 4.7, and 8.2 mg m−2, respectively. These values are in the range of those reported for globular proteins [90,91]. These predictions suggest that considerably more (2.7-fold) pea protein would be required to form an emulsion than whey protein, which is consistent with our own experimental measurements (Figure 5), and with those of other researchers [91,92]. In practice, the actual values may be smaller or larger than the predicted values because the proteins are not spherical, the interface may not be fully covered with proteins, or multilayers may form.

Experimental Determination

There are several ways of measuring the surface load of emulsifiers. In this section, we highlight three methods that can be utilized for this purpose.
Centrifugation method: In this method, an oil-in-water emulsion with a known droplet volume fraction (φ) is prepared using a suitable homogenization device [91]. Then, the mean particle diameter (d32) of the emulsion is measured, e.g., using a static light scattering instrument. The emulsion is then centrifuged using conditions that are sufficient to cause the oil droplets to cream to the top while the non-adsorbed protein molecules remain in the lower serum phase (e.g., 15,000× g for 1.5 h). The serum phase is then carefully collected. This process is often repeated two more times to remove any loosely bound proteins from the surfaces of the oil droplets. This is achieved by taking the cream layer, redispersing it in buffer solution, and then centrifuging again. The three different serum layers collected are then pooled together and the protein concentration is measured using a suitable analytical technique, such as one of the UV-visible methods mentioned earlier. The concentration of non-adsorbed protein (CNA) within the original aqueous phase of the emulsion can then be calculated using an appropriate dilution factor (which considers the amount of buffer added when washing the emulsions). The concentration of adsorbed protein can then be calculated: CA = CTCAN, where CT is the total mass of emulsifier per unit volume of emulsion. The surface load can then be determined by inserting this value and the known droplet size and concentration (d32 and φ) into Equation (7). Information about the nature of the proteins adsorbed to the droplet surfaces can also be obtained by collecting the cream layer, adding SDS to displace the proteins from the oil droplet surfaces, centrifuging, and then analyzing the serum phase using SDS-PAGE [91].
Droplet sizing method: This method involves measuring the change in mean droplet diameter (d32) of an oil-in-water emulsion with a fixed droplet concentration (e.g., 10 wt%) under standardized homogenization conditions (e.g., 500 psi, 3 passes) as the emulsifier concentration is increased (e.g., from 0.1 to 5 wt%). In general, the droplet diameter decreases with increasing emulsifier concentration until a limit is reached where the homogenizer cannot generate any smaller droplets (Figure 6). At relatively low emulsifier concentrations, the droplet size is limited by the amount of emulsifier present rather than by the homogenization conditions. Under these conditions, the following relationship applies, which is obtained by rearranging Equation (7):
d 32 = Γ S 6 ϕ C A
In principle, the surface load can then be calculated from the slope of a plot of d32 versus 1/CA: ΓS = slope/6φ. The mean droplet diameter is usually measured using a static light scattering instrument, whereas the emulsion is usually formed using a high-pressure valve homogenizer or microfluidizer. However, there are some assumptions underlying this equation that limit its applicability to proteins. It assumes that all the emulsifier added to the initial aqueous phase is located at the droplet surfaces after homogenization, which may not be the case. Moreover, it assumes that the surface load is independent of protein concentration, which is often not the case. Indeed, studies have reported that the surface load (measured by the centrifugation method) increases with increasing protein concentration, which was attributed to multilayer formation [91]. Despite these limitations, this approach has been used to estimate the surface load of several food proteins and polysaccharides. For instance, it was reported that the surface load of whey protein was around 1.8 mg m−2 and that of gum Arabic was around 64 mg m−2 [45]. The surface load determined using this method is in relatively good agreement with the theoretically predicted value for β-lactoglobulin (3.0 mg m−2), the major protein in whey (Theoretical Calculations section). The reason that the surface load of the whey protein is much smaller than that of gum Arabic can be attributed to the much smaller dimensions and higher density of the globular protein molecules compared to the branched flexible polysaccharide molecules.
Other useful parameters related to emulsifier performance can be obtained from a plot of droplet size versus emulsifier concentration under defined homogenization conditions (Figure 15). For instance, the emulsifier concentration (C1μm) required to form oil-in-water emulsions (10% oil or emulsifier-to-oil ratio of 1:10) with droplets of a specified mean diameter (e.g., d32 = 1 μm) could be used, as well as the mean droplet diameter (d1%) that is obtained when using a constant emulsifier concentration (1% w/w). These parameters may be practically useful for comparing the performance of different emulsifiers under similar conditions. However, they will depend on the type of homogenization used, as well as emulsion composition (such as oil type, pH, ionic strength, and additives).
Interfacial tension method: This method involves measuring the change in interfacial tension with increasing emulsifier concentration (Figure 16). An instrumental tensiometer is used to measure the interfacial tension (γ) at an oil-water interface, such as a drop shape analysis, ring, or drop volume method [18]. For the drop shape analysis method, a known volume of oil is injected into an aqueous solution using a syringe and then the shape of the oil droplet formed is measured, stored, and analyzed using a digital camera attached to a computer. The interfacial tension is then calculated by a mathematical analysis of the shape of the oil droplet. Measurements are usually carried out as the concentration of the emulsifier in the aqueous phase is increased (e.g., from 0 to 5%). Typically, the interfacial tension decreases with increasing emulsifier concentration because more of the unfavorable molecular interactions between the oil and water molecules (arising from the hydrophobic effect) are screened when more protein molecules become attached to the oil-water interface. Eventually, however, the interface becomes saturated with protein molecules and the interfacial tension reaches a constant value (γSAT). The surface load can be obtained from the slope of the interfacial tension versus logarithm of emulsifier concentration curve (Figure 16): Γ = −Slope/RT, where R is the gas constant and T is the absolute temperature. Other useful parameters can also be obtained from this data, as described in the Impact of Emulsifier on Emulsion Formation Section.

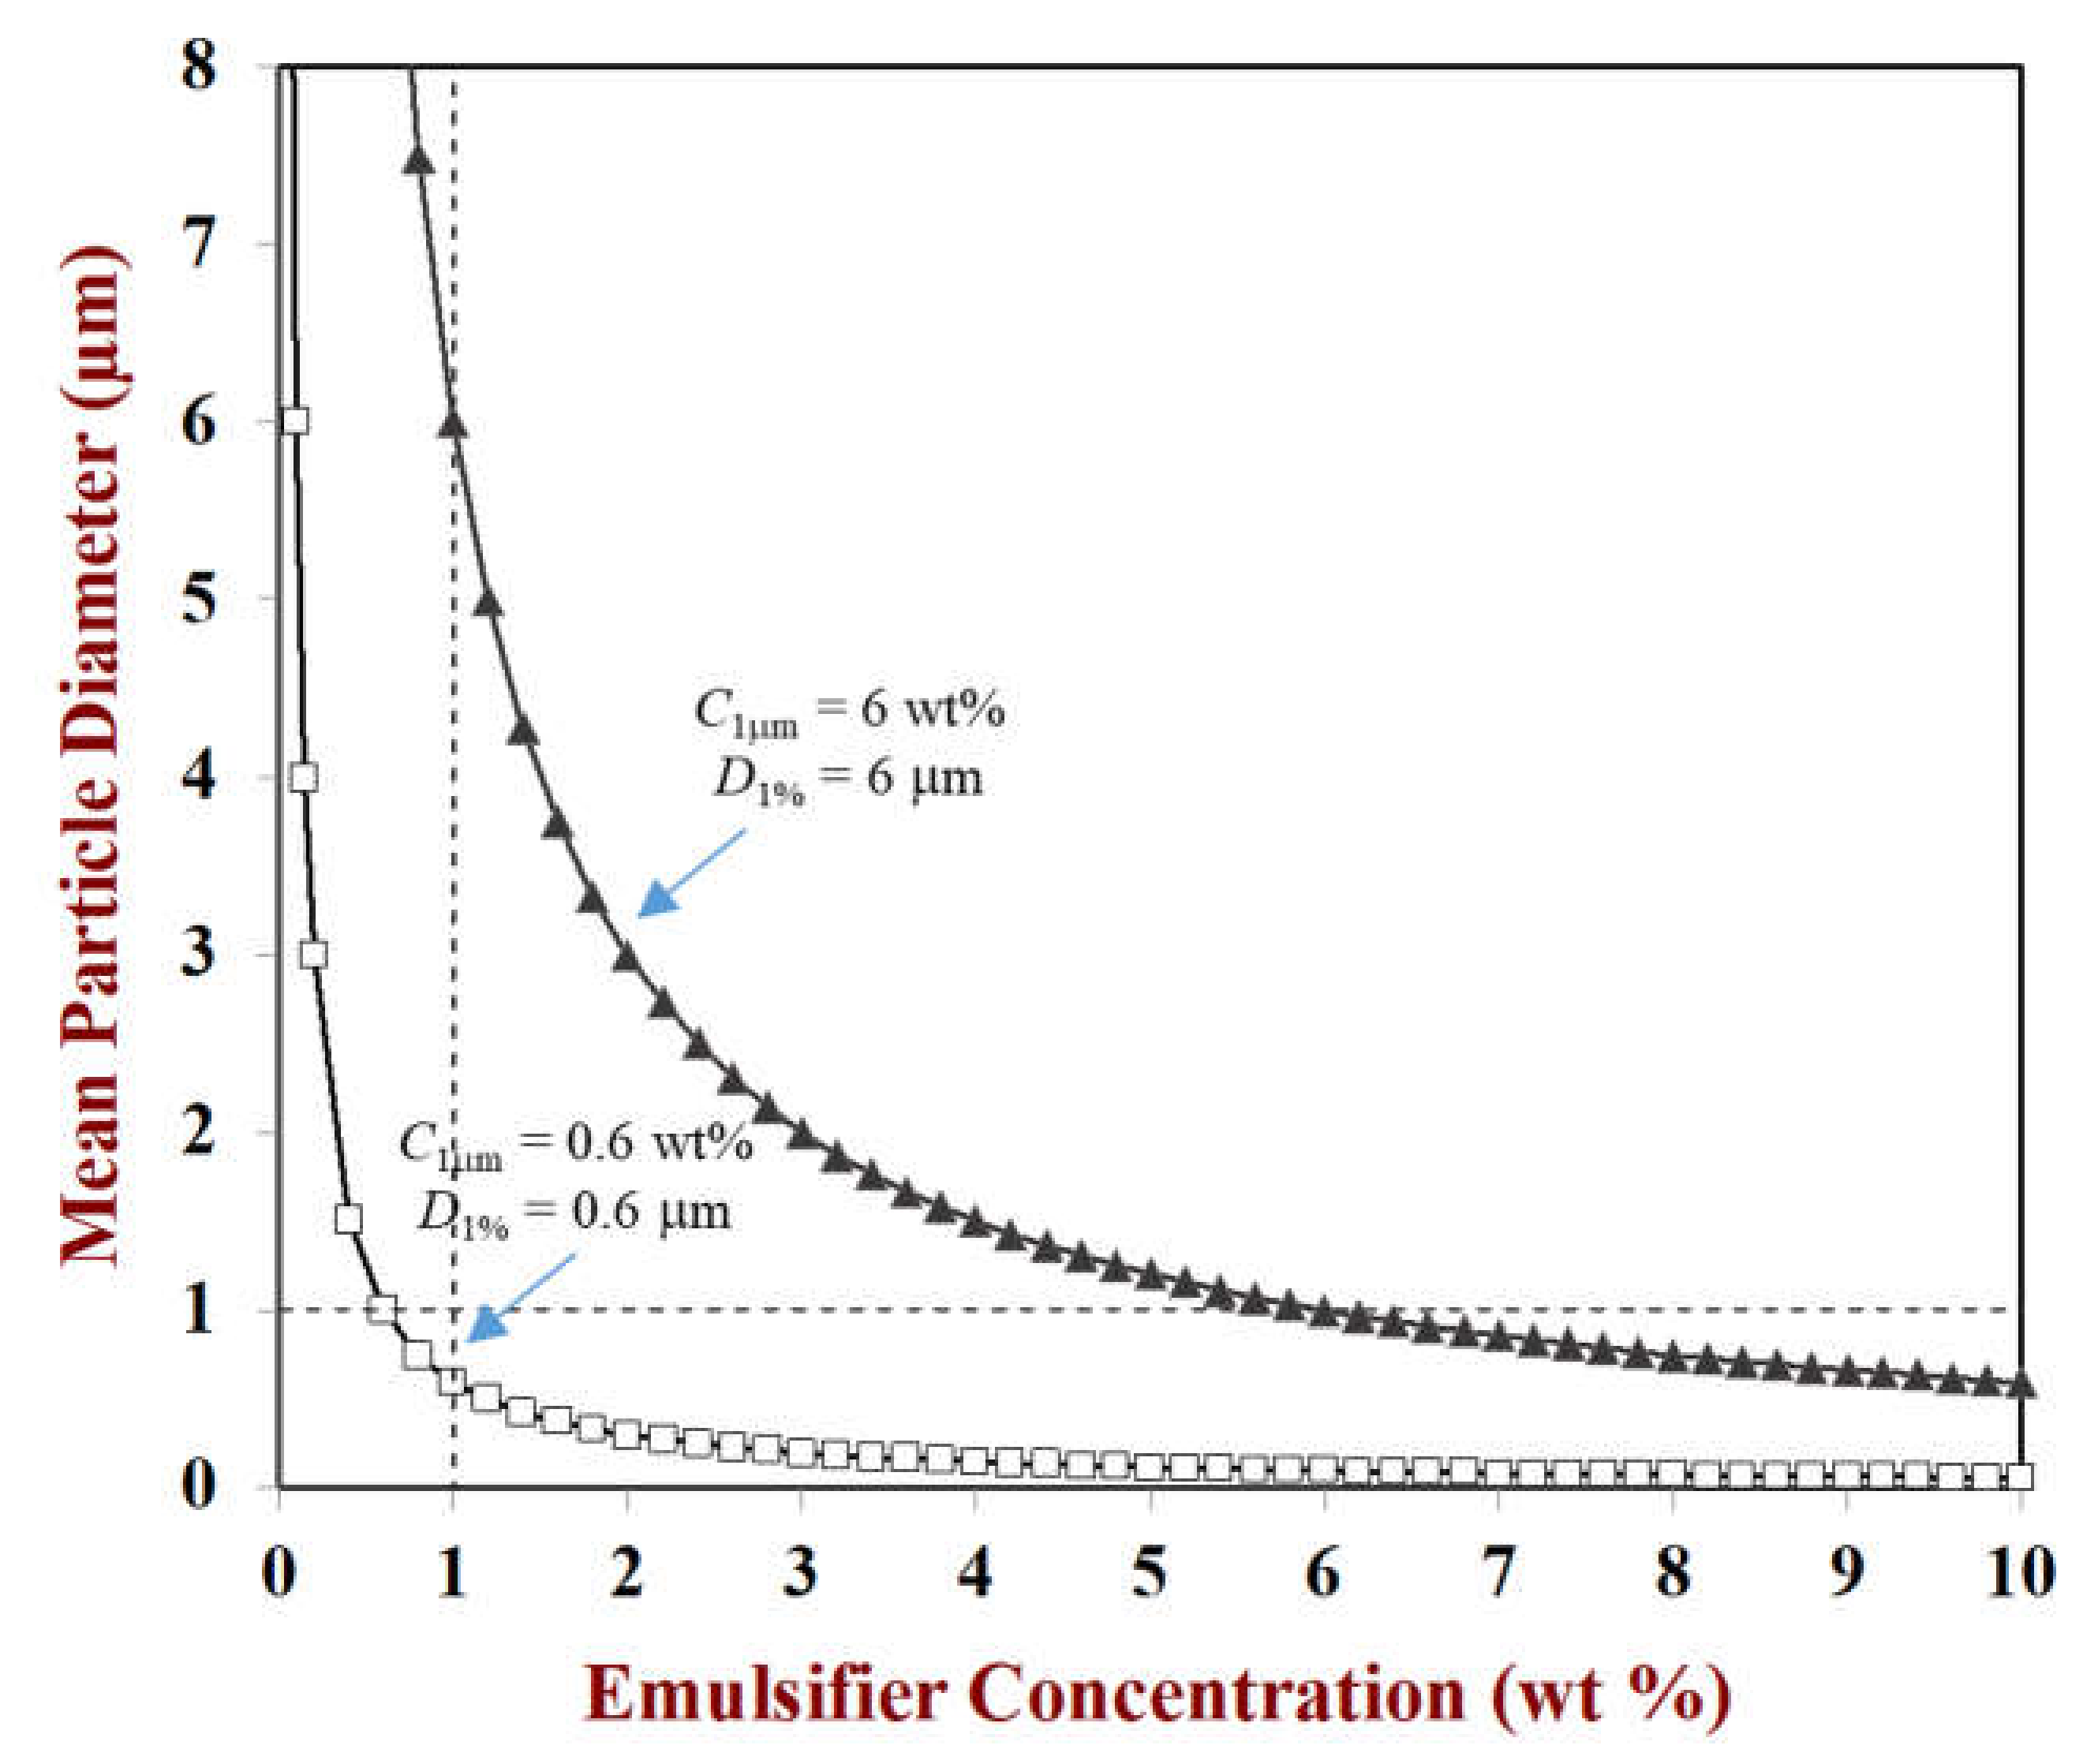
Importance of Surface Load

Information about the surface load of protein-based emulsifiers is useful because it allows one to estimate the amount required to prepare an oil-in-water emulsion of a given droplet size and concentration (Equation (7)). In practice, a greater quantity of emulsifier may be needed because some of it does not adsorb to the droplet surfaces during homogenization. It should also be noted that the surface load depends on pH, ionic strength, temperature, protein concentration, and ingredient interactions. Consequently, these factors should be considered when measuring and reporting surface load data. A summary of measurements of the surface loads of different proteins is given in Table 1.

3.2.3. Saturation Surface Pressure

Measurements of the interfacial tension versus emulsifier concentration (Figure 16a) can also be used to obtain other valuable information about the performance of emulsifiers. The surface pressure (Π) is the difference between the interfacial tension measured in the absence of emulsifier (γ0) and that measured in the presence of emulsifier (γ): Π = γ0 − γ. It is, therefore, a positive number that increases from zero to a fixed value as the emulsifier concentration increases and the interface becomes saturated (Figure 16b). The value of the surface pressure at saturation (ΠSAT) provides a measure of the effectiveness of an emulsifier at screening the thermodynamically unfavorable interactions between the oil and water molecules at the oil-water interface: the higher the value, the more effective the screening. The saturation surface pressure also provides valuable information about the ability of an emulsifier to decrease the interfacial tension, which is important for emulsion formation. As discussed earlier, a lower interfacial tension typically leads to smaller droplet sizes being generated under fixed homogenization conditions (provided the emulsifier can adsorb fast enough). Thus, protein-based emulsifiers that have high ΠSAT values should be more effective at forming small droplets during homogenization than those with low values.

3.2.4. Surface Activity

The surface activity of an emulsifier is a measure of its affinity for an oil-water interface: the higher the value, the stronger the affinity [18]. It is governed by a combination of molecular interaction and entropy effects, which depend on the molecular features of the emulsifier. The molecular interaction contributions are governed by differences in the attractive and repulsive forces of the emulsifier and oil-water interface in the adsorbed and non-adsorbed states. Entropy contributions are mainly governed by the reduction in the mixing and configurational entropies of the emulsifier molecules after adsorption. Molecular interaction effects usually favor protein adsorption, whereas entropy effects usually oppose it. For instance, there is a reduction in the contact area between non-polar groups and water molecules in the system after protein molecules adsorb to an oil-water interface, which is thermodynamically favorable because it reduces the number of unfavorable hydrophobic interactions. In contrast, the mixing and configurational entropies of the protein molecules are reduced after adsorption because their molecular mobility is reduced when they are located at the oil-water interface, which is thermodynamically unfavorable. There may also be repulsive interactions between neighboring protein molecules at the oil-water interface that oppose protein adsorption. For instance, if numerous protein molecules are already adsorbed to the interface, they may generate an electrostatic or steric repulsion that opposes the adsorption of additional protein molecules. Overall, the affinity of a particular protein for an interface depends on a balance of these effects.
At the molecular level, the surface activity of a protein depends on its surface chemistry, flexibility, and molar mass. Proteins with more exposed non-polar groups on their surfaces tend to have a higher affinity for an oil-water interface (provided they do not aggregate with other proteins in solution) because of the stronger hydrophobic effect. Smaller proteins tend to have a greater entropy of mixing effect opposing adsorption than larger ones, which decreases their affinity for the interface. At present, there is not a detailed understanding of the precise molecular features of proteins that influence their surface activity.
Experimentally, the surface activity (SA) of an emulsifier can be defined as the reciprocal of the emulsifier concentration required to increase the surface pressure to 50% of its saturation value: SA = 1/C50%. This value can conveniently be ascertained from a plot of the surface pressure versus emulsifier concentration (Figure 16). Knowledge of the surface activity of a protein can be useful for predicting the relative affinity of different proteins for the droplet surfaces in an emulsion. When present at a similar concentration, proteins with a higher affinity for the interface will tend to preferentially adsorb. A variety of analytical methods are available to measure changes in the interfacial tension when proteins adsorb to oil-water interfaces, including plate, ring, droplet shape analysis, and maximum bubble pressure methods [111].

3.2.5. Adsorption Kinetics

The speed that protein molecules become attached to the oil droplet surfaces during homogenization is important because it influences the ease of droplet formation (by affecting interfacial tension) and the tendency for droplet coalescence to occur (by affecting the colloidal interactions). Ideally, an emulsifier should rapidly adsorb to the oil droplet surfaces during homogenization because the time scale for the small drop formation is very small, typically on the order of milliseconds. Consequently, it is useful to have some measure about the kinetics of emulsifier adsorption to oil-water interfaces. In practice, emulsifier adsorption usually occurs under highly dynamic conditions inside a homogenizer, which is difficult to simulate using analytical instruments. Instead, the adsorption kinetics of emulsifiers is usually determined using quiescent (non-agitated) conditions [18,111,112]. These measurements can still be useful because emulsifier adsorption is often diffusion-limited inside homogenizers, even under dynamic conditions.

3.3. Impact of Emulsifier on Emulsion Stability

The resistance of emulsions to changes in their properties during storage or when their environment is altered is highly dependent on the emulsifier type. Many emulsifiers are effective at stabilizing emulsions under one set of conditions but not under another set. Consequently, it is important to identify the range of conditions where a particular protein-based emulsifier works.
In general, emulsions may become unstable for several reasons, such as creaming, sedimentation, flocculation, coalescence, partial coalescence, oiling-off, and Ostwald ripening [18]. There is therefore a need for appropriate instrumental methods and experimental protocols to characterize the ability of proteins to stabilize emulsions under different conditions [113].

3.3.1. Analytical Instruments Providing Information Relevant to Colloidal Interactions

Interfacial Layer Thickness

The thickness of the interfacial layers formed around oil droplets is important because it influences the steric repulsion between them [18]. Typically, the thicker the interfacial layer, the longer the range and the more effective is the steric stabilization mechanism at preventing droplet aggregation. For this reason, it is useful to have insights into the thickness of the interfacial layers formed by protein-based emulsifiers around fat droplets. The thickness of the interfacial layer depends on the molar mass of proteins, as well as their conformation and orientation at interfaces. The thickness of the interfacial layer usually increases with increasing molar mass. Assuming that a protein has a spherical shape at an interface, the thickness could be given be:
= 6 M W π N A ρ 3
If the molar mass is expressed as kDa, the interfacial thickness is given by the following equation in nanometers:
3.36 M W 3
As examples, the interfacial thicknesses should be around 8.8, 21, and 64 nm for β-lactoglobulin (MW = 18 kg mol−3), bovine serum albumin (MW = 66.4 kg mol−3), and pea legumin hexamer (MW = 350 kg mol−3), respectively. These values should only be treated as rough estimates since proteins are not spherical in reality. In addition, proteins may form multilayers when they are present at relatively high concentrations, which increases the interfacial thickness [114].
Several analytical instruments are available for providing information about interfacial thickness at planar oil-water interfaces, such as those that involve the reflection of light waves [115] or neutrons [116,117]. Nevertheless, these methods usually require specialized equipment that is not available in many food science laboratories. The thickness of the interfacial coatings in emulsions can often be determined indirectly by using monodisperse latex beads instead of oil droplets. The mean particle diameter of the latex beads is measured before (dB) and after (dA) the proteins have been adsorbed to the particle surfaces. The interfacial thickness can then be calculated: δ = (dAdB)/2 [118]. The thickness of interfacial layers in emulsions can also be obtained using neutron scattering methods [119], but these are usually again only available at specialized facilities.

Interfacial Layer Charge

The electrical charge on emulsifier-coated oil droplets influences their electrostatic interactions, which plays a major role in determining their resistance to aggregation, as well as their interactions with other charged ingredients and surfaces [18]. Typically, the greater the electrical charge of the droplet surfaces, the stronger the electrostatic repulsion between the emulsifier-coated fat droplets and the more resistant the emulsion is to aggregation. Consequently, it is useful to have analytical instruments to measure the electrical characteristics of droplets. This is usually achieved using electrophoresis instruments that measure the direction and speed that charged particles move in an applied electrical field. The most common means of measuring particle movement is a laser beam. Indeed, most commercial instruments that measure the electrical properties of particles use this principle. The electrical characteristics are usually expressed as the ζ-potential, which is the effective surface potential of the particles as they move through an applied electrical field. The ζ-potential is determined by the surface charge density of the droplet surfaces (i.e., the net number of charged groups per unit area), as well as by the ionic strength of the surrounding aqueous phase. For protein-based emulsifiers, the surface charge density is highly dependent on pH because the ionization of charged groups (such as carboxyl and amino groups) is determined by the pH relative to their isoelectric point. Consequently, it is important to control the pH of any fluid used to dilute the emulsions prior to analysis. Many researchers dilute their samples with distilled water, which can lead to large errors in the results because the pH of distilled water can vary greatly depending on its origin. Ideally, one should also control and know the ionic strength of the aqueous phase, as this also influences the measured ζ-potential. Typically, the ζ-potential decreases as the ionic strength increases due to electrostatic screening effects, i.e., accumulation of counter-ions around charged groups on droplet surfaces. In summary, it is critical to use an appropriate buffer solution when diluting protein-stabilized emulsions before carrying out ζ-potential measurements.

Interfacial Rheology

The resistance of the interfacial layer to disruption is important for preventing droplet coalescence and partial coalescence. The rheological properties of the interfacial layer play an important role in determining the robustness of the interfacial layer. In particular, the dilatational and shear rheology of the interface are important [120]. The dilatational rheology is related to the resistance of the interface to changes in its surface area, whereas the shear rheology is related to the resistance of the interfacial to deformation or flow (at constant surface area) when a shear force is applied.
An interface may have viscous and/or elastic components to its rheological properties. Consequently, it is possible to measure the interfacial viscosity or elastic modulus. A number of different analytical instruments are available to measure the shear and dilatational modulus of interfaces, which have been reviewed in detail recently [111]. Under quiescent conditions, interfaces with a high elastic component are usually more resistant to disruption. However, under shear conditions, interfaces with strong elastic properties may be irreversibly torn or ripped, which promotes droplet coalescence [121]. Indeed, this has been shown to be a problem with globular proteins that form covalent crosslinks with each other at the interface [37]. Many plant proteins are globular proteins that are capable of unfolding at an interface and forming crosslinks with each other. Consequently, they may be unstable to coalescence when sheared at rates that are sufficiently high to promote interfacial tearing. Nevertheless, further research is required in this area to establish the resistance of plant-protein stabilized emulsions to this mechanism.

3.3.2. Analytical Instruments for Characterizing Emulsion Stability

A range of analytical instruments are available for characterizing the stability of emulsions during storage or when they are exposed to particular environmental conditions, which have been reviewed in detail previously [33]. In this section, we therefore provide a brief overview of the different instrumental methods available, with a special emphasis on some of the factors that should be considered to make accurate and reliable measurements.

Particle Size and Aggregation State

Analytical instruments are required to provide information about the dimensions of the individual droplets in emulsions, as well as their aggregation state (e.g., separated or associated). The most common methods for this purpose are microscopy and particle sizing instruments [18].
Microscopy: Several kinds of microscopy instruments are available to provide information about the morphology of emulsions, including optical, electron, and atomic force microscopy. These instruments are based on different physical principles, which determine the contrast, magnification, and resolution of the images of the emulsions. The size of the particles that can be observed using these different technologies decreases in the following order: optical microscopy > scanning electron microscopy (SEM) > transmission electron microscopy (SEM) > atomic force microscopy (AFM). Typically, the particles in an emulsion must be larger than about 500 nm to be observed by optical microscopy, which limits its application for observing individual droplets in fine emulsions or nanoemulsions but it can often be used to detect whether these droplets are aggregated or not. In optical microscopy, the different components in an emulsion, such as the oils, proteins, and polysaccharides, can be selectively stained using colorimetric or fluorescent dyes, which can be utilized to provide information about the relative location of these different components in the system. In addition, cross-polarizers can be used to provide information about the location and morphology of any birefringent materials, such as fat crystals, starch granules, or protein fibers. Electron microscopy methods can usually observe smaller structures in emulsions than optical microscopy methods, but much more extensive sample preparation is often required, which can damage the sample and lead to artifacts in the images. Moreover, the instrumentation required is usually more expensive and time-consuming to use. Atomic force microscopy methods have also proved useful for providing information about the size and aggregation state of the droplets in emulsions and nanoemulsions but these are again much less widely available than optical microscopy methods.
Instrumental particle sizers: Several kinds of analytical instruments have been developed that are designed to measure the size of the particles in emulsions and other colloidal dispersions. These instruments are often simple to use and provide information about the full particle size distribution in a few minutes. The most widely used instruments are based on the scattering of light waves from particles, but instruments are also available that use other principles such as electrical pulse counting, gravitational separation, and nuclear magnetic resonance [18]. In this section, we focus on light scattering instruments since they are by far the most common.
There are two main kinds of particle sizing instruments based on light scattering: static and dynamic light scattering (SLS and DLS). SLS is based on measuring the diffraction pattern of a colloidal dispersion, i.e., the change in light intensity with diffraction angle. Typically, small particles scatter light waves at wider angles than large ones. As a result, the particle size distribution can be calculated by measuring the diffraction pattern and using a suitable mathematical model (such as Mie theory) to interpret the data. DLS is based on measuring the intensity fluctuations of a light wave transmitted or reflected from a colloidal dispersion, i.e., the change in intensity with time. The intensity fluctuations are more rapid for smaller particles than larger ones. Consequently, the particle size distribution can be calculated by measuring the intensity fluctuations of an emulsion and using a suitable theory to interpret the data. The range of particles that can be assessed depends on the type of light scattering instrument used: around 1 nm to 10 μm for DLS and around 100 nm to 1000 μm for SLS. For this reason, it is essential to select the most appropriate type of analyzer for the system being examined. For instance, a fine emulsion may start with small droplets (a few hundred nanometers) but may contain large particles (tens or hundreds of micrometers) if extensive aggregation occurs. In this case, DLS may not be appropriate for providing information about the aggregated system.
There are several other factors that should be considered when using light scattering methods for detecting particle aggregation:
  • Aggregation type: It is difficult to establish whether an observed increase in particle size in an emulsion is due to flocculation or coalescence. The instrument reports a particle size distribution and mean particle diameter, but it is not possible to ascertain the origin of droplet aggregation from this data alone. In some cases, however, insights can be obtained about the aggregation type. For instance, the particle size distribution of a protein-stabilized emulsion can be measured, and then a small molecule surfactant (e.g., 1% SDS or Tween 20) is added. The emulsion is then incubated for a few hours and the particle size distribution is measured again. During incubation, the surfactant adsorbs to the fat droplet surfaces and displaces the original emulsifiers, thereby disrupting any flocs. If the particle size distribution does not change after the surfactant is added, then it is assumed that droplet aggregation is due to coalescence. Conversely, if the size of the particles decreases appreciably after the surfactant is added, then it can be assumed that droplet aggregation is due to flocculation.
  • Actual particle size: The instrument software assumes that the objects that scatter light are isolated homogeneous spheres with well-defined refractive indices, which is not the case for flocculated emulsions. Flocculated emulsions contain heterogeneous irregular particles that do not have a well-defined refractive index. Consequently, the results reported by the instrument do not reflect the true size of the particles within the emulsion. In this case, the results should only be used to provide information about whether aggregation is occurring or not.
  • Dilution effects: Typically, emulsions must be diluted prior to analysis by light scattering to obtain a sufficiently strong signal while avoiding multiple scattering. As mentioned earlier, it is critical to carefully dilute the emulsions so as not to alter their aggregation state. If the droplets in flocs are only held together by weak attractive forces (such as depletion forces), then they may be disrupted when they are diluted and stirred. As a result, the particle size measured for the analyzed emulsion may be smaller than that in the actual emulsion. For protein-stabilized emulsions, the pH and ionic strength of the aqueous phase used to dilute the samples should be similar to those found in the original sample to minimize any changes in the colloidal interactions between the droplets.

Gravitational Separation

One of the most common instability mechanisms in emulsions is gravitational separation due to the upward (creaming) or downward (sedimentation) movement of the droplets. For O/W emulsions, which are the ones most commonly stabilized by proteins, creaming typically leads to a clear droplet-depleted serum layer at the bottom and a droplet-rich cream layer at the top. The formation of these layers can often be detected by the eye, where they are taken to be a quality defect by consumers. It is therefore important to be able to measure and predict the rate and extent of creaming in emulsions [18].
The simplest way to monitor creaming is to measure the height of the serum and/or cream layers as a function of time using a ruler. A record of the changes in emulsion stability can also be obtained by taking digital photographs of them over time when they are stored in controlled conditions. These approaches can be used to characterize emulsions where changes in the visual appearance are obvious. However, in some cases, creaming and/or sedimentation may have occurred in an emulsion, but it is difficult to detect the boundary between the serum, emulsion, or cream layers. In this case, laser profiling methods can be used to provide a more precise and objective measure of creaming or sedimentation. There are two main types of these devices that are commonly used:
Turbiscan: This instrument uses a laser that can move in the vertical direction to measure the change in the backscattered (BS) and transmitted (T) light as a function of sample height and storage time. The backscattered light tends to increase with increasing droplet concentration, whereas the transmitted light tends to decrease (although they also depend somewhat on droplet size). Consequently, measuring changes in BS and/or T with sample height during storage can be used to provide detailed information about the resistance of the droplets to movement due to gravity. This instrument is produced and distributed by Formulaction (Toulouse, France).
LUMiFuge: This instrument also uses a laser to measure the fraction of transmitted light as a function of sample height and storage time. But the sample is placed in an analytical centrifuge and centrifuged at a fixed speed throughout the measurements. As a result, the upward or downward movement of the particles in an emulsion is much faster than due to simple gravity. The main advantage of centrifuging the emulsions during the measurements is that it accelerates their phase separation, which may be useful for developing a more rapid test of emulsion stability. However, it would not be able to pick up events that occur slowly during storage, such as flocculation, which would accelerate phase separation due to the increase in particle size. This instrument is produced and distributed by LUM GmbH (Berlin, Germany).
Other instruments can also be utilized to measure phase separation in emulsions that utilize different physical principles. For instance, magnetic resonance imaging, ultrasonic imaging, X-ray tomography, and electrical conductivity measurements have all been used for this purpose but these instruments are not widely available in most food laboratories [18].

3.3.3. Emulsion Stability Testing Protocols

Several emulsion testing protocols have been developed to quantify the ability of emulsifiers to stabilize O/W emulsions. The results of these protocols can be used to compare the relative performance of different kinds of emulsifiers. In this section, we highlight some of the most commonly used protocols. In particular, we propose a series of standardized tests that can be used to compare the ability of emulsifiers to stabilize emulsions under different environmental conditions, which may be useful when selecting an emulsifier for a specific food application.

Emulsion Stability Index

Researchers have developed parameters to quantify the resistance of emulsions to droplet aggregation under specified conditions. One of the most widely used parameters is the emulsion stability index or ESI [122]. Originally, the ESI was calculated by measuring the turbidity of a diluted emulsion over time using a UV-visible spectrophotometer but more recently it is calculated by measuring the droplet diameter over time using a particle sizing instrument [113]:
ESI = d 0 × t d t d 0
Here, d(0) is the initial mean particle diameter of the emulsion and d(t) is the mean particle diameter measured at time t. One of the challenges with the ESI method is that it does not provide a good numerical indication of emulsion stability: the ESI tends to infinity for a stable emulsion but is small for an unstable one. A more convenient parameter is the emulsion instability index (EII):
EII = d t d 0 d 0 × t
This value provides a measure of the rate of change in the particle size over time. Thus, the EII value increases as the instability of an emulsion to droplet aggregation increases. The EII is simply the reciprocal of the ESI value.
There are several challenges associated with using a single parameter to describe the ability of an emulsifier to stabilize an emulsion against aggregation:
  • The particle size of an emulsion may increase due to various physicochemical mechanisms including flocculation, coalescence, and Ostwald ripening. The ESI or EII value does not provide insights into which of these mechanisms is dominant, which can be important for developing effective strategies to improve emulsion stability.
  • Typically, the mean particle diameter does not increase linearly with time. Instead, the particle size may increase during the initial stages of storage and then reach a constant value. As a result, the ESI or EII value depends on the time when the particle size is measured. For this reason, it is useful to stipulate a fixed storage time when comparing the effectiveness of different emulsifiers to stabilize emulsions, e.g., 24 h, 1 week or 1 month. Based on our practical experience with protein-stabilized emulsions, we recommend an incubation time of 24 h. This is usually sufficient to observe increases in droplet aggregation, without causing concerns with microbial growth.
  • The particle size distribution of an emulsion often changes from mono-modal (single-peaked) to multi-modal (multi-peaked) during storage, depending on the nature of the instability mechanism. We recommend that the time-dependence of the particle size distribution should be measured to provide insights into the origins of emulsion instability.
  • The values of the ESI and EII parameters depend on the type of mean particle diameter used in the calculations, such as d10, d32 or d43. Consequently, it is important to use the same mean particle diameter when comparing different emulsifiers. We recommend using the d43 value as this is most sensitive to particle aggregation.
  • The rate of increase in the particle size over time depends on the initial droplet size, droplet concentration, and continuous phase rheology in the emulsion being tested. These factors should therefore be standardized when comparing different emulsifiers. We recommend using an initial droplet diameter of 100–500 nm (to avoid creaming during storage), a droplet concentration of 10%, and pure water or buffer solution as the aqueous phase.
In general, when studying and comparing the performance of proteins as emulsifiers, we recommend that the full particle size distribution should be measured over time, or before and after some specified treatment (such as a change in pH, ionic strength, or temperature). We also recommend that the d32 and d43 values should be calculated from the particle size distributions and plotted versus time, or some other parameter (such as pH, ionic strength, or temperature). Finally, we recommend that an EII value obtained under standardized conditions should be reported for each emulsifier: i.e., an EII calculated from d43 values measured at 0 and 1 day storage of 10% oil-in-water emulsions. In this case, the emulsion instability index is simply expressed as EII = [d(t) − d(0)]/d(0). The same equation can be used to calculate the instability index of an emulsion after being exposed to some environmental stress test. The following criteria can be used to judge the stability of an emulsion:
  • 0 < EII < 0.05: Highly stable
  • 0.05 < EII < 0.5: Moderately stable
  • 0.5 < EII < 5.0: Moderately unstable
  • EII > 5.0: Highly unstable
These values should only be taken as rough guidelines but they do provide some valuable criteria for comparing one kind of emulsifier with another.
Due to the limitations of this method, and its high sensitivity to the experimental conditions used, we do not recommend the emulsion stability or emulsion instability indices as a good indicators of the ability of different proteins to stabilize emulsions. Instead, we recommend measuring changes in particle size using light scattering and microscopy under well-defined environmental conditions (see next section).

Environmental Stress Tests

Protein-based emulsifiers must perform in a range of different food matrices under a range of different processing, transport, storage, and food preparation conditions. Consequently, it is important to establish the range of conditions where they can form stable protein-coated fat droplets, as well as the range of conditions where they cannot be used. In this section, we propose a series of environmental stress tests that can be used to characterize and compare the properties of different protein-based emulsifiers. These methods are based on the authors decades of experience working with protein-stabilized emulsions. Widespread implementation of these methods could lead to the generation of a standardized database that could be used to compare the effectiveness of different emulsifiers.
Preparation of stock emulsion: Initially, a stock emulsion is prepared at ambient temperature using the protein-based emulsifier to be tested. We recommend producing a 10% oil-in-water emulsion by homogenizing 10% w/w of a food-grade oil (such as corn oil, sunflower oil, or canola oil) and 90% w/w of a buffered protein solution (10 mM phosphate buffer, pH 7.0). The target mean droplet diameter (d32) should fall within the range 100 to 500 nm. Typically, this droplet size can be achieved using a high-pressure valve homogenizer, microfluidizer, or sonicator. A high shear mixer or blender is usually unsuitable for this purpose because it cannot produce droplets that are small enough. The droplets produced using mixers or blenders are typically larger than 1000 nm and so tend to cream rapidly even if no aggregation occurs. Ideally, enough protein should be present to coat all the fat droplets without having too much excess protein in the surrounding aqueous phase. Typically, 1% protein should be sufficient to achieve this goal, but more or less may be required for certain kinds of emulsifiers. For instance, we have found that higher levels of protein (e.g., 2 or 5%) are required to produce small fat droplets (<500 nm) using certain kinds of plant proteins. Consequently, it may be necessary to carry out an initial screening experiment where the mean particle diameter (d43) is measured as a function of emulsifier concentration to select the most appropriate level of protein to use. The lowest protein concentration required to produce oil droplets with diameters below 500 nm can then be used to formulate the emulsions. Droplets with diameters (d43) < 500 nm should be resistant to creaming over a 24 h period (<4 mm/day), provided they do not aggregate with each other. As a result, the factors that affect droplet aggregation can be elucidated more easily. The emulsions should be prepared at an initial pH where they are known to be stable (usually pH 7) and should not contain any added salts (low ionic strength) to ensure there is a strong electrostatic repulsion between the droplets.
Stress tests: Once a stock emulsion has been prepared its resistance to droplet aggregation when exposed to a series of environmental stresses should be quantified and reported in a standardized fashion. We recommend that the emulsions be exposed to the following standardized stress tests and then their properties measured (as described at the end of this section).
pH stability: The stock emulsion is used to prepare a series of emulsions containing 1% oil but different pH values: pH 2, 3, 4, 5, 6, 7, and 8. These emulsions are then gently mixed to ensure they are homogeneous and incubated for 24 h at ambient temperature under quiescent conditions prior to analysis. Additional pH values may be added near the isoelectric point (pI) of the protein-coated oil droplets to provide more detailed information about the stability range, e.g., pH 4.25, 4.5, 4.75, 5.00, 5.25, 5.50, and 5.75 for an emulsifier with a pI of 5.0. These experiments are usually carried out in the absence of salt, but they can also be carried out in the presence of 150 mM NaCl to examine the combined influence of pH and salt.
Salt stability: The stock emulsion is used to prepare a series of emulsions containing 1% oil but different salt concentrations: 0, 25, 50, 75, 100, 200, 300, and 400 mM NaCl. The emulsions are then gently mixed to ensure they are homogeneous and incubated for 24 h at ambient temperature under quiescent conditions prior to analysis. Other types and amounts of salts can be examined if they are known to be present in a particular food or beverage product where the emulsifier will be used (e.g., calcium or potassium).
Heat stability: The stock emulsion is used to prepare a series of emulsions containing 1% oil and a known pH and ionic strength (e.g., pH 7, 0 mM added salt). Alternatively, pH and salt conditions that simulate those found in a commercial product where the emulsifier may be used can be utilized. The emulsion samples are then gently stirred to ensure they are homogeneous. Each test tube containing an emulsion sample is then incubated in a controlled temperature environment (such as a water bath) for a fixed time and temperature. We recommend that separate emulsion samples are incubated at 30, 40, 50, 60, 70, 80, and 90 °C for 30 min, then cooled to ambient temperature and stored for 24 h prior to analysis. For more detailed information about the stability range, additional temperatures can be included, especially around the thermal denaturation temperature of the proteins. In some cases, thermal processing conditions that simulate those that a food product containing the emulsifier might experience commercially may be used such as pasteurization (e.g., 63 °C for 30 min), sterilization (121 °C for 20 min), or cooking (100 °C for 10 min).
Refrigerator stability: The stock emulsion is used to prepare a diluted emulsion containing 1% oil and a known pH and ionic strength (e.g., pH 7, 0 mM added salt). The emulsion is then stored for 1 week in a refrigerator (around 4 °C), before being removed, incubated at ambient temperature for 2 h, and then analyzed.
Freeze-thaw stability: The stock emulsion is used to prepare a diluted emulsion containing 1% oil and a known pH and ionic strength (e.g., pH 7, 0 mM added salt). This sample is placed in a plastic test tube (to avoid cracking of glass) and then subjected to freezing (e.g., −20 °C for 24 h) and thawing (e.g., +20 °C for 24 h). This procedure may be repeated several times to simulate thermal fluctuations experienced by commercial products. The freezing and thawing temperatures used are important because water and fat may crystallize and melt at different temperatures.
Mechanical stress: The stock emulsion is used to prepare a diluted emulsion containing 1% oil and a known pH and ionic strength (e.g., pH 7, 0 mM added salt). The emulsions are then exposed to controlled mechanical stress conditions e.g., by placing them in a blender and then shearing them at 1000 rpm for 30 min. The emulsions are then removed from the blender, allowed to stand for 24 h, and then analyzed. These measurements are usually carried out at ambient temperature.
Analysis of samples: After being subjected to these environmental stress conditions, the mean particle diameter (d32 and d43), aggregation state, charge, and creaming stability of the emulsions are measured. The mean particle diameter is usually measured using a static light scattering instrument but a dynamic light scattering instrument can also be used (provided the aggregates formed are small enough to detect, i.e., <10,000 nm). The origin of droplet aggregation (flocculation or coalescence) can be established using microscopy methods and/or by measuring the particle size distribution before and after adding a surfactant. The particle charge (ζ-potential) can be measured using the electrophoresis instruments discussed earlier. The resistance to creaming can be established by taking a digital photograph of the sample or by using a Turbiscan instrument. In addition, other parameters may also be measured depending on the nature of the end product and purpose of the experiments, such as the appearance, rheology, flavor profile, or chemical degradation of specific components.

4. Application of Proposed Standardized Tests

In this section, we demonstrate the effectiveness of the proposed standardized tests for quantifying and comparing the performance of different protein-based emulsifiers. Information about the ability of several protein-based emulsifiers to form emulsions is summarized in Table 1, whereas information about their ability to stabilize emulsions is summarized in Table 2, Table 3 and Table 4. These tables show that there are appreciable differences in the ability of plant and animal proteins at forming and stabilizing emulsions. Typically, proteins with a higher molecular weight have a higher surface load, which means that more protein is required to form a given emulsion (Table 1). For most proteins, the emulsions are highly unstable to aggregation when the pH is around their isoelectric point, however, there are still differences in the range of pH values where they can form stable emulsions (Table 2). Some protein-stabilized emulsions tend to aggregate at high salt levels, whereas others become more stable in the presence of high salt levels (Table 3), which may be related to changes in their water-solubility. Many protein-stabilized emulsions tend to aggregate when they are heated to around and above the thermal denaturation temperature of the proteins, but again there are appreciable differences in thermal stability depending on protein type (Table 4). Including more data about protein performance in a standardized format will allow food manufacturers to select the most appropriate ingredient for specific applications.

5. Conclusions

Many new protein sources are being introduced as food ingredients, such as those from plants, microorganisms, or fermentation processes. These proteins are often used as functional ingredients in foods designed to reduce the consumption of animal products, such as meat, seafood, egg, or dairy products. In this manuscript, we have focused on the utilization of proteins as emulsifiers in foods and other products. We describe the physicochemical principles underlying the utilization of proteins as emulsifiers, as well as propose a series of standardized tests that can be used to characterize their properties. The information obtained from these tests can be used to compare the ability of different proteins to form and stabilize emulsions under standardized conditions. Our aim is to establish a database that can be used to compare the performance of different emulsifiers so that the most appropriate one can be selected for each application.

Author Contributions

Conceptualization, D.J.M.; formal analysis, D.J.M.; investigation, D.J.M.; data curation, D.J.M.; writing—original draft preparation, D.J.M.; writing—review and editing, D.J.M., L.G., and J.L.; visualization, D.J.M.; project administration, D.J.M.; funding acquisition, D.J.M. All authors have read and agreed to the published version of the manuscript.

Funding

This material was partly based upon work supported by the National Institute of Food and Agriculture, USDA, Massachusetts Agricultural Experiment Station (MAS00559) and USDA, AFRI (2020-03921) Grants, as well as by the Good Food Institute.

Conflicts of Interest

The authors declare no conflict of interest.

References

  1. Petersen, K.S.; Flock, M.R.; Richter, C.K.; Mukherjea, R.; Slavin, J.L.; Kris-Etherton, P.M. Healthy Dietary Patterns for Preventing Cardiometabolic Disease: The Role of Plant-Based Foods and Animal Products. Curr. Dev. Nutr. 2017, 1, 12. [Google Scholar] [CrossRef] [Green Version]
  2. Singh, M.; Trivedi, N.; Enamala, M.K.; Kuppam, C.; Parikh, P.; Nikolova, M.P.; Chavali, M. Plant-based meat analogue (PBMA) as a sustainable food: A concise review. Eur. Food Res. Technol. 2021, 247, 2499–2526. [Google Scholar] [CrossRef]
  3. McClements, D.J.; Grossmann, L. The science of plant-based foods: Constructing next-generation meat, fish, milk, and egg analogs. Compr. Rev. Food Sci. Food Saf. 2021, 20, 4049–4100. [Google Scholar] [CrossRef] [PubMed]
  4. Grossmann, L.; Weiss, J. Alternative Protein Sources as Technofunctional Food Ingredients. Annu. Rev. Food Sci. Technol. 2021, 12, 93–117. [Google Scholar] [PubMed]
  5. Onwezen, M.C.; Bouwman, E.P.; Reinders, M.J.; Dagevos, H. A systematic review on consumer acceptance of alternative proteins: Pulses, algae, insects, plant-based meat alternatives, and cultured meat. Appetite 2021, 159, 1–5. [Google Scholar] [CrossRef]
  6. Tso, R.; Lim, A.J.; Forde, C.G. A Critical Appraisal of the Evidence Supporting Consumer Motivations for Alternative Proteins. Foods 2021, 10, 24. [Google Scholar] [CrossRef]
  7. Loveday, S.M. Food Proteins: Technological, Nutritional, and Sustainability Attributes of Traditional and Emerging Proteins. Annu. Rev. Food Sci. Technol. 2019, 10, 311–339. [Google Scholar]
  8. Craddock, J.C.; Genoni, A.; Strutt, E.F.; Goldman, D.M. Limitations with the Digestible Indispensable Amino Acid Score (DIAAS) with Special Attention to Plant-Based Diets: A Review. Curr. Nutr. Rep. 2021, 10, 93–98. [Google Scholar] [CrossRef]
  9. McClements, D.J.; Grossmann, L. A brief review of the science behind the design of healthy and sustainable plant-based foods. Npj Sci. Food 2021, 5, 1. [Google Scholar] [CrossRef]
  10. Comunian, T.A.; Drusch, S.; Brodkorb, A. Advances of plant-based structured food delivery systems on the in vitro digestibility of bioactive compounds. Crit. Rev. Food Sci. 2021, 1–21. [Google Scholar] [CrossRef]
  11. Tan, Y.B.; McClements, D.J. Plant-Based Colloidal Delivery Systems for Bioactives. Molecules 2021, 26, 6895. [Google Scholar] [CrossRef] [PubMed]
  12. McClements, D.J.; Bai, L.; Chung, C. Recent Advances in the Utilization of Natural Emulsifiers to Form and Stabilize Emulsions. Annu Rev. Food Sci. Technol. 2017, 28, 205–236. [Google Scholar]
  13. McClements, D.J.; Gumus, C.E. Natural emulsifiers—Biosurfactants, phospholipids, biopolymers, and colloidal particles: Molecular and physicochemical basis of functional performance. Adv. Colloid Interface Sci. 2016, 234, 3–26. [Google Scholar] [CrossRef] [Green Version]
  14. McClements, D.J.; Rao, J. Food-Grade Nanoemulsions: Formulation, Fabrication, Properties, Performance, Biological Fate, and Potential Toxicity. Crit. Rev. Food Sci. Nutr. 2011, 51, 285–330. [Google Scholar] [CrossRef] [PubMed]
  15. Santana, R.C.; Perrechil, F.A.; Cunha, R.L. High-and Low-Energy Emulsifications for Food Applications: A Focus on Process Parameters. Food Eng. Rev. 2013, 5, 107–122. [Google Scholar] [CrossRef]
  16. Hakansson, A. Emulsion Formation by Homogenization: Current Understanding and Future Perspectives. Annu. Rev. Food Sci. Technol. 2019, 10, 239–258. [Google Scholar] [PubMed]
  17. Hakansson, A.; Rayner, M. General Principles of Nanoemulsion Formation by High-Energy Mechanical Methods. In Nanoemulsions; Academic Press: Cambridge, MA, USA, 2018; pp. 103–139. [Google Scholar]
  18. McClements, D.J. Food Emulsions: Principles, Practices, and Techniques, 3rd ed.; CRC Press: Boca Raton, FL, USA, 2015. [Google Scholar]
  19. O’Sullivan, J.; Murray, B.; Flynn, C.; Norton, I. The effect of ultrasound treatment on the structural, physical and emulsifying properties of animal and vegetable proteins. Food Hydrocoll. 2016, 53, 141–154. [Google Scholar] [CrossRef] [Green Version]
  20. Paez-Hernandez, G.; Mondragon-Cortez, P.; Espinosa-Andrews, H. Developing curcumin nanoemulsions by high-intensity methods: Impact of ultrasonication and microfluidization parameters. Lwt Food Sci. Technol. 2019, 111, 291–300. [Google Scholar] [CrossRef]
  21. Rampon, V.; Riaublanc, A.; Anton, M.; Genot, C.; McClements, D.J. Evidence that homogenization of BSA-stabilized hexadecane-in-water emulsions induces structure modification of the nonadsorbed protein. J. Agric. Food Chem. 2003, 51, 5900–5905. [Google Scholar] [CrossRef]
  22. Miriani, M.; Keerati-u-rai, M.; Corredig, M.; Iametti, S.; Bonomi, F. Denaturation of soy proteins in solution and at the oil-water interface: A fluorescence study. Food Hydrocoll. 2011, 25, 620–626. [Google Scholar] [CrossRef]
  23. Hinderink, E.B.A.; Berton-Carabin, C.C.; Schroen, K.; Riaublanc, A.; Houinsou-Houssou, B.; Boire, A.; Genot, C. Conformational Changes of Whey and Pea Proteins upon Emulsification Approached by Front-Surface Fluorescence. J. Agric. Food Chem. 2021, 69, 6601–6612. [Google Scholar] [CrossRef] [PubMed]
  24. Zhai, J.L.; Day, L.; Aguilar, M.I.; Wooster, T.J. Protein folding at emulsion oil/water interfaces. Curr. Opin. Colloid Interface Sci. 2013, 18, 257–271. [Google Scholar] [CrossRef]
  25. Gumus, C.E.; Decker, E.A.; McClements, D.J. Impact of legume protein type and location on lipid oxidation in fish oil-in-water emulsions: Lentil, pea, and faba bean proteins. Food Res. Int. 2017, 100, 175–185. [Google Scholar] [CrossRef] [PubMed]
  26. Hossain, K.M.Z.; Deeming, L.; Edler, K.J. Recent progress in Pickering emulsions stabilised by bioderived particles. Rsc Adv. 2021, 11, 39027–39044. [Google Scholar] [CrossRef]
  27. Tang, C.H. Emulsifying properties of soy proteins: A critical review with emphasis on the role of conformational flexibility. Crit. Rev. Food Sci. Nutr. 2017, 57, 2636–2679. [Google Scholar] [CrossRef]
  28. Liu, F.; Tang, C.H. Soy Protein Nanoparticle Aggregates as Pickering Stabilizers for Oil-in-Water Emulsions. J. Agric. Food Chem. 2013, 61, 8888–8898. [Google Scholar] [CrossRef]
  29. Zhu, X.F.; Zhang, N.; Lin, W.F.; Tang, C.H. Freeze-thaw stability of pickering emulsions stabilized by soy and whey protein particles. Food Hydrocoll. 2017, 69, 173–184. [Google Scholar] [CrossRef]
  30. Dumay, E.; Chevalier-Lucia, D.; Picart-Palmade, L.; Benzaria, A.; Gracia-Julia, A.; Blayo, C. Technological aspects and potential applications of (ultra) high-pressure homogenisation. Trends Food Sci. Technol. 2013, 31, 13–26. [Google Scholar] [CrossRef]
  31. Hakansson, A.; Innings, F.; Tragardh, C.; Bergenstahl, B. A high-pressure homogenization emulsification model-Improved emulsifier transport and hydrodynamic coupling. Chem. Eng. Sci. 2013, 91, 44–53. [Google Scholar] [CrossRef]
  32. Raikar, N.B.; Bhatia, S.R.; Malone, M.F.; McClerments, D.J.; Henson, M.A. Predicting the Effect of the Homogenization Pressure on Emulsion Drop-Size Distributions. Ind. Eng. Chem. Res. 2011, 50, 6089–6100. [Google Scholar] [CrossRef]
  33. McClements, D.J. Reduced-Fat Foods: The Complex Science of Developing Diet-Based Strategies for Tackling Overweight and Obesity. Adv. Nutr. 2015, 6, 338S–352S. [Google Scholar] [CrossRef] [PubMed] [Green Version]
  34. Hakansson, A.; Hounslow, M.J. Simultaneous determination of fragmentation and coalescence rates during pilot-scale high-pressure homogenization. J. Food Eng. 2013, 116, 7–13. [Google Scholar] [CrossRef]
  35. Hakansson, A.; Tragardh, C.; Bergenstahl, B. A method for estimating effective coalescence rates during emulsification from oil transfer experiments. J. Colloid Interface Sci. 2012, 374, 25–33. [Google Scholar] [CrossRef] [PubMed]
  36. Lee, L.L.; Niknafs, N.; Hancocks, R.D.; Norton, I.T. Emulsification: Mechanistic understanding. Trends Food Sci. Technol. 2013, 31, 72–78. [Google Scholar] [CrossRef]
  37. Tcholakova, S.; Denkov, N.D.; Ivanov, I.B.; Campbell, B. Coalescence stability of emulsions containing globular milk proteins. Adv. Colloid Interface Sci. 2006, 123, 259–293. [Google Scholar] [CrossRef] [PubMed]
  38. Maindarkar, S.N.; Hoogland, H.; Henson, M.A. Predicting the combined effects of oil and surfactant concentrations on the drop size distributions of homogenized emulsions. Colloids Surf. A-Physicochem. Eng. Asp. 2015, 467, 18–30. [Google Scholar] [CrossRef]
  39. Chang, C.; Tu, S.; Ghosh, S.; Nickerson, M.T. Effect of pH on the inter-relationships between the physicochemical, interfacial and emulsifying properties for pea, soy, lentil and canola protein isolates. Food Res. Int. 2015, 77, 360–367. [Google Scholar]
  40. Chen, M.S.; Xu, F.F.; Nsor-Atindana, J.; Chen, X.M.; Liu, F.; Wu, J.L.; Zhong, F. High protein and high oil emulsions: Phase diagram, stability and interfacial adsorption. Lwt-Food Sci. Technol. 2022, 153, 112464. [Google Scholar] [CrossRef]
  41. Ye, A.Q.; Zhu, X.Q.; Singh, H. Oil-in-Water Emulsion System Stabilized by Protein-Coated Nanoemulsion Droplets. Langmuir 2013, 29, 14403–14410. [Google Scholar] [CrossRef]
  42. Qian, C.; McClements, D.J. Formation of nanoemulsions stabilized by model food-grade emulsifiers using high-pressure homogenization: Factors affecting particle size. Food Hydrocoll. 2011, 25, 1000–1008. [Google Scholar] [CrossRef]
  43. Wooster, T.J.; Golding, M.; Sanguansri, P. Impact of Oil Type on Nanoemulsion Formation and Ostwald Ripening Stability. Langmuir 2008, 24, 12758–12765. [Google Scholar] [CrossRef] [PubMed]
  44. Ozturk, B.; Argin, S.; Ozilgen, M.; McClements, D.J. Formation and stabilization of nanoemulsion-based vitamin E delivery systems using natural surfactants: Quillaja saponin and lecithin. J. Food Eng. 2014, 142, 57–63. [Google Scholar] [CrossRef]
  45. Ozturk, B.; Argin, S.; Ozilgen, M.; McClements, D.J. Formation and stabilization of nanoemulsion-based vitamin E delivery systems using natural biopolymers: Whey protein isolate and gum arabic. Food Chem. 2015, 188, 256–263. [Google Scholar] [CrossRef] [Green Version]
  46. Jafari, S.M.; Assadpoor, E.; He, Y.H.; Bhandari, B. Re-coalescence of emulsion droplets during high-energy emulsification. Food Hydrocoll. 2008, 22, 1191–1202. [Google Scholar] [CrossRef]
  47. Schroen, K.; Berton-Carabin, C.; Renard, D.; Marquis, M.; Boire, A.; Cochereau, R.; Amine, C.; Marze, S. Droplet Microfluidics for Food and Nutrition Applications. Micromachines 2021, 12, 863. [Google Scholar] [CrossRef] [PubMed]
  48. Schroën, K.; de Ruiter, J.; Berton-Carabin, C. The Importance of Interfacial Tension in Emulsification: Connecting Scaling Relations Used in Large Scale Preparation with Microfluidic Measurement Methods. ChemEngineering 2020, 4, 63. [Google Scholar]
  49. Dickinson, E. Flocculation of protein-stabilized oil-in-water emulsions. Colloids Surf. B-Biointerfaces 2010, 81, 130–140. [Google Scholar] [CrossRef]
  50. Dickinson, E. Strategies to control and inhibit the flocculation of protein-stabilized oil-in-water emulsions. Food Hydrocoll. 2019, 96, 209–223. [Google Scholar] [CrossRef]
  51. McClements, D.J. Edible nanoemulsions: Fabrication, properties, and functional performance. Soft Matter 2011, 7, 2297–2316. [Google Scholar] [CrossRef] [Green Version]
  52. Dickinson, E. Hydrocolloids at interfaces and the influence on the properties of dispersed systems. Food Hydrocoll. 2003, 17, 25–39. [Google Scholar]
  53. Fredrick, E.; Walstra, P.; Dewettinck, K. Factors governing partial coalescence in oil-in-water emulsions. Adv. Colloid Interface Sci. 2010, 153, 30–42. [Google Scholar] [CrossRef] [PubMed]
  54. Langevin, D. Coalescence in foams and emulsions: Similarities and differences. Curr. Opin. Colloid Interface Sci. 2019, 44, 23–31. [Google Scholar] [CrossRef]
  55. Pawar, A.B.; Caggioni, M.; Hartel, R.W.; Spicer, P.T. Arrested coalescence of viscoelastic droplets with internal microstructure. Faraday Discuss. 2012, 158, 341–350. [Google Scholar] [CrossRef] [PubMed]
  56. Israelachvili, J. Intermolecular and Surface Forces, 3rd ed.; Academic Press: London, UK, 2011. [Google Scholar]
  57. Kim, H.J.; Decker, E.A.; McClements, D.J. Impact of protein surface denaturation on droplet flocculation in hexadecane oil-in-water emulsions stabilized by beta-lactoglobulin. J. Agric. Food Chem. 2002, 50, 7131–7137. [Google Scholar] [CrossRef]
  58. Kim, H.J.; Decker, E.A.; McClements, D.J. Role of postadsorption conformation changes of beta-lactoglobulin on its ability to stabilize oil droplets against flocculation during heating at neutral pH. Langmuir 2002, 18, 7577–7583. [Google Scholar] [CrossRef]
  59. Thanasukarn, P.; Pongsawatmanit, R.; McClements, D.J. Influence of emulsifier type on freeze-thaw stability of hydrogenated palm oil-in-water emulsions. Food Hydrocoll. 2004, 18, 1033–1043. [Google Scholar] [CrossRef]
  60. Zhai, J.; Hoffmann, S.V.; Day, L.; Lee, T.-H.; Augustin, M.A.; Aguilar, M.-I.; Wooster, T.J. Conformational Changes of alpha-Lactalbumin Adsorbed at Oil-Water Interfaces: Interplay between Protein Structure and Emulsion Stability. Langmuir 2012, 28, 2357–2367. [Google Scholar] [CrossRef]
  61. Zhai, J.L.; Wooster, T.J.; Hoffmann, S.V.; Lee, T.H.; Augustin, M.A.; Aguilar, M.I. Structural Rearrangement of beta-Lactoglobulin at Different Oil-Water Interfaces and Its Effect on Emulsion Stability. Langmuir 2011, 27, 9227–9236. [Google Scholar] [CrossRef]
  62. Brady, J.W. Introductory Food Chemistry; Cornell University Press: Ithaca, NY, USA, 2013. [Google Scholar]
  63. McClements, D.J.; Monahan, F.J.; Kinsella, J.E. Disulfide bond formation affects stability of whey-protein isolate emulsions. J. Food Sci. 1993, 58, 1036–1039. [Google Scholar] [CrossRef]
  64. Monahan, F.J.; McClements, D.J.; German, J.B. Disulfide-mediated polymerization reactions and physical properties of heated WPI-stabilized emulsions. J. Food Sci. 1996, 61, 504–509. [Google Scholar] [CrossRef]
  65. Yi, J.H.; Qiu, M.Y.; Liu, N.; Tian, L.; Zhu, X.P.; Decker, E.A.; McClements, D.J. Inhibition of Lipid and Protein Oxidation in Whey-Protein-Stabilized Emulsions Using a Natural Antioxidant: Black Rice Anthocyanins. J. Agric. Food Chem. 2020, 68, 10149–10156. [Google Scholar] [CrossRef] [PubMed]
  66. Taylor, P. Ostwald ripening in emulsions. Adv. Colloid Interface Sci. 1998, 75, 107–163. [Google Scholar] [CrossRef]
  67. Kabalnov, A. Ostwald ripening and related phenomena. J. Dispers. Sci. Technol. 2001, 22, 1–12. [Google Scholar] [CrossRef]
  68. Koroleva, M.Y.; Yurtov, E.V. Ostwald ripening in macro- and nanoemulsions. Russ. Chem. Rev. 2021, 90, 293–323. [Google Scholar] [CrossRef]
  69. Chang, Y.; McLandsborough, L.; McClements, D.J. Physical Properties and Antimicrobial Efficacy of Thyme Oil Nanoemulsions: Influence of Ripening Inhibitors. J. Agric. Food Chem. 2012, 60, 12056–12063. [Google Scholar] [CrossRef]
  70. Mun, S.H.; McClements, D.J. Influence of interfacial characteristics on Ostwald ripening in hydrocarbon oil-in-water emulsions. Langmuir 2006, 22, 1551–1554. [Google Scholar] [CrossRef]
  71. Kabalnov, A.S.; Shchukin, E.D. Ostwald ripening theory—Applications to fluorocarbon emulsion stability. Adv. Colloid Interface Sci. 1992, 38, 69–97. [Google Scholar] [CrossRef]
  72. Erni, P.; Jerri, H.A.; Wong, K.; Parker, A. Interfacial viscoelasticity controls buckling, wrinkling and arrest in emulsion drops undergoing mass transfer. Soft Matter 2012, 8, 6958–6967. [Google Scholar] [CrossRef]
  73. Nielsen, S.S. Food Analysis, 5th ed.; Springer: New York, NY, USA, 2017. [Google Scholar]
  74. McClements, D.J.; Weiss, J.; Kinchla, A.J.; Nolden, A.A.; Grossmann, L. Methods for Testing the Quality Attributes of Plant-Based Foods: Meat- and Processed-Meat Analogs. Foods 2021, 10, 260. [Google Scholar] [CrossRef]
  75. Cozzolino, D. The Ability of Near Infrared (NIR) Spectroscopy to Predict Functional Properties in Foods: Challenges and Opportunities. Molecules 2021, 26, 6981. [Google Scholar] [CrossRef]
  76. Hong, P.; Koza, S.; Bouvier, E.S.P. A review size-exclusion chromatography for the analysis of protein biotherapeutics and their aggregates. J. Liq. Chromatogr. Relat. Technol. 2012, 35, 2923–2950. [Google Scholar] [CrossRef] [PubMed] [Green Version]
  77. Fekete, S.; Beck, A.; Veuthey, J.L.; Guillarme, D. Theory and practice of size exclusion chromatography for the analysis of protein aggregates. J. Pharm. Biomed. Anal. 2014, 101, 161–173. [Google Scholar] [CrossRef] [PubMed]
  78. Singh, S.M.; Furman, R.; Singh, R.K.; Balakrishnan, G.; Chennamsetty, N.; Tao, L.; Li, Z.J. Size exclusion chromatography for the characterization and quality control of biologics. J. Liq. Chromatogr. Relat. Technol. 2021, 44, 265–278. [Google Scholar] [CrossRef]
  79. Phillips, G.O.; Williams, P.A. Handbook of Hydrocolloids, 3rd ed.; Woodhead Publishing: Cambridge, UK, 2021. [Google Scholar]
  80. Zhang, Y.; Sharan, S.; Rinnan, Å.; Orlien, V. Survey on Methods for Investigating Protein Functionality and Related Molecular Characteristics. Foods 2021, 10, 2848. [Google Scholar]
  81. Grossmann, L.; Hinrichs, J.; Weiss, J. Solubility of extracted proteins from Chlorella sorokiniana, Phaeodactylum tricornutum, and Nannochloropsis oceanica: Impact of pH-value. LWT 2019, 105, 408–416. [Google Scholar] [CrossRef]
  82. Morr, C.V.; German, B.; Kinsella, J.E.; Regenstein, J.M.; Vanburen, J.P.; Kilara, A.; Lewis, B.A.; Mangino, M.E. A collaborative study to develop a standardized food protein solubility procedure. J. Food Sci. 1985, 50, 1715–1718. [Google Scholar] [CrossRef]
  83. Walker, J.M. Nondenaturing Polyacrylamide Gel Electrophoresis of Proteins. In The Protein Protocols Handbook; Walker, J.M., Ed.; Humana Press: New York, NY, USA, 2002; pp. 57–60. [Google Scholar]
  84. Mahler, H.C.; Friess, W.; Grauschopf, U.; Kiese, S. Protein Aggregation: Pathways, Induction Factors and Analysis. J. Pharm. Sci. 2009, 98, 2909–2934. [Google Scholar] [CrossRef]
  85. Greenfield, N.J. Using circular dichroism collected as a function of temperature to determine the thermodynamics of protein unfolding and binding interactions. Nat. Protoc. 2006, 1, 2527–2535. [Google Scholar] [CrossRef]
  86. Eftink, M.R. The use of fluorescence methods to monitor unfolding transitions in proteins. Biophys J. 1994, 66, 482–501. [Google Scholar] [CrossRef] [Green Version]
  87. Usoltsev, D.; Sitnikova, V.; Kajava, A.; Uspenskaya, M. Systematic FTIR Spectroscopy Study of the Secondary Structure Changes in Human Serum Albumin under Various Denaturation Conditions. Biomolecules 2019, 9, 359. [Google Scholar] [CrossRef] [Green Version]
  88. Webb, N.B.; Ivey, F.J.; Craig, H.B.; Jones, V.A.; Monroe, R.J. Measurement of emulsifying capacity by electrical resistance. J. Food Sci. 1970, 35, 501. [Google Scholar] [CrossRef]
  89. Carpenter, J.A.; Saffle, R.L. Simple method of estimating emulsifying capacity of various sausage meats. J. Food Sci. 1964, 29, 774. [Google Scholar] [CrossRef]
  90. Gumus, C.E.; Decker, E.A.; McClements, D.J. Formation and Stability of omega-3 Oil Emulsion-Based Delivery Systems Using Plant Proteins as Emulsifiers: Lentil, Pea, and Faba Bean Proteins. Food Biophys. 2017, 12, 186–197. [Google Scholar] [CrossRef]
  91. Hinderink, E.B.A.; Munch, K.; Sagis, L.; Schroen, K.; Berton-Carabin, C.C. Synergistic stabilisation of emulsions by blends of dairy and soluble pea proteins: Contribution of the interfacial composition. Food Hydrocoll. 2019, 97, 105206. [Google Scholar] [CrossRef]
  92. Benjamin, O.; Silcock, P.; Beauchamp, J.; Buettner, A.; Everett, D.W. Emulsifying Properties of Legume Proteins Compared to beta-Lactoglobulin and Tween 20 and the Volatile Release from Oil-in-Water Emulsions. J. Food Sci. 2014, 79, E2014–E2022. [Google Scholar] [CrossRef]
  93. Schestkowa, H.; Drusch, S.; Wagemans, A.M. FTIR analysis of beta-lactoglobulin at the oil/water-interface. Food Chem. 2020, 302, 125349. [Google Scholar] [CrossRef]
  94. Relkin, P.; Launay, B.; Liu, T.X. Heat- and cold-setting gels of beta-lactoglobulin solutions. A DSC and TEM study. Thermochim. Acta 1998, 308, 69–74. [Google Scholar] [CrossRef]
  95. Qian, C.; Decker, E.A.; Xiao, H.; McClements, D.J. Comparison of Biopolymer Emulsifier Performance in Formation and Stabilization of Orange Oil-in-Water Emulsions. J. Am. Oil Chem. Soc. 2011, 88, 47–55. [Google Scholar] [CrossRef]
  96. Schroder, A.; Berton-Carabin, C.; Venema, P.; Cornacchia, L. Interfacial properties of whey protein and whey protein hydrolysates and their influence on O/W emulsion stability. Food Hydrocoll. 2017, 73, 129–140. [Google Scholar] [CrossRef]
  97. Bai, L.; Huan, S.Q.; Gu, J.Y.; McClements, D.J. Fabrication of oil-in-water nanoemulsions by dual-channel microfluidization using natural emulsifiers: Saponins, phospholipids, proteins, and polysaccharides. Food Hydrocoll. 2016, 61, 703–711. [Google Scholar] [CrossRef] [Green Version]
  98. Amine, C.; Dreher, J.; Helgason, T.; Tadros, T. Investigation of emulsifying properties and emulsion stability of plant and milk proteins using interfacial tension and interfacial elasticity. Food Hydrocoll. 2014, 39, 180–186. [Google Scholar] [CrossRef]
  99. Kharat, M.; Zhang, G.D.; McClements, D.J. Stability of curcumin in oil-in-water emulsions: Impact of emulsifier type and concentration on chemical degradation. Food Res. Int. 2018, 111, 178–186. [Google Scholar] [CrossRef] [PubMed]
  100. Hu, M.; McClements, D.J.; Decker, E.A. Lipid oxidation in corn oil-in-water emulsions stabilized by casein, whey protein isolate, and soy protein isolate. J. Agric. Food Chem. 2003, 51, 1696–1700. [Google Scholar] [CrossRef] [PubMed]
  101. Romero, A.; Beaumal, V.; David-Briand, E.; Cordobes, F.; Guerrero, A.; Anton, M. Interfacial and Oil/Water Emulsions Characterization of Potato Protein Isolates. J. Agric. Food Chem. 2011, 59, 9466–9474. [Google Scholar] [CrossRef]
  102. van Koningsveld, G.A.; Walstra, P.; Voragen, A.G.J.; Kuijpers, I.J.; Van Boekel, M.; Gruppen, H. Effects of protein composition and enzymatic activity on formation and properties of potato protein stabilized emulsions. J. Agric. Food Chem. 2006, 54, 6419–6427. [Google Scholar] [CrossRef]
  103. van Koningsveld, G.A.; Gruppen, H.; de Jongh, H.H.J.; Wijngaards, G.; van Boekel, M.A.J.S.; Walstra, P.; Voragen, A.G.J. Effects of pH and Heat Treatments on the Structure and Solubility of Potato Proteins in Different Preparations. J. Agric. Food Chem. 2001, 49, 4889–4897. [Google Scholar] [CrossRef]
  104. Oliete, B.; Potin, F.; Cases, E.; Saurel, R. Microfluidization as Homogenization Technique in Pea Globulin-Based Emulsions. Food Bioprocess. Technol. 2019, 12, 877–882. [Google Scholar] [CrossRef]
  105. Keivaninahra, F.; Gadkaria, P.; Benisb, K.Z.; Tulbekc, M.; Ghosh, S. Prediction of emulsification behaviour of pea and faba bean protein concentrates and isolates from structure–functionality analysis. Rsc Adv. 2021, 11, 12117–12135. [Google Scholar]
  106. Felix, M.; Romero, A.; Carrera-Sanchez, C.; Guerrero, A. Assessment of interfacial viscoelastic properties of Faba bean (Vicia faba) protein-adsorbed O/W layers as a function of pH. Food Hydrocoll. 2019, 90, 353–359. [Google Scholar] [CrossRef]
  107. Morales, E.; Burgos-Díaz, C.; Zúñiga, R.N.; Jorkowski, J.; Quilaqueo, M.; Rubilar, M. Effect of Interfacial Ionic Layers on the Food-Grade O/W Emulsion Physical Stability and Astaxanthin Retention during Spray-Drying. Foods 2021, 10, 312. [Google Scholar]
  108. Keerati-u-rai, M. Emulsifying Properties of Soy Protein Isolates and Their Effect of Bulk Properties of the Oil-in-Water Emulsion. Ph.D. Thesis, The University of Guelph, Guelph, ON, Canada, 2011. [Google Scholar]
  109. Li, Y.; Jin, H.; Sun, X.; Sun, J.; Liu, C.; Liu, C.; Xu, J. Physicochemical Properties and Storage Stability of Food Protein-Stabilized Nanoemulsions. Nanomaterials 2019, 9, 25. [Google Scholar]
  110. Tan, Y.B.; Lee, P.W.; Martens, T.D.; McClements, D.J. Comparison of emulsifying properties of plant and animal proteins in oil-in-water emulsions: Whey, soy, and RuBisCo proteins. Food Res. Int. 2022. submitted. [Google Scholar]
  111. Zhou, B.; Tobin, J.T.; Drusch, S.; Hogan, S.A. Interfacial properties of milk proteins: A review. Adv. Colloid Interface Sci. 2021, 295, 1–15. [Google Scholar]
  112. Miller, R.; Joos, P.; Fainerman, V.B. Dynamic surface and interfacial-tensions of surfactant and polymer-solutions. Adv. Colloid Interface Sci. 1994, 49, 249–302. [Google Scholar] [CrossRef]
  113. McClements, D.J. Critical review of techniques and methodologies for characterization of emulsion stability. Crit. Rev. Food Sci. Nutr. 2007, 47, 611–649. [Google Scholar] [CrossRef]
  114. Tcholakova, S.; Denkov, N.D.; Sidzhakova, D.; Ivanov, I.B.; Campbell, B. Interrelation between drop size and protein adsorption at various emulsification conditions. Langmuir 2003, 19, 5640–5649. [Google Scholar] [CrossRef]
  115. Keddie, J.L. Structural analysis of organic interfacial layers by ellipsometry. Curr. Opin. Colloid Interface Sci. 2001, 6, 102–110. [Google Scholar] [CrossRef]
  116. Atkinson, P.J.; Dickinson, E.; Horne, D.S.; Leermakers, F.A.M.; Richardson, R.M. Theoretical and experimental investigations of adsorbed protein structure at a fluid interface. Ber. Bunsen-Ges. Phys. Chem. Chem. Phys. 1996, 100, 994–998. [Google Scholar] [CrossRef]
  117. Atkinson, P.J.; Dickinson, E.; Horne, D.S.; Richardson, R.M. Neutron Reflectivity of Adsorbed Beta-Casein And Beta-Lactoglobulin At The Air/Water Interface. J. Chem. Soc. Faraday Trans. 1995, 91, 2847–2854. [Google Scholar] [CrossRef]
  118. Wooster, T.J.; Augustin, M.A. β-Lactoglobulin–dextran Maillard conjugates: Their effect on interfacial thickness and emulsion stability. J. Colloid Interface Sci. 2006, 303, 564–572. [Google Scholar] [CrossRef]
  119. Zielbauer, B.I.; Jackson, A.J.; Maurer, S.; Waschatko, G.; Ghebremedhin, M.; Rogers, S.E.; Heenan, R.K.; Porcar, L.; Vilgis, T.A. Soybean oleosomes studied by small angle neutron scattering (SANS). J. Colloid Interface Sci. 2018, 529, 197–204. [Google Scholar] [CrossRef] [PubMed]
  120. Karbaschi, M.; Lotfi, M.; Kragel, J.; Javadi, A.; Bastani, D.; Miller, R. Rheology of interfacial layers. Curr. Opin. Colloid Interface Sci. 2014, 19, 514–519. [Google Scholar] [CrossRef]
  121. van Aken, G.A.; van Vliet, T. Flow-induced coalescence in protein-stabilized highly concentrated emulsions: Role of shear-resisting connections between the droplets. Langmuir 2002, 18, 7364–7370. [Google Scholar] [CrossRef]
  122. Pearce, K.N.; Kinsella, J.E. Emulsifying Properties of Proteins—Evaluation of a Turbidimetric Technique. J. Agric. Food Chem. 1978, 26, 716–723. [Google Scholar]
  123. Xu, X.F.; Zhong, J.Z.; Chen, J.; Liu, C.M.; Luo, L.P.; Luo, S.J.; Wu, L.X.; McClements, D.J. Effectiveness of partially hydrolyzed rice glutelin as a food emulsifier: Comparison to whey protein. Food Chem. 2016, 213, 700–707. [Google Scholar] [CrossRef] [Green Version]
Figure 1. Protein-based emulsifiers play two major functions in the production of emulsion-based foods: facilitate emulsion formation and enhance emulsion stability.
Colloids 06 00019 g001
Figure 2. Representation of the major physicochemical processes occurring inside a high-energy homogenizer during emulsion formation: droplet disruption; droplet coalescence; emulsifier adsorption; and droplet stabilization. Small droplets tend to be formed when the emulsifier adsorbs more rapidly than droplet collisions occur.
Colloids 06 00019 g002
Figure 3. Simplified diagram of the typical two-step procedure used to produce oil-in-water emulsions using a high-energy method (i) a coarse emulsion is formed using a high-shear mixer; (ii) a fine emulsion is formed by passing the coarse emulsion through a high-pressure valve homogenizer.
Colloids 06 00019 g003
Figure 4. Under conditions where the droplet size is limited by the amount of emulsifier present (rather than the homogenizer operating conditions), the mean droplet diameter decreases with increasing emulsifier concentration. Here, the mean particle diameter (d32) is plotted against emulsifier concentration for emulsifiers with different surface loads. Predictions were made using Equation (2).
Colloids 06 00019 g004
Figure 5. The effectiveness of different emulsifiers can be compared by plotting the mean particle diameter (d32) versus emulsifier concentration. Data from authors laboratory.
Colloids 06 00019 g005
Figure 6. The mean particle diameter usually decreases with increasing homogenization pressure, provided there is sufficient emulsifier present to cover the surfaces of all droplet formed. In some situations, the particle size increases at high homogenization pressures, which is known as over-processing. Predictions were made using Equation (2) for the case of sufficient emulsifier, and modified for the other curves to schematically show the effects of over-processing and limited emulsifier on droplet size.
Colloids 06 00019 g006
Figure 7. Schematic diagram of different physicochemical mechanisms that protein-stabilized oil-in-water emulsions may become unstable: gravitation separation, flocculation, coalescence, and oiling-off.
Colloids 06 00019 g007
Figure 8. Protein-based emulsifiers typically stabilize oil droplets against aggregation through a combination of steric and electrostatic repulsive forces. The magnitude and range of these repulsive forces depends on the thickness, packing, and charge of the adsorbed protein molecules.
Colloids 06 00019 g008
Figure 9. The electrical charge on protein-coated oil droplets goes from positive at low pH to negative at high pH because of changes in the ionization of the amino acid charge groups. Droplet aggregation tends to occur under conditions where there is not a strong electrostatic repulsion between the droplets, i.e., around the isoelectric point. Data is experimental measurements on whey protein-coated oil droplets prepared in our laboratory.
Colloids 06 00019 g009
Figure 10. Proteins have highly heterogenous surfaces with cationic, anionic, polar, and non-polar regions exposed to the surrounding environment. The image here is of a soy protein prepared using the Maestro program (Schrodinger) from the crystal structure of soybean proglycinin A1AB1B homotrimer (Protein database 1FXZ). Key: Dark blue is positively charged regions, red is negatively charged regions, and green are hydrophobic regions.
Colloids 06 00019 g010
Figure 11. (A) Differential scanning calorimetry analysis shows that Rubisco protein is irreversibly thermally denatured when heated from between 65 to 75 °C. (B) The droplets in Rubisco-stabilized emulsions aggregate when they are heated above their thermal denaturation temperature because of an increase in surface hydrophobicity when the proteins unfold (data from our laboratory).
Colloids 06 00019 g011
Figure 12. The pH stability of protein-coated oil droplets is highly dependent on protein type. This figure shows the change in mean particle diameter with pH for emulsions stabilized by soy, rubisco, and whey protein (data from our laboratory).
Colloids 06 00019 g012
Figure 13. The surface load and thickness of a protein layer depends on the molecular dimensions and packing of the proteins at the oil-water interface.
Colloids 06 00019 g013
Figure 14. Plant proteins are isolated from plant materials, such as soybeans, using various separation and purification processes. The native and aggregation state of the proteins obtained depends on the isolation methods used. The dimensions of the different entities in the schematic diagram are not drawn to scale. Image of soybeans by Amy Wilson, CSIRO (http://www.scienceimage.csiro.au/image/3273 (accessed on 9 February 2022)) (Crea-tive Commons 3.0).
Colloids 06 00019 g014
Figure 15. The performance of an emulsifier at creating small droplets during homogenization can be determined by measuring the emulsifier concentration (C1μm) required to form oil-in-water emulsions (10% oil) with droplets of a specified mean diameter (e.g., d32 = 1 μm) and the mean droplet diameter (d1%) that can be achieved when using a constant emulsifier concentration (1% w/w). Curves are predictions made using Equation (2).
Colloids 06 00019 g015
Figure 16. The interfacial properties of a protein-based emulsifier can be characterized by measuring the interfacial tension versus protein concentration profile. The surface pressure versus concentration can then be calculated from this data. The data (A,B) shown are just schematic representations.
Colloids 06 00019 g016
Table 1. Emulsion forming properties of food proteins. Key: ΓSat = Surface load at saturation; γOW = interfacial tension at saturation; SA= surface activity; d0.1 = surface-weighted mean diameter (d32) of droplets produced using a protein-to-oil ratio (P:O) of 0.1 under emulsifier-limited homogenization conditions; C1μm = grams of protein per gram of oil (g/g) required to create fat droplets with a diameter of 1 μm under emulsifier-limited homogenization conditions. Ideally, the D0.1 and C1μm data are for 10% oil-in-water emulsions. All data is at pH 7 unless otherwise stated.
Protein TypeΓSat (mg/m2)γOW
(mN/m)
SA
(wt%−1)
D0.1
(μm)
C1μm
(g/g)
pITm
(oC)
Ref
β-lactoglobulin1.8−2.712.68.30.170.24.775[93,94,95]
Whey1.8313.5100.110.25.072[3,45,96,97]
Sodium Caseinate1.51.840.18<0.24.6N/A[98,99,100]
Potato1.84.140.230.24.960[98,101,102,103]
Pea2.8−5.93.850.360.74.577−79[3,90,98,104]
Faba2.48.01.30.710.584.8 [90,105,106]
Lentil5.19.5>20.870.915.0120[39,90,107]
Soy2−610.01.20.250.44.580−93[3,39,108,109,110]
Table 2. pH stability of protein-coated oil droplets in oil-in-water emulsions. Regions in bold show where extensive droplet aggregation occurs. Key: ζ = ζ-potential; d/d0 is the particle diameter at specified pH divided by particle diameter at pH 7; CI is the creaming index measured after storage for certain time at ambient temperature.
Protein TypePropertypH ValueCommentsReference
Charge
Size
Creaming
2345678Oil content and type
Protein-to-oil ratio (P:O) Homogenizer; Particle sizer
Wheyζ (mV) 24.114.3−7.2−20.4−25.2 2.5% corn oil
P:O = 0.2:1
Sonicator; DLS
Our Lab
(Cheryl Chung)
d/d0 1.8712.722.60.991.00
CI (%) -----
Wheyζ (mV)37.750.227.8−2.6−31.8−52.8−53.110% soy oil
P:O = 0.1:1
Microfluidizer; SLS
[110]
d/d01.021.6123.71323.621.000.93
CI (%)-------
Wheyζ (mV)38.947.731.70.0−30.5−47.7−45.110% orange oil: vitamin A
P:O = 0.2:1
Microfluidizer, SLS
[45]
d/d01.001.001.011211.001.000.99
CI (%)00027%000
Caseinateζ (mV) 18.811.9−23.0−37.1−41.6 2.5% corn oil
P:O = 0.2:1
Sonicator; DLS
Our Lab
(Chung)
d/d0 30.353.21.720.981.00
CI (%) -----
Fabaζ (mV)23.626.214.3−4.1−14.0−18.3−19.510 wt% algae oil
P:O = 0.27:1
Microfluidizer, SLS
[90]
d/d01.8820.1314.1911.73.301.000.83
CI (%)867674746500
Lentilζ (mV)24.529.419.4−0.7−18.4−20.8−21.210 wt% algae oil
P:O = 0.27:1
Microfluidizer, SLS
[90]
d/d00.961.080.9316.30.831.000.91
CI (%)0059474800
Peaζ (mV)22.626.815.9−4.1−16.4−17.2−17.610 wt% algae oil
P:O = 0.27:1
Microfluidizer, SLS
[90]
d/d00.8215.324.223.84.031.000.70
CI (%)07678817800
Soyζ (mV)26.931.218.0−6.1−19.1−35.9−42.610% soy oil
P:O = 0.1:1
Microfluidizer; SLS
[110]
d/d095.91321281241.411.000.89
CI (%)-------
Rubiscoζ (mV)22.330.118.4−7.7−27.0−35.0−31.610% soy oil
P:O = 0.1:1
Microfluidizer; SLS
[110]
d/d02.1810.741.542.329.01.000.84
CI (%)-------
Hydrolyzed rice glutelinζ (mV)26.925.75.1−11.3−21.9−32.8−40.710 wt% corn oil
P:O = 0.3:1
Microfluidizer, SLS
[123]
d/d071.578.989.973.736.71.000.98
CI (%)10141316000
Table 3. Salt stability of protein-coated oil droplets in oil-in-water emulsions. Regions in bold show where extensive droplet aggregation occurs. Key: ζ = ζ-potential; d/d0 is the particle diameter at specified salt concentration divided by particle diameter in the absence of salt; CI is the creaming index measured after storage for certain time at ambient temperature.
Protein TypePropertySalt (NaCl) Concentration (mM)CommentsReference
Charge
Size
Creaming
050100200300400500Oil content and type
Protein-to-oil ratio (P:O) Homogenizer; Particle sizer
Whey proteinζ (mV)−52.8-−52.9−49.9−48.9−48.8−47.410% soy oil
P:O = 0.1:1
Microfluidizer; SLS
[110]
d/d01.00-0.960.991.041.081.10
CI (%)S-SSSSS
Rubiscoζ (mV)−35.9-−39.7−38.7−37.9−37.4−36.910% soy oil
P:O = 0.1:1
Microfluidizer; SLS
[110]
d/d01.00-4.257.0812.512.914.6
CI (%)S UUUUU
Soyζ (mV)−35.0-−33.7−33.5−33.1−33.1−32.710% soy oil
P:O = 0.1:1
Microfluidizer; SLS
[110]
d/d01.00-8.757.5643.5111236
CI (%)S SSSSS
Fabaζ (mV)−18.3-−17.8−11.6−8.6−7.2−8.910 wt% algae oil
P:O = 0.27:1
Microfluidizer, SLS
[90]
d/d01.00-28.741.420.970.881.00
CI (%)S UUUSS
Lentilζ (mV)−20.8-−16.6−13.2−11.9−9.0−20.810 wt% algae oil
P:O = 0.27:1
Microfluidizer, SLS
[90]
d/d01.00-0.820.620.610.600.67
CI (%)S SSSSS
Peaζ (mV)−17.2-−14.4−12.1−11.9−11.0−8.410 wt% algae oil
P:O = 0.27:1
Microfluidizer, SLS
[90]
d/d01.00-26.08.721.751.461.35
CI (%)S UUSSS
Hydrolyzed Rice Proteinζ (mV)−36.3−17.3−13.4−10.4−9.3-−8.110 wt% corn oil
P:O = 0.3:1
Microfluidizer, SLS
[123]
d/d01.001.531.521.5321.5-22.2
CI (%)-------
Table 4. Temperature stability of protein-coated oil droplets in oil-in-water emulsions. Regions in bold show where extensive droplet aggregation occurs. Key: ζ = ζ-potential; d/d0 is the particle diameter at specified temperature divided by particle diameter at ambient temperature; CI is the creaming index measured after storage for certain time at ambient temperature.
Protein TypePropertyTemperature (oC)CommentsReference
Charge
Size
Creaming
30405060708090Oil content, oil type, buffer, temperature
Whey proteinζ (mV)−47.6−53.2−53.0−53.2−51.1−51.4−45.010% soy oil
P:O = 0.1:1
Microfluidizer; SLS
[110]
d/d01.000.991.010.990.990.990.99
CI (%)SSSSSSS
Rubiscoζ (mV)−39.3−37.8−37.8−35.9−34.9−34.5−34.810% soy oil
P:O = 0.1:1
Microfluidizer; SLS
[110]
d/d01.000.850.863.7012.118.642.8
CI (%)
Soyζ (mV)−33.9−35.4−35.6−35.4−35.7−33.8−32.810% soy oil
P:O = 0.1:1
Microfluidizer; SLS
[110]
d/d01.000.880.970.860.920.981.00
CI (%)
Fabaζ (mV)−36.7−35.0−45.3−18.1−18.7−18.9−19.510 wt% algae oil
P:O = 0.27:1
Microfluidizer, SLS
[90]
d/d01.000.870.841.231.201.151.15
CI (%)SSSSSSS
Lentilζ (mV)−44.9−47.3−24.4−22.7−21.8−21.8−22.110 wt% algae oil
P:O = 0.27:1
Microfluidizer, SLS
[90]
d/d01.000.981.091.061.491.431.41
CI (%)SSSSSSS
Peaζ (mV)−30.0−42.4−36.7−19.2−17.5−17.5−18.310 wt% algae oil
P:O = 0.27:1
Microfluidizer, SLS
[90]
d/d01.001.061.030.911.221.191.17
CI (%)SSSSSSS
Hydrolyzed Rice Proteinζ (mV)−10.7−10.0−10.7−9.3−8.8−9.4−9.410 wt% corn oil
P:O = 0.3:1
Microfluidizer, SLS
[123]
d/d01.001.151.2323.230.836.037.4
CI (%)SSSUUUU
Publisher’s Note: MDPI stays neutral with regard to jurisdictional claims in published maps and institutional affiliations.

