Article

Prediction of Aqueous Solution Surface Tension of Some Surfactant Mixtures and Composition of Their Monolayers at the Solution—Air Interface

by
Bronisław Jańczuk
1,*,
Anna Zdziennicka
1,
Katarzyna Szymczyk
1 and
Maria Luisa González-Martín
2,3
1
Department of Interfacial Phenomena, Institute of Chemical Sciences, Faculty of Chemistry, Maria Curie-Skłodowska University in Lublin, Maria Curie-Skłodowska Sq. 3, 20-031 Lublin, Poland
2
Department of Applied Physics, Extremadura University, Avda. de Elvas, s/n, 06006 Badajoz, Spain
3
Networking Research Center on Bioengineering, Biomaterials and Nanomedicine (CIBER-BBN), 06006 Badajoz, Spain
*
Author to whom correspondence should be addressed.
Colloids Interfaces 2021, 5(4), 53; https://doi.org/10.3390/colloids5040053
Submission received: 9 November 2021 / Revised: 6 December 2021 / Accepted: 14 December 2021 / Published: 17 December 2021

Abstract

:
Measurements of the surface tension of the aqueous solution of SDDS mixture with fluorocarbon surfactants (FC) were carried out and considered in light of the surface tension of aqueous solutions of individual surfactants. Similar analyses were made for many other aqueous solutions of binary and ternary mixtures, taking into account the literature data of the surface tension of aqueous solutions of TX100, TX114, TX165, SDDS, SDS, CTAB, CPyB and FC. The possibility of predicting the surface tension of the aqueous solution of many surfactant mixtures from that of the mixture components using both the Szyszkowski, Fainerman and Miller and Joos concepts was analyzed. The surface tension of the aqueous solutions of surfactant mixtures was also considered based on the particular mixture component contribution to the water surface tension reduction. As a result, the composition of the mixed surface layer at the solution–air interface was discussed and compared to that which was determined using the Hua and Rosen concept. As follows from considerations, the surface tension of the aqueous solution of binary and ternary surfactant mixtures can be described and/or predicted.

Graphical Abstract

1. Introduction

Application of surfactants is very often due to their adsorption at the water–air interface. As a result, a surface monolayer is formed, which reduces the water surface tension [1,2,3,4,5,6]. The reduction magnitude depends on the kind of surfactants and/or surfactant mixtures and their concentration in the aqueous solution. In the case of surfactant mixtures, the magnitude of the water surface tension reduction by the mixed monolayer formed at the water–air interface also depends on the composition of the mixture in the bulk phase [7,8,9,10].
As mixtures of different surfactants are used in practice, rather than single surfactants, knowledge of the surface tension of the aqueous solution of surfactant mixtures is very important. Therefore, the literature reports many concepts for prediction and/or description of the changes in the surface tension of the aqueous solution of surfactant mixtures as a function of the concentration in the bulk phase [11,12,13,14]. To determine these changes, Szyszkowski and Joos equations are often used, as well as the Fainerman and Miller equation [3,15,16,17,18]. To solve the Szyszkowski equation for the aqueous solution of individual surfactants, the constant a, which depends on the standard Gibbs free energy of surfactant adsorption, and maximal Gibbs surface excess concentration of surfactant in the surface region, must be known. The changes in the surface tension of a given surfactant as a function of its concentration can be described at the first approximation by the Szyszkowski equation only in the range of surfactant concentration from zero to the critical micelle concentration (CMC). However, with regard to surfactant mixtures, the values of the surface tension of their aqueous solution calculated using the Szyszkowski equation differed in many cases from the measured ones [19,20]. The reason was the difficulty of finding proper values of the constant a , as well as the maximal Gibbs surface excess concentration of the mixture. In addition, the literature does not present the application of the Szyszkowski equation to predict the surface tension of the aqueous solution of surfactant mixtures based on the data of single surfactants being components of the mixture.
To calculate the surface tension of the aqueous solution of surfactant mixtures using the Joos equation, the film pressure, limiting Gibbs surface excess concentration and constant a (same as in the Szyszkowski equation for the mixture components) must be known [16]. For many binary and ternary surfactant mixtures, the values of the surface tension of their aqueous solution calculated using the Joos equation are similar to those measured. However, this is possible only in the range of surfactant mixture concentrations from 0 to CMC [21,22,23]. In some cases, the surface tension of the aqueous solution of surfactant mixtures can be predicted by the Joos equation only in the range of small concentrations of the mixture in the bulk phase (practically corresponding to the unsaturated mixed monolayer at the water–air interface). In the case of a significant synergetic effect in the water surface tension reduction by a given surfactant mixture, a greater difference between the surface tension values calculated from the Joos equation and those measured is observed [24].
In turn, to solve the Fainerman and Miller equation to determine the surface tension of the aqueous solution of surfactant mixture, the pressure of the monolayer of mixture components and the area occupied by one mole in the monolayer, as well as that occupied by one mole of surfactant mixtures, must be known. It is not difficult to establish the area occupied by a mole of mixture if their areas are similar or there is a small difference between those of mixture components [21,25]. For many binary and ternary surfactant mixtures, the Fainerman and Miller equation can be applied to predict of the surface tension of their aqueous solutions [21,22,25]. Nevertheless, in some cases there are differences between the values of the surface tension of the aqueous solution of surfactant mixtures calculated from the Fainerman and Miller equation and those measured [26]. This may result from the difficulties in the determination of the value of the area occupied by one mole of the surfactant mixtures. Thus, the efficient use of the Fainerman and Miller equation for prediction of the surface tension of the aqueous solution of surfactant mixtures requires proper values of the surface area occupied by one mole of the particular components of the mixture, as well as one mole of the mixture itself. In turn, the Joos equation can be successfully solved regarding the surface tension of the aqueous solution of surfactant mixtures if, besides the monolayer pressure of particular components of the mixture, the constant a, which depends on the standard Gibbs free energy of the mixture components and their limiting surface concentration, can be determined. In the case of the Szyszkowski equation, to predict of the surface tension of the aqueous solution of the surfactant mixtures, the constant a must be also known [3,15,27], which similarly to a in the Joos equation depends on the standard Gibbs free energy of adsorption and maximal Gibbs surface excess concentration for each composition of the surfactant mixtures.
The literature includes many papers which describe the isotherm of the surface tension of the aqueous solution of individual surfactants and their mixtures by the Szyszkowski equation, and predictions by the Joos, as well as Fainerman and Miller equations [21,22,25]. However, it is difficult to find papers discussing the relations between the limiting area occupied by the mole of the mixture of surfactants and the composition of the mixed monolayer at the water–air interface, as well as the constant a obtained from different equations. The conditions that should be fulfilled for the calculation of the surface tension of the aqueous solution of surfactants and their mixtures must also be analyzed. Thus, the purpose of our studies was to establish the relations between the constant a and the maximal Gibbs surface excess concentration, as well as the limiting area occupied by the components of surfactant mixtures and the parameters of the mixture at the proper composition, in light of the Szyszkowski, Joos and Fainerman and Miller equations’ applicability to predict or describe the surface tension of the aqueous solution of surfactant mixtures’ isotherms from the data of particular components of the mixture. Additionally, a possible description of the isotherm of the surface tension by the exponential function of the second order, as well as the meaning of the constants in this equation, were considered. The studies were based on the measurements of the surface tension of the sodium dodecylsulphate (SDDS) mixture with Zonyl FSN-100 (FC1) and Zonyl FSO-100 (FC2) as well as on the literature data for the binary and ternary mixtures, including the following surfactants: Triton X-100 (TX100), Triton X-114 (TX114), Triton X-165 (TX165), sodium dodecylsulfate (SDDS), sodium decylsulfate (SDS), cetyltrimethylammonium bromide (CTAB), cetylpyridinium bromide (CPyB), FC1 and FC2 [20,21,22,25,28,29,30,31,32]. The standard Gibbs free energy of adsorption was also considered for all studied mixtures.

2. Materials and Methods

For the surface tension measurements, the aqueous solution of the ternary mixtures of surfactants, including an anionic classical surfactant, e.g., sodium dodecylsulfate (SDDS) (Sigma-Aldrich) and two nonionic fluorocarbon surfactants, Zonyl FSN-100 (FC6EO14, FC1) as well as Zonyl FSO-100 (FC5EO10, FC2) (Du Pount), were used. All surfactants were of analytical grade. The water used for solution’s preparation was doubly distilled and deionized (Destamat Bi18E). The concentration of the ternary mixture of surfactants in water was changed from 1 × 10⁻⁷ to 1 × 10⁻² M. The mole fraction of FC1, FC2 and SDDS in the bulk phase was equal to 0.3, 0.5 and 0.2, respectively.
The surface tension ( γ L V ) measurements of the aqueous solution of the FC1, FC2 and SDDS ternary mixtures were made at 293 K using the Krüss K9 tensiometer calibrated before the measurements. For this calibration they were applied water and methanol, whose surface tensions at 293 K were equal to 72.8 and 22.5 mN/m, respectively. The details of γ L V measurements were described earlier [32]. For each concentration of the aqueous solution of FC1, FC2 and SDDS mixtures, the measurements were repeated at least ten times. The standard deviation of the results obtained from the measurements was ± 0.1 mN/m and the uncertainty was in the range from 0.3 to 0.9%. The procedures describing the preparation of the other studied solutions and surface tension measurements are reported in the literature [20,21,22,25,28,29,30,31,32].

3. Results and Discussion

3.1. Surface Tension of the Aqueous Solution of Individual Surfactants

A surfactant present in the aqueous media adsorbs, among others, at the water–air interface. As a result of surfactant adsorption at this interface, a decrease in water surface tension is observed. From a practical point of view, it is not only the decrease in the total water surface tension under the influence of surfactant adsorption that is important, but also the components of this tension resulting from different kinds of intermolecular interactions.
For the first time, Fowkes [33] proposed the division of liquid and solid surface tension into components resulting from dispersion, dipole-dipole, dipole-induced-dipole, hydrogen bonds, electrostatic and acid–base intermolecular interactions. In turn, van Oss et al. [34,35,36,37] divided the surface tension of solids and liquids into two components. In their opinion, the dispersion, dipole-dipole and dipole-induced dipole interactions are inseparable, and the effect of their interactions is the Lifshitz–van der Waals component (LW) of surface tension. At the same time, van Oss et al. [34,35,36,37] stated that the contributions of dipole-dipole and induced dipole-dipole intermolecular interactions to the LW component of the surface tension do not exceed 2%, and in practice are close to the dispersion component proposed by Fowkes [33]. The second component of solid and liquid surface tension proposed by van Oss et al. is related to hydrogen-bond interactions and is called the acid–base (AB) component. This component depends on the electron-acceptor and electron-donor parameters.
Based on the Berthelot rule, Fowkes stated that the adhesion work (Wa) of liquid-to-liquid or liquid-to-solid can be expressed by the geometrical mean from the dispersion components of these phases, if the surface tension of liquids, solids and/or both phases being in contact results from dispersion intermolecular interactions [38,39]. Next, taking into account Fowkes’ concept of the phases being in contact and the fulfilled conditions mentioned above, van Oss et al. [34,35,36,37] proposed the equation:
W a = 2 γ 1 L W γ 2 L W ,
where 1 and 2 refer to the proper phases and LW refers to the Lifshitz–van der Waals component of the surface tension of a given phase.
Based on Equation (1), the LW component of the liquid surface tension can be determined from measurements of both the liquid–liquid interface tension and the contact angle of liquid on the solid, whose surface tension results only from the LW intermolecular interactions. The LW component of the water surface tension at 293 K determined from the water–alkane interface tension (21.8 mN/m) [40] proved to be considerably smaller than that determined from the contact angle of water on the apolar solids, whose surface tension results only from the LW intermolecular interactions (26.85 mN/m) [41]. Thus, it is hard to explain these different LW values of water surface tension. It is possible that the mutual dissolution of the liquids being in contact, and/or the way in which the water molecules orientate at the interfaces and their packing, affect this difference.
From the contact angles measured for the aqueous solution of many hydrocarbon surfactants on the apolar solids (particularly on polytetrafluoroethylene, PTFE), it can be seen that in the whole range of surfactant concentrations, the adhesion work of the solution to the solid surface is constant, and the LW of the solution surface tension calculated from Equation (1) is close to the LW component of the water surface tension determined from the contact angles (26.85 mN/m) measured on PTFE [41]. In the case of fluorocarbon surfactants, the LW component of their aqueous solution depends on their concentration, particularly in the concentration range corresponding to the saturated monolayer at the water–air interface [42,43].
The LW component of the water surface tension is affected only by the LW component of the surfactant adsorbed at the water–air interface.
According to van Oss and Constanzo [34], the surfactant surface tension depends on its molecules’ orientation towards the air phase. Hence, the concept of the surface tension of the head and tail of the surfactant is known. The tail surface tension of most hydrocarbon surfactants ranges from 22 to 28 mN/m (Table 1). This means that the value of the LW component of the water surface tension determined from its contact angle on hydrophobic solids is in the range of tail surface tension of hydrocarbon surfactants. The minimal surface tension of the aqueous solution of hydrocarbon surfactants is higher than 28 mN/m in most cases. This indicates that the surface monolayer is not completely packed, and explains why the LW component of the aqueous solution of hydrocarbon surfactants and their mixtures in the whole range of their concentration is close to the LW component of the water surface tension.
As the surface tension of the fluorocarbon surfactant’s tail is significantly smaller than that of the LW component of the water surface tension (Table 1), the changes in the LW component of the aqueous solution of the fluorocarbon surfactants as a function of their concentration are observed [42]. This means that contrary to the hydrocarbon surfactant’s fluorocarbons, not only does the acid–base component of the water surface tension change, but also the LW component.
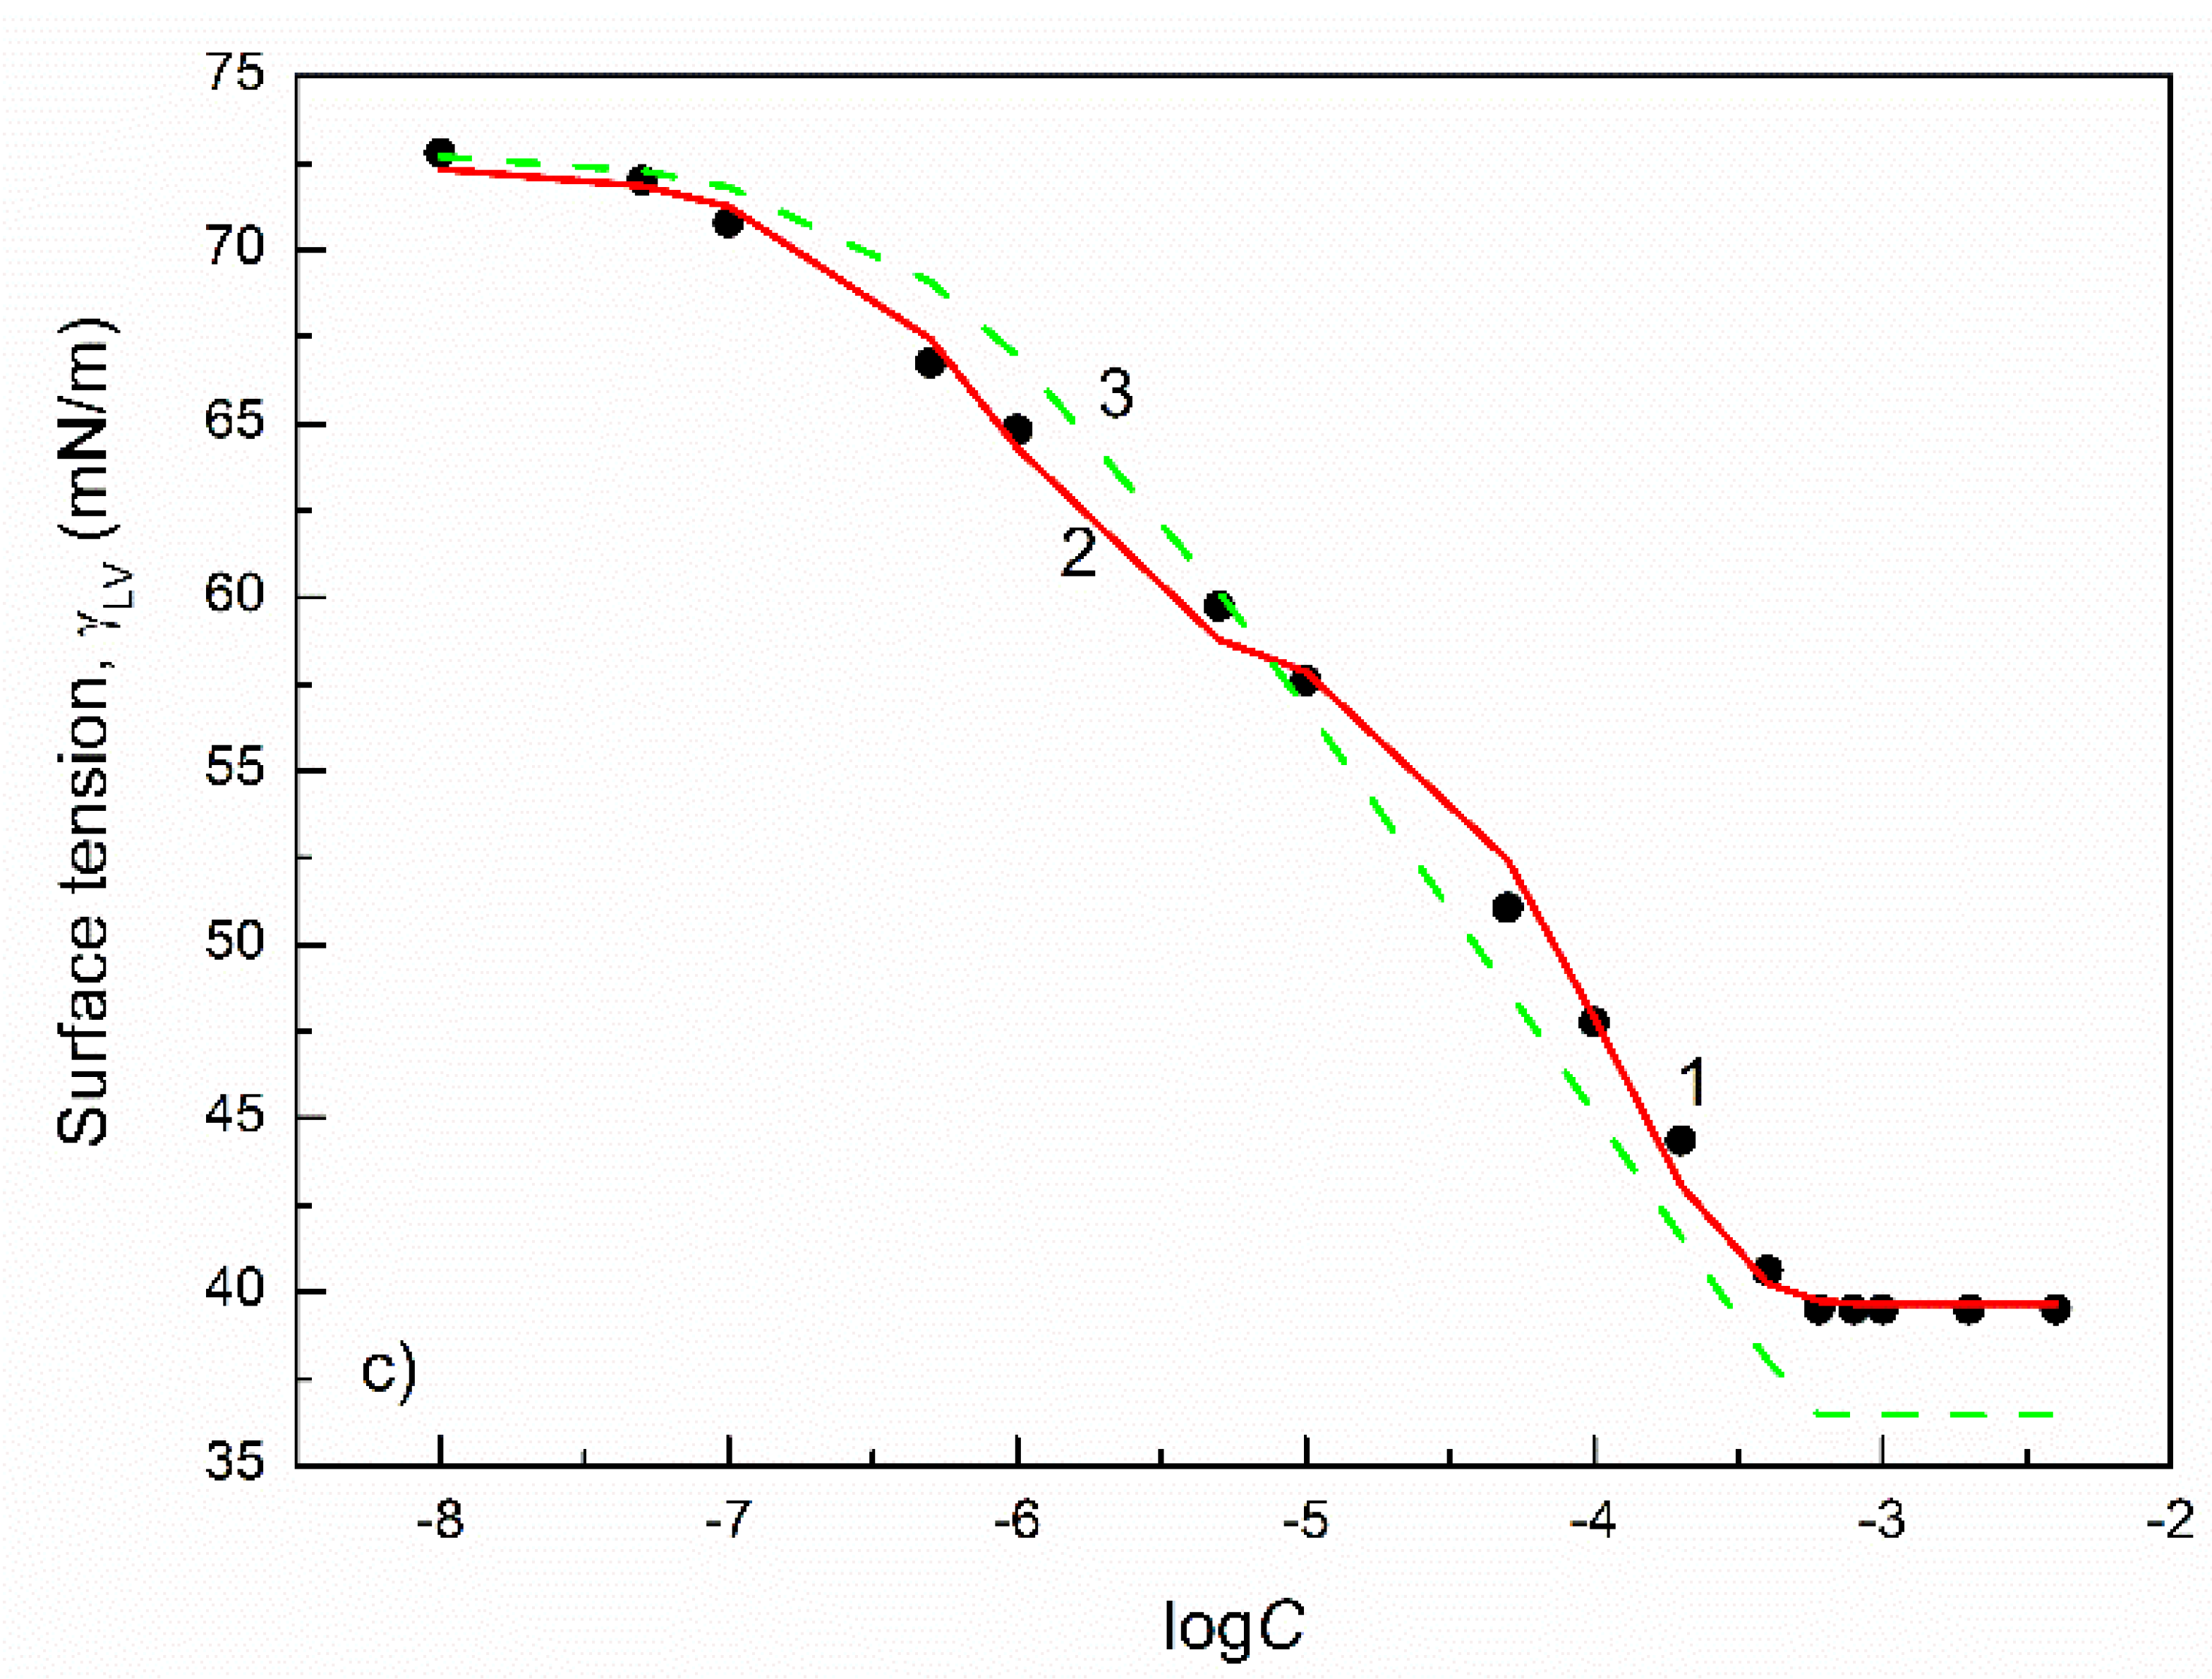
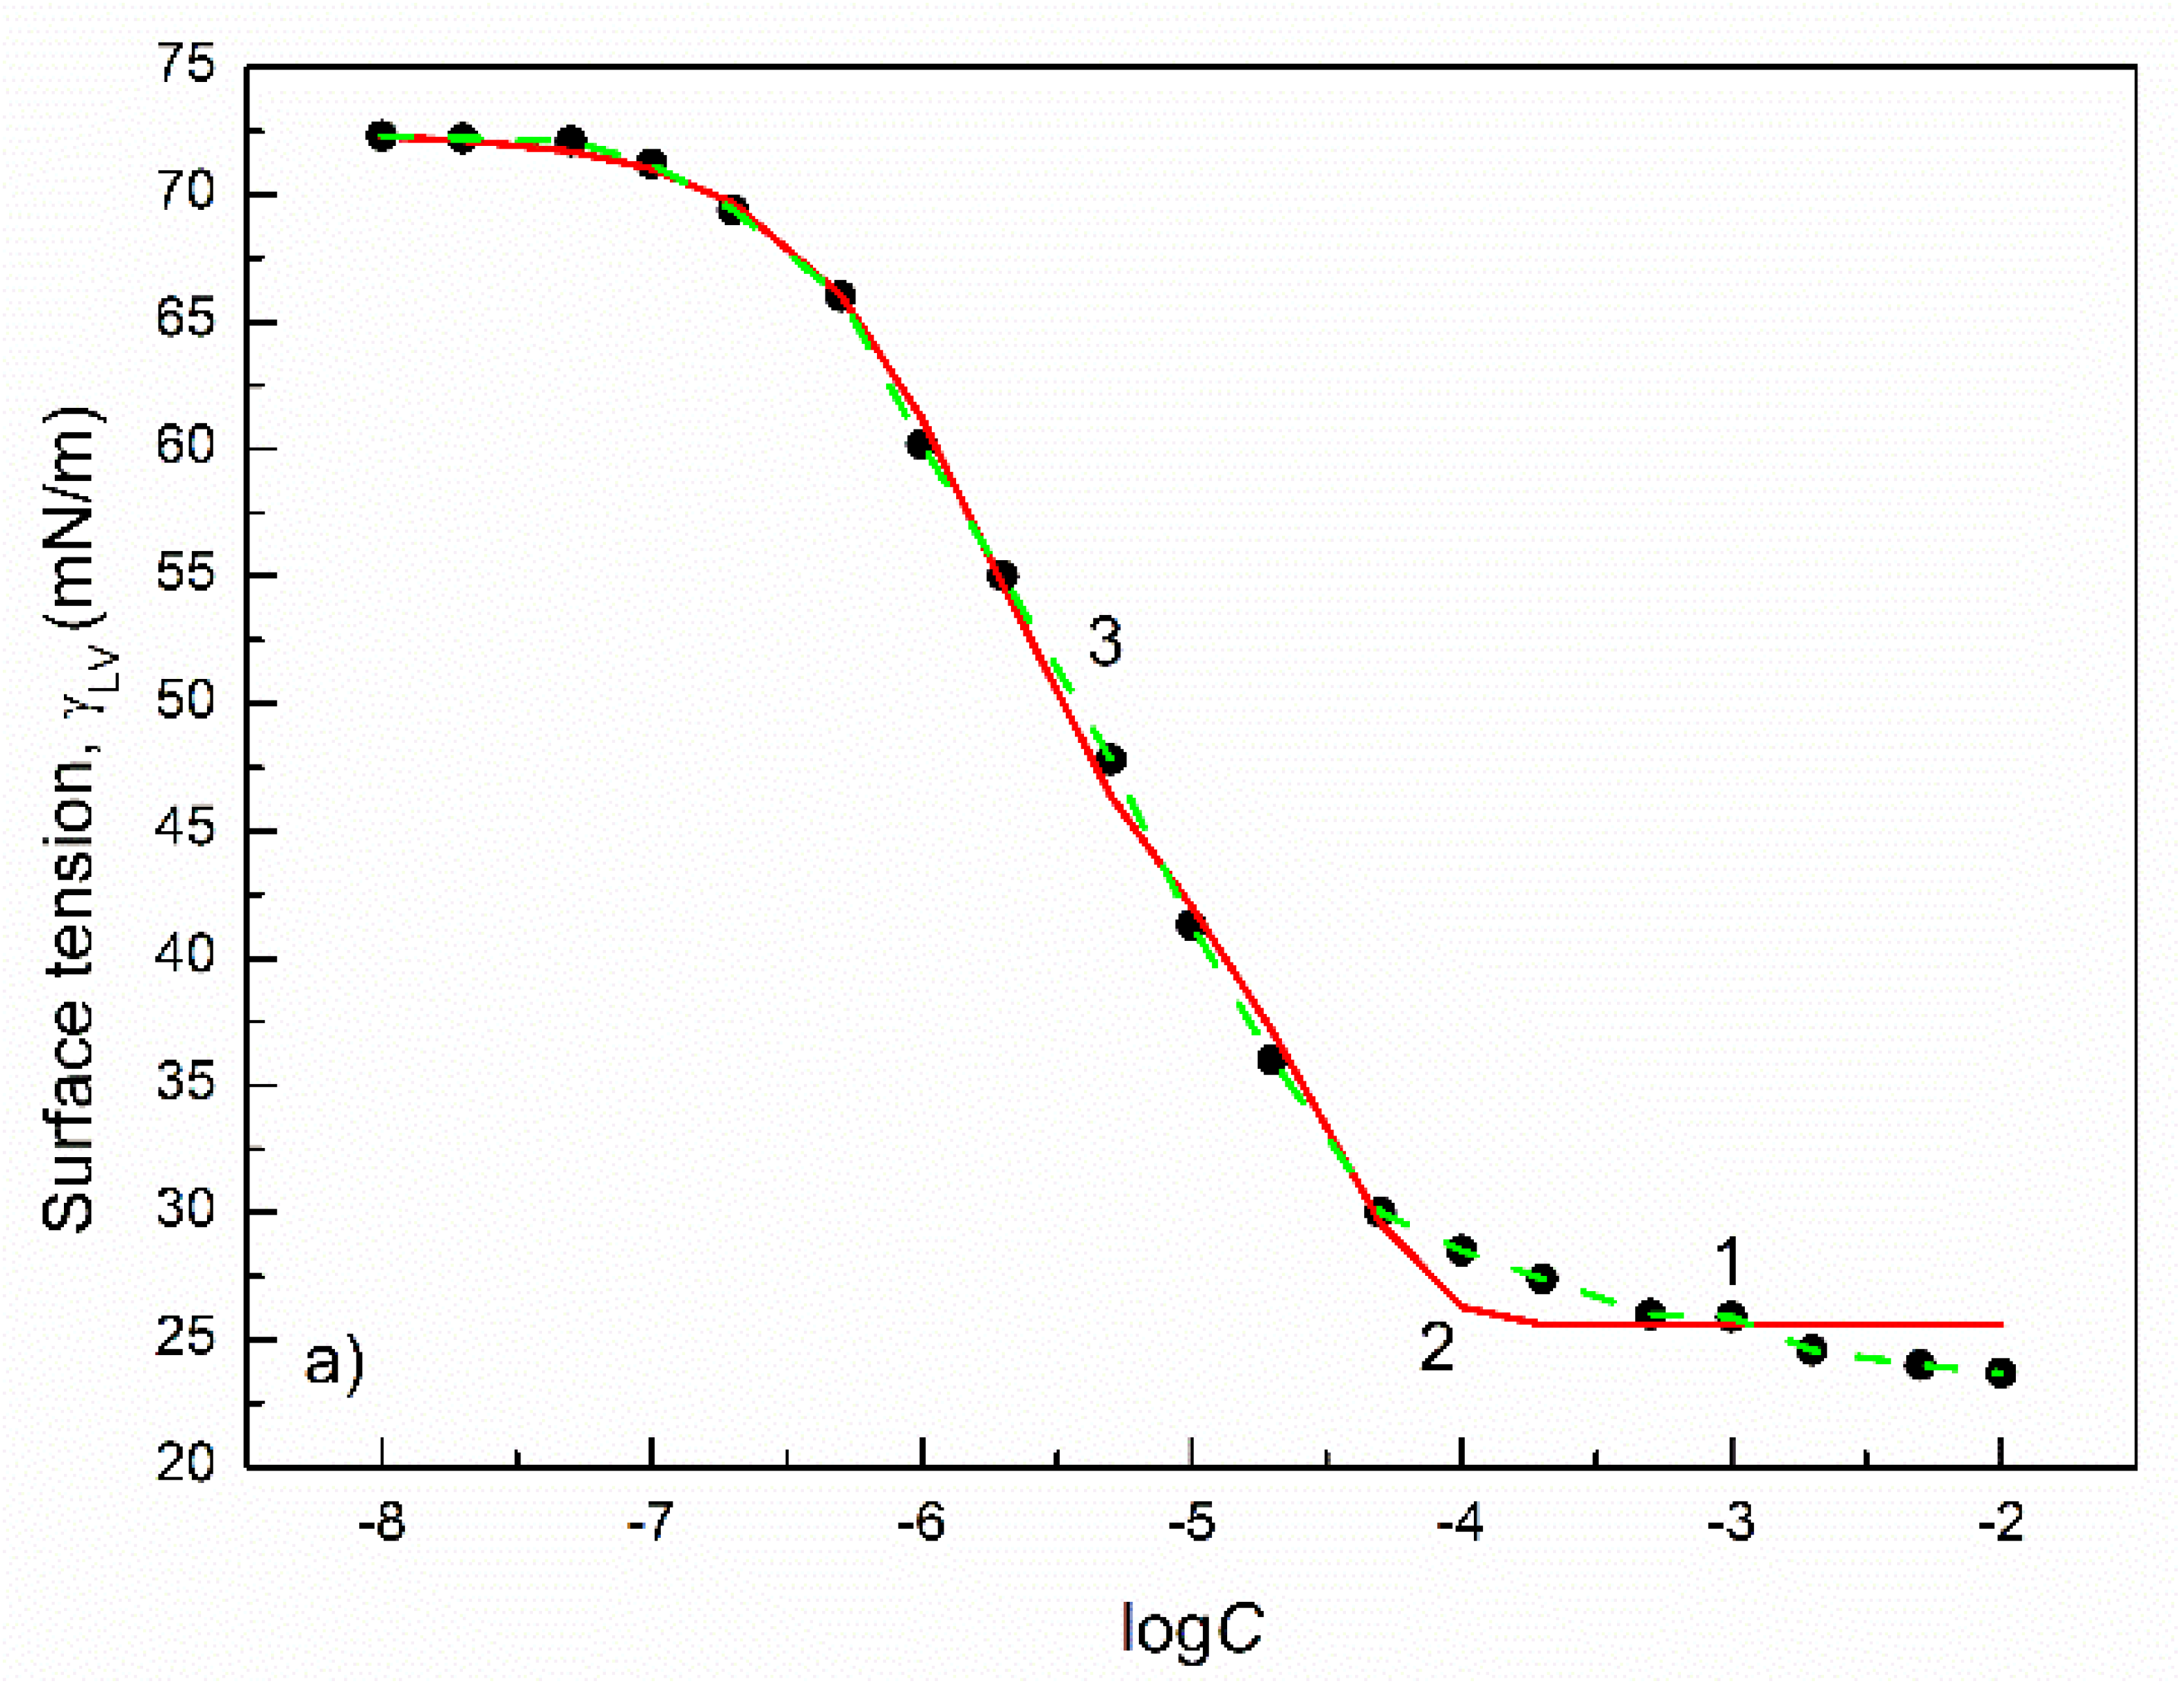
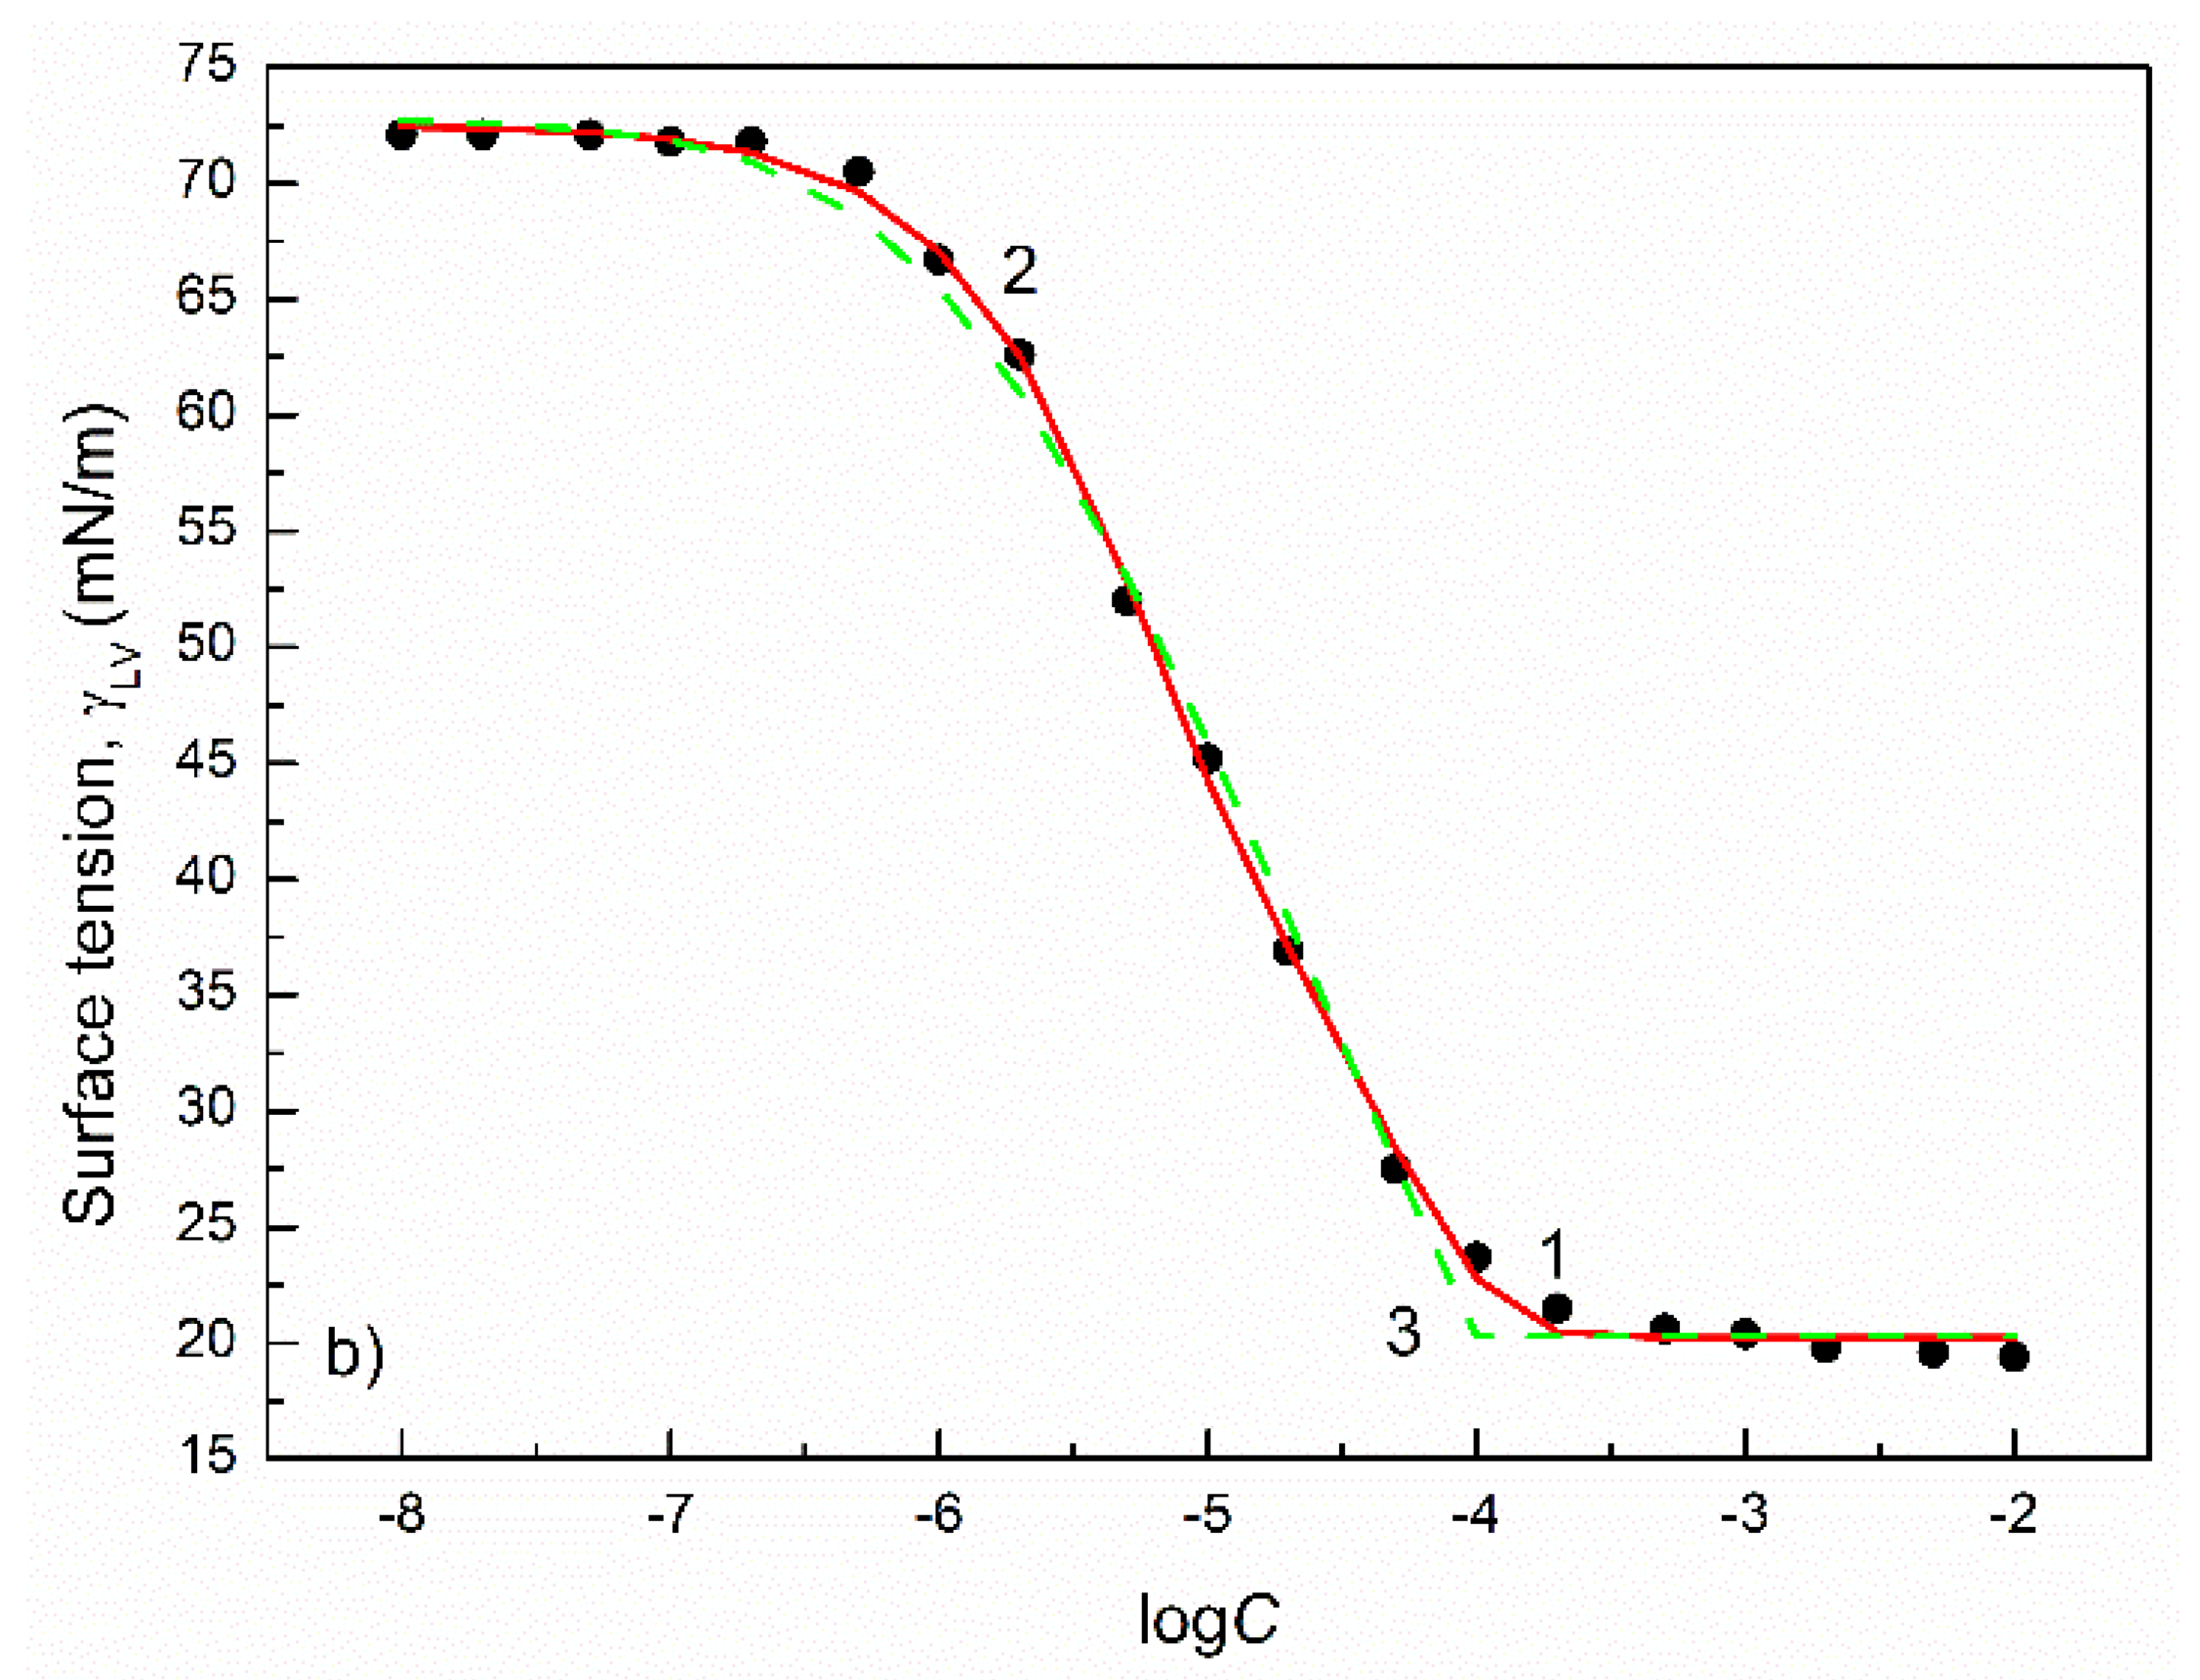
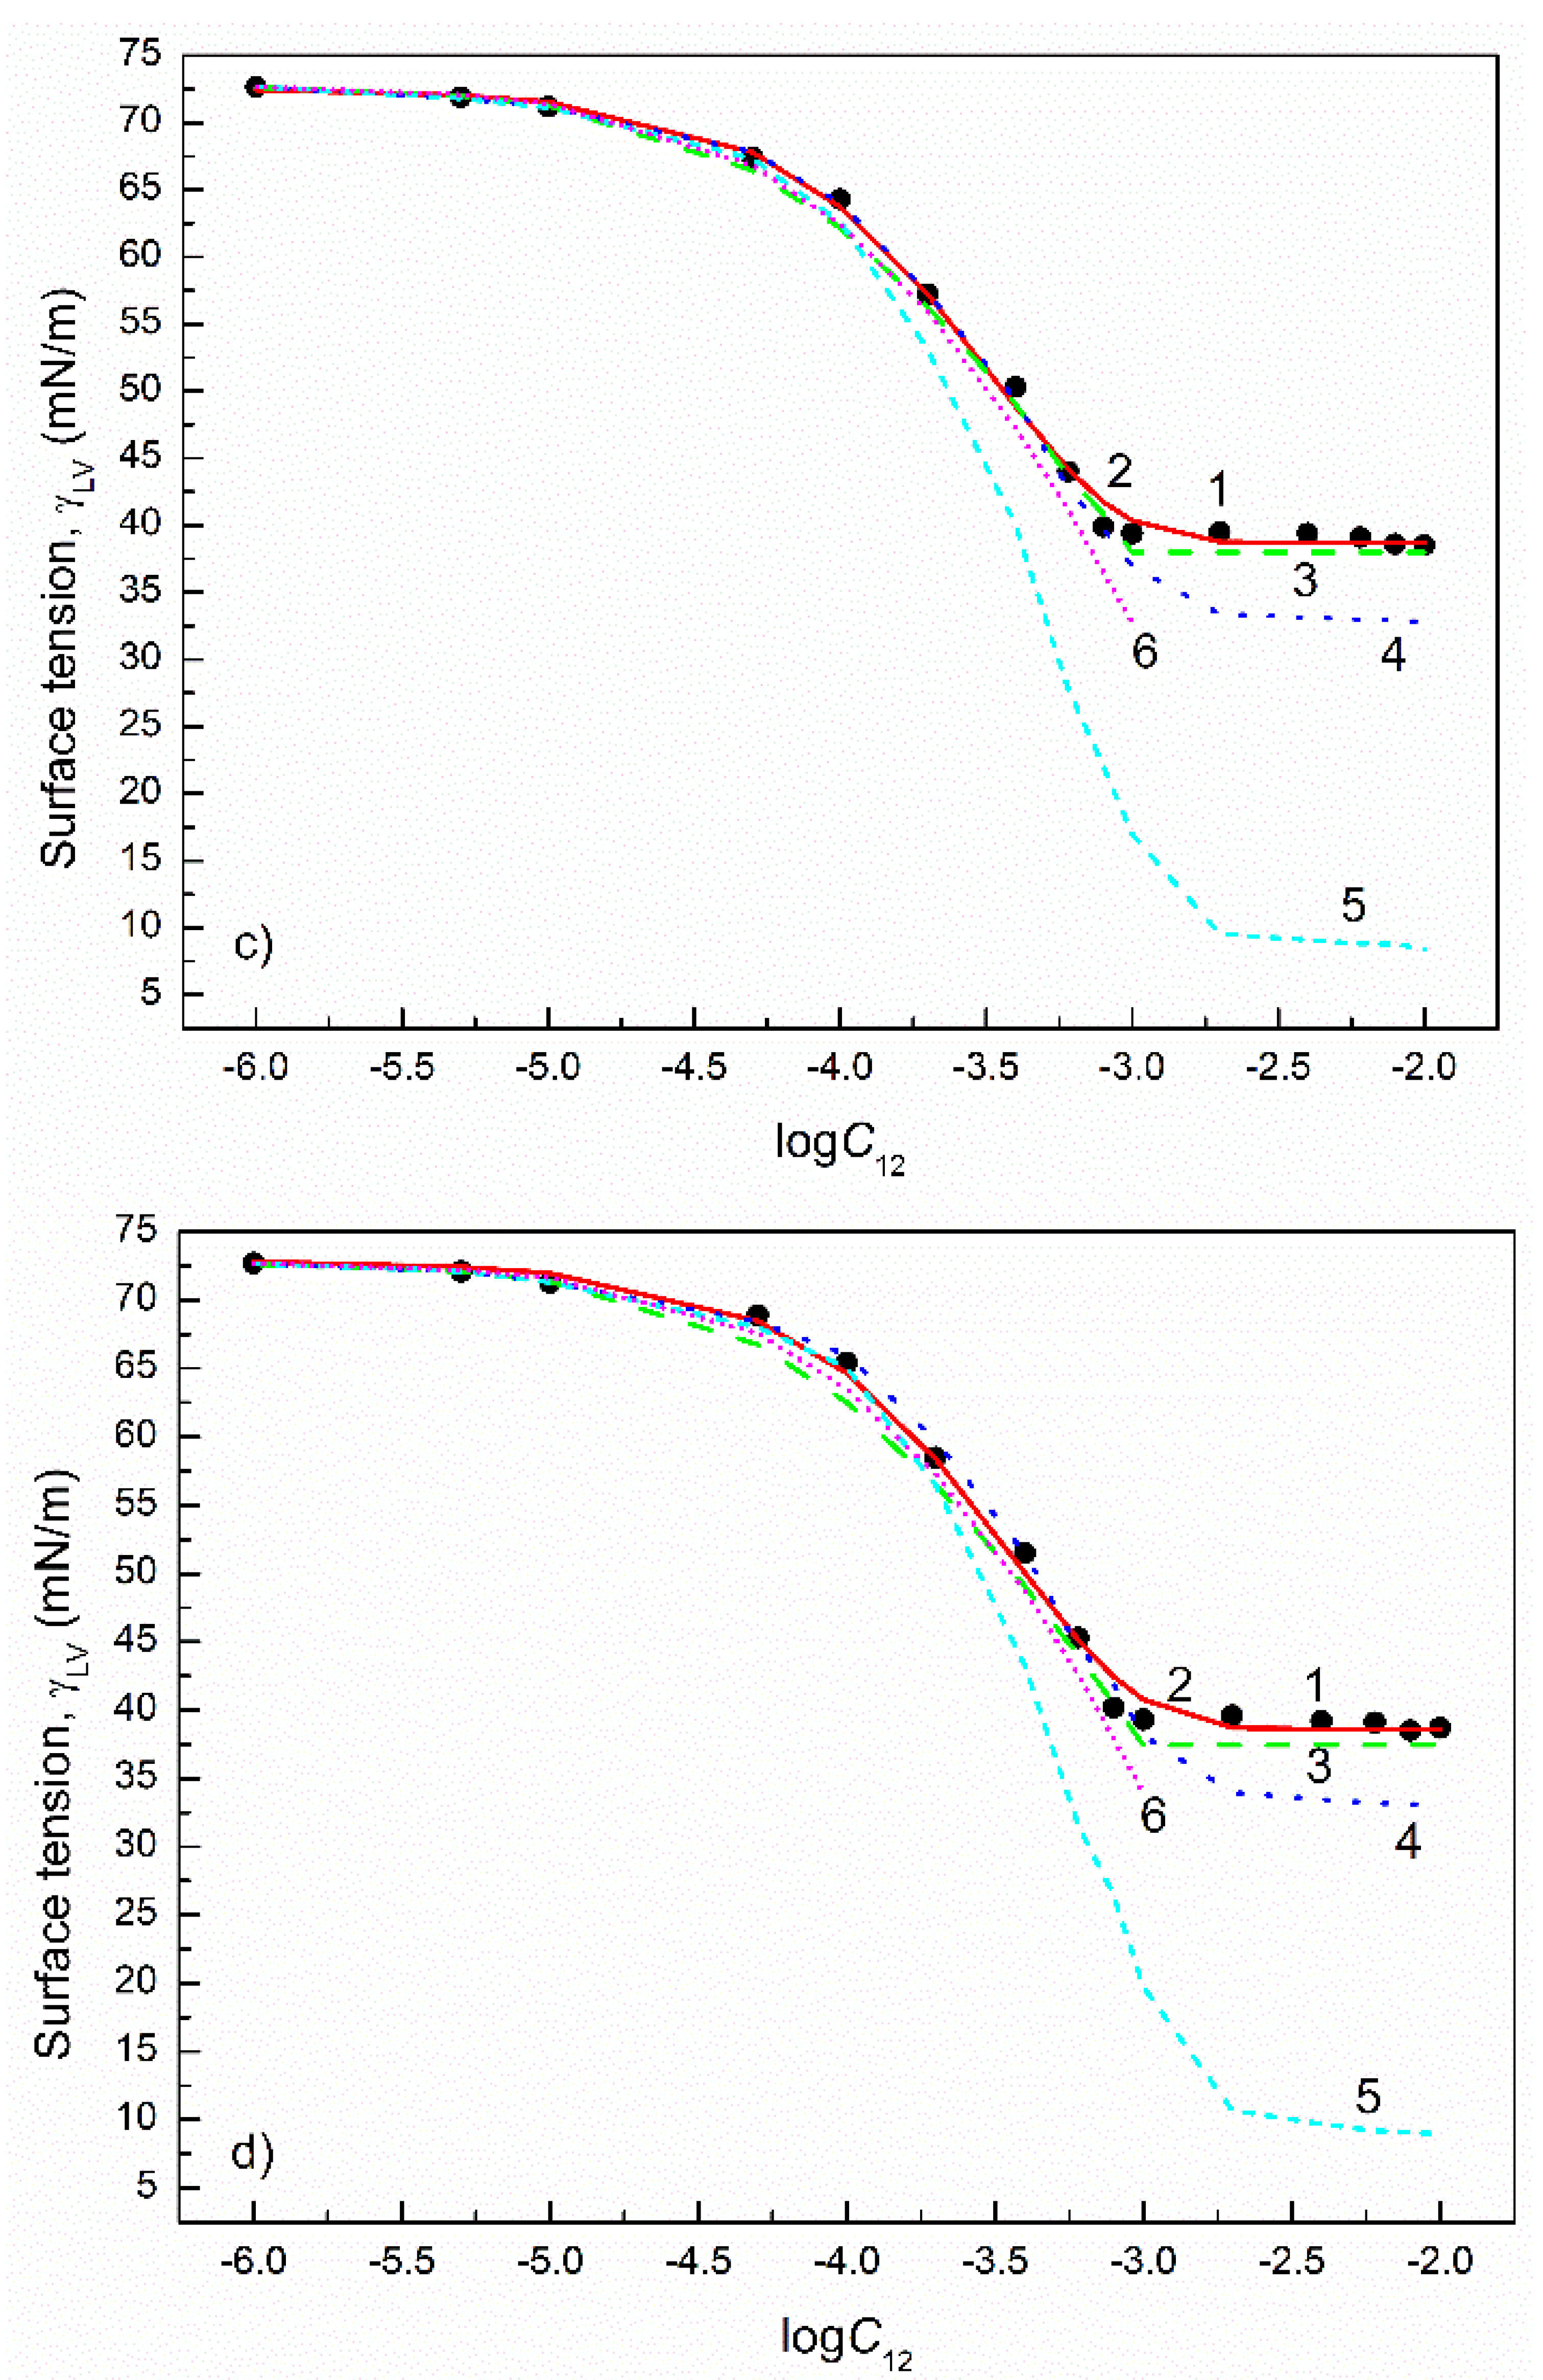
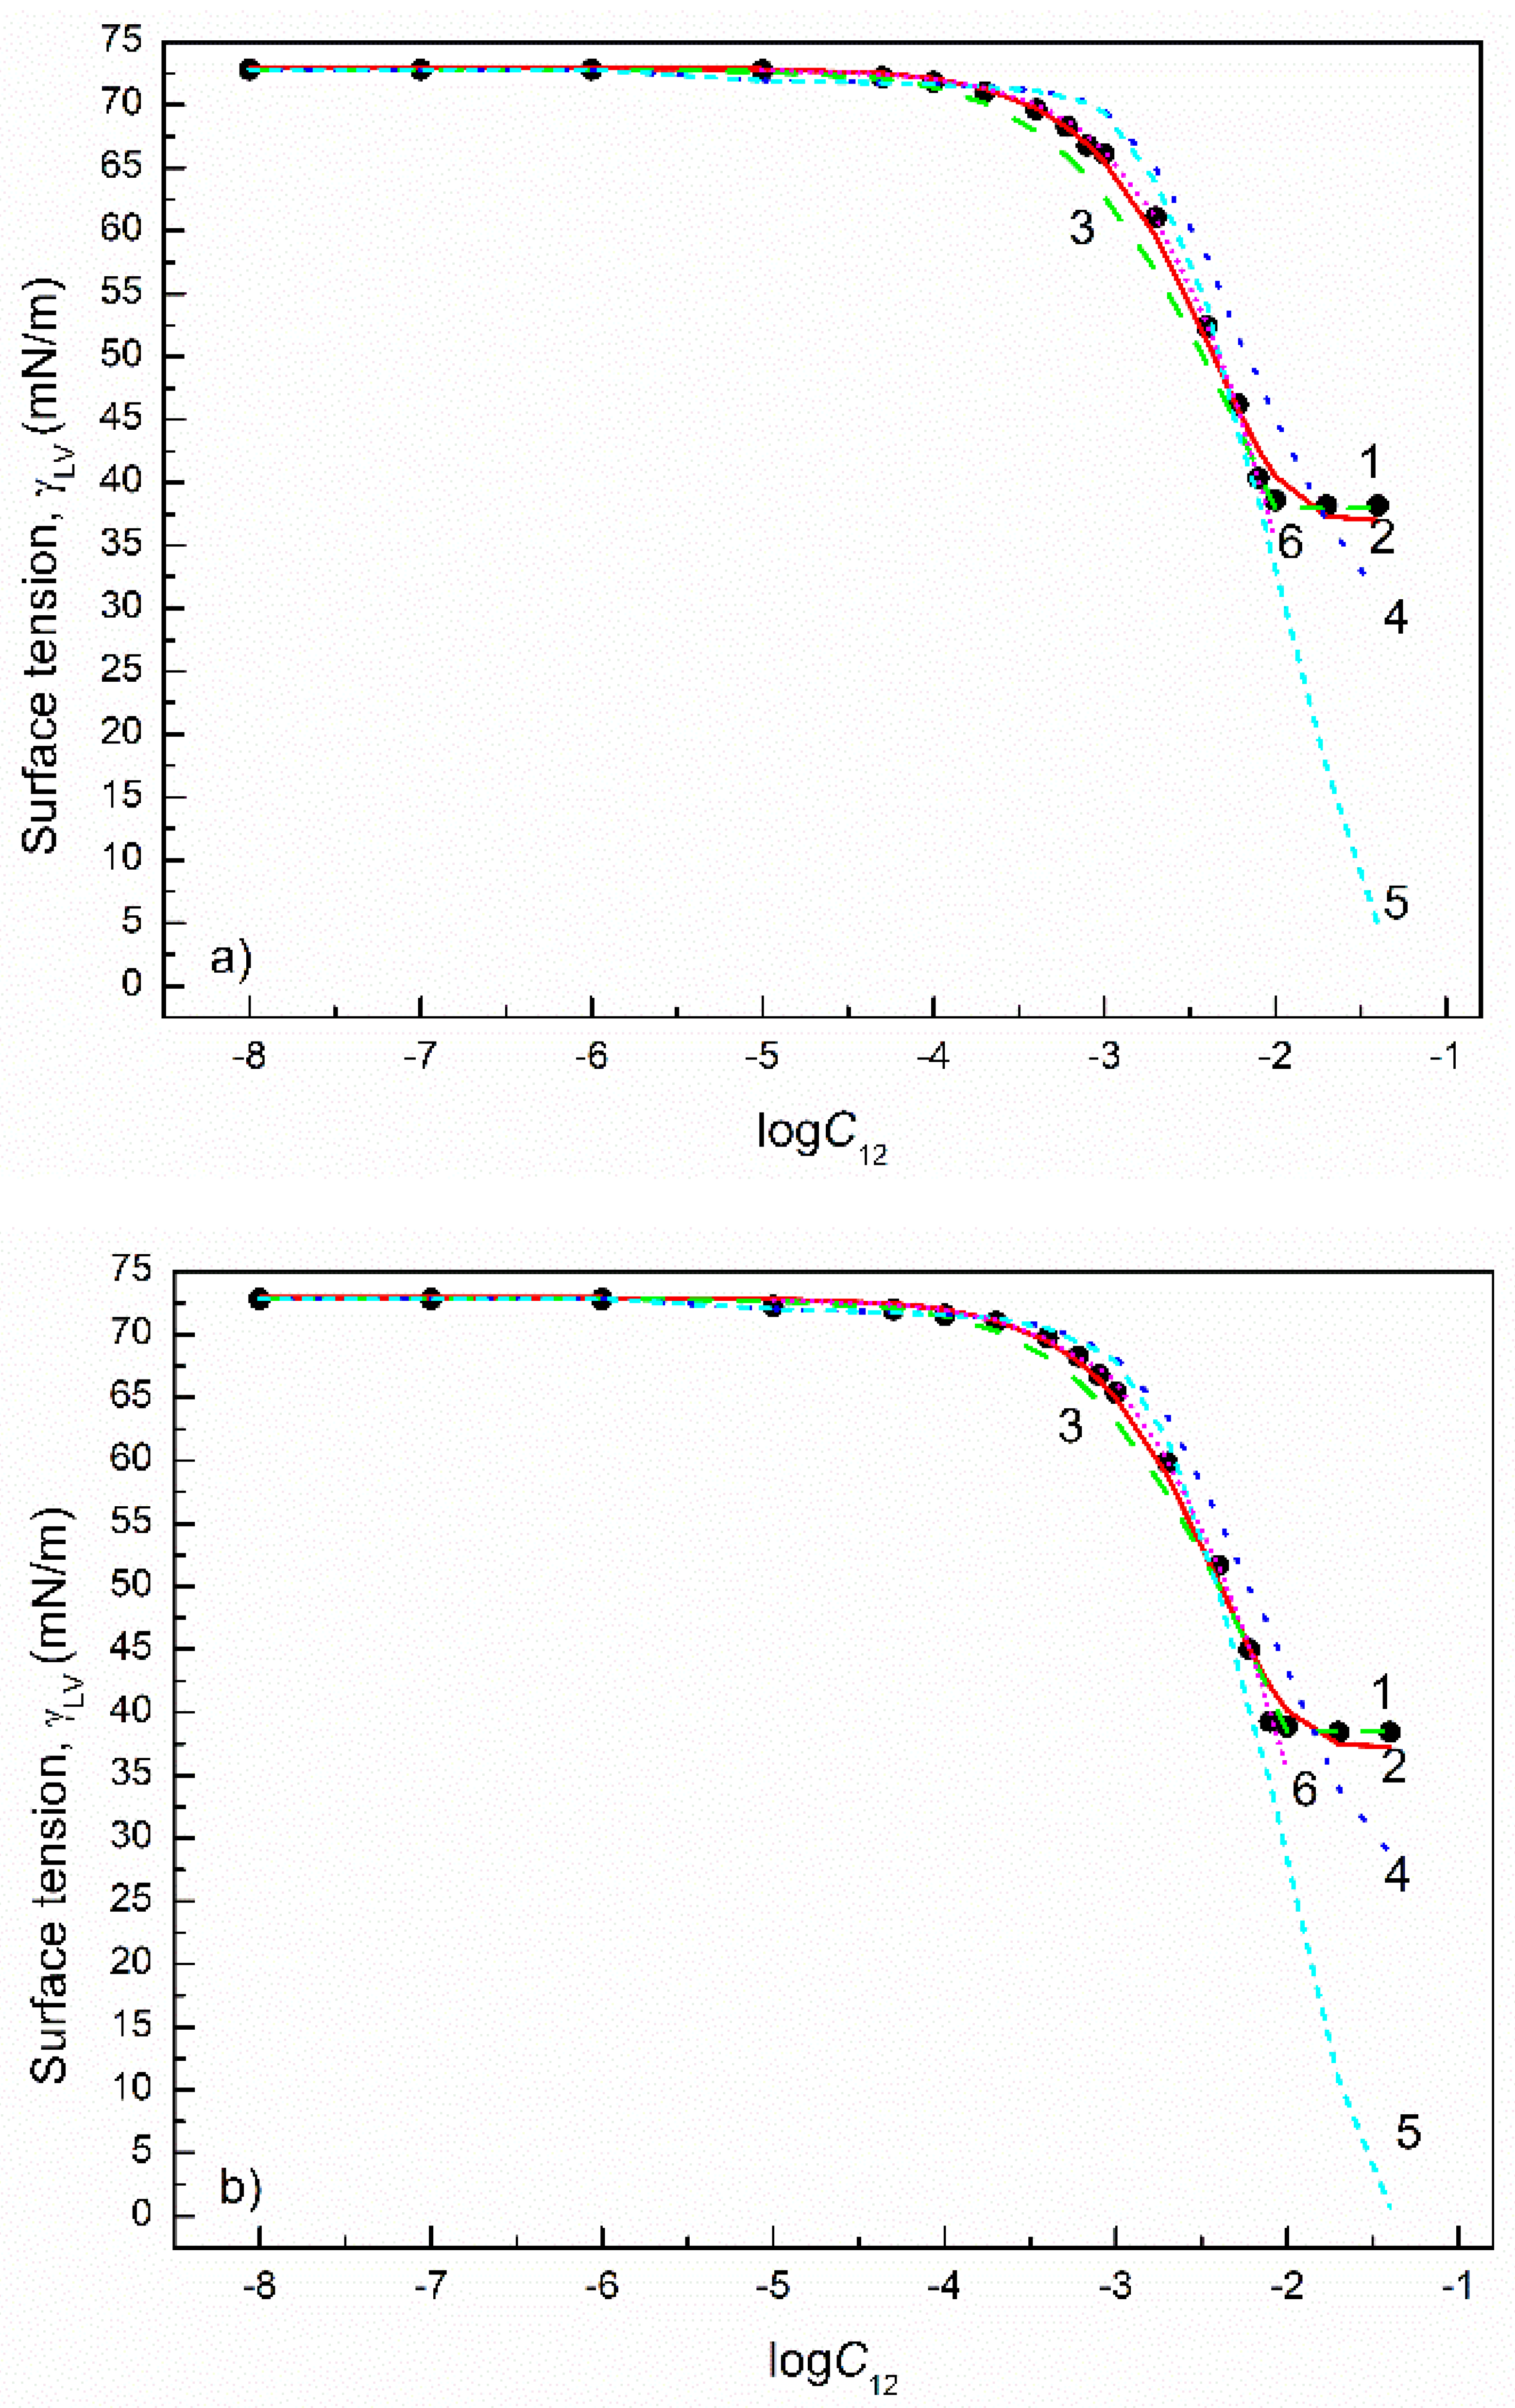
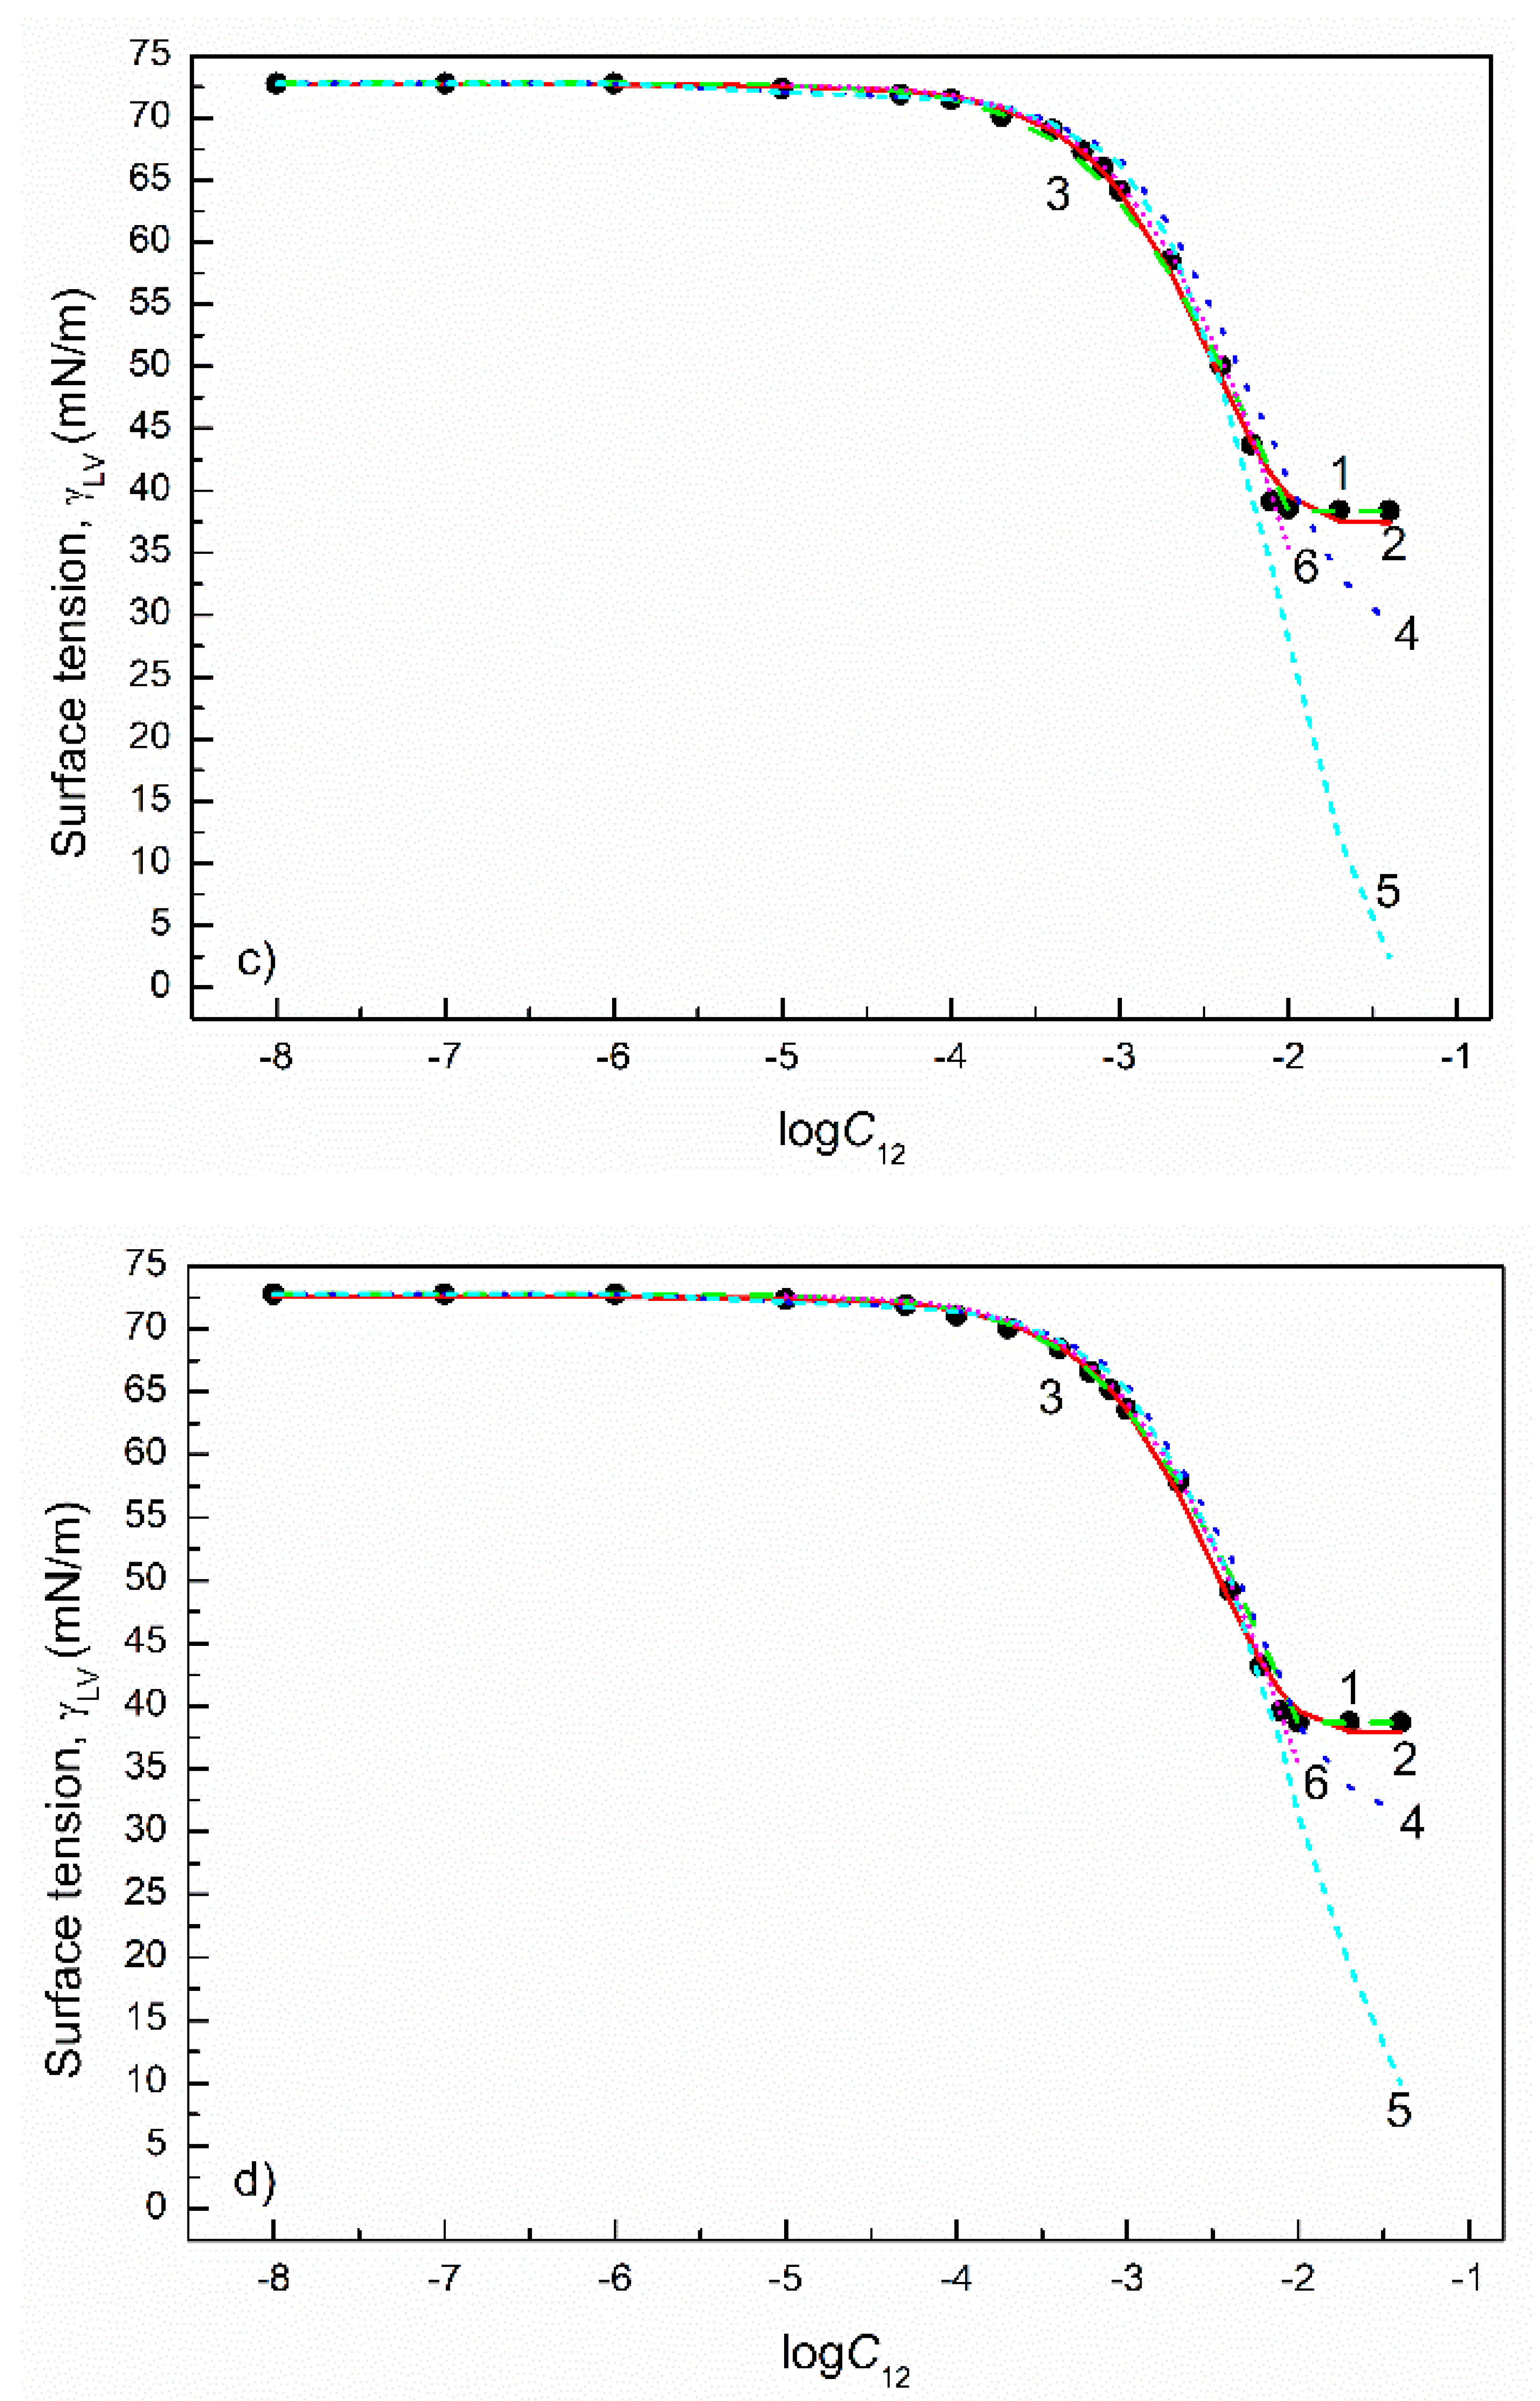
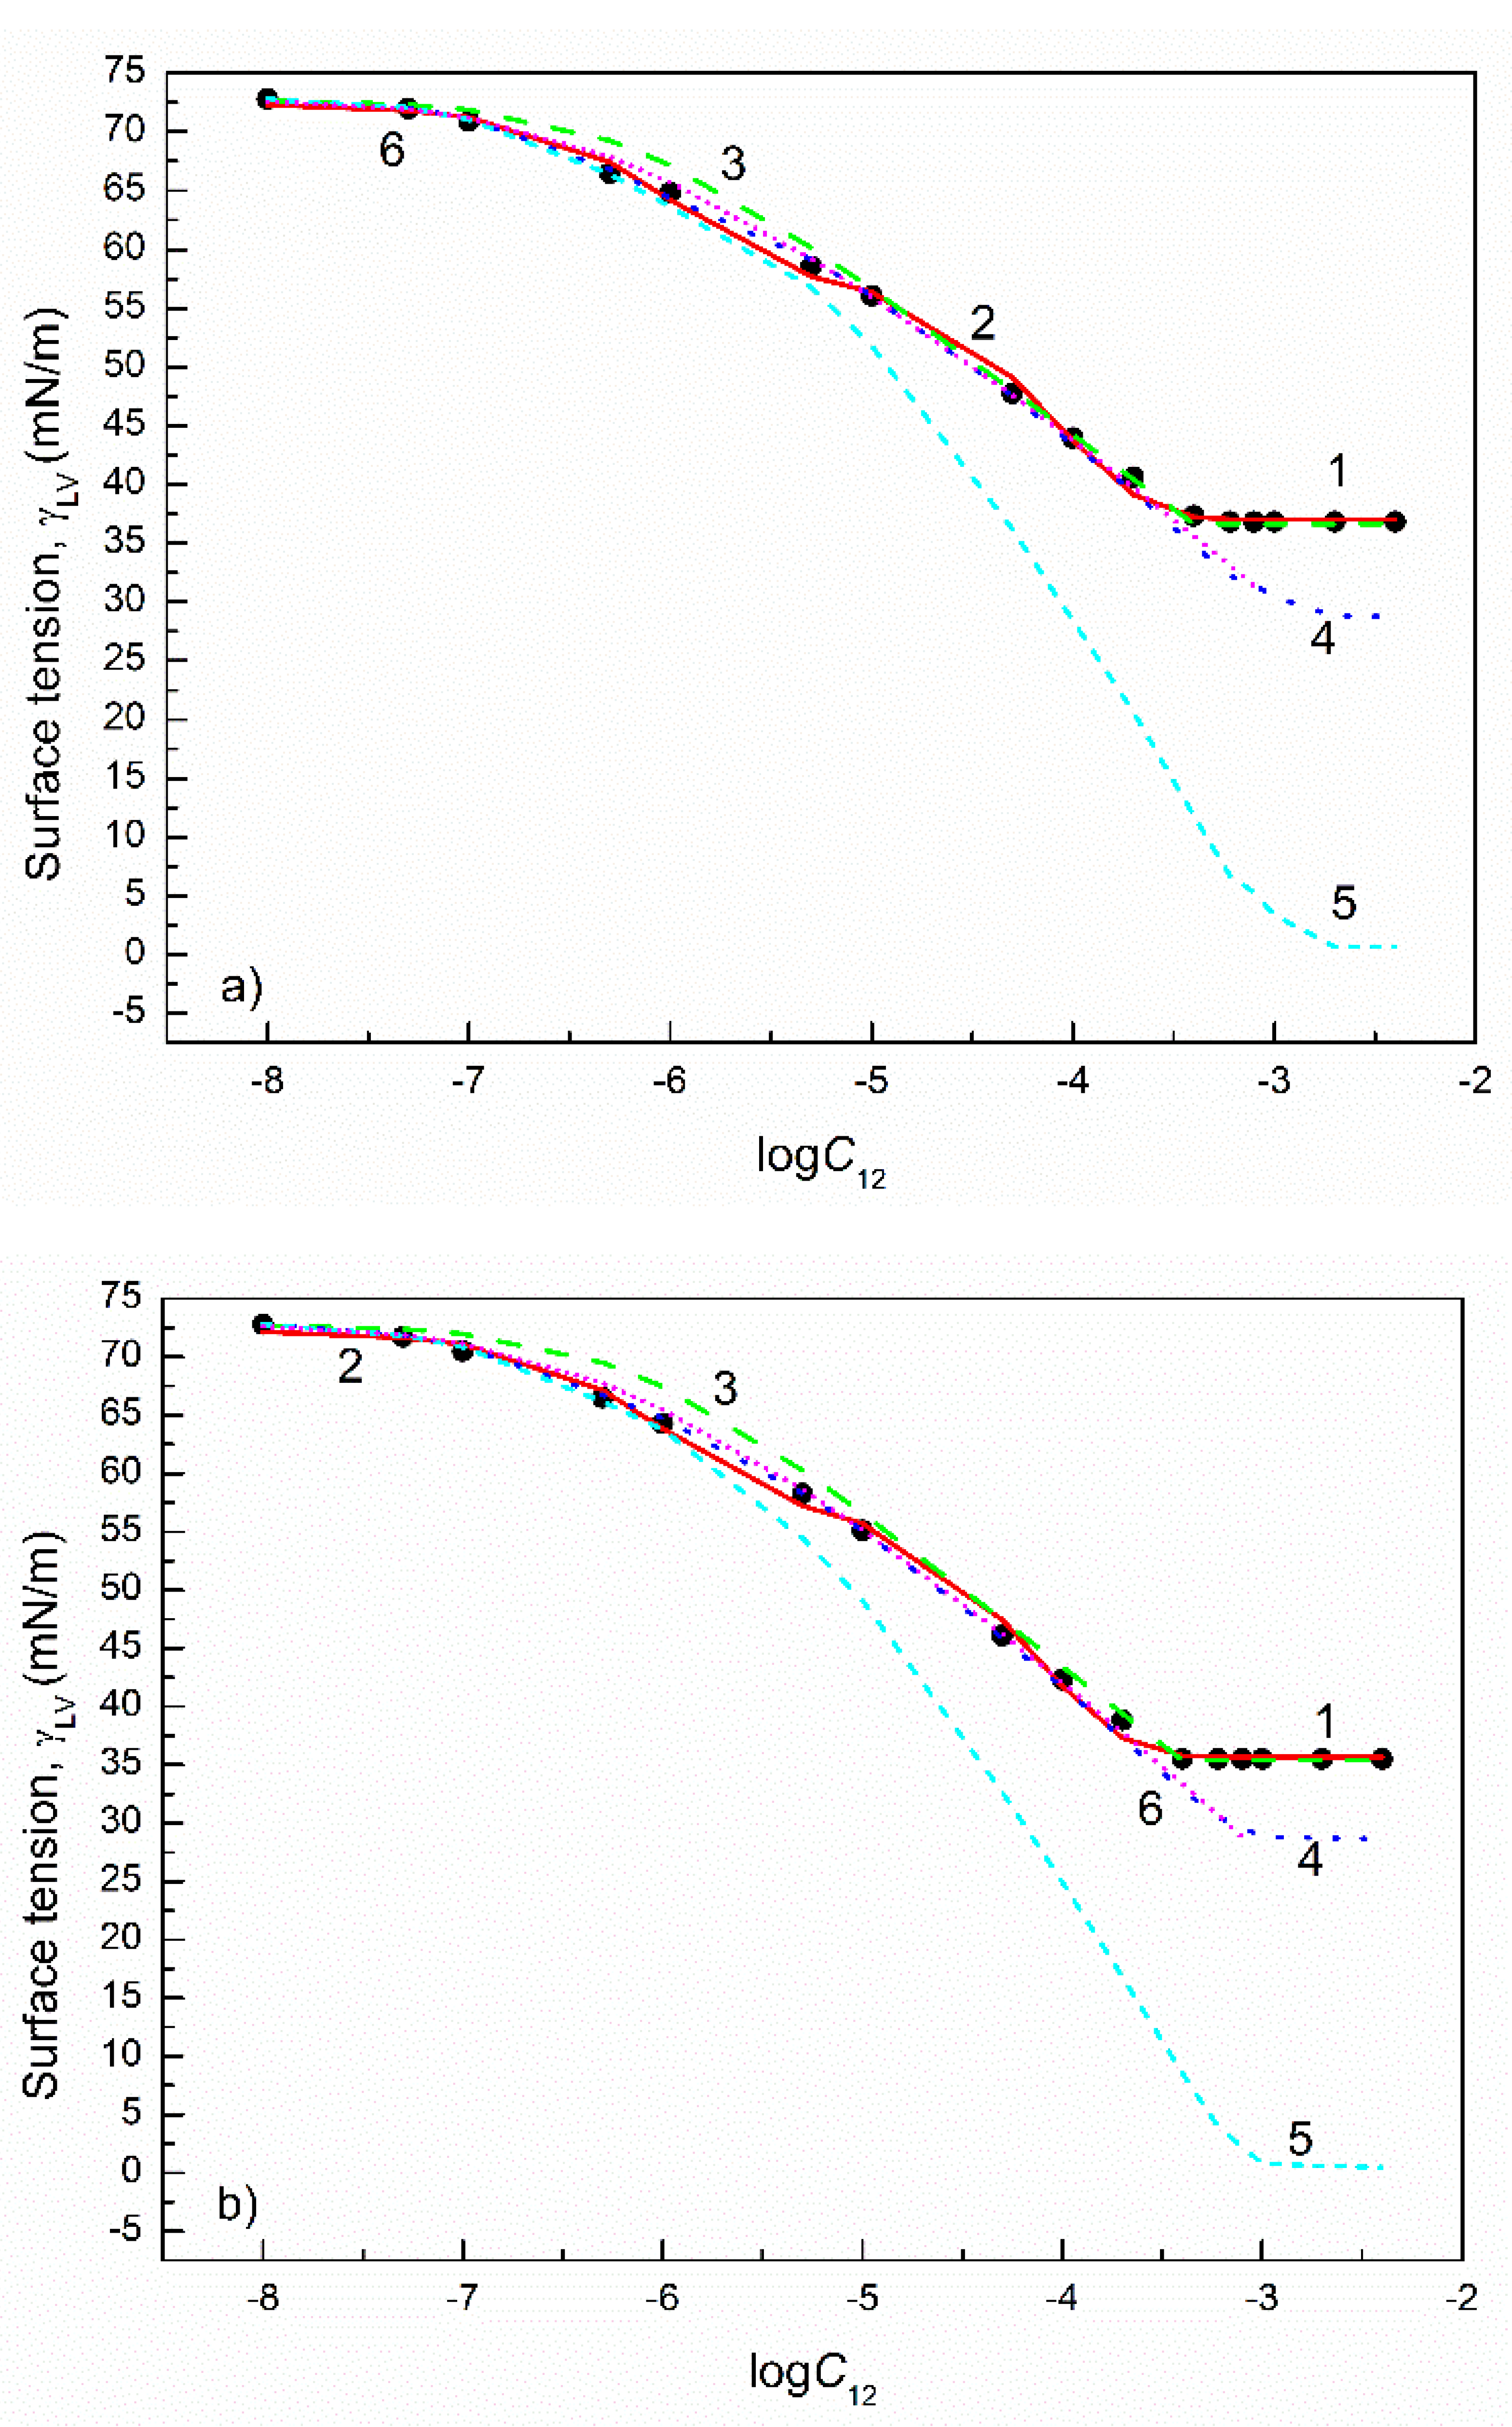
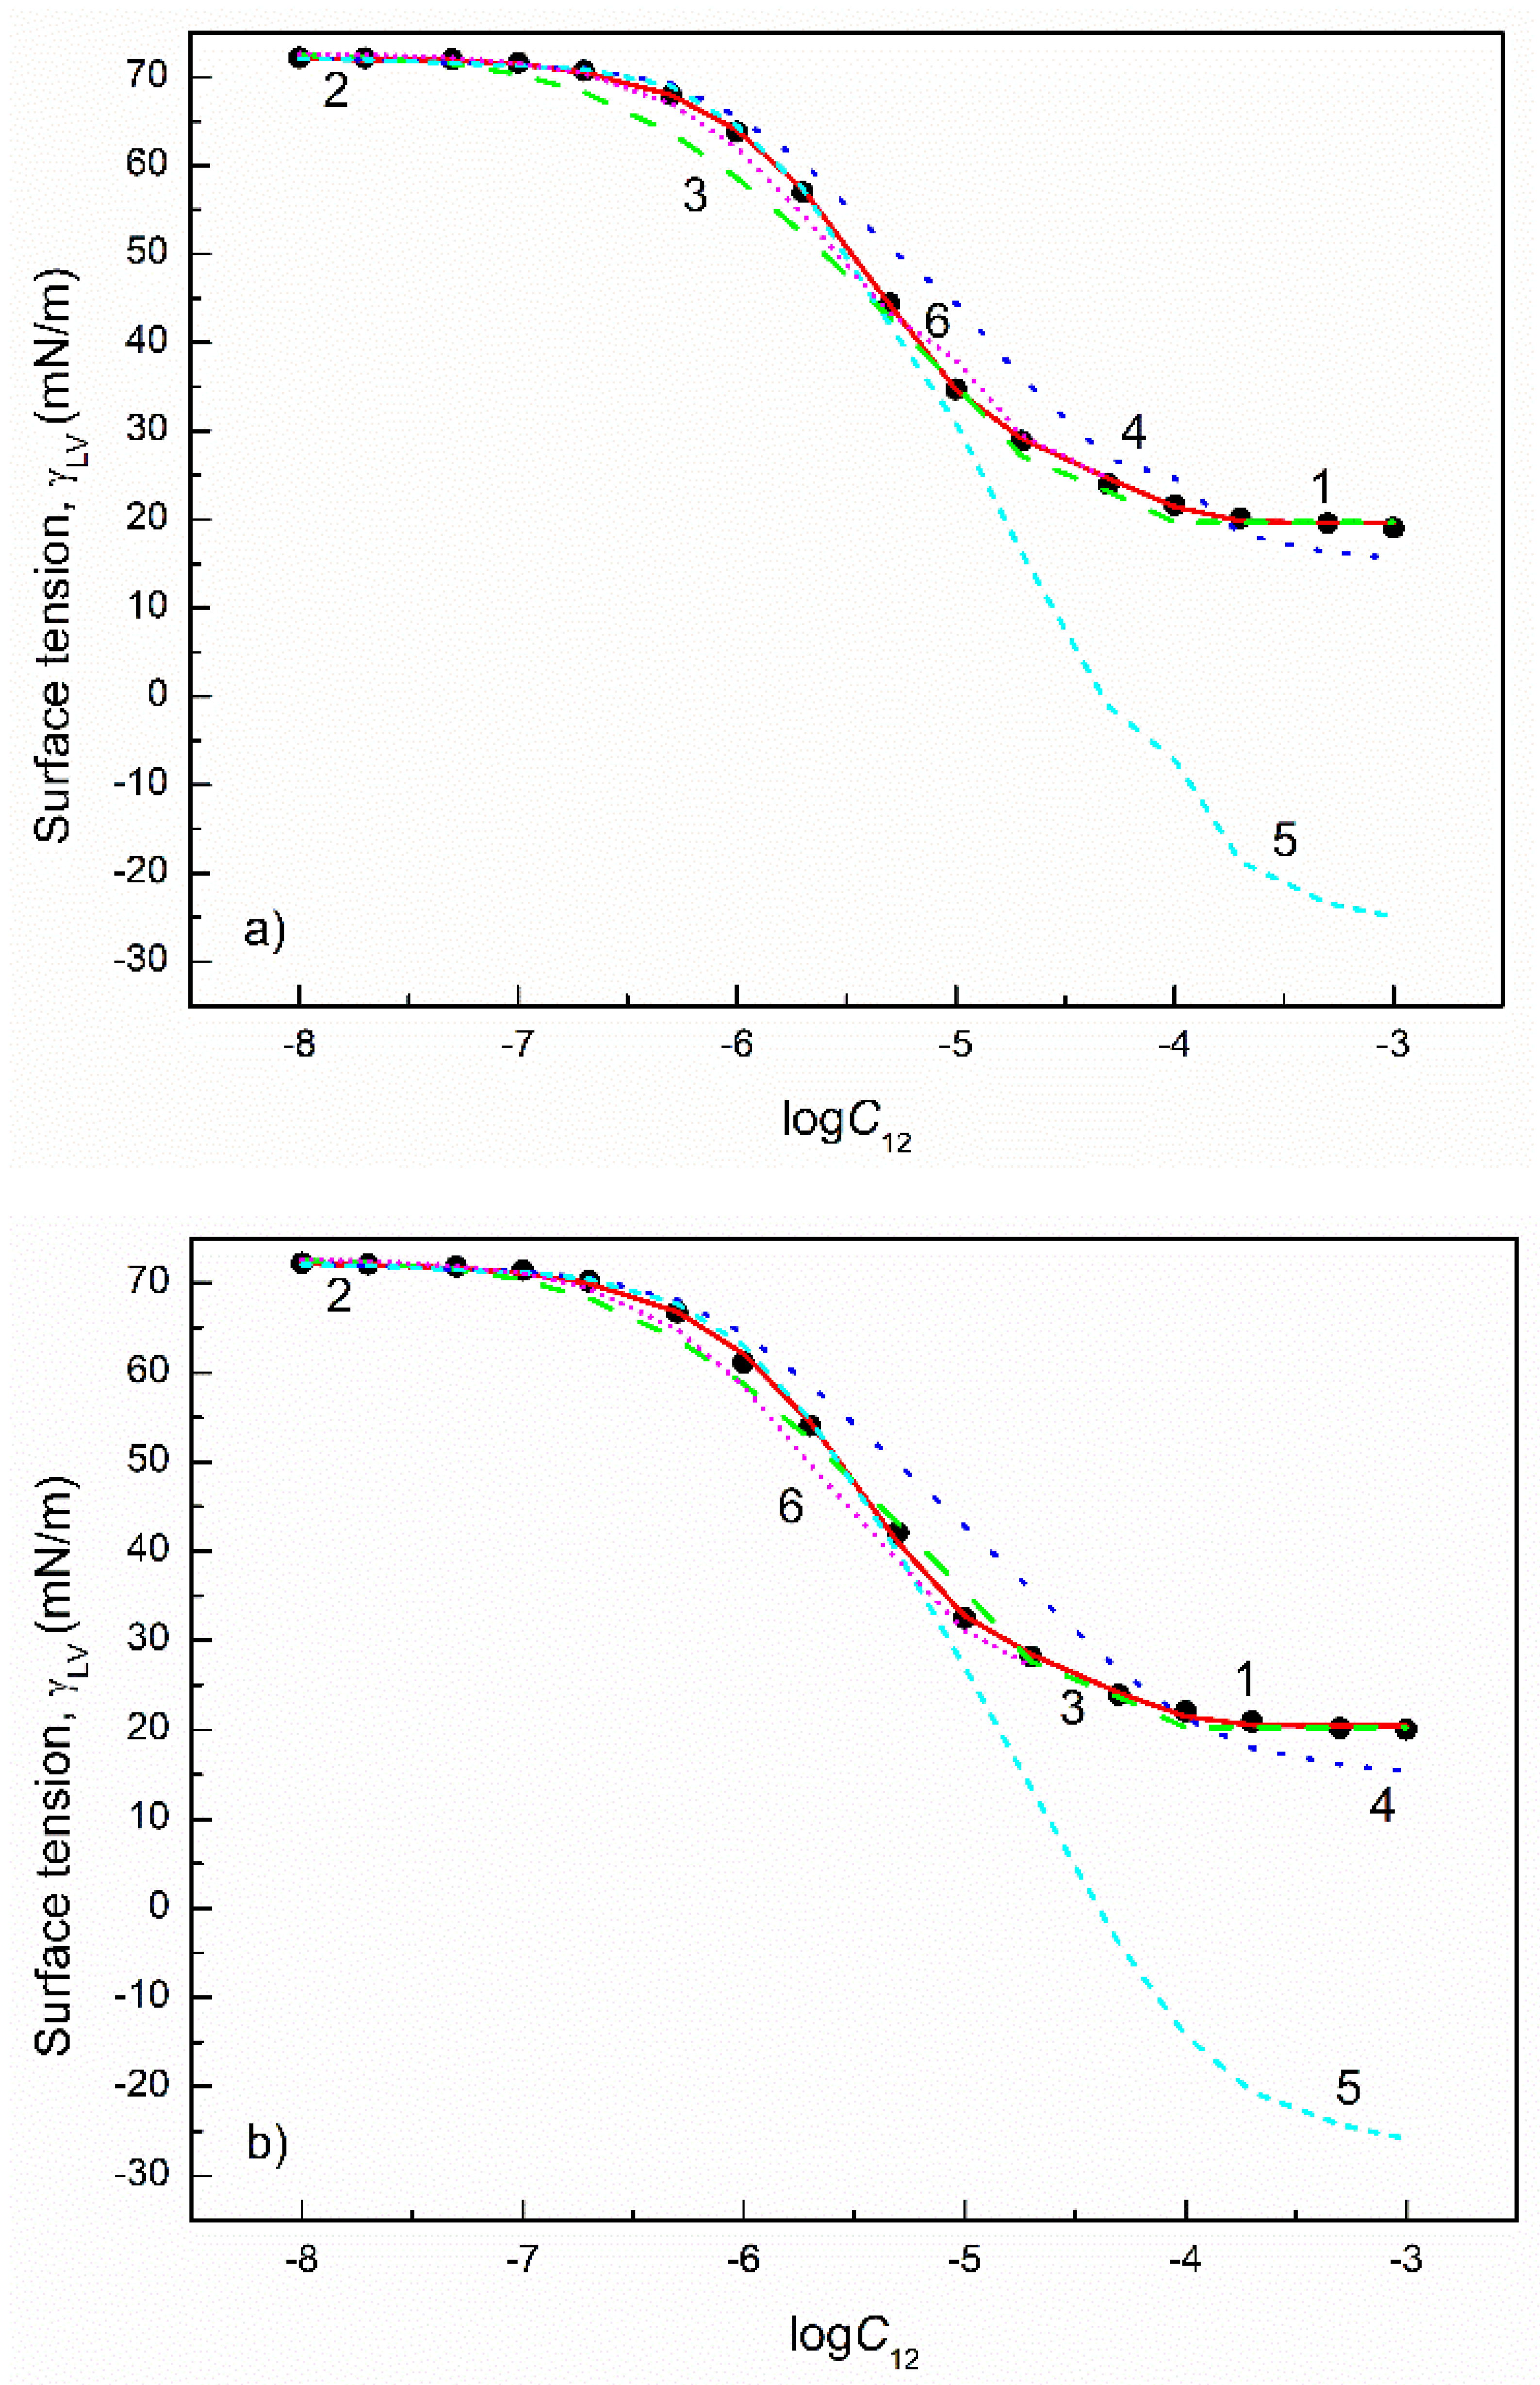
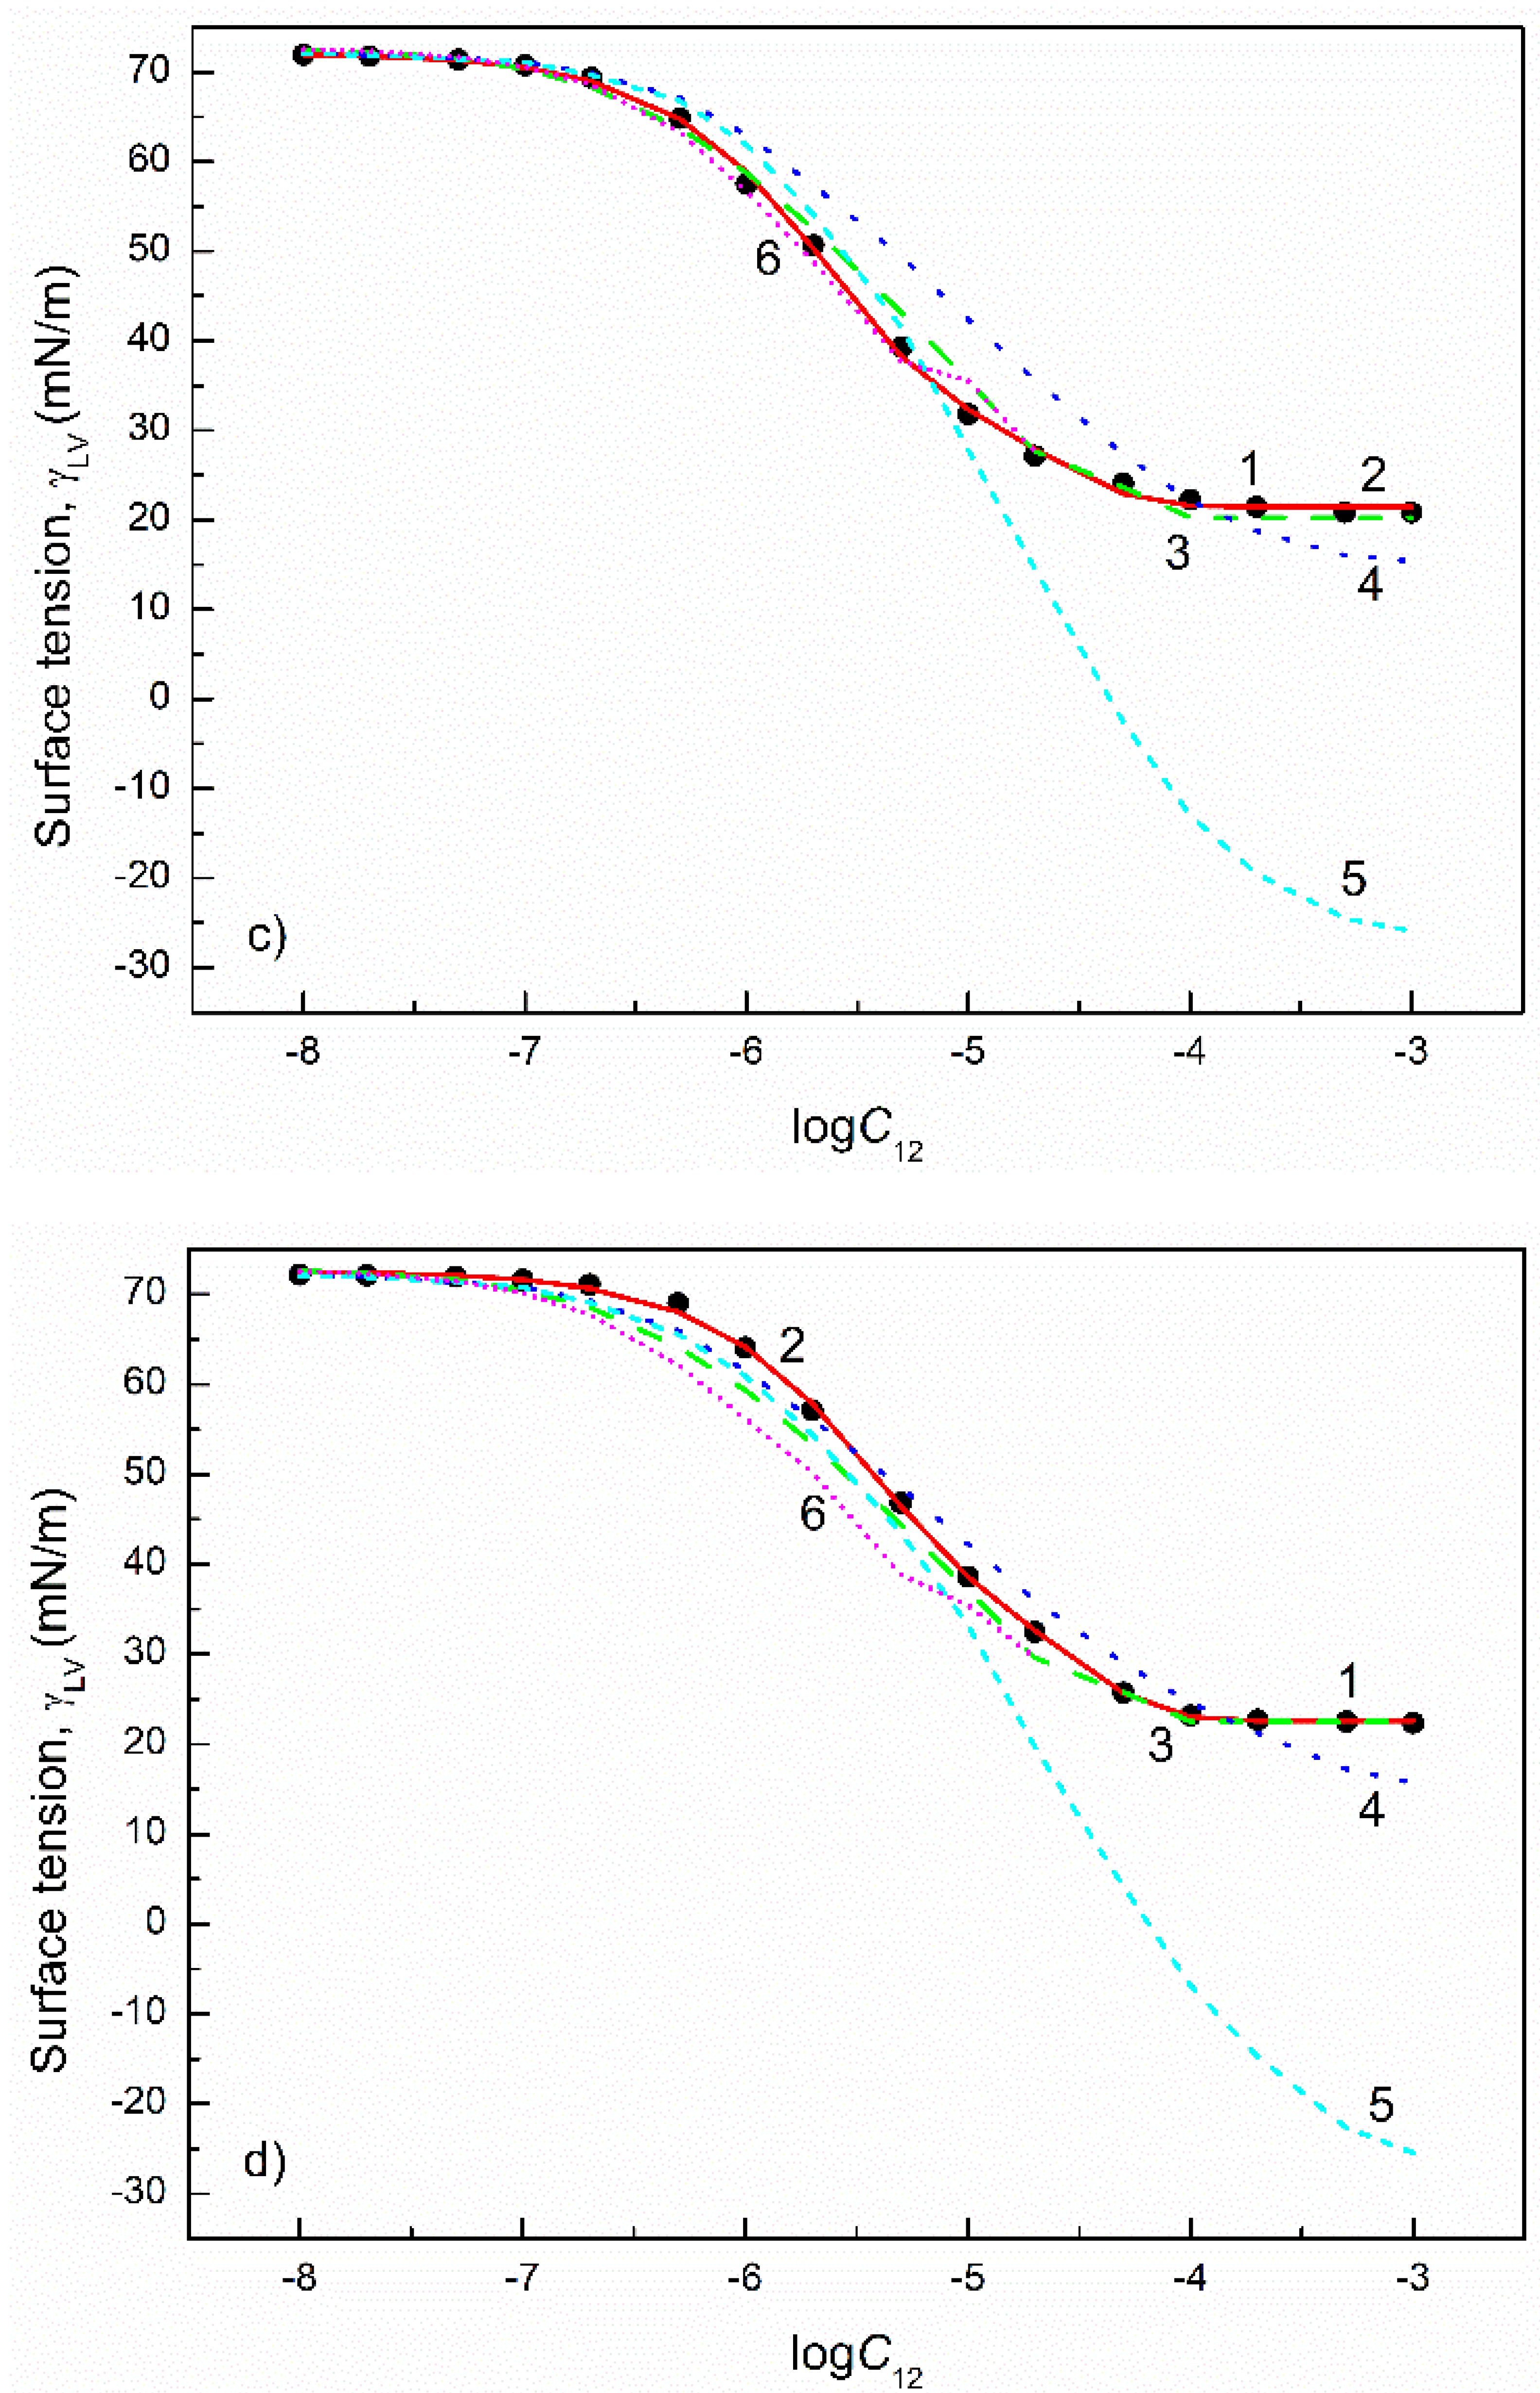
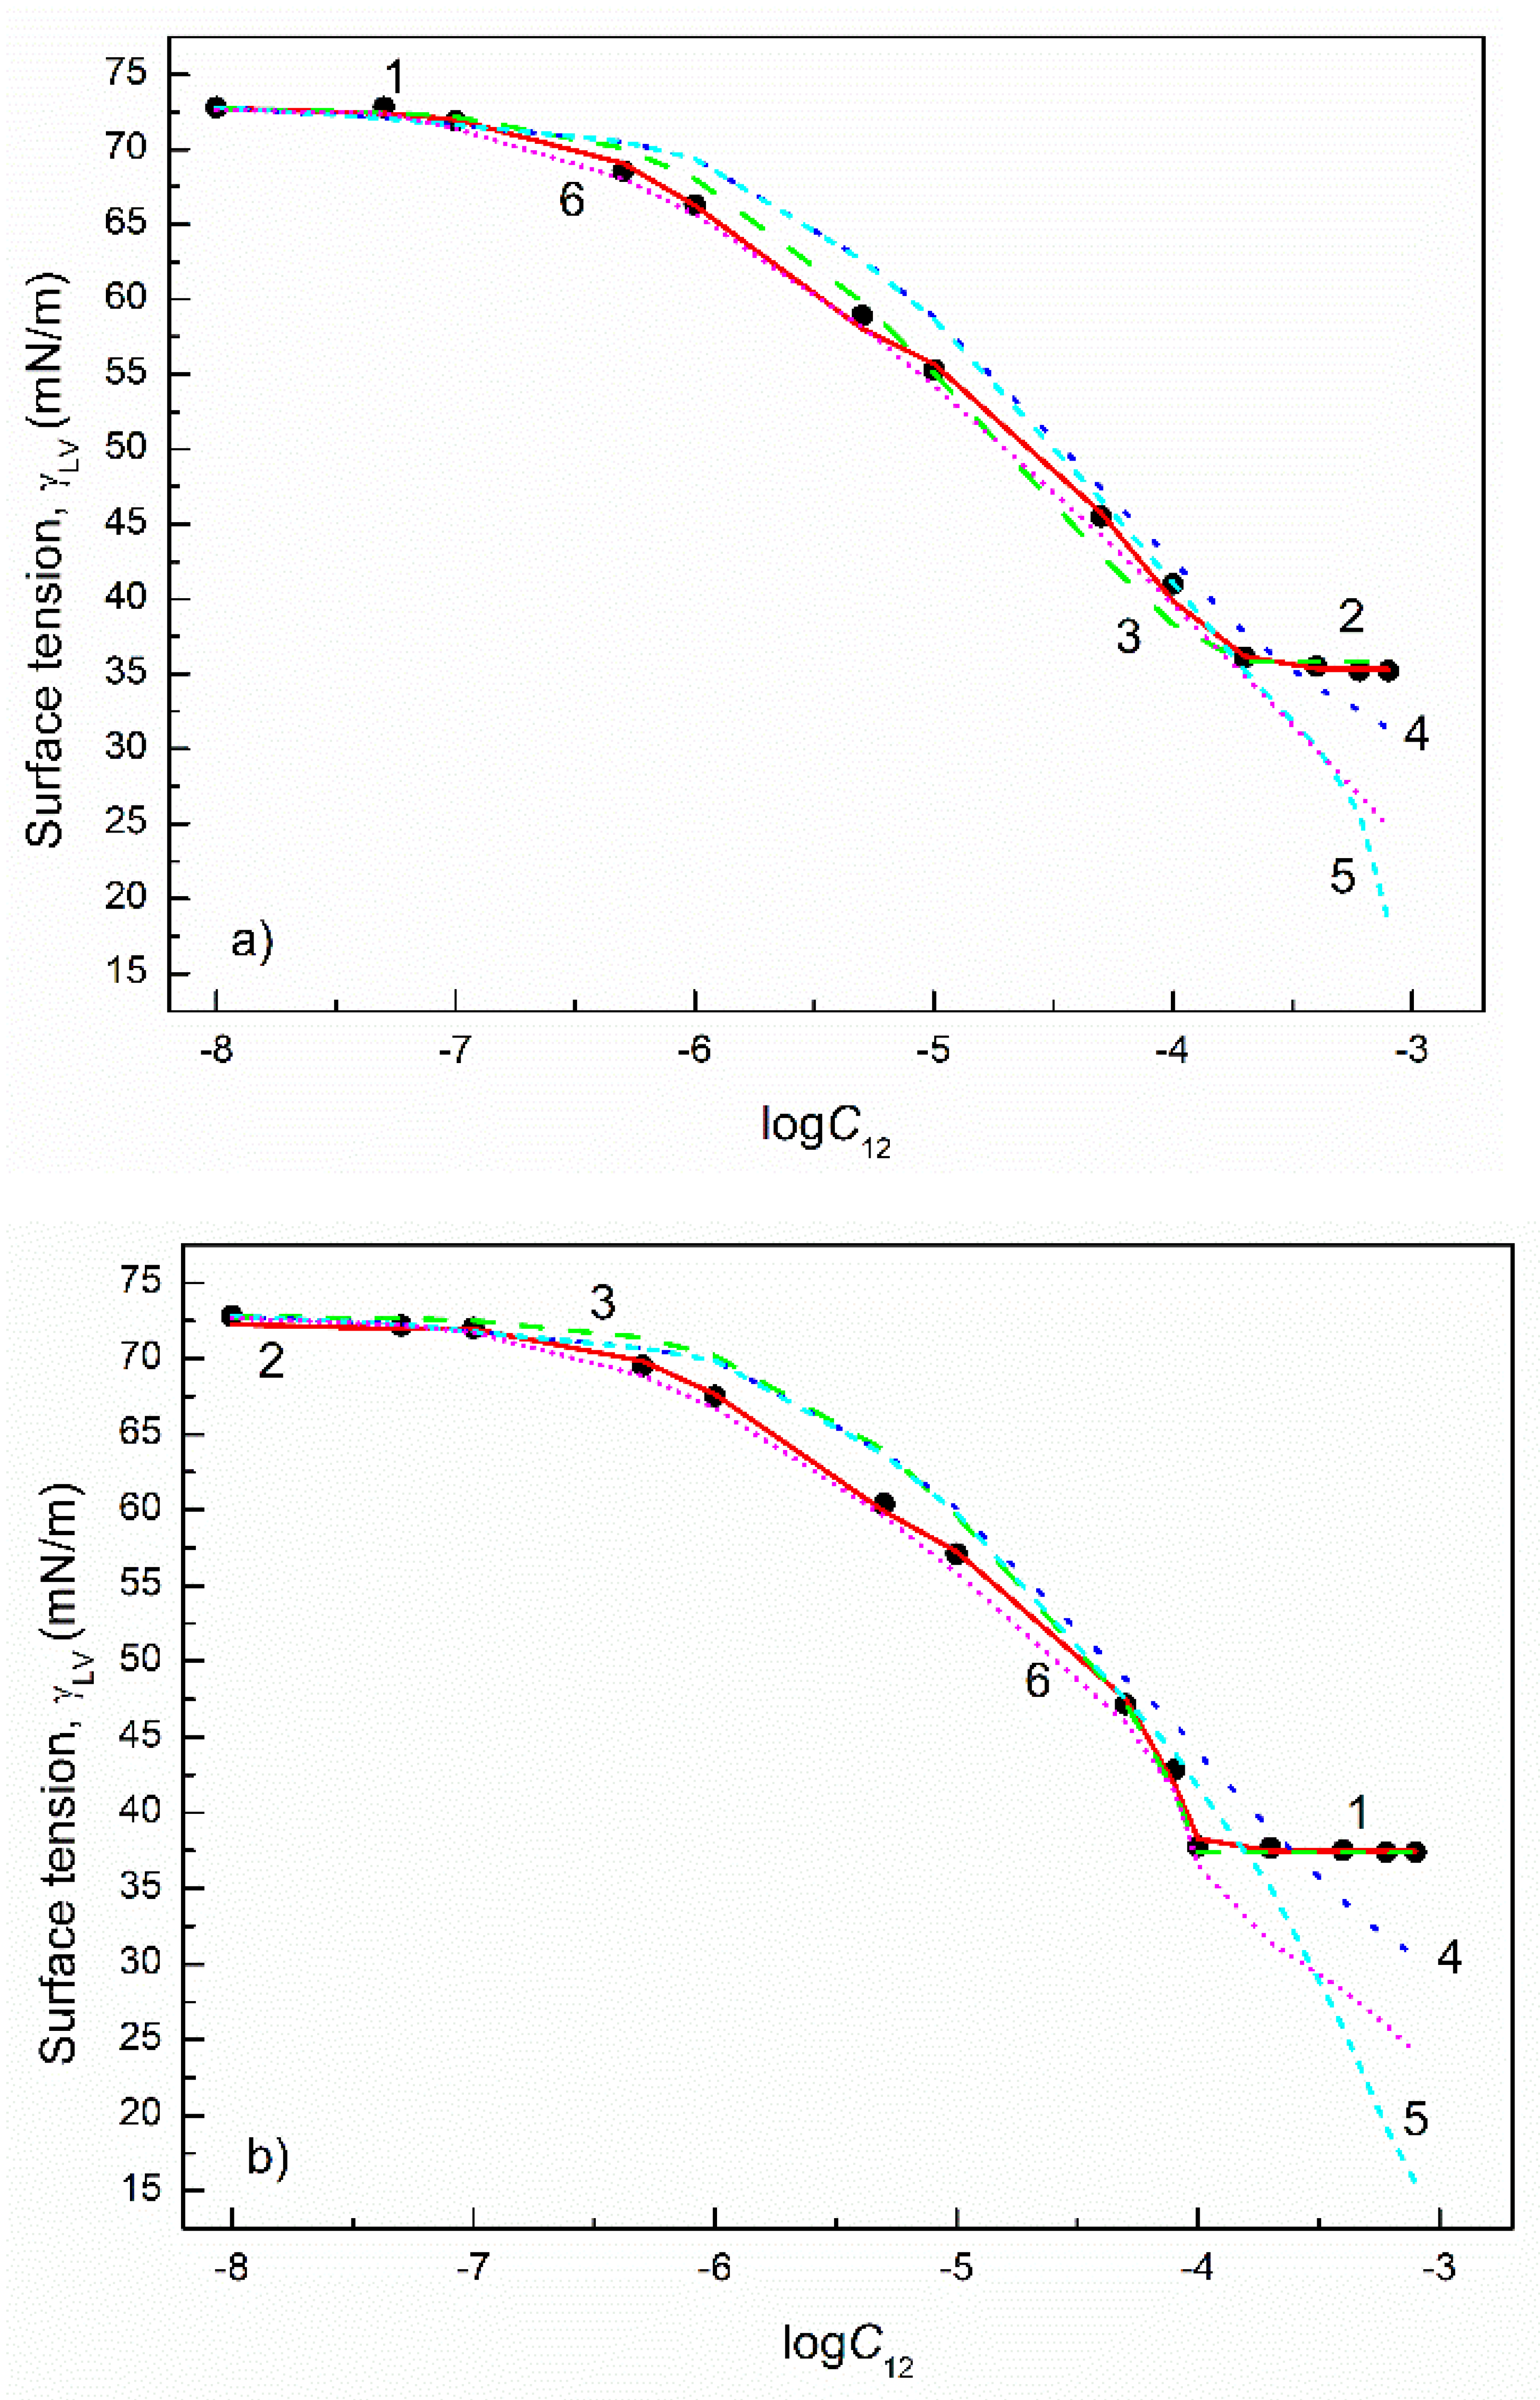
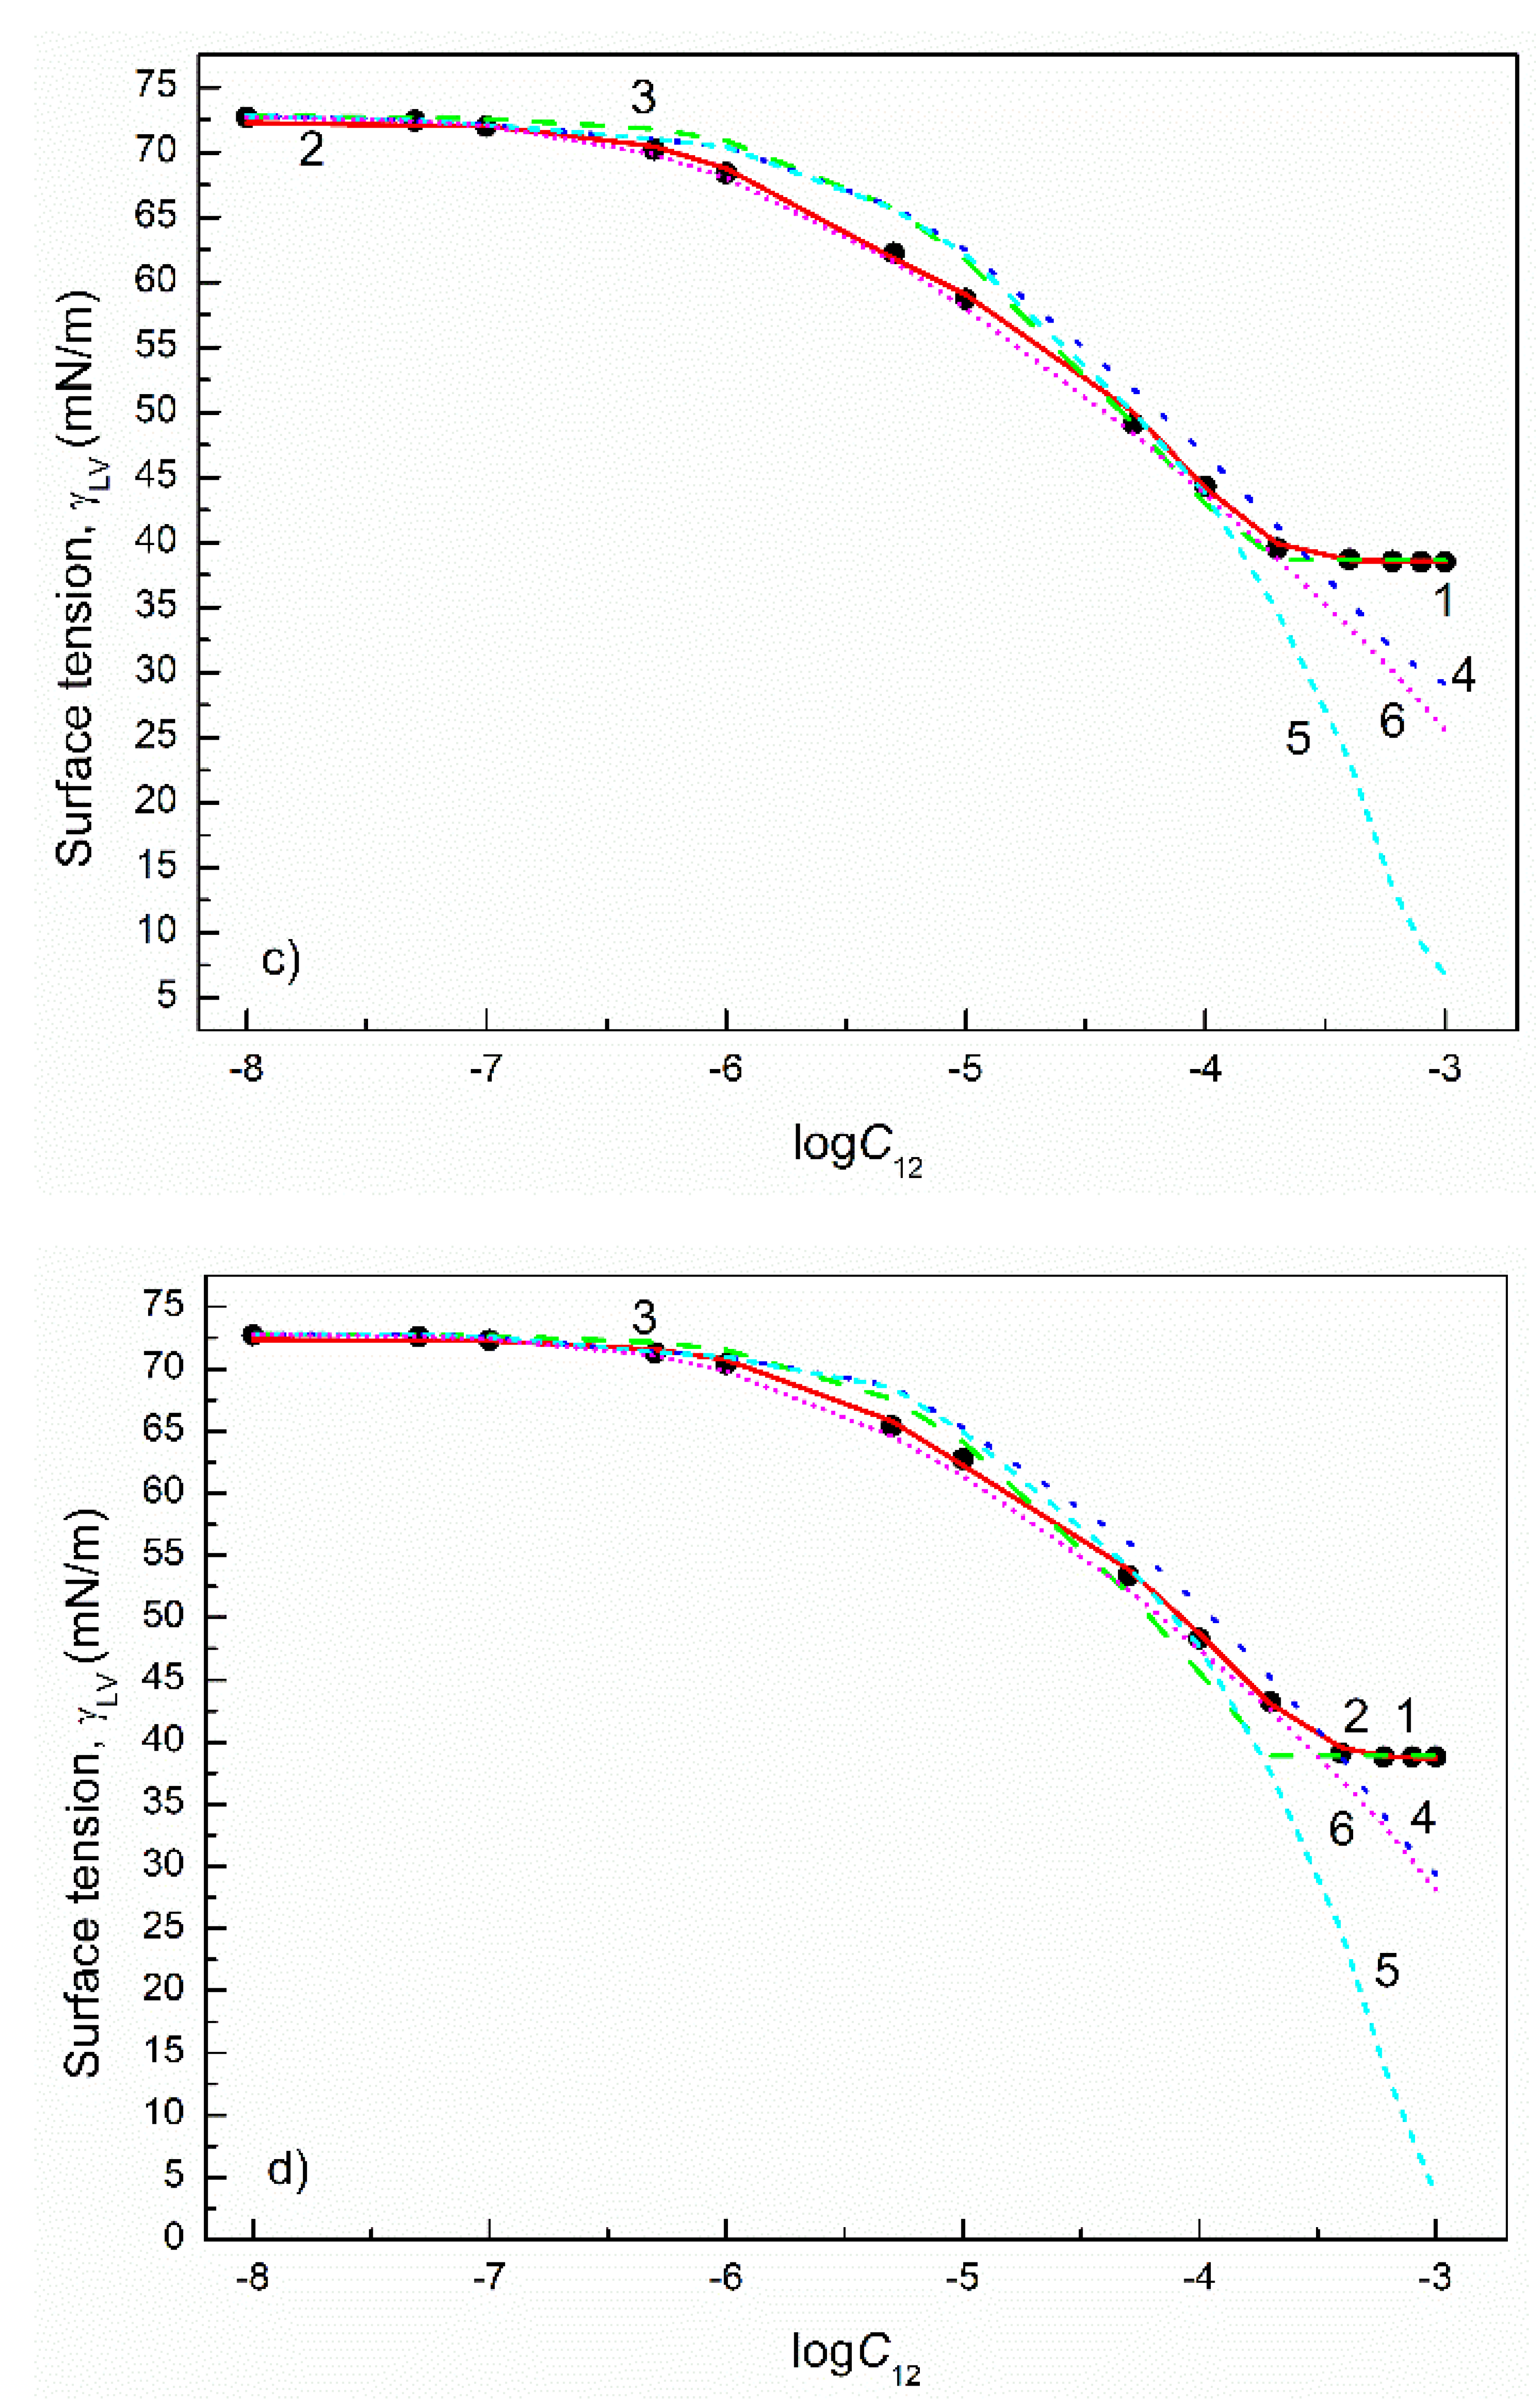
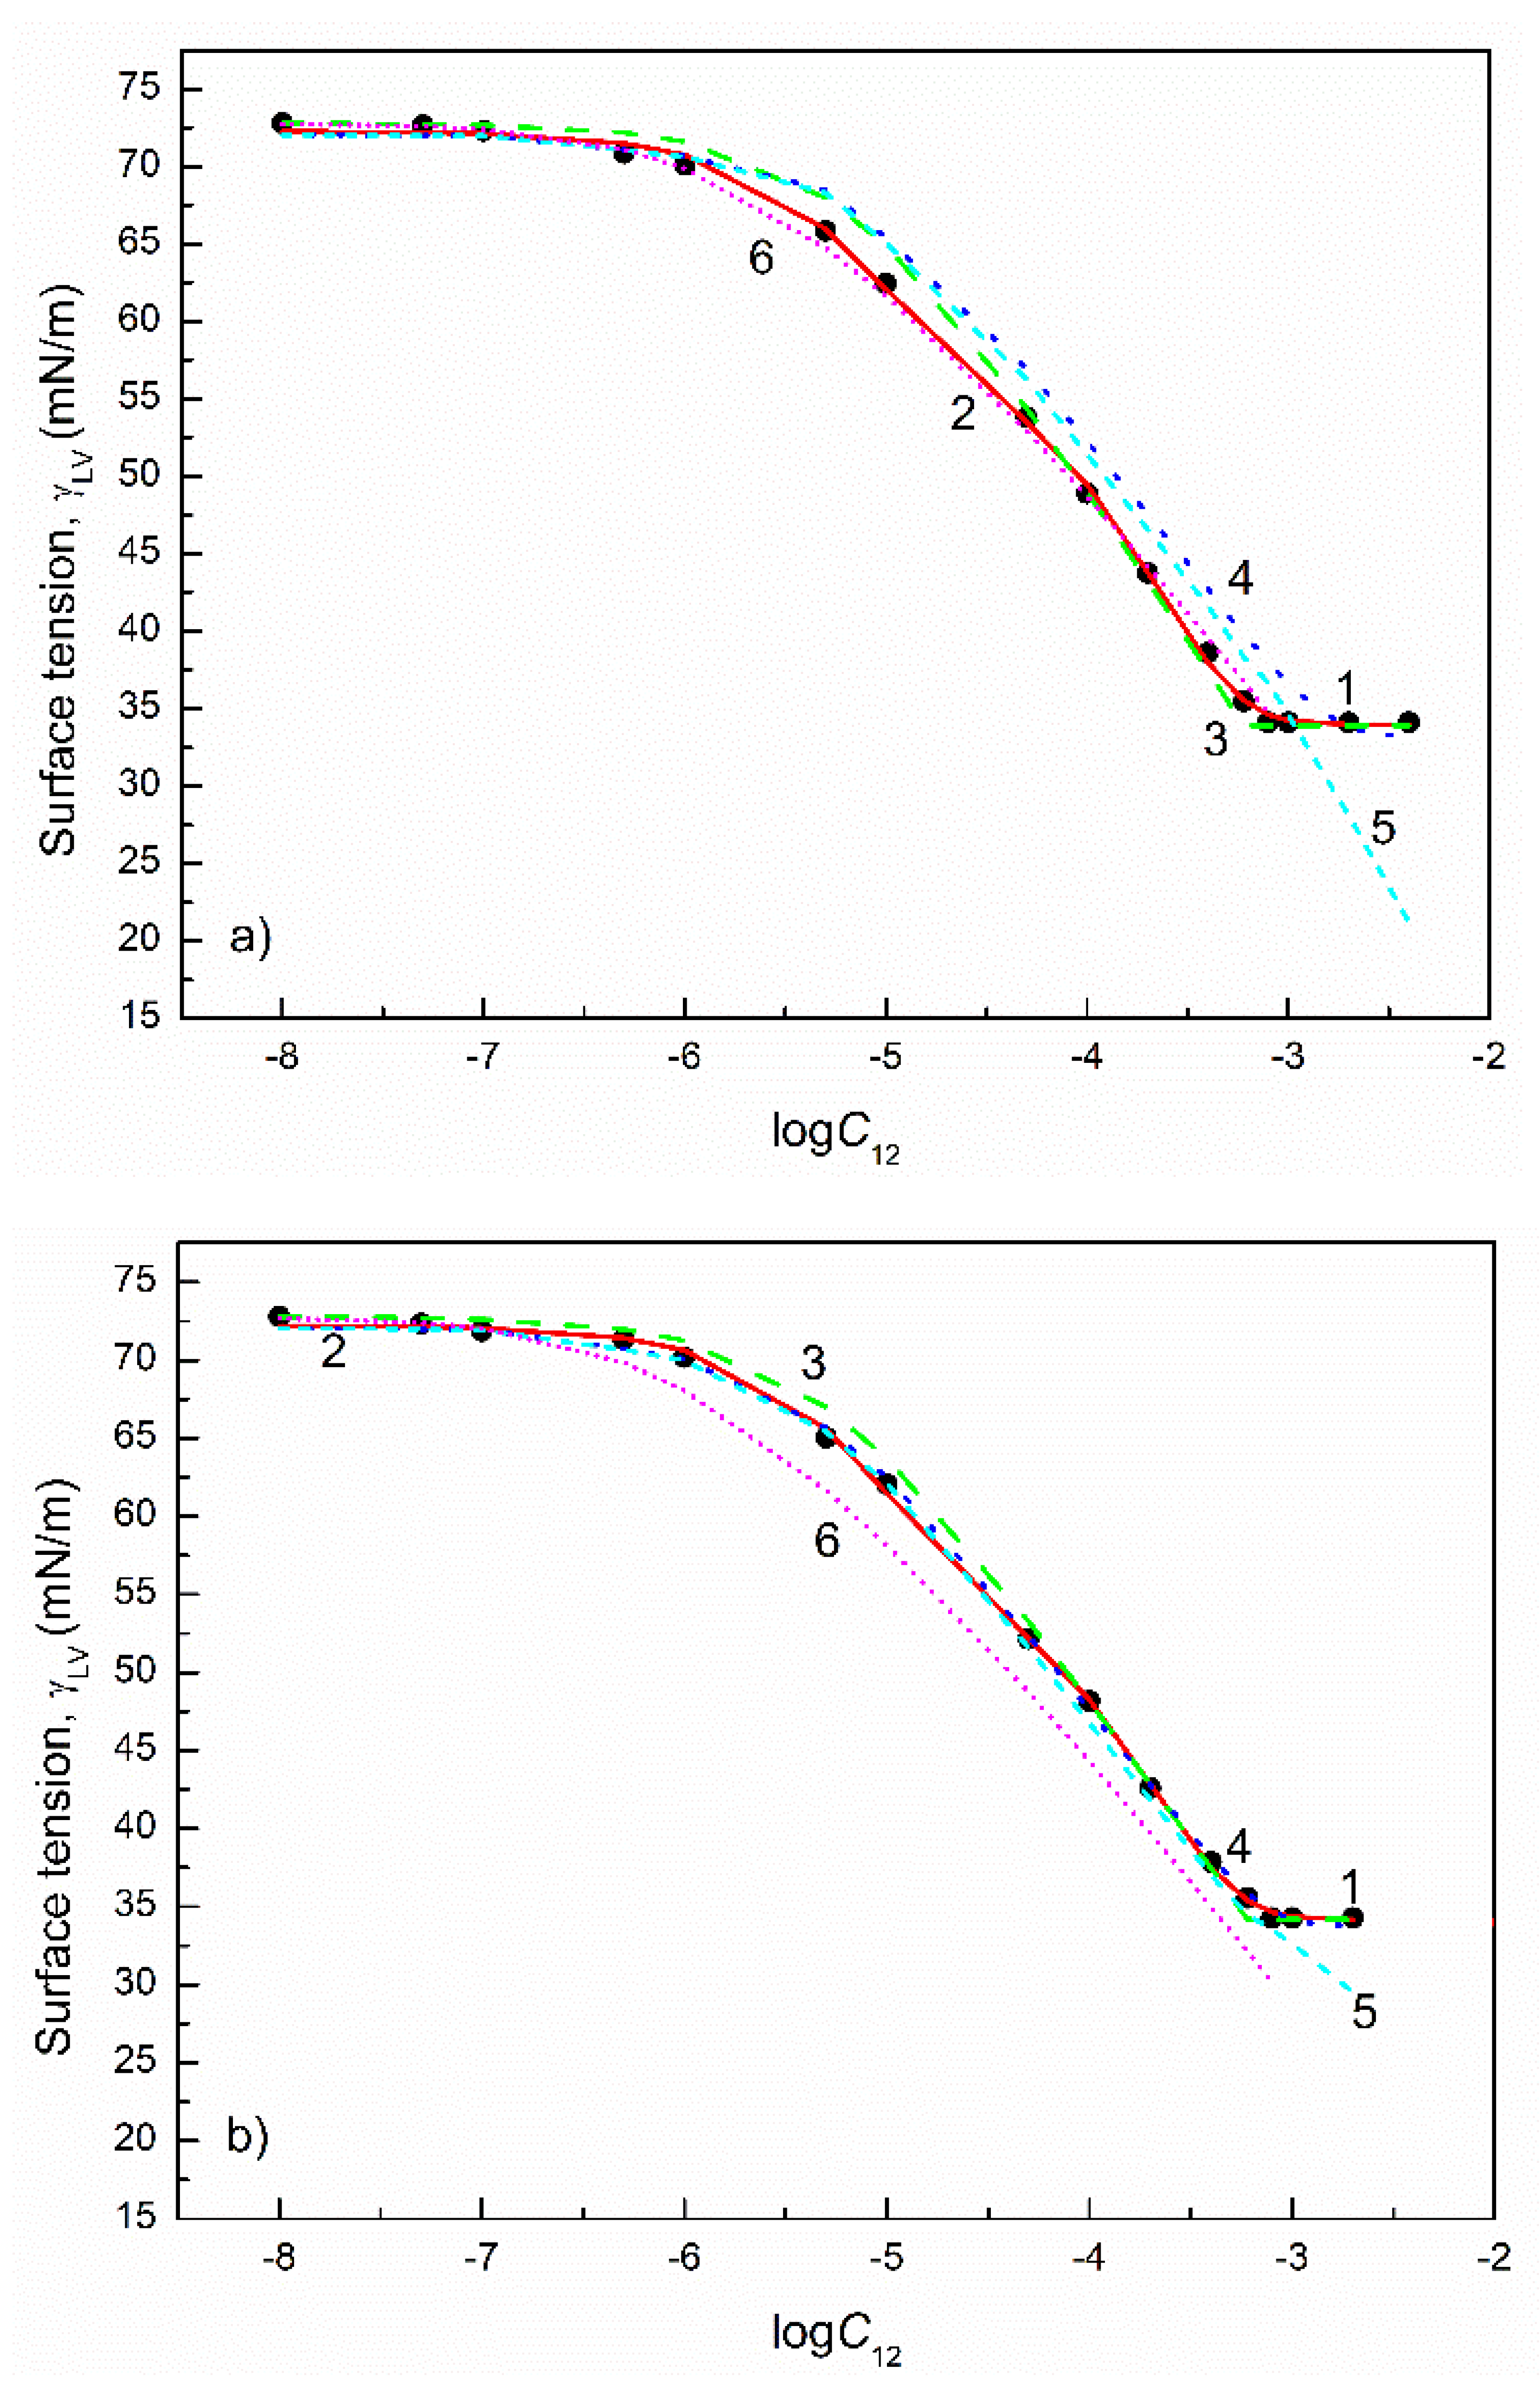
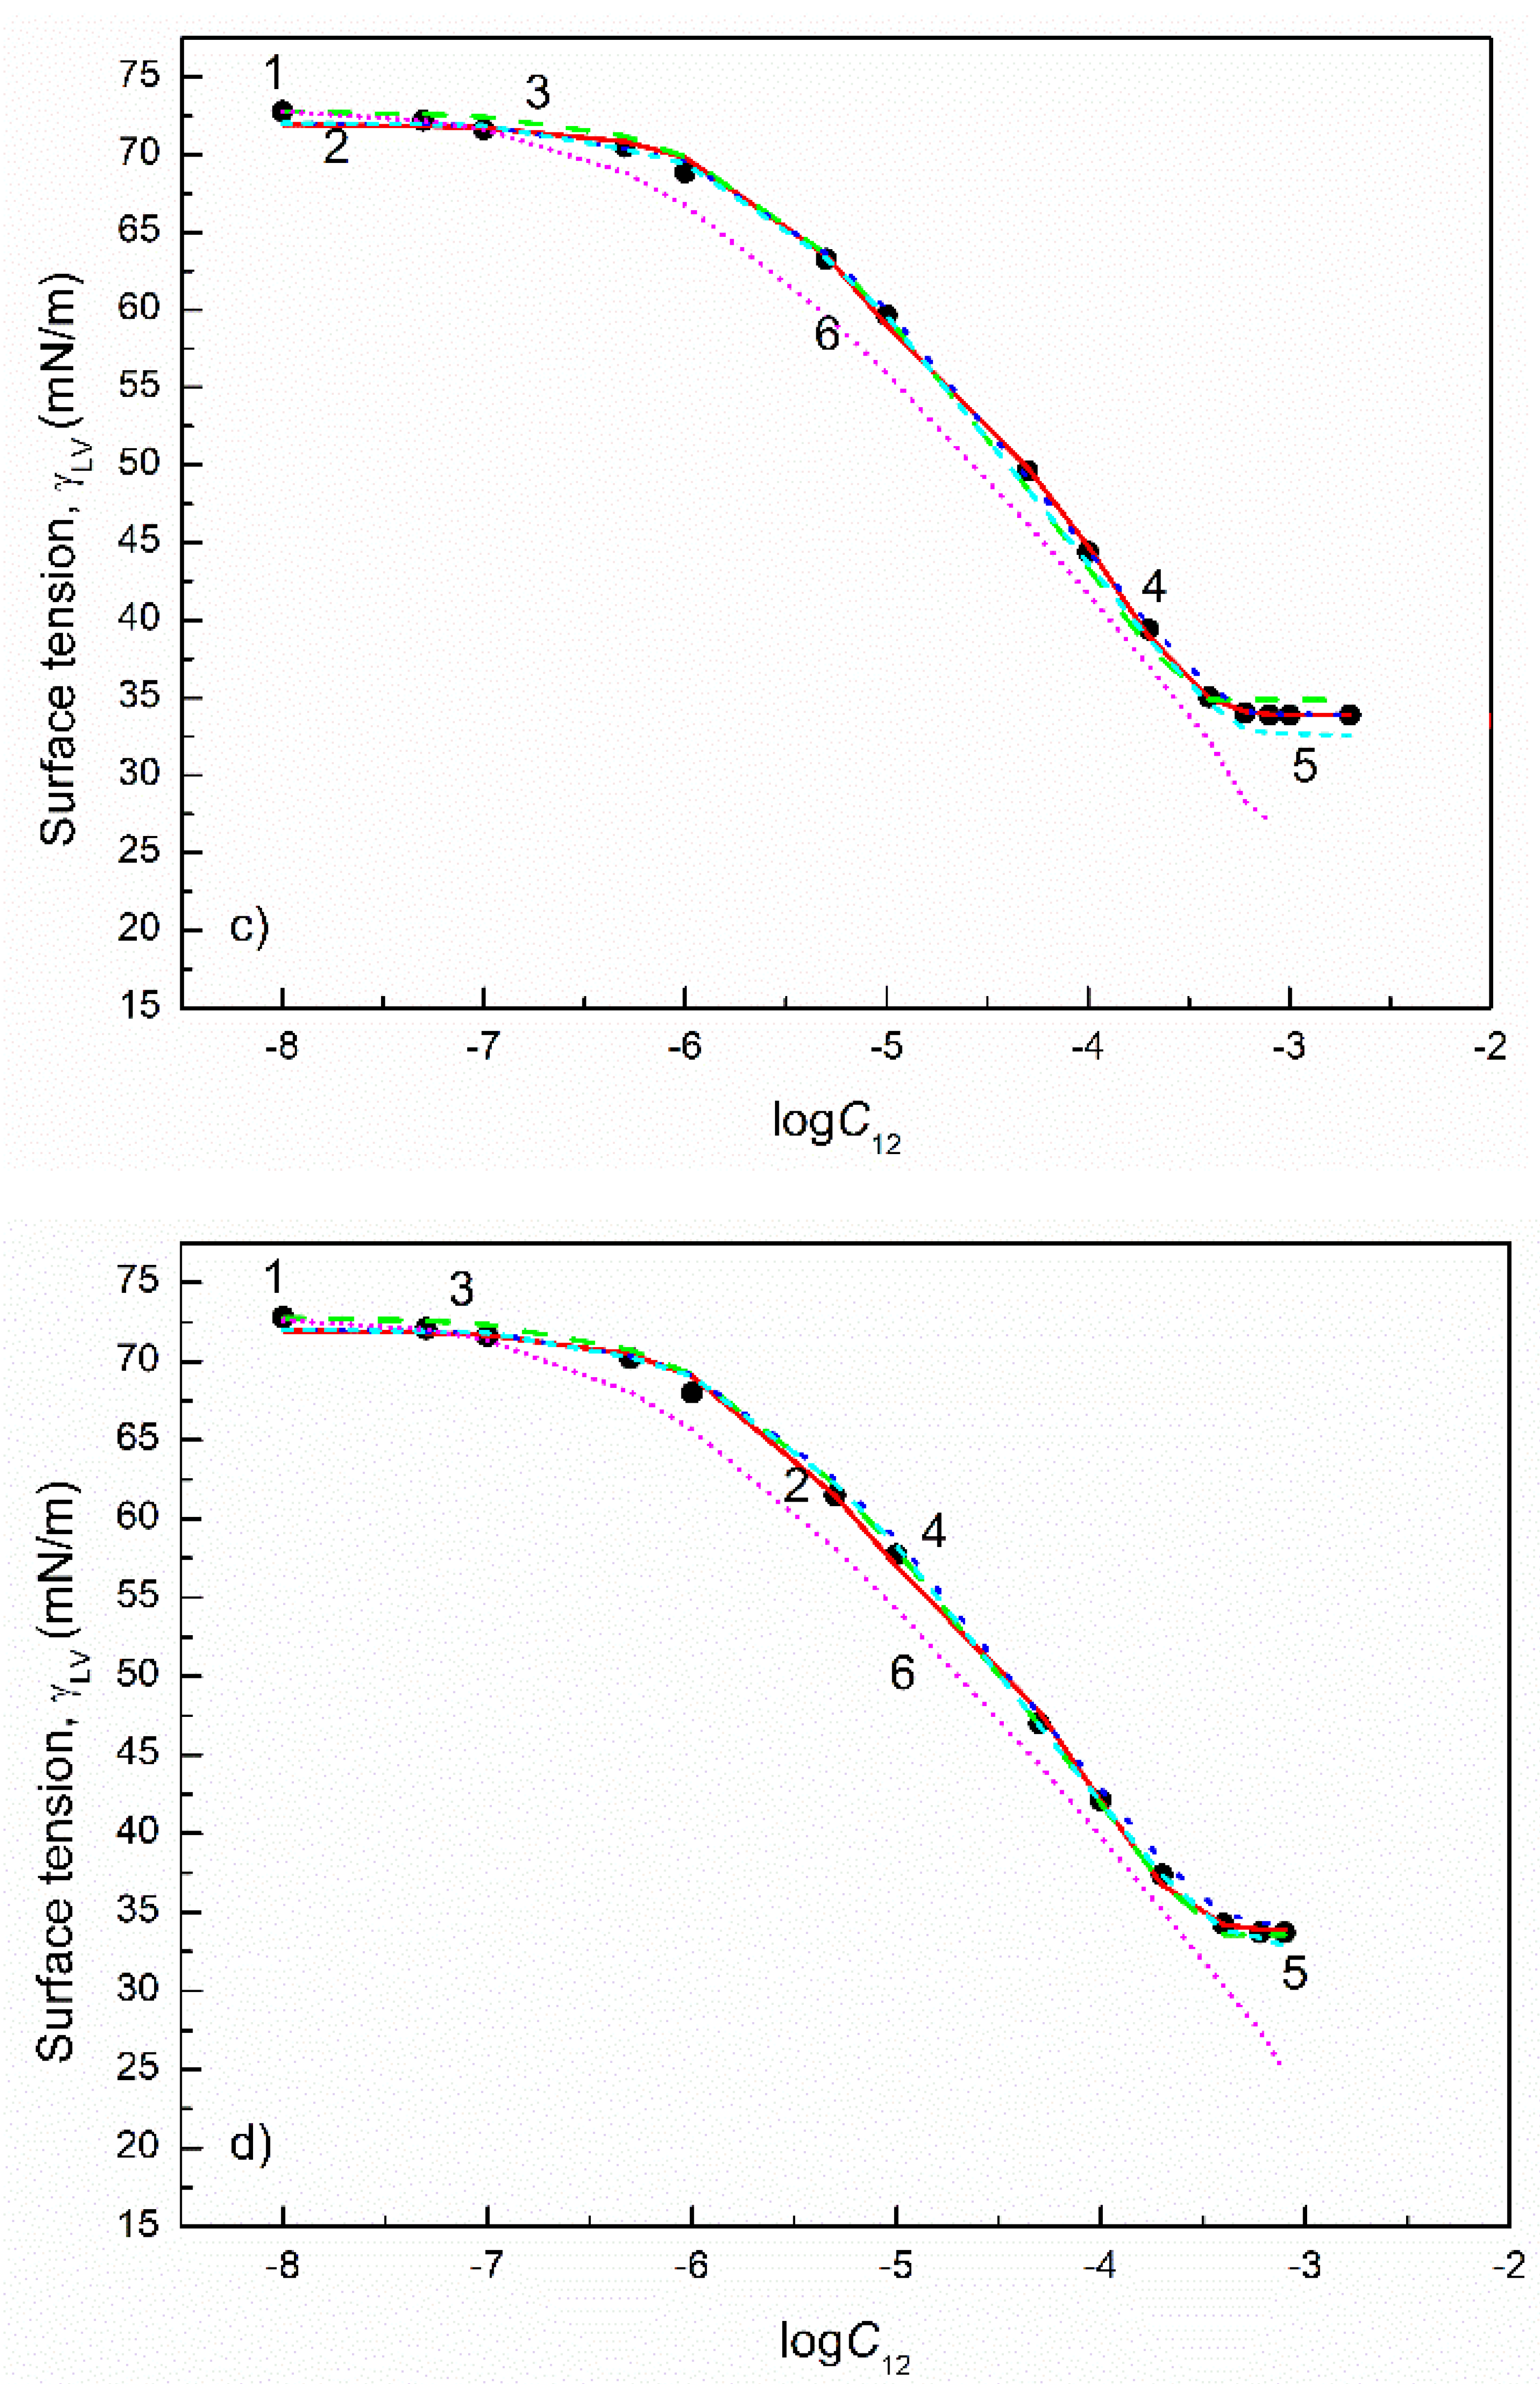
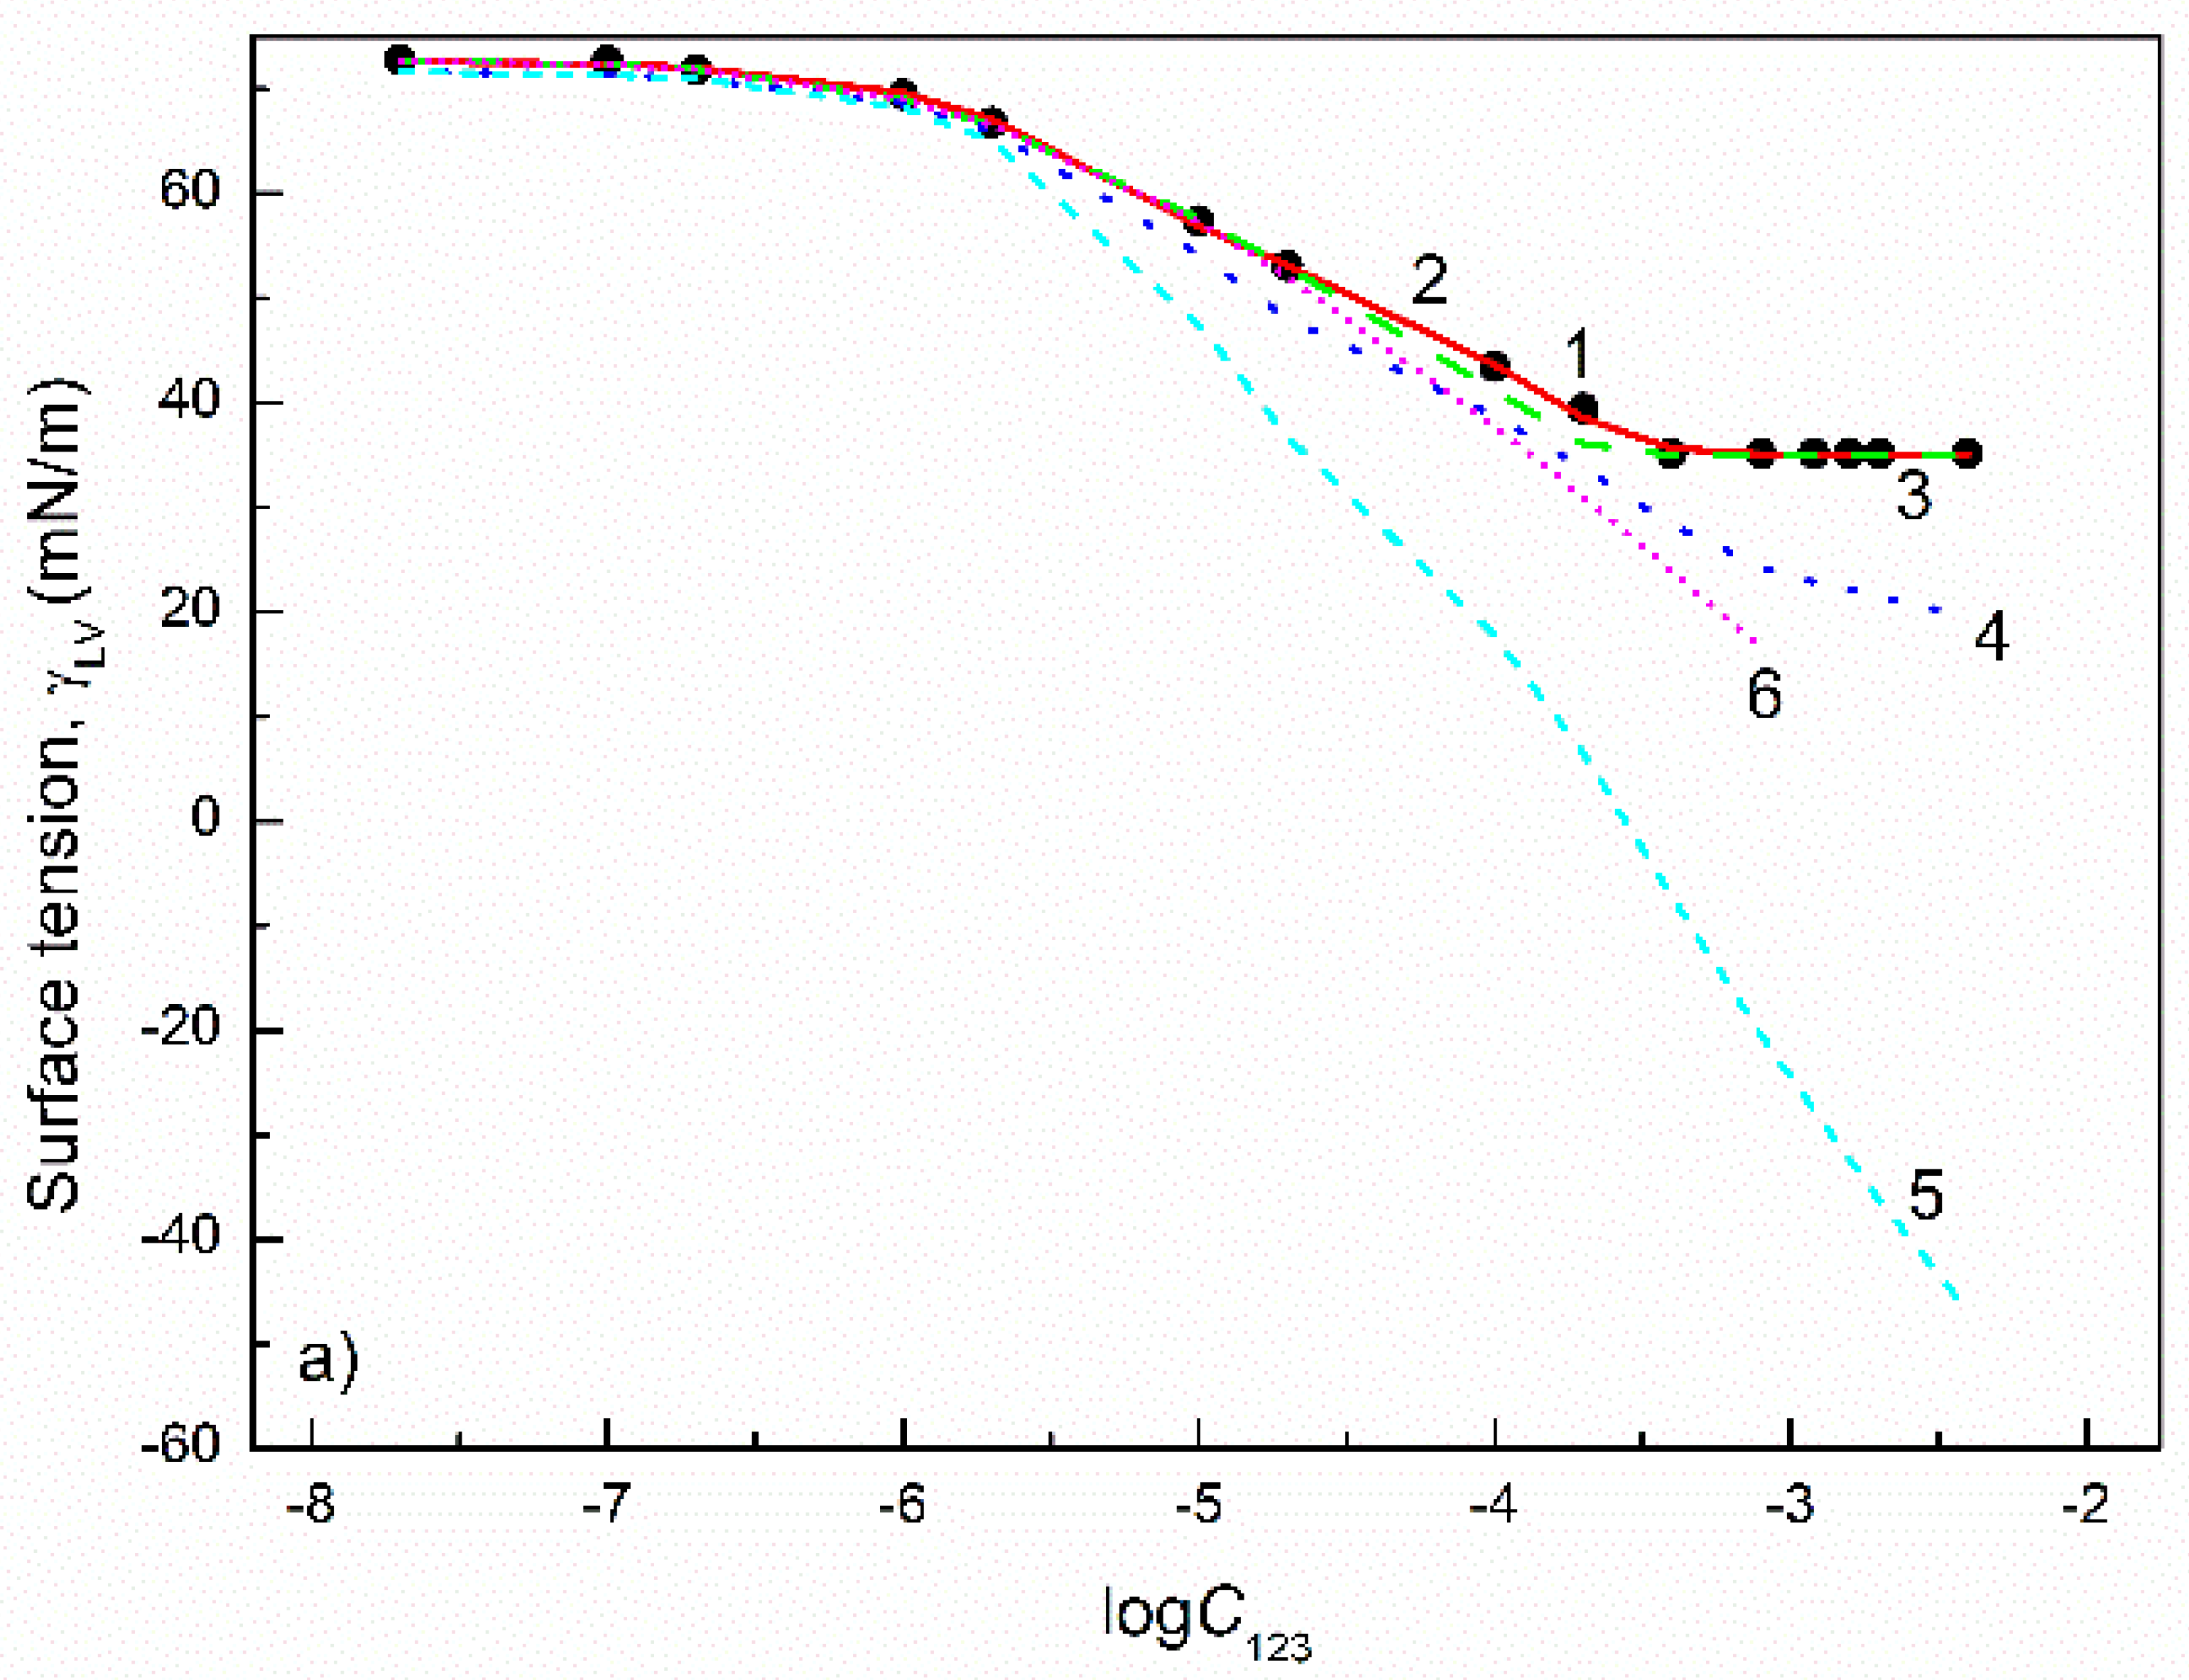
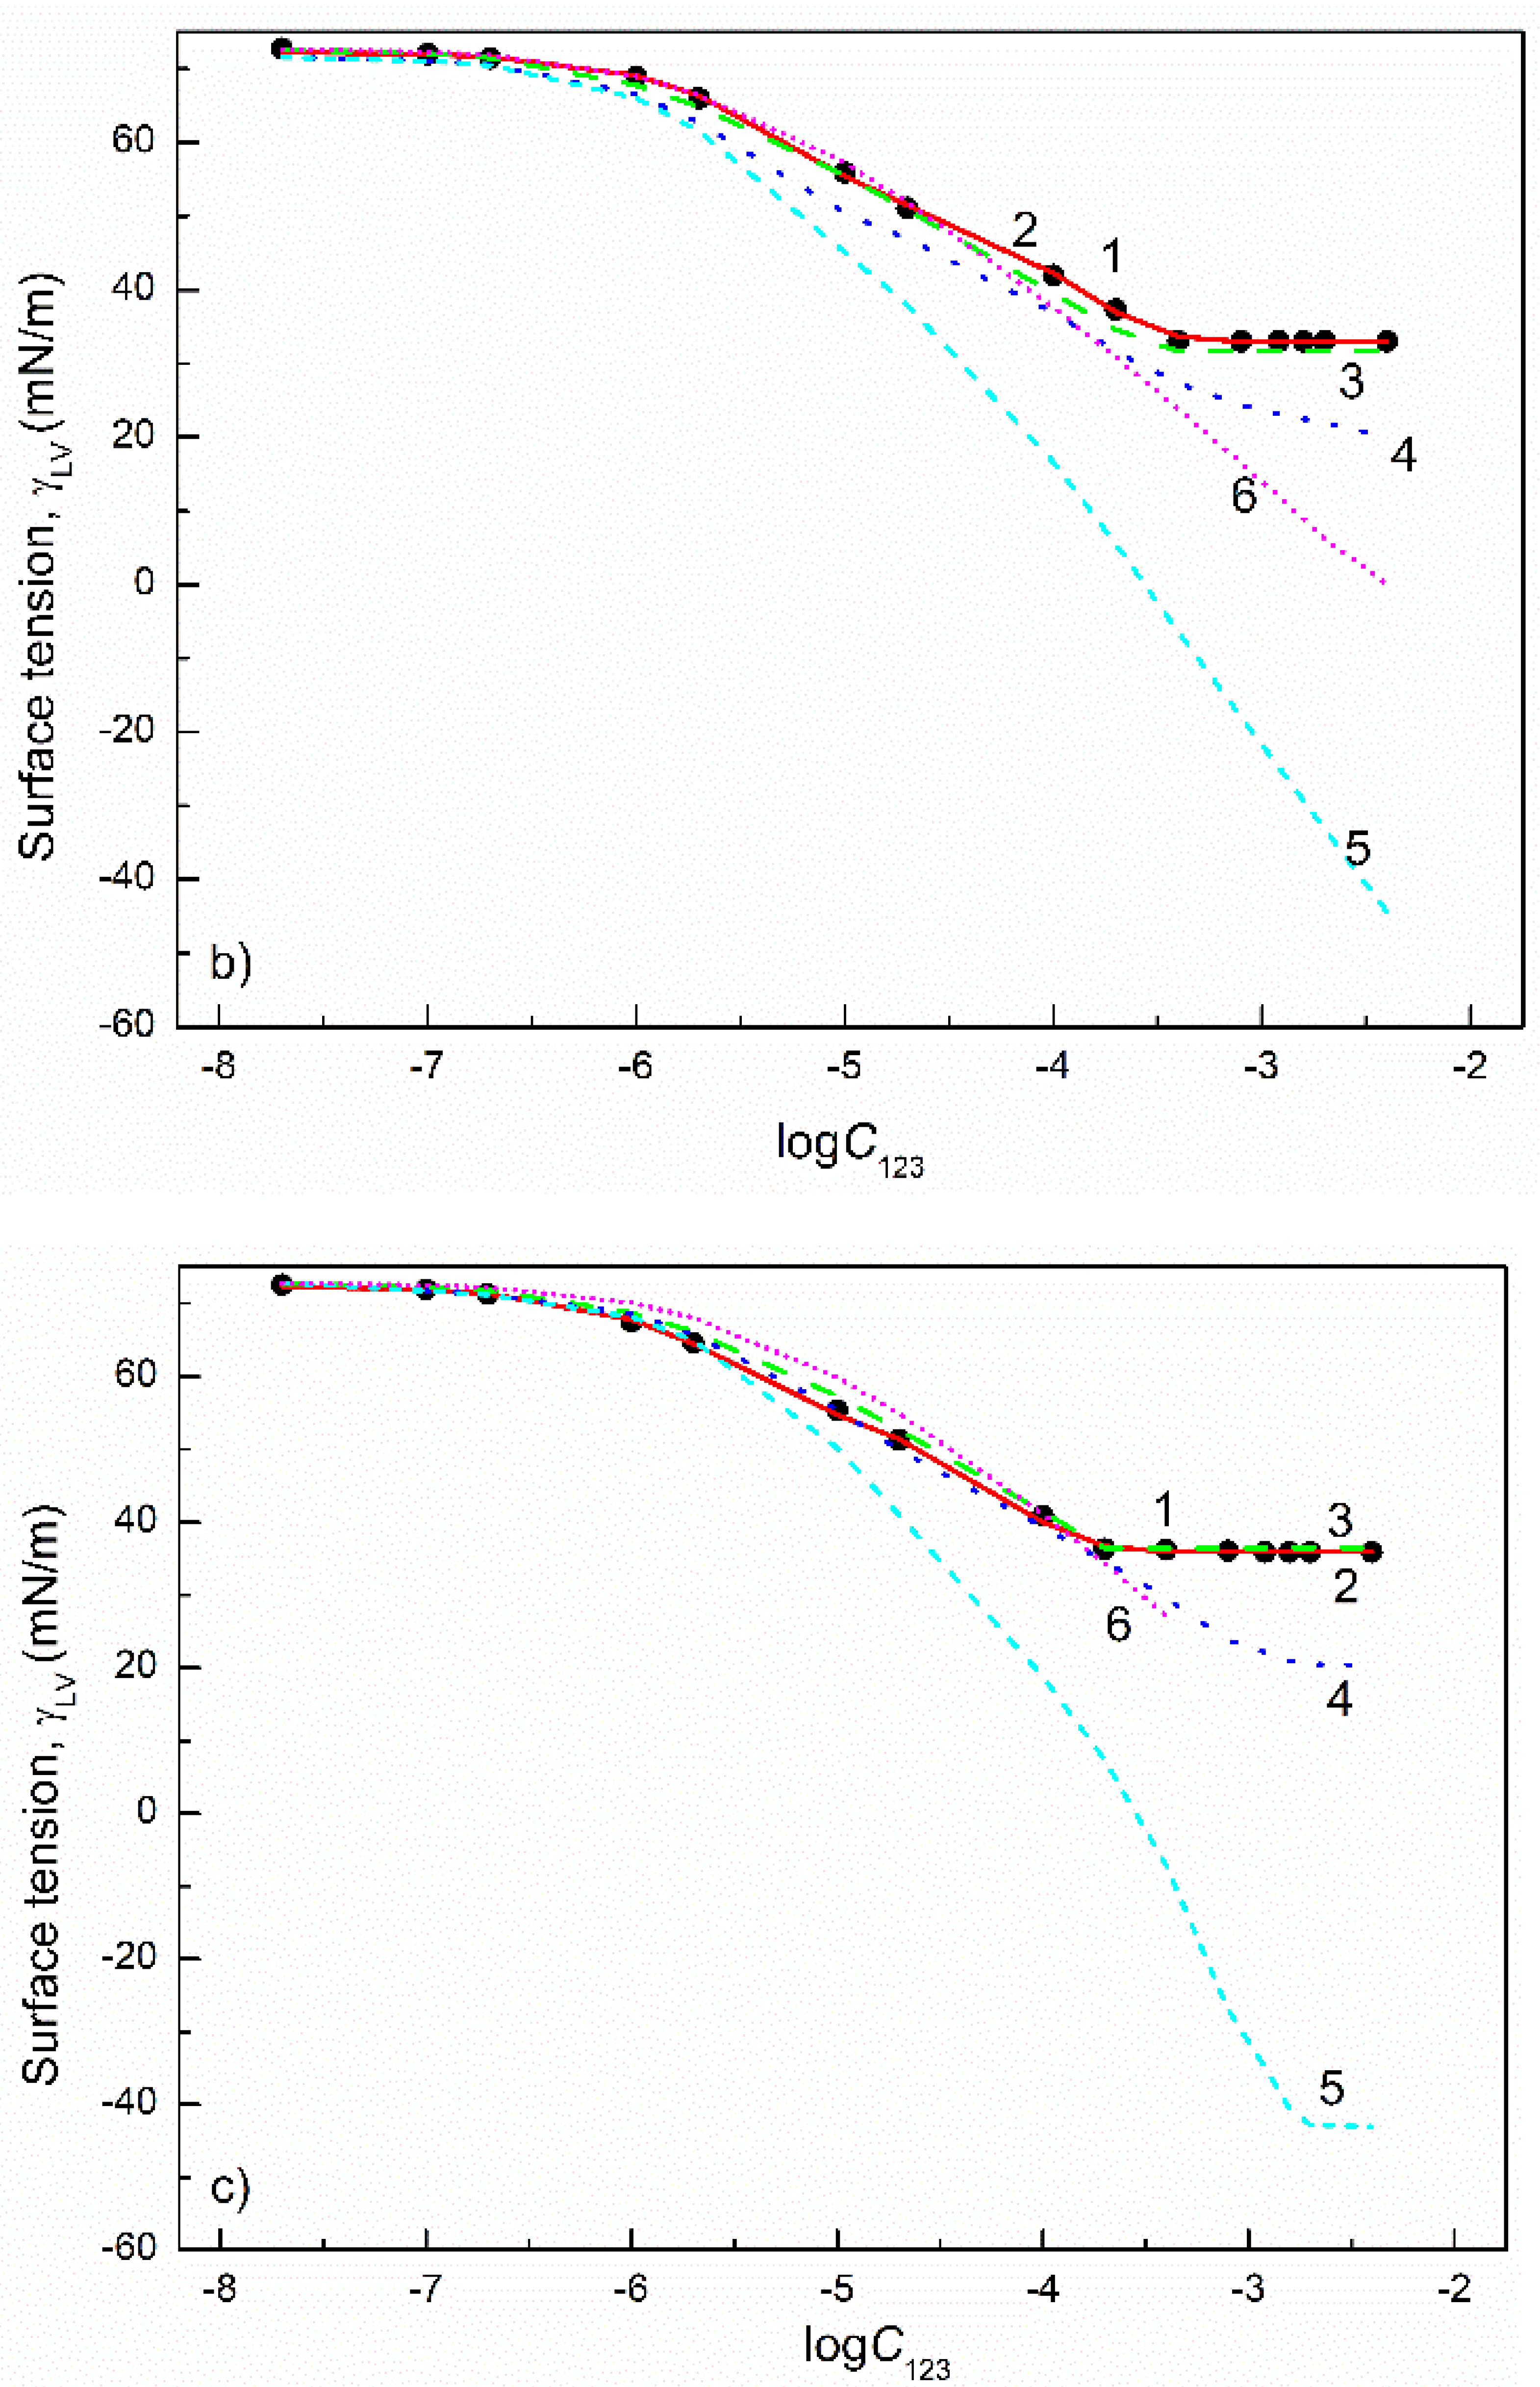
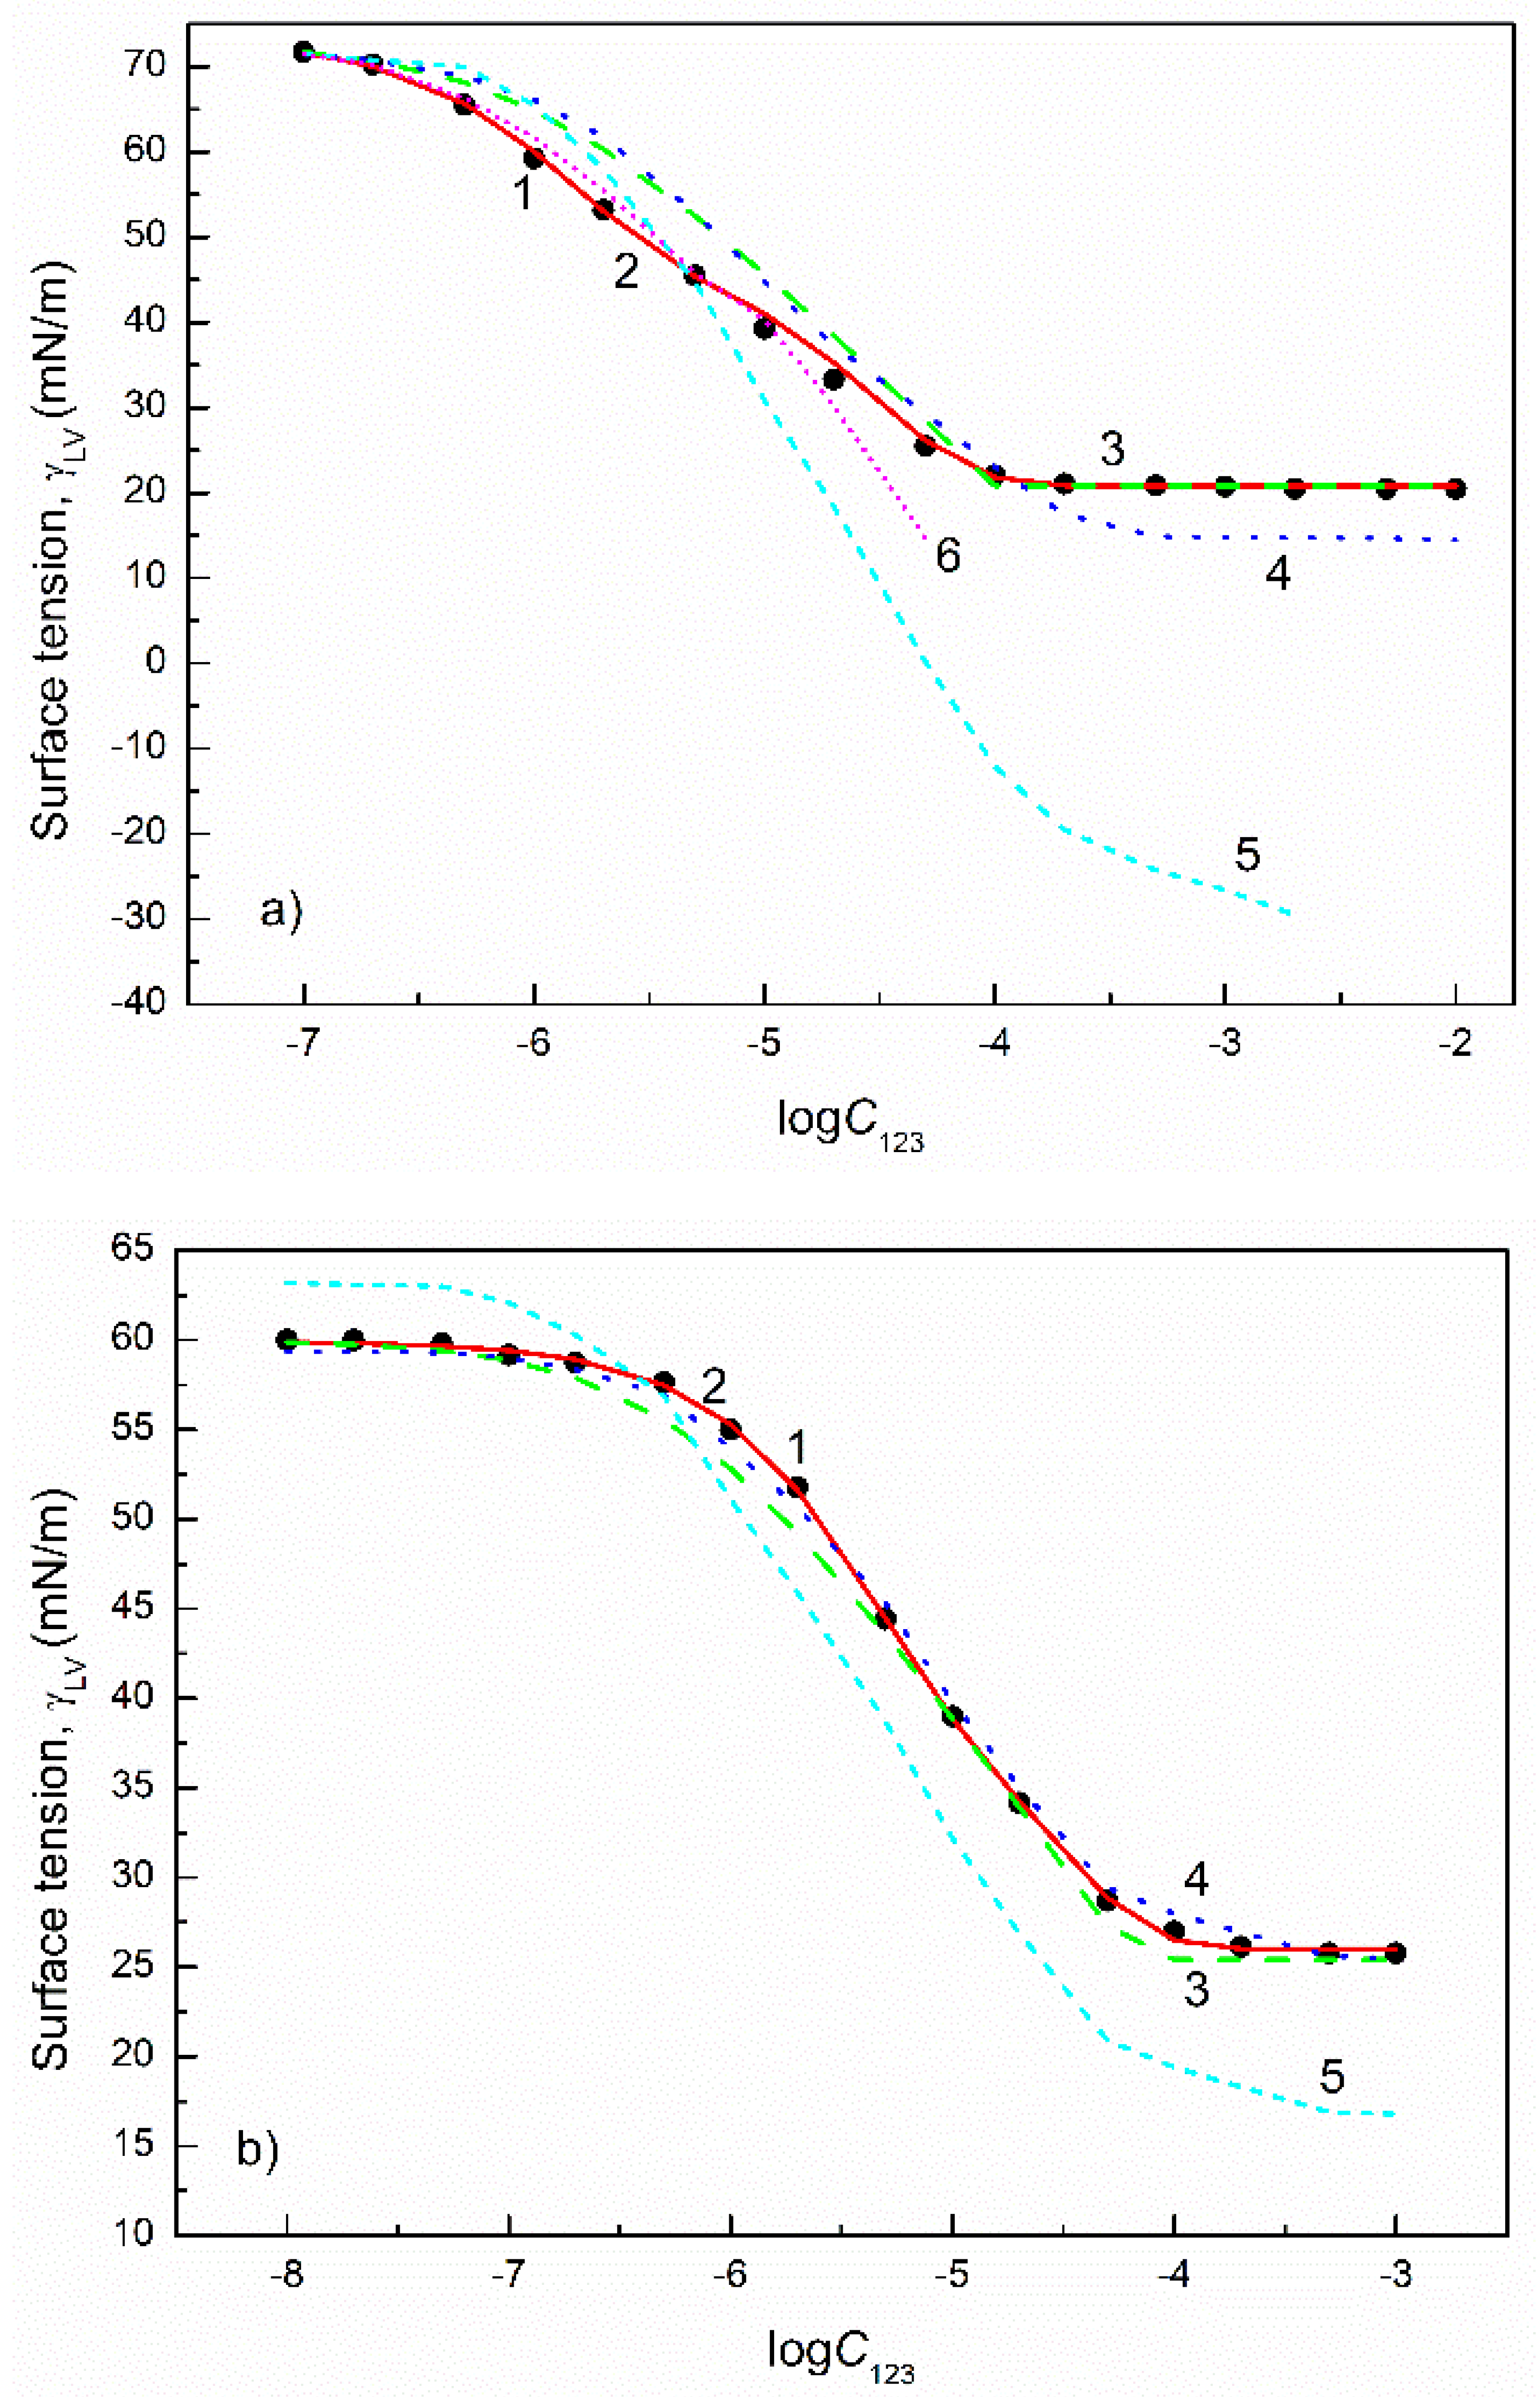
The changes in the total surface tension affected by the surfactant’s adsorbed monolayer at the water–air interface can be described by the equation of the second-order exponential function (Figure 1, Figure 2, Figure 3 and Figure 4). This equation has the form:
γ L V = y 0 + A 1 e x p ( C t 1 ) + A 2 e x p ( C t 2 ) ,
where γ L V is the surface tension of the aqueous solution of the surfactant, C is the surfactant concentration and y 0 , A 1 , A 2 , t 1 and t 2 are the constants.
Unfortunately, it is very difficult to analyze the constants in Equation (2) in light of the physicochemical properties of the surfactants. The studies on the correlation between the surfactant’s adsorption activity and the surface tension of the tail and head and the Gibbs surface free energy of surfactant adsorption, among others, at the water–air interface, can be determined based on the tail–water and head–water interface tension, as well as the contactable area of the tail and head of the surfactants. According to van Oss et al. [34,35,36,37] the water–tail and water–head of surfactants depend on the components and parameters of the water, tail and head of the surfactant’s surface tension. As can be seen from earlier studies, the standard Gibbs free energy of surfactant adsorption results from the changes in the water–tail interface tension, into the surface tension of the tail if the head is not dehydrated during the transfer from the bulk phase to the interface [43]. As the standard Gibbs free energy of adsorption is a measure of the surfactant’s tendency to adsorb at the interface, the shape of the isotherm of the aqueous solution’s surface tension is indirectly associated with this energy. For this reason, there may be some relation between the constant in the exponential function of the second order and the components, as well as the parameters of the tail and head of the surfactant’s surface tension. As follows from Figures S1–S4, in the case of the Tritons, the constant y 0 increases but other constants decrease as a function of the number of oxyethylene groups in the head of Triton molecules (Figure S3). The same tail but a different number of oxyethylene groups are found in the Triton molecules. These groups are strongly hydrated. Two molecules of water are joined to one group by a strong hydrogen bond and the other molecules by the weak hydrogen bond. Indeed, the increase in the number of oxyethylene groups in the Triton molecules results in the increase in the hydration number [45,46]. This fact influences the shape of the surface tension isotherms, and for the same reason the constants in Equation (2). The same tendency of constant changes in Equation (2) as for the Tritons is observed (Figure S4). However, the constant y 0 is considerably smaller in comparison to the Tritons’. This may be due to the fact that the surface tension of FC’s tail is smaller than that of the Tritons’ tail (Table 1). In the case of CTAB and CPyB, there are great differences between the constants in Equation (2), describing the isotherms of their aqueous solutions (Figure S1). These surfactants are ionic and have the same tails in the molecules, but different heads. The significant difference between the constants in Equation (2) for these surfactants suggests that the hydration number of the molecules’ head, as well as the electrostatic interactions, greatly affect the y 0 , A 1 , A 2 , t 1 and t 2 constants. This fact is confirmed by the constants in Equation (2) for SDS and SDDS (Figure S2). For these surfactants, the biggest observed difference in the constant y 0 results largely from the tail surface tension. The surface tension of the SDS tail is smaller than that for the SDDS one. However, the electrostatic interactions are similar because these surfactants have the same head.
The possibility to describe the isotherm of the surface tension of the aqueous solution of surfactants is important to determine the behavior of the surfactants in the surface monolayer at the water–air interface. However, it is also important to predict this isotherm from the same values of the physicochemical properties of the given surfactant. For this purpose, the Szyszkowski equation was tested. This equation has the form [3,15]:
γ W γ L V = π = k R T Γ m a x l n ( C a + 1 ) ,
where γ W is the water surface tension, π is the monolayer at the water–air interface pressure, a is the constant, Γ m a x is the maximal Gibbs surface excess concentration of surfactant, R is the gas constant, T is the temperature and k is the number used in the Gibbs isotherm equation for the surface excess concentration determination. This number is connected with real changes of π as a function of the surfactant concentration. For example, in the case of surfactant type 1:1, electrolyte k is equal to 2. To solve Equation (3) against the surface tension of the aqueous solution of surfactants, the proper value of k should be taken into account. In addition, the fact that in contrast to some authors the surfactant is surface active in the monomeric form, but not in the micelles, is of significant importance [3]. Therefore, the values of surfactant concentration after CMC should be assumed as equal to CMC.
The constant a in Equation (3) can be expressed [3,15]:
a = ϖ   e x p ( Δ G a d s 0 R T ) ,
where: ω ¯ is the number of water moles in dm3 and Δ G a d s 0 is the standard Gibbs free energy of adsorption.
The standard Gibbs free energy of adsorption can be determined, among other factors, by the saturated monolayer pressure, its maximal concentration and critical micelle concentration (CMC), taking into account the Butler equation [47]:
According to Butler, the chemical potential of a surfactant in the surface region resulting from its symmetrical definition ( μ S ) fulfills the equation [47]:
μ S = μ 0 + R T l n a S + π ω ,
where μ 0 is the standard chemical potential in the symmetrical definition, a S is the surfactant activity in the surface region and ω is the area occupied by one mole of surfactant at the water–air interface.
In the equilibrium state, the chemical potential of the surfactant in the surface region is equal to that in the bulk phase ( μ B ), which is asymmetrically defined and expressed as [15]:
μ B = μ + R T l n a B ,
where μ is the standard chemical potential of the surfactant in the bulk phase and a B is the activity of the surfactant in the bulk phase.
If the concentration of the surfactant in the bulk phase is equal to CMC a S = 1 and if at CMC the activity coefficient of the surfactant is equal to unity, then based on Equations (5) and (6) one can write:
Δ G a d s 0 = μ 0 μ = R T l n C M C ω π ω ,
So far, the ω has been expressed as equal to 1 Γ m a x ( Γ m a x is the maximal Gibbs surface excess concentration) but as mentioned above, π is related to k Γ m a x . Therefore, it seems that ϖ should be equal to 1 k Γ m a x .
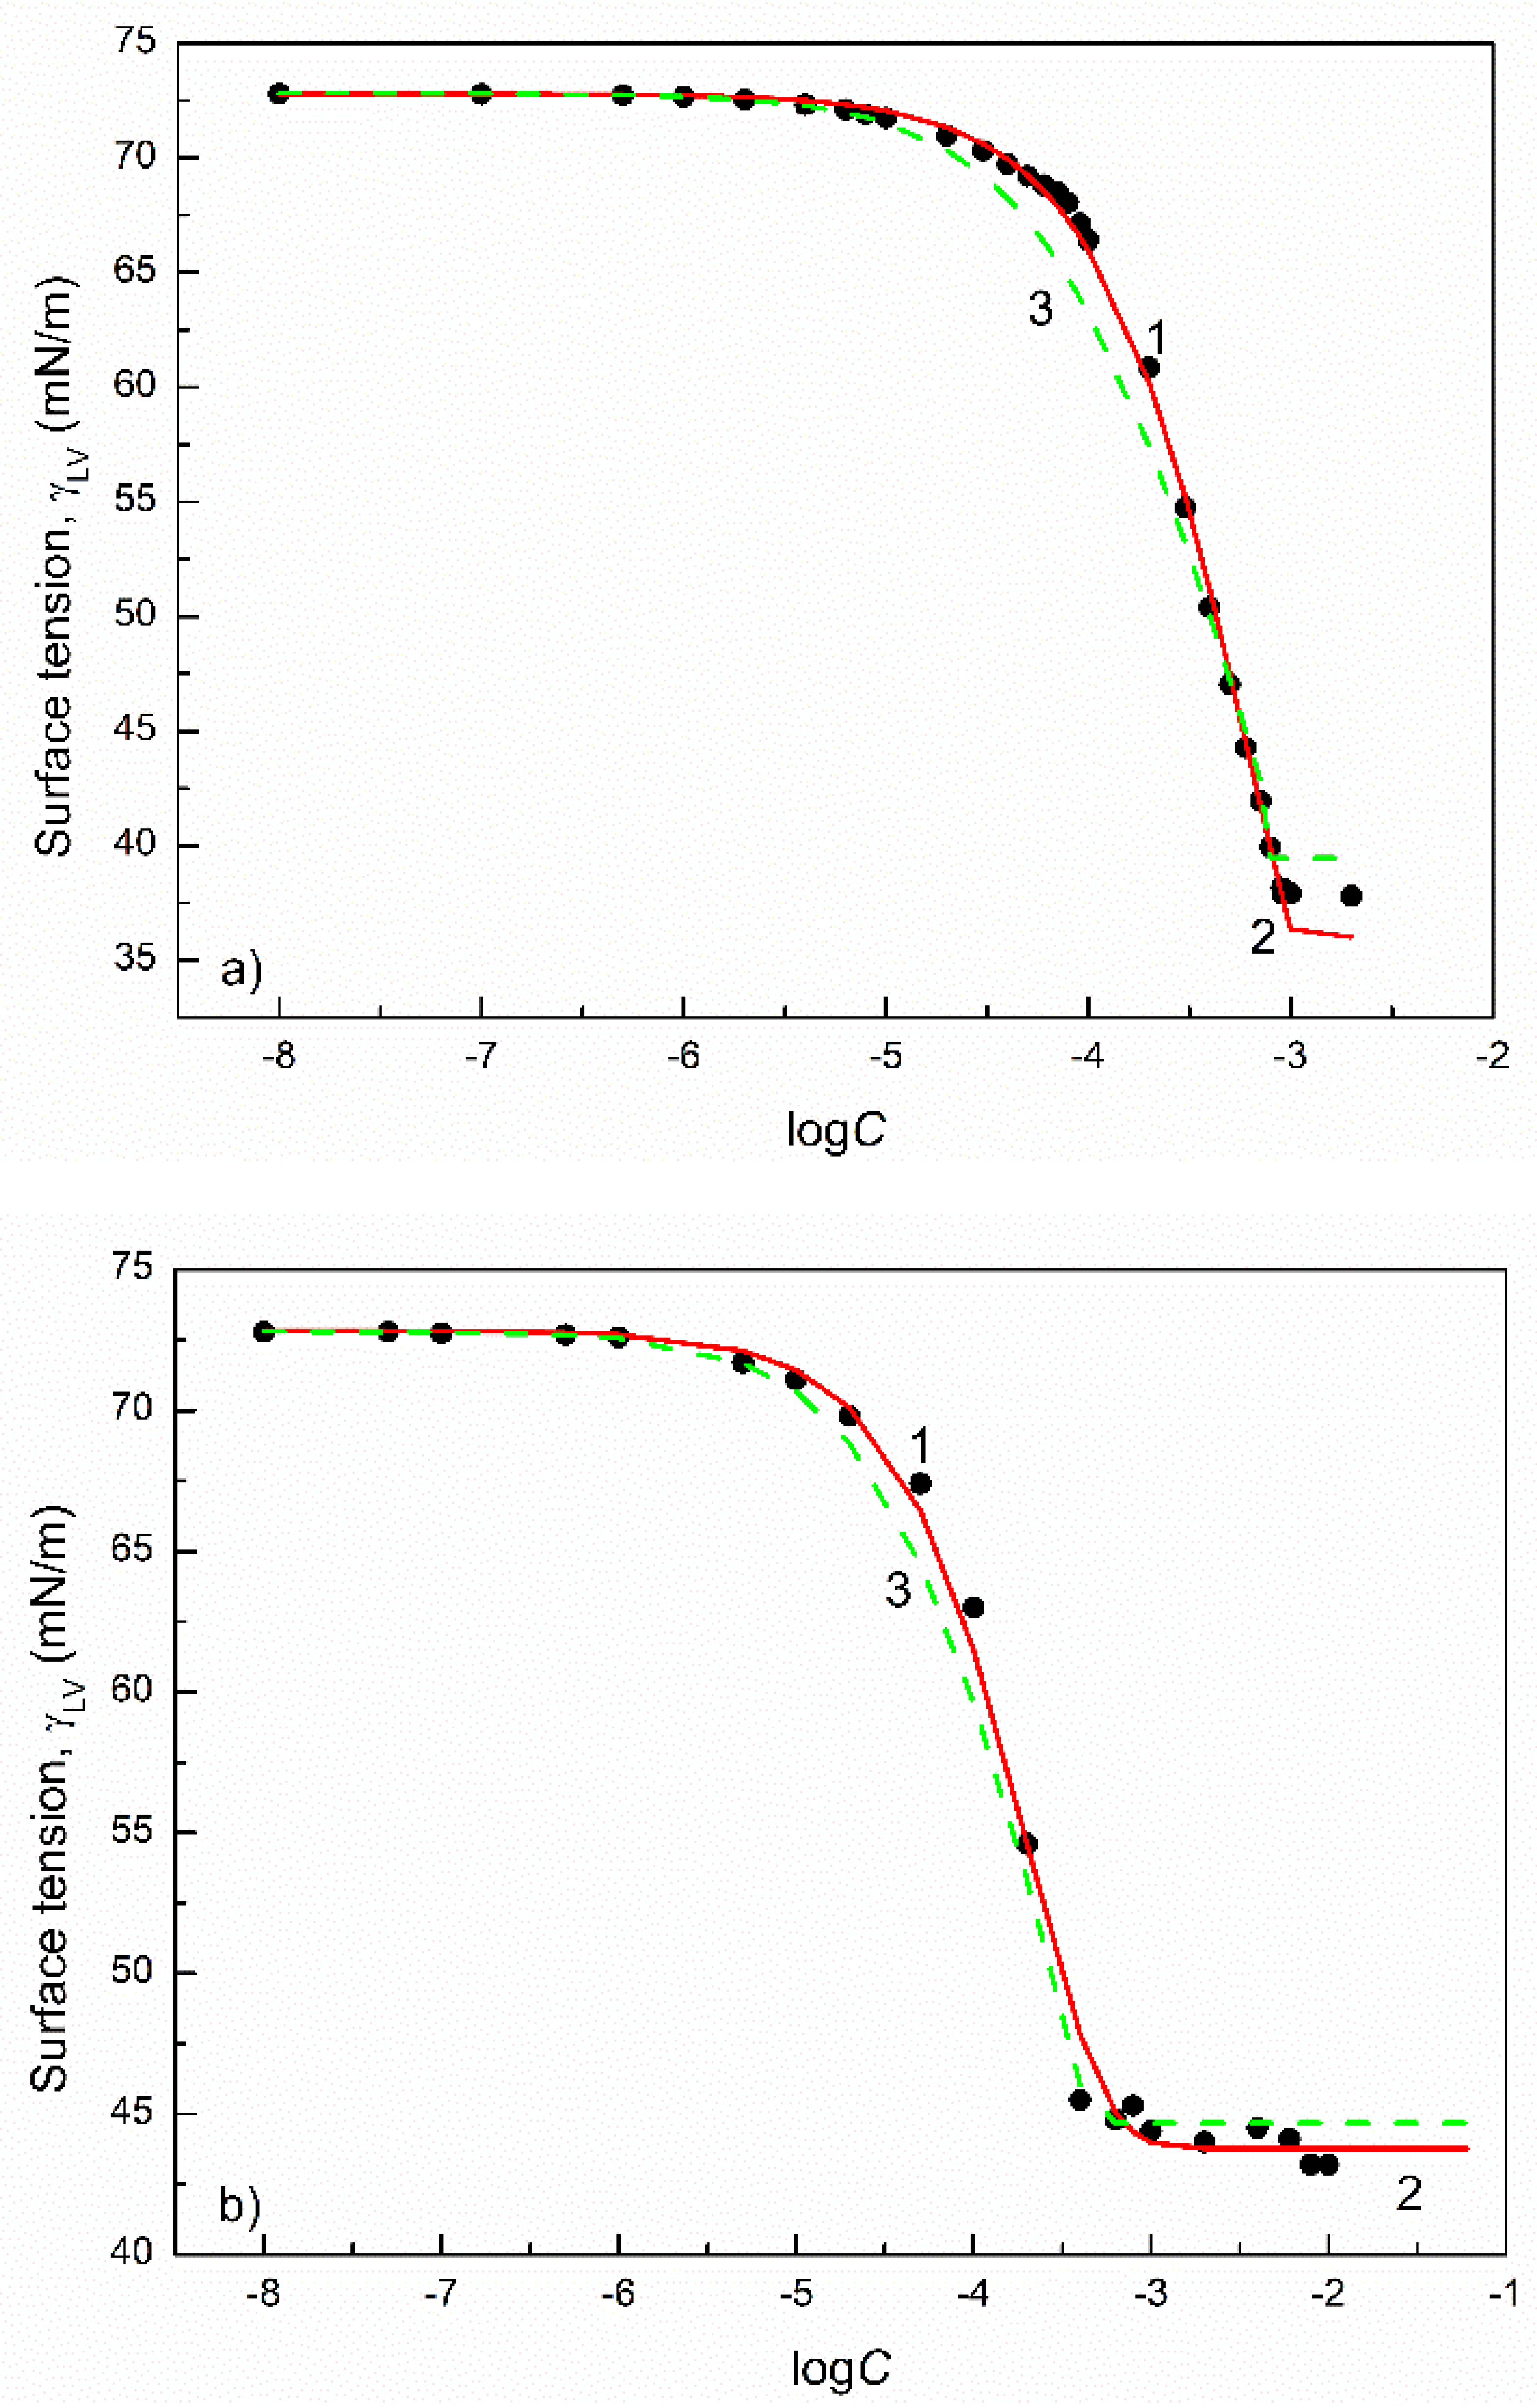
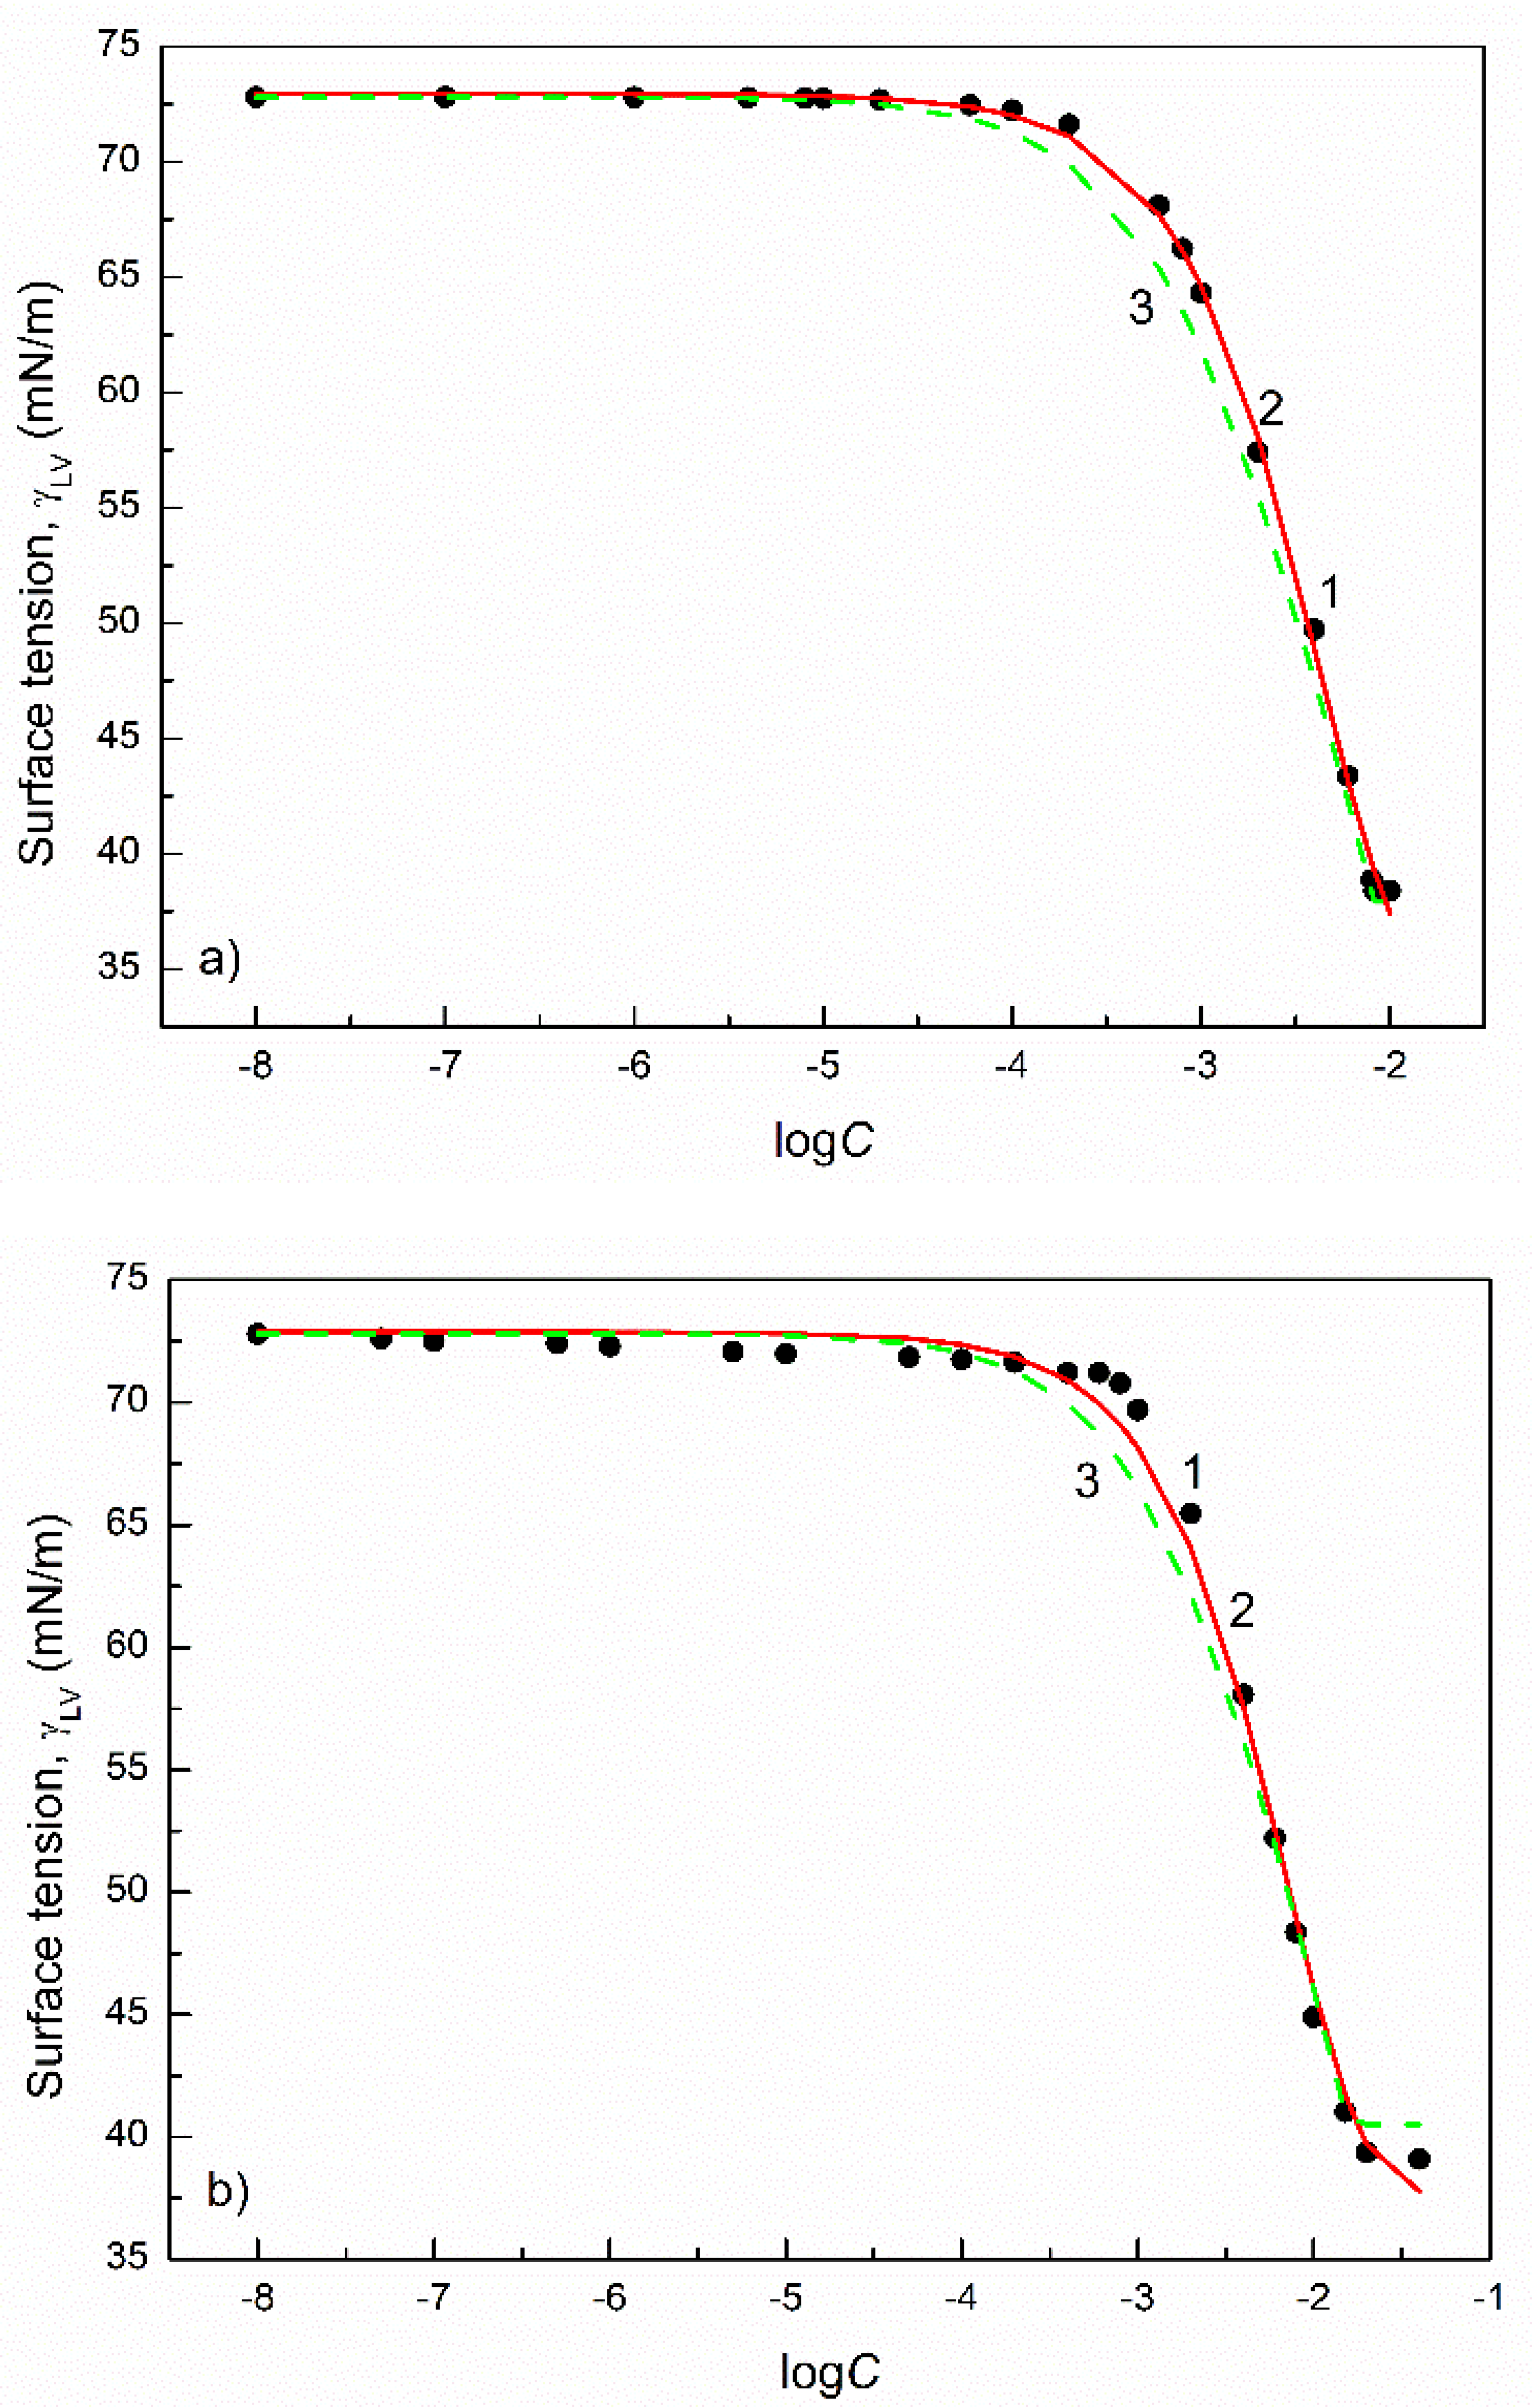
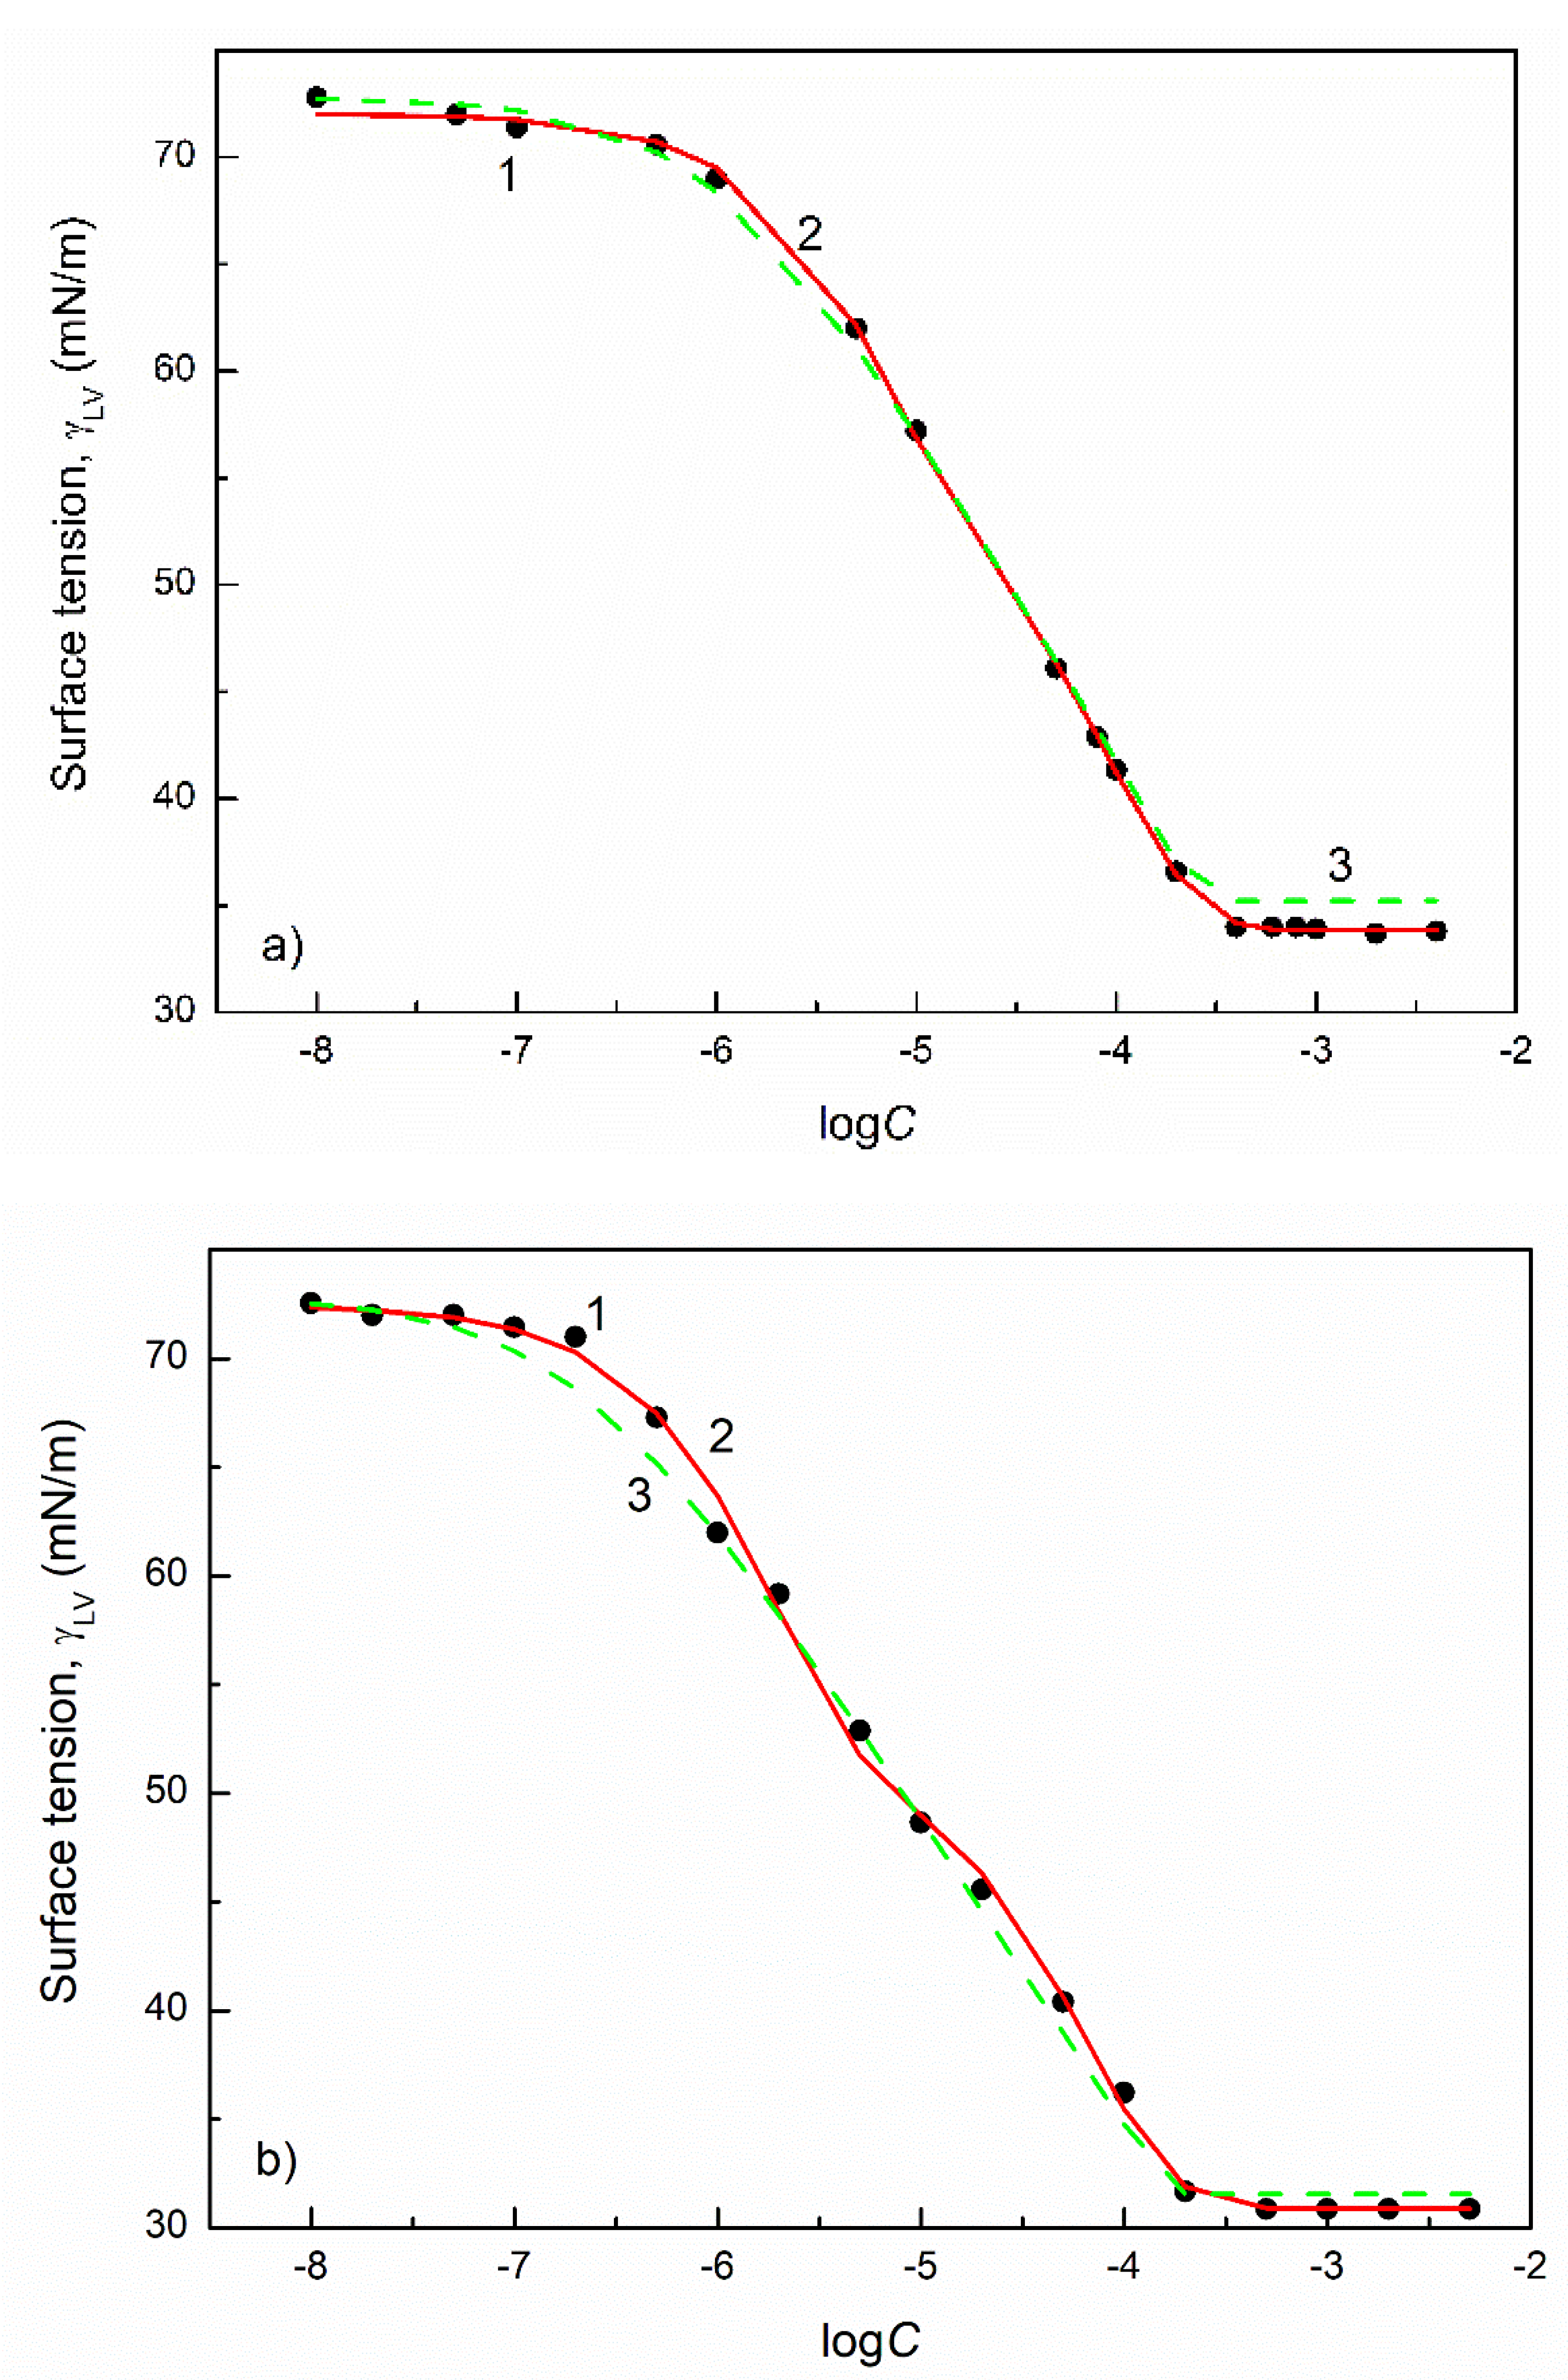
It appears that the values of the surface tension of aqueous solution of CTAB, CPyB, SDDS, SDS, TX100, TX114, TX165, FC1 and FC2 calculated from Equation (3) are close to the measured ones if the abovementioned conditions are satisfied (Figure 1, Figure 2, Figure 3 and Figure 4). Moreover, the values of the standard Gibbs free energy of surfactant adsorption calculated from Equation (4) using the constant a from the Szyszkowski equation (Equation (3)), which were numerically determined, are close to those calculated from Equation (7) and determined from the Langmuir equation modified by de Boer [48] (Table 2).
The values of Δ G a d s 0 calculated from Equation (4) are also close to those determined from the Langmuir equation modified by de Boer [48], with exception of TX114 and SDS [43]. It should be remembered that the constant a in Equation (4), resulting from the isotherm of surfactant adsorption at the water–air interface, does not depend on the surfactant concentration in the bulk phase. In turn, Equation (7) is based on the CMC values of surfactants and their chemical potentials in the saturated monolayer. However, the Δ G a d s 0 values calculated from the Langmuir equation modified by de Boer [48] depend on the surfactant concentration. The values of Δ G a d s 0 , calculated from this equation corresponding to the unsaturated monolayer, are treated as the standard Gibbs free energy of adsorption. Unfortunately, the values of the area occupied by surfactant molecules in the monolayer at low surfactant concentration in the bulk phase can be affected by a significant error. Thus, the difference between the Δ G a d s 0 values for SDS and TX114 calculated from Equation (7) and the Langmuir equation are higher than for the other surfactants. It should be mentioned the literature reports different values of Δ G a d s 0 depending on the determination method.

3.2. Surface Tension of the Aqueous Solution of Binary Surfactant Mixtures

In many cases, the adsorption of multicomponent surfactant mixtures at the water–air interface decreases the water surface tension to a greater or lower degree than individual surfactants at the same concentration as the mixture. This results from the fact that in the case of the mixture, not only the hydration of the tail and head of the surfactant molecules, but also the mutual influence of the molecules of the components of the mixture, play an important role in the adsorption processes. In the concentration range, for example, binary mixtures of surfactants in the bulk phase corresponding to unsaturated mixed monolayers the particular component of the mixture can adsorb independently. However, at the concentration of the binary mixture of surfactants corresponding to the saturated monolayer, the mutual influence on their packing of the molecules’ orientation can take place [21,22,25]. In the case of the mixtures of ionic and nonionic surfactants in the saturated monolayer, the molecules of nonionic surfactants can separate the ionic ones, thus diminishing the electrostatic intermolecular interactions. For this reason, the packing of the mixed monolayer can increase, and a greater reduction of the water surface tension is observed than that for individual components of the mixture. It is possible that as a result of the interaction between the surfactant molecules, the dehydration of their head takes place, which also influences the isotherm of the surface tension of the aqueous solution of the surfactant mixture. On this isotherm, the changes in the orientation of surfactant molecules in the mixed monolayer also take place under mutual interaction. Similarly to single surfactants, the isotherm of the surface tension of the aqueous solution of binary surfactant mixtures can be described by the exponential function of the second order. In the case of the exponential function of the second order’s applicability for the description of the γ L V changes in binary surfactant mixtures as a function of their concentration, two types of mixtures were taken into account. The first type includes the binary mixtures of the same kind of surfactants, such as cationic (CTAB+CPyB), anionic (SDS+SDDS) and nonionic (TX100+TX165 and FC1+FC2) in which the mole fraction of surfactants in the mixtures in the bulk phase is constant and the total concentration changes. The second type of binary surfactant mixtures includes different kinds of surfactants such as CTAB+TX100, SDDS+TX100, FC2+TX100 and FC1+TX165 [21,22,25,28,29,30]. For this type of mixtures, similarly to the first type, the changes in the surface tension of their aqueous solution at a given constant composition in the bulk phase as a function of the mixture concentration were considered.
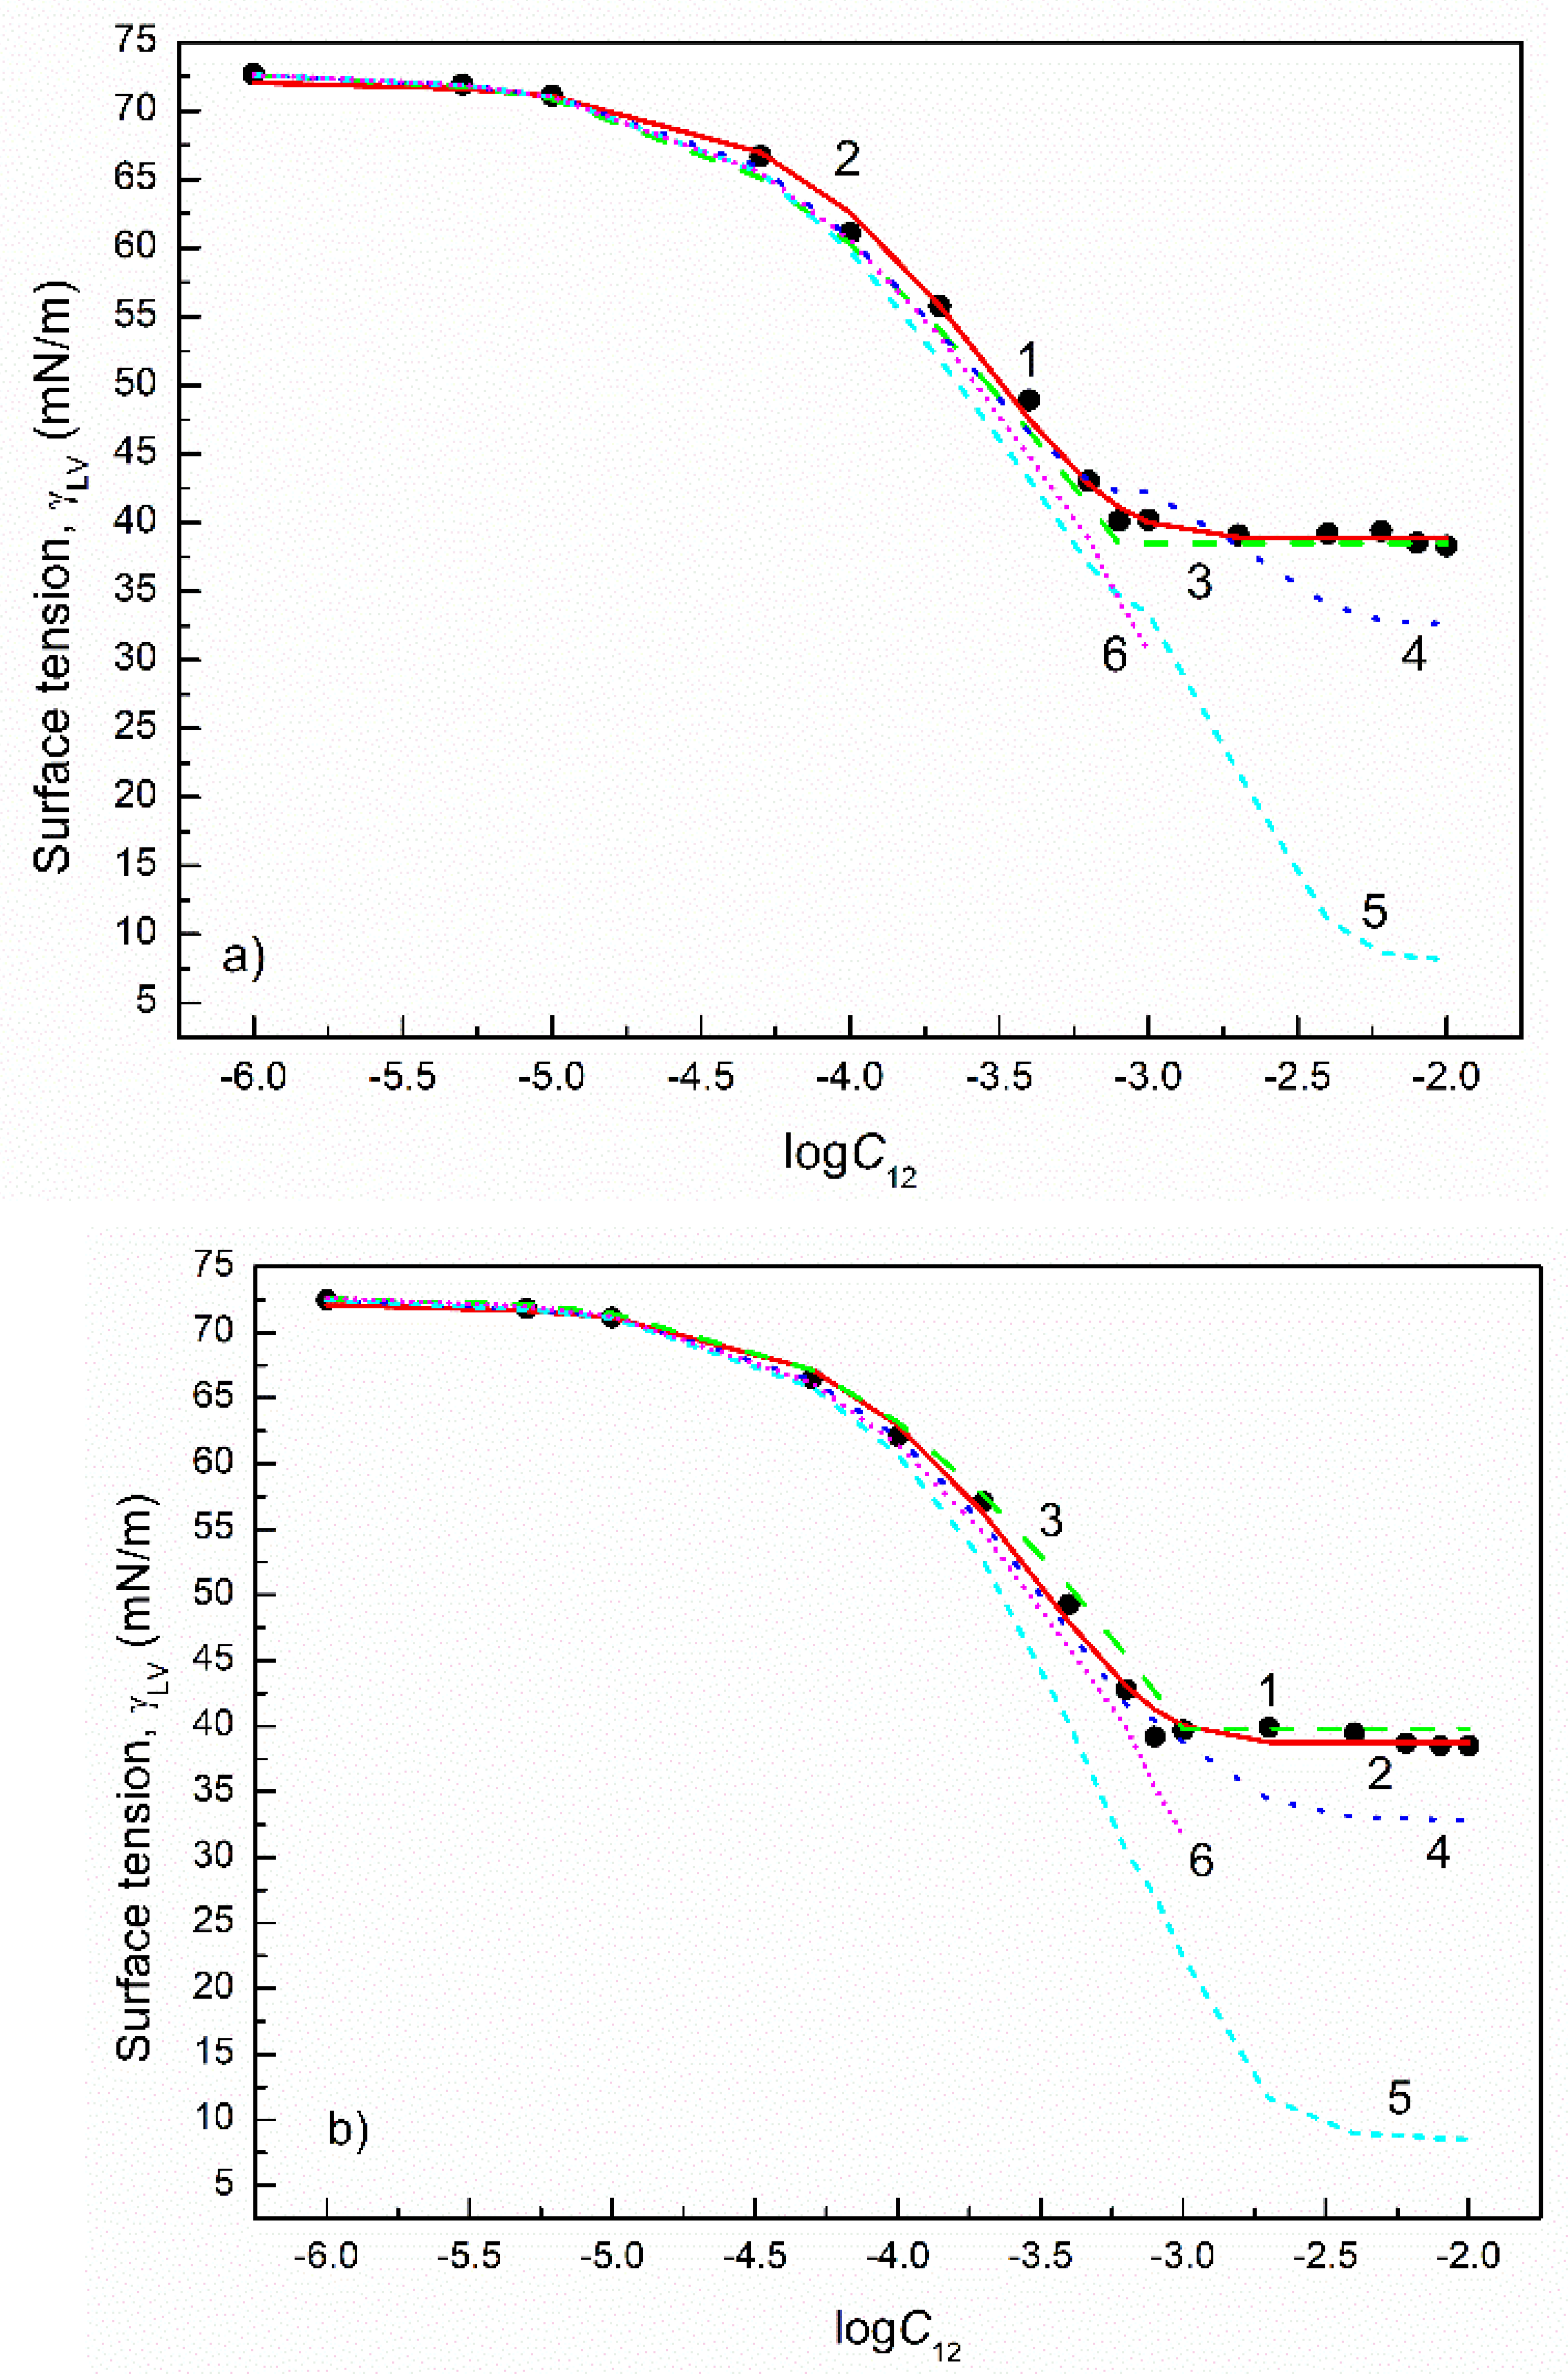
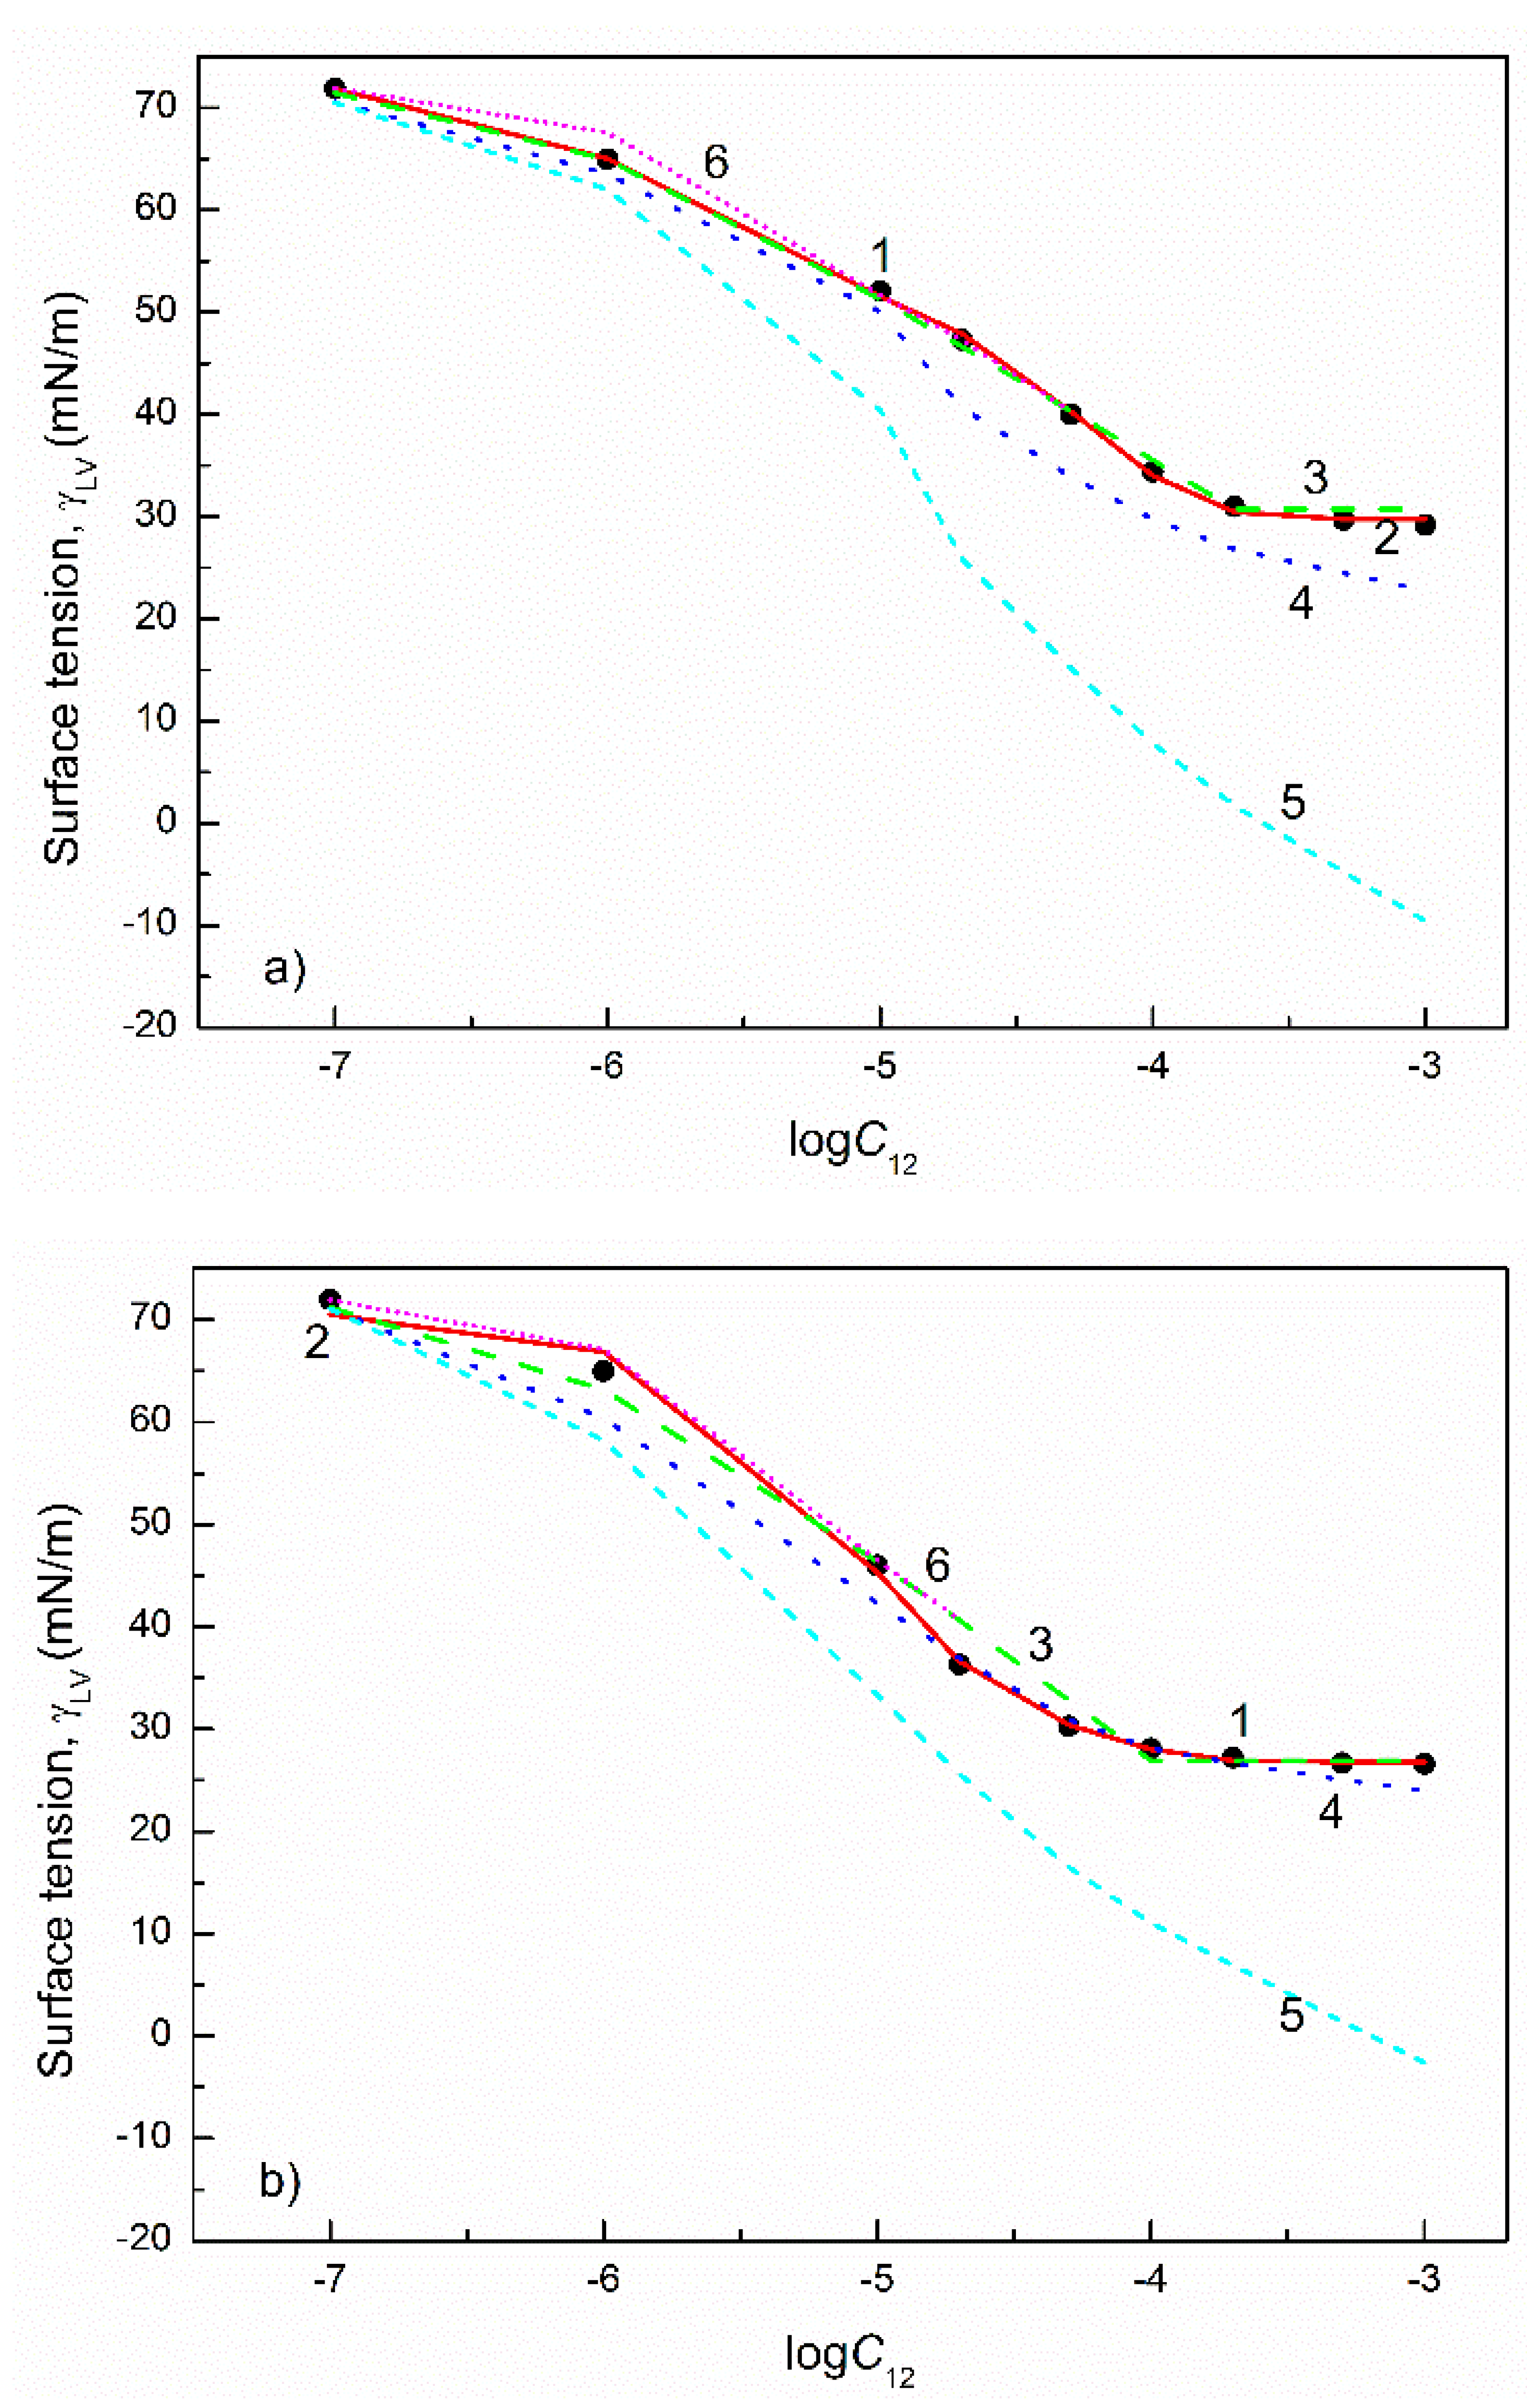
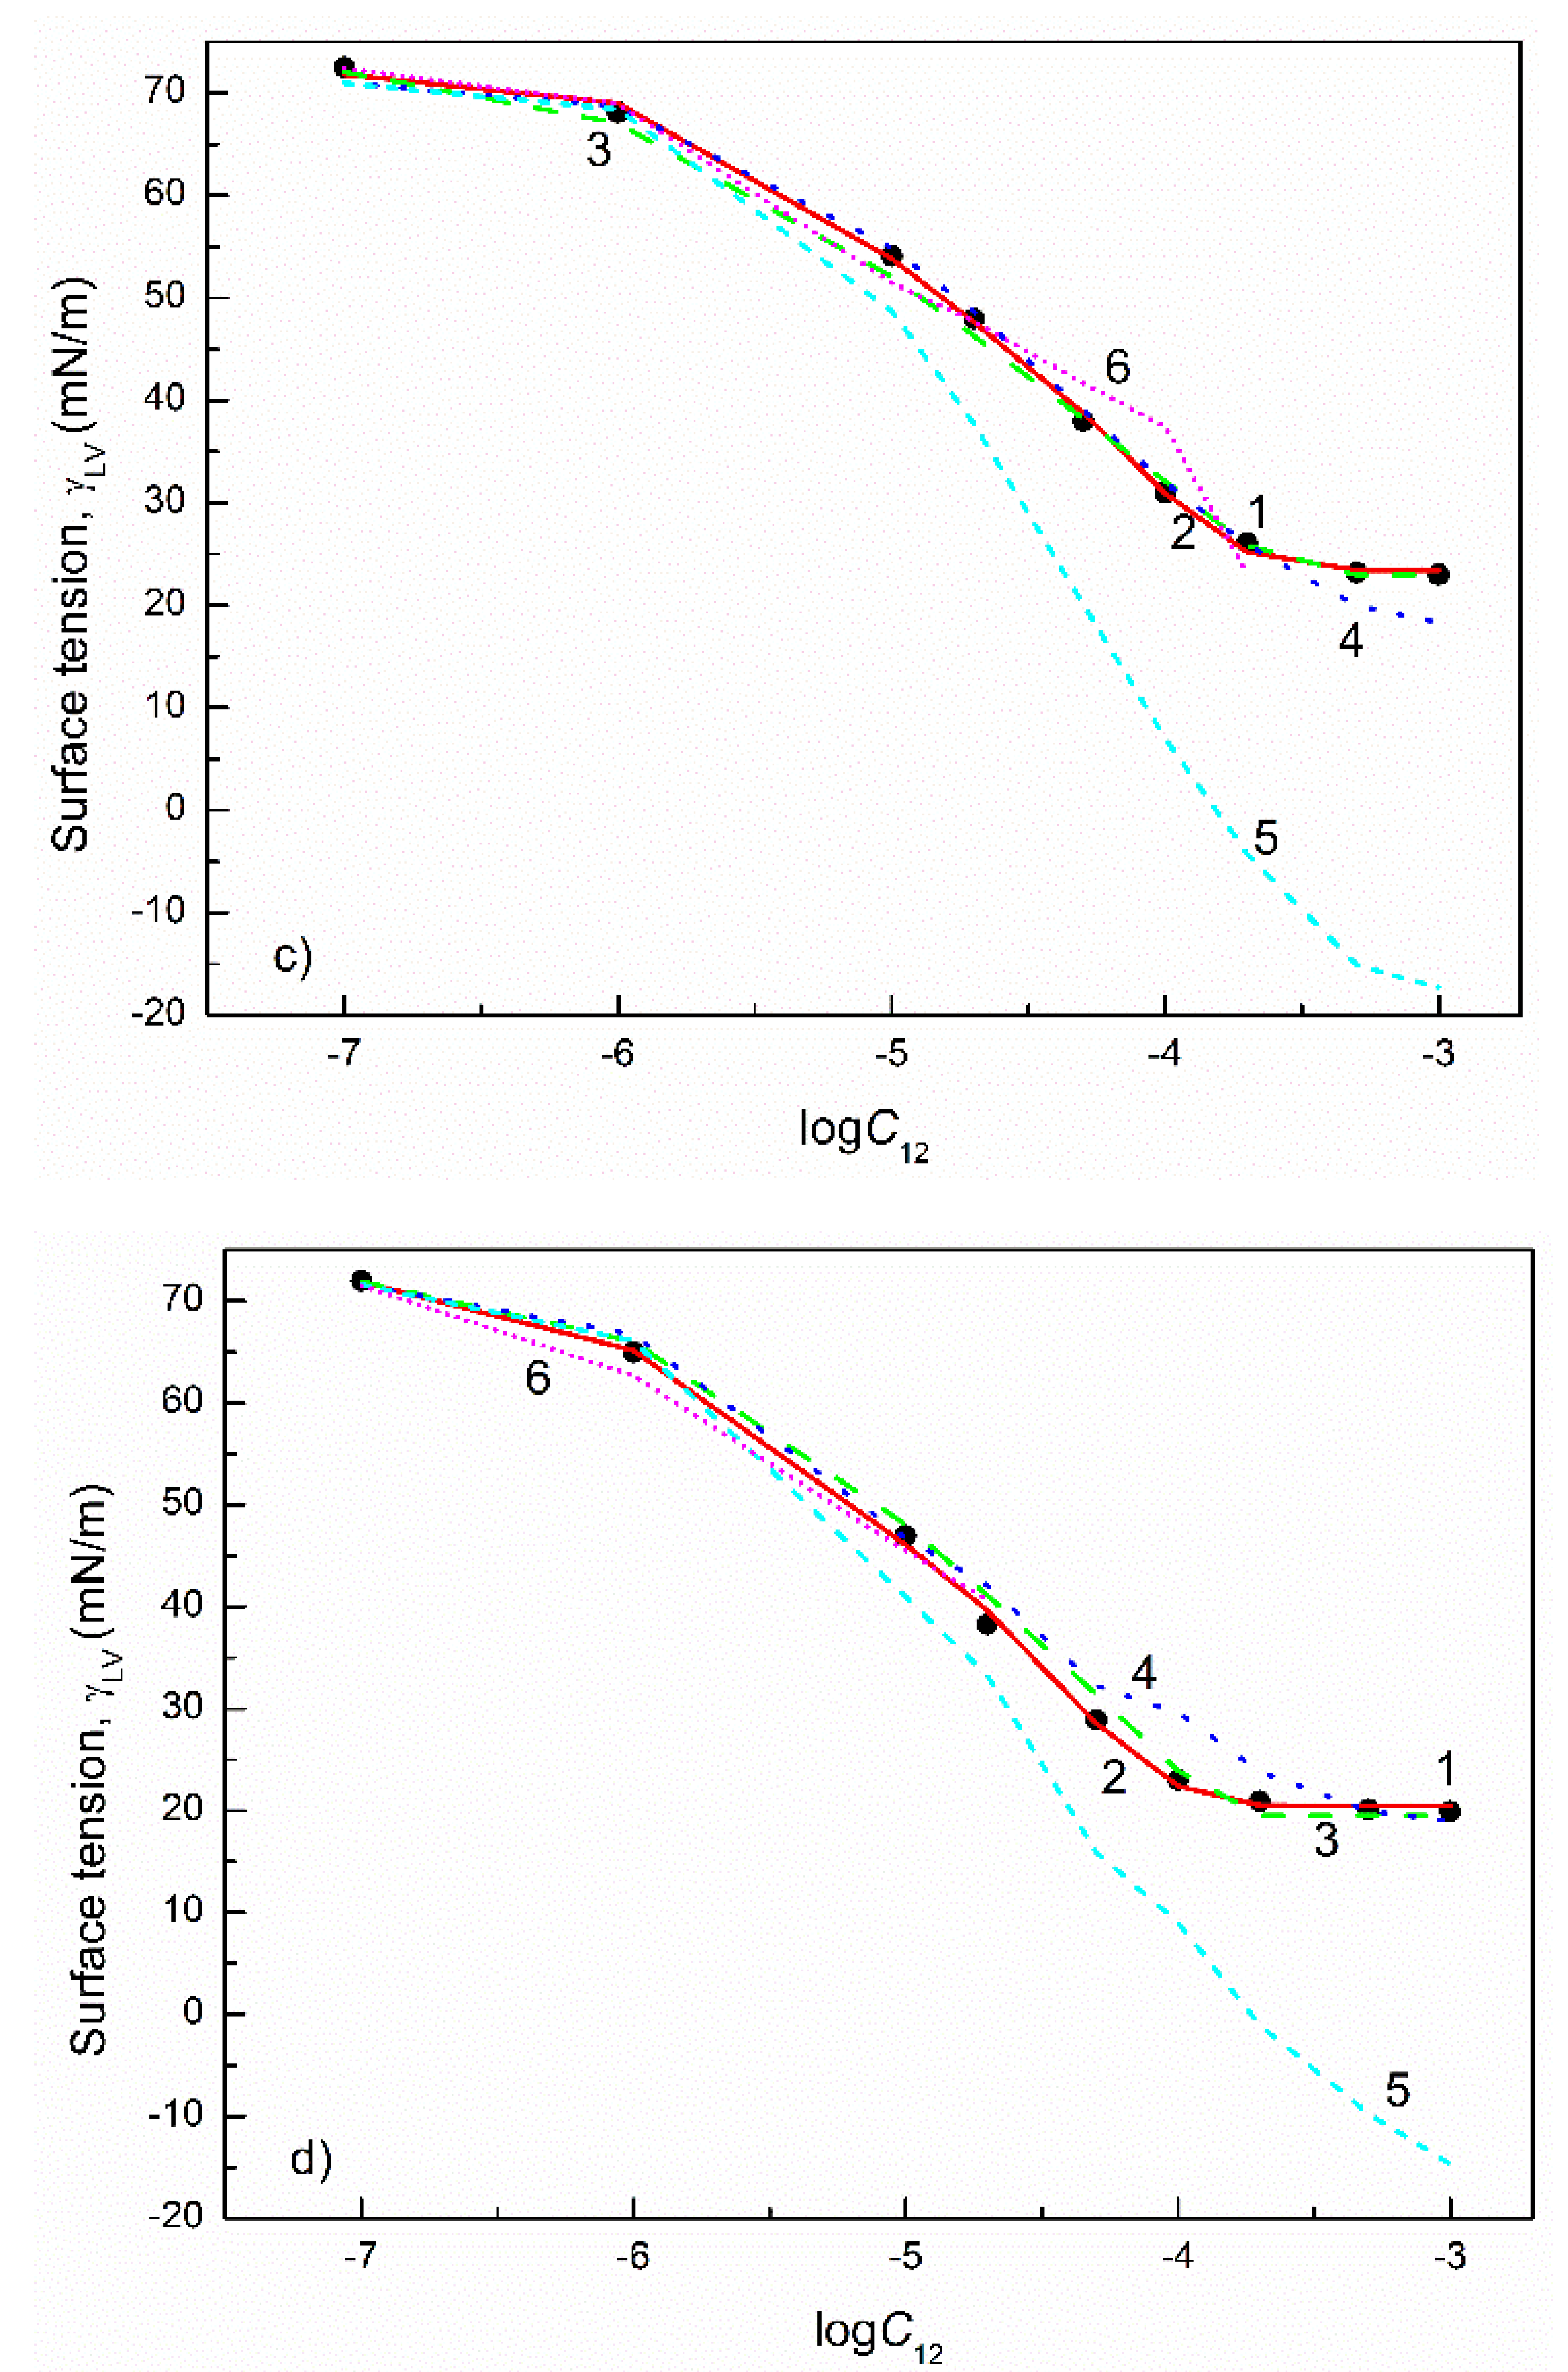
For both types of the binary surfactant mixtures, the changes in the surface tension of their aqueous solution as a function of the concentration can be described by the exponential function of the second order for each composition (Figure 5, Figure 6, Figure 7, Figure 8, Figure 9, Figure 10 and Figure 11). However, in some cases there is an insignificant difference between the measured and calculated values of γ L V . This takes place particularly in the concentration range of the surfactant mixtures higher than CMC. The constants in the equations of the exponential function of the second order do not change linearly as a function of the surfactant mixtures’ composition (Figures S5 and S6). However, for the first type of surfactant mixtures, the smallest deviation from the linear dependence between y 0 and the composition of the mixture is observed (Figure S5). For the mixtures including two anionic (SDS+SDDS) and two cationic surfactants (CTAB+CPyB), the constant A 1   = A 2 and t 1 = t 2 . This points out that for these mixtures, the changes of γ L V as a function of their concentration can also be described by the exponential function of the first order. However, convincing evidence for the synergetic effect in the reduction of water surface tension was not found [21,28]. For the mixtures of the first type of surfactant included two FC nonionic surfactants (FC1+FC2) and two Tritons (TX100+TX165) (Figure S5) A 1     A 2 and t 1     t 2 . The synergetic effect in the reduction of water surface tension was found for them [25,30].
The dependence between the surface tension of the aqueous solution of all second-type surfactant mixtures (CTAB+TX100, SDDS+TX100, FC2+TX100, FC1+TX165) and the concentration at their constant composition can be described only by the exponential function of the second order (Figure 9, Figure 10 and Figure 11). In the case of these mixtures, the synergetic effect in the reduction of the water surface tension was found [22,28,29]. The biggest deviation of the constants in the exponential function of the second order, describing the γ L V changes as a function of C from the linear dependence between these constants, and the composition of the surfactant mixtures, takes place for the mixtures of Triton with FC (Figure S6), for which the biggest synergetic effect in the reduction of water surface tension was found [29]. It is possible that the changes of the constants A 1 , A 2 , t 1 and t 2 in Equation (2) as a function of the surfactant mixture’s composition are largely due to the polar interactions between the heads of surfactants, as well as the constant y 0 with the apolar interactions between the tails of the surfactant molecules. However, based on the constants of the exponential function of the second order describing the γ L V changes as a function of the concentration of the individual surfactants, it is impossible to predict the changes of the aqueous solution surface tension of the mixtures; it is possible only to describe them.
The description of γ L V value changes, as a function of the concentration of a given surfactant mixture, is important for the determination of the surfactant concentration at the water–air interface. However, it is more important to predict the surface tension values of the aqueous solution of surfactant mixtures than their description by mathematical function. For this purpose, the applicability of the Szyszkowski equation (Equation (3)) was considered. It appeared that the changes in the surface tension of the aqueous solution of surfactant binary mixtures at a given constant composition could be described by the Szyszkowski equation (Equation (3)) numerically choosing the constant a and k Γ m a x (Figure 5, Figure 6, Figure 7, Figure 8, Figure 9, Figure 10 and Figure 11). As a matter of fact, in the case of calculations it was assumed that the concentration of surfactant mixture after CMC form was constant. The deviation of γ L V values calculated from this equation from those measured is more evident for the binary surfactant mixtures of the second type than the first one.
Analyzing the values of Γ m a x (Figures S7 and S8) and a for the binary surfactant mixtures at a given composition, the question arises whether these values can be predicted from the Γ m a x and a values for single surfactants being a component of the mixture. As it was mentioned above, the values of a are related to the standard Gibbs free energy of adsorption of surfactants at the water–air interface. Hence, it is possible to calculate the Δ G a d s 0 values for the binary surfactant mixtures at a given composition based on the numerically determined a . The values of Δ G a d s 0 determined in such way are presented in Figures S9 and S10. It appeared that for the mixtures of CTAB+CPyB and TX100+TX165 there is an ideal linear dependence between Δ G a d s 0 and the mixture’s composition (Figure S9). At the first approximation, there is a linear dependence between Δ G a d s 0 and the composition of the FC2+TX100 and FC1+TX165 mixtures (Figure S10). In the case of the CTAB+TX100, FC1+FC2 and SDS+SDDS mixtures, there is the negative deviation from the linear dependence between Δ G a d s 0 and the composition of the mixtures (Figures S9 and S10). It should be mentioned that with the exception of the CTAB and TX100 mixture, there is an insignificant difference between the Δ G a d s 0 values of the mixture components.
As it is commonly known, the constant a depends on the standard Gibbs free energy of adsorption. This energy for the surfactant mixtures can be predicted based on the energy of the mixture components and their mole fraction in the bulk phase, as well as the Gibbs free energy of surfactant mixing ( G m i x ) [3]. Thus, the standard free energy of the surfactant’s binary mixture adsorption ( Δ G a d s , 12   0 ) should satisfy the condition:
Δ G a d s , 12   0 = Δ G a d s , 1   0 X 1 B + G a d s , 2 0 X 2 B + G m i x ,
where Δ G a d s , 1   0 and G a d s , 2 0 are the standard Gibbs free energies of adsorption of surfactants 1 and 2, respectively, and X 1 B and X 2 B are the fractions of surfactants in the bulk phase.
From the data presented in Figure S9 it can be deduced that only in the case of CTAB and TX100 mixtures the absolute values of G m i x differ significantly from zero. This indicates that for the other studied mixtures, the values of a 12 of the binary surfactant mixtures at a given composition can be predicted based on the constants a 1 and a 2 of surfactants 1 and 2, respectively, being the components of the mixture.
To solve the Szyszkowski equation in order to determine γ L V , apart from the a 12 value, that of k Γ 12 m a x (12 refers to the binary mixture of surfactants) is needed. As follows from Figures S7 and S8 similarly to G a d s , 2 0 , there is an ideal linear dependence between k 12 Γ 12 m a x and the composition of CTAB+CPyB, as well as that of TX100+TX165. In the case of the SDS and SDDS mixtures, this dependence is close to linear, but for the others a negative or positive deviation from the linear dependence between k 12 Γ 12 m a x and the mixture composition is observed.
For the binary surfactant mixtures, if the changes of k 12 Γ 12 m a x as a function of composition can be described by the linear function, the k 12 Γ 12 m a x fulfills the expression:
k 12 Γ 12 m a x = k 1 Γ 1 m a x X 1 B + k 2 Γ 2 m a x X 2 B ,
From the above-presented fact, it results that for the binary surfactant mixtures whose changes of Δ G a d s , 12   0 against the mixture’s composition can be expressed by the linear function, it is possible to predict the changes of surface tension of the aqueous solution of these mixtures using the Szyszkowski equation.
If adsorption of particular surfactants in the mixture at the water–air interface is independent, the surface tension of the aqueous solution of this mixture fulfills the condition:
γ L V = γ W π 1 π 2 ,
where π 1 and π 2 are the contribution of surfactants 1 and 2 to the reduction of water surface tension.
It is proven that in the range of the surfactant mixture concentrations corresponding to the unsaturated mixed monolayer at the water–air interface, the adsorption of particular mixture components is independent. In the range of the surfactant mixture concentrations corresponding to the saturated mixed monolayer, the values of γ L V calculated from Equation (10) differ somehow from the measured ones. For the second type of the binary surfactant mixtures, for which the synergetic effect in the reduction of water surface tension was found, the values of γ L V   are higher than those measured (SDDS+TX100, CTAB+TX100) [22,28]. This indicates that the reduction of the water surface tension by these mixtures is higher than that which results from independent adsorption. However, for the first type of binary surfactant mixtures (CTAB+CPyB, SDS+SDDS, TX165+TX100, FC1+FC2), the values of the surface tension of their aqueous solution in the range of the concentration corresponding to the saturated mixed monolayer calculated from Equation (10) are close to or smaller than the measured ones (Figure 5, Figure 6, Figure 7, Figure 8, Figure 9, Figure 10 and Figure 11). This means that in such cases, the synergetic effect does not appear or is very weak. As results from the calculation of the γ L V of the aqueous solution of binary surfactant mixtures, in some cases it is possible to predict the γ L V values of the mixture based on the independent adsorption of the mixture components at the water–air interface.
Among others, Fainerman and Miller [17,18] as well as Joos [16] proposed the equations for the calculation of the surface tension of the aqueous solution of binary surfactant mixtures based on the data of particular mixture components. However, our studies proved that these equations can be extended to the multicomponent systems. Hence, the Fainerman and Miller equation for the multicomponent mixtures of the surfactants has the form [49]:
e x p Π * = i = n i = 1 e x p Π i * ( n 1 ) ,
where n is the number of surfactants in the mixture Π * = Π ω / R T , Π i * = Π i ω i / R T are the dimensionless pressures of the mixed monolayer at the water–air interface, the individual surfactant i, ω i and ω are the areas occupied by one mole of the surfactant i and the mixture at the water–air interface and Π and Π i are the differences between the surface tension of the solvent and solution of the surfactant mixtures and the component i, respectively.
The main problem in solving Equation (11) is determination of ω . In our opinion, ω should fulfil the condition:
ω = i = n i = 1 ω i X i S ,
where X i S = Π i i = n i = 1 Π i .
The Joos equation for the aqueous solution of the multicomponent surfactant mixtures can be written in the form:
e x p ( Π R T 0 ) + i = n i = 1 e x p ( Π i k R T i ) C i a i = 1 ,
where Γ 0 is the limiting concentration of the water at the water–air interface and Γ i is the limiting concentration of i component of the surfactant mixture at the water–air interface,   C i is the concentration of i component in the bulk phase and a i is the constant which should be described by Equation (4).
The constants a i and Γ i can be determined from the following equation [16]:
e x p ( Π R T 0 ) + e x p ( Π i k R T i ) = 1 ,
For the majority of aqueous solutions of binary surfactant mixtures, it is possible to predict the values of γ L V using the Fainerman and Miller equation (Equation (11)) based on the data for particular components of the mixture, in the range of mixture concentrations from 0 to CMC (Figure 5, Figure 6, Figure 7, Figure 8, Figure 9, Figure 10 and Figure 11). However, for the mixtures containing FC (Figures S8 and S11), the differences between the values of γ L V calculated from Equation (11) and those measured are larger than those of other mixtures.
Using Equation (13) it is possible to predict the values of γ L V for the aqueous solution of the first type of binary surfactant mixtures in the range of the mixture concentrations from 0 to CMC. For the mixtures of the second type, a greater difference between the values of γ L V measured and calculated from Equation (13) is observed (Figures S9–S11). For the mixtures including FC and hydrocarbon surfactant, it was possible to predict surface tension of their aqueous solution only in the range of mixture concentrations corresponding to the unsaturated mixed monolayer at the water–air interface (Figure 11). The reason for this may be the biggest difference between the surface tension of the tail and head of FC among the surfactants studied.
In most cases, the values of the standard Gibbs free energy of surfactant adsorption calculated from Equation (4) based on the a i values obtained from Equation (14) are significantly different from those obtained using the values a i from the Szyszkowski equation and the linear Langmuir isotherm equation (Table 2).

3.3. Surface Tension of the Aqueous Solution of Ternary Surfactant Mixture

To study the possible prediction of the surface tension of the aqueous solution of ternary mixtures of surfactants, the CTAB+TX100+FC1, SDDS+FC1+FC2 and CTAB+TX100+TX114 systems were taken into consideration (Figure 12 and Figure 13). It should be mentioned that for the SDDS+FC1+FC2 and CTAB+TX100+TX114 systems, the surface tension of their aqueous solutions was analyzed as a function of concentration at the constant composition of the mixtures. In this case, the mixed monolayer at the water–air interface was changed from the unsaturated form to the saturated one as a function of the ternary surfactant mixture concentration. However, in the case of the CTAB+TX100+FC1 mixture, the concentration of the CTAB+TX100 binary mixture was constant and FC1 changed. The constant concentration of the CTAB and TX100 mixture corresponds to its saturated monolayer at the water–air interface. This indicates that in the range of the studied FC1 concentration, the adsorbed mixed monolayer at the water–air interface was saturated. However, its composition and packing changed as a function of the FC1 concentration.
The changes in the surface tension of the aqueous solution of the mixtures under consideration can be described by the exponential function of the second order, similar to that of the solution of both the individual and binary mixtures of surfactants (Figure 1, Figure 2, Figure 3, Figure 4, Figure 5, Figure 6, Figure 7, Figure 8, Figure 9, Figure 10, Figure 11, Figure 12 and Figure 13). The values of the constants in the exponential function of the second order are in the range of those for the components of the ternary mixtures (Figures S11 and S12). However, it is difficult to predict the constants in the exponential function of the second order for the mixtures based on the component ones. As mentioned above, it is possible that the constants in the exponential function describing the isotherm of the surface tension of the aqueous solution of ternary mixtures are related to the apolar and polar interactions of surfactant molecules, both with water molecules and between them. It seems that the constant y 0 particularly depends on the apolar intermolecular interactions of the surfactant molecules with other molecules.
So far, based on the exponential function of the second order describing the isotherm of the surface tension of the individual surfactant’s aqueous solution being the component of the ternary surfactant mixture, it was difficult to predict the surface tension changes as a function of the mixture concentration. However, the description of the isotherm of γ L V is useful for the determination of the isotherm of the surface excess concentration at the water–air interface [20].
The isotherm of γ L V can also be described by the Szyszkowski equation (Equation (3) (Figure 12 and Figure 13) if, in this equation, the concentration of surfactant mixture in the bulk phase which is higher than its CMC is assumed to be equal to CMC. This results from the fact that the molecules of the surfactants in the monomeric form in the bulk phase are adsorbed at the water–air interface rather than micelles, and that their concentration is constant. The numerically determined constants Γ m a x (Figure S13) and a to obtain the best approximation of γ L V values calculated from Equation (3) to those measured are insignificantly different from those determined based on the data for individual surfactants being the components of the ternary mixture of surfactants. Moreover, the values of the standard Gibbs free energy of surfactant mixture adsorption at the water–air interface calculated from Equation (4) based on the constant a in Equation (3) are similar to those determined from the Langmuir linear isotherm of adsorption (Figure S14) [3].
Based on the γ L V calculation using the Szyszkowski equation, it can be concluded that for the ideal ternary mixtures of surfactants, and those for which the weak synergetic or antagonic effect in the reduction of water surface tension takes place, it is possible to predict the   γ L V values from the data for an individual component of the mixture.
As follows from our calculations, the Fainerman and Miller equation can be used for the prediction of γ L V values, not only for the aqueous solution of binary mixtures of surfactants, but also the ternary ones (Figure 12 and Figure 13). It was found that determination of the limiting area occupied by one mole of surfactant mixture using Equation (12) gives a better approximation of the calculated values of γ L V to the measured ones than the method proposed by the Fainerman and Miller equation [17,18]. This means that ω depends on the fraction of the contribution of a given surfactant of the mixture to the reduction of water surface tension and can change as a function of surfactant mixture concentration. Indeed, in most cases the surface tension of the ternary mixture can be predicted in the range of its concentration from zero to CMC. If there are big differences between the independent and real adsorption in a given system, some differences between the values of γ L V calculated from Equation (11) and the measured ones are observed (Figure 12 and Figure 13).
The independent adsorption of the ternary mixture of surfactants at the water–air interface can be determined from the expression [20]:
γ L V = γ W π 1 π 2 π 3 ,
The values of γ L V calculated from Equation (15) for CTAB+TX100+FC1 differ considerably from the measured ones. However, the γ L V values calculated from the Fainerman and Miller equation (Equation (11)) are very close to the measured ones. Moreover, for this system the changes of the mixture concentration were in the range of the concentration corresponding to the saturated mixed monolayer. Additionally, the concentration of CTAB and TX100 mixture was constant and changed only for FC1.
From the Joos equation (Equation (13)) it was possible to calculate the γ L V values for the SDDS+FC1+FC2 and CTAB+TX100+TX114 systems but not for the CTAB+TX100+FC1 one (Figure 12 and Figure 13). In the case of the CTAB mixture with Triton, a good approximation of the calculated γ L V values to those measured was obtained. However, it was impossible to obtain the γ L V values in the whole surfactant mixture concentration. As mentioned above, the standard Gibbs energy of surfactant mixture adsorption, determined based on a i used in the Joos equation, differs considerably from that obtained by different methods. Hence, it can be stated that the Joos equation is useful to predict the surface tension of the ideal aqueous solution of the surfactant mixtures, and/or close to the ideal one in the range of mixture concentrations from zero to CMC.

3.4. Prediction of the Composition of the Mixed Monolayer of Surfactants at the Water–Air Interface

The composition of the mixed surface layer is very important from both the theoretical and practical points of view. The layer composition controls the synergetic or antagonistic effects in the reduction of the water surface tension and its structure. Among others, the relative composition of the saturated binary surfactant’s monolayer can be determined using the Hua and Rosen equation, which has the form [3,27]:
( X 1 S ) 2 l n ( X 1 b C 12 / X 1 S C 1 ) ( 1 X 1 S ) 2 l n [ ( 1 X 1 b ) C 12 / ( 1 X 1 S ) C 2 ] = 1 ,
where indices 1, 2 and 12 refer to surfactants 1, 2 and the binary surfactant mixture, respectively. The indices S and b refer to the surface region and the bulk phase.
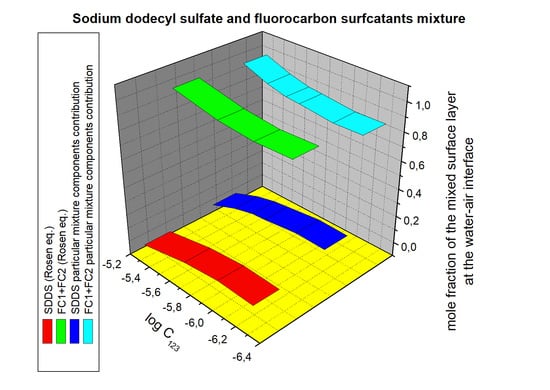
It appeared that the values of the mole fraction of a particular component of the binary mixture of the surfactants calculated from Equation (16) were close to the fraction of the water surface tension reduction by a particular surfactant adsorption at the water–air interface. As a matter of fact, based on Equation (16) it is possible to determine the mole fraction of the surfactant in the mixed monolayer only at the concentration corresponding to that of the saturated mixed monolayer. However, from the expression X i S = Π i i = n i = 1 Π i , it is possible to determine the composition of the mixed surface layer at the water–air interface in the whole range of mixture concentrations in the bulk phase.
From the calculations of the mixed surface layer composition based on the contribution of particular mixture component to the reduction of the water surface tension, results that even in the case of the mixed monolayer of surfactants, characterized by the same surface tension of their tail, the composition differs significantly from that in the bulk phase, depending on the concentration of the mixture of surfactants (CTAB+CPyB, TX100+TX165) (Figures S13 and S14). The difference between the composition of the mixed monolayer and the bulk phase is found also for the binary mixture of surfactants, the molecules of which have the same head but a different tail (SDDS+SDS) (Figure S15). However, the biggest difference between the composition of the surface layer and the bulk phase is observed for the surfactant mixture in which the molecules of the components have both a different tail and head (CTAB+TX100, SDDS+TX100, FC1+FC2, FC2+TX100, FC1+TX165) (Figures S16–S19). The surface tension of the SDDS and TX100, CTAB and TX100 tail and head is different (Table 1), but that of the heads of other mixtures is the same. The differences between the composition of the mixed monolayer and the bulk phase are considerable, depending largely on the mixture’s concentration. It means that the difference between the surface tension of the tail of the mixture components influences the difference in the composition of the mixed surface layer and bulk phase.
Determination of the composition of the ternary mixture of surfactants at the water–air interface based on the Hua and Rosen concept is more complicated than in the case of binary mixtures. We proposed the indirect way to determine the composition of the ternary mixed monolayer using the Hua and Rosen equation. For such mixtures, this equation can be written in the form [49]:
( X 12 S ) 2 l n ( X 12 b C 123 / X 12 S C 12 ) ( 1 X 12 S ) 2 l n [ ( 1 X 12 b ) C 123 / ( 1 X 12 S ) C 3 ] = 1 ,
where: X 12 S is the sum of the molar fractions of surfactants 1 and 2 in the mixed monolayer, X 12 b is the sum of the molar fractions of surfactants 1 and 2 in the bulk phase, C 12 is the concentration of the sum of surfactants 1 and 2 in the ternary mixture, C 3 is the concentration of surfactant 3 and C 123 is the concentration of the ternary surfactant mixture.
From Equation (17) it is possible to establish numerically X 12 S and then X 3 S ( X 3 S = 1 X 12 S ). To calculate X 1 S , the sum of the molar fractions of surfactants 2 and 3 in the mixed monolayer and in the bulk phase, as well as that of surfactant 2 and 3’s concentrations, must be taken into account in Equation (17). Thus, it is possible to determine the mole fraction of three surfactants in the mixed monolayer at the water air interface. However, only the sum of the mole fractions of surfactants 1 and 2, and that of surfactant 3, were calculated as an example.
The mole fractions of the sum of two surfactants and a single one determined in such a way are comparable to that of the same two surfactants and an individual one in the reduction of the water surface tension (Figures S20 and S21). This means that similarly to the binary mixtures, the composition of the mixed monolayer at the water–air interface can be predicted for the ternary surfactant mixtures, based on the contribution of a particular mixture component to the reduction of the water surface tension.

4. Conclusions

The prediction of the surface tension values of the aqueous solution of the binary and ternary surfactant mixtures, as well as the composition of their adsorption monolayer at the water–air interface, was based on the mathematical and thermodynamic rules.
As follows, the isotherm of the surface tension of the aqueous solution of a single surfactant, as well as binary and ternary mixtures of surfactants, can be described—but not predicted—by the exponential function of the second order. However, it was stated that the constants in this function are related to the surface tension of the tail and head of surfactants. This means that the constant values in the equation of the exponential function of the second order depend on both apolar and polar interactions of the surfactant molecules with water and those between the surfactant molecules.
The isotherms of the surface tension of the aqueous solution of individual, binary and ternary mixtures of surfactants can be described by the Szyszkowski equation, and their prediction using this equation is not excluded. This results from the fact that from the constant in the Szyszkowski equation, the standard Gibbs free energy values, which are similar to those determined by the other methods, can be obtained. For the ideal aqueous solution of the surfactant mixtures, the dependence is linear between both the Gibbs surface excess concentration and the standard Gibbs free energy, as well as the mixture composition. At the first approximation, such dependence can be assumed also for non-ideal solutions of the surfactant mixtures with a weak synergetic effect in the water surface tension reduction.
The surface tension of the aqueous solution of binary and ternary surfactant mixtures can be predicted in all cases in the range of mixture concentrations in the bulk phase from 0 to their CMC if the limiting area occupied by the mole of the mixture at the water–air interface is determined based on the areas of single components of the mixture and the fraction of the components in the water surface tension reduction.
For some studied mixtures of surfactants, the isotherm of the surface tension of their aqueous solution can be predicted using the Joos equation. However, the constant values found for individual surfactants based on this equation are different from those in the Szyszkowski equation. The values of the standard Gibbs free energy calculated from this constant are considerably different from those determined by other methods.
In the range of the binary and ternary surfactant mixture concentrations corresponding to the saturated mixed monolayer, it is possible to predict the composition of the mixed monolayer at the water–air interface. However, from the contribution of the individual surfactant being a component of the mixture to the reduction of the water surface tension, it is possible to predict the composition of the mixed monolayer at the water–air interface in the whole mixture concentration in the bulk phase.

Supplementary Materials

The following are available online at https://www.mdpi.com/article/10.3390/colloids5040053/s1, The values of the constants in the exponential function of the second order describing the changes of aqueous solutions of CTAB, CPyB (Figure S1), SDDS, SDS (Figure S2), TX100, TX65, TX114 (Figure S3) as well as FC1 and FC2 (Figure S4) surface tension; the plot of the constants in the exponential function of the second order describing the changes of the surface tension of aqueous solutions of studied binary surfactant mixtures vs. the mole fraction of surfactant in the bulk phase (Figures S5 and S6); the plot of the k Γ m a x values of binary surfactant mixtures vs. the mole fraction of surfactant in the bulk phase (Figures S7 and S8); the plot of the standard Gibbs free energy of adsorption ( Δ G a d s 0 ) of binary surfactant mixtures vs. the mole fraction of surfactant in the bulk phase (Figures S9 and S10); the values of the constant y 0 in the exponential function of the second order for CTAB, TX100, TX114, SDDS, CTAB+TX100+TX114, CTAB+TX100+FC1, SDDS+TX100+FC2, FC1 and FC2 (Figure S11); the values of the constant A 1 (a), A 2 (b), t 1 (c) and t 2 (d) in the exponential function of the second order for CTAB, TX100, TX114, SDDS, CTAB+TX100+TX114, CTAB+TX100+FC1, SDDS+TX100+FC2, FC1 and FC2 (Figure S12); the comparison of the mole fraction of the mixed surface layer formed by CTAB+CPyB (Figure S13), TX100+TX165 (Figure S14), SDDS+SDS (Figure S15), CTAB+TX100 (Figure S16), SDS+TX100 (Figure S17), FC1+FC2 (Figure S18), FC1+TX165 as well as FC2+TX100 (Figure S19), CTAB+TX100+TX114 (Figure S20) and CTAB+TX100+FC1 as well as FC1+FC2+SDDS (Figure S21) at the water–air interface calculated based on the contribution of the particular mixture components to the reduction of the water surface tension and calculated from Equations (16) and (17) at the different mixture composition in the bulk phase.

Author Contributions

Conceptualization, B.J., A.Z., K.S. and M.L.G.-M.; methodology, B.J., A.Z. and K.S.; software, A.Z. and K.S.; validation, A.Z. and K.S.; formal analysis, B.J., A.Z. and K.S.; investigation, A.Z. and K.S.; resources, A.Z. and K.S.; data curation, B.J., A.Z., K.S. and M.L.G.-M.; writing—original draft preparation, B.J., A.Z., K.S. writing—review and editing, B.J., A.Z. and K.S.; visualization, A.Z. and K.S.; supervision, B.J.; project administration, B.J.; funding acquisition, B.J. All authors have read and agreed to the published version of the manuscript.

Funding

This research received no external funding.

Institutional Review Board Statement

Not applicable.

Informed Consent Statement

Not applicable.

Conflicts of Interest

The authors declare no conflict of interest.

References

  1. Fainerman, V.B.; Kovalchuk, V.I.; Aksenenko, E.V.; Ravera, F.; Liggieri, L.; Loglio, G.; Makievski, A.V.; Mishchuk, N.O.; Schneck, E.; Miller, R. A multistate adsorption model for the adsorption of C14EO4 and C14EO8 at the solution/air interface. Coll. Interfaces 2021, 5, 39. [Google Scholar] [CrossRef]
  2. Fainerman, V.B.; Aksenenko, E.V.; Kovalchuk, V.I.; Mucic, N.; Javadi, A.; Liggieri, L.; Ravera, F.; Loglio, G.; Makievski, A.V.; Schneck, E.; et al. New view of the adsorption of surfactants at water/alkane interfaces–Competitive and cooperative effects of surfactant and alkane molecules. Adv. Coll. Interface Sci. 2020, 279, 102143. [Google Scholar] [CrossRef] [PubMed]
  3. Rosen, M.J. Surfactants and Interfacial Phenomena, 3rd ed.; Wiley–Interscience: New York, NY, USA, 2004; pp. 34–178. [Google Scholar]
  4. Zhao, Z.; Qi, K.; Zhu, B.; Long, H.; Huang, Q.; Lei, F.; Huang, Z.; Zhou, J. Effect of chain rigidity on morphological transformation and adsorption behaviors of biocompatible polyoxyethylene-based surfactants at water–air surface. Coll. Polym. Sci. 2021, 299, 1807–1817. [Google Scholar] [CrossRef]
  5. Mchedlov-Petrossyan, N.O. Adsorption of ionic surfactants on water/air interface: One more transformation of the Gibbs equation. Surf. Eng. Appl. Electrochem. 2014, 50, 173–182. [Google Scholar] [CrossRef]
  6. Fainerman, V.B.; Miller, R.; Möhwald, H. General relationships of the adsorption behavior of surfactants at the water/air interface. J. Phys. Chem. B 2002, 106, 809–819. [Google Scholar] [CrossRef]
  7. Trawińska, A.; Hallmann, E.; Mędrzycka, K. Synergistic effects in micellization and surface tension reduction in nonionic gemini S-10 and cationic RTAB surfactants mixtures. Coll. Surf. A 2016, 488, 162–172. [Google Scholar] [CrossRef]
  8. Goswami, A.; Hassana, P.A.; Bhagwat, S.S. Static and dynamic surface tension behaviour of a triblock copolymer and a non ionic surfactant mixture. Coll. Surf. A 2015, 484, 190–196. [Google Scholar] [CrossRef]
  9. Fan, Y.; Tang, H.; Wang, Y. Synergistic behavior and microstructure transition in mixture of zwitterionic surfactant, anionic surfactant, and salts in sorbitol/H2O solvent: 1. Effect of surfactant compositions. J. Surf. Deterg. 2017, 20, 435–443. [Google Scholar] [CrossRef]
  10. Ferreira, J.; Mikhailovskaya, A.; Chenneviere, A.; Restagno, F.; Cousin, C.; Muller, F.; Degrouard, J.; Salonen, A.; Marques, E.F. Interplay between bulk self-assembly, interfacial and foaming properties in a catanionic surfactant mixture of varying composition. Soft Matter 2017, 13, 7197–7206. [Google Scholar] [CrossRef] [PubMed]
  11. Mulqueen, M.; Blankschtein, D. Prediction of equilibrium surface tension and surface adsorption of aqueous surfactant mixtures containing zwitterionic surfactants. Langmuir 2000, 16, 7640–7654. [Google Scholar] [CrossRef]
  12. Abramzon, A.A. Prediction of surface tension and adsorption isotherms for surfactants in liquid-gas and liquid-liquid systems. Russian J. Appl. Chem. 1996, 69, 1159–1162. [Google Scholar]
  13. Cui, Z.-G.; Canselier, J.P. Interfacial and micellar properties of some anionic/cationic binary surfactant systems. 1. Surface properties and prediction of surface tension. Coll. Polym. Sci. 2000, 278, 22–29. [Google Scholar]
  14. Cui, Z.-G.; Canselier, J.P.; Zhou, X.-Q. Mixed adsorption and surface tension prediction of nonideal ternary surfactant systems. Coll. Polym. Sci. 2005, 283, 539–550. [Google Scholar]
  15. Adamson, W.; Gast, A.P. Physical Chemistry of Surfaces, 6th ed.; Wiley Interscience: New York, NY, USA, 1997. [Google Scholar]
  16. Joos, P. Thermodynamics of mixed monolayers. Bull. Soc. Chim. Belg. 1967, 76, 591–600. [Google Scholar] [CrossRef]
  17. Fainerman, V.B.; Miller, R.; Aksenenko, E.V. Simple model for prediction of surface tension of mixed surfactant solutions. Adv. Coll. Interface Sci. 2002, 96, 339–359. [Google Scholar] [CrossRef]
  18. Fainerman, V.B.; Miller, R. Simple method to estimate surface tension of mixed surfactant solutions. J. Phys. Chem. B 2001, 105, 11432–11438. [Google Scholar] [CrossRef]
  19. Hey, M.J.; Kippax, P.G. Surface tensions of mixed aqueous solutions of tert-butanol and n-pentanol. Coll. Surf. A 2005, 262, 198–203. [Google Scholar] [CrossRef]
  20. Jańczuk, B.; Szymczyk, K.; Zdziennicka, A. Adsorption properties of hydrocarbon and fluorocarbon surfactants ternary mixture at the water-air interface. Molecules 2021, 26, 4313. [Google Scholar] [CrossRef]
  21. Szymczyk, K.; Zdziennicka, A.; Jańczuk, B.; Wójcik, W. The properties of mixtures of two cationic surfactants in water at water/air interface. Coll. Surf. A 2005, 264, 147–156. [Google Scholar] [CrossRef]
  22. Szymczyk, K.; Jańczuk, B. The adsorption at solution-air interface and volumetric properties of mixtures of cationic and nonionic surfactants. Coll. Surf. A 2007, 293, 39–50. [Google Scholar] [CrossRef]
  23. Wüstneck, R.; Miller, R. The adsorption behavior of solutions containing sodium dodecyl sulfate and different n-alkanols. Coll. Surf. 1990, 47, 15–21. [Google Scholar]
  24. Radke, C.J. Gibbs adsorption equation for planar fluid–fluid interfaces: Invariant formalism. Adv. Coll. Interface. Sci. 2015, 222, 600–614. [Google Scholar] [CrossRef] [Green Version]
  25. Szymczyk, K.; Jańczuk, B. The properties of a binary mixture of nonionic surfactants in water at the water/air interface. Langmuir 2007, 23, 4972–4981. [Google Scholar] [CrossRef] [PubMed]
  26. Zdziennicka, A. Surface behavior of Triton X-165 and short chain alcohol mixtures. Langmuir 2010, 23, 1860–1869. [Google Scholar] [CrossRef]
  27. Rosen, J.M.; Hua, X.Y. Surface concentrations and molecular interactions in binary mixtures of surfactants. J. Coll. Interface Sci. 1982, 86, 164–172. [Google Scholar] [CrossRef]
  28. Szymczyk, K.; Jańczuk, B. Wetting behavior of aqueous solutions of binary surfactant mixtures to poly(terafluoroethylene). J. Adhesion Sci. Technol. 2008, 22, 1145–1157. [Google Scholar] [CrossRef]
  29. Szymczyk, K. The properties of binary mixtures of ethoxylated octyl phenols with ethoxylated fluorinated alkanols at the water/air interface. J. Surf. Deterg. 2011, 14, 415–423. [Google Scholar] [CrossRef]
  30. Taraba, A.; Szymczyk, K. Study of the influence of the binary mixtures of fluorocarbon surfactants on the surface tension of water. Ann. Chem. Sect. AA 2017, 72, 111–120. [Google Scholar] [CrossRef]
  31. Szymczyk, K.; Zdziennicka, A.; Krawczyk, J.; Jańczuk, B. Behaviour of cetyltrimethylammonium bromide, Triton X-100 and Triton X-114 in mixed monolayer at the (water–air) interface. J. Chem. Thermod. 2014, 69, 85–92. [Google Scholar] [CrossRef]
  32. Zdziennicka, A.; Szymczyk, K.; Krawczyk, J.; Jańczuk, B. Activity and thermodynamic parameters of some surfactants adsorption at the water–air interface. Fluid Phase Equilib. 2012, 318, 25–33. [Google Scholar] [CrossRef]
  33. Fowkes, F.M. Attractive forces at interfaces. Ind. Eng. Chem. 1964, 56, 40–52. [Google Scholar] [CrossRef]
  34. van Oss, C.J.; Constanzo, P.M. Adhesion of anionic surfactants to polymer surfaces and low-energy materials. J. Adhes. Sci. Technol. 1992, 4, 477–487. [Google Scholar] [CrossRef]
  35. van Oss, C.J. Interfacial Forces in Aqueous Media; Marcel Dekker: New York, NY, USA, 1994. [Google Scholar]
  36. van Oss, C.J.; Good, R.J. Surface tension and the solubility of polymers and biopolymers: The role of polar and apolar interfacial free energies. J. Macromol. Sci. Chem. 1989, 26, 1183–1203. [Google Scholar] [CrossRef]
  37. van Oss, C.J.; Chaudhury, M.K.; Good, R.J. Monopolar surfaces. Adv. Coll. Interface Sci. 1987, 28, 35–64. [Google Scholar] [CrossRef]
  38. Fowkes, F.M. Dispersion force contributions to surface and interfacial tensions, contact angles, and heats of immersion. Adv. Chem. Ser. 1964, 43, 99–111. [Google Scholar]
  39. Kwok, D.Y.; Neumann, A.W. Contact angle measurement and contact angle interpretation. Adv. Coll. Interface Sci. 1999, 81, 167–249. [Google Scholar] [CrossRef]
  40. Jańczuk, B.; Wójcik, W.; Zdziennicka, A. Determination of the components of the surface tension of some liquids from interfacial liquid-liquid tension measurements. J. Coll. Interface Sci. 1993, 157, 384–393. [Google Scholar] [CrossRef]
  41. Zdziennicka, A.; Krawczyk, J.; Szymczyk, K.; Jańczuk, B. Components and parameters of liquids and some polymers surface tension at different temperature. Coll. Surf. A 2017, 529, 864–875. [Google Scholar] [CrossRef]
  42. Szymczyk, K. Wettability of polymeric solids by ternary mixtures composed of hydrocarbon and fluorocarbon nonionic surfactants. J. Coll. Interface Sci. 2011, 363, 223–231. [Google Scholar] [CrossRef]
  43. Szymczyk, K.; Zdziennicka, A.; Jańczuk, B. Properties of some nonionic fluorocarbon surfactants and their mixtures with hydrocarbon ones. Adv. Coll. Interf. Sci. 2021, 292, 102421. [Google Scholar] [CrossRef]
  44. Zdziennicka, A.; Jańczuk, B. Modification of adsorption, aggregation and wetting properties of surfactants by short chain alcohols. Adv. Colloid Interface Sci. 2020, 284, 102249. [Google Scholar] [CrossRef] [PubMed]
  45. El, D.I.; Eini, B.; Barry, W.; Rhodes, J. Micellar size, shape, and hydration of long-chain polyoxyethylene nonionic surfactants. J. Coll. Interface Sci. 1976, 54, 348–351. [Google Scholar]
  46. Javadian, S.; Kakemam, J. Intermicellar interaction in surfactant solutions; a review study. J. Mol. Liq. 2017, 242, 115–128. [Google Scholar] [CrossRef]
  47. Butler, J.A.V. The Thermodynamics of the Surfaces of the Solutions. Proc. Roy. Soc. Ser. A 1392, 138, 348–375. [Google Scholar]
  48. De Boer, J.H. The Dynamic Character of Adsorption; Oxford University: Oxford, UK, 1953. [Google Scholar]
  49. Szymczyk, K.; Zdziennicka, A.; Jańczuk, B. Effect of fluorocarbon surfactants on the adsorption of hydrocarbon surfactants mixture at the water-air interface. J. Mol. Liq. 2022, 345, 117832. [Google Scholar] [CrossRef]
Figure 1. A plot of the surface tension ( γ L V ) of the aqueous solutions of CTAB (a) and CPyB (b) vs. the logarithm of their concentration ( l o g C ). Points 1 correspond to the measured values [32], curves 2 and 3 correspond to the values calculated from the exponential function of the second order (Equation (2)) and Szyszkowski equation (Equation (3)), respectively.
Colloids 05 00053 g001
Figure 2. A plot of the surface tension ( γ L V ) of the aqueous solutions of SDDS (a) and SDS (b) vs. the logarithm of their concentration ( l o g C ). Points 1 correspond to the measured values [28,32], curves 2 and 3 correspond to the values calculated from the exponential function of the second order (Equation (2)) and Szyszkowski equation (Equation (3)), respectively.
Colloids 05 00053 g002
Figure 3. A plot of the surface tension ( γ L V ) of the aqueous solutions of TX100 (a), TX114 (b) and TX165 (c) vs. the logarithm of their concentration ( l o g C ). Points 1 correspond to the measured values [32], curves 2 and 3 correspond to the values calculated from the exponential function of the second order (Equation (2)) and Szyszkowski equation (Equation (3)), respectively.
Colloids 05 00053 g003aColloids 05 00053 g003b
Figure 4. A plot of the surface tension ( γ L V ) of the aqueous solutions of FC1 (a) and FC2 (b) vs. the logarithm of their concentration ( l o g C ). Points 1 correspond to the measured values [30], curves 2 and 3 correspond to the values calculated from the exponential function of the second order (Equation (2)) and Szyszkowski equation (Equation (3)), respectively.
Colloids 05 00053 g004aColloids 05 00053 g004b
Figure 5. A plot of the surface tension ( γ L V ) of the aqueous solutions of CTAB+CPyB mixtures at the CTAB mole fraction in the bulk phase ( α ) equal to 0.2 (a), 0.4 (b), 0.6 (c) and 0.8 (d) vs. the logarithm of the mixture concentration ( l o g C 12 ). Points 1 correspond to the measured values [21], curves 2–6 correspond to the values calculated from the exponential function of the second order (Equation (2)), Szyszkowski equation (Equation (3)), Fainerman and Miller equation (Equation (11)), independent adsorption (Equation (10)) and Joos equation (Equation (13)), respectively.
Colloids 05 00053 g005aColloids 05 00053 g005b
Figure 6. A plot of the surface tension ( γ L V ) of the aqueous solutions of SDDS+SDS mixtures at the SDDS mole fraction in the bulk phase ( α ) equal to 0.2 (a), 0.4 (b), 0.6 (c) and 0.8 (d) vs. the logarithm of the mixture concentration ( l o g C 12 ). Points 1 correspond to the measured values [28], curves 2–6 correspond to the values calculated from the exponential function of the second order (Equation (2)), Szyszkowski equation (Equation (3)), Fainerman and Miller equation (Equation (11)), independent adsorption (Equation (10)) and Joos equation (Equation (13)), respectively.
Colloids 05 00053 g006aColloids 05 00053 g006b
Figure 7. A plot of the surface tension ( γ L V ) of the aqueous solutions of TX100+TX165 mixtures at the TX100 mole fraction in the bulk phase ( α ) equal to 0.2 (a), 0.4 (b), 0.6 (c) and 0.8 (d) vs. the logarithm of the mixture concentration ( l o g C 12 ). Points 1 correspond to the measured values [22], curves 2–6 correspond to the values calculated from the exponential function of the second order (Equation (2)), Szyszkowski equation (Equation (3)), Fainerman and Miller equation (Equation (11)), independent adsorption (Equation (10)) and Joos equation (Equation (13)), respectively.
Colloids 05 00053 g007aColloids 05 00053 g007b
Figure 8. A plot of the surface tension ( γ L V ) of the aqueous solutions of FC1+FC2 mixtures at the FC2 mole fraction in the bulk phase ( α ) equal to 0.2 (a), 0.4 (b), 0.6 (c) and 0.8 (d) vs. the logarithm of the mixture concentration ( l o g C 12 ). Points 1 correspond to the measured values [30], curves 2–6 correspond to the values calculated from the exponential function of the second order (Equation (2)), Szyszkowski equation (Equation (3)), Fainerman and Miller equation (Equation (11)), independent adsorption (Equation (10)) and Joos equation (Equation (13)), respectively.
Colloids 05 00053 g008aColloids 05 00053 g008b
Figure 9. A plot of the surface tension ( γ L V ) of the aqueous solutions of CTAB+TX100 mixtures at the CTAB mole fraction in the bulk phase ( α ) equal to 0.2 (a), 0.4 (b), 0.6 (c) and 0.8 (d) vs. the logarithm of the mixture concentration ( l o g C 12 ). Points 1 correspond to the measured values [22], curves 2–6 correspond to the values calculated from the exponential function of the second order (Equation (2)), Szyszkowski equation (Equation (3)), Fainerman and Miller equation (Equation (11)), independent adsorption (Equation (10)) and Joos equation (Equation (13)), respectively.
Colloids 05 00053 g009aColloids 05 00053 g009b
Figure 10. A plot of the surface tension ( γ L V ) of the aqueous solutions of SDDS+TX100 mixtures at the TX100 mole fraction in the bulk phase ( α ) equal to 0.2 (a), 0.4 (b), 0.6 (c) and 0.8 (d) vs. the logarithm of the mixture concentration ( l o g C 12 ). Points 1 correspond to the measured values [28], curves 2–6 correspond to the values calculated from the exponential function of the second order (Equation (2)), Szyszkowski equation (Equation (3)), Fainerman and Miller equation (Equation (11)), independent adsorption (Equation (10)) and Joos equation (Equation (13)), respectively.
Colloids 05 00053 g010aColloids 05 00053 g010b
Figure 11. A plot of the surface tension ( γ L V ) of the aqueous solutions of FC1+TX165 mixtures at the FC1 mole fraction in the bulk phase ( α ) equal to 0.2 (a) and 0.8 (b) as well as FC2+TX100 mixtures at the FC2 mole fraction in the bulk phase equal to 0.2 (c) and 0.8 (d) vs. the logarithm of the mixture concentration ( l o g C 12 ). Points 1 correspond to the measured values [29], curves 2–6 correspond to the values calculated from the exponential function of the second order (Equation (2)), Szyszkowski equation (Equation (3)), Fainerman and Miller equation (Equation (11)), independent adsorption (Equation (10)) and Joos equation (Equation (13)), respectively.
Colloids 05 00053 g011aColloids 05 00053 g011b
Figure 12. A plot of the surface tension ( γ L V ) of the aqueous solutions of CTAB(0.3)+TX100(0.5)+TX114(0.2) (a), CTAB(0.25)+TX100(0.25)+TX114(0.5) (b) CTAB(0.5)+TX100(0.25)+TX114(0.25) (c) mixtures vs. the logarithm of their concentration ( l o g C 123 ). Points 1 correspond to the measured values [31], curves 2–6 correspond to the values calculated from the exponential function of the second order (Equation (2)), Szyszkowski equation (Equation (3)), Fainerman and Miller equation (Equation (11)), independent adsorption (Equation (15)) and Joos equation (Equation (13)), respectively.
Colloids 05 00053 g012aColloids 05 00053 g012b
Figure 13. The plot of the surface tension ( γ L V ) of the aqueous solutions of FC1+FC2+SDDS (a) and CTAB+TX100+FC1 (b) mixtures vs. the logarithm of their concentration ( l o g C 123 ). Points 1 correspond to the measured values [49], curves 2–6 correspond to the values calculated from the exponential function of the second order (Equation (2)), Szyszkowski equation (Equation (3)), Fainerman and Miller equation (Equation (11)), independent adsorption (Equation (15)) and Joos equation (Equation (13)), respectively.
Colloids 05 00053 g013
Table 1. The components and parameters of the surface tension of water, CTAB, CPyB, SDS, SDDS, TX100, TX114, TX165, FC1 and FC2 (mN/m) [43,44].
Substance γ L W γ + γ γ A B γ
Water21.8025.5025.5051.0072.80
26.8522.97522.97545.9572.80
CTAB tail27.000.000.000.0027.00
CTAB head41.3558.450.000.0041.35
CPyB tail27.000.000.000.0027.00
CPyB head39.2460.200.000.0039.24
SDDS tail25.100.000.000.0025.10
SDDS head28.050.1548.795.4133.46
SDS tail23.900.000.000.0023.90
SDS head28.050.1548.795.4133.46
TX100 tail22.000.000.000.0022.00
TX100 head21.301.4349.1016.7638.07
TX114 tail22.000.000.000.0022.00
TX114 head21.001.5148.757.1638.16
TX165 tail22.000.000.000.0022.00
TX165 head27.700.3350.208.1435.84
FC1 tail11.910.000.000.0011.91
FC1 head27.700.3350.208.1435.84
FC2 tail9.890.000.000.009.89
FC2 head21.301.4349.1016.7638.06
Table 2. The values of standard Gibbs free energy of adsorption of surfactants at the water–air interface ( Δ G a d s 0 ) calculated from Equation (4) on the basis the constant a in the Szyszkowski and Joos equations as well as calculated from Equation (7) and taken from the literature.
Δ G a d s 0   [ kJ / mol ]
SurfactantSzyszkowski
Equation
Equation (7)Joos EquationLiterature Data
CTAB−31.92−32.45−28.82−32.00 [27]
CPyB−33.69−34.03−30.62−32.45 [27]
TX 100−43.16−43.33−39.02−44.55 [27]
TX 114−47.31−47.59−39.12−43.70 [27]
TX 165−45.25−43.81−30.56−44.00 [27]
SDDS−26.64−26.86−23.73−26.05 [27]
SDS−25.18−25.36−21.96−29.81 [3]
FC1−45.17−45.67−43.03−45.17 [38]
FC2−43.02−43.03−39.33−43.02 [38]
Publisher’s Note: MDPI stays neutral with regard to jurisdictional claims in published maps and institutional affiliations.

