Article

Explainable Stacked Ensemble Deep Learning (SEDL) Framework to Determine Cause of Death from Verbal Autopsies

by
Michael T. Mapundu
1,*,†,‡,
Chodziwadziwa W. Kabudula
1,2,‡,
Eustasius Musenge
1,‡,
Victor Olago
3,‡ and
Turgay Celik
4,5
1
School of Public Health, Department of Epidemiology and Biostatistics, University of the Witwatersrand, Johannesburg 2193, South Africa
2
MRC/Wits Rural Public Health and Health Transitions Research Unit (Agincourt), University of the Witwatersrand, Johannesburg 1360, South Africa
3
National Health Laboratory Service (NHLS), National Cancer Registry, Johannesburg 2131, South Africa
4
Wits Institute of Data Science, University of the Witwatersrand, Johannesburg 2000, South Africa
5
School of Electrical and Information Engineering, University of the Witwatersrand, Johannesburg 2000, South Africa
*
Author to whom correspondence should be addressed.
27 St Andrews, Parktown, Johannesburg 2193, South Africa.
These authors contributed equally to this work.
Mach. Learn. Knowl. Extr. 2023, 5(4), 1570-1588; https://doi.org/10.3390/make5040079
Submission received: 9 August 2023 / Revised: 17 October 2023 / Accepted: 21 October 2023 / Published: 25 October 2023
(This article belongs to the Special Issue Advances in Explainable Artificial Intelligence (XAI): 2nd Edition)

Abstract

:
Verbal autopsies (VA) are commonly used in Low- and Medium-Income Countries (LMIC) to determine cause of death (CoD) where death occurs outside clinical settings, with the most commonly used international gold standard being physician medical certification. Interviewers elicit information from relatives of the deceased, regarding circumstances and events that might have led to death. This information is stored in textual format as VA narratives. The narratives entail detailed information that can be used to determine CoD. However, this approach still remains a manual task that is costly, inconsistent, time-consuming and subjective (prone to errors), amongst many drawbacks. As such, this negatively affects the VA reporting process, despite it being vital for strengthening health priorities and informing civil registration systems. Therefore, this study seeks to close this gap by applying novel deep learning (DL) interpretable approaches for reviewing VA narratives and generate CoD prediction in a timely, easily interpretable, cost-effective and error-free way. We validate our DL models using optimisation and performance accuracy machine learning (ML) curves as a function of training samples. We report on validation with training set accuracy (LSTM = 76.11%, CNN = 76.35%, and SEDL = 82.1%), validation accuracy (LSTM = 67.05%, CNN = 66.16%, and SEDL = 82%) and test set accuracy (LSTM = 67%, CNN = 66.2%, and SEDL = 82%) for our models. Furthermore, we also present Local Interpretable Model-agnostic Explanations (LIME) for ease of interpretability of the results, thereby building trust in the use of machines in healthcare. We presented robust deep learning methods to determine CoD from VAs, with the stacked ensemble deep learning (SEDL) approaches performing optimally and better than Long Short-Term Memory (LSTM) and Convolutional Neural Network (CNN). Our empirical results suggest that ensemble DL methods may be integrated in the CoD process to help experts get to a diagnosis. Ultimately, this will reduce the turnaround time needed by physicians to go through the narratives in order to be able to give an appropriate diagnosis, cut costs and minimise errors. This study was limited by the number of samples needed for training our models and the high levels of lexical variability in the words used in our textual information.

1. Introduction

More than 65 percent of the world population lacks high quality information on cause of death (CoD), accounting for two thirds of the sixty million deaths worldwide that are not assigned a medically certified cause [1,2,3]. This information is vital for informing civil registration systems, policies and strengthening health priorities. Most of these deaths are common in Low- and Medium-Income Countries (LMIC) as they occur outside health facilities [4]. As such, the verbal autopsy (VA) tool is used to determine CoD. A VA is a process that entails non-medical personnel interviewing the next of kin of the deceased using a structured questionnaire where they seek to elicit information on circumstances and events that could have led to CoD. The collected information known as VA narratives are then housed as text and given to two medical doctors who determine the probable CoD, and if they do not agree, a third physician is consulted, a process known as physician-coded verbal autopsy (PCVA) [3]. Detailed information on the VA process is reported in [5]. Even though the PCVA is the only gold standard used in CoD decisions, this process is expensive, time-consuming, inconsistent and subjective (prone to errors in information elicitation), amongst many drawbacks.
This has led to alternative novel approaches that use probabilities, tariff scores and statistical operations to get to the CoD [6,7]. These approaches are known as computer-coded verbal autopsy (CCVA). Recent studies have mainly focussed on statistical approaches that seek to investigate CoD determination using VA narratives by employing CCVA approaches [7,8,9,10,11]. Nevertheless, these approaches perform poorly because of the unstructured narratives that they take as input for CoD classification. Therefore, the CCVA approaches cannot be applied to guide health priorities as they fail to avail enough evidence where there is limited expert diagnosis [1]. On the other hand, there have been efforts to apply machine learning (ML) approaches, which have shown better results than the CCVA approach. Considerable research was conducted by applying various shallow ML algorithms that are trained on very high dimensional (where there are many predictors and outcome variables) and sparse features (predictors and outcome variables are not within the same scale) to obtain meaningful information from the VA narratives [3,12,13,14,15,16,17,18,19,20]. Most of these ML techniques perform poorly because of high-dimensionality data caused by a lack of feature scaling, missing effective feature engineering techniques, ineffective preprocessing strategies and a lack of data balancing.
Advances in technology, specifically in ML and natural language processing (NLP), have availed new opportunities and proficiencies in the processing and classification of textual narratives. In this study, we present novel robust DL architectures that use NLP, specifically tailored to effectively process VA narratives and predict probable CoD.
Furthermore, we aim to assess the potential impact of the DL methods in healthcare and mortality assessments. In so doing, we will be able to enhance CoD prediction accuracy by leveraging the advanced capabilities of ensemble DL approaches as compared with the existing baseline methods reported in [21]. Our DL methods will further give us insights into how it arrived at a CoD prediction, a step crucial for enforcing transparency and trustworthiness in the use of AI in disease diagnosis in the public health space. As such, this will allow us to explore the potential application of the SEDL in the real world, opening avenues for assessing its applicability beyond this study’s context, such as different populations, regions and datasets, and consequently discovering new knowledge and presenting valuable insights and semantic relationships between the VA narratives and their corresponding probable CoD.
Even though DL techniques are more accurate in terms of prediction, they have a limitation in terms of complexity and model interpretability (understanding how the model performed in the way it did). Despite these challenges, DL has shown promising results because of its efficiency, superior performance, integrated feature learning and effective capabilities of attaining end-to-end learning from complex and multi-modality data [22]. Conversely, conventional statistical and ML techniques require firstly to perform feature engineering to attain effective and robust features representative of the data and then build predictive models. There is scant literature, especially on applying advanced ML techniques known as DL models as approaches to solving VA problems.
This study enhances the transparency, trustworthiness and accountability in the use of AI-driven healthcare applications. Integrating such an explainable system in CoD diagnosis will minimise diagnosis errors, reduce bias and improve diagnosis turnaround time and cut costs, amongst many benefits. As such, it will enforce effective collaborations on the use of AI systems in aiding human interpretation and annotation of disease diagnosis, thus improving the quality of VA reporting and decision making, which is key in informing civil registration systems and strengthening health priorities.

2. Deep Learning in VA

DL functionalities, such as automated feature extraction and engineering, have triggered the application of automated diagnosis systems, something that was initially impossible with conventional ML approaches [23]. DL has produced good results and has already been applied in the health domain as in the work of [24,25,26,27]. Other studies by [27,28,29] also show the positive results of DL approaches. Ref. [30] pointed out that the DL approaches can improve ML results in various fields, such as speech recognition, drug discovery and object detection, amongst many. Moreover, DL models with optimal hidden layers have been developed to reveal information not easily detectable with traditional statistical and ML models. These DL architectures can achieve learning of data representation with varying levels of data abstraction when even computational techniques use few processing layers [31]. Feature engineering in DL to extract, represent and select features is performed using an end-to-end system that learns in an automated fashion from training data. Therefore, these advanced approaches can be relevant in VA data with high-dimensional sparse data.
Initially, the Convolutional Neural Network (CNN) architecture was used for image recognition using multiple data arrays. Nevertheless, further inquiries with this architecture showed better results when used for text classification using one-dimensional data structures and character levels [29,32]. Various researchers applied the basic Recurrent Neural Network (RNN), with some investigators modifying the approach for sentiment analysis and producing good results [33,34,35,36,37,38]. Other work by [30,39] used a fusion of a CNN and RNN and attained good results using a hierarchical implementation. Ref. [40] investigated a multitask learning model for CoD classification. They used a CNN and Linear Discriminant Analysis (LDA) for topic segmentation. The predicted key phrase clusters outperformed the LDA and CNN models in extracting keywords from the VA data. They employed a CNN feed-forward network that took the input of word embeddings, using 10-fold cross validation for optimisation, to generate distinct LDA topics. They attained a precision of 0.779, a recall of 0.778 and an F1-score of 0.774. However, they used a small dataset and had word clusters that were more frequent and longer than others, creating non-representative features. Ref. [41] also explored character embeddings on VA data to try and establish if their approach could improve CoD classification. They used four datasets with varying disease categories and deduced that character information improves accuracy when used with smaller datasets as the models can handle unknown words and different forms of spelling. They reported a significant improvement using models, such as a CNN. However, their study only used small datasets of less than 1000 cases, which varied in size. Ref. [42] used DL interpretable methods to extract the CoD from VAs by applying logistic regression, Bayes classifier, random forest ensemble and two variants of RNN DL architectures. Their experiments used three datasets, but high scores were attained only for the DL architecture on the neonatal dataset with a precision of 63.2%, an accuracy of 63.0%, a recall of 63.0% and an F-score of 61.3%.
Ref. [43] experimented on the prediction of death status on treatment course in SARS-COV-2 patients using DL and ML methods and reported an accuracy of 97.15% on the DL approaches and 92.15% for random forest, 93.4% for k-nearest neighbour and 99.7% for the ensemble classifier XGBoost. Ref. [44] performed an analysis of railway accident narratives using DL distributed vector representations and a RNN and CNN. They achieved a high accuracy of 75 % and an F-score of 0.65 using word2vec as the distributed vector representation of words and a CNN.

2.1. Ensemble DL

Apart from the conventional DL approaches discussed above, there have been studies that applied what are known as ensemble DL approaches (combination of several individual models) in a quest to attain a better generalisation performance. Ensemble DL makes use of an averaging or voting process of the combined models to get to a final model prediction. Ref. [23] conducted a study where they applied SEDL using the CNN for paediatric pneumonia diagnosis by using chest X-ray images. They combined conventional traditional ML approaches with DL approaches. They reported an accuracy of 98.3%, a precision of 99.29%, a recall of 98.36%, an F1-score of 98.83% and an AUC of 98.24%. They concluded that their stacked ensemble models attained optimal model performance and the findings can be used to assist clinicians in the diagnosis process. Similar work was reported in [45], which pointed out the robustness of ensemble classifiers on attaining high model performance. However, they highlighted the importance of addressing class imbalance for improved results. Ref. [46] conducted a study on the application of ensemble DL for COVID-19 case detection using chest X-ray images. They attained an accuracy of 95% and reported that ensemble classifiers can yield better performance. Nevertheless, they pointed out the need to have more data points for model improvement. Ref. [47] conducted a review on the various types of ensemble DL approaches and reported that ensemble approaches are better in terms of model performance. However, they argued that these DL models are difficult to train with smaller training samples, they are complex in nature and selecting models to include in the ensemble architecture is also a challenge. The authors further pointed out that there is a need for researchers to investigate how best to find a strategy to define the number of base learners to be included in the architecture, find a criterion for model selection and combine different fusion strategies. Ref. [23] argued that stacking is one effective ensemble DL approach, which entails creating a stack of predictions from base classifiers, also known as individual classifiers. These predictions on base classifiers are used as features, which are taken as input for training the meta learner, which is the final classifier. This results in model improvement as stacking combines the strengths of the base classifiers. Ref. [48] reported on the application of ensemble DL models for heart disease classification using data from Mexico. They reported on the accuracy and F1-scores within the range of 91% and 96%. They concluded that ensemble DL can attain high model performance, which can be used for real-time reporting and diagnosis in the health space.

2.2. Explainable AI

Although DL methods have shown promising results in various domains, they are difficult to interpret. In other words, it is difficult to tell how a model got to a final prediction due to the complexity. This is the reason why DL models are known as a black box [49,50,51]. As such, this has given rise to the field of Explainable Artificial Intelligence (XAI), which strives to ease DL model interpretability. Ref. [50] pointed out that XAI approaches can be categorised into intrinsic and post hoc. The authors elaborated that intrinsic approaches are easy to understand as to how they got to the decision-making process. On the contrary, post hoc approaches help us understand the context of the input data that leads to a classification decision in any classifier. They usually use visual explanations, local explanations and explanation by simplification, amongst many functionalities. Ref. [52] argued that XAI can be applied in the medical field to aid clinicians in getting to a diagnosis in a way that is transparent, understandable and explainable. This can be effectively implemented only if ML models are able to justify how they arrived at a decision. Additionally, the authors further elaborated that if XAI is employed properly, it will increase the chances of trusting and implementing such strategies within the medical domain. The authors applied XAI to aid in human decision support within the medical space. They applied three different strategies and concluded that if properly implemented and improved, these approaches may prove key in the decision-making process for clinicians. Ref. [49] also supported the above described notion and argued that most of the DL model predictions are black boxes and they lack interpretability on how the model got to a decision. As such, this makes it difficult for the health experts to be able to understand and trust the results generated by ML models, hence the limited use within the public health space. In order to build trust in model predictions, there is a need to incorporate the explainability and interpretation of the results generated by the models. This may position DL models as an encouraging choice in its application and usage in healthcare to improve healthcare outcomes.
In this study, we used Local Interpretable Model-agnostic Explanations (LIME), because it eases interpretability and provides key meaningful information for decision making [51]. The XAI approach gets to a decision based on validating model classifier behaviour in close proximity with the cases to be explained based on the local models, such as logistic regression or decision trees [52]. Ref. [49] pointed out that XAI can be thought of as features that describe how a particular complex model derived its predictions. Therefore, it makes it easier for a user to understand how it got to a decision. XAI highlights the most important and relevant features that it used to get to a prediction. It takes data input from the model whilst observing any prediction changes in its response. Moreover, it generates a prediction explanation of a single case and not the entire dataset using unseen or test data. It uses individual feature prediction probabilities to explain how it arrived at a prediction [49]. As such, the results generated by XAI approaches should be visualised, thus making generalisations of findings easier, specifically in clinical settings. Therefore, this will make the DL approaches more reliable and will thus improve such application acceptance levels in healthcare.
This present study investigated the application of SEDL architectures to determine CoDs from VA narratives. There is limited research in the application of XAI on SEDL architectures, specifically in the VA domain. One notable study [42] used XAI methods; however, they did not employ stacked ensemble approaches. The contribution of the current study is to extend the current XAI research and its application in healthcare in order to build trustworthy and easy-to-understand DL models that are cost-effective, timely, error-free, consistent and accurate in order to improve VA reporting.
In this study, we apply LSTM, a CNN and SEDL to determine easily interpretable CoDs from VA narratives, thus making it easier to understand how the model arrived at its predicted outcome. The XAI DL approaches can therefore be effectively integrated into the process of identifying mortality causes, alongside human annotation and interpretation. This can prove very beneficial for clinicians and other interested researchers.

3. Materials and Methods

This section will describe the methods used in this study.

3.1. Study Design

This study is a retrospective cross-sectional study that uses secondary data analysis. We standardised and normalised our dataset within the Python Spyder environment and created data frames for cleaned VA narratives, model performance and classified VA categories, which are stored within a PostgreSQL version 4.2 Relational Database Management System.

3.2. Study Population

In this study, we used VA data from the Agincourt Health and Demographic Surveillance System (HDSS). The Agincourt HDSS study area came into existence in 1992 and is located in rural northeastern South Africa. Specifically, it is situated in the rural sub-district of Bushbuckridge under the Ehlanzeni District, in the Mpumalanga Province. The Agincourt study area covers approximately 420 km2. According to the Agincourt fact sheet of 2019, the population comprised 116,247 individuals residing in 28 villages with 22,716 households, with 55,961 males, 60,280 females, 11,724 children under 5 years and 928 school-going children aged from 5 to 19 [53].

3.3. Data Source and Description

This study used the Agincourt HDSS dataset for the period of 1993 to 2015. Our DL models specifically used input from VA narratives to predict CoD in twelve disease categories, which were described in the literature [3,9,54,55]. The dataset has 287 columns/features and 16,338 records/observations. We, therefore, used all the symptoms and the VA narrative column as our predictors X and the corresponding doctors diagnosis International Classification of Diseases 10th Revision (ICD-10) code as our target variable Y with 16,338 records.
Table 1 depicts the data labelling as in this study for the twelve disease categories.

3.4. Preprocessing

Preprocessing addressed the data that were incomplete, noisy and inconsistent, through data cleaning, munging, transformation and reduction [56]. Data cleaning was also performed to simplify text by removing meaningless text that was deemed irrelevant for the models. This was achieved by converting text to lower case and removing all punctuation marks, spaces, numbers and special characters. Spelling correction was applied using the TextBlob Python library. Tokenisation was employed to create string tokens by splitting a document. Stopword removal was performed to remove irrelevant words using the NLTK library of English stopwords. Lemmatisation was applied to convert all possible word variations into the root form, known as the lemma. All nulls were dropped to remove bias in the modelling. Feature scaling was performed by using the Python StandardScaler to set the magnitude of our predictors X and response variables Y to be within the same range. To remove bias after exploratory data analysis, we applied data balancing using the Synthetic Minority Oversampling Technique (SMOTE) for our training dataset, as we had imbalanced classes.

3.5. Word Embedding and Representation

In this study, we used the global vector (GloVe) distributed vector word embedding and representation because we aimed to address the issue of complex and high data dimensionality, resulting in a distributed representation of words in low-dimensional space. Distributed vectors mark the beginning of a data processing layer in a DL model and imply that sentences with similar meanings tend to occur in similar contexts. The novel Glove was applied instead of term frequency (TF) and term frequency with inverse document frequency (TF-IDF), because the Glove is robust in discovering relationships as compared with the traditional TF which has common words dominating the vector space and TF-IDF fails to find similarity between words. The Glove is described in detail in [57,58].

3.6. Text Classification with Deep Learning Architectures

In this study, we employed the Long-Term Short Memory (LSTM), CNN and SEDL architectures as our text classification techniques. These approaches are able to deal with the challenge of large vocabularies that are made up of unknown words or out of vocabulary words (words that appear a few times in the test set but are not in the training corpus of words), unlike distributed vector representations. In the literature, they are known as character embeddings because each word is considered as no more than a composition of individual letters [59].

3.6.1. Long-Term Short Memory

LSTM is a variant of the RNN which uses a feed-back loop between layers and thus is dynamic [60]. RNNs are used to process information that is sequential and apply the same operation on each sequential instance. RNNs use input that relies on output of prior steps or previous computational output [61]. They make use of memory from previous computations to effectively process the current tasks. RNNs are made up of three layers: input, hidden layers and output [60]. However, RNNs have issues of learning long distance associations known as the vanishing gradient (where weighted activation function inputs of a neural network increase or decrease whilst the derivative function approaches zero). Consequently, this ultimately affects accuracy and makes it difficult for the architecture to learn and hypertune parameters for optimum results. RNNs are described elsewhere in [59].
One variant of a RNN that overcomes the vanishing gradient issue is LSTM. LSTM has three gates, namely, forget, input and output. It is distinctly efficient as compared with other RNN models in that it can remove information from memory, can save selected information to memory and can focus only on instant important aspects that are relevant [61]. The forget gate differentiates itself from other basic RNN architectures and makes it possible to backpropagate an infinite number of times. Furthermore, it calculates the hidden layer by averaging the three layers [59]. It calculates the hidden state by combining the three gates [59]. Figure 1 depicts the LSTM architecture and the conventional RNN.

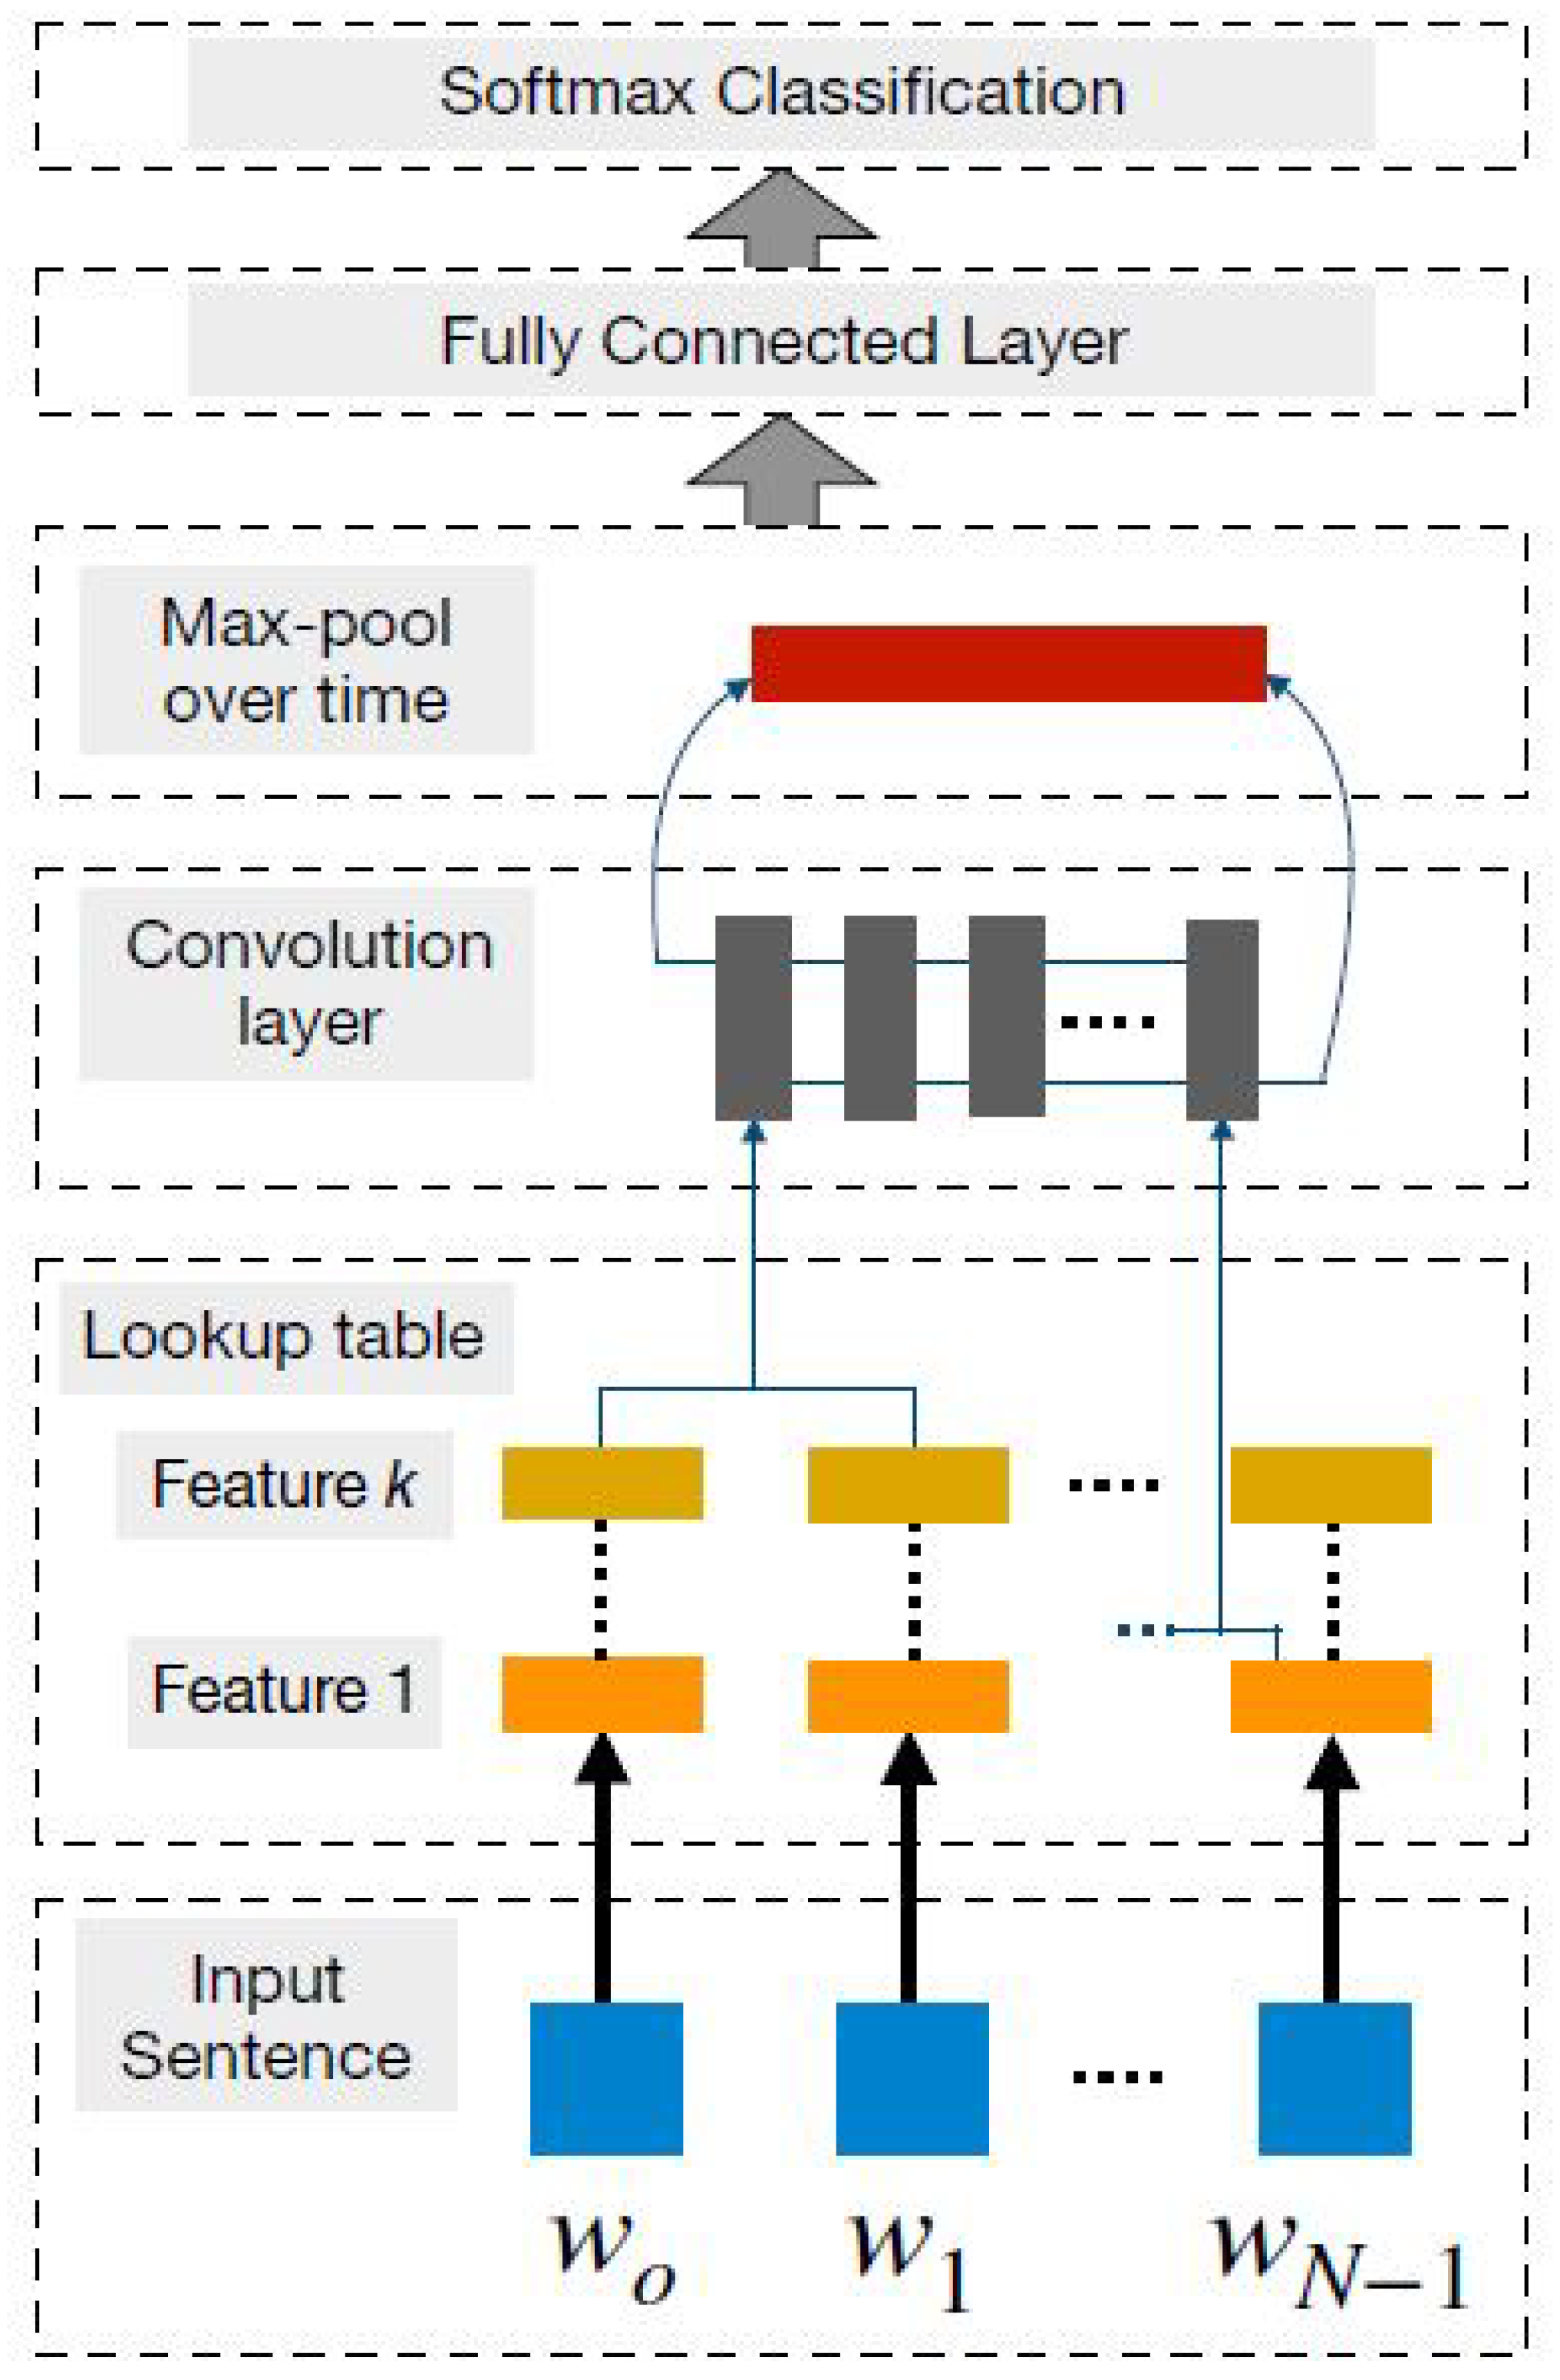
3.6.2. Convolutional Neural Network

The Convolutional Neural Network (CNN) was developed as a feature extraction function to extract high-level features from n-grams, and thus, these features are used for various NLP tasks [59,62,63]. The CNN uses the weight constraint, meaning that a single convolutional layer must have the same weights on the inputs for all the nodes in that layer. As such, this makes the CNN more efficient than training a basic neural network [61]. The CNN is made up of an input layer, convolutional layers, pooling layers, fully connected layers and the softmax function for classification. The functionality of the CNN is described in [59]. Figure 2 illustrates the pictorial representation of the CNN architecture.

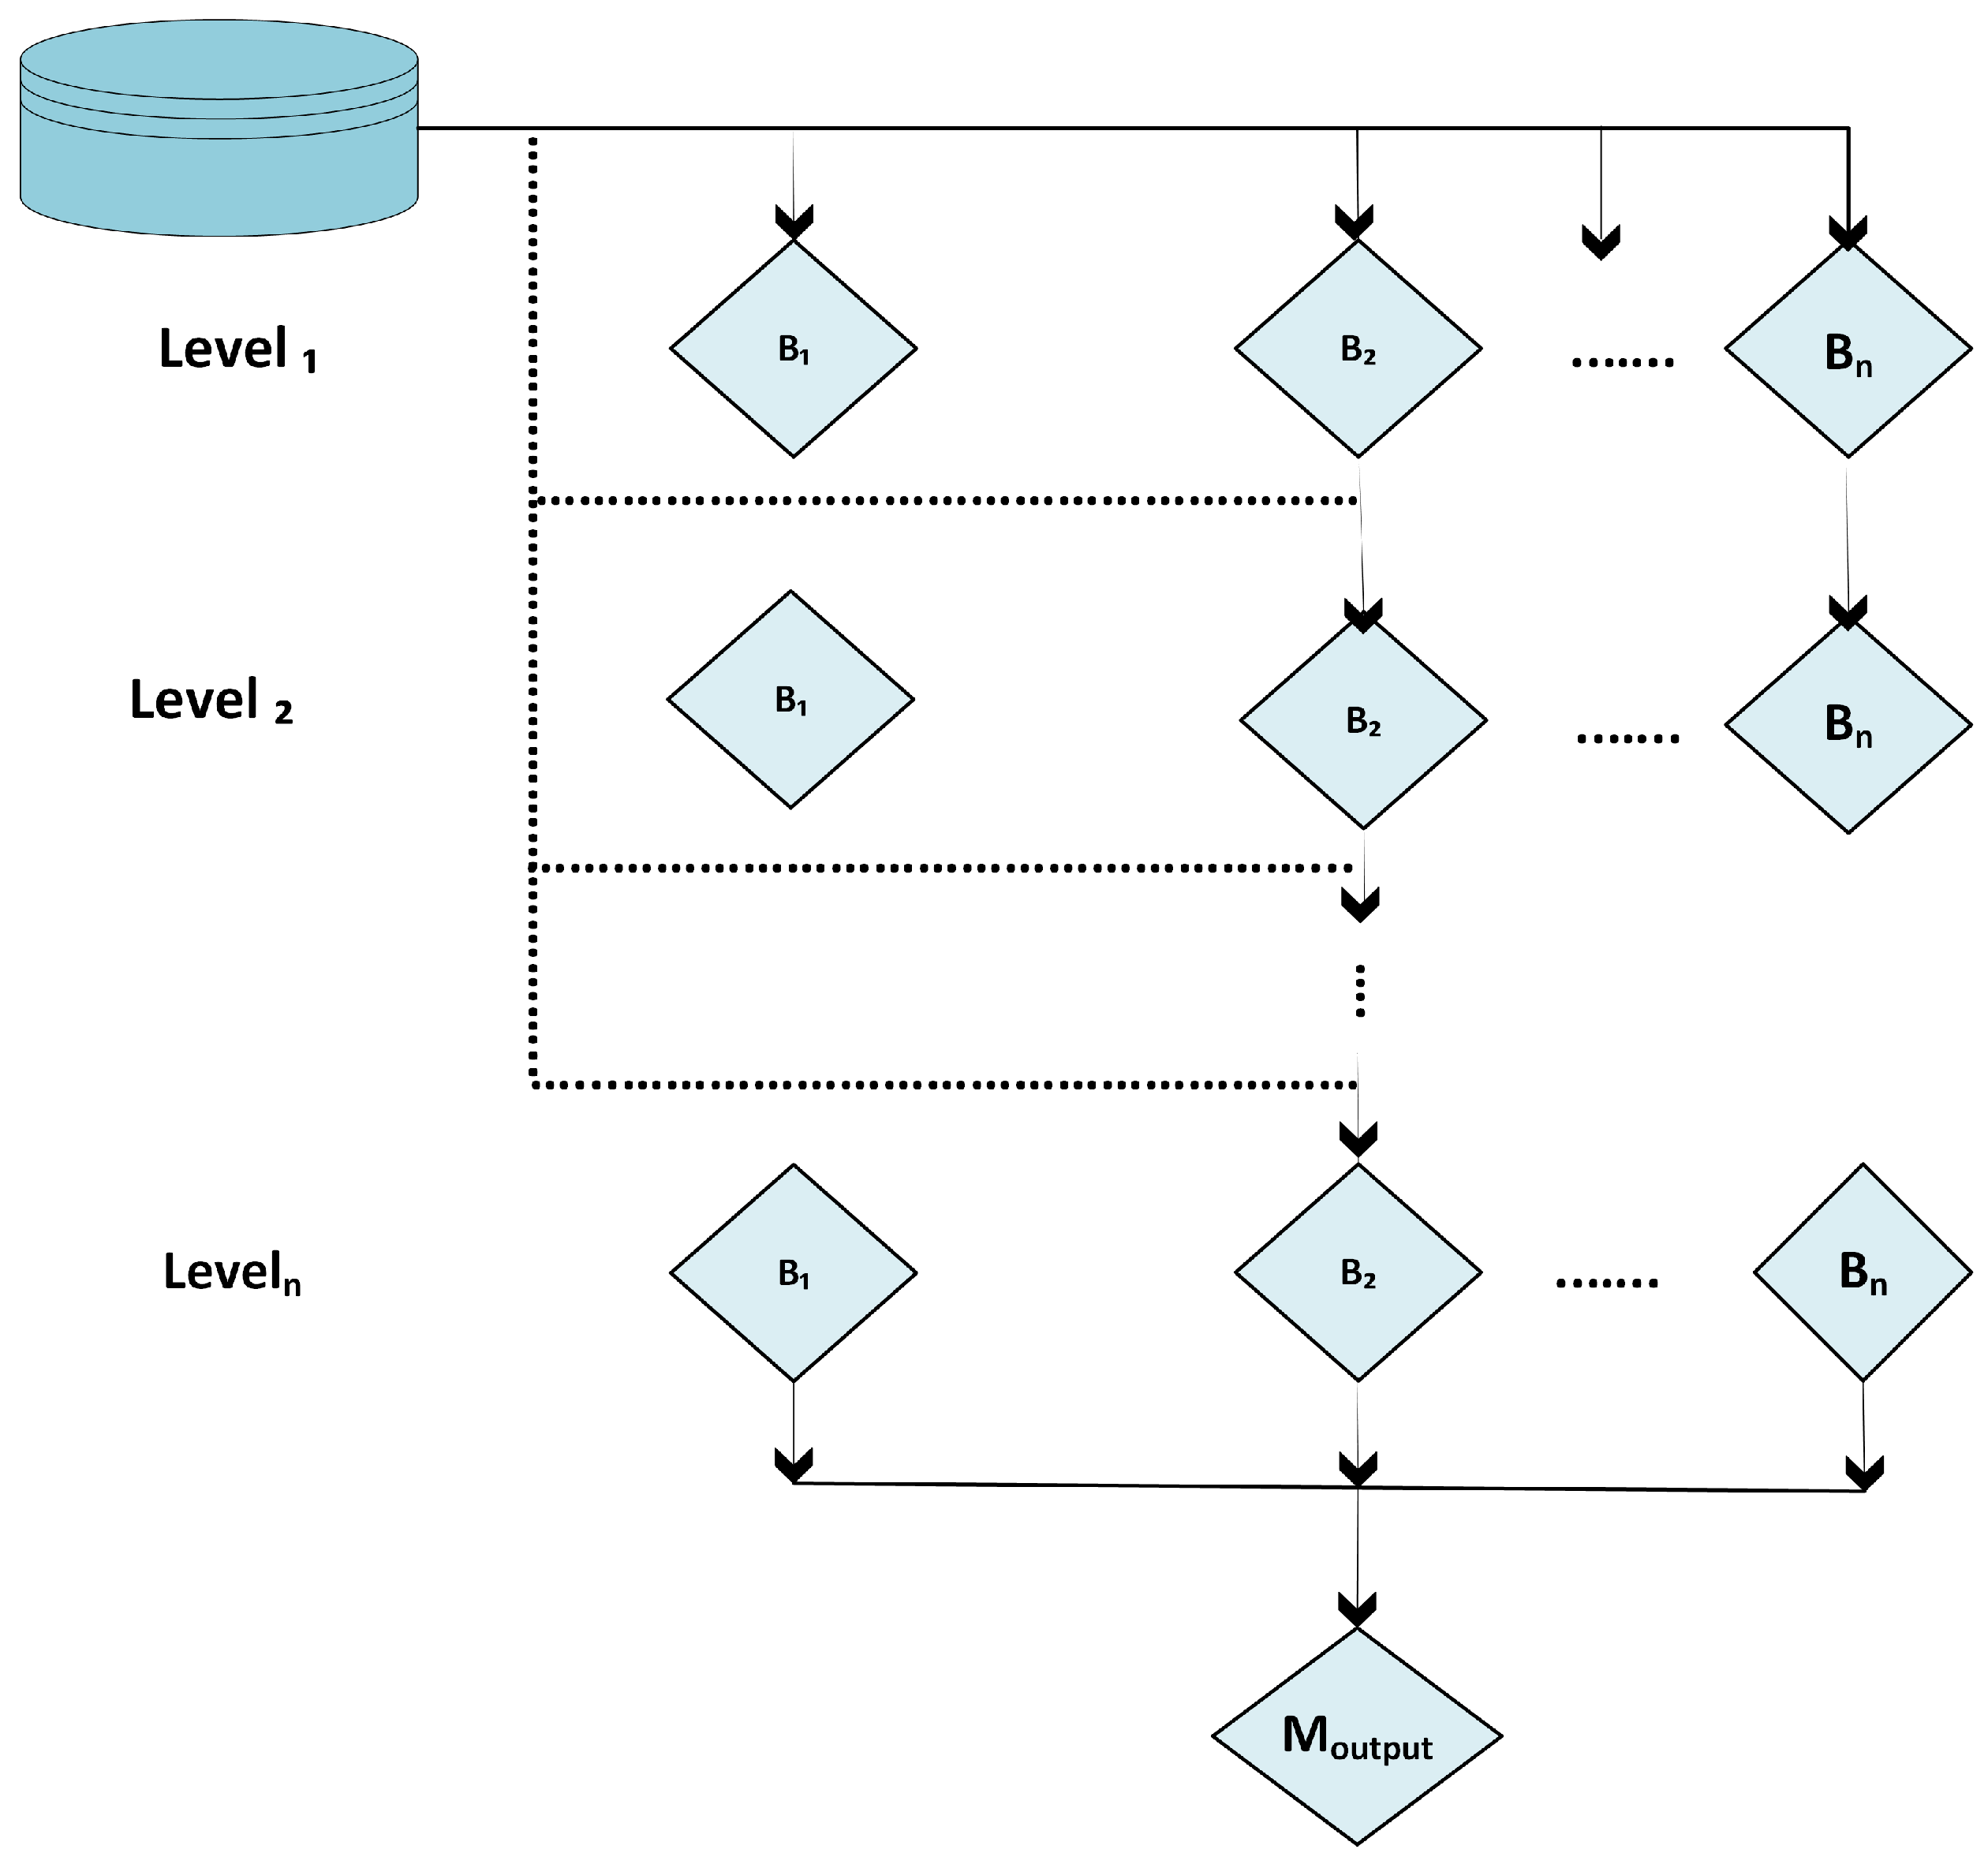
3.7. Stacked Ensemble DL Models

Figure 3 depicts the ensemble DL methods using stacking. We employed various base learners ( B 1 B n ) that go through several iterations ( L e v e l 1 L e v e l n ) and feed into the meta learner ( M o u t p u t ) for the final model prediction. This study employed the stacking ideas formulated in the work of [64]. The dataset was first split into n equal parts, and each n t h -fold cross-validation set was taken for testing and the remainder for training the model. We created pairs of train–test sub-datasets to attain various model predictions that were used as input in our meta model for the final prediction. As such, this approach improves model performance and reduces room for bias in results [47].

3.8. Explainable AI Using LIME

Figure 4 is a visual representation of a general schematic diagram of the implementation of XAI using post hoc explanations by a simplification approach, LIME. We first fed the VA narratives as the input into the black box, SEDL models. This was followed by explaining the model output using the LIME component to provide the CoD diagnosis and explanations to the experts. In this study, we followed the XAI mathematical approach (LIME) reported on in [50,52].

4. Experiments

Deep Learning Models

This section details the distributed word vector representations, DL architectures and Python libraries used in this study. The global vectors (Gloves) were used in order to attain a vectorised representation of words using the Keras Python library, and we re-trained it with our own corpus. We generated a 128-dimension vector for each word using a window size of 5. The input VA narratives were padded to be of the same size of 250 words for all the narratives. As we experimented, it was discovered that changing the dimensions to higher values would not have any significant effect. The CNN architecture was implemented which consisted of four 1D convolutional layers (128, 256, 256 and 512) with corresponding maximum pooling and dropout layers. The kernel size of the convolutional and max pooling layers was set at 3. We had a flattening layer for generating all input of the convolutional layers into a single long feature vector that was connected to the fully connected layer. The fully connected layer was set to 128 units and also used a dropout layer. All the layers used the rectified linear unit (ReLU) activation function except the classification layer, which used softmax. For optimisation, cross entropy for loss was used and adam was used as the optimiser. The model was set to early stopping if there was no further improvement in training.
The RNN implementation using the LSTM variant included two Gated Recurrent layers with 256 and 512 nodes, respectively. The fully connected layer had 12 nodes at the end and also had a dropout layer with the rate set at 0.002 . The classification layer used softmax as the activation function and we optimised using cross entropy for loss and set our optimiser as adam. We also set our model to early stopping if there was no effective further training.
We fine-tuned the batch size and number of epochs as part of batch normalisation where we sought to normalise the distribution of each input dimension of our dataset [65]. Furthermore, we tuned the optimization algorithm used to train the network, each with default parameters. Additionally, we optimised the learning rate which controls how much to update the weight at the end of each batch and the momentum controls how much to let the previous update influence the current weight update. Optimisation was also applied to the selection of network weight initialization by evaluating all of the available techniques. Moreover, we fine-tuned the activation function, which controls the non-linearity of individual neurons and when to fire. The dropout rate fused with the weight constraint were optimised by tuning the dropout rate for regularisation in an effort to limit overfitting and improve the model’s ability to generalise. We further tuned the number of neurons in the hidden layer as a larger network requires more training and at least the batch size and number of epochs should ideally be optimised with the number of neurons.
Our conventional DL models failed to converge, as they failed to attain our optimal model performance set on 80% in our initial work reported in [21]. Therefore, we explored with ensemble DL methods, specifically employing SEDL architectures. A sequential model from the Keras ML library was used. It had one global average pooling layer and four dense layers with 1024, 512, 128, and 64 units, respectively. Additionally, to address model complexity and avoid overfitting, we added dropout layers and employed regularisation using Lasso regularisation. We used adam as our optimiser, set the patience to 3 and used 500 epochs and a batch size of 128. This formed the basis of our base learners, which were made up of 100 members.

5. DL Model Evaluation

In this study, we applied optimisation and performance learning curves to evaluate our DL models, specifically using training and validation datasets to visualise the cross entropy loss and model performance. This was performed in various iterations. We used the optimisation learning curves that depict a training loss and validation loss graph over time. The training loss depicts the extent to which a model is fitting the training data and, on the other hand, the validation loss indicates how well the model fits new unseen data. Performance learning curves which use accuracy as a metric to evaluate models were employed. Training accuracy indicates how well the model fits the training data, whilst validation accuracy denotes the extent to which a model fits new unseen data. Learning curves are described elsewhere in the studies of [61,66,67].
We also report on the accuracy of our models. Accuracy denotes all classes with classified results that have been predicted correctly in fraction terms [18,20]. True Positives (TPs) and True Negatives (TNs) represent the number of outcomes in which our prediction model correctly classifies positive and negative cases, respectively. In our study, TP denotes predicted positive VA narratives with a particular disease category from the twelve classes and are actually positive, while TN denotes predicted negative VA narratives with a particular disease category from the twelve classes and are actually negative. Conversely, False Positives (FPs) and False Negatives (FNs) denote the number of outcomes where our models incorrectly predicted the positive and negative classes. In our case, the FPs imply predicted positive VA narratives with a particular disease category from the twelve classes but are actually negative, and FN depicts the predicted negative VA narratives with a particular disease category from the twelve classes but are actually positive. The mathematical approach of accuracy is given by
A c c u r a c y = T P + T N T P + F P + T N + F N

6. Results

In this section, we discuss the results attained from our DL models in the classification of VA narratives into twelve disease categories.
We removed 2247 VA narratives that had null values and were left with 14,091 cases of textual information that were fed into our DL models. We also dropped 5170 target outcome values that were also missing. The longest narrative had 715 words, and thus 3949 characters. On the contrary, the shortest narrative had seven words, and thus 55 characters. Generally our narratives had a mean sentence length of 99.76 words.
Twelve disease classes with 3388 samples each for our training dataset were created after data balancing using SMOTE. This implied that the majority of classes had more data points compared with other minority classes that were less represented in terms of the data samples. Models that lack proper implementation of these data handling strategies usually suffer from model bias and can cause huge misclassification errors and misinterpretations.
Each VA narrative was taken as a single short document that is made up of a sequence of words. These sequences of words are unigrams (n = 1) and bigrams (n = 2) that were taken as input by our DL architectures for predicting the probable CoD into any of the twelve disease categories (target class). We sought to predict the values of our target features for the test set as unseen data. These text sequences were converted into numeric vector representations of word embeddings using global vectors (Gloves) where our models applied mathematical operations for prediction.

6.1. Model Performance

Table 2 below presents our performance evaluation metrics for the three DL architectures (LSTM, CNN and SEDL) attained by employing optimisation and performance ML curves. SEDL outperformed LSTM and the CNN in disease classification. Our ML curve depicts SEDL achieving a training accuracy of 82.1 % , as compared with LSTM at 76.11 % and the CNN at 76.35 % . In terms of validation accuracy, SEDL achieved 82 % , compared with LSTM and the CNN that attained 67.05 % and 66.16 % , respectively. A test accuracy of 82 % , 67 % and 66.2 % for SEDL, LSTM and the CNN was achieved, respectively. In terms of test loss, SEDL attained 1.15 % , LSTM 11.95 % and the CNN 12.64 % . SEDL, LSTM and the CNN were, respectively, approximately 82%, 67% and 66.2% accurate. This implies that all three models predicted the class correctly for 82%, 67% and 66.2% of the samples in the test dataset.
Figure 5 and Figure 6 depict the DL model performances using learning curves. Our DL models were able to generalise well on new unseen data. This implies that our models are able to make accurate predictions on new data, illuminating the same characteristics of the training data. In order to be able to generalise with our models and avoid overfitting and underfitting, we reduced the model complexity by using dropout (20%). We also used early stopping (monitor = validation loss), patience (3) and the minimum delta (0.001%) to force the model to stop when there was no further model improvement. The small variance between our validation and test accuracies denotes a good fit of our models.
Figure 7 and Figure 8 show a learning curve performance evaluation of the stacked ensemble model. The variance between the train and test curve is minimal and thus shows that we did not have any underfitting or overfitting in our ensemble models.

6.2. Model Explainability

This extract discusses the model interpretability of our SEDL architectures using LIME. Generally, we attained different CoD predictions and interpretability from our models. However, further insight was derived from the results attained by using LIME to ease explainability.
Figure 9 and Figure 10 show the text narratives of cases with metabolic, maternal and neonatal diagnoses, respectively, that were correctly predicted by our SEDL model. The case of a patient who succumbed from metabolic diabetes disease shows that the respondent raised symptoms, such as (“high sugar" and “sugar diabetic"). These terms also constituted high probabilities in our XAI LIME model. Figure 9 depicts another correct prediction by our model. Interestingly, LIME managed to arrive at a prediction based on the patient’s death description based on the keywords (“baby", “incubator", “mother", “delivery" and “birth"), which all had high probabilities. It is noteworthy that in certain instances, our models got to some CoDs by inferring the symptoms, treatment and laboratory tests performed. Moreover, such cases had more correct predictions given by our models.
Figure 11 and Figure 12 show cases that were incorrectly predicted by our models as HIV and TB being the CoDs, whilst the gold standard was non-communicable diseases and respiratory causes, respectively. On the contrary, we found that in certain cases the models had challenges in NLP proficiencies, because some extracts of the narratives had irrelevant historical information of the patients that was insignificant to achieve a proper CoD. As such, the correct predictions were achieved by paying attention to the relevant descriptions that led to death, rather than historical patient information. This is evident in the textual extract given in Figure 12.
We designed an experiment that sought to elicit mean opinion scores (MOSs) from doctors, based on the evaluation of the LIME results and model predictions. The goal of this was to assess if the LIME explanations made sense or not. We randomly selected 20 LIME predictions and gave them to 10 doctors for review and assessment. The MOSs were denoted by the following terms and corresponding weights:
  • Bad.
  • Poor.
  • Fair.
  • Good.
  • Excellent.
This calculated MOS value represents the average quality perception of the LIME predictions. We attained a high MOS of 4.21 , which implies that the LIME predictions made sense.

7. Discussion

Determining CoD from VAs using narratives only largely remains a manual task that is tedious, time-consuming, prone to errors and costly. Specifically, the turnaround time to obtain a proper diagnosis on CoD from physicians after reviewing the VA narratives is still a challenge. Despite efforts to improve the VA processes, the VA elicitation process suffers from many drawbacks and still lags in the determination of CoD from VAs. This ultimately affects VA reporting as it does not happen in real time, even though it is key in informing civil registration systems and strengthening health priorities.
Generally, we employed novel DL architectures specifically using only VA narratives, with the aim of reducing the turnaround time needed by physicians to give an appropriate diagnosis after reviewing the narratives. Whilst the literature mainly uses the structured responses to the VA questionnaire for information extraction, we found the VA narratives have rich and valuable information [3]. In comparison with the related work that usually uses the closed-ended responses to the structured questionnaires to build predictive models, we have shown that using the VA narratives only produces comparative results that are in close agreement with a physician-determined CoD. Additionally, to obtain improved information from the VA narratives, we need to consider using new novel technological ways, such as using tablets for recording the VA process with relatives of the deceased and transcribing it in an automated fashion. Consequently, doing away with summarising the interview may produce much more reliable results with an error percentage below 6 %  [42].
In this study, we used LSTM and a CNN to determine CoD using VA narratives only. Consistent with previous studies, we discovered that the DL approaches do not always produce the best performance as expected, as they require vast amounts of data and computing resources. Therefore, we faced challenges of few training data samples, as well as a high prevalence of out of vocabulary words with high lexical variability in the terms (words with broad meaning in the medical domain) [42]. Even though our DL models underperformed, LSTM produced better results than the CNN. Nevertheless, LSTM’s underperformance signifies that our model was not effective for the sequential modelling of narratives and could not address the vanishing gradient issue. This implies that during the training of our model, using gradient methods, our gradient was getting smaller, thus preventing our models from training and learning effectively as the weights remained unchanged or not updated. Consequently, this issue might have negatively affected LSTM’s capability of using its forget gate functionality (to forget previous computations by removing it from memory, the ability to save only useful information to memory and focus only on components of memory that are recently relevant), possibly suggesting such a performance.
It follows that the CNN also performed moderately. The performance of this model suggests that, during training, it did not effectively constraint input weights to be the same for all nodes in each convolutional layer. Furthermore, we noted that we did not have a good number of parameters at each layer in order to attain balanced, efficient training of the data points in this model. Moreover, this model did not fully utilise its ability to take the combined results from previous layers as input to other layers to attain a cutting-edge experience to actually learn more abstract and complex relationships.
As stated by [31], DL approaches require vast amounts of training data in order to perform optimally in classification; thus, in cases where there are limited data points, it does not achieve the best results as it needs to learn various feature weights and select the discriminative ones for model prediction. Conversely, our initial work reported in [21] proved that conventional approaches are better in CoD determination from VAs as compared with basic DL techniques. In a quest to prove the capabilities of DL approaches, we explored SEDL models.
Our SEDL architectures attained optimal results as compared with conventional DL approaches, as they surpassed the 80% model performance threshold set in our initial work reported in [21]. This can be attributed to the fact that the stacked ensemble classifier managed to effectively improve the performance during the iterative model training, by combining all the capabilities of all the base classifiers. Our empirical findings suggest that these SEDL architectures can be effectively used for CoD determination using narratives only.
DL models are a black box and difficult to implement as an alternative for the physician CoD gold standard. Additionally, the public health domain still lacks trust in implementing machines for disease diagnosis and prognosis, because this sensitive field requires more accurate models that are easily interpretable. However, the findings of this study position our SEDL framework as an encouraging alternative to physician diagnosis. This is consistent with the findings reported in the study of [42]. This is due to automated techniques that enforce a reduction in human error and inconsistencies, thus enforcing standardisation. Additionally, ML models are scalable and can be used to analyse and interpret large datasets, something not possible through human processes. Moreover, automated models are time-saving (reduce time needed to review the narratives), cost-effective (less costly than the physician), free from human error and enforce consistency in CoD determination (the machine can improve CoD diagnosis and prognosis through model training).
The process of eliciting information from relatives of the deceased remains a huge challenge of the VA process, in terms of interpretability, because of the subjective nature of recall bias. Our findings can result in improved efficiency by automating the VA analysis process, thus reducing the time and effort required for human analysis. Therefore, this improves VA reporting and decision making.
Interestingly, it should be noted that clinical data are not always found in large volumes; thus, in cases where the datasets are limited or small in terms of training samples, it is better to use conventional ML approaches. From a comparative analysis of the results attained in this study and our previous study where we used conventional ML approaches [21], we found that traditional ML approaches are better in terms of performance when using VA narratives for CoD classification. Nevertheless, the novelty of this study is in the use of SEDL frameworks that are easily interpretable using LIME. Moreover, the evaluation conducted by the physicians presents this study as a promising accurate and cost-effective alternative. This further builds trust in the application of machines in the public health space.
This study was limited in the number of training samples that are needed by DL models to improve performance. Moreover, model performance was also affected by high lexical variability in the terms in the medical domain. The study was also limited by the length of the recall period, which could have created a bias in the collected VA data. In addition, some of the data collectors might have had inadequate training or inconsistencies in interviewing techniques, which could have introduced bias into the data collection process. The VA data that we used did not include native terms, which thus may have impacted the generalisability of the findings and limited a chance for model improvement.

8. Conclusions

This study showed that our SEDL framework may be included in the process for determining mortality causes, alongside human annotation and interpretation. As such, the findings of this study may be used as a baseline of building trust in the implementation of machines in disease prognosis and diagnosis in the public health field. Ultimately, this will reduce the turnaround time needed for CoD determination, cut costs, strengthen civil registration systems and health priorities as well as inform policy and practice. Future work will entail the application of record linkage to identify under-reported morbidity occurrences by effectively linking HDSS population data and NHLS public health data registries.

Author Contributions

Conceptualization, M.T.M., C.W.K., T.C. and E.M.; methodology, M.T.M. and V.O.; software, M.T.M. and V.O.; validation, M.T.M., T.C. and V.O.; formal analysis, M.T.M. and V.O.; investigation, M.T.M.; data curation, M.T.M. and C.W.K.; writing—original draft preparation, M.T.M.; writing—review and editing, M.T.M.; visualization, M.T.M. and V.O.; supervision, C.W.K., T.C. and E.M.; project administration, M.T.M. All authors have read and agreed to the published version of the manuscript.

Funding

This research received no external funding.

Institutional Review Board Statement

The study was conducted in accordance with the Declaration of Helsinki and approved by the Institutional Review Board (or Ethics Committee) of the University of the Witwatersrand Faculty of Health Sciences, Human Research Ethics Committee (Medical), (protocol code M1911132 and approved 23 September 2020).

Informed Consent Statement

Patient consent was waived. This study is a retrospective study that used secondary data analysis. We obtained permission from the Agincourt Health and Demographic Surveillance Site to use their data for research purposes and maintained confidentiality through anonymity.

Data Availability Statement

The data presented in this study are available on request from the corresponding author. The data are not publicly available due to privacy and ethical restrictions.

Acknowledgments

This work was supported by the Developing Excellence in Leadership, Training and Science (DELTAS) Africa Initiative Sub-Saharan Africa Consortium for Advanced Biostatistics (SSACAB) (Grant No. DEL-15-005). The DELTAS Africa Initiative is an independent funding scheme of the African Academy of Sciences (AAS) Alliance for Accelerating Excellence in Science in Africa (AESA) and is supported by the New Partnership for Africa’s Development Planning and Coordinating Agency (NEPAD Agency) with funding from the Wellcome Trust (Grant No. 107754/Z/15/Z) and the United Kingdom government. Furthermore, we received support from the University of the Witwatersrand Faculty of Health Sciences Seed funding.

Conflicts of Interest

The authors declare that they have no competing interests.

Abbreviations

The following abbreviations are used in this manuscript:
AIArtificial Intelligence
CCVAComputer-Coded Verbal Autopsy
CoDCause of Death
CNNConvolutional Neural Network
DLDeep Learning
XAIExplainable Artificial Intelligence
LIMELocal Interpretable Model-agnostic Explanations
LSTMLong Short-Term Memory
MLMachine Learning
NLPNatural Language Processing
PCVAPhysician-Coded Verbal Autopsy
RNNRecurrent Neural Network
SEDLStacked Ensemble Deep Learning
VAVerbal Autopsy

References

  1. Nichols, E.K.; Byass, P.; Chandramohan, D.; Clark, S.J.; Flaxman, A.D.; Jakob, R.; Leitao, J.; Maire, N.; Rao, C.; Riley, I.; et al. The WHO 2016 verbal autopsy instrument: An international standard suitable for automated analysis by InterVA, InSilicoVA, and Tariff 2.0. PLoS Med. 2018, 15, e1002486. [Google Scholar] [CrossRef]
  2. Thomas, L.M.; D’Ambruoso, L.; Balabanova, D. Verbal autopsy in health policy and systems: A literature review. BMJ Glob. Health 2018, 3, e000639. [Google Scholar] [CrossRef]
  3. Jeblee, S.; Gomes, M.; Jha, P.; Rudzicz, F.; Hirst, G. Automatically determining cause of death from verbal autopsy narratives. BMC Med. Inform. Decis. Mak. 2019, 19, 127. [Google Scholar] [CrossRef]
  4. Soleman, N.; Chandramohan, D.; Shibuya, K. Verbal autopsy: Current practices and challenges. Bull. World Health Organ. 2006, 84, 239–245. [Google Scholar] [CrossRef] [PubMed]
  5. Bailo, P.; Gibelli, F.; Ricci, G.; Sirignano, A. Verbal autopsy as a tool for defining causes of death in specific healthcare contexts: Study of applicability through a traditional literature review. Int. J. Environ. Res. Public Health 2022, 19, 11749. [Google Scholar] [CrossRef] [PubMed]
  6. Clark, S.J. A Guide to Comparing the Performance of VA Algorithms. arXiv 2018, arXiv:1802.07807. [Google Scholar]
  7. Desai, N.; Aleksandrowicz, L.; Miasnikof, P.; Lu, Y.; Leitao, J.; Byass, P.; Tollman, S.; Mee, P.; Alam, D.; Rathi, S.K.; et al. Performance of four computer-coded verbal autopsy methods for cause of death assignment compared with physician coding on 24,000 deaths in low-and middle-income countries. BMC Med. 2014, 12, 20. [Google Scholar] [CrossRef]
  8. James, S.L.; Flaxman, A.D.; Murray, C.J. Performance of the Tariff Method: Validation of a simple additive algorithm for analysis of verbal autopsies. Popul. Health Metrics 2011, 9, 31. [Google Scholar] [CrossRef]
  9. Byass, P.; Herbst, K.; Fottrell, E.; Ali, M.M.; Odhiambo, F.; Amek, N.; Hamel, M.J.; Laserson, K.F.; Kahn, K.; Kabudula, C.; et al. Comparing verbal autopsy cause of death findings as determined by physician coding and probabilistic modelling: A public health analysis of 54 000 deaths in Africa and Asia. J. Glob. Health 2015, 5. [Google Scholar]
  10. McCormick, T.H.; Li, Z.R.; Calvert, C.; Crampin, A.C.; Kahn, K.; Clark, S.J. Probabilistic cause-of-death assignment using verbal autopsies. J. Am. Stat. Assoc. 2016, 111, 1036–1049. [Google Scholar] [CrossRef]
  11. Miasnikof, P.; Giannakeas, V.; Gomes, M.; Aleksandrowicz, L.; Shestopaloff, A.Y.; Alam, D.; Tollman, S.; Samarikhalaj, A.; Jha, P. Naive Bayes classifiers for verbal autopsies: Comparison to physician-based classification for 21,000 child and adult deaths. BMC Med. 2015, 13, 286. [Google Scholar] [CrossRef] [PubMed]
  12. Boulle, A.; Chandramohan, D.; Weller, P. A case study of using artificial neural networks for classifying cause of death from verbal autopsy. Int. J. Epidemiol. 2001, 30, 515–520. [Google Scholar] [CrossRef] [PubMed]
  13. Flaxman, A.D.; Vahdatpour, A.; Green, S.; James, S.L.; Murray, C.J. Random forests for verbal autopsy analysis: Multisite validation study using clinical diagnostic gold standards. Popul. Health Metrics 2011, 9, 29. [Google Scholar] [CrossRef]
  14. Quigley, M.A.; Chandramohan, D.; Setel, P.; Binka, F.; Rodrigues, L.C. Validity of data-derived algorithms for ascertaining causes of adult death in two African sites using verbal autopsy. Trop. Med. Int. Health 2000, 5, 33–39. [Google Scholar] [CrossRef] [PubMed]
  15. Mwanyangala, M.A.; Urassa, H.M.; Rutashobya, J.C.; Mahutanga, C.C.; Lutambi, A.M.; Maliti, D.V.; Masanja, H.M.; Abdulla, S.K.; Lema, R.N. Verbal autopsy completion rate and factors associated with undetermined cause of death in a rural resource-poor setting of Tanzania. Popul. Health Metrics 2011, 9, 41. [Google Scholar] [CrossRef] [PubMed]
  16. Koopman, B.; Karimi, S.; Nguyen, A.; McGuire, R.; Muscatello, D.; Kemp, M.; Truran, D.; Zhang, M.; Thackway, S. Automatic classification of diseases from free-text death certificates for real-time surveillance. BMC Med Informatics Decis. Mak. 2015, 15, 53. [Google Scholar] [CrossRef]
  17. Koopman, B.; Zuccon, G.; Nguyen, A.; Bergheim, A.; Grayson, N. Extracting cancer mortality statistics from death certificates: A hybrid machine learning and rule-based approach for common and rare cancers. Artif. Intell. Med. 2018, 89, 1–9. [Google Scholar] [CrossRef]
  18. Mujtaba, G.; Shuib, L.; Raj, R.G.; Rajandram, R.; Shaikh, K.; Al-Garadi, M.A. Automatic ICD-10 multi-class classification of cause of death from plaintext autopsy reports through expert-driven feature selection. PLoS ONE 2017, 12, e0170242. [Google Scholar] [CrossRef]
  19. Mujtaba, G.; Shuib, L.; Raj, R.G.; Rajandram, R.; Shaikh, K.; Al-Garadi, M.A. Classification of forensic autopsy reports through conceptual graph-based document representation model. J. Biomed. Inform. 2018, 82, 88–105. [Google Scholar] [CrossRef]
  20. Mujtaba, G.; Shuib, L.; Raj, R.G.; Rajandram, R.; Shaikh, K. Prediction of cause of death from forensic autopsy reports using text classification techniques: A comparative study. J. Forensic Leg. Med. 2018, 57, 41–50. [Google Scholar] [CrossRef]
  21. Mapundu, M.T.; Kabudula, C.W.; Musenge, E.; Olago, V.; Celik, T. Performance evaluation of machine learning and Computer Coded Verbal Autopsy (CCVA) algorithms for cause of death determination: A comparative analysis of data from rural South Africa. Front. Public Health 2022, 10, 990838. [Google Scholar] [CrossRef]
  22. Miotto, R.; Wang, F.; Wang, S.; Jiang, X.; Dudley, J.T. Deep learning for healthcare: Review, opportunities and challenges. Briefings Bioinform. 2017, 19, 1236–1246. [Google Scholar] [CrossRef] [PubMed]
  23. Prakash, J.A.; Ravi, V.; Sowmya, V.; Soman, K. Stacked ensemble learning based on deep convolutional neural networks for pediatric pneumonia diagnosis using chest X-ray images. Neural Comput. Appl. 2022, 35, 8259–8279. [Google Scholar] [CrossRef]
  24. Ravì, D.; Wong, C.; Deligianni, F.; Berthelot, M.; Andreu-Perez, J.; Lo, B.; Yang, G.Z. Deep learning for health informatics. IEEE J. Biomed. Health Inform. 2016, 21, 4–21. [Google Scholar] [CrossRef] [PubMed]
  25. Kwak, G.H.J.; Hui, P. Deephealth: Deep learning for health informatics. ACM Trans. Comput. Healthc. 2019. [Google Scholar]
  26. Srivastava, S.; Soman, S.; Rai, A.; Srivastava, P.K. Deep learning for health informatics: Recent trends and future directions. In Proceedings of the 2017 International Conference on Advances in Computing, Communications and Informatics (ICACCI), Udupi, India, 13–16 September 2017; pp. 1665–1670. [Google Scholar]
  27. Zhao, R.; Yan, R.; Chen, Z.; Mao, K.; Wang, P.; Gao, R.X. Deep learning and its applications to machine health monitoring. Mech. Syst. Signal Process. 2019, 115, 213–237. [Google Scholar] [CrossRef]
  28. Zhang, T.; Oles, F.J. Text categorization based on regularized linear classification methods. Inf. Retr. 2001, 4, 5–31. [Google Scholar] [CrossRef]
  29. Zhang, X.; Zhao, J.; LeCun, Y. Character-level convolutional networks for text classification. arXiv 2015, arXiv:1509.01626. [Google Scholar]
  30. Kowsari, K.; Brown, D.E.; Heidarysafa, M.; Meimandi, K.J.; Gerber, M.S.; Barnes, L.E. Hdltex: Hierarchical deep learning for text classification. In Proceedings of the 2017 16th IEEE international conference on machine learning and applications (ICMLA), Cancun, Mexico, 18–21 December 2017; pp. 364–371. [Google Scholar]
  31. Mujtaba, G.; Shuib, L.; Idris, N.; Hoo, W.L.; Raj, R.G.; Khowaja, K.; Shaikh, K.; Nweke, H.F. Clinical text classification research trends: Systematic literature review and open issues. Expert Syst. Appl. 2019, 116, 494–520. [Google Scholar] [CrossRef]
  32. Johnson, R.; Zhang, T. Effective use of word order for text categorization with convolutional neural networks. arXiv 2014, arXiv:1412.1058. [Google Scholar]
  33. Irsoy, O.; Cardie, C. Opinion mining with deep recurrent neural networks. In Proceedings of the 2014 Conference on Empirical Methods in Natural Language Processing (EMNLP), Doha, Qatar, 25–29 October 2014; pp. 720–728. [Google Scholar]
  34. Tang, D.; Qin, B.; Liu, T. Document modeling with gated recurrent neural network for sentiment classification. In Proceedings of the 2015 Conference on Empirical Methods in Natural Language Processing, Lisbon, Portugal, 17–21 September 2015; pp. 1422–1432. [Google Scholar]
  35. Liu, F.; Zheng, J.; Zheng, L.; Chen, C. Combining attention-based bidirectional gated recurrent neural network and two-dimensional convolutional neural network for document-level sentiment classification. Neurocomputing 2020, 371, 39–50. [Google Scholar] [CrossRef]
  36. Ghosh, M.; Sanyal, G. Document modeling with hierarchical deep learning approach for sentiment classification. In Proceedings of the 2nd International Conference on Digital Signal Processing, Tokyo, Japan, 25–27 February 2018; pp. 181–185. [Google Scholar]
  37. Xu, J.; Chen, D.; Qiu, X.; Huang, X. Cached long short-term memory neural networks for document-level sentiment classification. arXiv 2016, arXiv:1610.04989. [Google Scholar]
  38. Jelodar, H.; Wang, Y.; Orji, R.; Huang, S. Deep sentiment classification and topic discovery on novel coronavirus or covid-19 online discussions: Nlp using lstm recurrent neural network approach. IEEE J. Biomed. Health Inform. 2020, 24, 2733–2742. [Google Scholar] [CrossRef]
  39. Yang, Z.; Yang, D.; Dyer, C.; He, X.; Smola, A.; Hovy, E. Hierarchical attention networks for document classification. In Proceedings of the 2016 Conference of the North American Chapter of the Association for Computational Linguistics: Human Language Technologies, San Diego, CA, USA, 12–17 June 2016; pp. 1480–1489. [Google Scholar]
  40. Jeblee, S.; Gomes, M.; Hirst, G. Multi-task learning for interpretable cause of death classification using key phrase prediction. In Proceedings of the BioNLP 2018 Workshop, Melbourne, Australia, 19 July 2018; pp. 12–17. [Google Scholar]
  41. Yan, Z.; Jeblee, S.; Hirst, G. Can Character Embeddings Improve Cause-of-Death Classification for Verbal Autopsy Narratives? In Proceedings of the 18th BioNLP Workshop and Shared Task, Florence, Italy, 1 August 2019; pp. 234–239. [Google Scholar]
  42. Blanco, A.; Perez, A.; Casillas, A.; Cobos, D. Extracting Cause of Death from Verbal Autopsy with Deep Learning interpretable methods. IEEE J. Biomed. Health Inform. 2020, 25, 1315–1325. [Google Scholar] [CrossRef]
  43. Kivrak, M.; Guldogan, E.; Colak, C. Prediction of death status on the course of treatment in SARS-COV-2 patients with deep learning and machine learning methods. Comput. Methods Programs Biomed. 2021, 201, 105951. [Google Scholar] [CrossRef]
  44. Heidarysafa, M.; Kowsari, K.; Barnes, L.; Brown, D. Analysis of Railway Accidents’ Narratives Using Deep Learning. In Proceedings of the 2018 17th IEEE International Conference on Machine Learning and Applications (ICMLA), Orlando, FL, USA, 17–20 December 2018; pp. 1446–1453. [Google Scholar]
  45. El Asnaoui, K. Design ensemble deep learning model for pneumonia disease classification. Int. J. Multimed. Inf. Retr. 2021, 10, 55–68. [Google Scholar] [CrossRef]
  46. Tang, S.; Wang, C.; Nie, J.; Kumar, N.; Zhang, Y.; Xiong, Z.; Barnawi, A. EDL-COVID: Ensemble deep learning for COVID-19 case detection from chest X-ray images. IEEE Trans. Ind. Inform. 2021, 17, 6539–6549. [Google Scholar] [CrossRef]
  47. Ganaie, M.A.; Hu, M.; Malik, A.; Tanveer, M.; Suganthan, P. Ensemble deep learning: A review. Eng. Appl. Artif. Intell. 2022, 115, 105151. [Google Scholar] [CrossRef]
  48. Baccouche, A.; Garcia-Zapirain, B.; Castillo Olea, C.; Elmaghraby, A. Ensemble deep learning models for heart disease classification: A case study from Mexico. Information 2020, 11, 207. [Google Scholar] [CrossRef]
  49. Loh, H.W.; Ooi, C.P.; Seoni, S.; Barua, P.D.; Molinari, F.; Acharya, U.R. Application of explainable artificial intelligence for healthcare: A systematic review of the last decade (2011–2022). Comput. Methods Programs Biomed. 2022, 226, 107161. [Google Scholar] [CrossRef] [PubMed]
  50. Zhang, Y.; Weng, Y.; Lund, J. Applications of explainable artificial intelligence in diagnosis and surgery. Diagnostics 2022, 12, 237. [Google Scholar] [CrossRef] [PubMed]
  51. Javed, A.R.; Khan, H.U.; Alomari, M.K.B.; Sarwar, M.U.; Asim, M.; Almadhor, A.S.; Khan, M.Z. Toward explainable AI-empowered cognitive health assessment. Front. Public Health 2023, 11, 1024195. [Google Scholar] [CrossRef]
  52. Knapič, S.; Malhi, A.; Saluja, R.; Främling, K. Explainable artificial intelligence for human decision support system in the medical domain. Mach. Learn. Knowl. Extr. 2021, 3, 740–770. [Google Scholar] [CrossRef]
  53. Kabudula, C.W.; Tollman, S.; Mee, P.; Ngobeni, S.; Silaule, B.; Gómez-Olivé, F.X.; Collinson, M.; Kahn, K.; Byass, P. Two decades of mortality change in rural northeast South Africa. Glob. Health Action 2014, 7, 25596. [Google Scholar] [CrossRef] [PubMed]
  54. Danso, S.; Atwell, E.; Johnson, O. A comparative study of machine learning methods for verbal autopsy text classification. arXiv 2014, arXiv:1402.4380. [Google Scholar]
  55. King, G.; Lu, Y. Verbal autopsy methods with multiple causes of death. Stat. Sci. 2008, 23, 78–91. [Google Scholar] [CrossRef]
  56. Shah, C. A Hands-On Introduction to Data Science; Cambridge University Press: Cambridge, UK, 2020. [Google Scholar]
  57. Naili, M.; Chaibi, A.H.; Ghezala, H.H.B. Comparative study of word embedding methods in topic segmentation. Procedia Comput. Sci. 2017, 112, 340–349. [Google Scholar] [CrossRef]
  58. Alami, N.; Meknassi, M.; En-nahnahi, N. Enhancing unsupervised neural networks based text summarization with word embedding and ensemble learning. Expert Syst. Appl. 2019, 123, 195–211. [Google Scholar] [CrossRef]
  59. Young, T.; Hazarika, D.; Poria, S.; Cambria, E. Recent trends in deep learning based natural language processing. arXiv 2017, arXiv:1708.02709. [Google Scholar]
  60. Zaki, M.J.; Meir, W., Jr. Data Mining and Machine Learning: Fundamental Concepts and Algorithms; Cambridge University Press: Cambridge, UK, 2019. [Google Scholar]
  61. Leskovec, J.; Rajaraman, A.; Ullman, J.D. Mining of Massive Data Sets; Cambridge University Press: Cambridge, UK, 2020. [Google Scholar]
  62. Kirillov, A.; Schlesinger, D.; Forkel, W.; Zelenin, A.; Zheng, S.; Torr, P.; Rother, C. Efficient likelihood learning of a generic CNN-CRF model for semantic segmentation. arXiv 2015, arXiv:1511.05067. [Google Scholar]
  63. Malinowski, M.; Rohrbach, M.; Fritz, M. Ask your neurons: A neural-based approach to answering questions about images. In Proceedings of the IEEE International Conference on Computer Vision, Santiago, Chile, 7–13 December 2015; pp. 1–9. [Google Scholar]
  64. Wolpert, D.H. Stacked generalization. Neural Netw. 1992, 5, 241–259. [Google Scholar] [CrossRef]
  65. Watt, J.; Borhani, R.; Katsaggelos, A. Machine Learning Refined: Foundations, Algorithms, and Applications; Cambridge University Press: Cambridge, UK, 2020. [Google Scholar]
  66. Anzanello, M.J.; Fogliatto, F.S. Learning curve models and applications: Literature review and research directions. Int. J. Ind. Ergon. 2011, 41, 573–583. [Google Scholar] [CrossRef]
  67. Hoiem, D.; Gupta, T.; Li, Z.; Shlapentokh-Rothman, M.M. Learning Curves for Analysis of Deep Networks. arXiv 2020, arXiv:2010.11029. [Google Scholar]
Figure 1. LSTM deep learning framework. Source: [59].
Make 05 00079 g001
Figure 2. CNN deep learning framework. Source: [59].
Make 05 00079 g002
Figure 3. Stacking of our models. Source: [47].
Make 05 00079 g003
Figure 4. General pipeline of XAI implementation using VA data.
Make 05 00079 g004
Figure 5. Learning curve depicting performance evaluation of CNN.
Make 05 00079 g005
Figure 6. Learning curve depicting performance evaluation of LSTM.
Make 05 00079 g006
Figure 7. Learning curve depicting SEDL performance evaluation during model training.
Make 05 00079 g007
Figure 8. Learning curve depicting SEDL performance evaluation.
Make 05 00079 g008
Figure 9. Example of LIME correct prediction.
Make 05 00079 g009
Figure 10. Example of LIME correct prediction.
Make 05 00079 g010
Figure 11. Example of LIME incorrect prediction.
Make 05 00079 g011
Figure 12. Example of LIME incorrect prediction.
Make 05 00079 g012
Table 1. Labelling of the twelve disease classes.
Disease CategoryClass LabelNumber of Samples
HIV/TB03388
Other Infectious1964
Metabolic2242
Cardiovascular3140
Indeterminate41468
Maternal and Neonatal5121
Abdominal6117
Neoplasms793
Neurological957
Respiratory1046
Other NCD1121
Legend: HIV—human immunodeficiency virus, TB—tuberculosis, NCD—non-communicable diseases.
Table 2. Performance evaluation of models.
ModelTraining
Accuracy (%)
Validation
Accuracy (%)
Test Accuracy
(%)
Test Loss (%)
LSTM76.1167.056711.95
CNN76.3566.1666.212.64
SEDL82.182821.15
Disclaimer/Publisher’s Note: The statements, opinions and data contained in all publications are solely those of the individual author(s) and contributor(s) and not of MDPI and/or the editor(s). MDPI and/or the editor(s) disclaim responsibility for any injury to people or property resulting from any ideas, methods, instructions or products referred to in the content.

