Article

Evaluation of the Effect of the Composition of the Foam Glass Concrete on Its Flammability and Moisture Characteristics

Building Materials Institute, Faculty of Civil Engineering, Vilnius Gediminas Technical University, Linkmenų Str. 28, LT-08217 Vilnius, Lithuania
*
Author to whom correspondence should be addressed.
J. Compos. Sci. 2024, 8(3), 105; https://doi.org/10.3390/jcs8030105
Submission received: 7 February 2024 / Revised: 1 March 2024 / Accepted: 12 March 2024 / Published: 16 March 2024

Abstract

:
The purpose of this study was to evaluate the moisture and flammability characteristics of lightweight concrete with different aggregates and different amounts of cement according to different criteria. The moisture properties of the specimens were evaluated by the coefficient of water absorption due to capillary action, short-term water absorption, and water vapour permeability. Short-term water absorption correlated with the density of the specimens, and capillary absorption was evaluated depending on the soaking time, amount of cement, and type of lightweight aggregate. The values of the water vapour diffusion resistance factor were estimated based on the amount of cement, the type of lightweight aggregate, the density, and the porosity. The porosity correlated with the amount of cement and the type of lightweight aggregate. The flammability properties of concrete with lightweight aggregate were evaluated by several methods, such as the single flame source test, the single burning item test, and the non-combustibility test. After assessing the flammability characteristics, a structure analysis of the samples was specifically performed to assess the processes that occur during the combustion of lightweight concrete. It was found that short-term water absorption depended mainly on the density, capillary absorption on the amount of cement, and the water vapour diffusion resistance factor, flammability, and thermal stability of lightweight concrete on the type of granules.

1. Introduction

Over the past decades, lightweight concrete (LWC) has been increasingly used in the construction sector. Such products are characterized not only by a significantly lower density but also by several other superior properties compared to ordinary concrete. Lightweight concrete can be produced in many ways, but most commonly it is produced using a lightweight aggregate (LWA) or lightweight matrix [1]. LWC can replace conventional concrete in structures due to properties such as low density, thermal conductivity, and high fire resistance. However, the use of LWA can also be associated with the deterioration of properties. Light aggregates tend to increase the porosity of concrete, thus worsening the strength characteristics of the products [2].
LWA can be derived from natural resources or developed artificially. By using lightweight artificial aggregates such as waste, the use of fossil feedstock can be reduced, thus providing environmentally friendly and cost-effective solutions [3,4,5]. Therefore, the application of secondary raw materials has recently become more relevant [6,7,8].
One of the possible raw materials for the production of lightweight artificial aggregate is glass waste. Glass is a non-biodegradable and chemically inert material that remains unchanged in the environment for a very long time. In the construction sector, glass waste can be used in various ways [6]. During the last decade, research related to the development of expanded glass (EG) composites has been increasing. Scientists have explored the recycling of glass waste from various sources, such as bottles, cathode ray tube glass, and flat glass. [9,10,11]. Lightweight composites made of EG beads are a fairly unique class of materials with a combination of rational properties that make them suitable for various purposes. These composites usually consist of a porous glass structure embedded in a matrix allowing them to obtain a lightweight and efficient thermal insulation material with different mechanical properties. Products with a porous glass structure ensure low thermal conductivity; therefore, they are suitable for application in the construction, transport, and energy-saving systems. [3,5,12]. For instance, Adhikary [6] further reduced the density and thermal conductivity of an EG-based composite using aerogels. Such findings also show that the products with EG beads, a hydraulic inorganic binder, and additives are non-flammable, waterproof, weather-resistant, and durable [13].
Another filler suitable as a LWA is polystyrene foam beads or crushed polystyrene foam waste (CEPW) [14,15]. Currently, expanded polystyrene (EPS) is a widely used material in structures due to its rational properties, such as lightness, low thermal conductivity, moisture resistance, good chemical resistance, convenient processing, and low cost [16,17,18]. The studies have shown that recycled EPS waste, as well as manufactured EPS beads can be used as an aggregate for the development of lightweight cement-based thermal insulation composites [19,20,21].
Kadhim et al. [22] studied a LWC composite with EPS beads. The density of such concrete ranged from 588 to 790 kg/m3, and the water absorption ranged from 6.45 to 14.05%. The water absorption was slightly higher than that with conventional aggregates due to the formation of voids in the composite. Using LWA with a superplasticizer to make LWC showed higher compressive strength than concrete with LWA without a superplasticizer. The maximum compressive strength of LWC was 21 MPa. Sayadi et al. [23] studied the fire resistance of concrete with different amounts of EPS. It was found that specimens with higher EPS content obtained lower fire resistance. This was due to the greater volumetric shrinkage of the matrix compared to concrete compositions with a lower EPS content.
Pundiene et al. [24] studied the influence of chemical additives on a lightweight composite with EPS waste and EG beads as aggregates. Increasing the ratio of metakaolin to ordinary Portland cement (OPC) with air-entraining admixture and superplastic polycarboxylates allowed for a larger volume of air to be entrained, resulting in a uniform distribution of pores and a 2.2-fold increase in apparent porosity. Increasing the ratio of MA to OPC and using porous concrete aggregates (EG and EPS beads) resulted in a highly porous macrostructure, a reduction in density of up to 40.1%, and a thermal conductivity of up to 2.1 times (from 0.152 to 0.073 W/(m·K). Water absorption increased by 44.8% (from 5.7 to 8.3%). A previous study [19] examined the effect of LWA (EG and EPS) on composite properties. Using the EPS aggregate, the amount of deformation of the lightweight composite was reduced while the durability was increased. The compressive strength values of the specimens with EG and EPS aggregates after 200 freeze–thaw cycles at a maximum binder content of 130 kg/m3 were approximately 3 times lower than those for specimens without EPS aggregate. Microstructural studies confirmed that the EPS LWA was not damaged during freezing and prevented the formation of continuous cracks throughout the volume of the LWC.
Due to the porous structure, LWA has a higher water absorption than conventional natural aggregates. Studies have shown that water absorption depends on the size of the EG particles, the raw materials used, and the sintering temperature applied. The water absorption of EG aggregates can vary from 8 to 25% depending on the size of the beads [25,26,27,28,29]. Moreover, several studies have shown that the cells of glass beads increase by several times at higher sintering temperatures, which may negatively influence water absorption [26,28].
Water absorption and capillary water absorption of lightweight composites consisting of cement and LWA is an important factor that can affect the durability of concrete and depends on the type of aggregates, their amount, W/C ratio, and the amount of binder [15]. The structure of LWC is more porous than that of the conventional concrete. Studies have shown that expanded clay concrete can absorb approximately 7–44% of water [3,30,31,32], while lightweight composites with EG beads can absorb from 9.44 to 34.33% [30,32,33,34]. The water absorption of composites can also depend on the ratio of open-to-closed cells of the EG beads. Gulengul [35] determined that water absorption decreased from 17 to 15% when the amount of EG beads increased from 5 to 20%. The phenomena were associated with the closed cell structure of the beads. Furthermore, capillary water absorption of EPS-based lightweight composite with densities ranging from 445 to 565 kg/m3 varied from 66.6 to 11.0 g/dm2, respectively [36]. Capillary water absorption depended on the initial composition of the mixture, the additives used, and the structure of the closed cells of the porous filler. The authors of [37] found that the depth of penetration of the water of the cement composite with foamed beads can be reduced by 43% when nano-silica additive is added to the cement composite.
Chung et al. [38] conducted research and found that water vapour permeability depends on the density of LWC components. Ducman and Mirtič [39] investigated water vapour permeability using aggregates with different densities. The results showed that when LWA with densities ranging from 1320 to 1860 kg/m3 was used, the water vapour diffusion resistance factor varied from 18 to 32. The use of LWA made it possible to develop a composite several times more permeable to water vapour (conventional concrete has a water vapour diffusion resistance factor of 84).
The main objective of this work is to evaluate the moisture and flammability characteristics of LWC with EG and CEPW aggregates according to different criteria. The moisture properties of the specimens were evaluated by short-term water absorption, coefficient of water absorption due to capillary action, and water vapour permeability in dry and wet conditions. Moisture characteristics were evaluated based on the amount of cement, the type of light aggregate, LWC density, and its porosity. Porosity was dependent on the amount of cement and the type of LWA. The flammability properties of concrete with LWA were evaluated using three methods: the single flame source test, the single burning item test, and the non-flammability test. A thermal stability test was also performed to explain the processes that occur during combustion. After assessing the flammability characteristics, a structural analysis of the samples was specifically performed to assess changes in the specimens.

2. Materials and Methods

2.1. Raw Materials

Ordinary Portland cement (OPC) CEM I 42.5R was manufactured by JSC Akmenės cementas (Naujoji Akmenė, Lithuania) and used as a binding material. The specific surface of OPC was 356 m2/kg and bulk density was 1150 kg/m3. The chemical composition of the Portland cement was determined according to the requirements of EN 196-2 [40] and is presented in Table 1.
The mineralogical composition of the OPC: C3S—63.70%, C2S—7.68%, C3A—6.34%, and C4AF—12.58%. Particle size distribution was performed using a CILAS 1090 instrument (Orleans, France). The size of the OPC particles was between 1 and 100 µm, 50% of the OPC consisted of particles with a size of 15–30 µm.
In total, 10% of the OPC was replaced with metakaolin waste (MKW). This is the technological waste from UAB “Stikloporas” (Druskininkai, Lithuania) which was obtained during the production of foamed beads by heating kaolin powder at a temperature of 820–850 °C. The bulk density of MKW was 480 kg/m3 and the specific surface was 897 m2/kg. The chemical composition of MKW is presented in Table 2. The particle size distribution showed that 40% of the MKW powder consisted of 8–15 µm particles.
Two modifying additives were used to stabilize the cement matrix mixture, i.e., superplasticizer Castament FS-40 (SPL) from BASF Construction Solutions GmbH, Trostberg, Germany, and air-entraining admixture (AEA) UFAPORE TCO from Unger Fabrikker AS, Fredrikstad, Norway.
AEA is an additive based on sodium alkenes sulfonate. Its purpose is to ensure the formation of small pores in the cement matrix and to hydrophilize CEPW. The amount of AEA in the cement matrix recommended by the manufacturer is 0.01 ÷ 0.06% of the mass of the binding material. Studies [15] have shown that the most effective amount of AEA to be used for testing is 0.05%.
Castament FS-40 is a new-generation superplasticizer (SPL) based on polycarboxylic ether for the production of low-cement concrete and ultra-low-cement concrete. SPL effectively reduces the viscosity of the Portland cement matrix and, according to the BASF manufacturer’s recommendations, it should be used between 0.05 and 0.5% of the weight of the binder. Studies [15] have shown that the most effective amount of SPL for the tested compositions is 0.5%.
The main properties of AEA and SPL are listed in Table 3.
EG of three different fractions (from 2 to 16 mm, Table 4) and bulk density (120–290 kg/m3) produced by UAB “Stikloporas”, Lithuania were used as an aggregate to form thermal insulation composite specimens. UAB “Virginijus ir Co”,Plungė, Lithuania, provided the CEPW up to 2 mm in size with a bulk density of 15.0 kg/m3. The bulk density was determined according to the requirements of EN 1097-6 [41].

2.2. Specimens Preparation

To determine the effect of the amount of binder and the type of aggregates on the structure and properties of the thermal insulation composite, six composite compositions with three different amounts of binder were selected. The compositions of the composite moulding mixtures are presented in Table 4. During the preparation of the moulding mixtures, all components of the composite were mixed with a mobile Apex ST2 vertical mixer Wagner S.p.a., Valmadrera, Italy in a round plastic container with a capacity of 20 L. The mixer speed was 180 rpm for all mixtures.
The mixed composite mass was poured into moulds and compacted by pressing with a small load so that the beads were brought together without damaging their structure, and so that the composite mass could be evenly distributed in the moulds without segregation. The formed specimens of six composite compositions were covered with a polyethylene film and kept at an environmental temperature of (20 ± 5) °C for two days. After two days, the specimens were unmoulded, covered with a polyethylene film, and kept for 26 days at a temperature of (20 ± 5) °C. The technological scheme of the manufacturing process of lightweight composite specimens is presented in Figure 1.

2.3. Test Methods

The short-term water absorption of the thermal insulation composite specimens was determined according to EN ISO 29767:2019 method B [42]. Three (200 × 200 × 100) mm-sized specimens of each composition were tested. Before the test, the specimens were conditioned for 6 h at a temperature of (23 ± 5) °C. During the test, the composite specimens were soaked for 24 h in 20 °C water. After 24 h, the specimens were removed and placed on a special drain at an angle of 45°, drained (10 ± 0.5) min, and weighed.
The coefficient of water absorption due to capillary action (cw,s) was determined according to EN 772-11 [43]. Six specimens with the size of 100 × 100 × 100 mm of each composition were tested. Before the test, the specimens were dried to a constant mass in a ventilated oven “WTB binder” (Binder GmbH, Tuttlingen, Germany) at a temperature of (70 ± 5) °C. To determine the coefficient of water absorption, the specimens were placed on a 10 mm high support device and immersed in a bath to a depth of (10 ± 1) mm. The composite specimens were soaked from 10 min to 24 h. The specimens were removed from the bath, wiped with a cloth napkin, and weighed.
The water vapour diffusion resistance factor of the specimens was determined according to EN 12086 [44]. Since the newly developed material is hygroscopic, the permeability of the water vapour was determined under two climatic conditions (Figure 2a,b). Three (100 × 100 × 100) mm specimens of each composition were tested. Before the test, the specimens were conditioned for 6 h at a temperature of (23 ± 5) °C. The average air pressure during the test was 1007 hPa. The flow direction of the water vapour stream was perpendicular to the forming surface of the specimens.
The percentage volume of open and closed pores was determined according to the EN ISO 4590 method 2 [45]. Three specimens of each composition (100 × 30 × 30) mm in size were tested. Before the test, the specimens were conditioned for 16 h at an environmental temperature of (23 ± 2) °C and relative air humidity of (50 ± 5)%.
LWC specimens were tested under 3 different simulated scenarios of fire initiation and propagation. In the first case, the start of a fire was simulated when the specimen was exposed to a flame of low heat output for a limited time. To evaluate flammability, the products were exposed to an open flame according to the requirements of EN ISO 11925-2 [46] for three (200 × 90 × 50) mm-sized specimens of each composition. The specimens were exposed to an open flame at an angle of 45° for 15 s. After removing the flame source, the specimens were left to burn for an additional 5 s. A general view of the single flame source test stand is shown in Figure 3.
In the second case, the focus of the fire was simulated in the corner of the structure. This test was carried out according to EN 13823 [47]. The test piece consisted of two wings called short and long wings. The width and length of the short wings were (495 × 1500) mm, the long wing was (1000 × 1500) mm, and the thickness of the specimens was 150 mm. The duration of the fire test was 20 min. The scheme of the stand for the general determination of the flammability of specimens under the heat of one burning object is presented in Figure 4.
In the third case, a developed fire was simulated when the sample was exposed to a source of high heat output from all sides. The non-flammability test was performed according to the requirements of the EN ISO 1182 [48]. This test method defines the determination of the non-flammability of homogeneous construction products and the main components of heterogeneous construction products when the products are not completely inert but emit only a very small amount of heat and have a low flame under the temperature of ~750 °C. The general view of the bench for determining flammability parameters by the non-flammability method is shown in Figure 5.
In addition, the total heat of combustion (calorific value PCS) was determined according to EN ISO 1716 [49]. During this test, the amount of heat released by a completely burned thermal insulation composite was determined. To achieve this goal, a calorimetric bomb was used (Figure 6).
To evaluate the changes in LWC during a fire, thermal stability tests were performed. Derivative thermogravimetric analysis (DTG) and thermogravimetric analysis (TGA) were implemented using an STA 449 F1 Jupiter analyzer apparatus (Netzsch Group, Selb, Germany). The samples were tested at a heating rate of 10 °C/min in an argon atmosphere. Measurements were made in the temperature range of 25 to 1000 °C.
The microstructure studies of the thermal insulation composite samples were performed with a Zeiss EVO-50 EP scanning electron microscope (Carl Zeiss SMT GmbH, Oberkochen, Germany). The (15 × 15 × 15) mm-sized specimens were prepared for the microstructure analysis of the composites. The analysis was carried out using variable pressure mode at an acceleration voltage of 20 keV and a working distance of 10 to 15 mm. During the test, the contact zones between the matrix and the aggregates, as well as the surfaces of the aggregates, were analyzed.
For determination of the effect of the amount of cement and the type of aggregate on the moisture characteristics and flammability of lightweight concrete, a mathematical-statistical data evaluation was applied using the StatSoft 8.0 software [50].

3. Results and Discussions

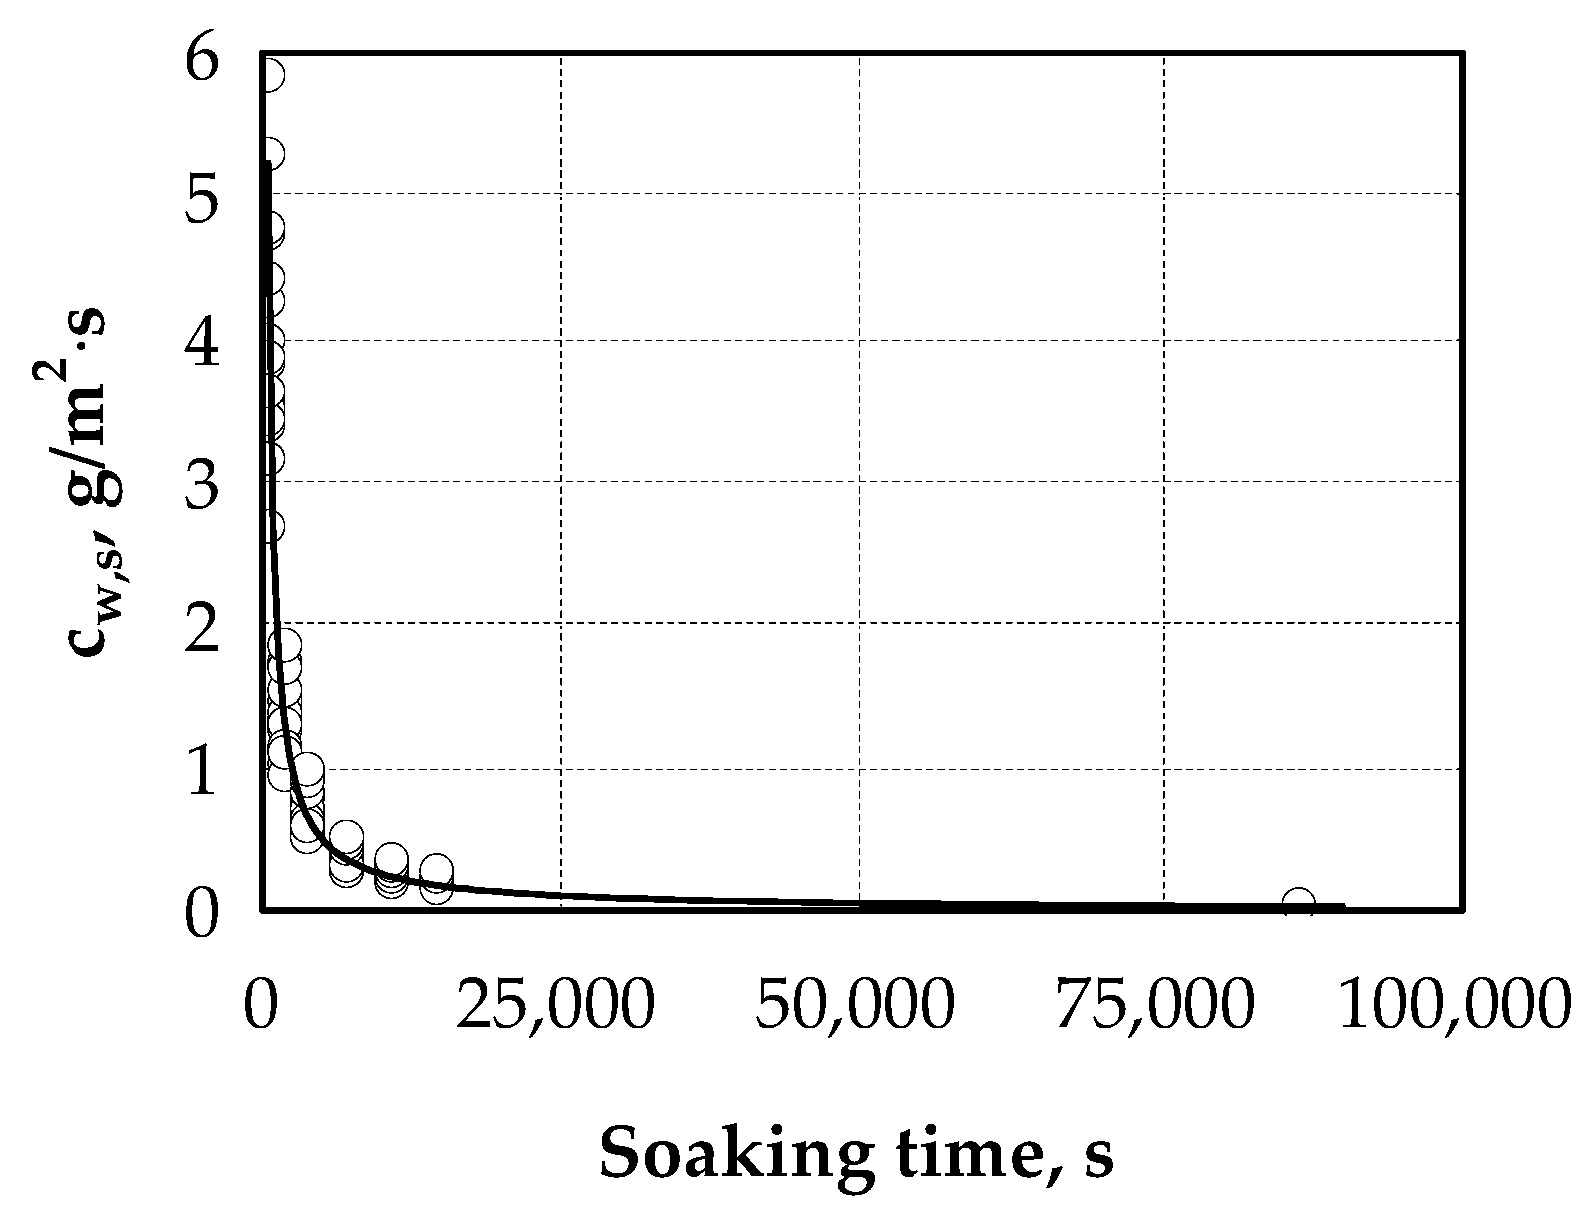
3.1. Short-Term and Capillary Water Absorption

Figure 7 shows the dependence of short-term water absorption on the density of LWC specimens. It can be seen that as the density increases, so does the water absorption of the LWC specimens. When the density of the material increased from 225 to 373 kg/m3 or 1.7 times, the short-term water absorption increased from 2.4 to 5.0 kg/m2 or 2.1 times, respectively. Short-term water absorption values can be described by Equation (1) (Figure 7 and Table 5). From the experimental data, it can be concluded (Table 5) that the relationship between short-term water absorption and density is very strong. This is shown by the correlation coefficient which is equal to 0.949, and the coefficient of determination for short-term water absorption values is 90.1%, which is dependent on the density of the material. This leads to the conclusion that the density of LWC is determined by the type of beads and the amount of cement used.
Figure 8 presents the results of the kinetics of the reduction in capillary water absorption of lightweight concrete. It can be seen that the influence of the type of beads and the amount of cement on the kinetics of capillary absorption is evaluated. The curve changes drastically over time and can be divided into three stages. In the first stage, a sudden decrease in the intensity of capillary water absorption can be observed, and it lasts for ~1800 s (30 min). At this stage, the intensity of capillary water absorption decreased 4.3 times, i.e., from ~5.8 to ~1.35 g/m2·s, and this represented 77.14% of the total amount of capillary absorption. In the second stage, the absorption process lasts for ~ 12,600 s (210 min), and the intensity of capillary water absorption decreased from ~1.35 to ~0.18 g/m2·s and reached 20.28%. In the last stage, after 86,400 s (24 h), the intensity of capillary water absorption decreases from ~0.18 to ~0.031 g/m2·s and is only 2.58%. The kinetic values of the decrease in the intensity of capillary water absorption of light concrete can be described by Equation (2) (Figure 8 and Table 5).
Further, an attempt was made to evaluate the influence of the amount of cement and the type of beads on capillary water absorption. The dispersion analysis conducted in the experimental studies shows (Figure 9 and Table 6) how the amount of cement and the type of beads (EG and EG+CEPW) impact the kinetics of capillary water absorption of lightweight concrete. Figure 9a,b show that the amount of cement has the greatest influence on capillary water absorption. The greatest difference occurs between specimens with cement contents of 70 and 130 kg; after 10 min, the difference reaches 1.3 times, and after 24 h, it reaches 1.5 times. In the statistical analysis, the Tukey HSD test shows that there is no difference between mean values of capillary water absorption for 70 and 100 kg of cement and 100 and 130 kg of cement after 10 min and 24 h of immersion. Repeated Anova analysis between 70 and 100 kg (after 10 min) showed that the statistic of the F criterion is equal to 1.27, and p = 0.285. This indicates a statistically insignificant difference between the mean results of the analyzed specimens. The average value of capillary water absorption coefficient of LWC with 70 and 100 kg OPC is 3.66 g/m2·s. Statistical analysis shows that the F criterion is equal to 2.53, and p = 0.143 when the OPC amounts were 100 and 130 kg (after 24 h). This indicates a statistically insignificant difference between the mean results of the analyzed specimens. The average value of capillary water absorption coefficient of LWC with 100 and 130 kg OPC is 4.24 g/m2·s.
The analysis of the experimental data shows that partially replacing one type of bead with another type of bead (EG and EG+CEPW) does not significantly affect the capillary water absorption of lightweight concrete. Anova analysis shows a statistically insignificant difference in the means of capillary water absorption (Figure 9c,d, and Table 6). After replacing part of the amount of EG beads with CEPW beads, the average value of capillary water absorption coefficient after 10 min is 3.98 g/m2·s. Consequently, after 24 h, the average value of the parameter is 0.0391 g/m2·s.

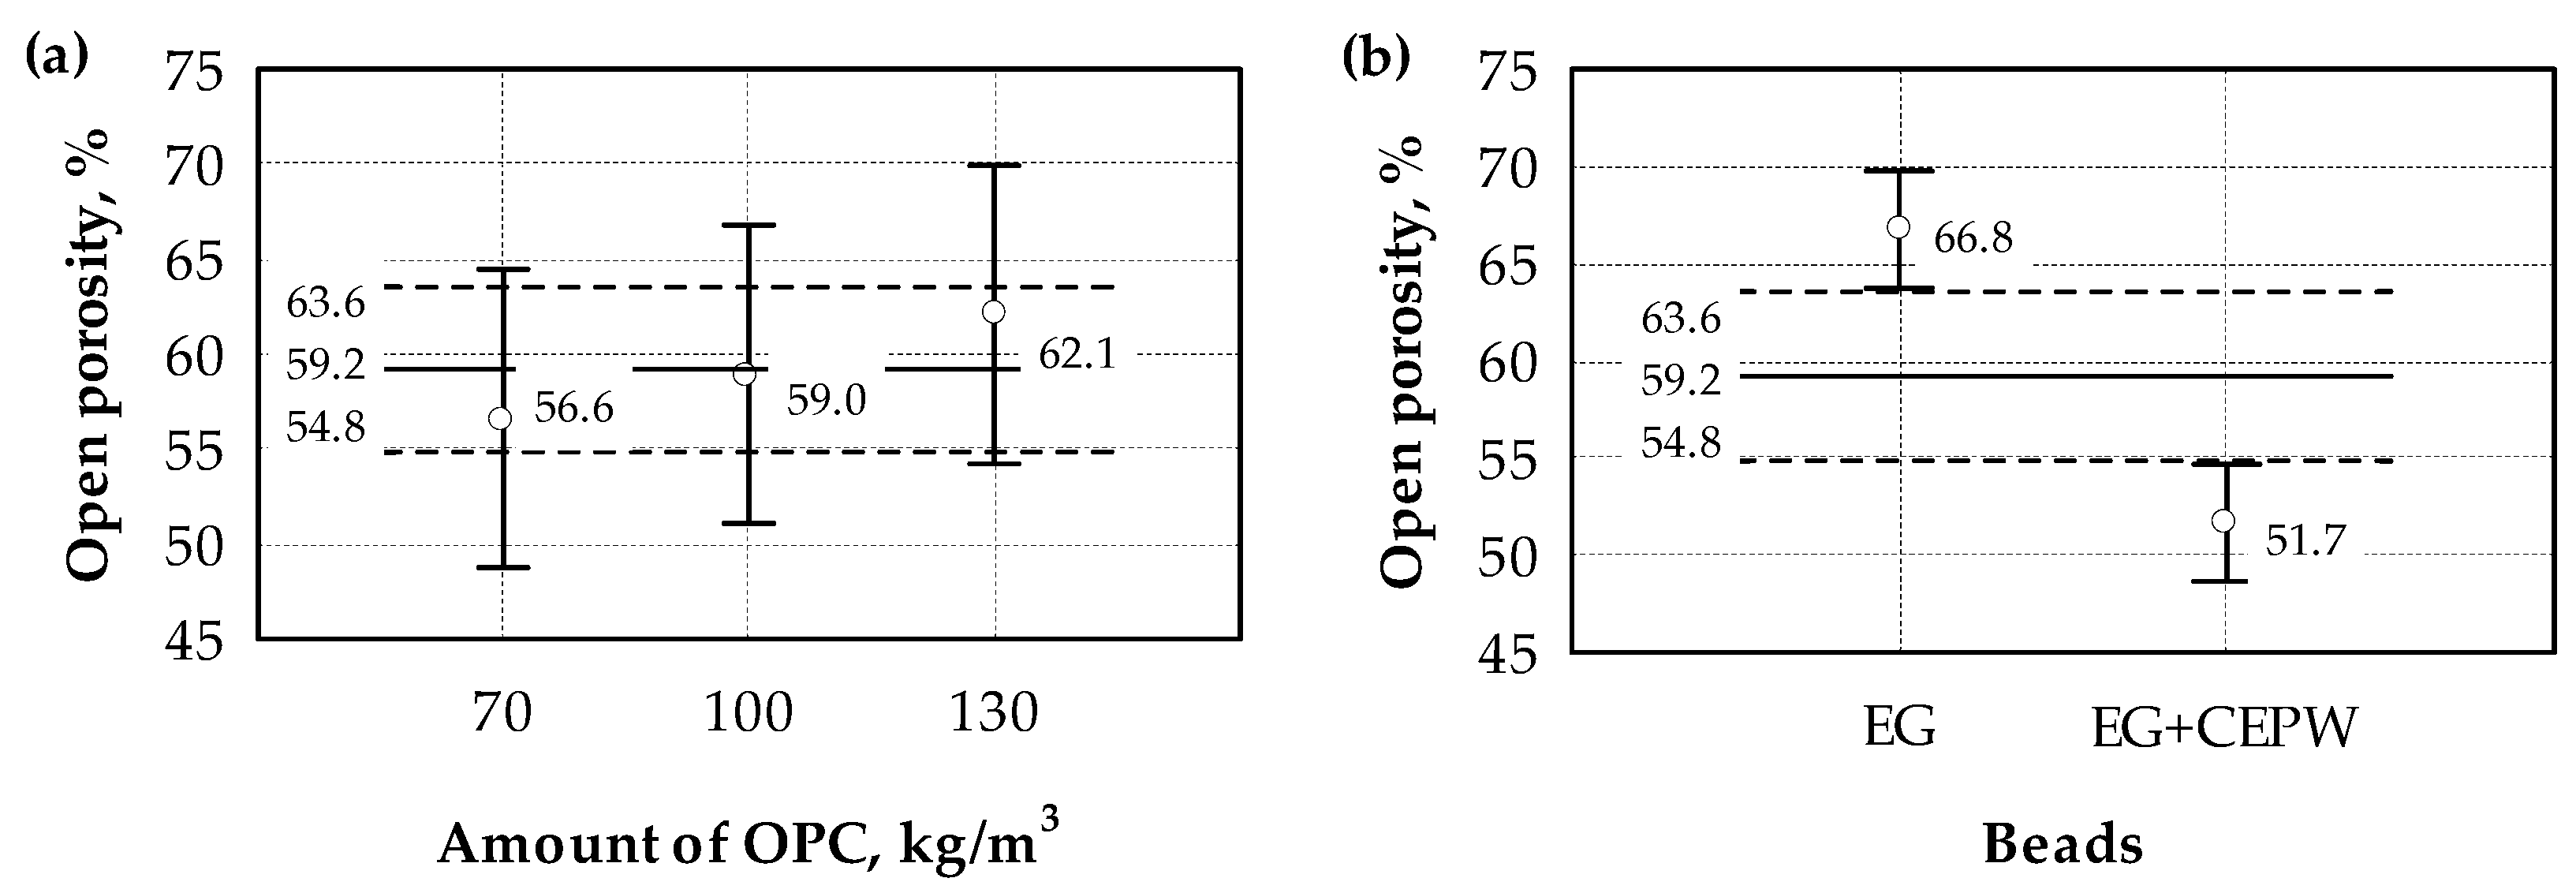
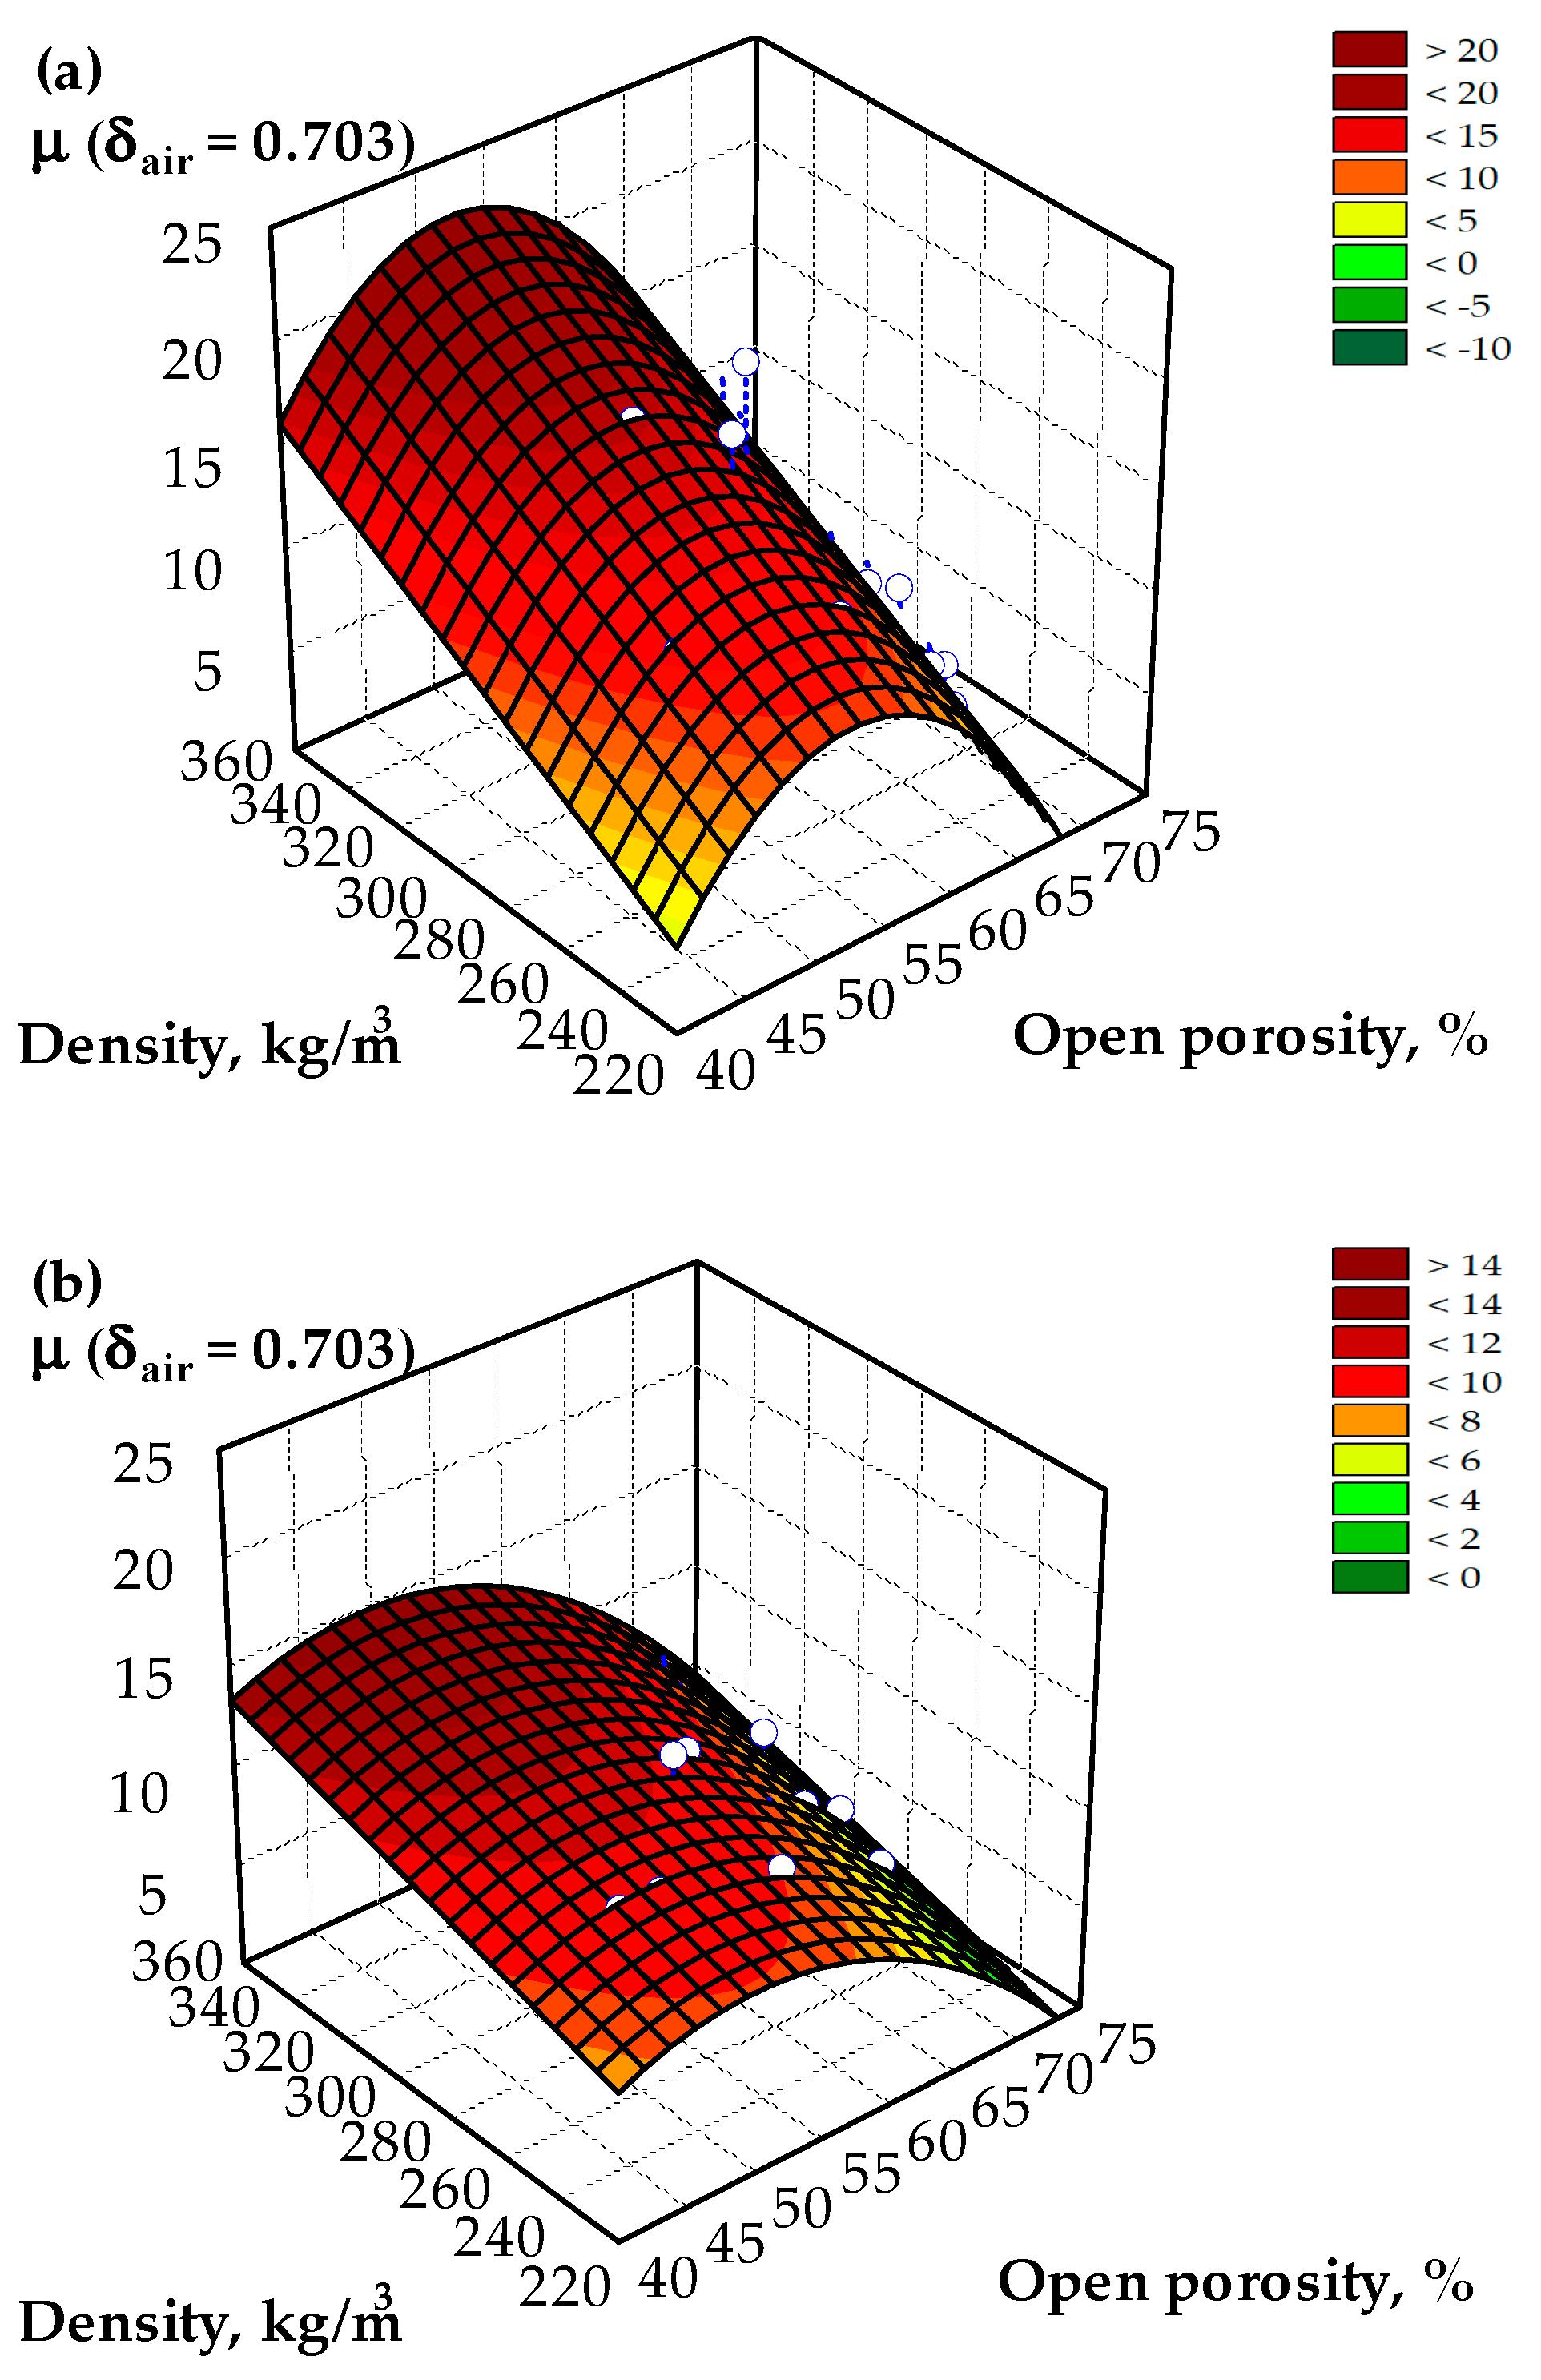
3.2. Analysis of the Water Vapour Permeability

The water vapour permeability test of the LWC specimens was then performed. To check whether the difference is significant between the average values of the test results obtained from the vapour permeability test for LWC depending on the amount of cement and the type of beads (EG and EG+CEPW), a dispersion analysis was performed (Figure 10 and Table 7). Variance analysis shows that the difference in the average values of vapour permeability under 23–50/93 conditions (Figure 10a and Table 7) is insignificant. Consequently, the average value of the water vapour diffusion resistance factor is ~9.91. The highest difference occurs when the amount of cement is 70 and 130 kg; this difference reaches ~1.8 times. Under 23–0/50 conditions (Figure 10b and Table 7), the difference in the average values of the water vapour diffusion resistance factor is also insignificant, and the average value is ~8.43. The highest difference occurs when the amount of cement is 70 and 130 kg; this difference reaches ~1.4 times.
Further analysis shows that changing the type of beads with the partial number of different beads (EG and EG+CEPW) does not significantly affect the water vapour permeability of lightweight concrete. The analysis shows a statistically significant difference between the means of the water vapour diffusion resistance factor (Figure 10c,d, and Table 7). After the partial replacement of EG beads with CEPW beads (conditions 23–50/93, Figure 10), a sharp difference between the average values is visible; this difference is ~1.9 times. Similarly, under 23–0/50 conditions (Figure 10d), the difference is ~1.5 times. It can be seen that, after replacing the amount of EG beads with CEPW beads, the value of µ increases and the permeability of water vapour decreases under both conditions (23–50/93 and 23–0/50).
Experimental studies on the number of open pores have shown (Figure 11a and Table 8) that the differences between the average values of the results, depending on the amount of cement, are insignificant. When the amount of cement varies from 70 to 130 kg, the average value of open pores is 59.2%. Meanwhile, the difference between the number of open pores occurs after the partial replacement of EG beads with CEPW beads (Figure 11b). The dispersion analysis carried out shows a statistically significant difference between the average values of the number of open pores (Figure 11b and Table 8). It can be seen that, after replacing part of the number of EG beads with CEPW beads, the number of open pores decreases, and the difference is ~1.3 times.
The current study attempts to evaluate the degree of variation in the water vapour diffusion resistance factor, depending on the density of the material and the number of open pores, under different conditions (23–50/93 and 23–0/50). A relationship is approximated by the multicriteria regression Equation (3) under 23–50/93 conditions:
μ = 121.67 + 4.334 · o p . p o r o s i t y + 0.0844 · ρ 0.0413 · o p . p o r o s i t y 2  
with the coefficient of determination R o p . p · ρ 2 = 0.771 , and mean squared deviation S r = 1.12 . The regression Equation (4) under 23–0/50 conditions is as follows:
μ = 41.24 + 1.639 · o p . p o r o s i t y + 0.0418 · ρ 0.01642 · o p . p o r o s i t y t 2  
with the coefficient of determination R o p . p · ρ 2 = 0.790 , and mean squared deviation S r = 1.12 .
Moreover, the water vapour diffusion resistance factor is dependent on the density and the number of open pores of LWC (Figure 12). The high values of the coefficients of determination of the multicriteria analysis show that the water vapour diffusion resistance factor is accurately characterized by the values of the input variable, the density of the material, and the values of the number of open pores.

3.3. Analysis of the Flammability

For flammability assessment, the products were exposed to an open flame. The results are presented in Table 9. From the data presented, it can be seen that flammability does not occur in specimens with EG aggregate, whereas in specimens with EG and CEWP aggregate, flammability occurs and the highest flame height is obtained for the specimen with the lowest OPC content. This shows that both the aggregate and cement contents have a significant effect on the flammability of lightweight concrete. Although transient flammability is observed for specimens with CEPW beads, the damage is not serious, and the melting of CEPW beads is visually visible. Furthermore, after the flame is removed, there is no spread of the fire, no separation of individual particles of the specimen, and no smouldering.
According to the EN 13823 [47] methodology, the test assesses the contribution of the product to the spread of fire by simulating the situation of a fire caused by a single burning object. The test results according to EN 13823 [47] are presented in Table 10. Specimens with the lowest amount of OPC, i.e., specimens of composition 1 and 4 (see Table 4), were prepared for the tests. As the test results show, there is no lateral flame propagation during the test, the rate of fire growth is zero, and the total amount of heat in all cases is more than 10 times lower than the allowable for A2 flammability class materials.
The non-combustibility test according to EN ISO 1182 [48] was used to check whether the product meets the requirements of the flammability classes A1 and A2. The results of non-combustibility tests are presented in Table 11. According to the values of temperature increase, mass loss of the specimens, and duration of non-stop burning, the flammability of the specimens is classified according to the requirements of EN 13501-1 [51].
In the specimens of compositions 1, 2, and 3, there is no flaming process, the temperature does not rise above 50 °C, and the mass loss is approximately 4%. The specimens of compositions 4, 5, and 6 show small mass losses, the temperature increase is higher than 50 °C, and the specimens support flaming. Only the specimens with a temperature increase of no more than 50 °C, a mass loss of no more than 50%, and a flaming duration of no more than 20 s can be assigned to the A2 flammability class. The specimens of compositions 4, 5, and 6 meet the requirements of the A2 flammability class according to the requirements for mass loss and flame duration but do not meet the requirement for the permitted temperature increase. In addition, the tests were carried out according to EN 1716 [49]. The average upper calorific value obtained during the determination of the total heat of combustion according to the requirements of EN ISO 1716 [49] is equal to 1.049 MJ/kg. According to the requirements of EN 13501-1 [51], the average maximum calorific value of A2 class products must be less than 3.0 MJ/kg. Furthermore, the substances are evaluated according to the fall of flaming droplets and particles and the generation of smoke. Since no flaming droplets and particles are formed, the material corresponds to subclass d0. Furthermore, according to the smoke formation index, subclass s1 is determined. Therefore, the specimens of compositions 4, 5, and 6 correspond to the class of flammability A2-s1, d0.

3.4. Analysis of the Thermal Stability

To examine what processes take place during the burning of the material, thermal stability studies are carried out. The thermal resistance of thermal insulation with aggregates EG and EG/CEPW is evaluated by means of thermogravimetric and differential thermal analyses. The graphical representation is depicted in Figure 13, and the summarized results are shown in Table 12. Two endothermic effects can be observed for thermal insulation with aggregate EG and four effects can be observed for thermal insulation with EG/CEPW aggregates. The endothermic peak Tmax.1 at 110 °C for both compositions within the temperature range from 40 to 240 °C corresponds to the evaporation of free water existing within the pores, i.e., the water which was adsorbed by the hydrated compounds and the dehydration of the ettringite and C-S-H. The total weight losses observed at this stage are 1.80 and 2.55% for, respectively, composition 1 and composition 4. Santos et al. [52] reported that the complete decomposition of ettringite takes place around the temperature range of (90–100) °C, while C-S-H in gel form decomposes within the temperature range of (200–450) °C. However, scientists [53,54,55] reported a wider range of decomposition temperatures for analyzed compounds.
The second endothermic peak Tmax.2 in the temperature range of (240–395) °C with a total weight loss of 3.2% corresponds to the thermal decomposition of the CEPW aggregate, although the authors Shao et al. [55] indicated that the beginning of the thermal degradation of EPS may be shifted to 283 °C and the end to 412 °C. The third endothermic peak Tmax.3 at 440 and 445 °C for, respectively, composition No. 1 and composition No. 4, observed between 395 and 475 °C, belongs to the decomposition of portlandite. It can also be noted that Tmax.3 for composition No. 1 is not as visible as for composition No. 4 as it starts to overlap with the decomposition of calcium hydroxide at a temperature of 450 °C [56] and the start of degradation of amorphous calcite at 430 °C.
Li et al. [57] determined that the thermal decomposition of amorphous calcite can take up to 600 °C. Therefore, it also overlaps the most intensive peaks at 690 and 710 °C in the temperature range (600–755) °C for, respectively, composition No. 1 and composition No. 4, with weight losses equal to 2.9 and 5.8%, which are assigned to the decarbonisation of crystalline calcite. Additionally, the results obtained for the char yield at 1000 °C indicate that thermal insulation with composition No. 1 is more thermally stable compared to thermal insulation with composition No. 4.

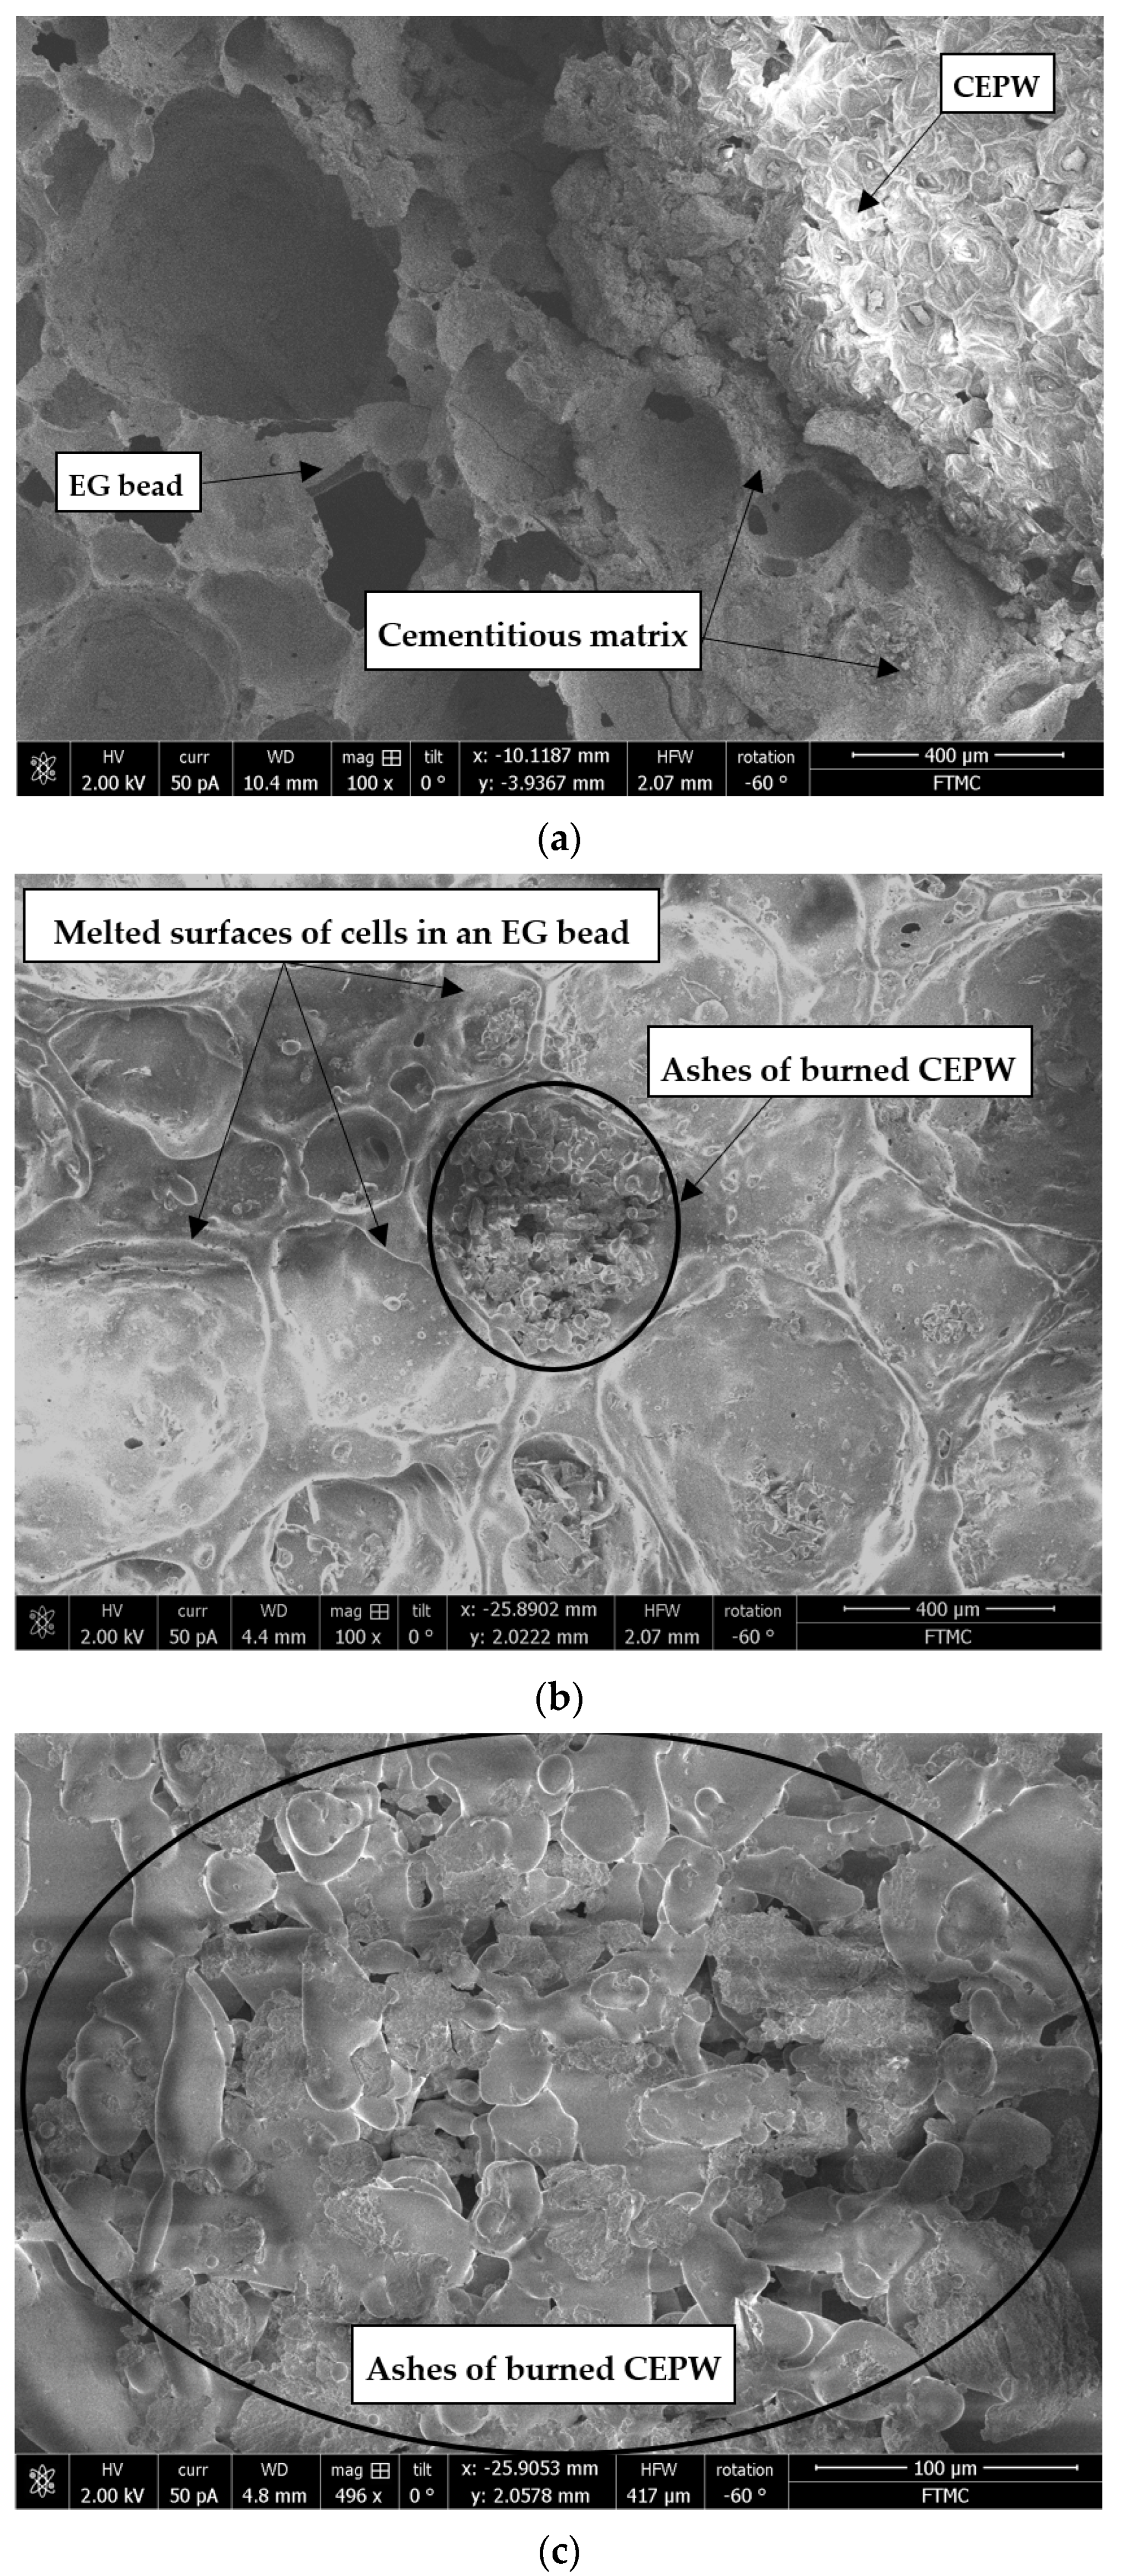
3.5. Analysis of the Microstructure

The analysis of the structure of the LWC specimens is presented in Figure 14 and Figure 15. A general view of LWC with EG beads is presented in Figure 14a. It can be seen that the cement matrix binds to the two EG beads. The cement matrix in this composite not only forms bonds between the individual beads and ensures the strength properties of the composite but also has a certain effect on the impact on moisture properties and fire resistance. As scientists point out [58], lower W/C (to a certain limit) inhibits the spread of fire in the material under the influence of a fire source, i.e., higher cement content results in increased hydration reaction, leading to better fire resistance.
The prepared LWC products with EG aggregate were exposed to a low-flame fireplace. Figure 14b shows that totally melted cells are formed on the surface of the EG bead. As a result of the melting process on the surface of the bead, all the cells take on round shapes. A deeper analysis shows (see Figure 14c) that the cells not only melt but also exfoliate. A large number of individual particles with a size of 15–400 µm are formed throughout the cut of the specimen. Such separation is likely to be caused primarily by the high stresses caused by the high temperatures of the fire and, from a chemical point of view, by the separation of the individual chemical elements. Vlasova et al. [59] studied changes in glass and found that, during melting, the separation of individual phases occurs primarily in glass which is associated with the differences in the melting temperatures of individual raw materials which vary from 850 to 1713 °C.
In Figure 15a, the structure of LWC with EG and CEPW beads is shown. Both types of beads are connected by a thin layer of cement matrix. CEPW, coated with a thin layer of OPC, burns when exposed to a fire (Figure 15b). After the CEPW burns, an ash layer forms on the EG beads, and the surface of the EG beads itself begins to melt. In Figure 15c, the ash particles formed after the combustion of the CEPW beads are clearly visible.

4. Conclusions

Both the type of aggregate and the amount of OPC determine the density of the lightweight composite and at the same time the properties of LWC. The density of LWC developed in the current work ranged from 225 to 375 kg/m3.
The density has the greatest influence on short-term water absorption, the amount of cement has the greatest influence on capillary water absorption, and the amount of cement and the type of beads have a significant influence on the water vapour permeability of LWC in both wet and dry conditions.
According to all the parameters tested, specimens without CEPW aggregate can be classified as non-combustible products corresponding to class A1 according to the average upper calorific value, subclass d0 according to the formation of flaming droplets or particles, and subclass S0 according to the smoke generation index.
Specimens with EG and CEPW aggregates can be assigned to the flammability class A2. Since no flaming droplets and particles were formed, the material corresponds to subclass d0, and according to the smoke generation index, subclass s1 was determined.
Thermal stability analysis showed that the highest mass losses in the samples occur as a result of the evaporation of free water at high temperatures and the decomposition of chemical compounds. The total mass losses at 1000 °C for samples with only EG aggregate and for samples with EG and CEPW aggregates are 8.7 and 16.7%, respectively.

Author Contributions

Conceptualisation, S.V. (Sigitas Vėjelis) and J.Š.-J.; methodology, S.V. (Sigitas Vėjelis), J.Š.-J. and A.K. (Arūnas Kremensas); software, J.Š.-J. and S.V. (Saulius Vaitkus); validation, J.Š.-J. and A.K. (Agnė Kairytė); formal analysis, S.V. (Sigitas Vėjelis) and S.V. (Saulius Vaitkus); investigation, S.V. (Sigitas Vėjelis), A.K. (Agnė Kairytė), A.K. (Arūnas Kremensas), S.V. (Saulius Vaitkus) and J.Š.-J.; resources, J.Š.-J. and S.V. (Sigitas Vejelis); data curation, S.V. (Sigitas Vėjelis); writing—S.V. (Sigitas Vėjelis) and J.Š.-J.; writing—review and editing, S.V. (Sigitas Vėjelis) and J.Š.-J. and A.K. (Agnė Kairytė); visualisation, A.K. (Agnė Kairytė); supervision, S.V. (Sigitas Vėjelis) and J.Š.-J. All authors have read and agreed to the published version of the manuscript.

Funding

This research received no external funding.

Data Availability Statement

Data are contained within the article.

Conflicts of Interest

The authors declare no conflicts of interest.

References

  1. Sidney, M.; Young, J.F.; Darwin, D. Concrete, 2nd ed.; Prentice Hall, Pearson Education, Inc.: Upper Saddle River, NJ, USA, 2003. [Google Scholar]
  2. Kurpińska, M.; Ferenc, T. Effect of porosity on physical properties of lightweight cement composite with foamed glass aggregate. In Proceedings of the II International Conference of Computational Methods in Engineering Science, Gdańsk, Poland, 15 December 2017. [Google Scholar] [CrossRef]
  3. Bumanis, G.; Bajare, D.; Korjakins, A. Mechanical and Thermal Properties of Lightweight Concrete Made from Expanded Glass. J. Sustain. Archit. Civ. Eng. 2013, 2, 19–25. [Google Scholar] [CrossRef]
  4. Polat, R.; Demirboğa, R.; Karakoç, M.B.; Türkmen, I. The infuence of lightweight aggregate on the physicomechanical properties of concrete exposed to freeze-thaw cycles. Cold Reg. Sci. Technol. 2010, 60, 51–56. [Google Scholar] [CrossRef]
  5. Yu, R.; Van Onna, D.V.; Spiesz, P.; Yu, Q.L.; Brouwers, H.J.H. Development of ultra-lightweight fibre reinforced concrete applying expanded waste glass. J. Clean. Prod. 2016, 112, 690–701. [Google Scholar] [CrossRef]
  6. Adhikary, S.K.; Rudžionis, Ž. Influence of expanded glass aggregate size, aerogel and binding materials volume on the properties of lightweight concrete. Mater. Today Proc. 2020, 32, 712–718. [Google Scholar] [CrossRef]
  7. Dias, N.; Garrinhas, I.; Maximo, A.; Belo, N.; Roque, P.; Carvalho, M.T. Recoveryof glass fromthe inert fraction refused by MBT plants in a pilot plant. Waste Manag. 2015, 46, 201–211. [Google Scholar] [CrossRef]
  8. Vanitha, S.; Natrajan, V.; Praba, M. Utilization of waste plastics as a partial replacement of coarse aggregate in concrete blocks. Indian. J. Sci. Technol. 2015, 8, 1–6. [Google Scholar] [CrossRef]
  9. Kristalya, F.; Szabob, R.; Madaic, F.; Debreczeni, A.; Mucsie, G. Lightweight composite from fly ash geopolymer and glass foam. J. Sustain. Cem.-Based Mater. 2020, 10, 1–22. [Google Scholar] [CrossRef]
  10. Souza, M.T.; Maia, B.G.O.; Teixeira, L.B.; de Oliveira, K.G.; Teixeira, A.H.B.; de Oliveira, A.P.N. Glass foams produced from glass bottles and eggshell wastes. Process Saf. Environ. Prot. 2017, 111, 60–64. [Google Scholar] [CrossRef]
  11. Petersen, R.R.; König, J.; Yue, Y. The viscosity window of the silicate glass foam production. J. Non-Cryst. Solids 2017, 456, 49–54. [Google Scholar] [CrossRef]
  12. Mohajerani, A.; Vajna, J.; Cheung, T.H.; Kurmus, H.; Arulrajah, A.; Horpibulsuk, S. Practical recycling applications of crushed waste glass in construction materials: A review. Constr. Build. Mater. 2017, 156, 443–467. [Google Scholar] [CrossRef]
  13. Lakov, L.; Jivov, B.; Aleksandrova, M.; Ivanova, Y.; Toncheva, K. An innovative composite material based on sintered glass foam granules. J. Chem. Technol. Metall. 2018, 53, 1081–1086. [Google Scholar]
  14. Dixit, A.; Pang, S.D.; Kang, S.-H.; Moon, J. Lightweight structural cement composites with expanded polystyrene (EPS) for enhanced thermal insulation. Cem. Concr. Compos. 2019, 102, 185–197. [Google Scholar] [CrossRef]
  15. Šeputytė, J. Impact of Additives and Lightweight Aggregates on the Structure and Properties of Thermal Insulating Cementitious Composite. Doctoral Dissertation, Vilnius Gediminas Technical University, Vilnius, Lithuania, 2016; p. 129. [Google Scholar]
  16. Demirel, B. Optimization of the composite brick composed of expanded polystyrene and pumice blocks. Constr. Build. Mater. 2013, 40, 306–313. [Google Scholar] [CrossRef]
  17. Raps, D.; Hossieny, N.; Park, C.B.; Altstadt, V. Past and present developments in polymer bead foams and bead foaming technology. Polymer 2015, 56, 5–19. [Google Scholar] [CrossRef]
  18. Wang, S.; Lim, J.L.G.; Tan, K.H. Performance of lightweight cementitious composite incorporating carbon nanofibers. Cem. Concr. Compos. 2020, 109, 103561. [Google Scholar] [CrossRef]
  19. Šeputytė-Jucikė, J.; Vėjelis, S.; Kizinievič, V.; Kairytė, A.; Vaitkus, S. The Effect of Expanded Glass and Crushed Expanded Polystyrene on the Performance Characteristics of Lightweight Concrete. Appl. Sci. 2023, 13, 4188. [Google Scholar] [CrossRef]
  20. Adhikary, S.K.; Ashish, D.K. Turning waste expanded polystyrene into lightweight aggregate: Towards sustainable construction industry. Sci. Total Environ. 2022, 837, 155852. [Google Scholar] [CrossRef] [PubMed]
  21. Matsuo, E. Properties of Lightweight Concrete Using Expanded Polystyrene as Aggregate. Int. J. Environ. Rural Dev. 2019, 10, 8–13. [Google Scholar] [CrossRef]
  22. Kadhim, F.J.; Muammar, A.; Almusawi, J.K.; Abed, M.S. A study of characteristics of man-made lightweight aggregate and lightweight concrete made from expanded polystyrene (eps) and cement mortar. Open Eng. 2023, 13, 20220432. [Google Scholar] [CrossRef]
  23. Sayadi, A.A.; Tapia, J.V.; Neitzert, T.R.; Clifton, G.C. Effects of expanded polystyrene (EPS) particles on fire resistance, thermal conductivity and compressive strength of foamed concrete. Construct. Build. Mater. 2016, 112, 716–724. [Google Scholar] [CrossRef]
  24. Pundienė, I.; Pranckevičienė, J.; Kligys, M.; Kizinievič, O. The synergetic interaction of chemical admixtures on the properties of eco-friendly lightweight concrete from industrial technogenic waste. Construct. Build. Mater. 2020, 256, 119461. [Google Scholar] [CrossRef]
  25. Adhikary, S.K.; Ashish, D.K.; Rudžionis, Ž. Expanded glass as. light-weight aggregate in concrete—A review. J. Clean. Prod. 2021, 313, 127848. [Google Scholar] [CrossRef]
  26. Kazmina, O.V.; Tokareva, A.Y.; Vereshchagin, V.I. Using quartzofeldspathic waste to obtain foamed glass material. Resour. Technol. 2016, 2, 23–29. [Google Scholar] [CrossRef]
  27. Chakartnarodom, P.; Ineure, P. Foam glass development using glass cullet and fly ash or rice husk ash as the raw materials. Key Eng. Mater. 2014, 608, 73–78. [Google Scholar] [CrossRef]
  28. Yio, M.H.N.; Xiao, Y.; Ji, R.; Russell, M.; Cheeseman, C. Production of foamed glass-ceramics using furnace bottom ash and glass. Ceram. Int. 2020, 47, 8697–8706. [Google Scholar] [CrossRef]
  29. Šeputytė-Jucikė, J.; Sinica, M. The effect of expanded glass and polystyrene waste on the properties of lightweight aggregate concrete. Eng. Struct. Technol. 2016, 8, 31–40. [Google Scholar] [CrossRef]
  30. Adhikary, S.K.; Rudžionis, Ž.; Tučkutė, S.; Ashish, D.K. Effects of carbon nanotubes on expanded glass and silica aerogel based lightweight concrete. Sci. Rep. 2021, 11, 2104. [Google Scholar] [CrossRef]
  31. Pichor, W.; Kaminski, A.; Szoldra, P.; Frac, M. Lightweight cement mortars with granulated foam glass and waste perlite addition. Adv. Civ. Eng. 2019, 2019, 1705490. [Google Scholar] [CrossRef]
  32. Spiesz, P.; Yu, Q.L.; Brouwers, H.J.H. Development of cement-based lightweight composites—Part 2: Durability-related properties. Cement Concr. Compos. 2013, 44, 30–40. [Google Scholar] [CrossRef]
  33. Torres, M.L.; García-Ruiz, P.A. Lightweight pozzolanic materials used in mortars: Evaluation of their influence on density, mechanical strength and water absorption. Cem. Concr. Compos. 2009, 31, 114–119. [Google Scholar] [CrossRef]
  34. Carsana, M.; Bertolini, L. Durability of lightweight concrete with expanded glass and silica fume. ACI Mater. J. 2017, 114, 207–213. [Google Scholar] [CrossRef]
  35. Gülengül, S.; Kar, F. Evaluation of the expanded glass as a light concrete aggregate. Innov. Infrastruct. Solut. 2022, 7, 149. [Google Scholar] [CrossRef]
  36. Namsone, E.; Sahmenko, G.; Namsone, E.; Korjakins, A. Reduction of the capillary water absorption of foamed concrete by using the porous aggregate. IOP Conf. Ser. Mater. Sci. Eng. 2017, 251, 12030. [Google Scholar] [CrossRef]
  37. Du, H. Properties of ultra-lightweight cement composites with nano-silica. Construct. Build. Mater. 2019, 199, 696–704. [Google Scholar] [CrossRef]
  38. Chung, S.-Y.; Sikora, P.; Kim, D.J.; El Madawy, M.E.; Abd Elrahman, M. Effect of different expanded aggregates on durability-related characteristics of lightweight aggregate concrete. Mater. Charact. 2021, 173, 110907. [Google Scholar] [CrossRef]
  39. Ducman, V.; Mirtic, B. Water vapour permeability of lightweight concrete prepared with different types of lightweight aggregates. Construct. Build. Mater. 2014, 68, 314–319. [Google Scholar] [CrossRef]
  40. EN 196-2; Method of Testing Cement—Part 2: Chemical Analysis of Cement. European Committee for Standardization: Brussels, Belgium, 2013.
  41. EN 1097-6; Tests for Mechanical and Physical Properties of Aggregates—Part 6: Determination of Particle Density and Water Absorption. European Committee for Standardization: Brussels, Belgium, 2022.
  42. EN 29767; Thermal Insulating Products for Building Applications—Determination of Short-Term Water Absorption by Partial Immersion. European Committee for Standardization: Brussels, Belgium, 2016.
  43. EN 772-11; Methods of Test for Masonry Units—Part 11: Determination of Water Absorption of Aggregate Concrete, Autoclaved Aerated Concrete, Manufactured Stone and Natural Stone Masonry Units due to Capillary Action and the Initial Rate of Water Absorption of Clay Masonry Units. European Committee for Standardization: Brussels, Belgium, 2011.
  44. EN 12086; Thermal Insulating Products for Building Applications—Determination of Water Vapour Transmission Properties. European Committee for Standardization: Brussels, Belgium, 2013.
  45. EN ISO 4590; Rigid Cellular Plastics—Determination of the Volume Percentage of Open Cells and of Closed Cells. European Committee for Standardization: Brussels, Belgium, 2016.
  46. EN ISO 11925-2; Reaction to Fire Tests—Ignitability of Products Subjected to Direct Impingement of Flame—Part 2: Single-Flame Source Test. European Committee for Standardization: Brussels, Belgium, 2020.
  47. EN 13823; Reaction to Fire Tests for Building Products—Building Products Excluding Floorings Exposed to the Thermal Attack by a Single Burning Item. European Committee for Standardization: Brussels, Belgium, 2022.
  48. EN ISO 1182; Reaction to Fire Tests for Products—Non-Combustibility Test. European Committee for Standardization: Brussels, Belgium, 2020.
  49. EN ISO 1716; Reaction to Fire Tests for Products—Determination of the Gross Heat of Combustion (Calorific Value). European Committee for Standardization: Brussels, Belgium, 2018.
  50. Data Science Textbook. 2020. Available online: https://docs.tibco.com/data-science/textbook (accessed on 15 December 2023).
  51. EN 13501-1; Fire Classification of Construction Products and Building Elements—Part 1: Classification Using Data from Reaction to Fire Tests. European Committee for Standardization: Brussels, Belgium, 2018.
  52. Santos, T.A.; e Silva, G.A.O.; Ribeiro, D.V. Mineralogical analysis of portland cement pastes rehydrated. J. Solid Waste Technol. Manag. 2020, 46, 15–23. [Google Scholar] [CrossRef]
  53. Sikarskas, D. Effect of Aluminosilicate Pozzolanic Additives and Polyvinyl Alcohol Fibre on the Structure and Physical-Mechanical Properties of the Lightweight Composite. Doctoral Dissertation, Vilnius Gediminas Technical University, Vilnius, Lithuania, 2023; p. 113. [Google Scholar]
  54. Zenga, Q.; Fanga, R.; Lib, H.; Penga, Y.; Wang, J. Tailoring the thermal and mechanical properties of lightweight cementbased composites by macro and micro fillers. Cem. Concr. Compos. 2019, 102, 169–184. [Google Scholar] [CrossRef]
  55. Shao, X.; Du, Y.; Zheng, X.; Wang, J.; Wang, Y.; Shao, S.; Xin, Z.; Li, L. Reduced fire hazards of expandable polystyrene building materials via intumescent flame-retardant coatings. J. Mater. Sci. 2020, 55, 7555–7572. [Google Scholar] [CrossRef]
  56. El-Diadamony, H.; Amer, A.A.; Sokkary, T.M.; El-Hoseny, S. Hydration and characteristics of metakaolin pozzolanic cement pastes. HBRC J. 2018, 14, 150–158. [Google Scholar] [CrossRef]
  57. Li, L.; Ziyabek, N.; Jiang, Y.; Xiao, J.; Poon, C.S. Effect of carbonation duration on properties of recycled aggregate concrete. Case Stud. Constr. Mater. 2023, 19, e02640. [Google Scholar] [CrossRef]
  58. Abed, M.A.; Lubloy, E. Understanding the effect of recycled concrete aggregate and cementitious materials on concrete’s fire resistance. J. Struct. Fire Eng. 2022, 13, 421–432. [Google Scholar] [CrossRef]
  59. Vlasova, I.E.; Yapaskurt, V.O.; Averin, A.A.; Melnik, O.E.; Zolotov, D.A.; Senin, R.A.; Poliakova, T.R.; Nevolin, I.M.; Kalmykov, S.N.; Shiryaev, A.A. Nuclear Melt Glass from Experimental Field, Semipalatinsk Test Site. Energies 2022, 15, 9121. [Google Scholar] [CrossRef]
Figure 1. Technological scheme of thermal insulation composite. The numbers indicate the sequence of mixing the raw materials and preparing the mixture. During the preparation of the mixture, either EG up to 2 mm or CEPW up to 2 mm was used; see No. 7.
Jcs 08 00105 g001
Figure 2. Composite specimens during the experiment with (a) KNO3 aqueous solution; (b) dry CaCl2 salt.
Jcs 08 00105 g002
Figure 3. The ignitability of a vertically oriented test specimen when exposed to a small flame.
Jcs 08 00105 g003
Figure 4. Mounting test scheme of specimens according to requirements of EN 13823: 1—long wing; 2—short wing; 3—burner; 4—wagon; 5—fixings.
Jcs 08 00105 g004
Figure 5. Non-flammability test: (a) test equipment; (b) composite specimen during experiment.
Jcs 08 00105 g005
Figure 6. Principal scheme of the calorimetric bomb: 1—mixer for uniform mixing of water, 2—jacket cover, 3—fuse cables, 4—water thermometer, 5—calorimeter vessel, 6—water in the jacket, 7—calorimetric bomb, 8—fuse wire, and 9—crucible containing the sample.
Jcs 08 00105 g006
Figure 7. Dependence of short-term water absorption on the density of lightweight concrete: ○—experimental results; ───—the results of an empirical line; - - -—the predicted values (with 0.95 probability).
Jcs 08 00105 g007
Figure 8. Dependence of capillary water absorption coefficient of the LWC on the soaking duration: ○—experimental results; ───—the results of an empirical line.
Jcs 08 00105 g008
Figure 9. Dependence of capillary water absorption coefficient of the LWC on the immersion duration: ○—experimental results; ───—the average of the results; - - -—confidence intervals of the results (with 0.95 probability); (a) after 10 min (OPC, kg/m3); (b) after 24 h (OPC, kg/m3); (c) after 10 min (beads); (d) after 24 h (beads).
Jcs 08 00105 g009
Figure 10. Water vapour diffusion resistance factor of lightweight concrete: ○—experimental results; ───—the average of the results; - - -—confidence intervals of the results (with 0.95 probability): (a) OPC, kg/m3 (environmental conditions 23–50/93); (b) OPC, kg/m3 (environmental conditions 23–0/50); (c) beads (environmental conditions 23–50/93); (d) beads (environmental conditions 23–50/93).
Jcs 08 00105 g010
Figure 11. Open porosity of lightweight concrete: ○—experimental results; ───—the average of the results; - - -—confidence intervals of results (with 0.95 probability): (a) OPC, kg/m3; (b) beads.
Jcs 08 00105 g011
Figure 12. Estimation of the water vapour diffusion resistance factor based on the density and the number of open pores of the lightweight concrete under environmental conditions: (a) 23–50/93; (b) 23–0/50.
Jcs 08 00105 g012
Figure 13. Thermal degradation pattern of thermal insulation with EG and EG/CEPW aggregates: (a) TGA; (b) DTG.
Jcs 08 00105 g013
Figure 14. Microstructure of LWC with EG beads: (a) EG beads connected by cementitious matrix, ×100; (b) EG cell surfaces after exposure to fire, ×100; (c) EG cell surfaces after exposure to fire, ×500.
Jcs 08 00105 g014
Figure 15. Microstructure of LWC with EG and CEPW beads: (a) EG and CEPW beads connected by cementitious matrix, ×100; (b) EG and CEPW cell surfaces after exposure to fire, ×100; (c) EG and CEPW cell surfaces after exposure to fire, ×500.
Jcs 08 00105 g015
Table 1. Chemical composition of OPC.
Chemical Composition of OPC, %
SiO2Al2O3Fe2O3CaOMgOK2ONa2OSO3Other
19.234.913.5062.463.190.940.123.102.55
Table 2. Chemical composition of MKW.
Chemical Composition of MKW, %
SiO2Al2O3Fe2O3CaOMgOK2O + Na2OTiO2Other
46.137.21.100.200.200.700.7013.8
Table 3. Main properties of AEA and SPL additives.
Title of
Additive
Properties
pHElectrical Conductivity, µS/cmShapeThe Amount of
Active Substance, %
AEA8.0-White powder94.0
SPL8.4250Yellow powder-
Table 4. Compositions of mixtures of lightweight concrete.
Amount of Raw Materials per 1 m3 of Mixture, kgMixture Composition Number
123456
OPC7010013070100130
MKW7101371013
SPL0.350.500.650.350.500.65
AEA0.01750.02500.03250.01750.02500.0325
EG (8–16) mm72
EG (4–8) mm28
EG (0–2) mm58
CEPW (0–2) mm5
W/C0.560.420.340.660.530.46
Table 5. Results of statistical analysis.
EquationRR2Adjusted R2 S r Fp
1
W p = 0.0164 · ρ 0.915
0.9490.9010.894 0.234   k g m 3 145.780
2
C w , s = 2069.58 · t 0.978
0.9710.9430.942 0.317   g m 2 · s 333.200
Table 6. Analysis of variance of capillary water absorption coefficient the LWC on the soaking duration (ANOVA).
CoefficientMultiple R2Adjusted R2FpNote
Coefficients for Figure 9
(a)0.3820.3004.640.0271Significant
(b)0.5980.54411.160.0107Significant
(c)0.000210−0.06230.003360.955Non-significant
(d)0.0388−0.02120.6470.433Non-significant
Table 7. Variance analysis of the water vapour diffusion resistance factor of LWC (ANOVA).
CoefficientMultiple R2Adjusted R2FpNote
Coefficients for Figure 10
(a)0.3140.2223.430.0595Non-significant
(b)0.2750.1782.840.0899Non-significant
(c)0.5390.51018.680.000526Significant
(d)0.6940.67536.270.0000180Significant
Table 8. Analysis of open porosity variance (ANOVA).
CoefficientMultiple R2Adjusted R2FpNote
Coefficients for Figure 11
(a)0.0689−0.05530.5550.587Non-significant
(b)0.7800.76656.770.000001Significant
Table 9. Assessment of the flammability of composites.
Number of Compositions123456
Combustion after removing the flame sourceNoNoNoNoNoNo
The flame reaches 150 mm in heightNo
(0 mm)
No
(0 mm)
No
(0 mm)
No
(32 mm)
No
(29 mm)
No
(26 mm)
Time when the flame reaches 150 mm height, s------
Filter paper ignitionNoNoNoNoNoNo
SmoulderingNoNoNoNoNoNo
Table 10. Flammability test results.
Composition NumberDensity of Specimens, kg/m3Heat Release Rate
(HRRmean), kW
Total Heat Released (THR600s), MJSmoke Production Rate (SPRmean), m2/s,Total Smoke Production (TSP600s), m2Smoke Generation Rate Indicator (SMOGRA), cm2/s2An Indicator of the Rate of Fire Growth (FIGRA (=FIGRA0.2 MJ)), W/s.
125018.20.10.00514.700
423029.90.50.03734.200
Table 11. Test results of non-combustibility method.
Composition NumberDensity of Specimen, kg/m3Average Temperature Rise, °CAverage Duration of Continuous Burning, sAverage Mass Loss of Specimens, %
125038.403.24
229540.804.17
333542.104.23
423062.3195.26
528051.2186.48
631061.5196.83
Table 12. Thermal stability results of thermal insulation with EG and EG/CEPW aggregates.
Mixture Composition NumberTmax., °CChar Yield at 1000 °C, wt.%
1st2nd3rd4th
111044069091.3
411031544571083.3
Disclaimer/Publisher’s Note: The statements, opinions and data contained in all publications are solely those of the individual author(s) and contributor(s) and not of MDPI and/or the editor(s). MDPI and/or the editor(s) disclaim responsibility for any injury to people or property resulting from any ideas, methods, instructions or products referred to in the content.

