
Recycled Glass Polypropylene Composites from Transportation Manufacturing Waste

Abstract
:1. Introduction
2. Literature Review
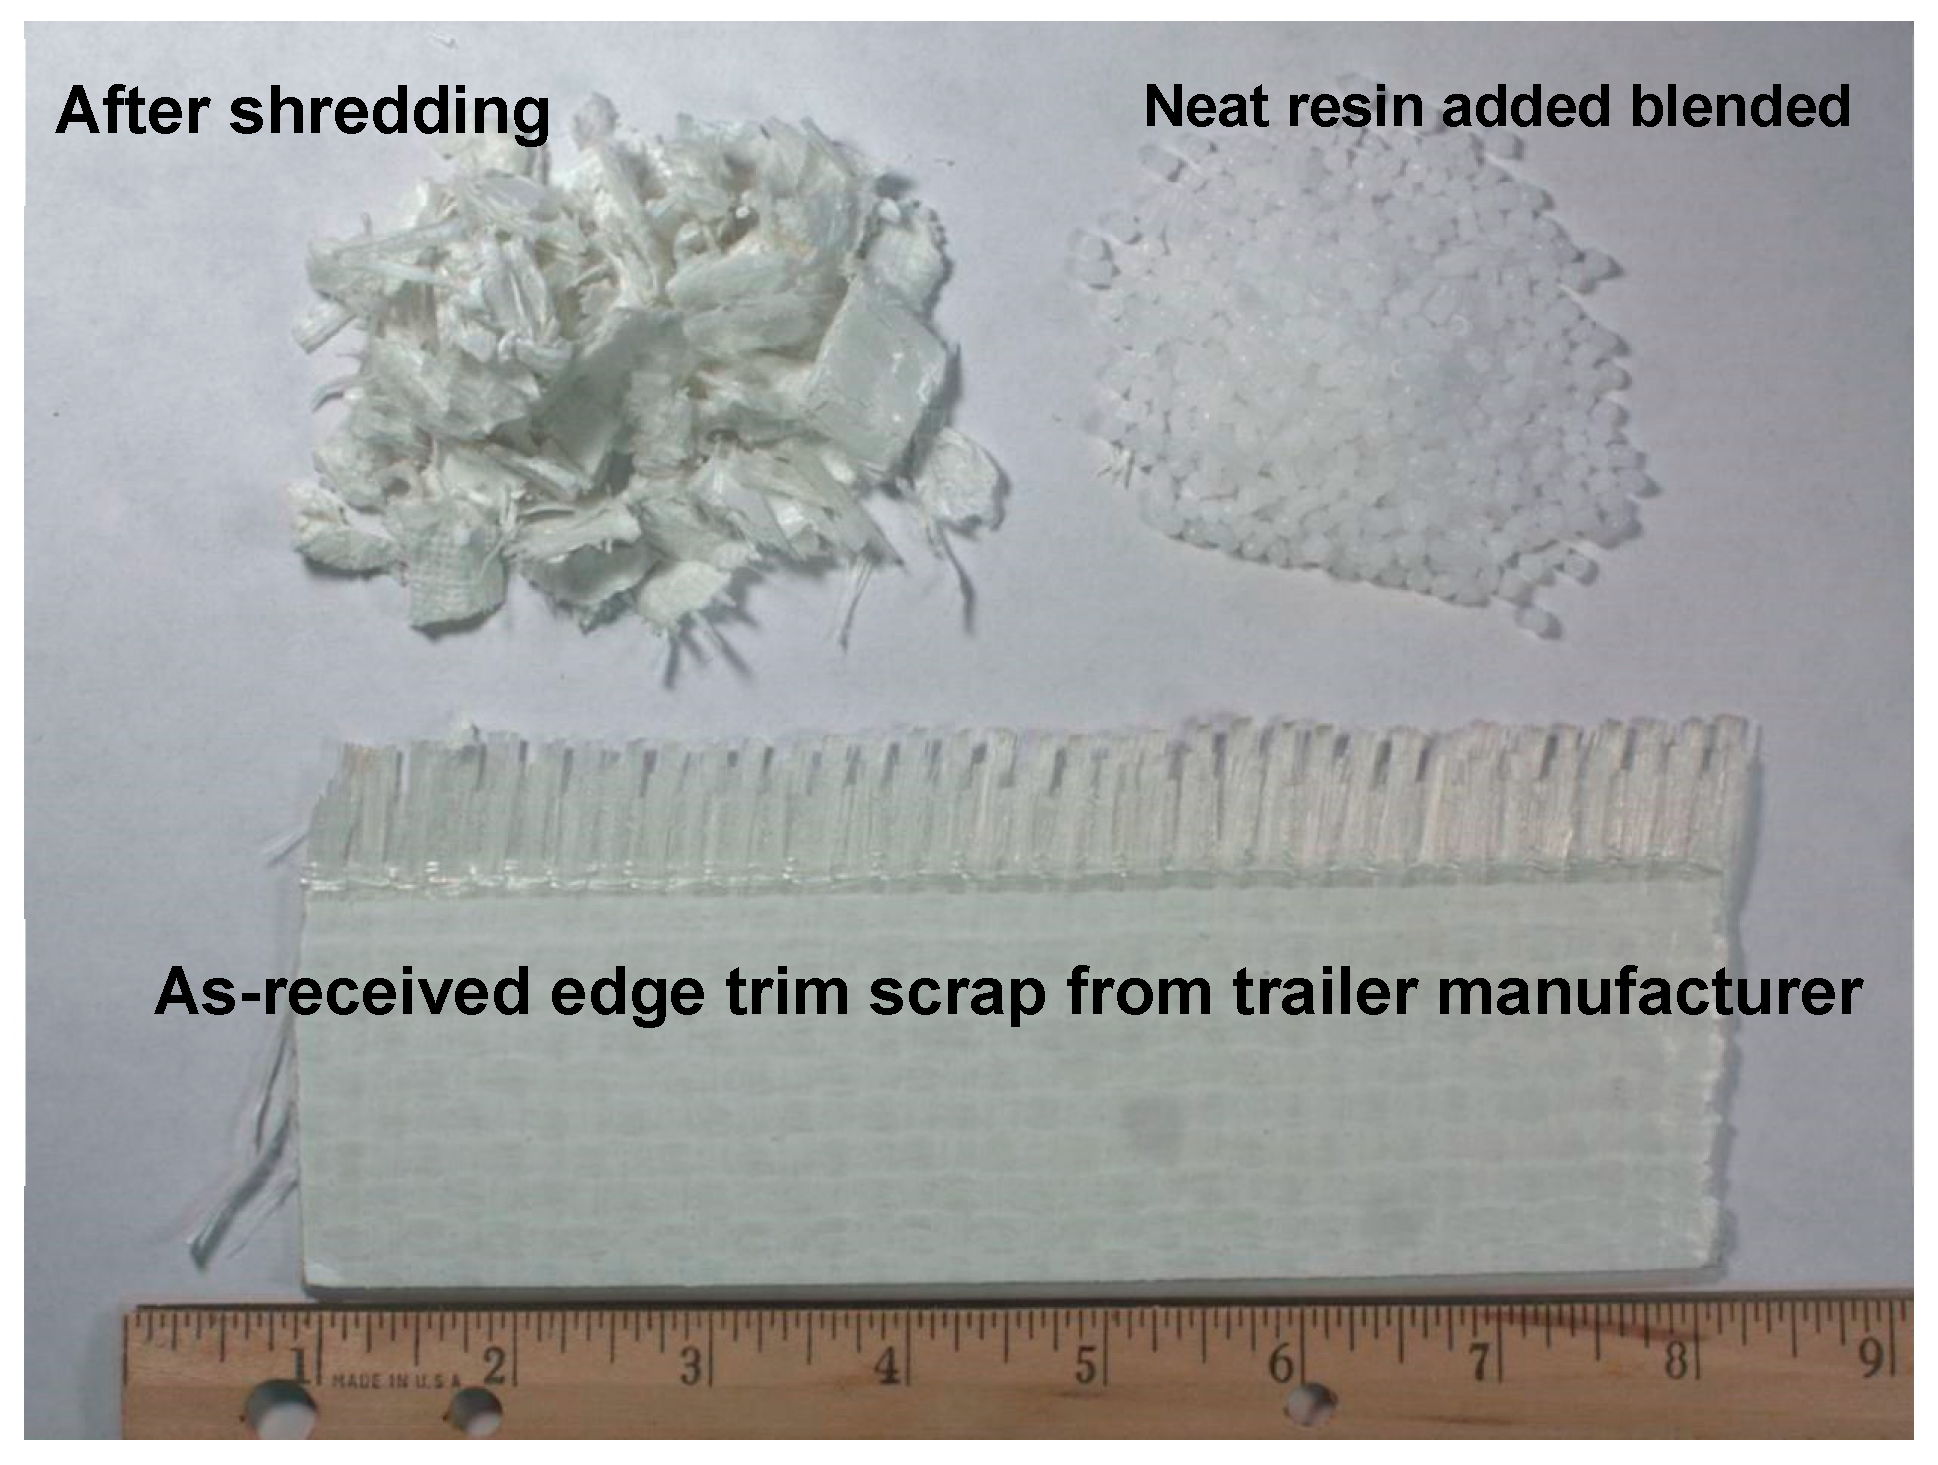
3. Materials and Methods
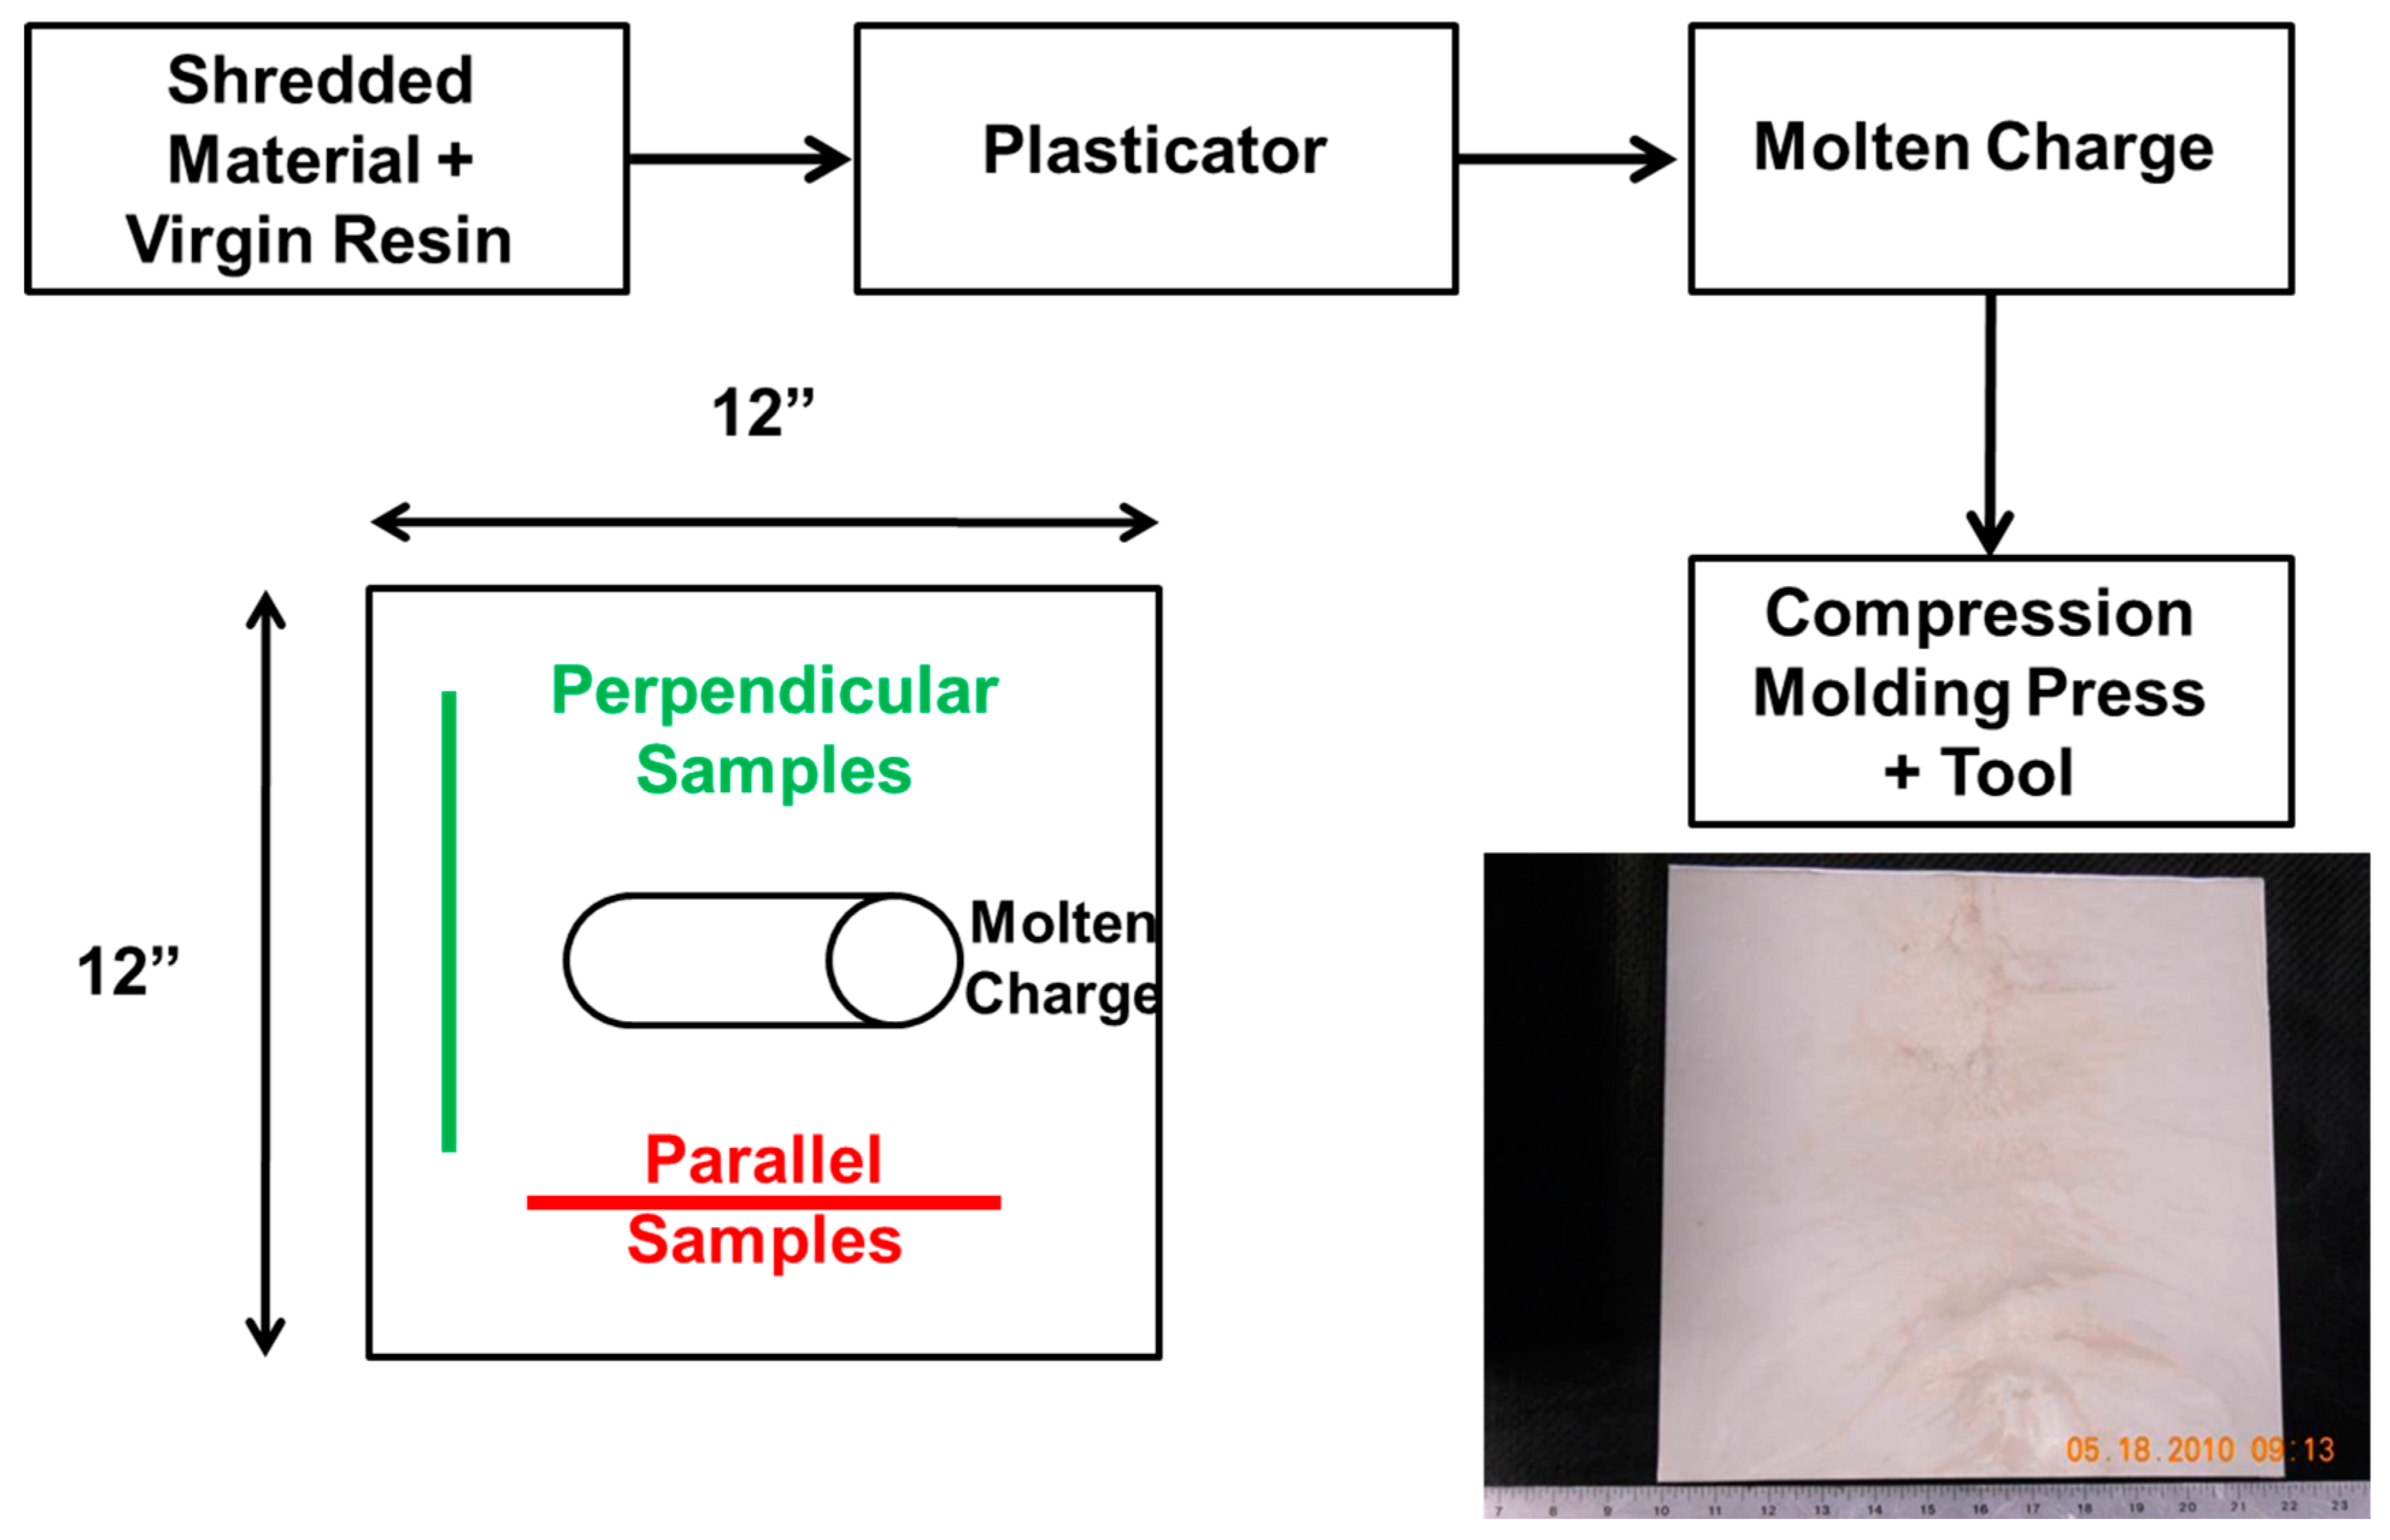
Processing of PP-GF Recyclate Shreds
4. Results
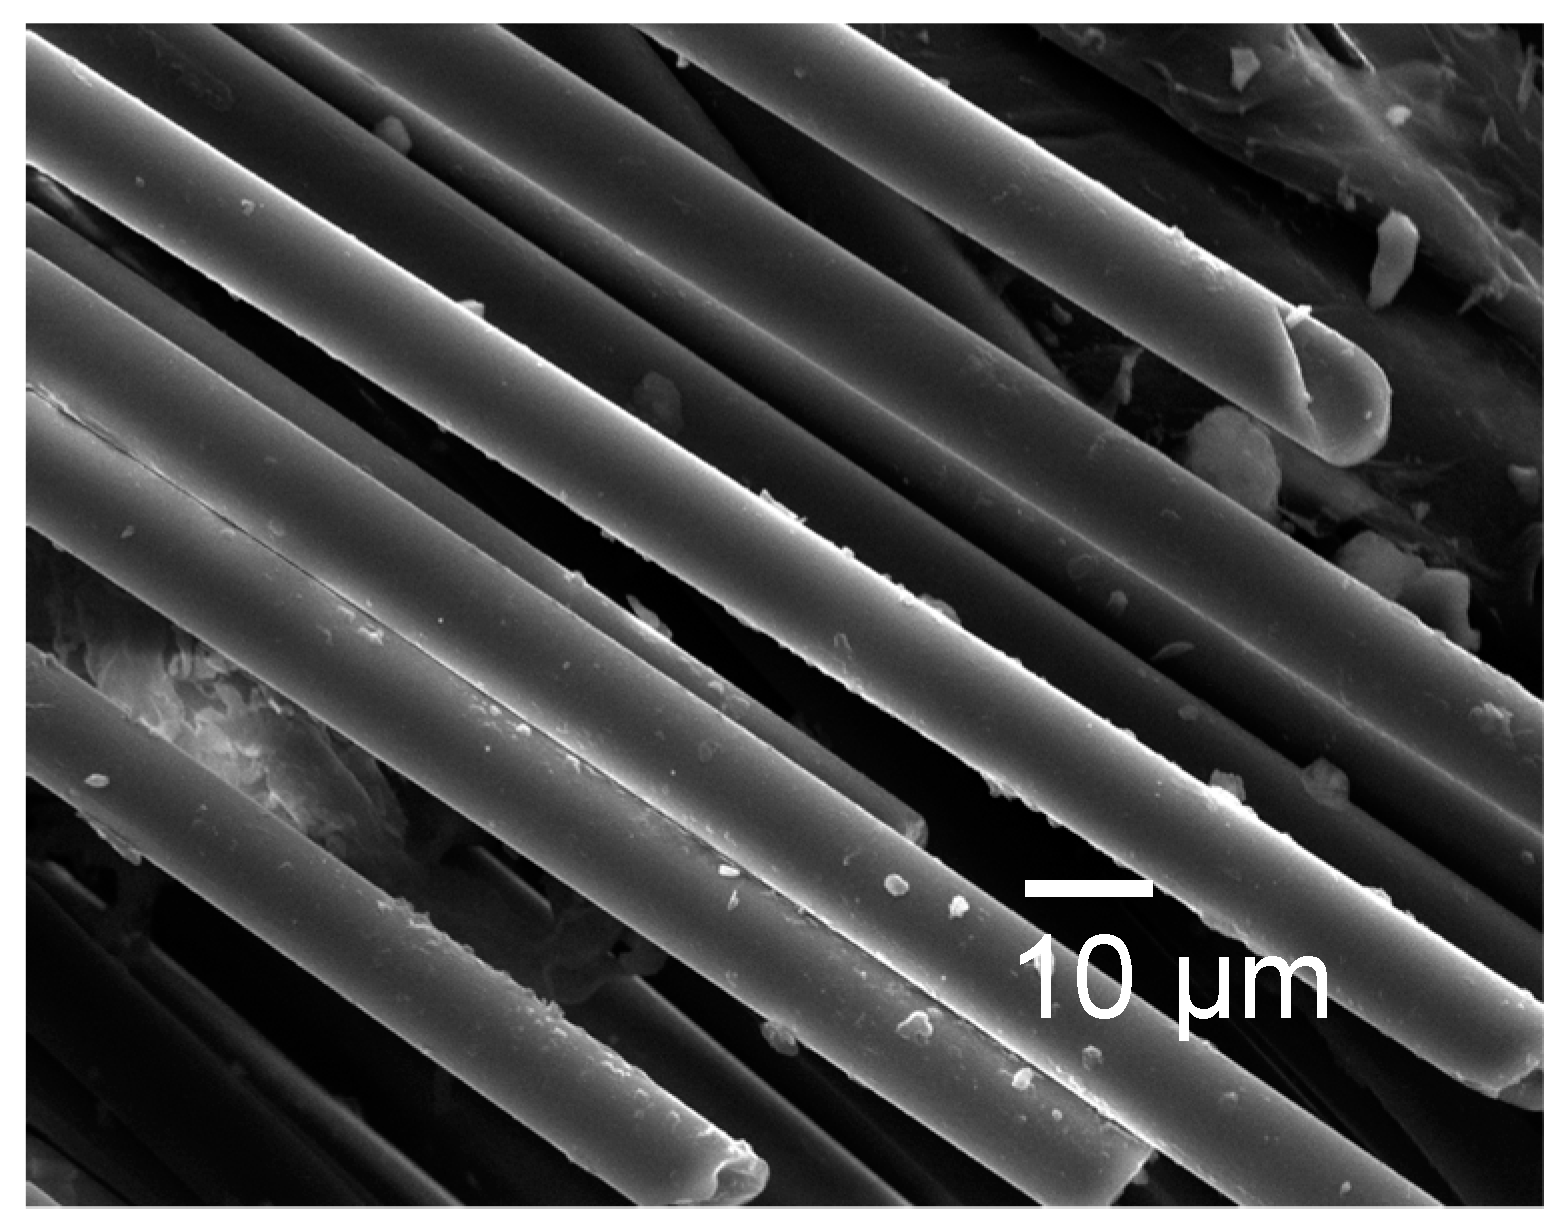
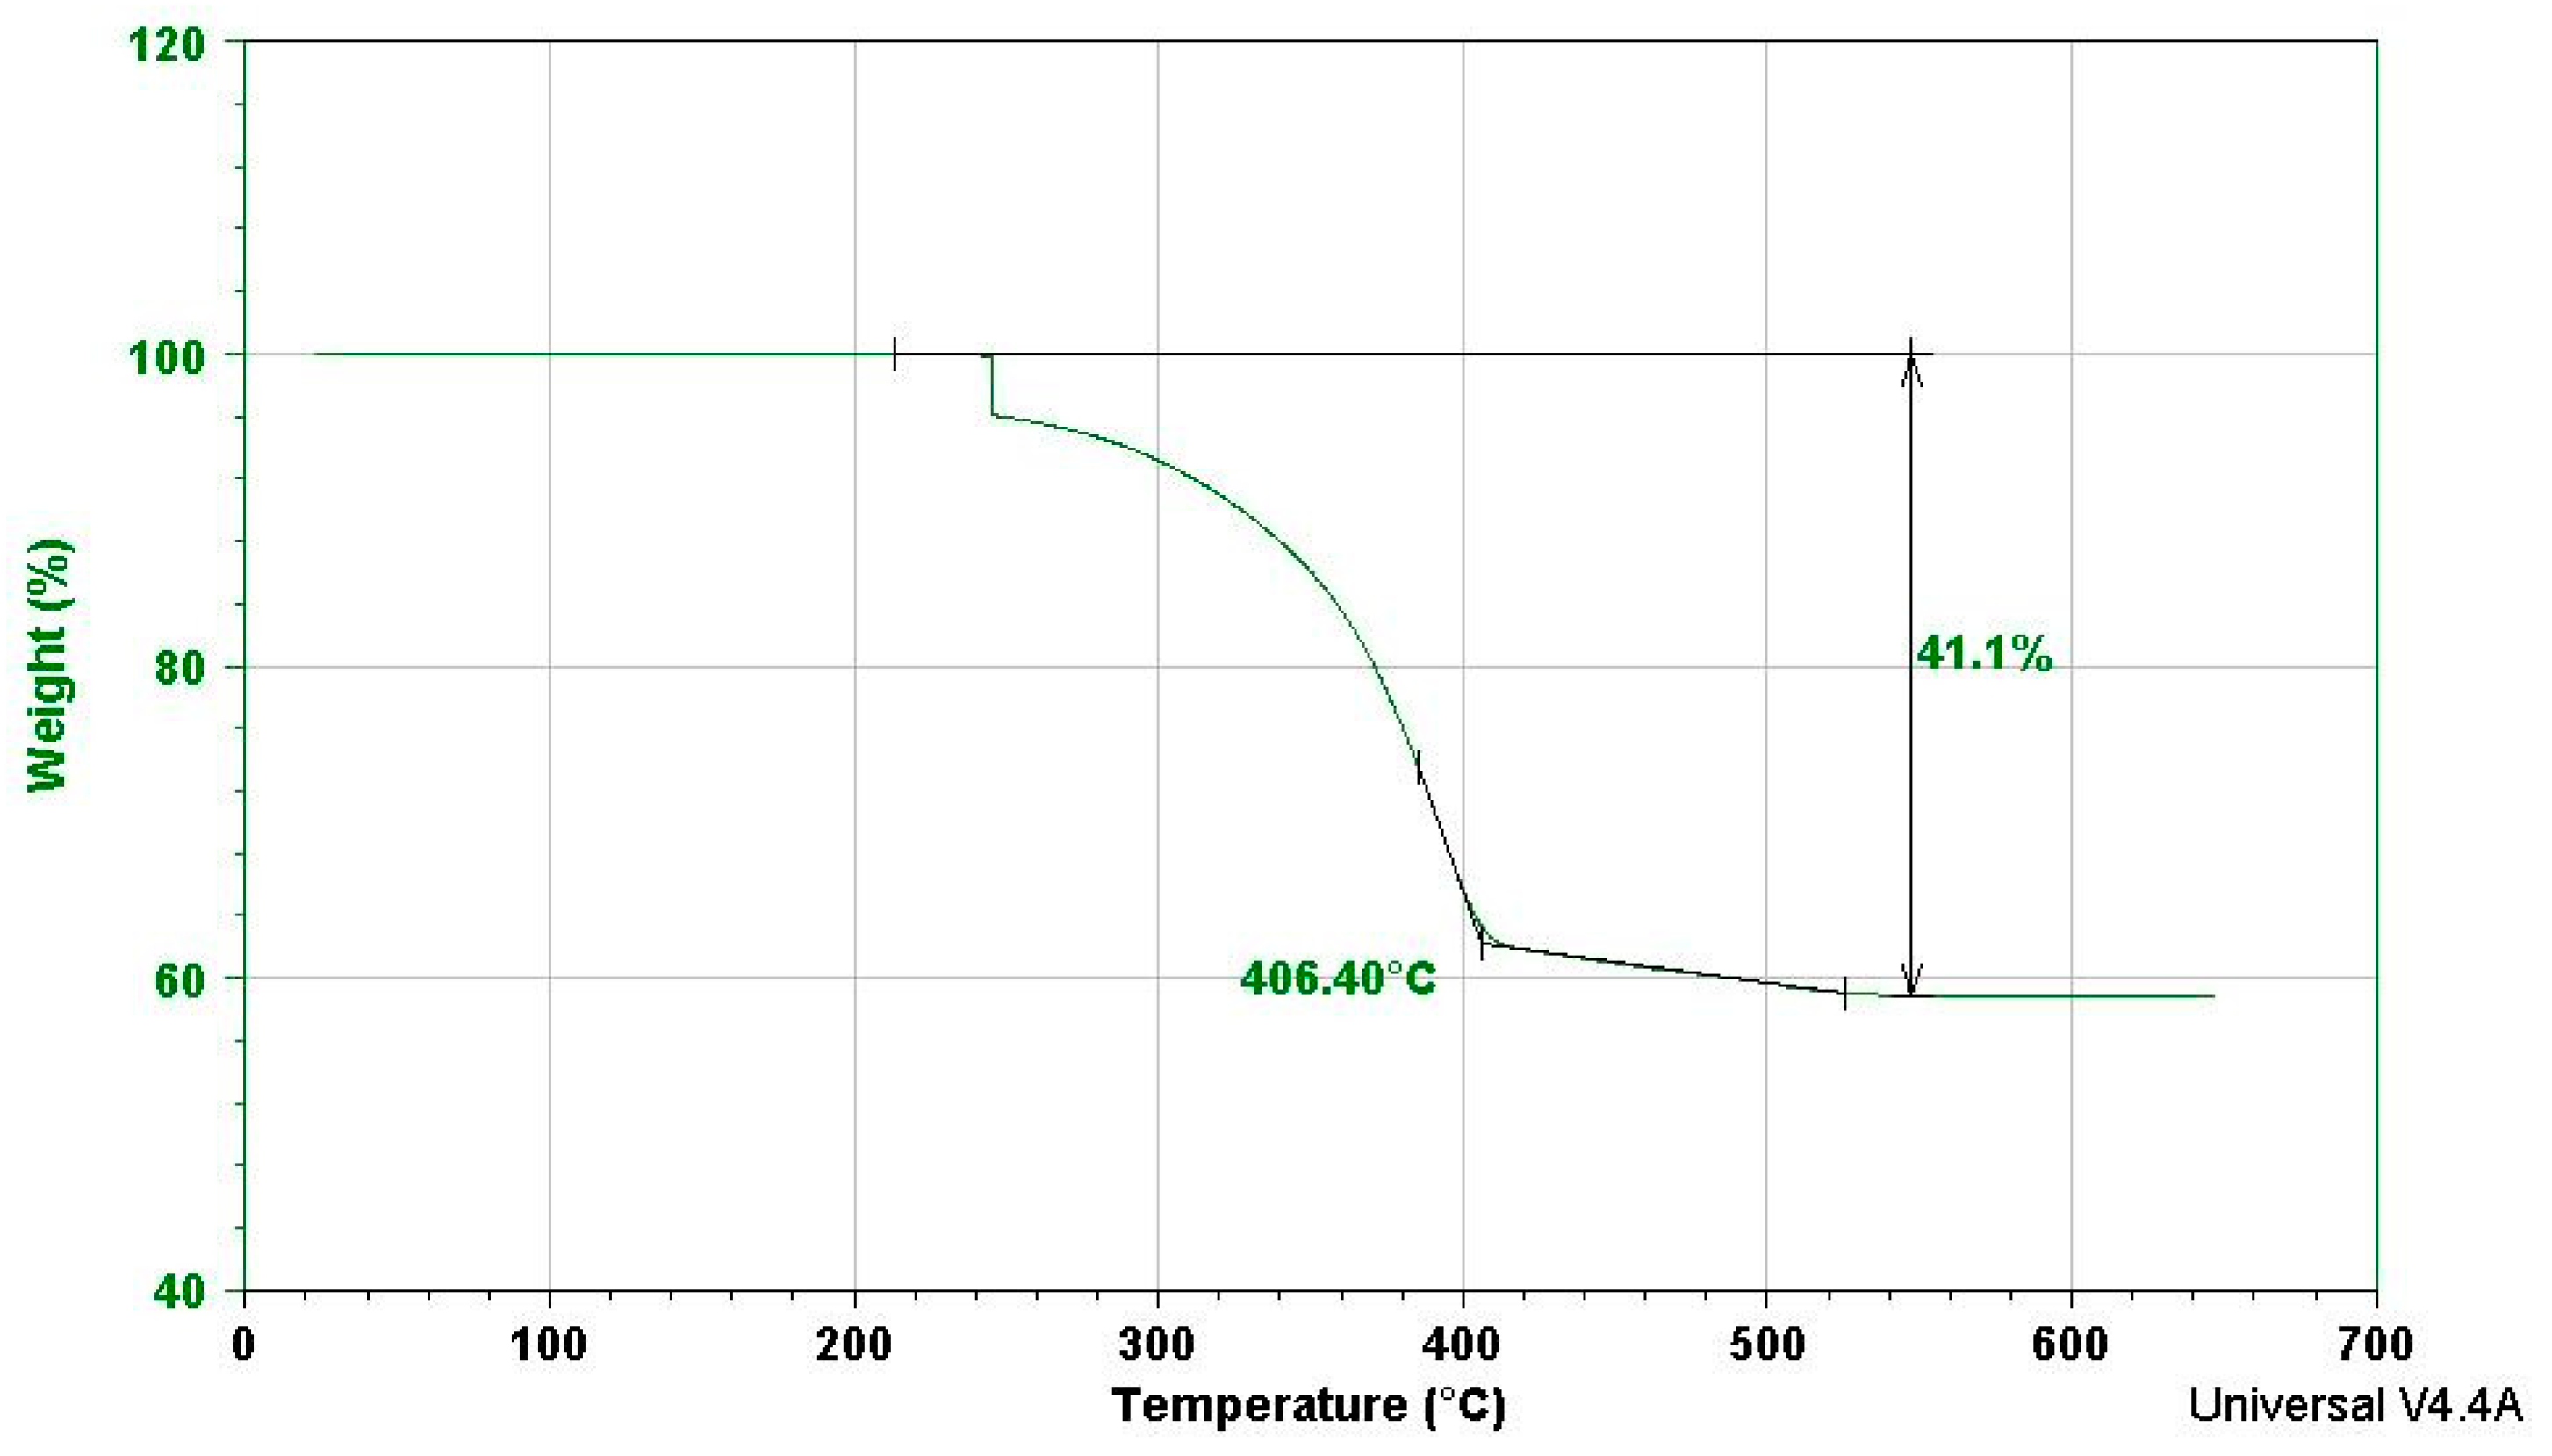
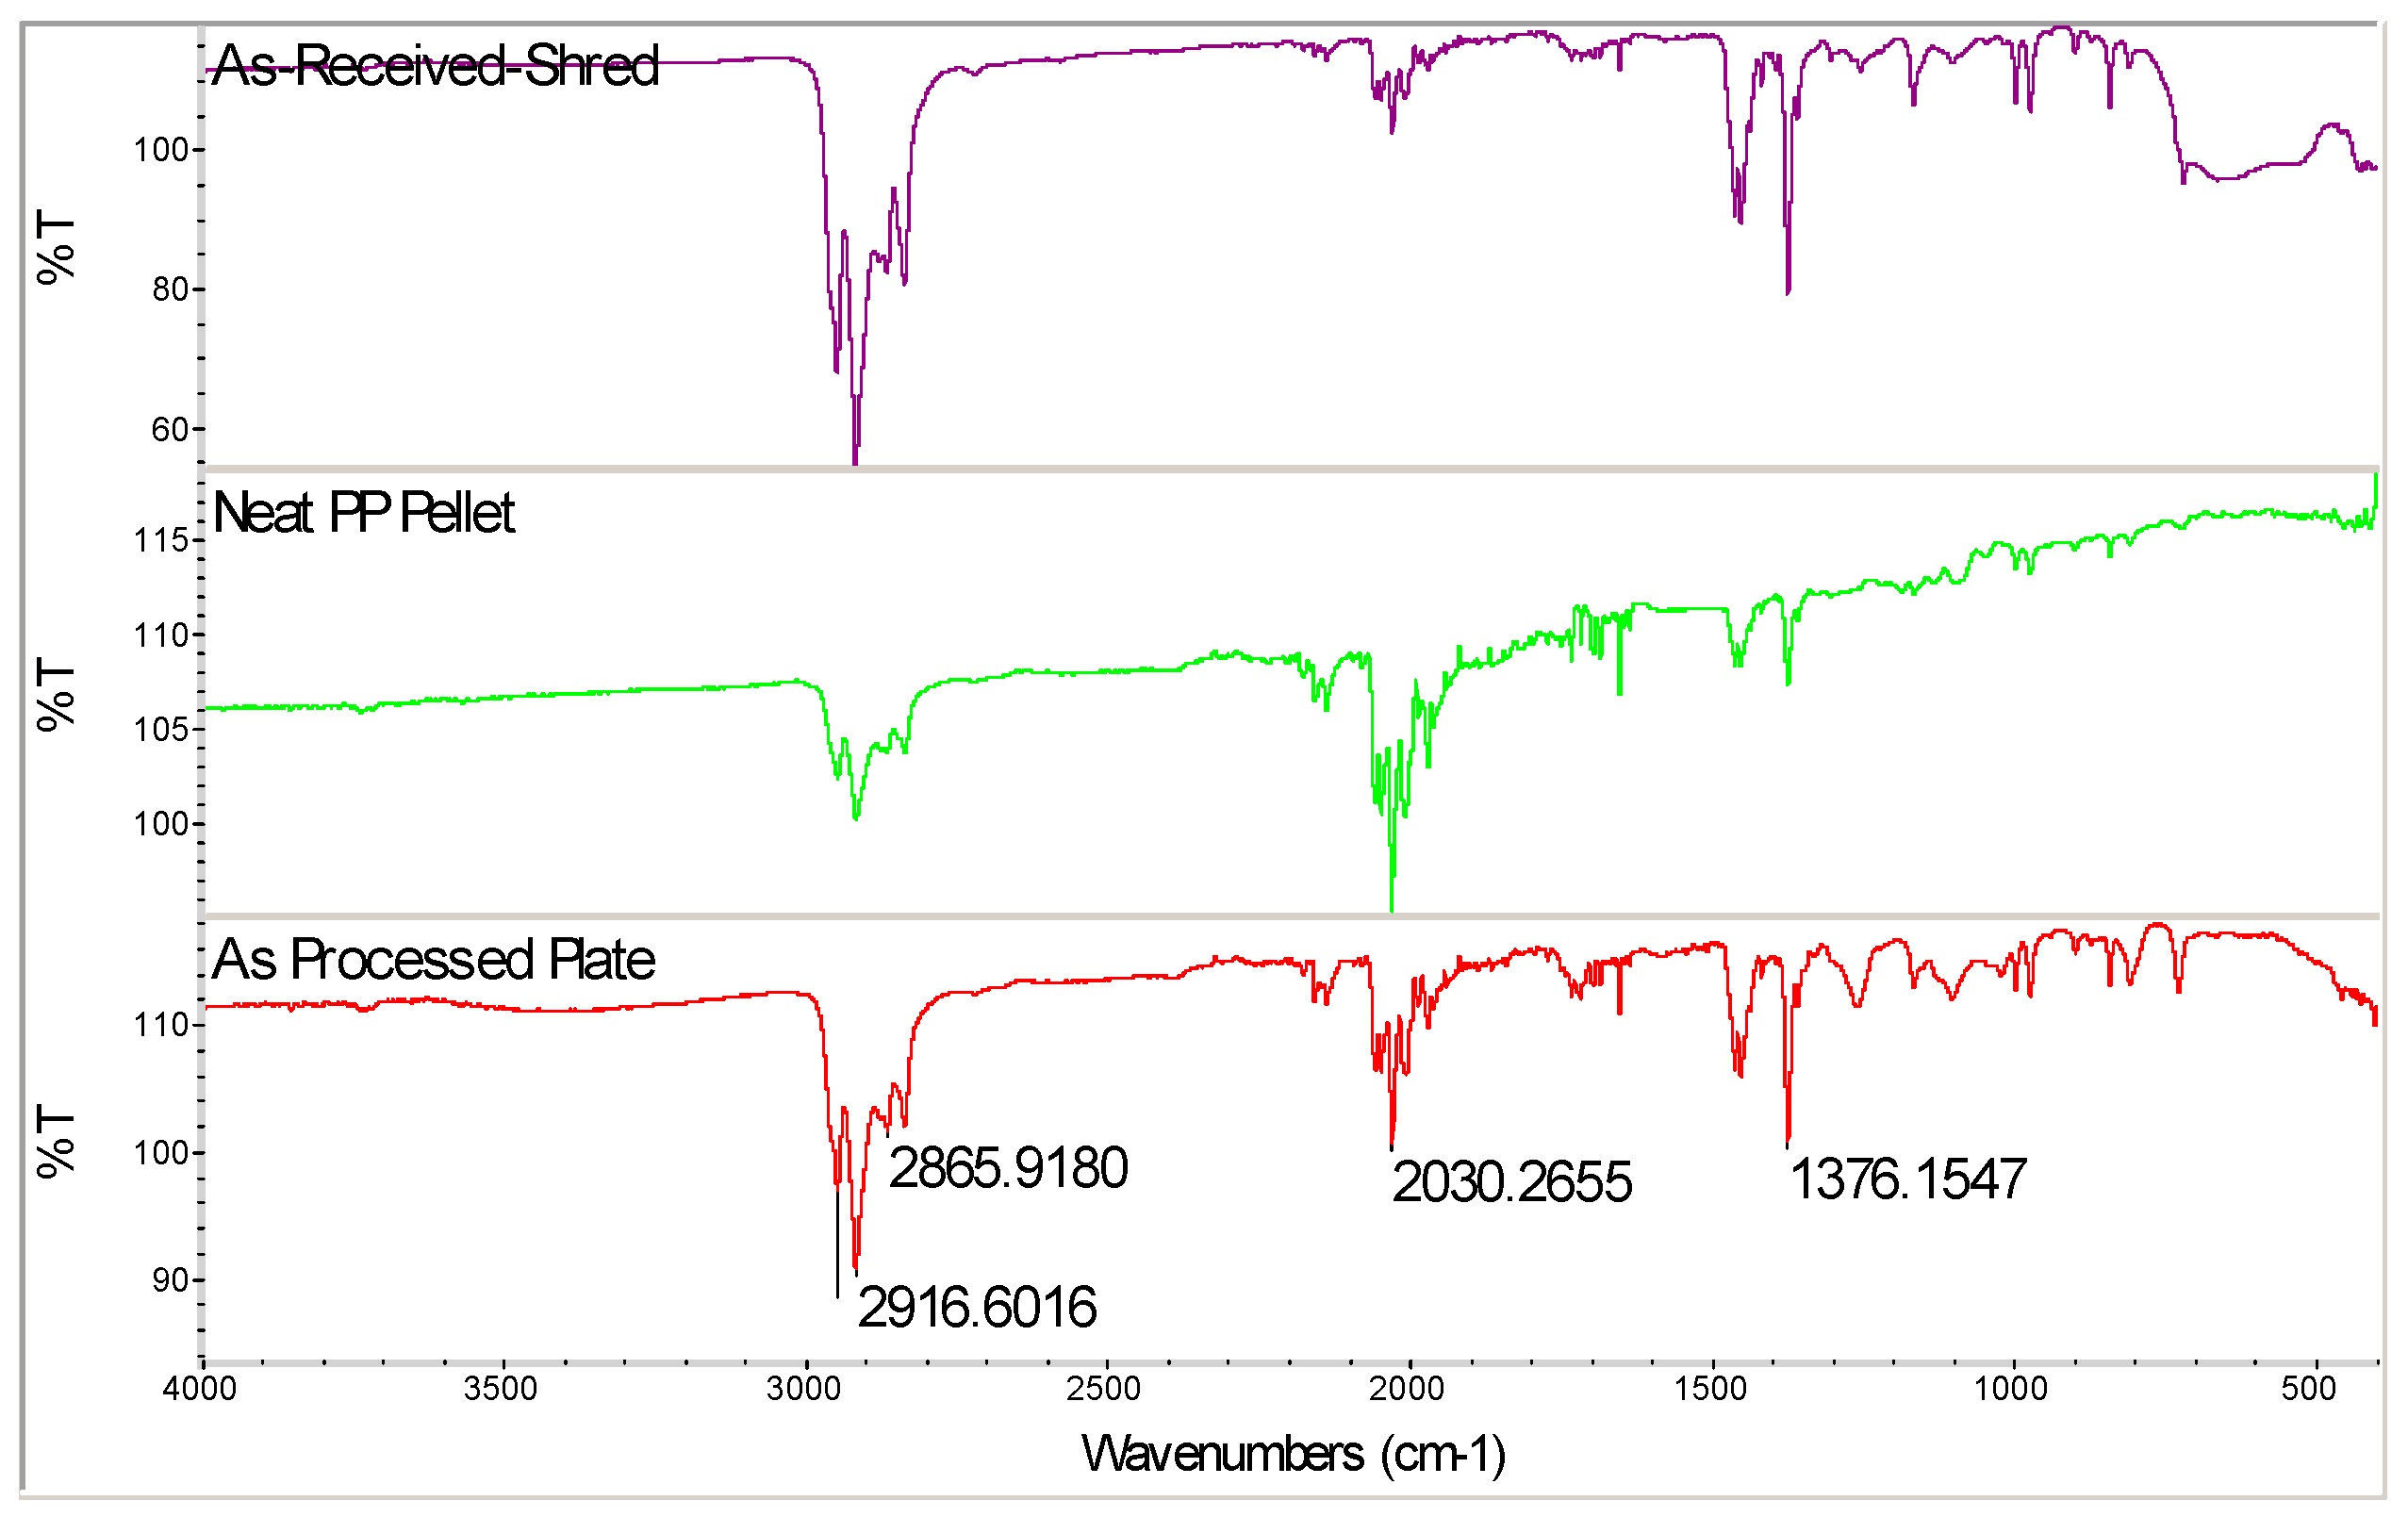
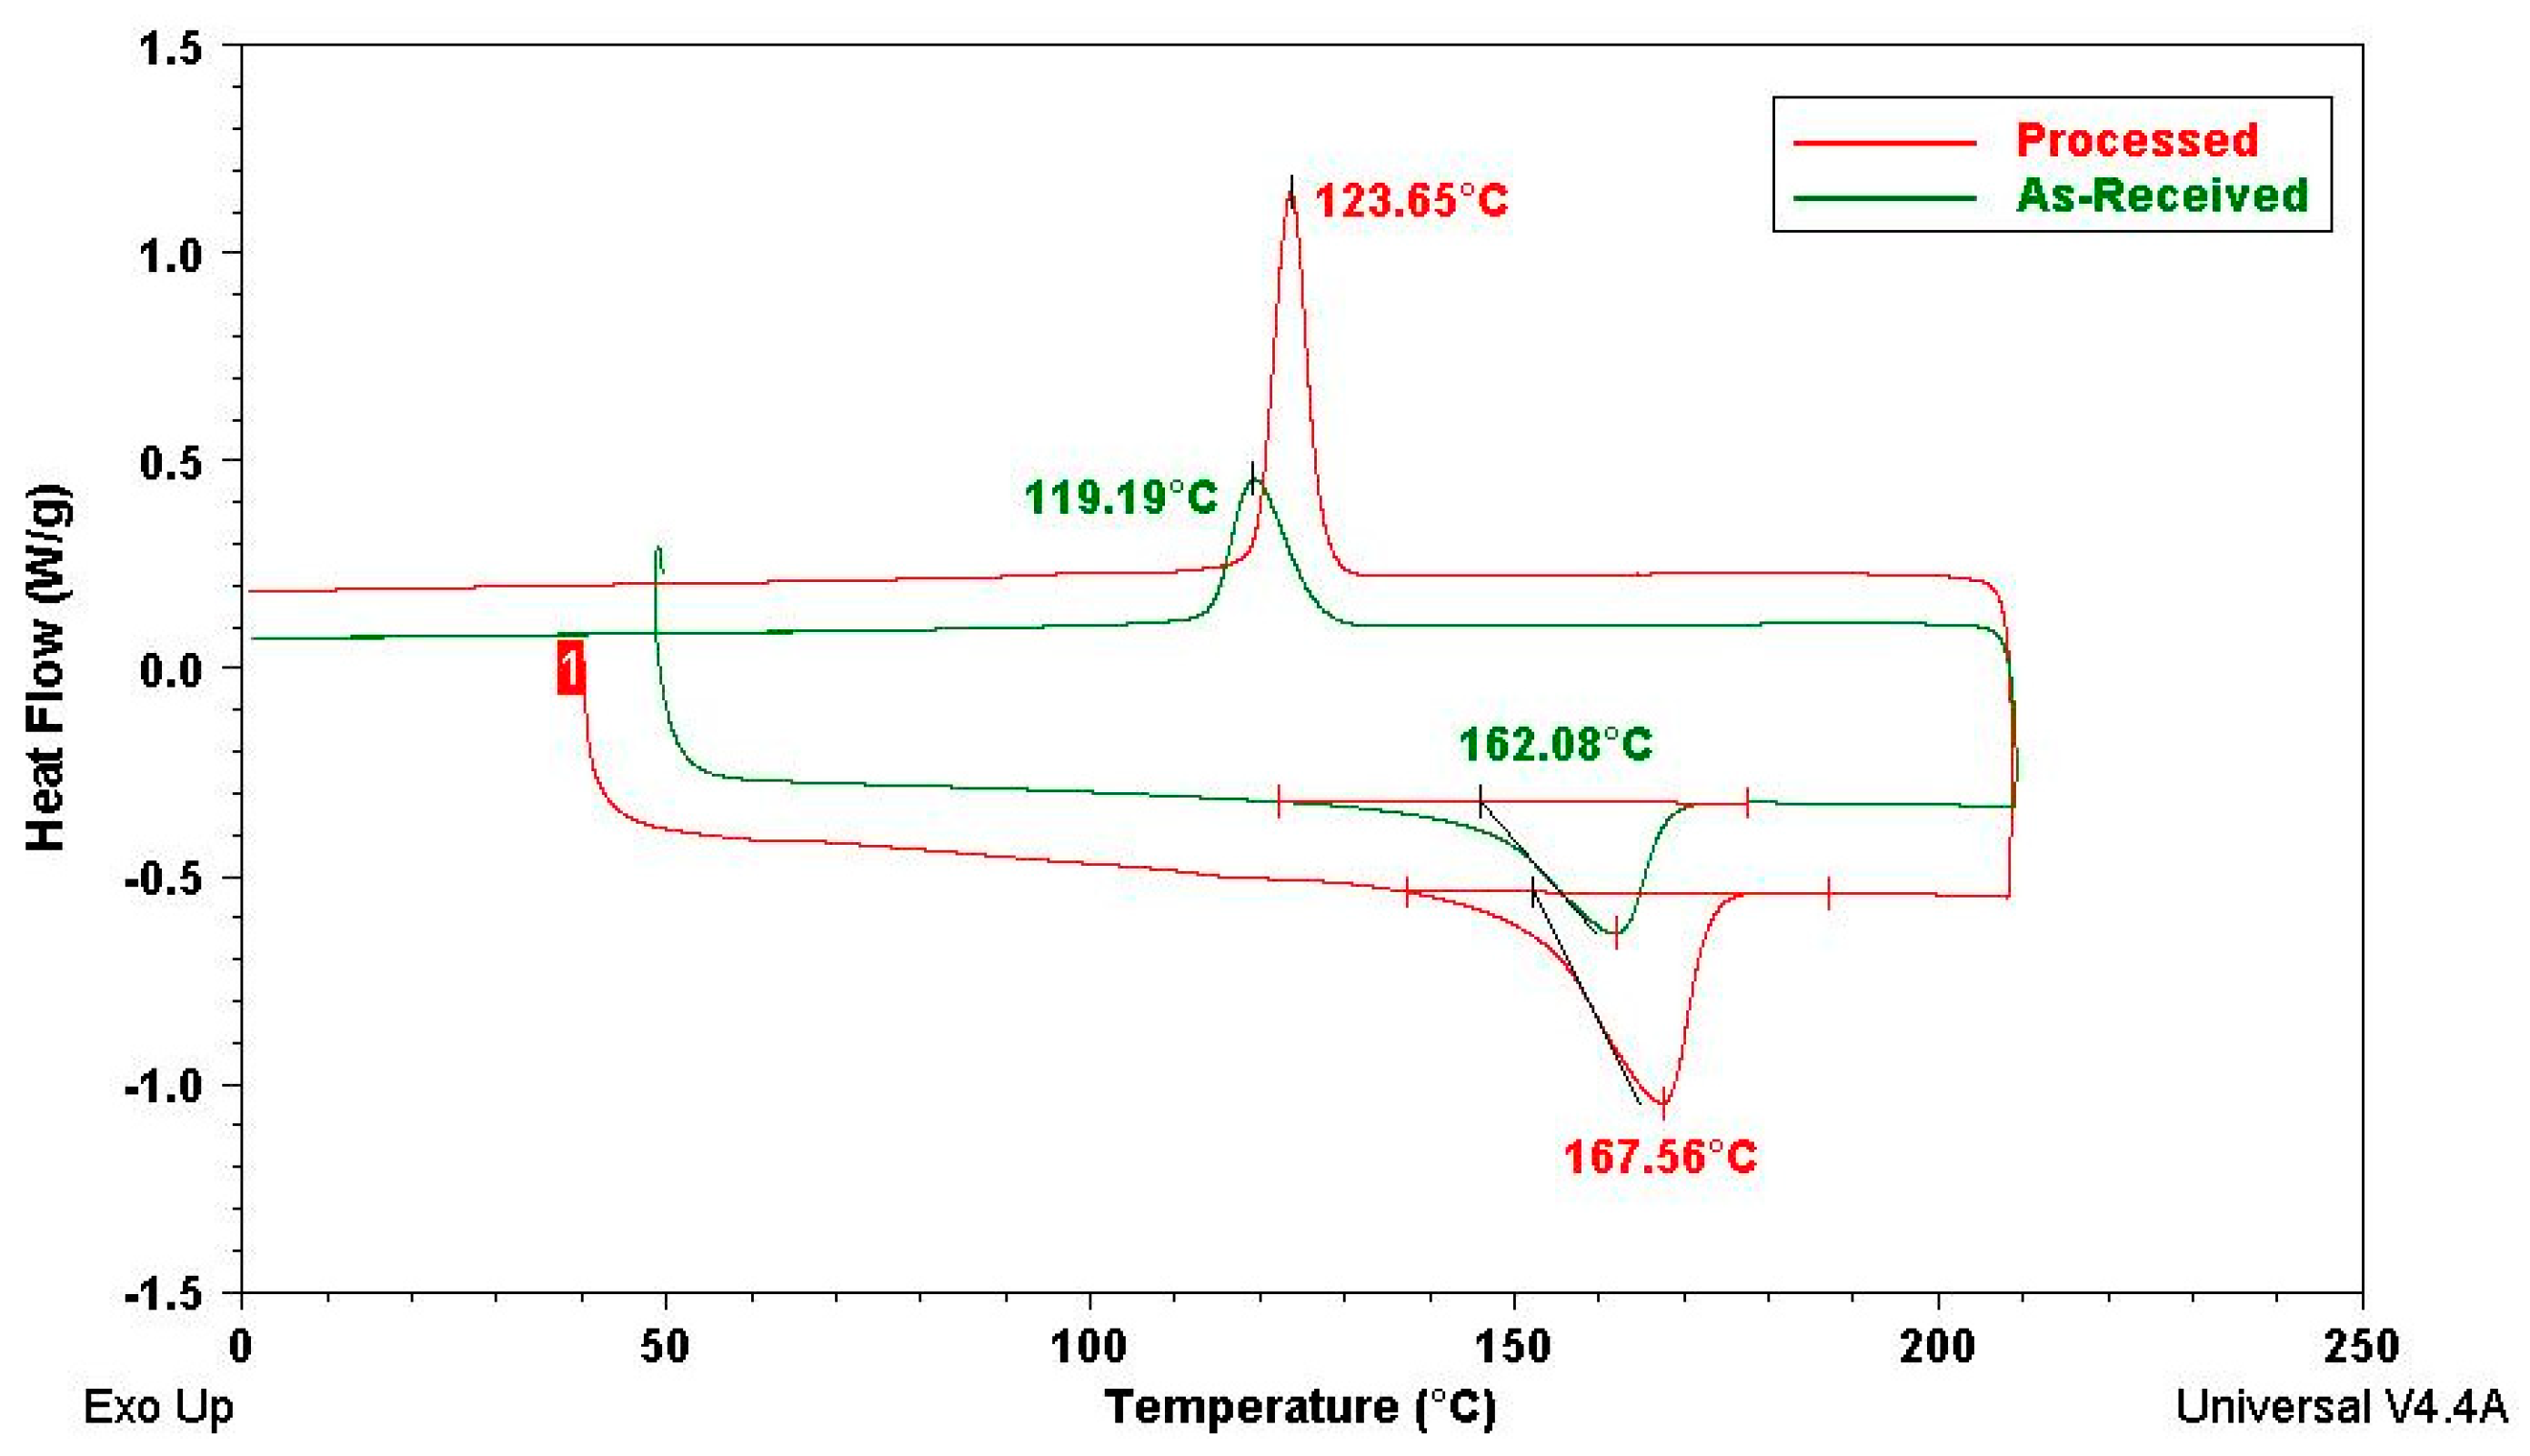
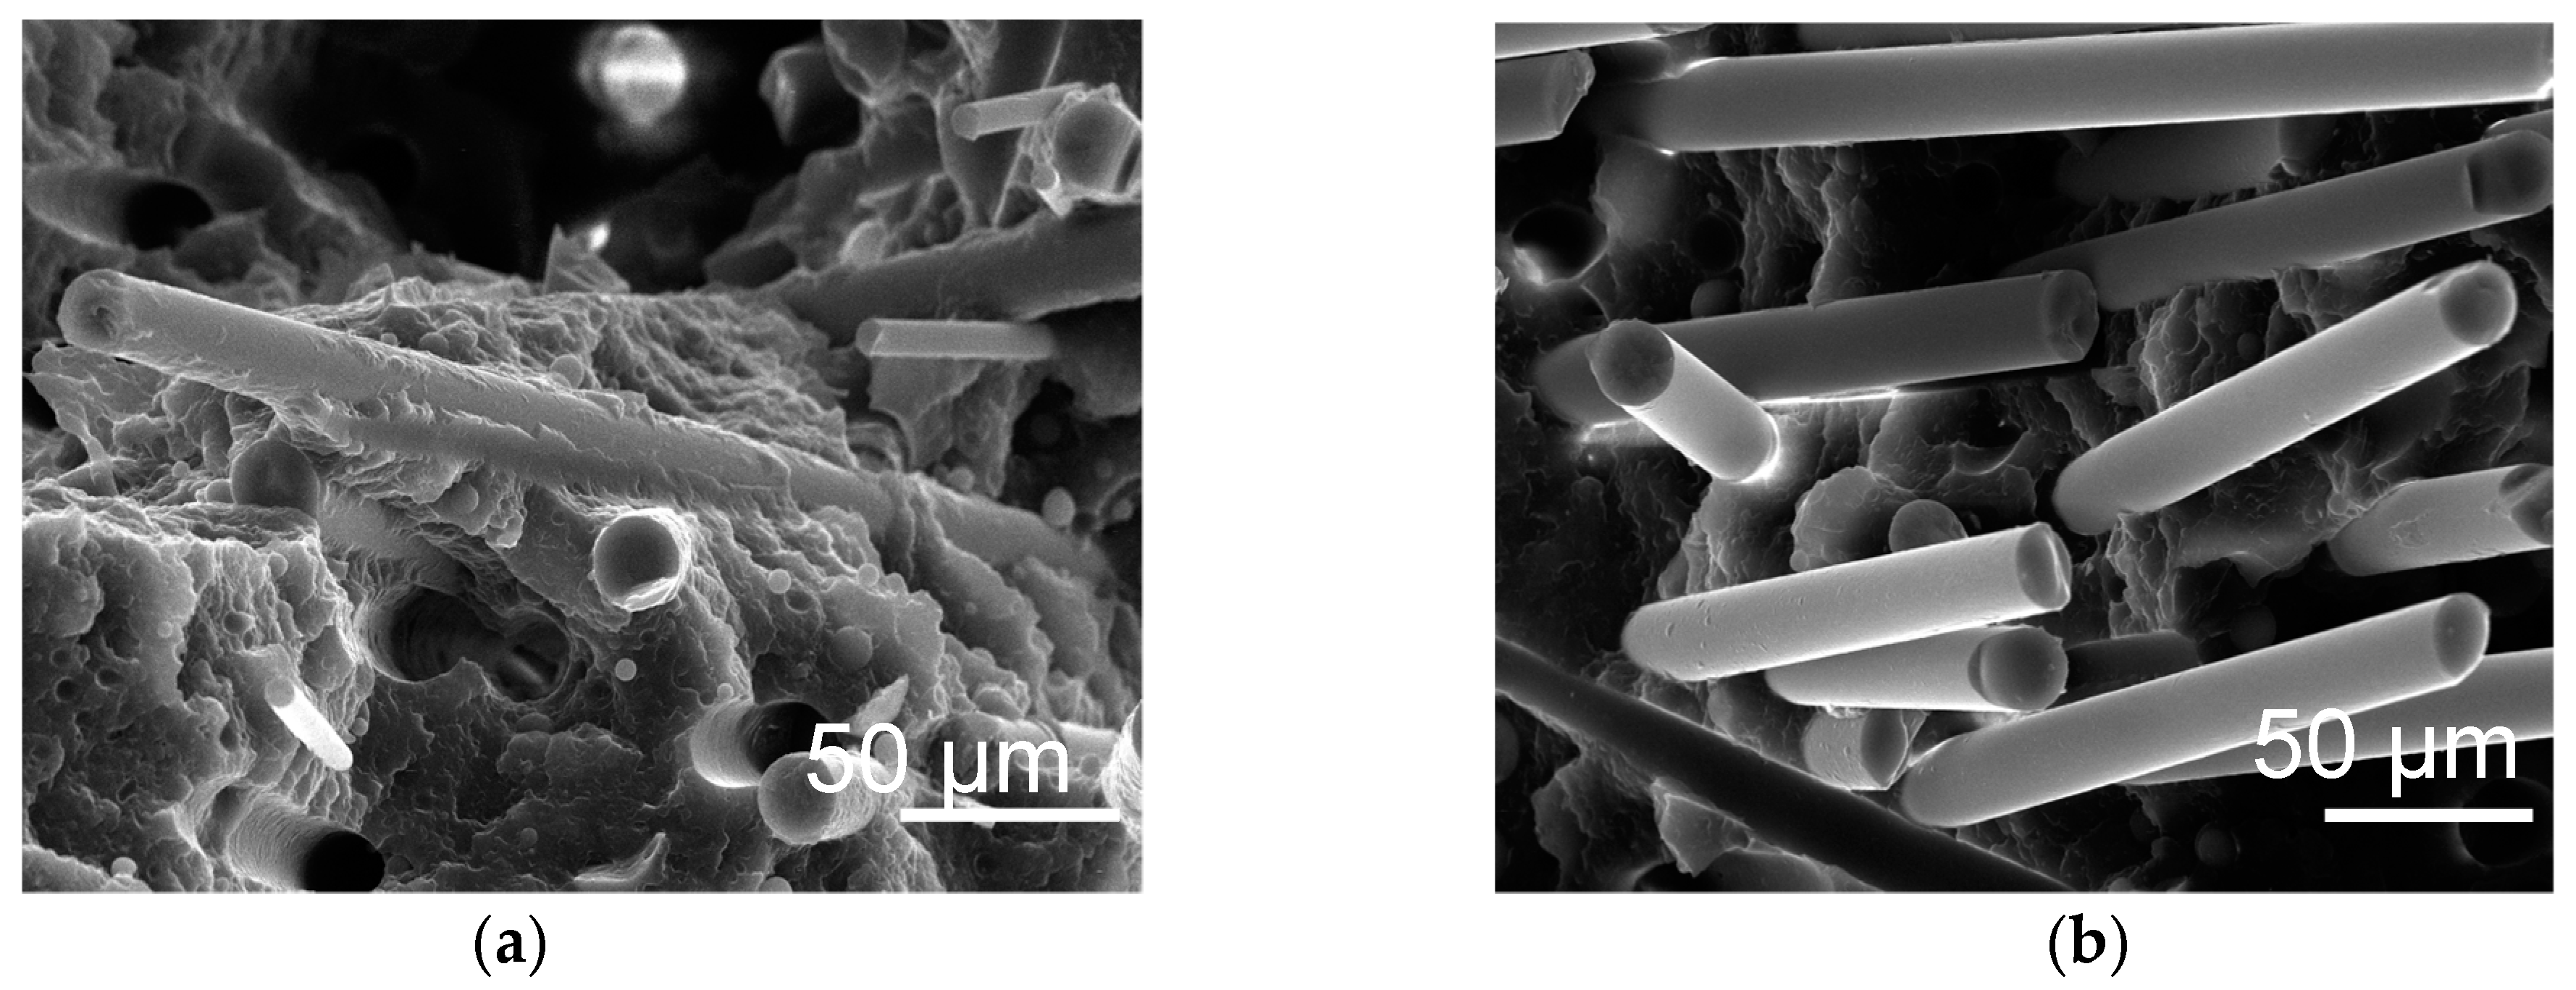
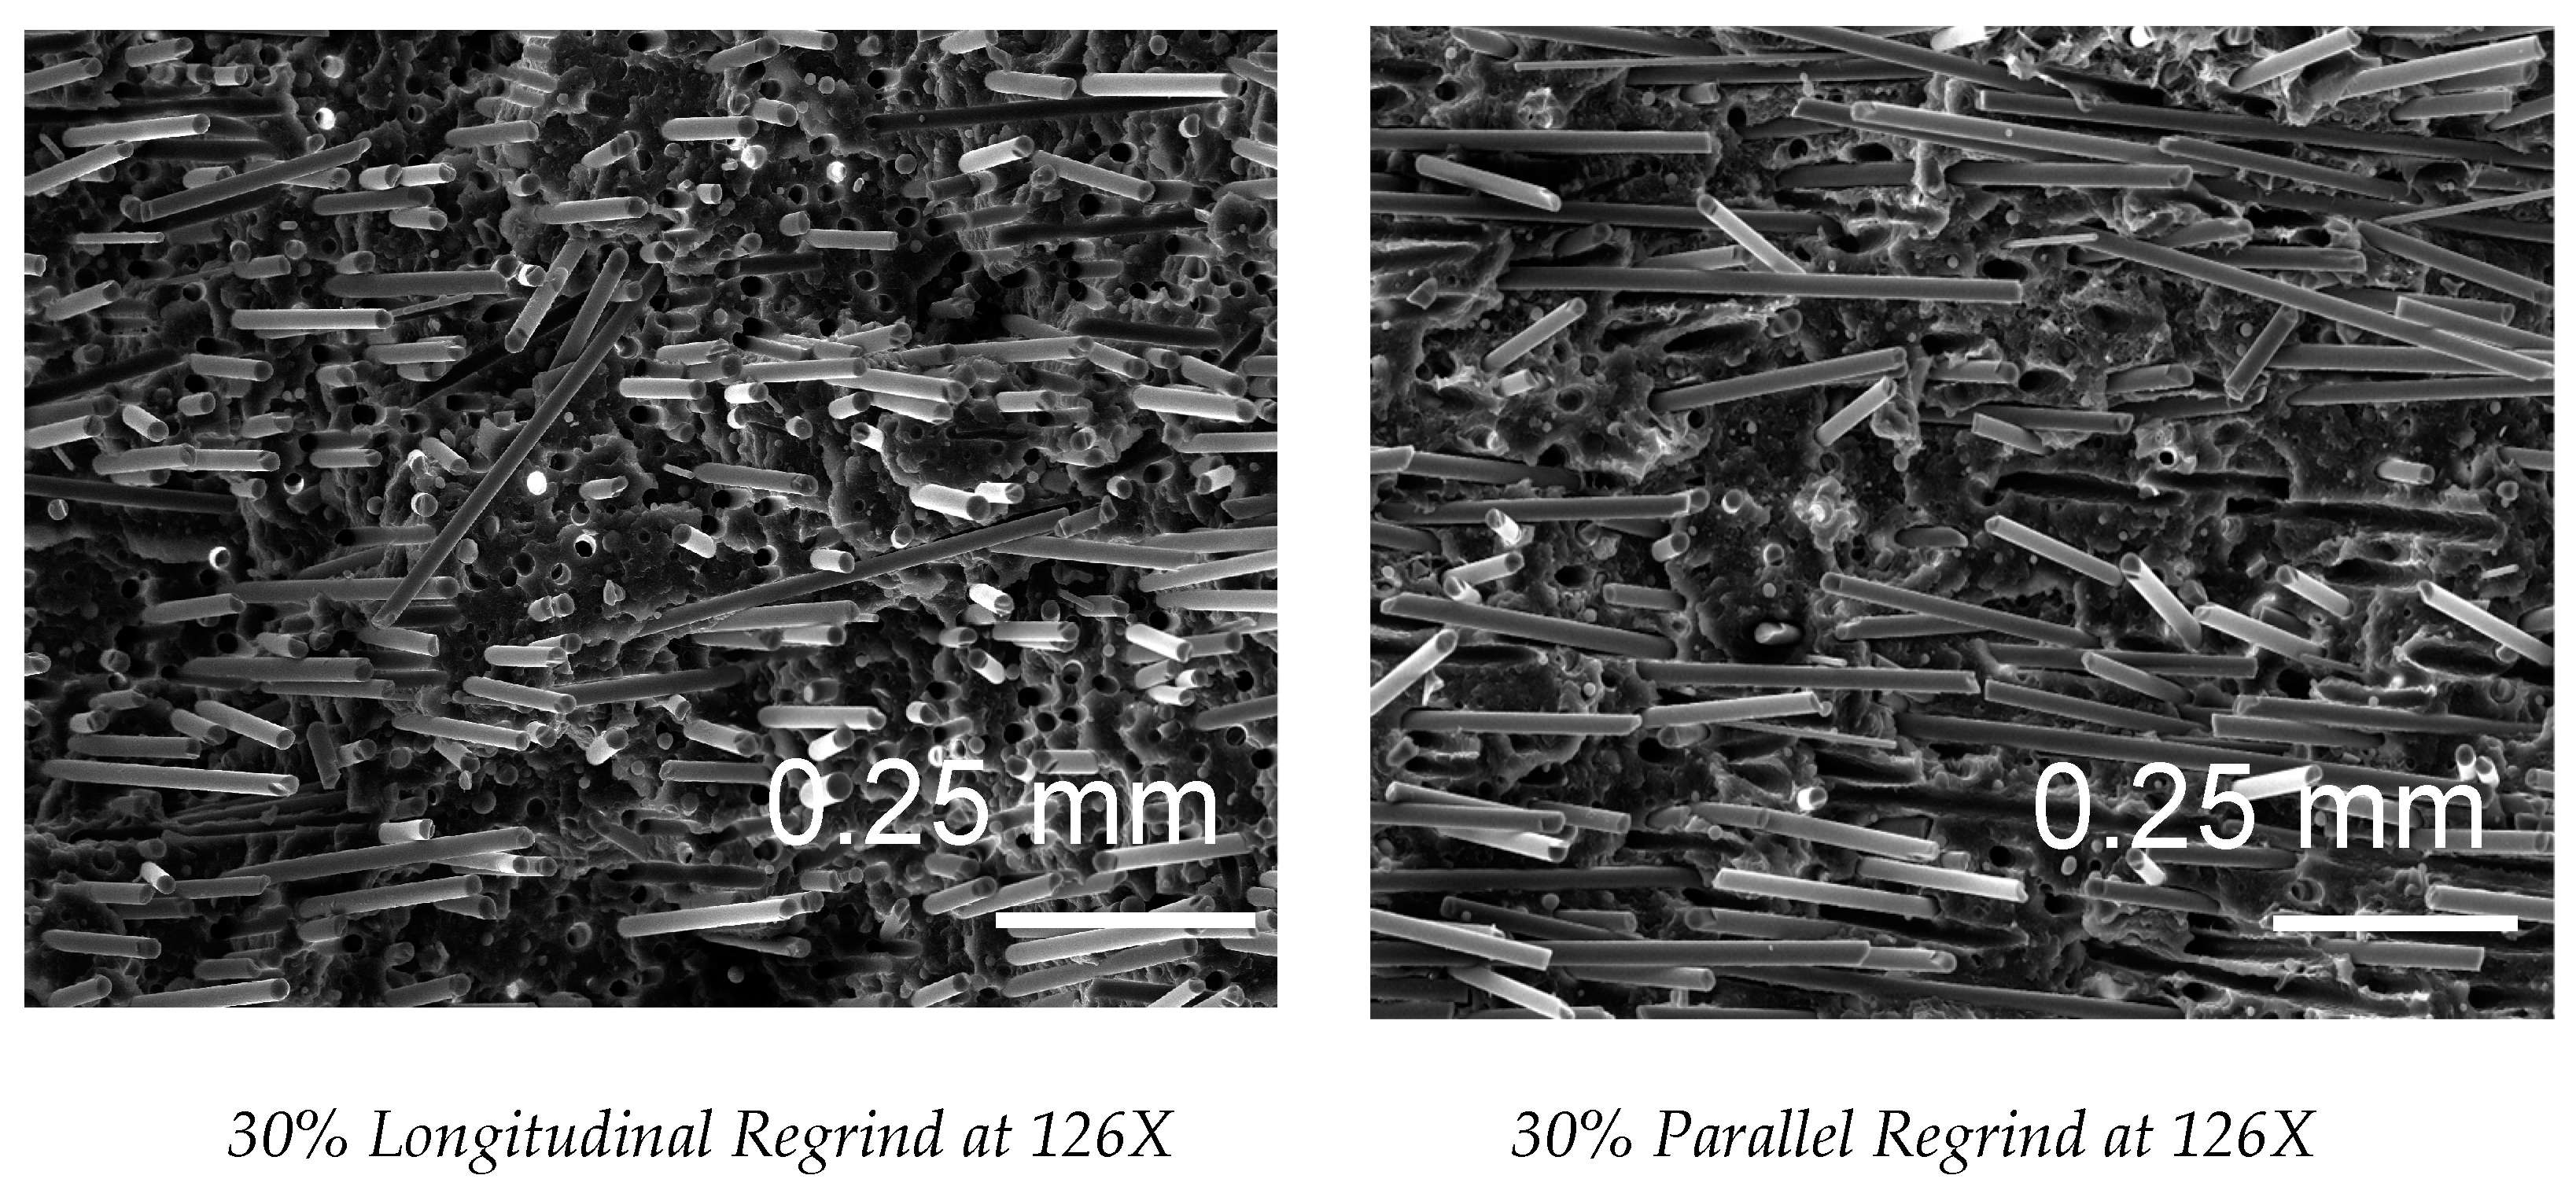
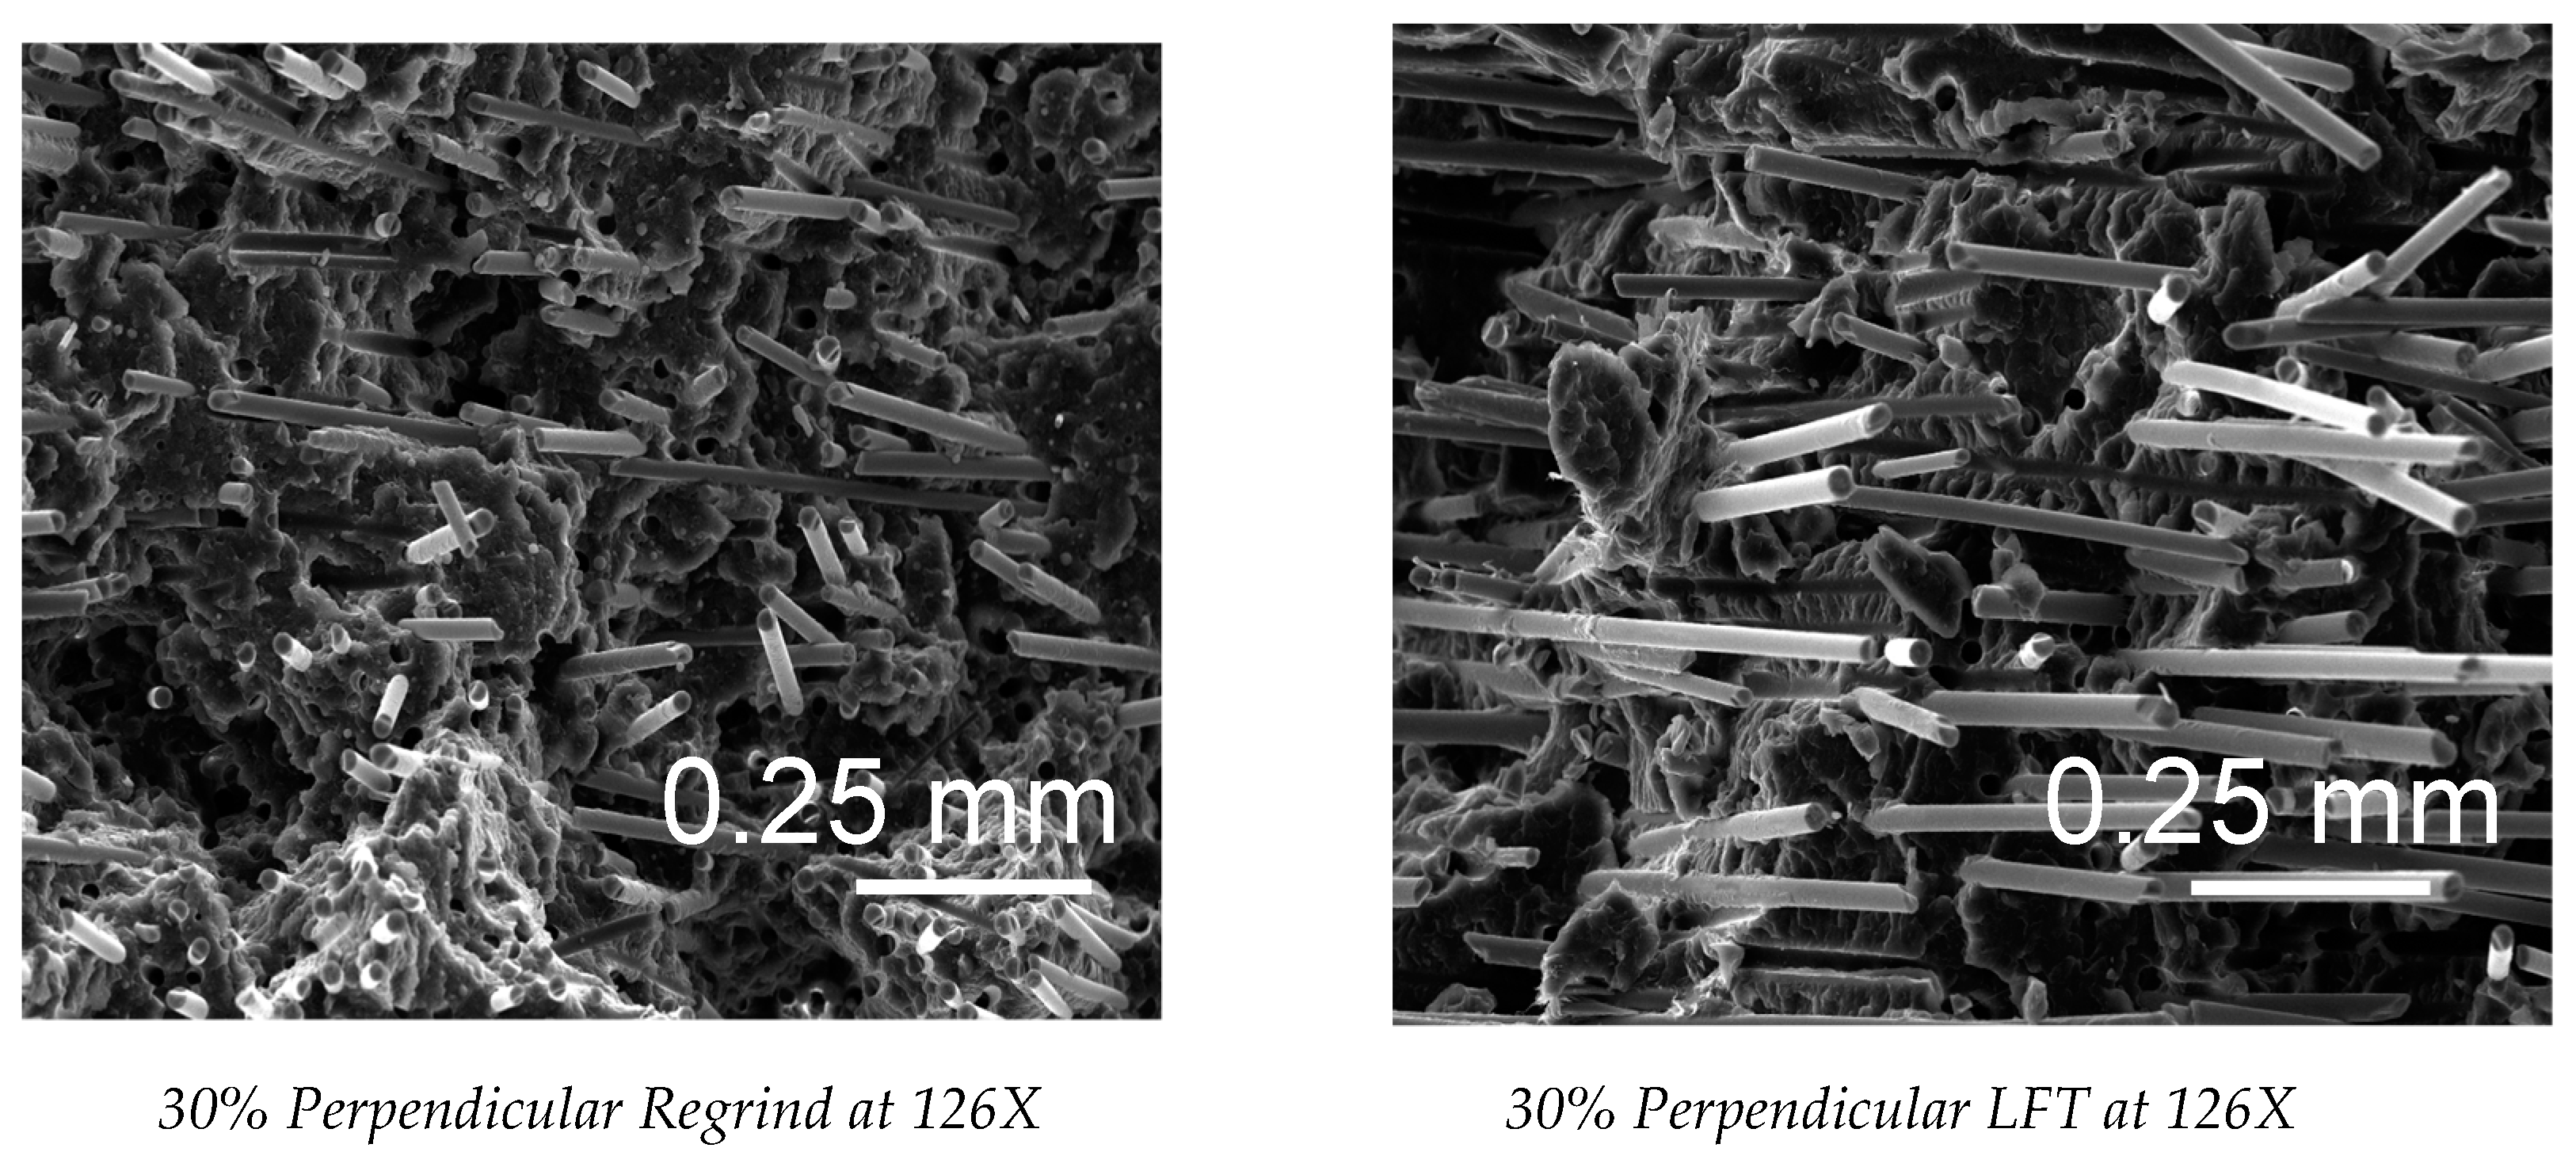
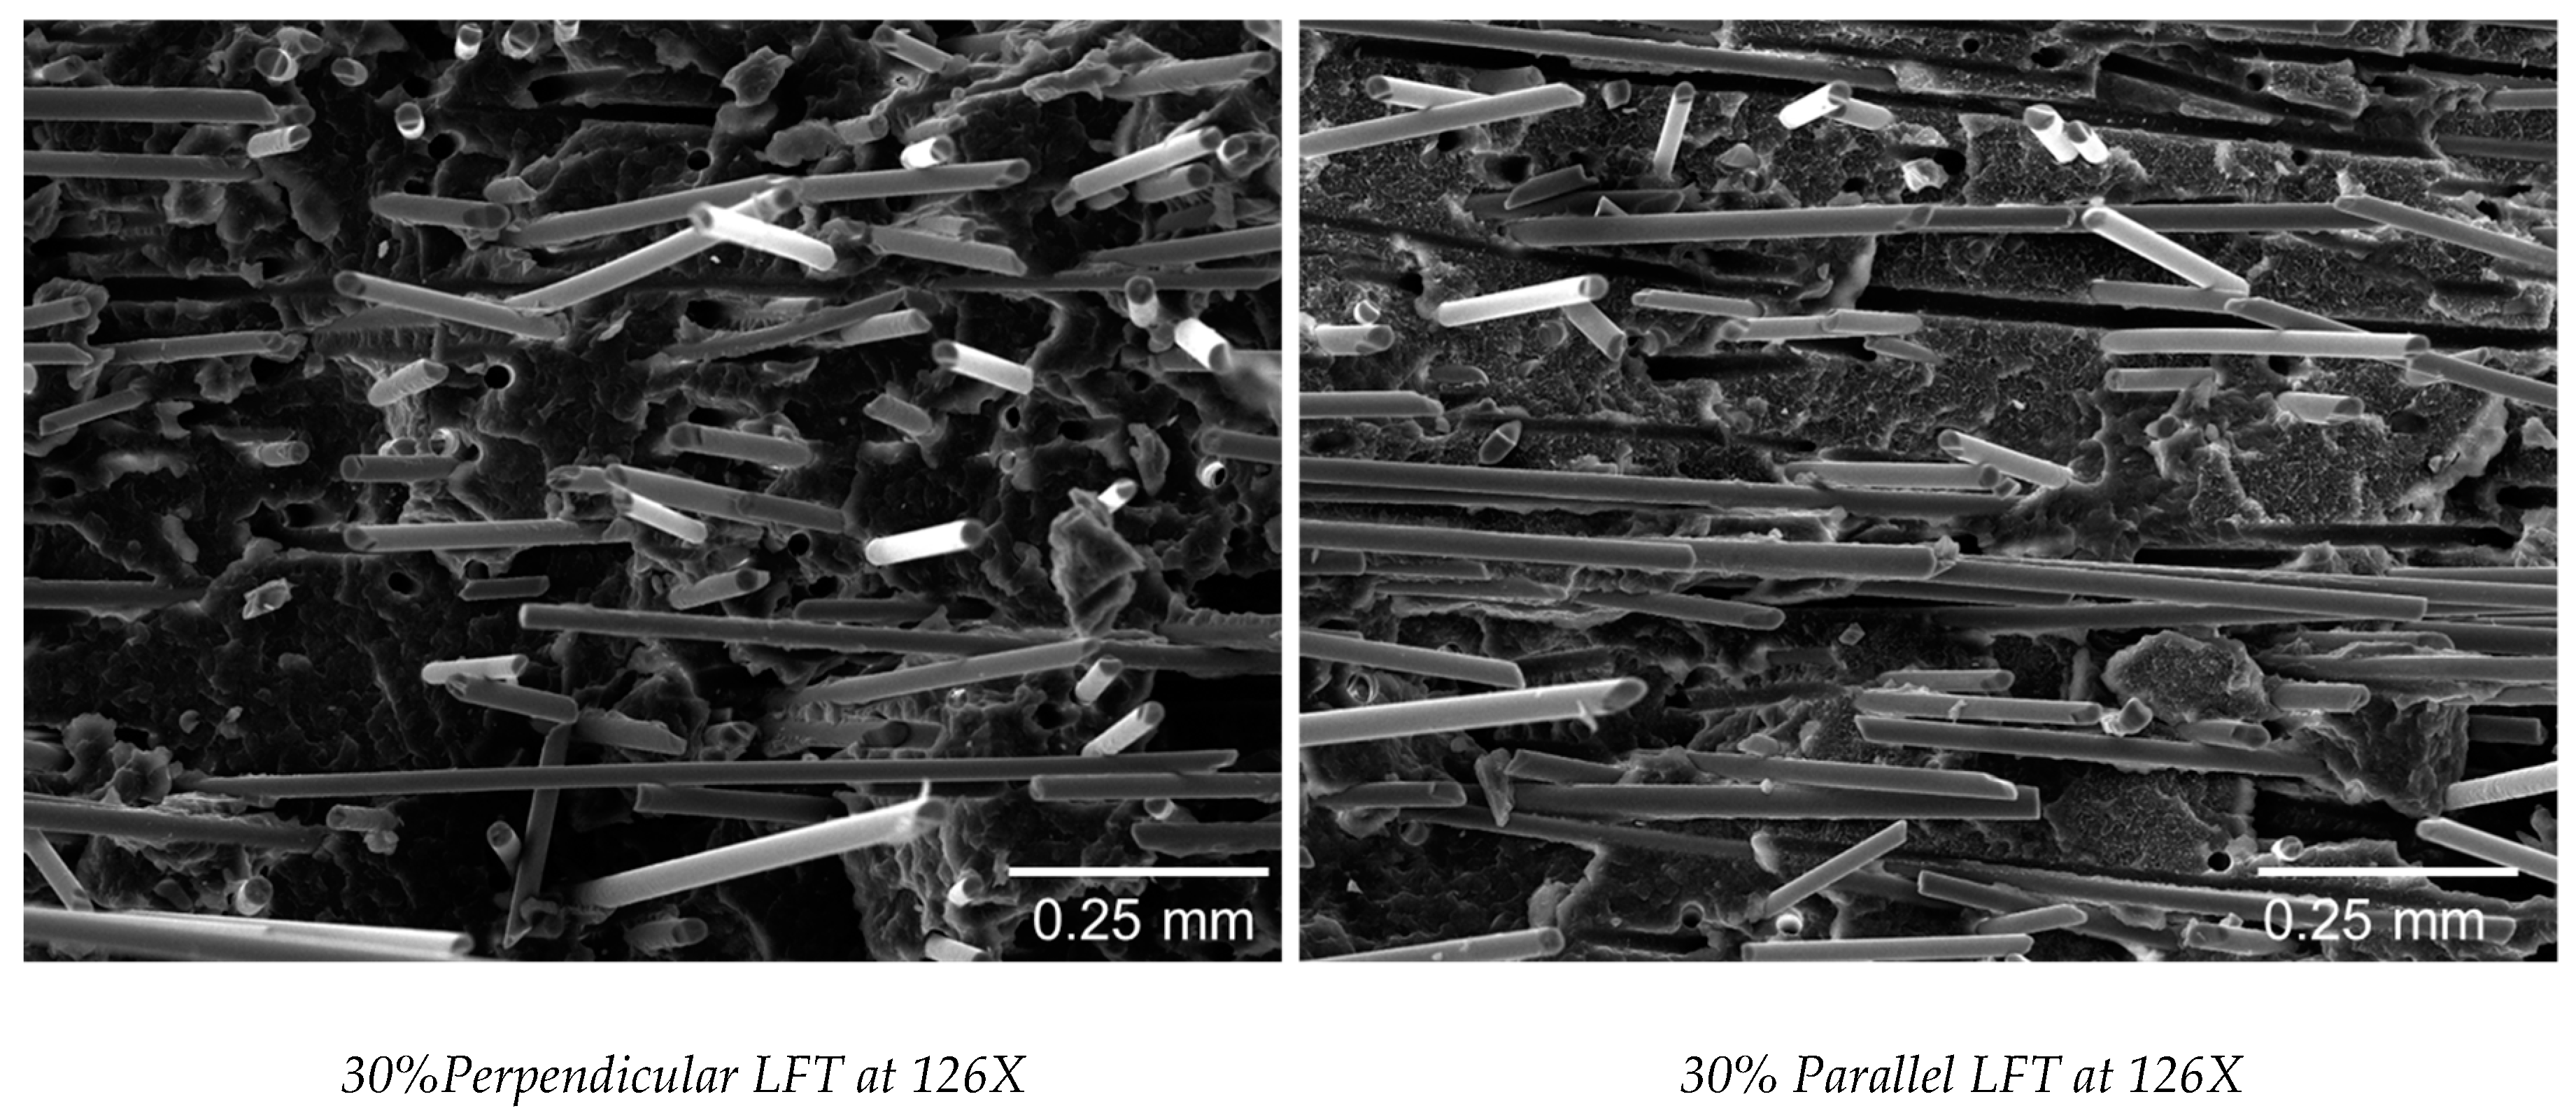
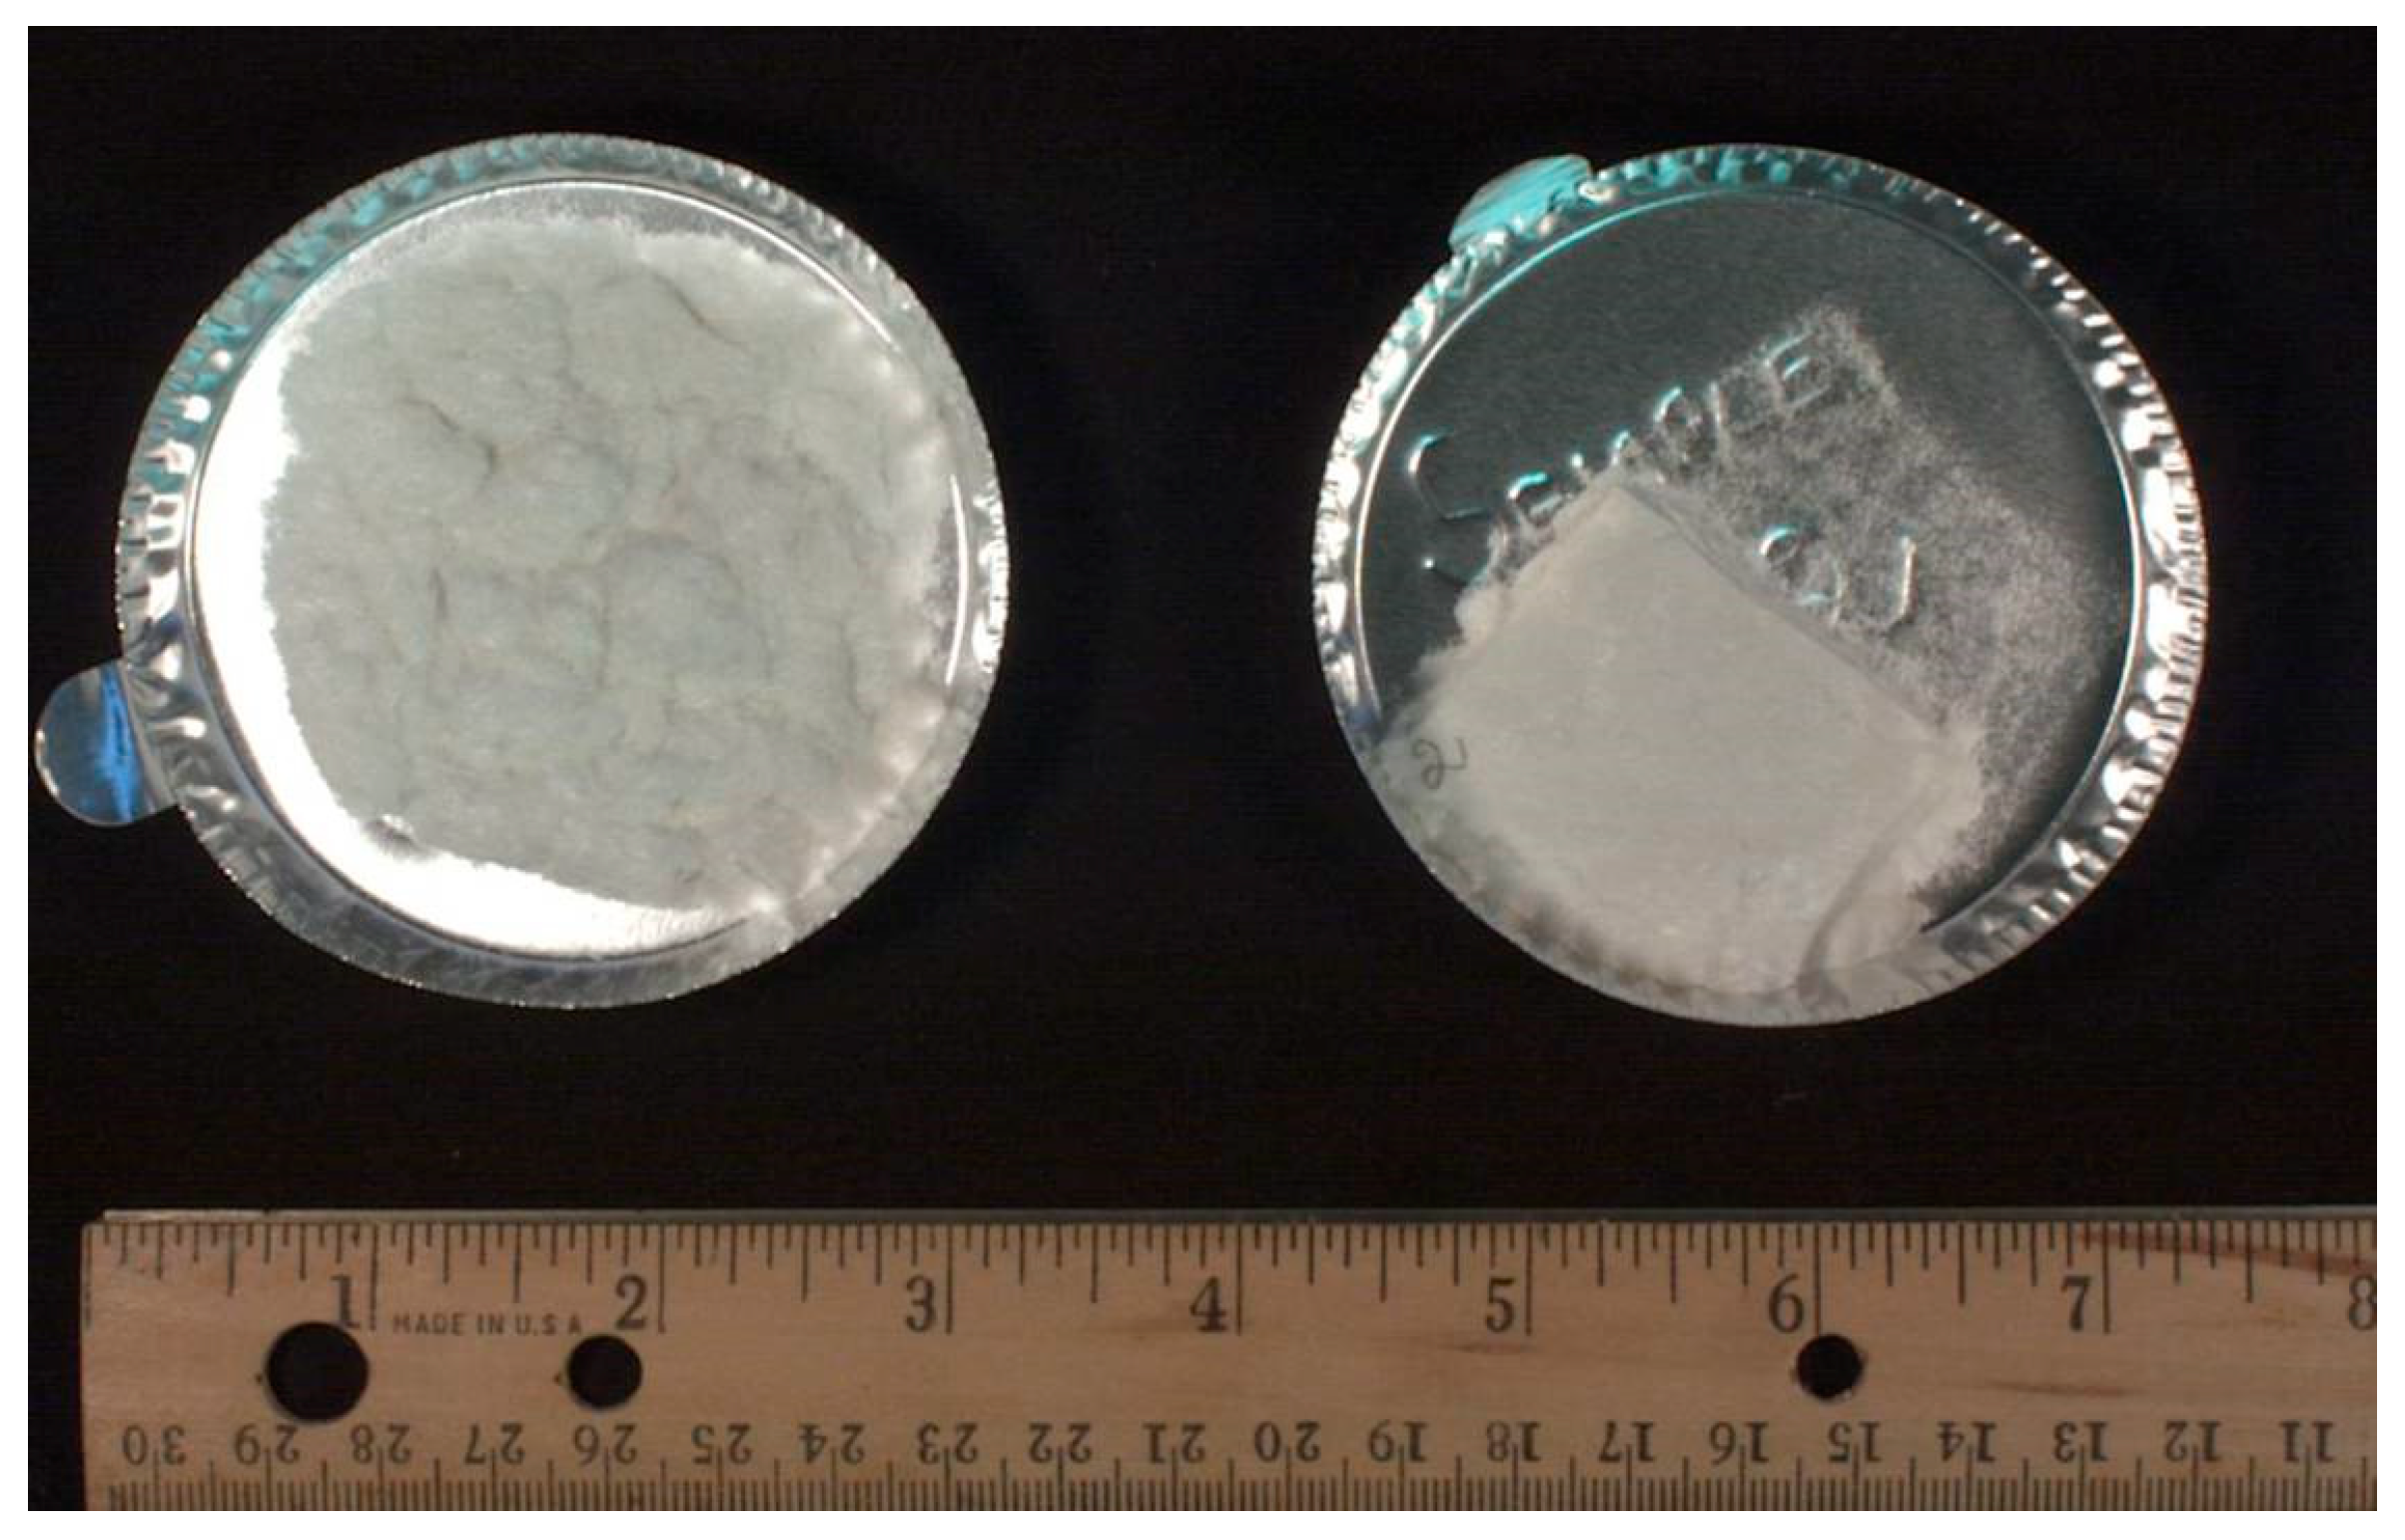
4.1. Thermal and Surface Characterization
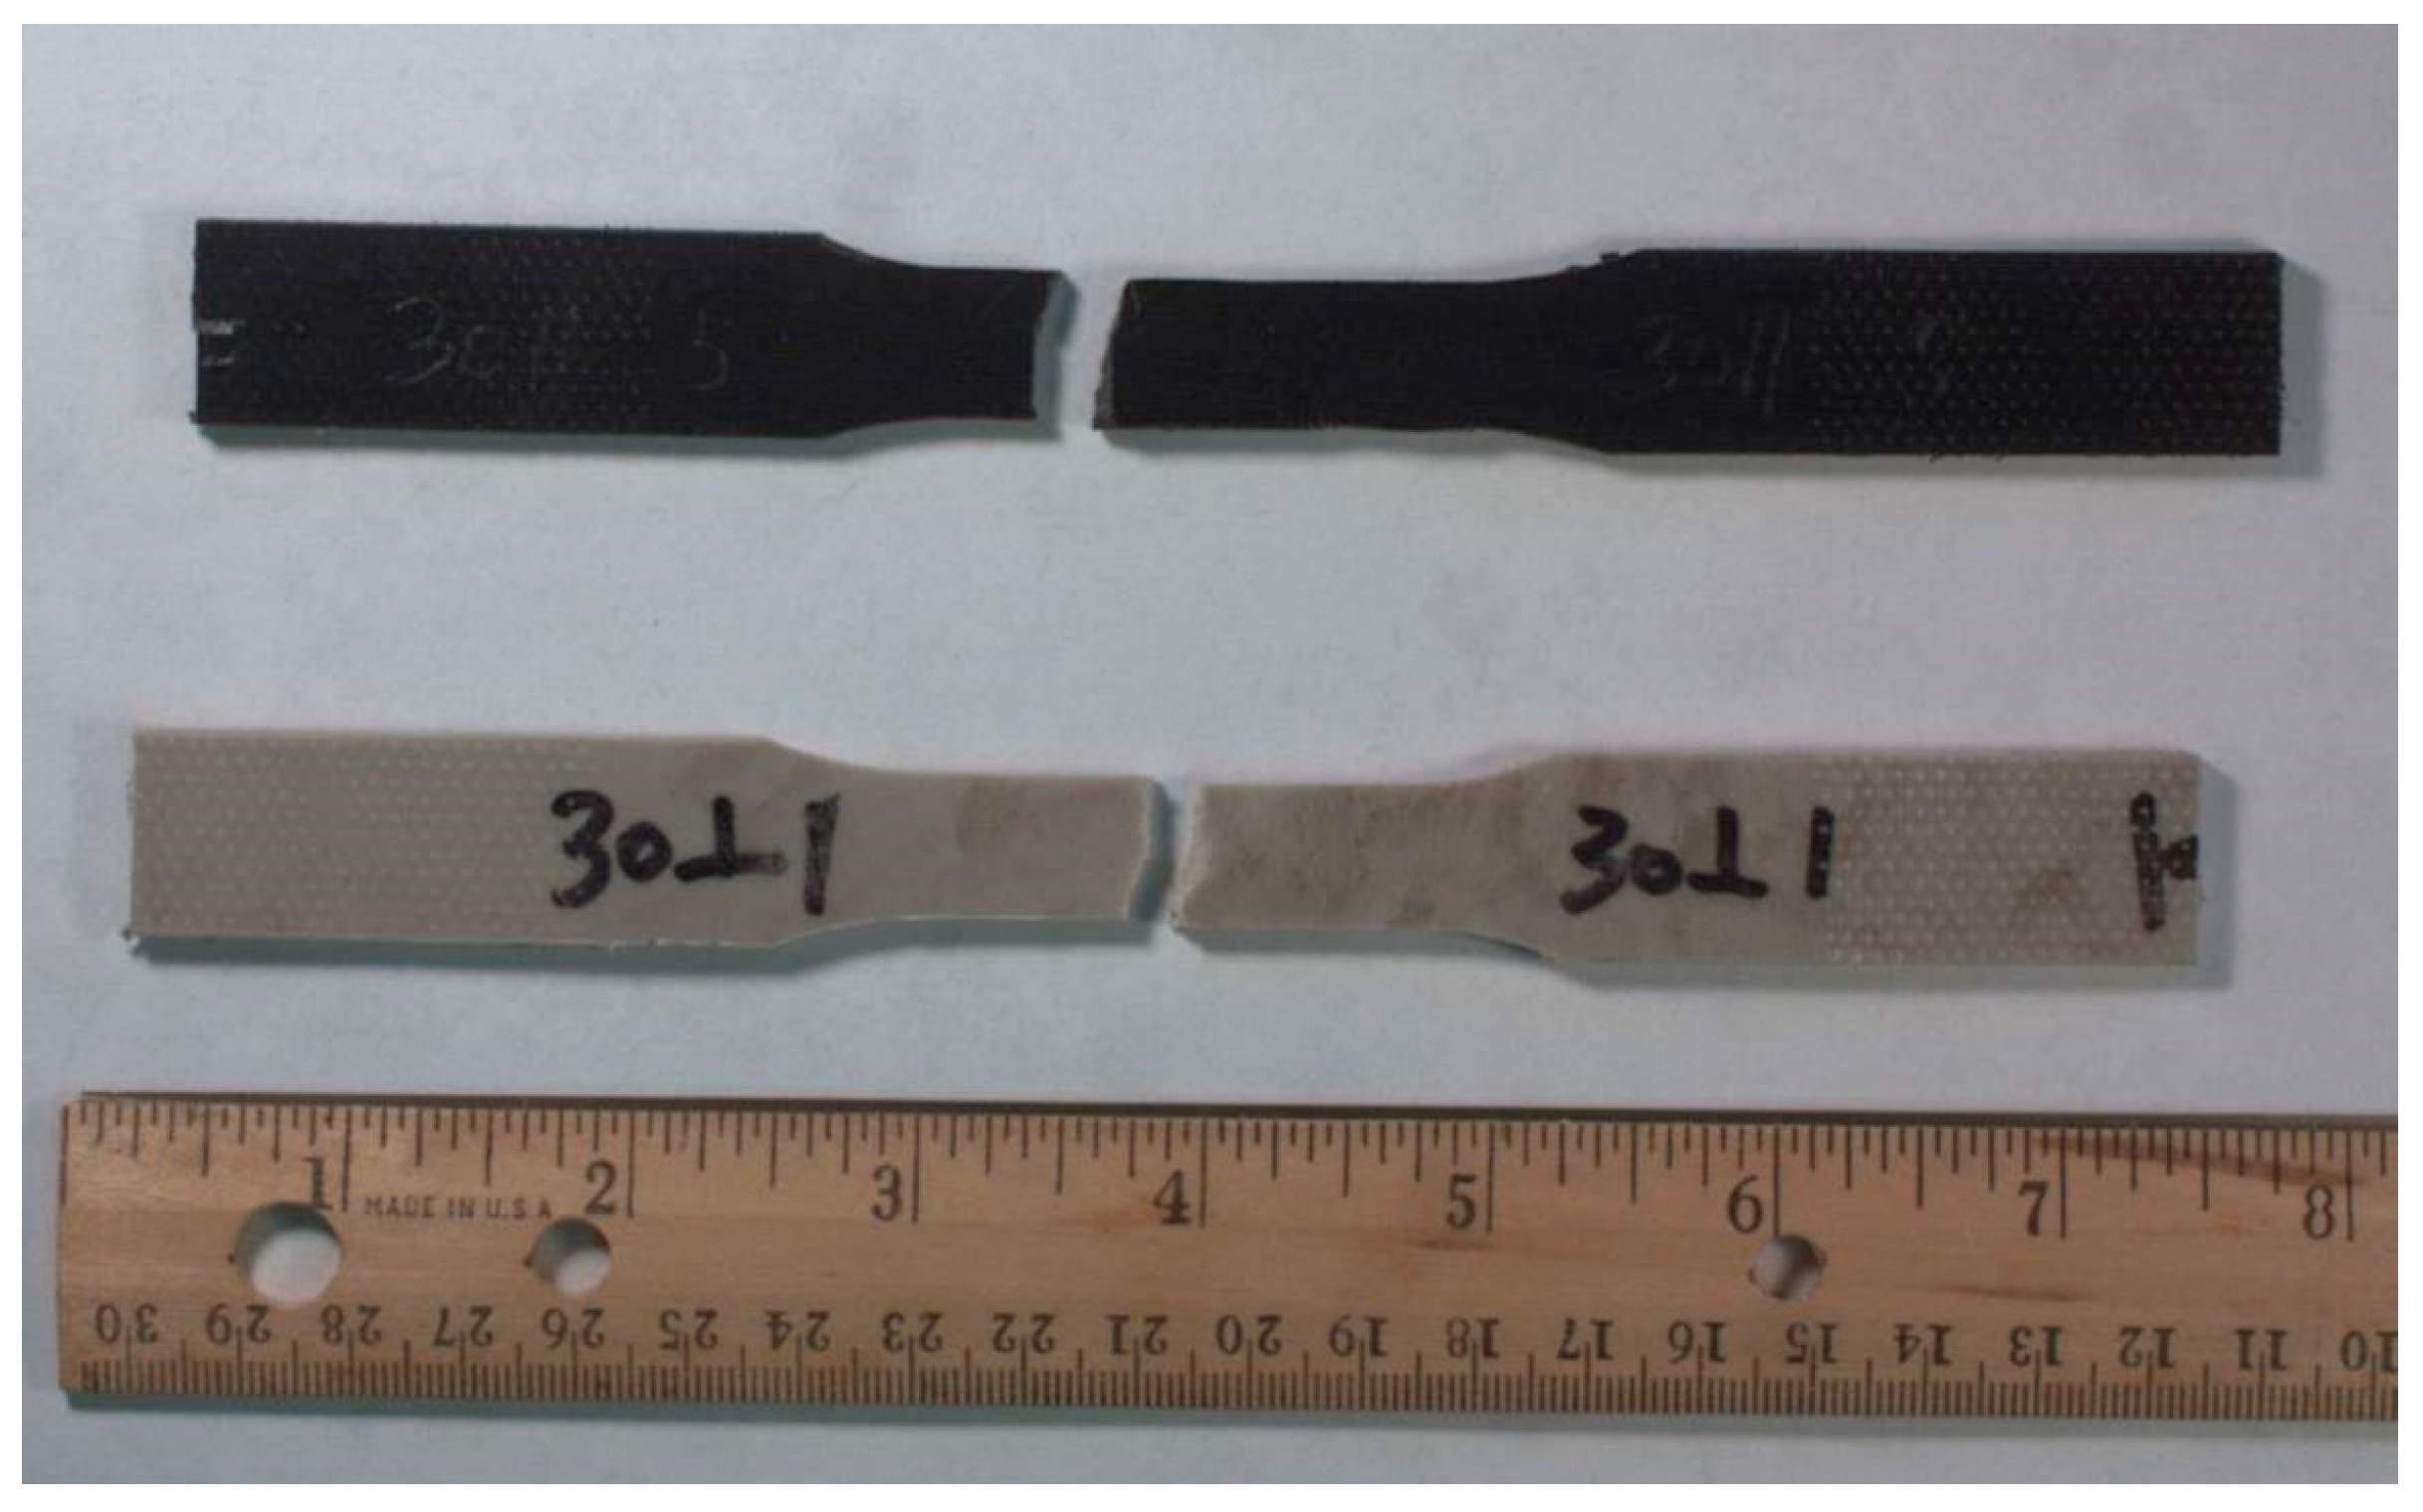
4.2. Tensile Response
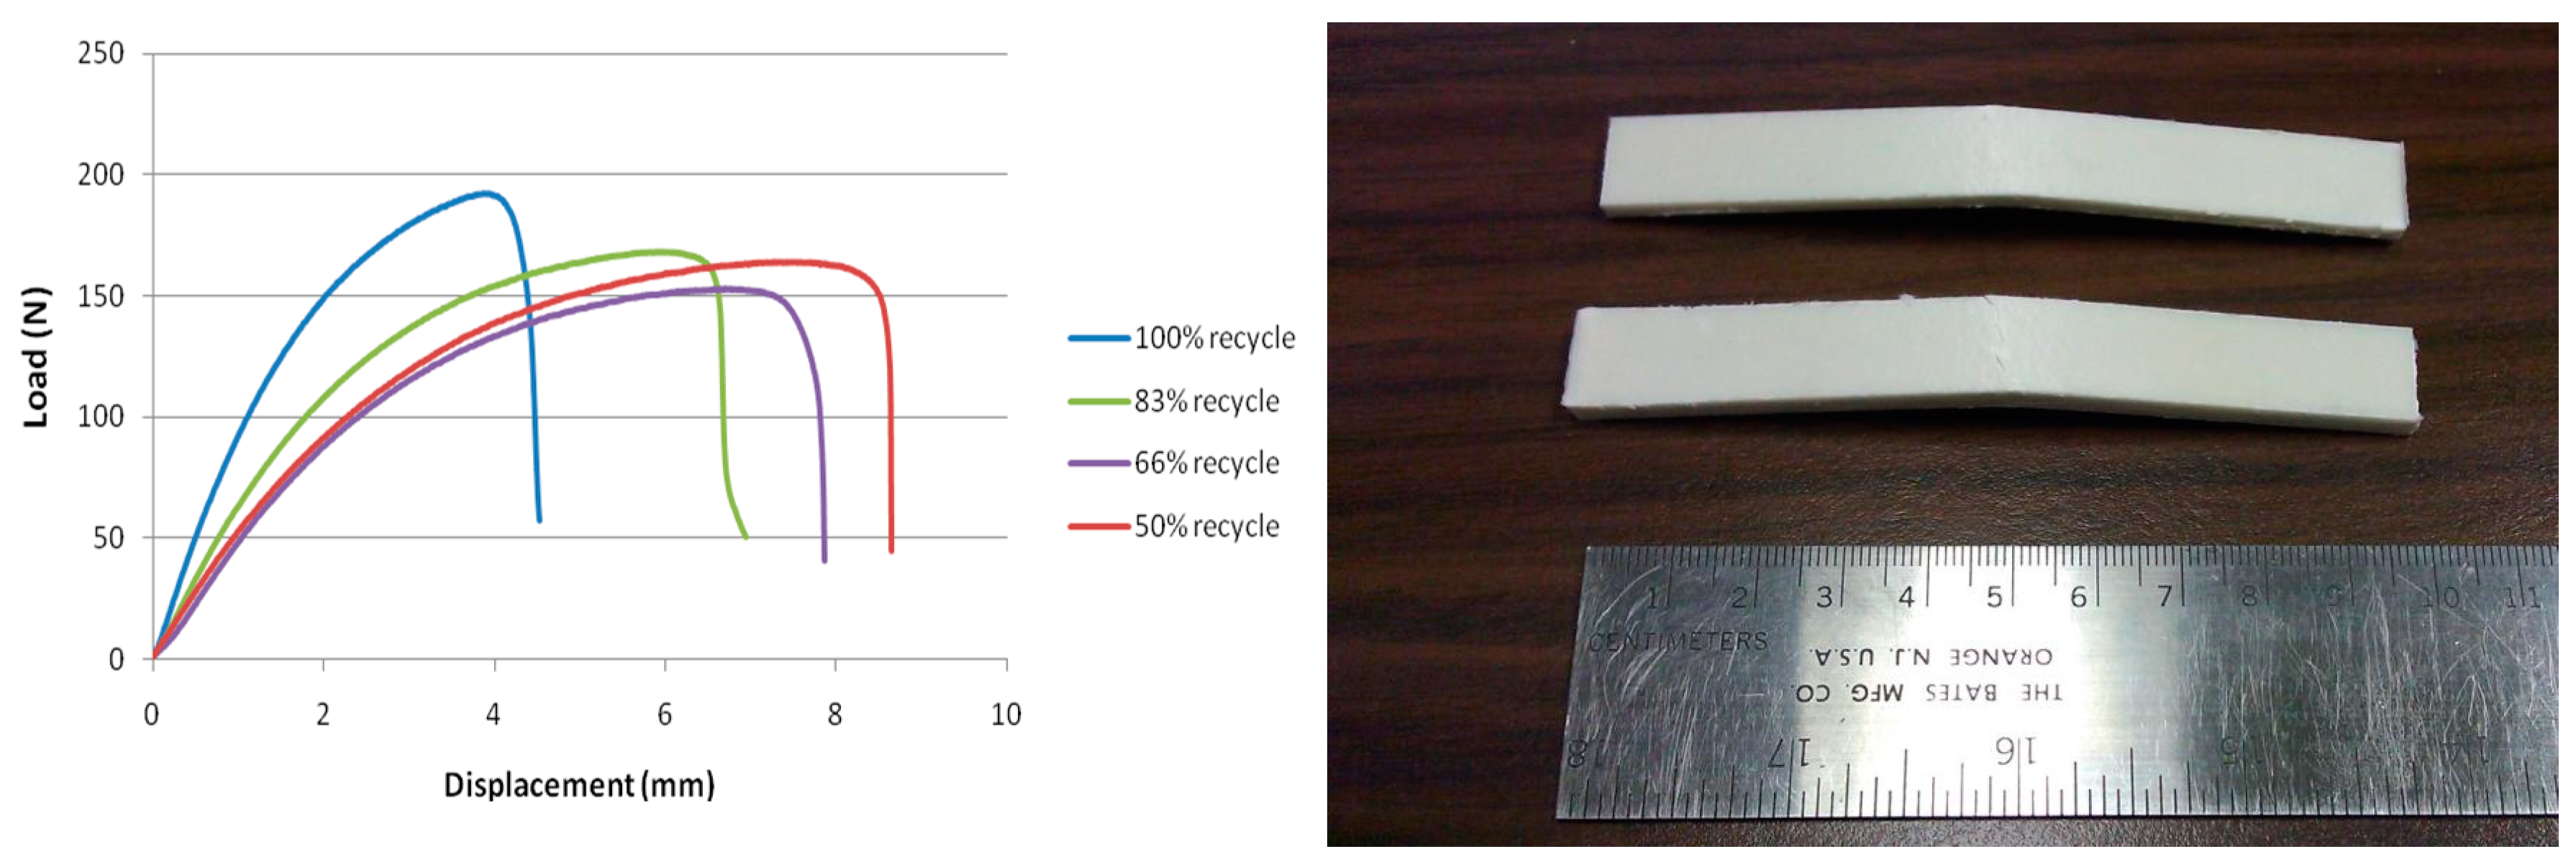
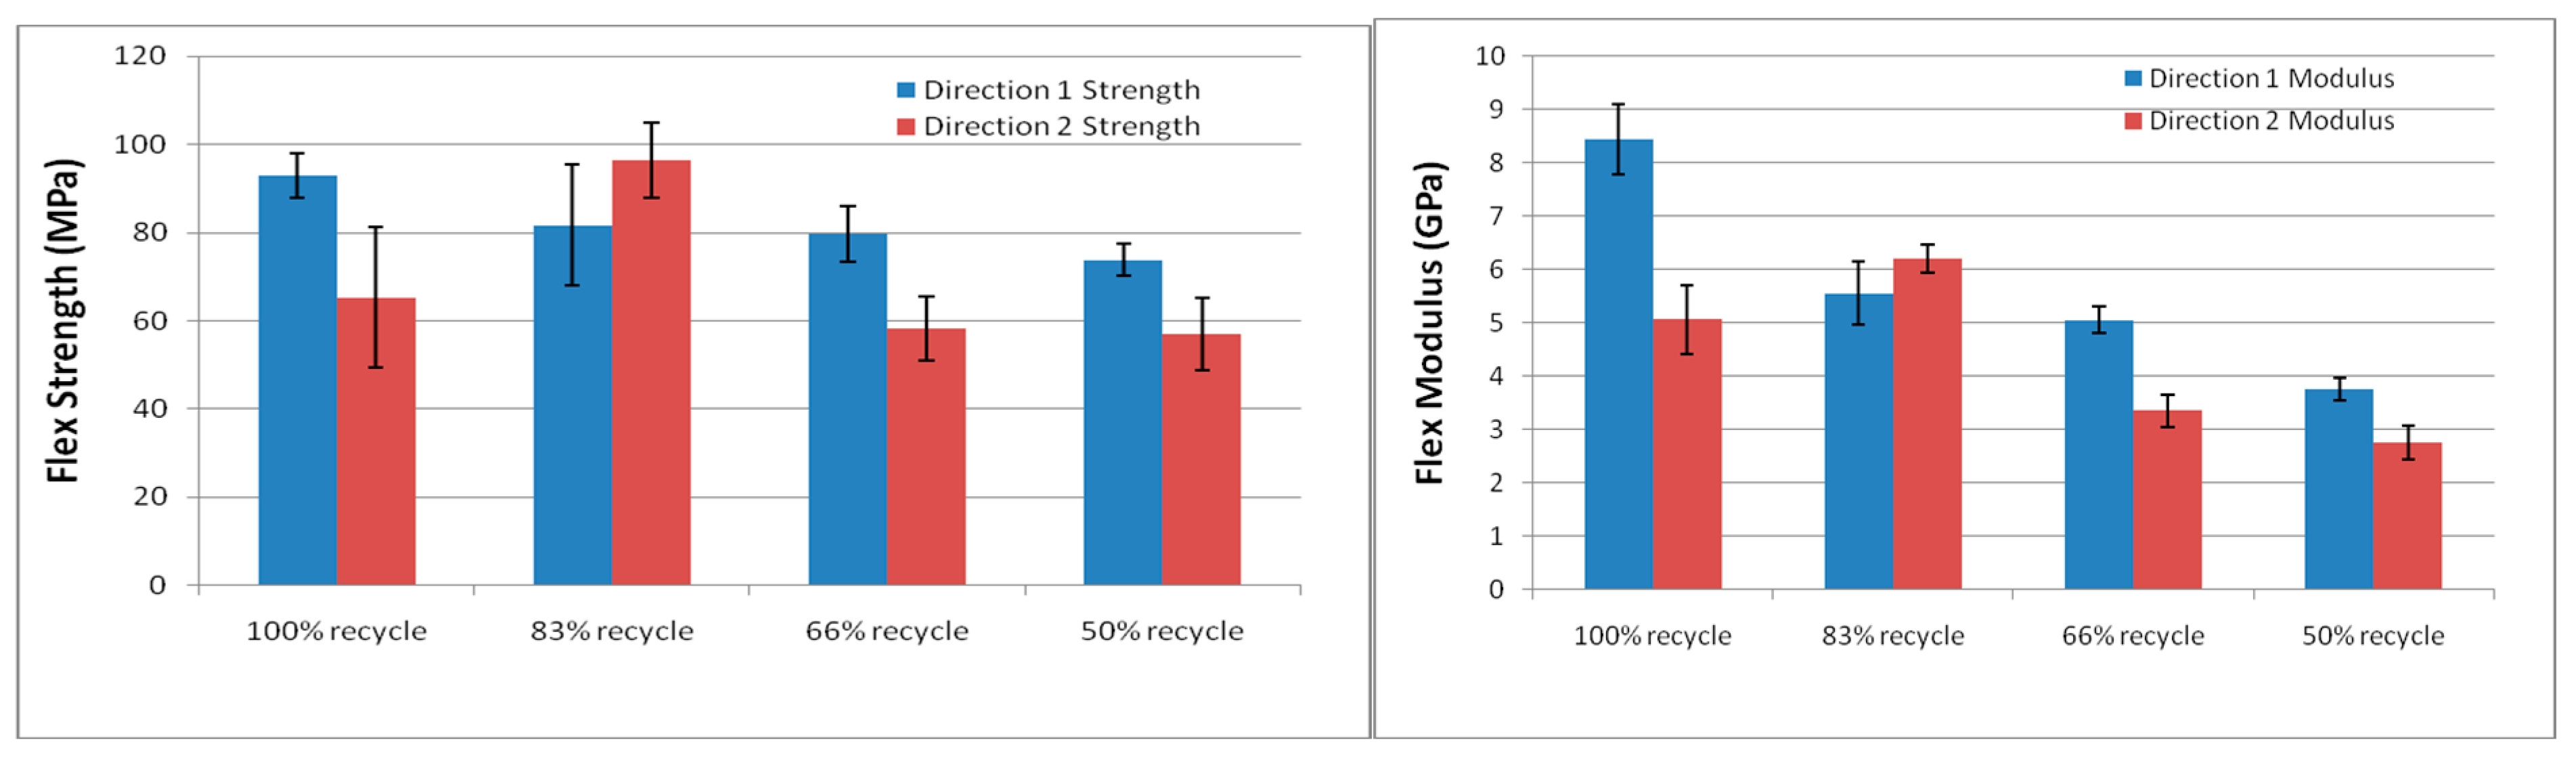
4.3. Flexure Response
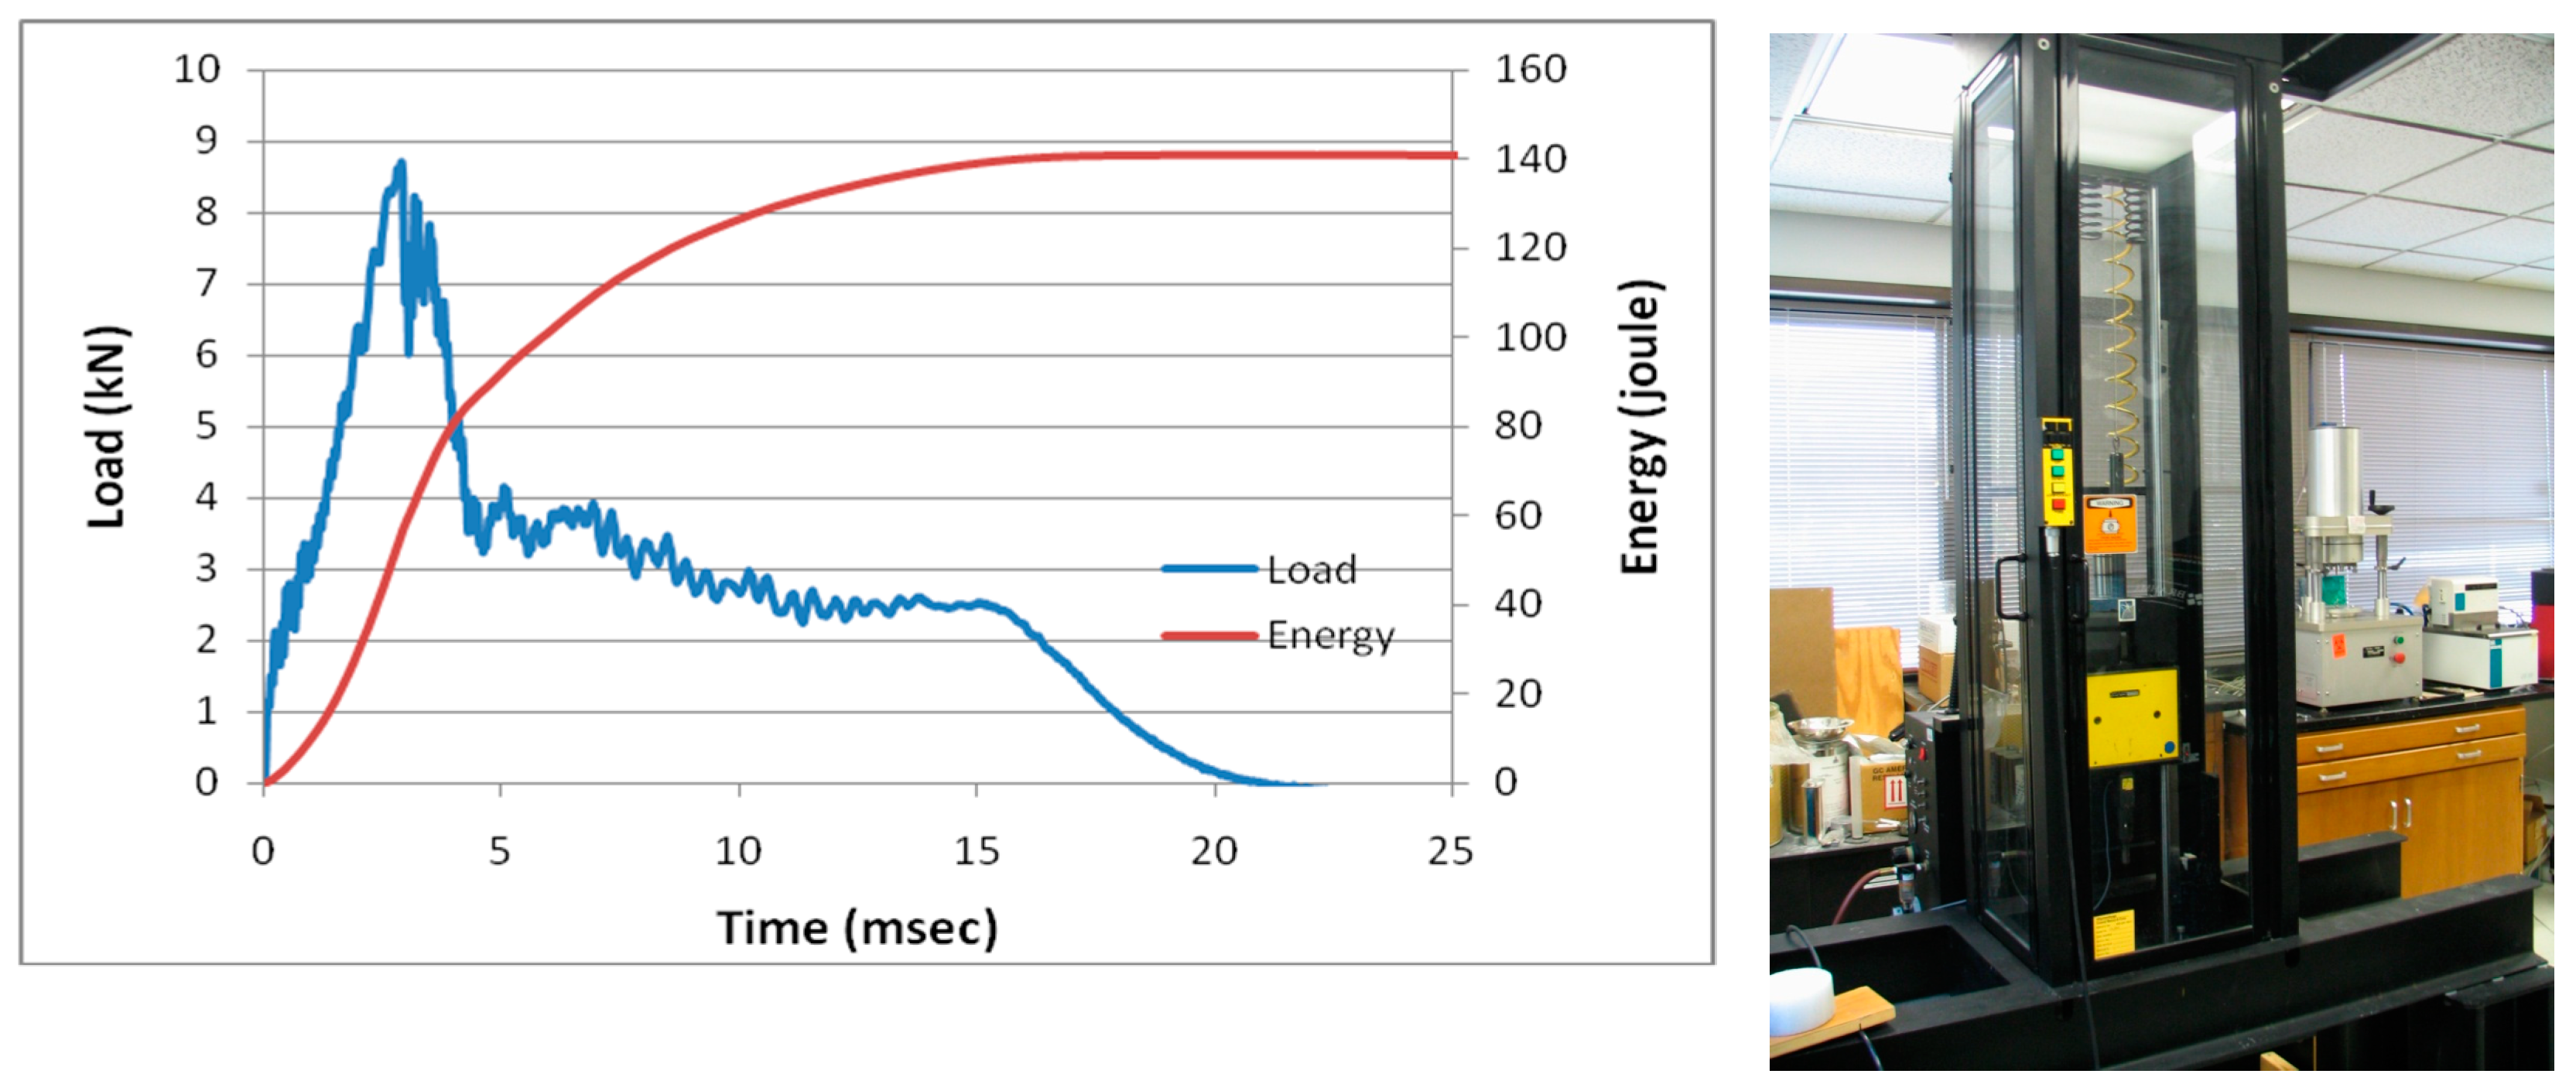
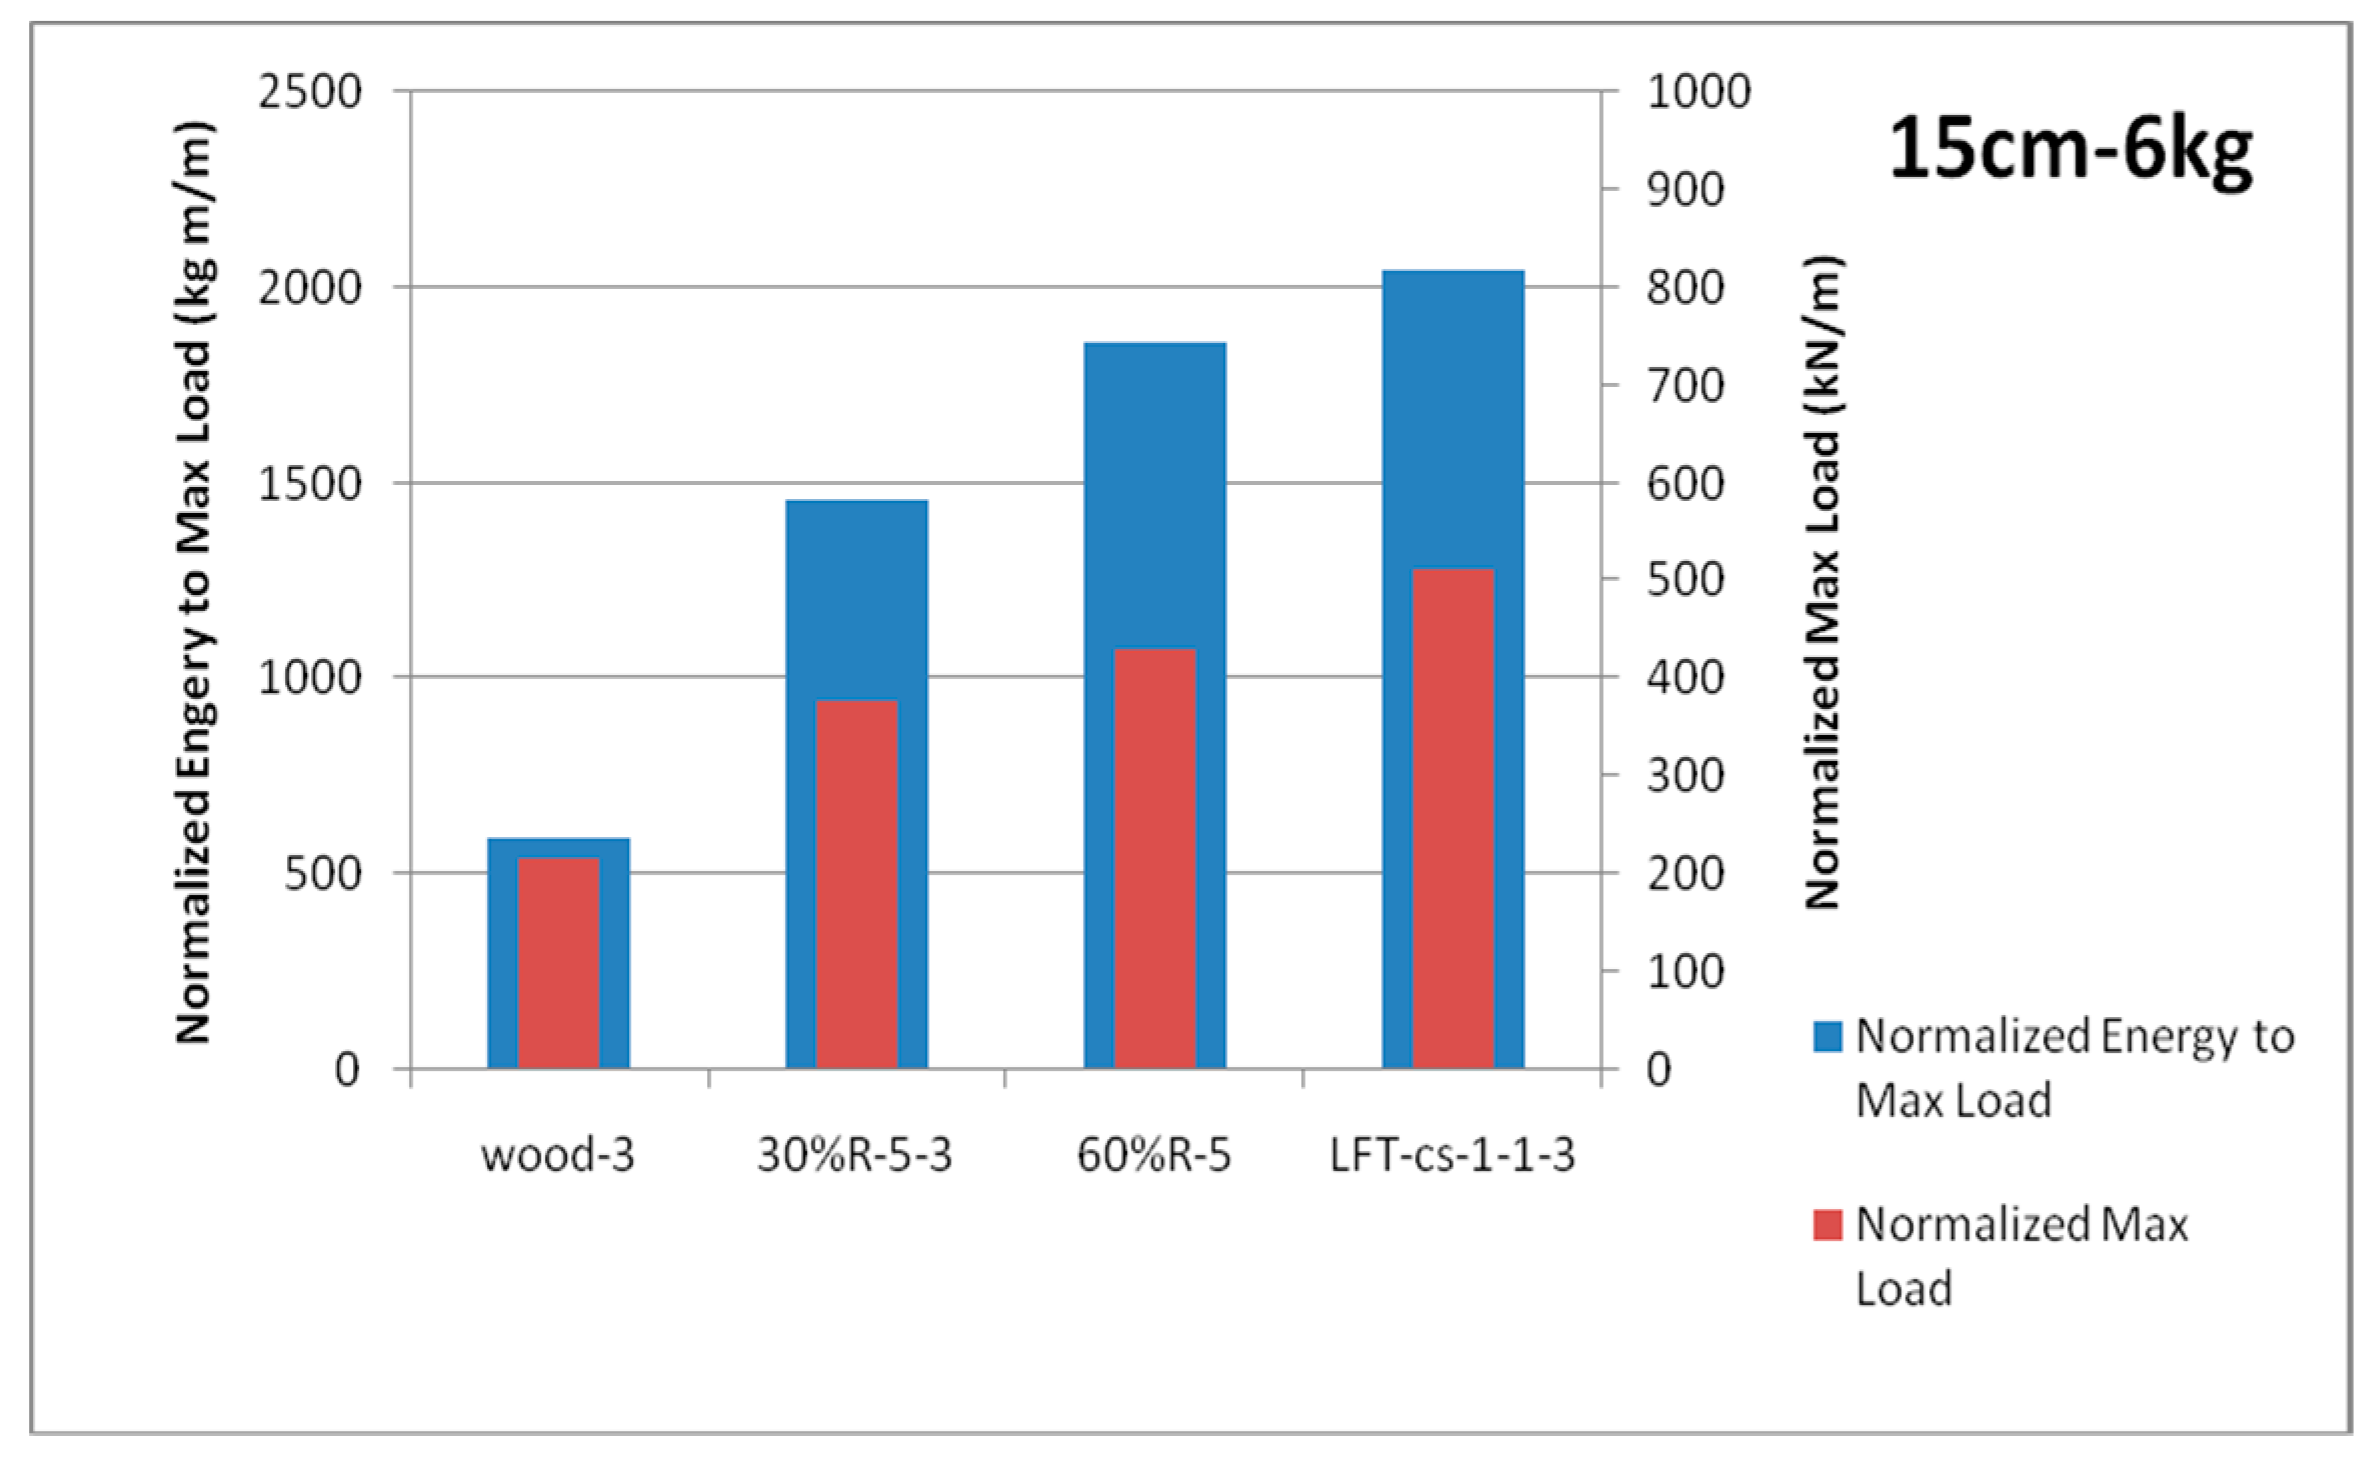
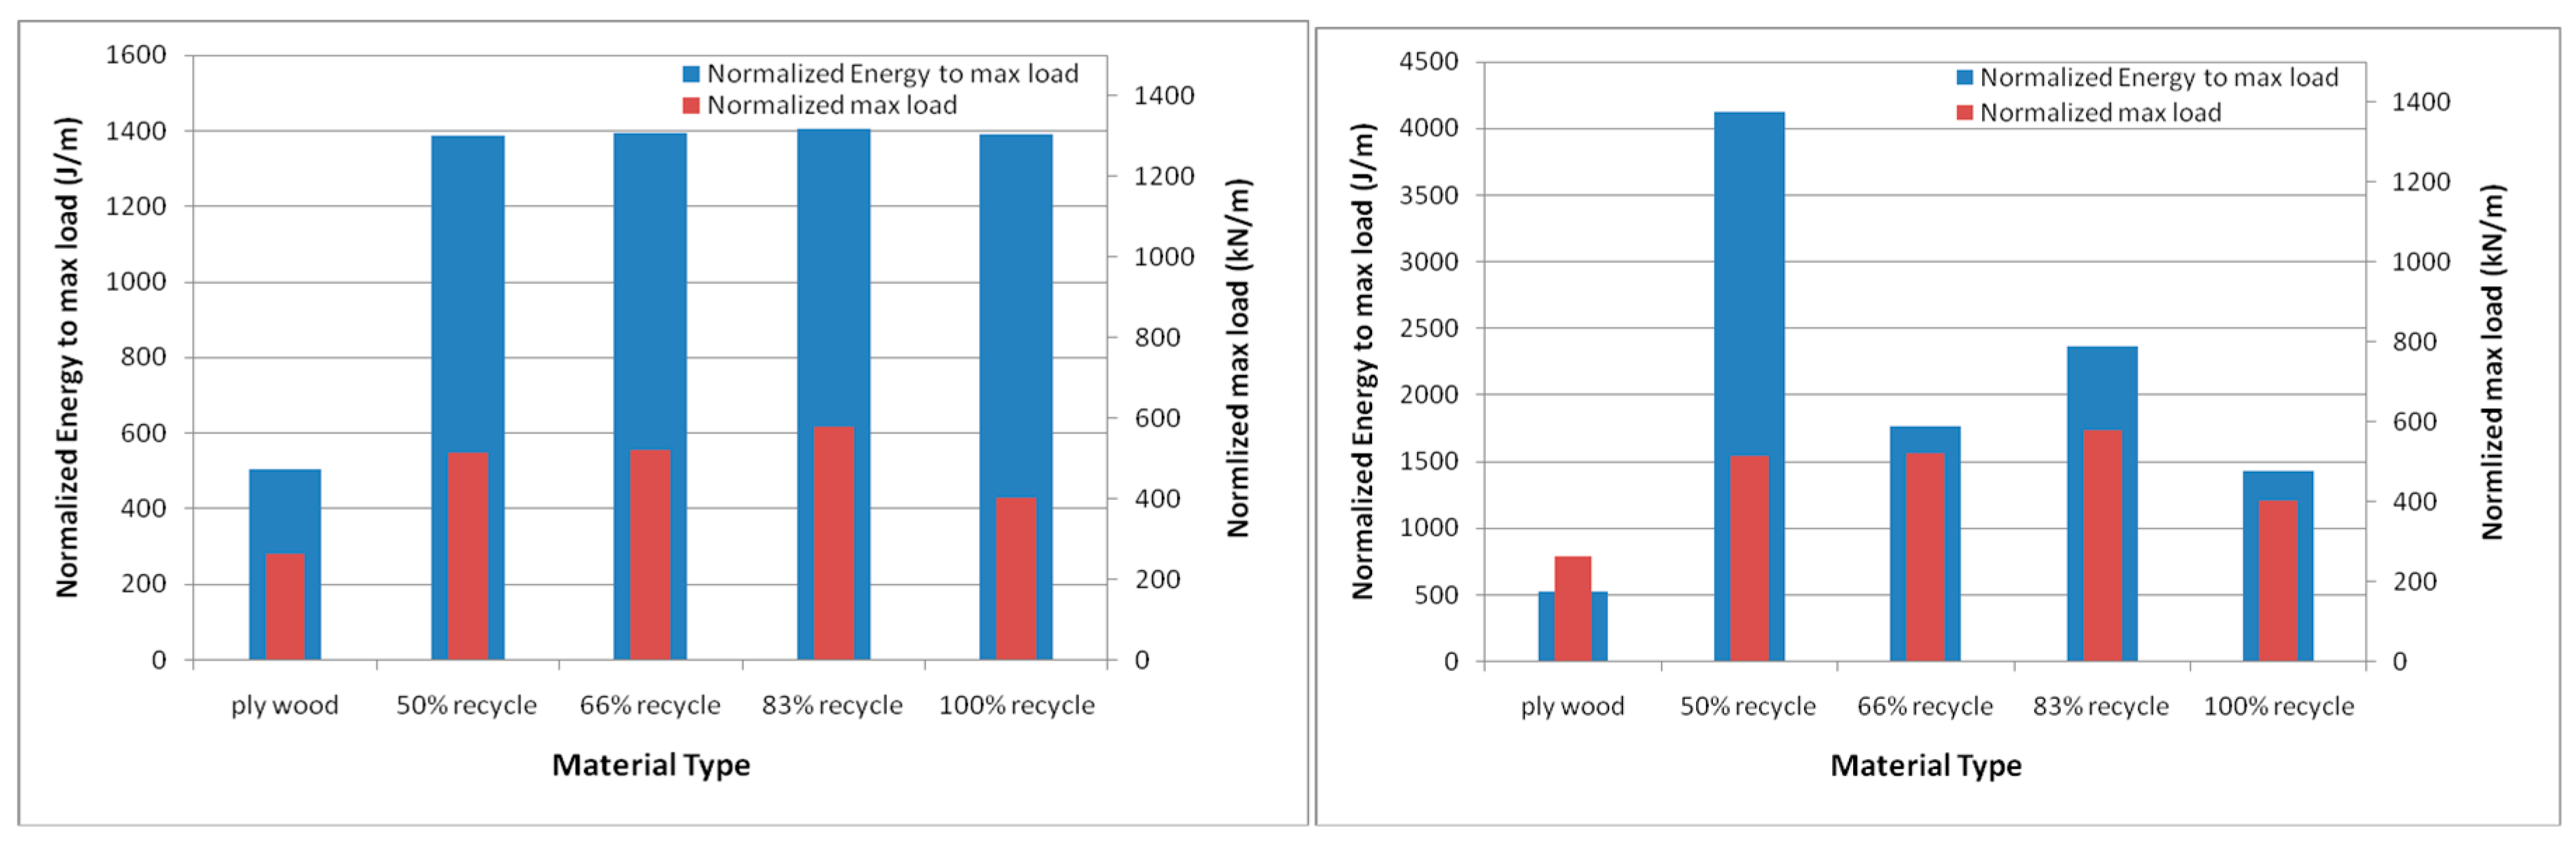
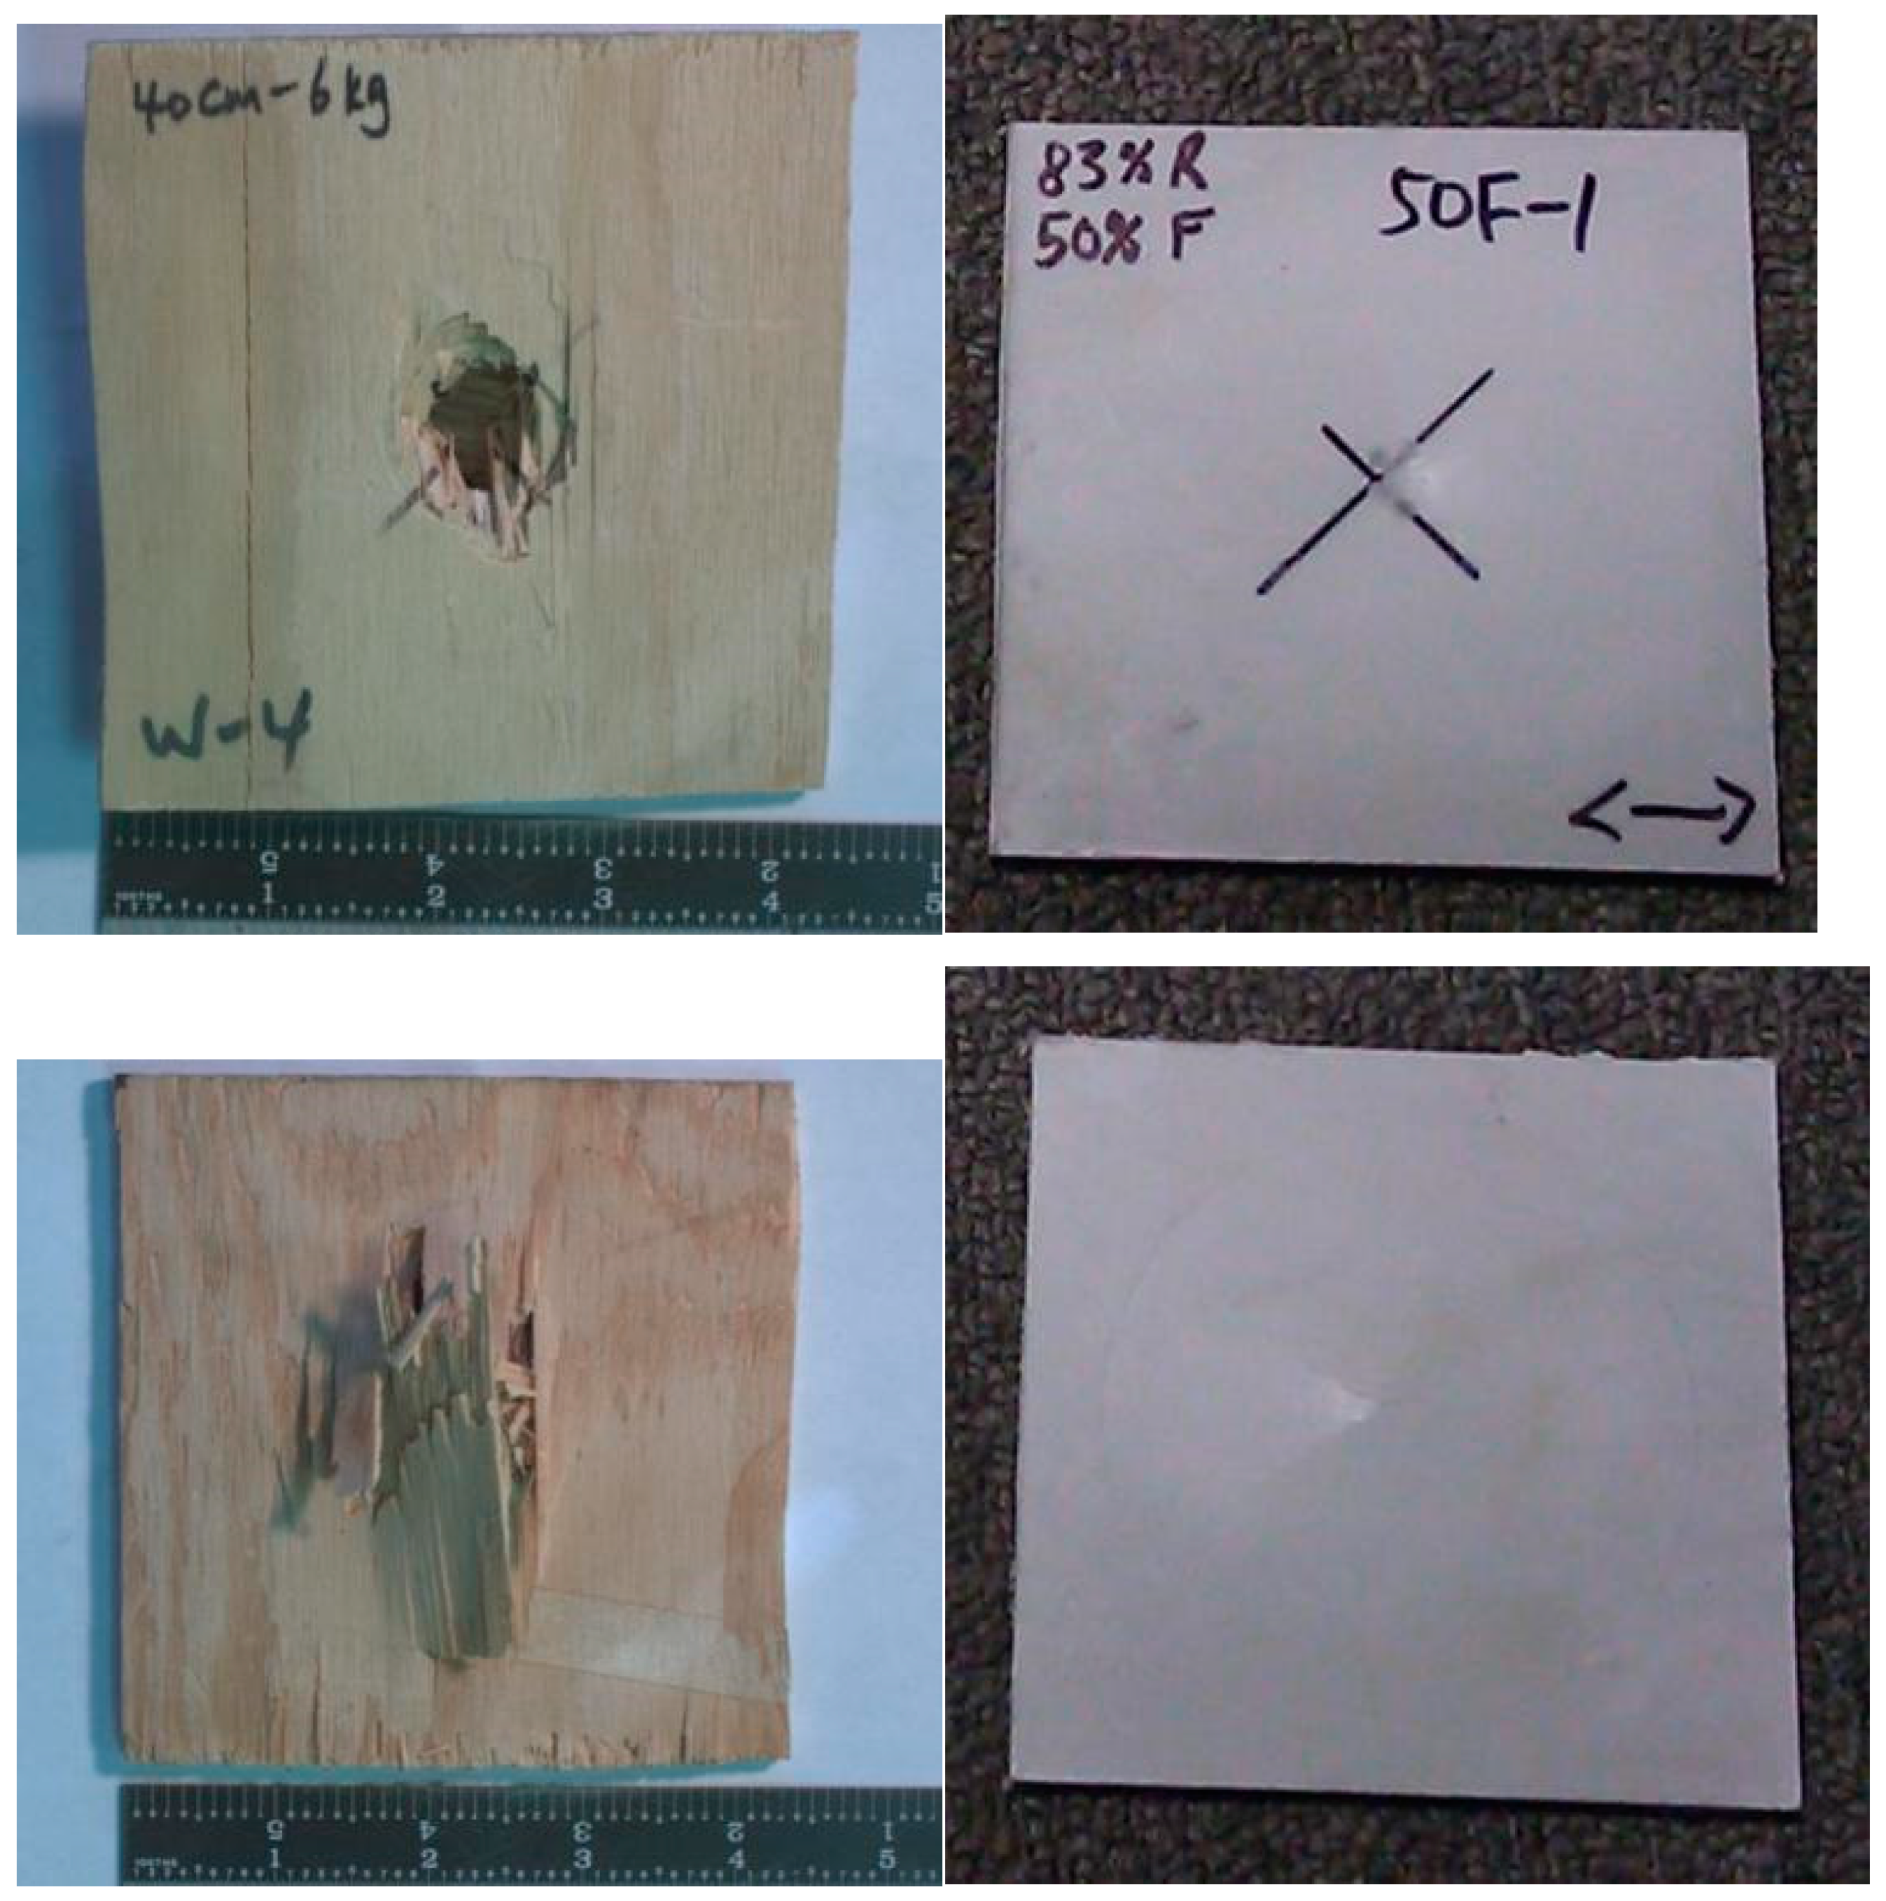
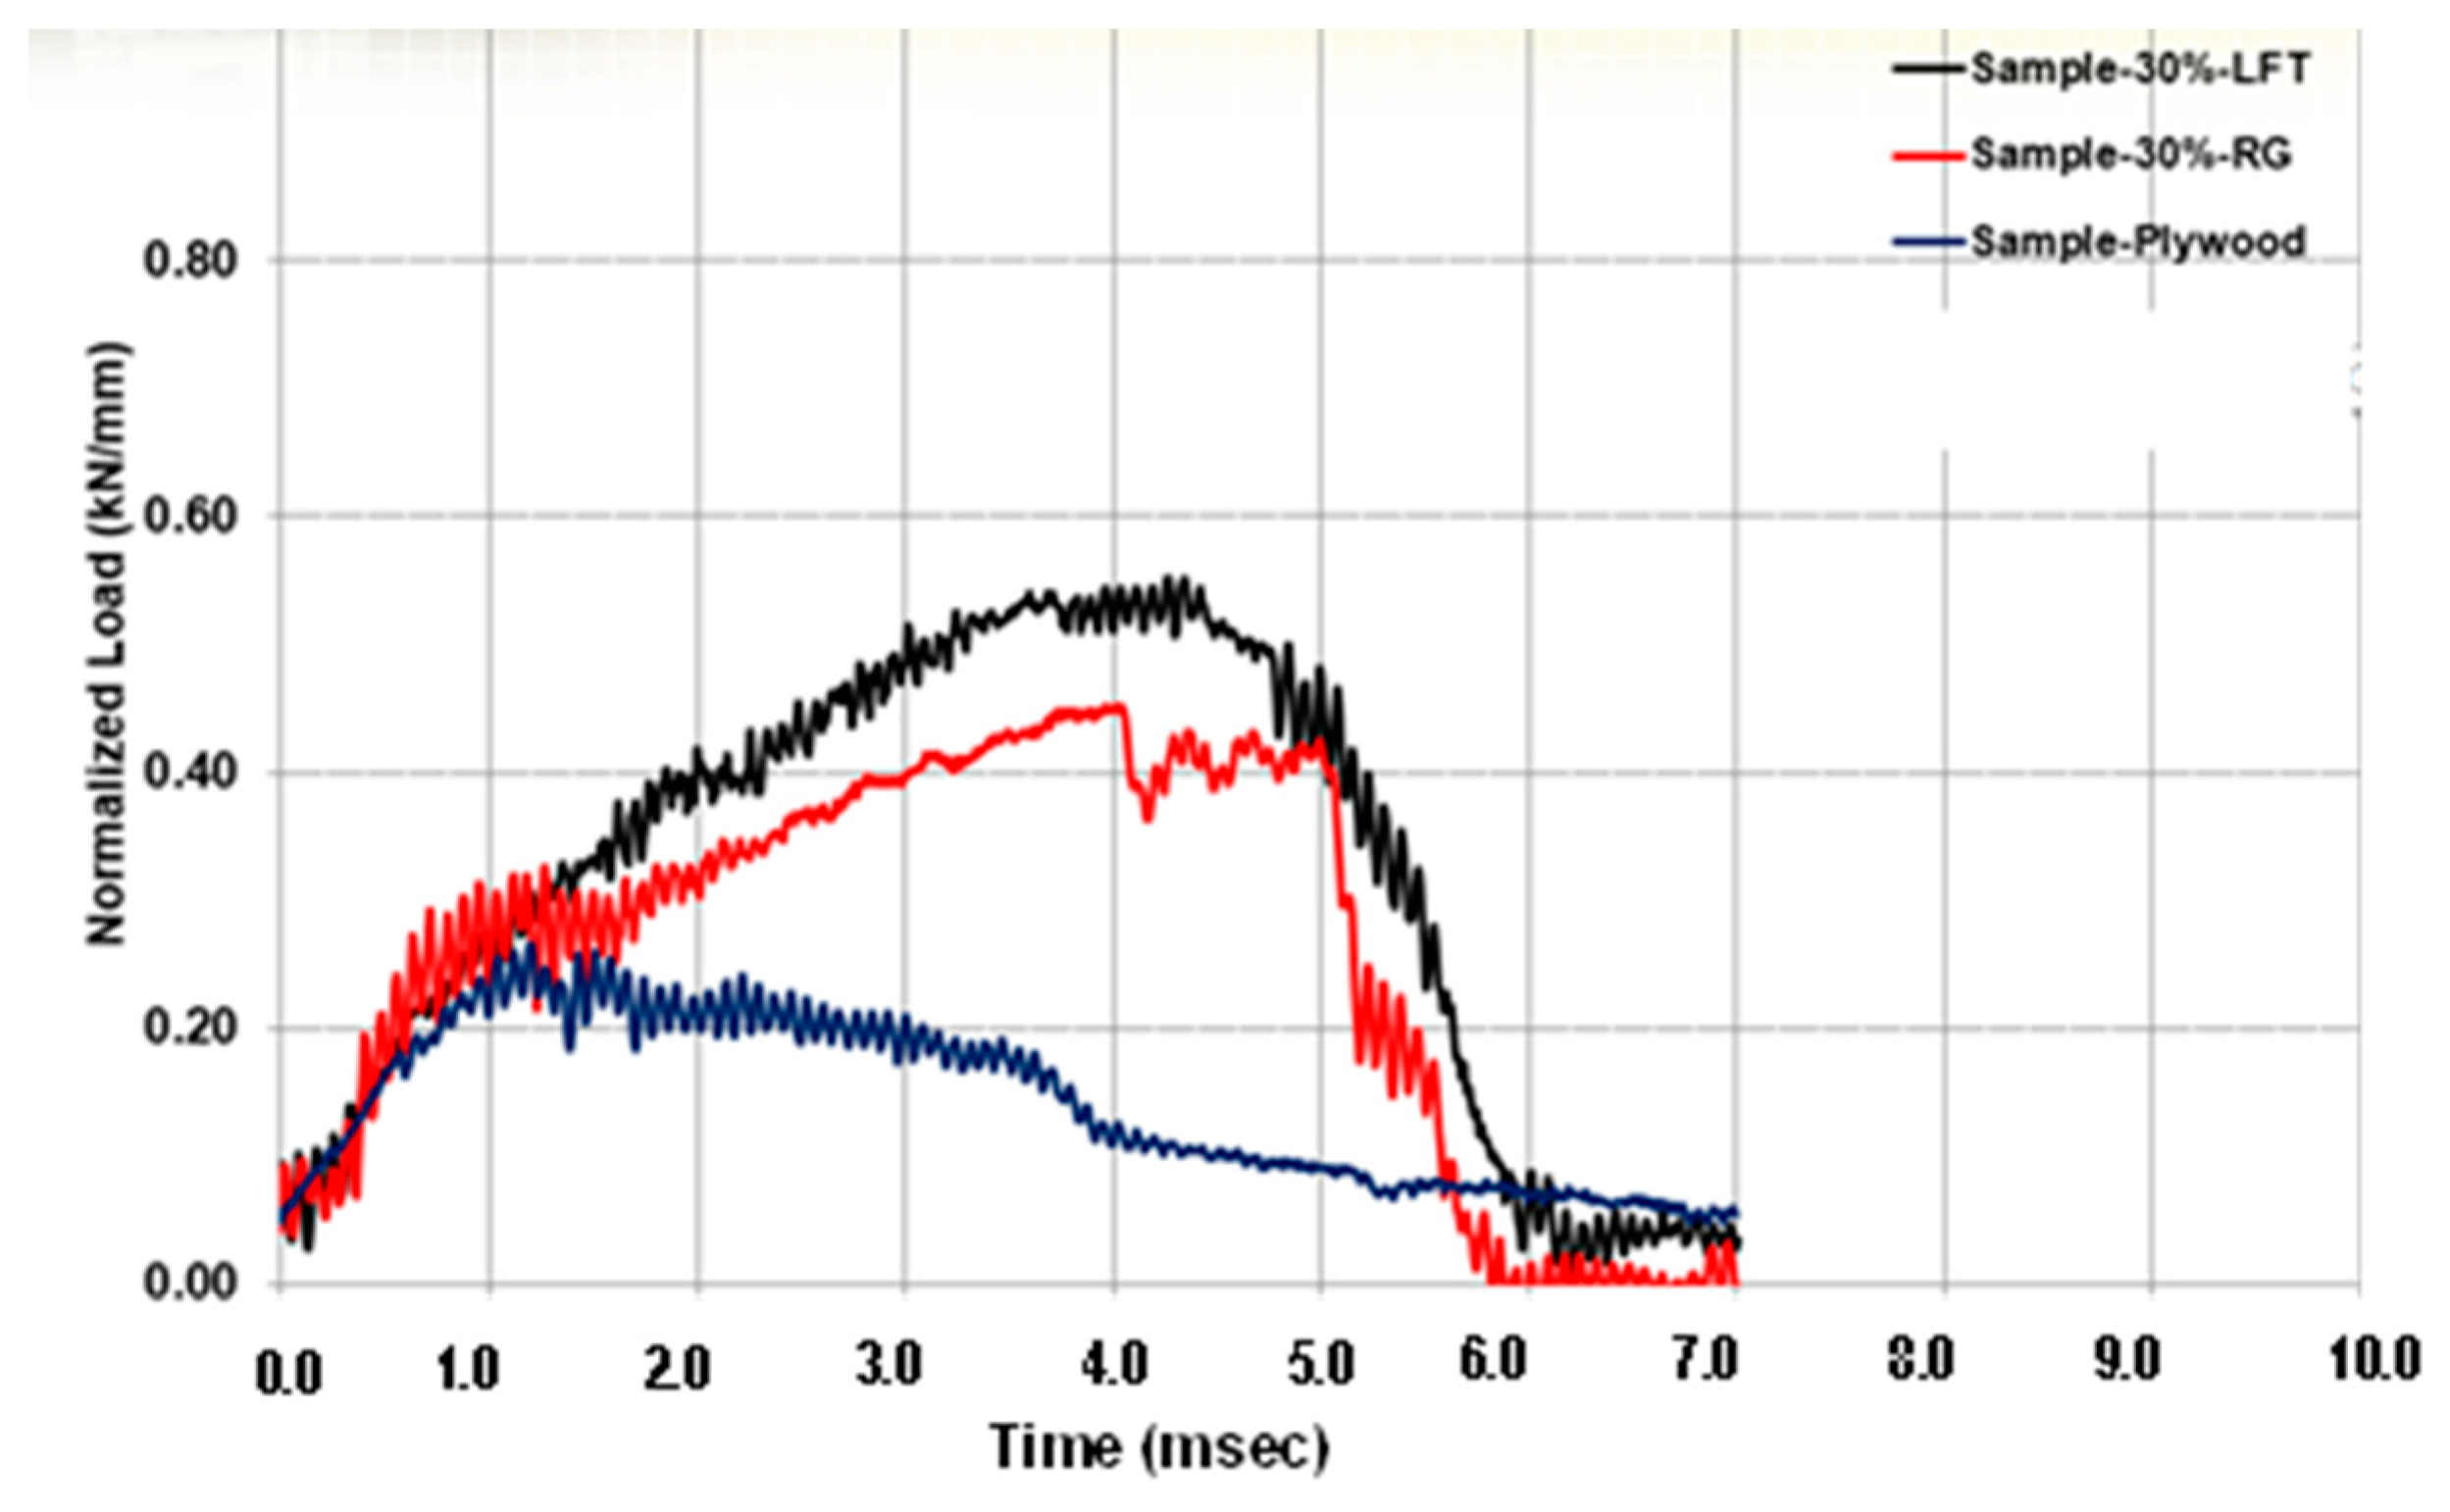
4.4. Impact Performance of PP-GF Scrap Compared with Plywood and LFT
5. Discussion
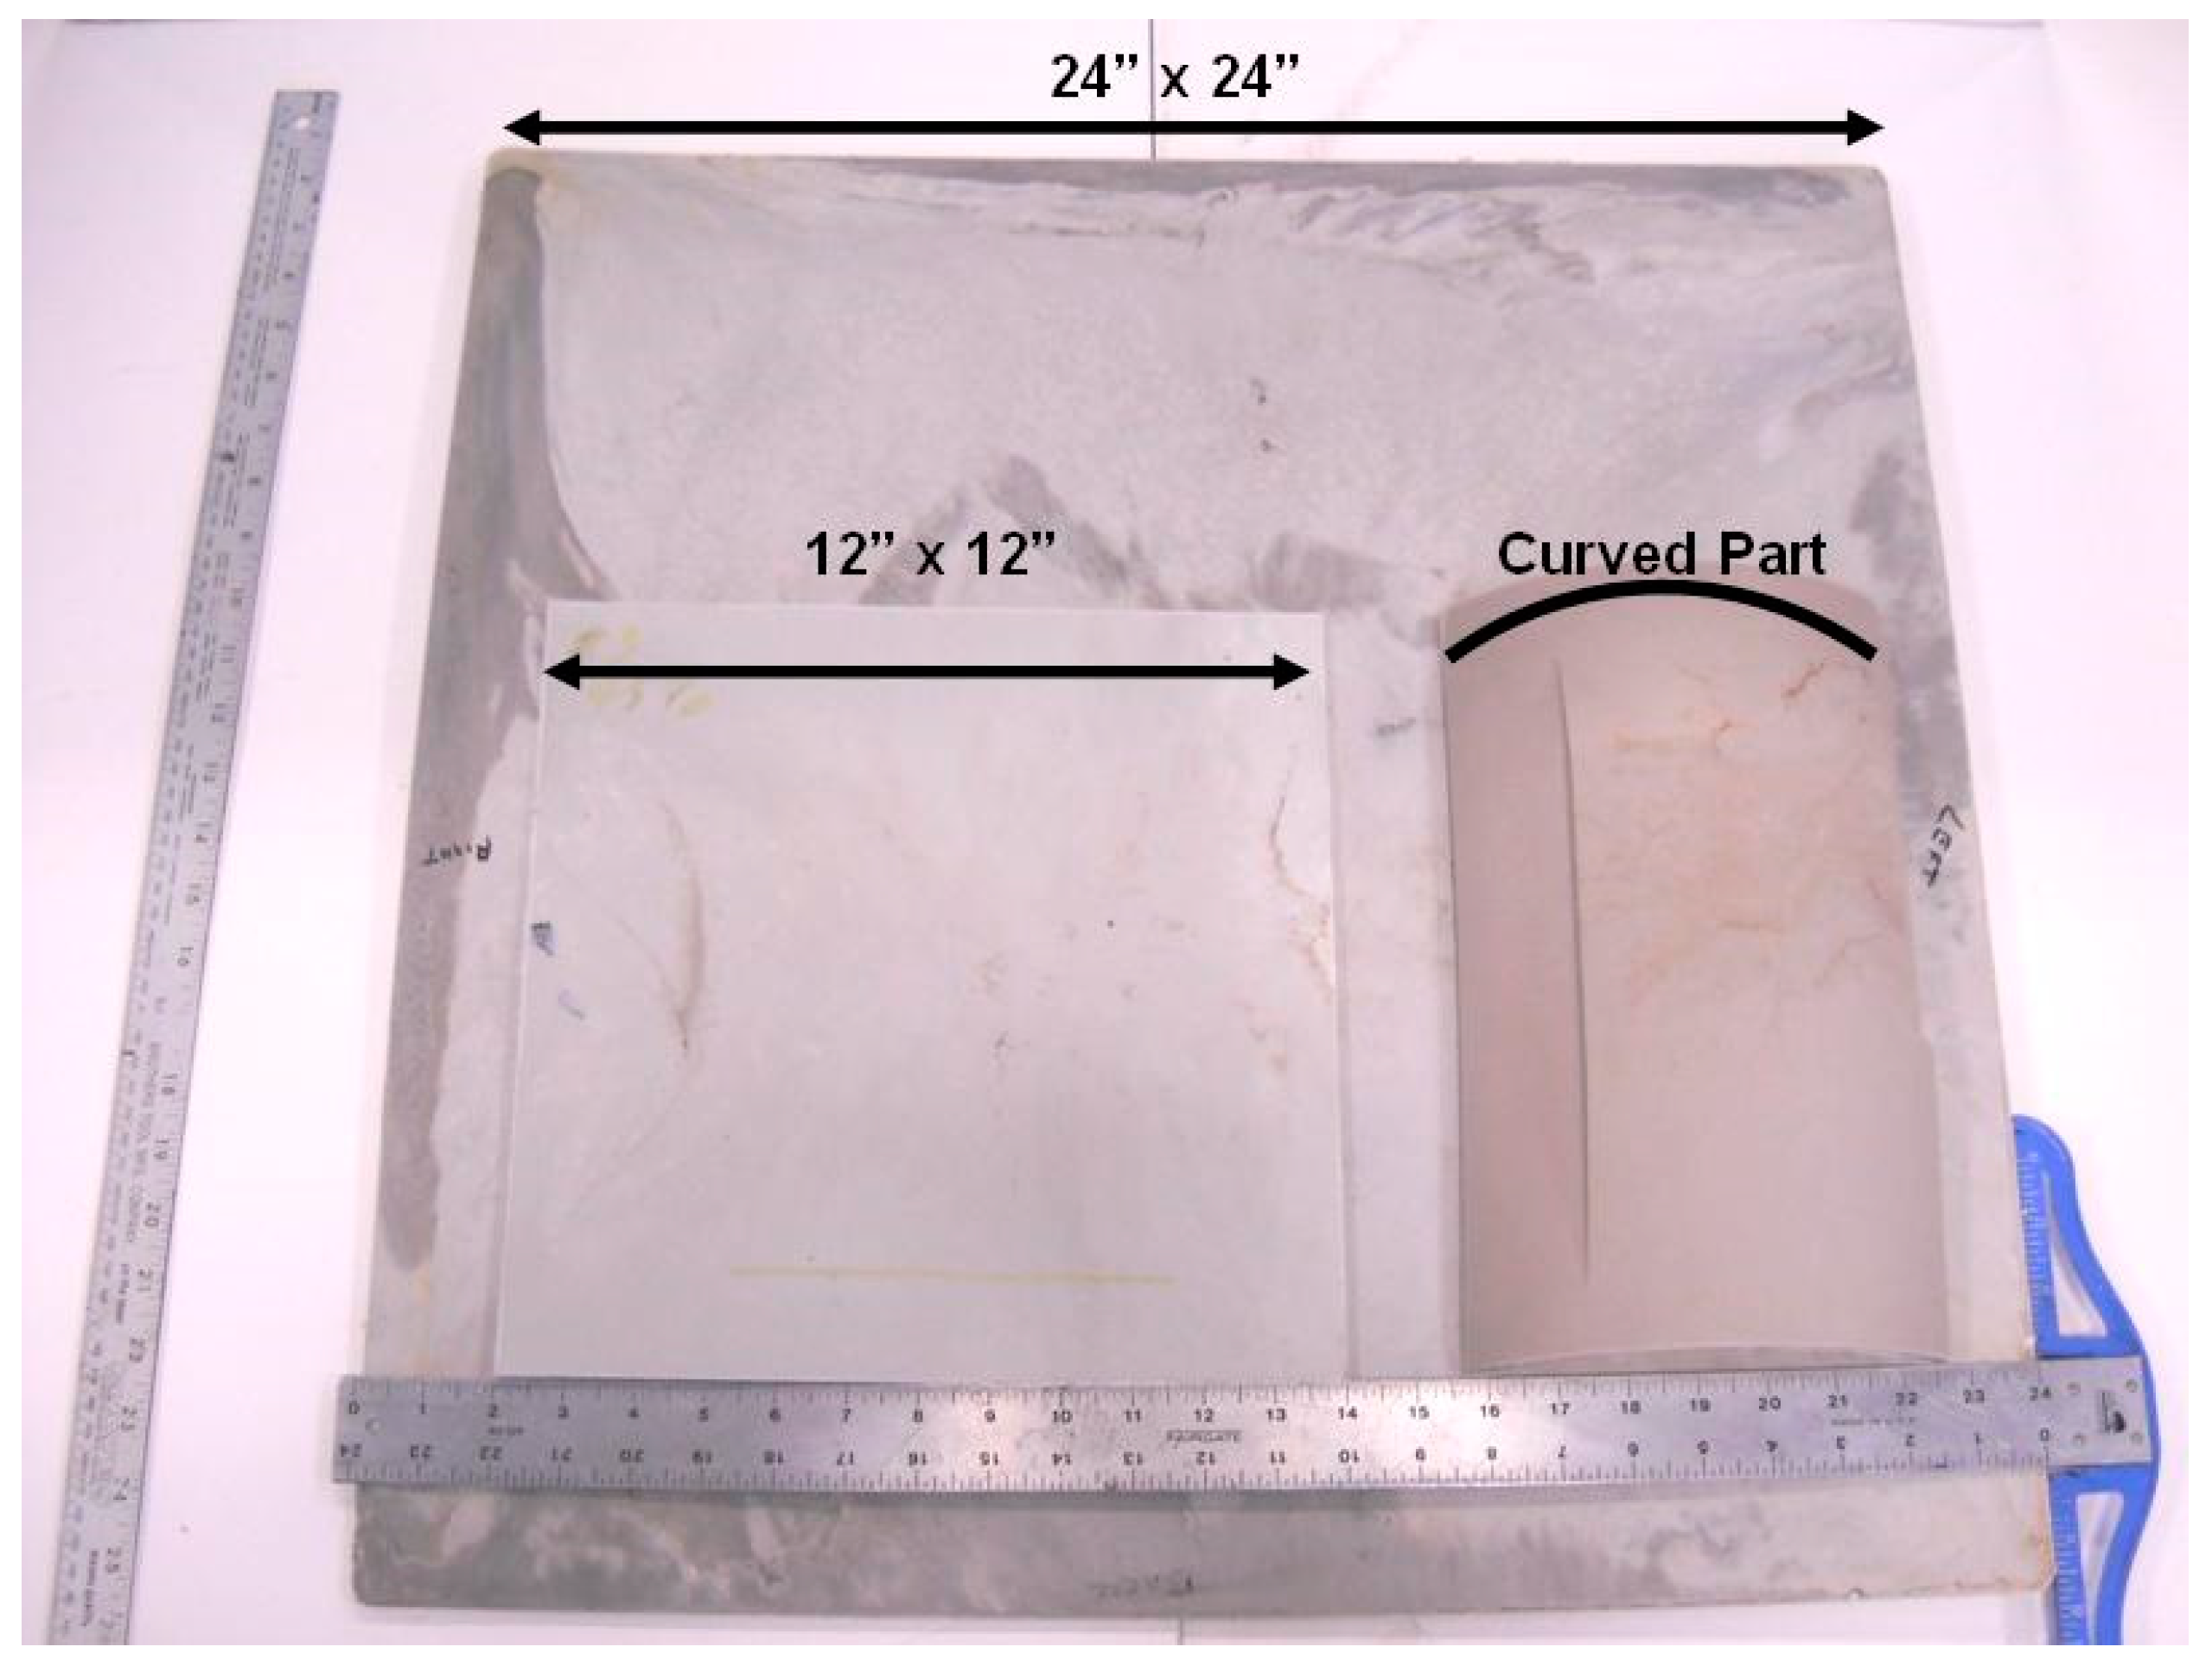
Scale Up
6. Conclusions
Author Contributions
Funding
Institutional Review Board Statement
Informed Consent Statement
Data Availability Statement
Acknowledgments
Conflicts of Interest
References
- Technology Roadmap, Institute for Advanced Composites Manufacturing Innovation (IACMI)—The Composites Institute Roadmap. Available online: www.iacmi.org (accessed on 15 December 2022).
- Circular Economy Technologies and Systems, United States Department of Energy (DOE). Available online: https://www.energy.gov/eere/amo/circular-economy-technologies-and-systems (accessed on 5 January 2023).
- Vaidya, U. Composites for Automotive, Truck and Mass Transit: Materials, Design, Manufacturing; DEStech Publications: Lancaster, PA, USA, 2011. [Google Scholar]
- Sönmez, M.; Georgescu, M.; Vâlsan, M.; Radulescu, M.; Ficai, D.; Voicu, G.; Ficai, A.; Alexandrescu, L. Design and characterization of polypropylene matrix/glass fibers composite materials. J. Appl. Polym. Sci. 2015, 132, 42163. [Google Scholar] [CrossRef]
- Donna Dawson, Spread-Tow Technology Takes off, 11/1/2014, Composites World. 2014. Available online: https://www.compositesworld.com/articles/spread-tow-technology-takes-off- (accessed on 12 February 2023).
- Polystrand–Lightweight, Strong and Durable. Available online: https://www.avient.com/products/advanced-composites/continuous-fiber-composite-panels/polystrand-thermoplastic-composite-panels (accessed on 3 January 2023).
- Vaidya, U.; Pillay, S.B.; Thattai, K.B.; Ning, H. Advanced reinforced thermoplastic composites for mass transit and heavy truck applications. Int. J. Veh. Struct. Syst. 2012, 4, 100–103. [Google Scholar] [CrossRef]
- Ning, H.; Pillay, S.; Vaidya, U.K. Design and development of thermoplastic composite roof door for mass transit bus. Mater. Des. 2009, 30, 983–991. [Google Scholar] [CrossRef]
- Commercial Trucking–Streamlining the Big Box, Composites World. Available online: https://www.compositesworld.com/articles/(623) (accessed on 5 January 2023).
- Trailer Makers Use Composites, Materials to Extend Life, Limit Moisture and Overloading Glass Fiber Recycling. Available online: https://www.ttnews.com/articles/trailer-makers-use-composites-materials-extend-life-limit-moisture-and-overloading (accessed on 14 November 2022).
- Poulikidou, S.; Jerpdal, L.; Björklund, A.; Åkermo, M. Environmental performance of self-reinforced composites in automotive applications—Case study on a heavy truck component. Mater. Des. 2016, 103, 321–329. [Google Scholar] [CrossRef]
- Kooduvalli, K.; Unser, J.; Ozcan, S.; Vaidya, U.K. Embodied Energy in Pyrolysis and Solvolysis Approaches to Recycling for Carbon Fiber-Epoxy Reinforced Composite Waste Streams. Recycling 2022, 7, 6. [Google Scholar] [CrossRef]
- IACMI—The Composites Institute Initiates Robust, Scalable Composite Recycling Project. 14 September 2017. Available online: https://acmanet.org/2017/09/iacmi-the-composites-institute-initiates-robust-scalable-composite-recycling-project/ (accessed on 2 January 2023).
- Industrial Shredders, Grinders, Granulators, Jordan Reduction Solutions, Birmingham, Alabama, United States. Available online: https://www.jordanreductionsolutions.com/ (accessed on 2 January 2023).
- Imbert, M.; Hahn, P.; Jung, M.; Balle, F.; May, M. Mechanical laminae separation at room temperature as a high-quality recycling process for laminated composites. Mater. Lett. 2021, 306, 130964. [Google Scholar] [CrossRef]
- Cheng, S.; Wong, K.H.; Shen, C.P.; Liu, X.L.; Rudd, C. Shredding energy consumption of GFRP composite waste. J. Phys. Conf. Ser. 2021, 1765, 12015. [Google Scholar] [CrossRef]
- Vincent, G.A.; de Bruijn, T.A.; Wijskamp, S.; Rasheed, M.I.A.; van Drongelen, M.; Akkerman, R. Shredding and sieving thermoplastic composite scrap: Method development and analyses of the fibre length distributions. Compos. Part B Eng. 2019, 176, 107197. [Google Scholar] [CrossRef] [Green Version]
- Hummel, S.; Obermeier, K.; Zier, K.; Krommes, S.; Schemme, M.; Karlinger, P. Analysis of Mechanical Properties Related to Fiber Length of Closed-Loop-Recycled Offcuts of a Thermoplastic Fiber Composites (Organo Sheets). Materials 2022, 15, 3872. [Google Scholar] [CrossRef]
- Gonçalves, R.M.; Martinho, A.; Oliveira, J.P. Recycling of Reinforced Glass Fibers Waste: Current Status. Materials 2022, 15, 1596. [Google Scholar] [CrossRef]
- Vaidya, U.K. Impact Response of Laminated and Sandwich Composites; Abrate, S., Ed.; Impact Engineering of Composite Structures; SpringerWien: New York, NY, USA, 2011; pp. 97–191. [Google Scholar]


| 50% regrind with 50% virgin PP |
| 66% regrind with 34% virgin PP |
| 83% regrind with 17% virgin PP |
| 100% regrind |
| Corresponding final fiber content: 30%, 40%, 50%, and 60% |
| Sample ID | Weight of Empty Pan | Sample + Pan | Sample + Pan | Weight of the Sample | Weight of the Fiber | Fiber Weight Fraction |
|---|---|---|---|---|---|---|
| (grams) | (grams) | (grams) | (grams) | (grams) | ||
| 30-1 | 2.20 | 9.76 | 4.51 | 7.56 | 2.31 | 30.56 |
| 30-2 | 2.22 | 9.42 | 4.41 | 7.20 | 2.19 | 30.42 |
| 30-3 | 2.26 | 9.50 | 4.48 | 7.24 | 2.22 | 30.66 |
| 35-1 | 2.18 | 9.37 | 4.92 | 7.19 | 2.74 | 38.11 |
| 35-2 | 2.18 | 9.27 | 4.88 | 7.09 | 2.70 | 38.08 |
| 35-3 | 1.40 | 8.35 | 4.06 | 6.95 | 2.66 | 38.27 |
| 40-1 | 2.21 | 9.69 | 5.52 | 7.48 | 3.31 | 44.25 |
| 40-2 | 2.23 | 9.39 | 5.56 | 7.16 | 3.33 | 46.51 |
| 40-3 | 2.24 | 9.45 | 5.36 | 7.21 | 3.12 | 43.27 |
| 45-1 | 2.22 | 9.24 | 5.29 | 7.02 | 3.07 | 43.73 |
| 45-2 | 2.20 | 9.13 | 5.18 | 6.93 | 2.98 | 43.00 |
| 45-3 | 2.18 | 9.37 | 5.34 | 7.19 | 3.16 | 43.95 |
| ‘Longitudinal’ | |||||
| Specimen | Final Fiber Weight Percentage | Tensile Strength (MPa) | Tensile Strength Std Dev | Tensile Modulus (GPa) | Tensile Modulus Std Dev |
| 100% Recycle | 60% | 40.7 | 8.91 | N/A | N/A |
| 83% Recycle | 50% | 34.79 | 3.80 | 2.71 | 0.2 |
| 66% Recycle | 40% | 60.6 | 9.14 | 4.57 | 0.78 |
| 50% Recycle | 30% | 54.6 | 7.04 | 4.1 | 0.54 |
| ‘Transverse’ | |||||
| Specimen | Final Fiber Weight Percentage | Tensile Strength (MPa) | Tensile Strength Std Dev | Tensile Modulus (GPa) | Tensile Modulus Std Dev |
| 100% Recycle | 60% | 33.82 | 3.94 | 2.56 | 0.2 |
| 83% Recycle | 50% | 51.96 | 11.80 | 3.79 | 1.02 |
| 66% Recycle | 40% | 37.35 | 5.51 | 2.67 | 0.48 |
| 50% Recycle | 30% | 34.67 | 2.52 | 2.44 | 0.19 |
| ‘Longitudinal’ | |||||
| Specimen | Final Fiber Weight Percentage | Flexural Strength (Mpa) | Flexural Strength Std dev | Flexural Modulus (Gpa) | Flexural Modulus Std dev |
| 100% Recycle | 60% | 93.01 | 4.98 | 8.42 | 0.66 |
| 83% Recycle | 50% | 81.69 | 13.69 | 5.55 | 0.58 |
| 66% Recycle | 40% | 79.70 | 6.35 | 5.05 | 0.25 |
| 50% Recycle | 30% | 73.77 | 3.62 | 3.75 | 0.21 |
| ‘Transverse’ | |||||
| Specimen | Final Fiber Weight Percentage | Flexural Strength (Mpa) | Flexural Strength Std dev | Flexural Modulus (Gpa) | Flexural Modulus Std dev |
| 100% Recycle | 60% | 65.26 | 15.99 | 5.06 | 0.65 |
| 83% Recycle | 50% | 96.53 | 8.50 | 6.20 | 0.26 |
| 66% Recycle | 40% | 58.21 | 7.26 | 3.35 | 0.30 |
| 50% Recycle | 30% | 56.91 | 8.21 | 2.76 | 0.31 |
| Plywood 1 | 60 wt% Regrind 2 | 30 wt% Regrind 3 | 30 wt% LFT 4 | |
|---|---|---|---|---|
| Areal density (g/cm2) | 0.38 | 0.54 | 0.41 | 0.40 |
| Thickness (mm) | 6 | 3.8 | 3.4 | 3.6 |
Disclaimer/Publisher’s Note: The statements, opinions and data contained in all publications are solely those of the individual author(s) and contributor(s) and not of MDPI and/or the editor(s). MDPI and/or the editor(s) disclaim responsibility for any injury to people or property resulting from any ideas, methods, instructions or products referred to in the content. |
© 2023 by the authors. Licensee MDPI, Basel, Switzerland. This article is an open access article distributed under the terms and conditions of the Creative Commons Attribution (CC BY) license (https://creativecommons.org/licenses/by/4.0/).
Share and Cite
Vaidya, U.; Wasti, S.; Tekinalp, H.; Hassen, A.A.; Ozcan, S. Recycled Glass Polypropylene Composites from Transportation Manufacturing Waste. J. Compos. Sci. 2023, 7, 99. https://doi.org/10.3390/jcs7030099
Vaidya U, Wasti S, Tekinalp H, Hassen AA, Ozcan S. Recycled Glass Polypropylene Composites from Transportation Manufacturing Waste. Journal of Composites Science. 2023; 7(3):99. https://doi.org/10.3390/jcs7030099
Chicago/Turabian StyleVaidya, Uday, Sanjita Wasti, Halil Tekinalp, Ahmed Arabi Hassen, and Soydan Ozcan. 2023. "Recycled Glass Polypropylene Composites from Transportation Manufacturing Waste" Journal of Composites Science 7, no. 3: 99. https://doi.org/10.3390/jcs7030099