
Characterization of UV Light Curable Piezoelectric 0-0-3 Composites Filled with Lead-Free Ceramics and Conductive Nanoparticles

Abstract
:1. Introduction
1.1. Nanofillers in Composites
1.2. Composite Manufacturing with UV Light
2. Materials and Methods
2.1. Materials
2.2. Suspension Preparation and Sensor Manufacturing
2.3. Characterization Methods
3. Results and Discussion: Material Screening
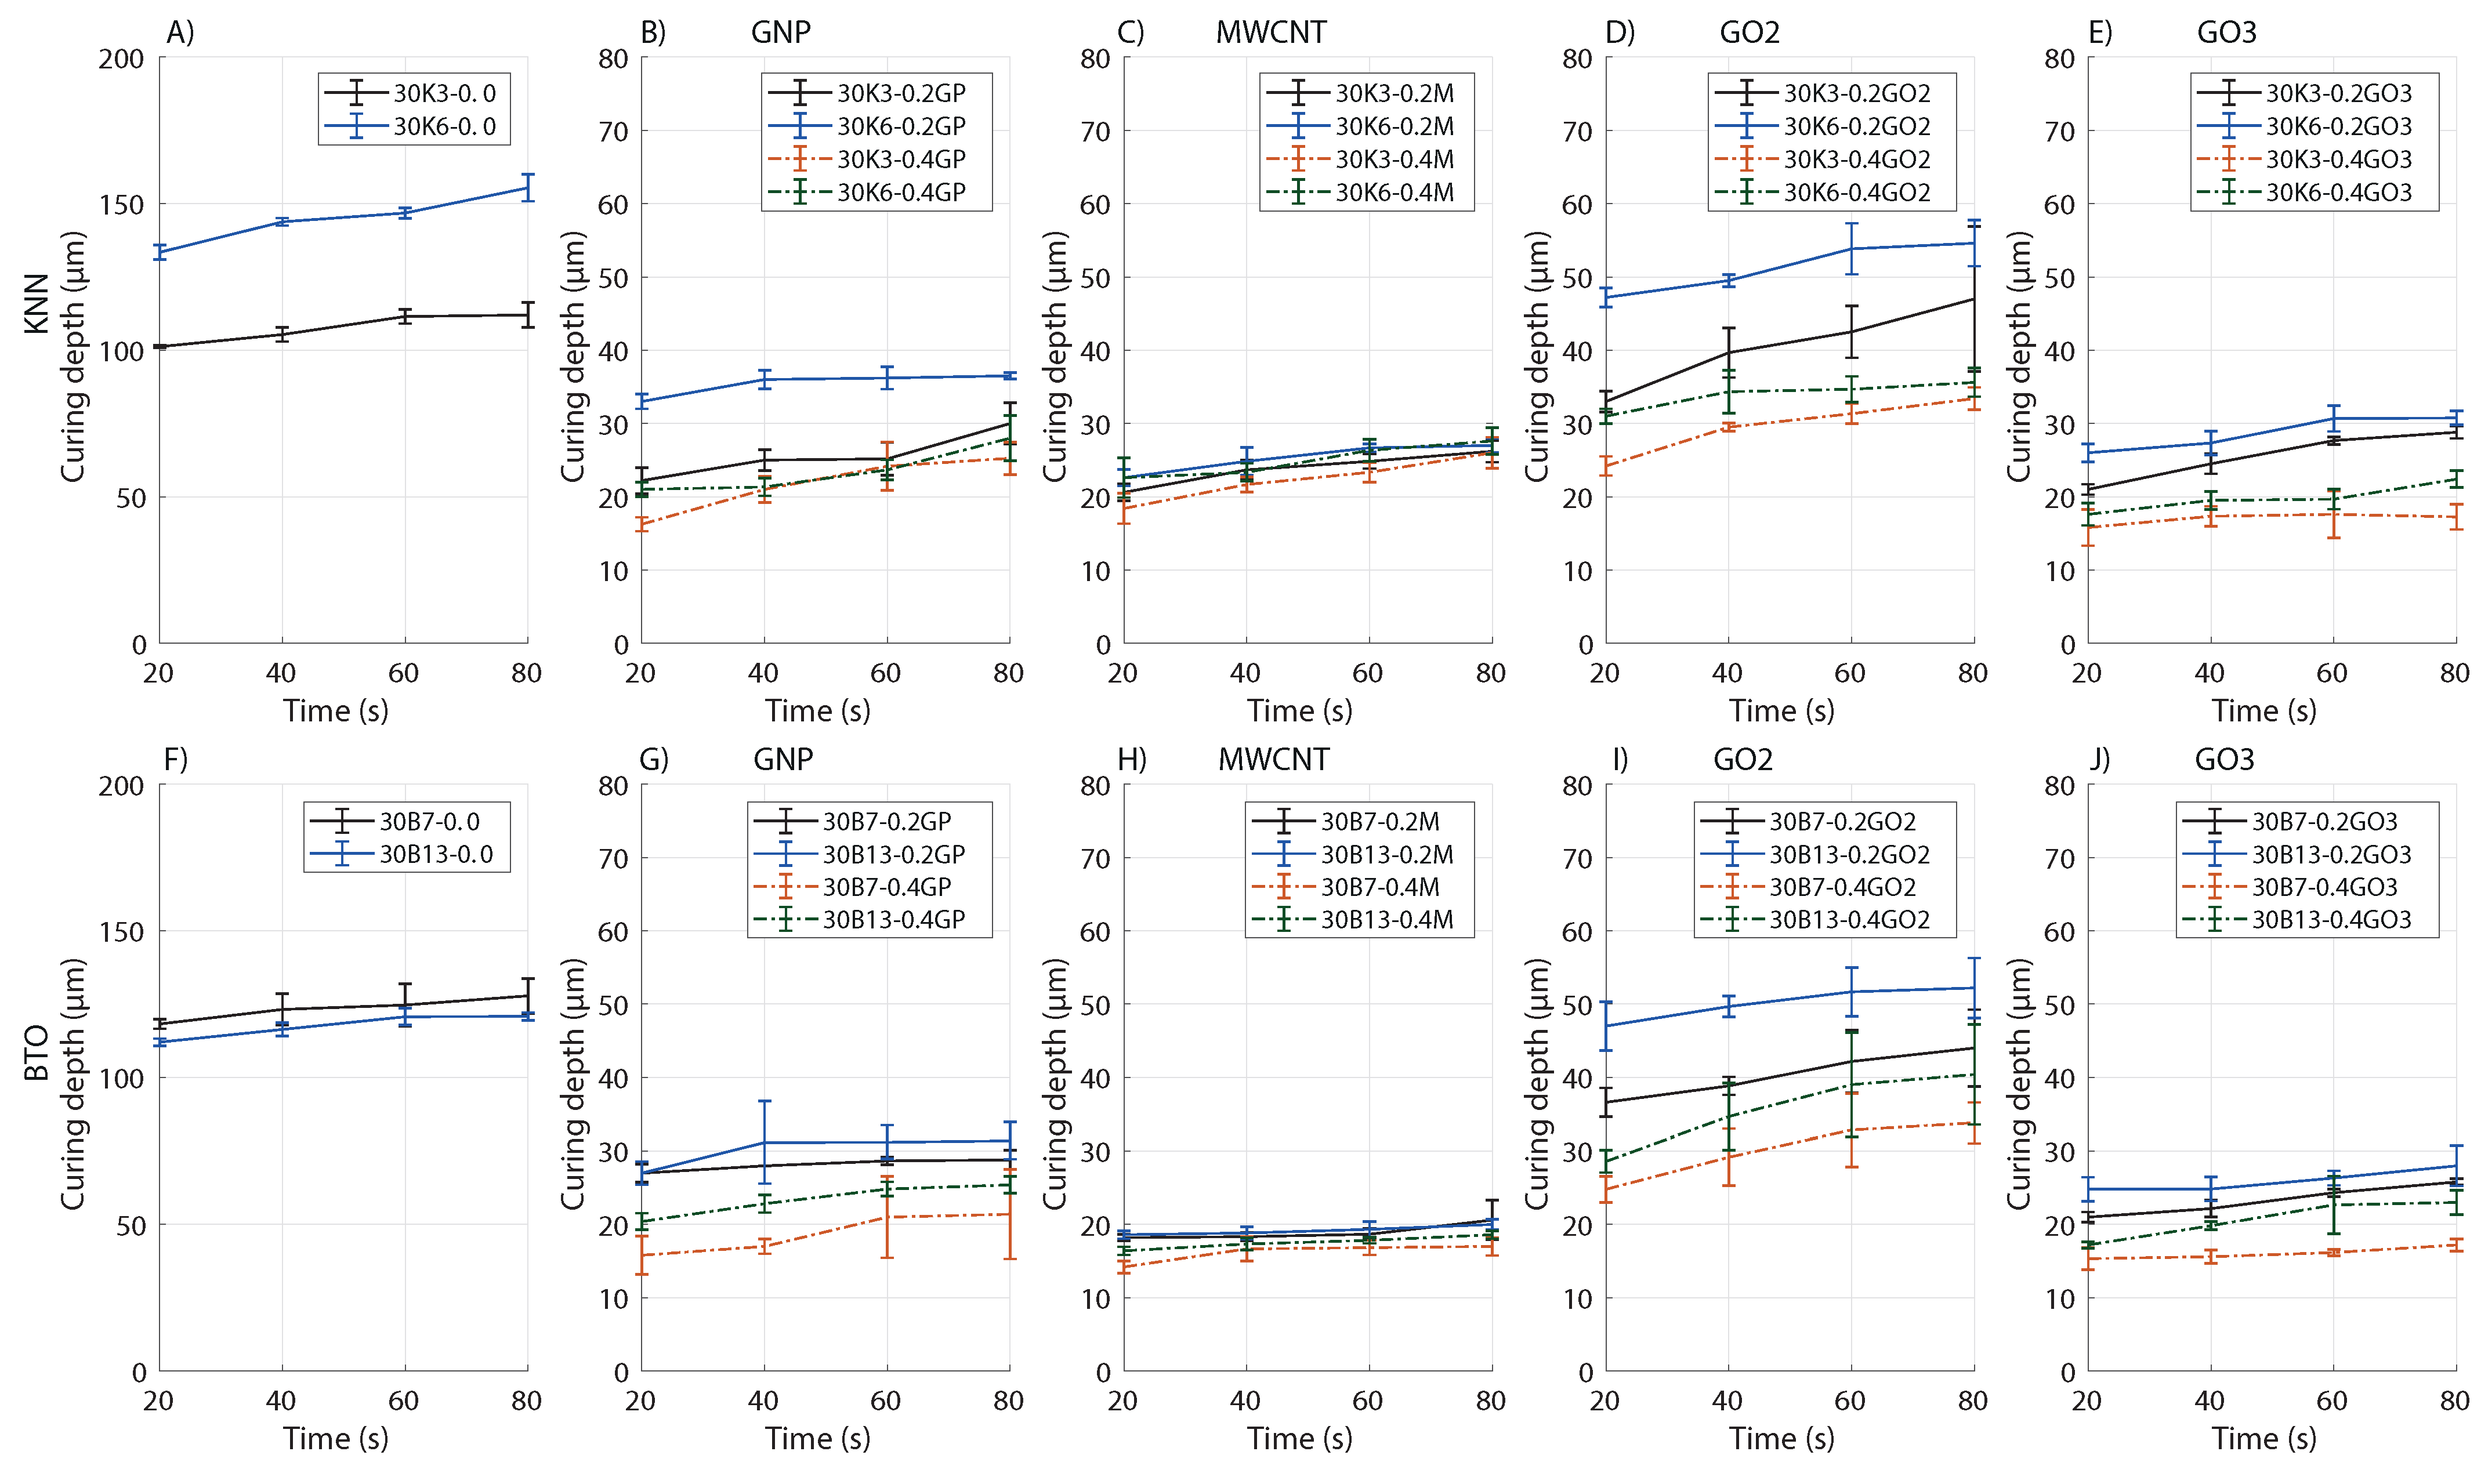
3.1. Curing Depth
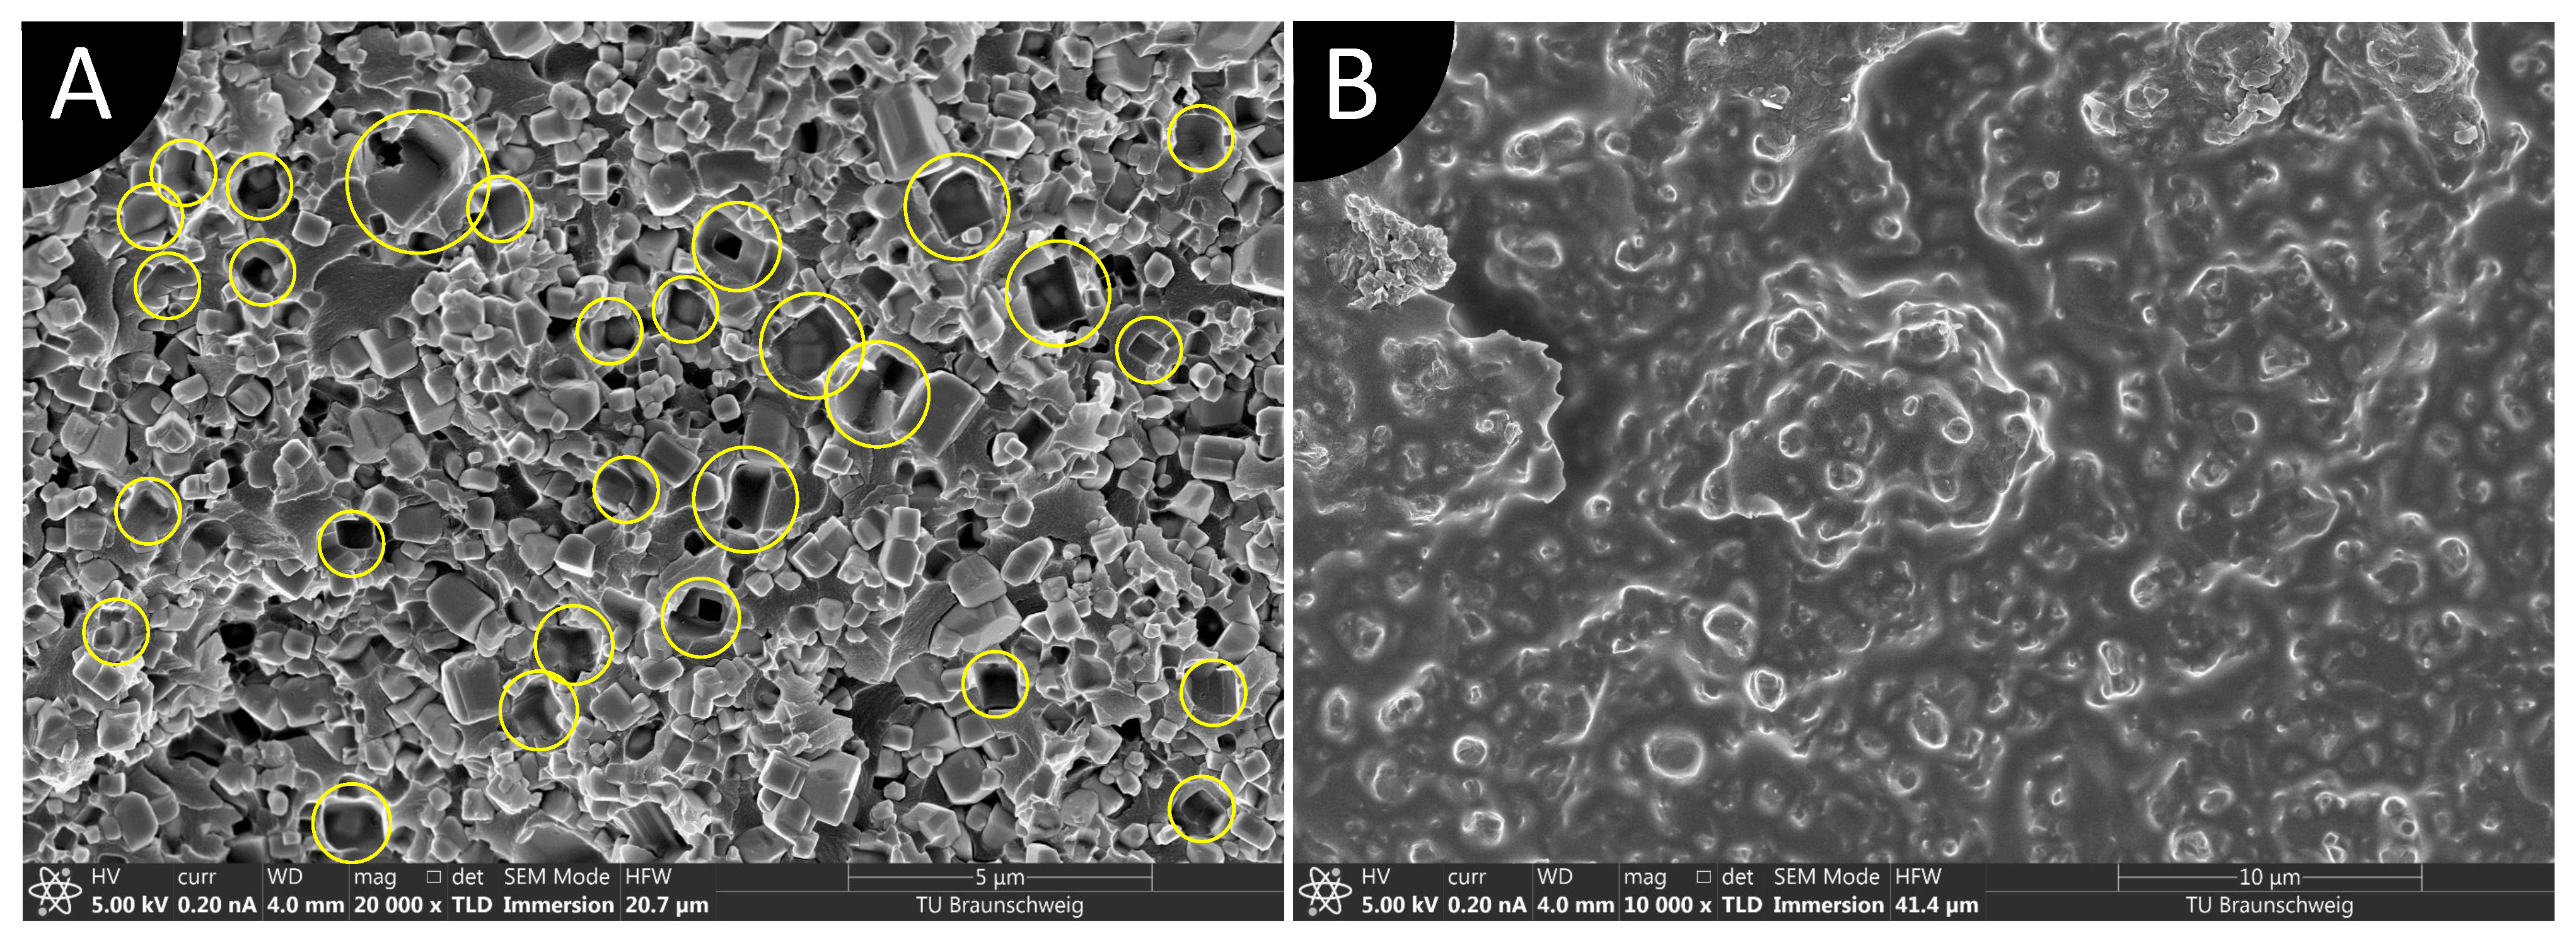
3.2. Microstructure
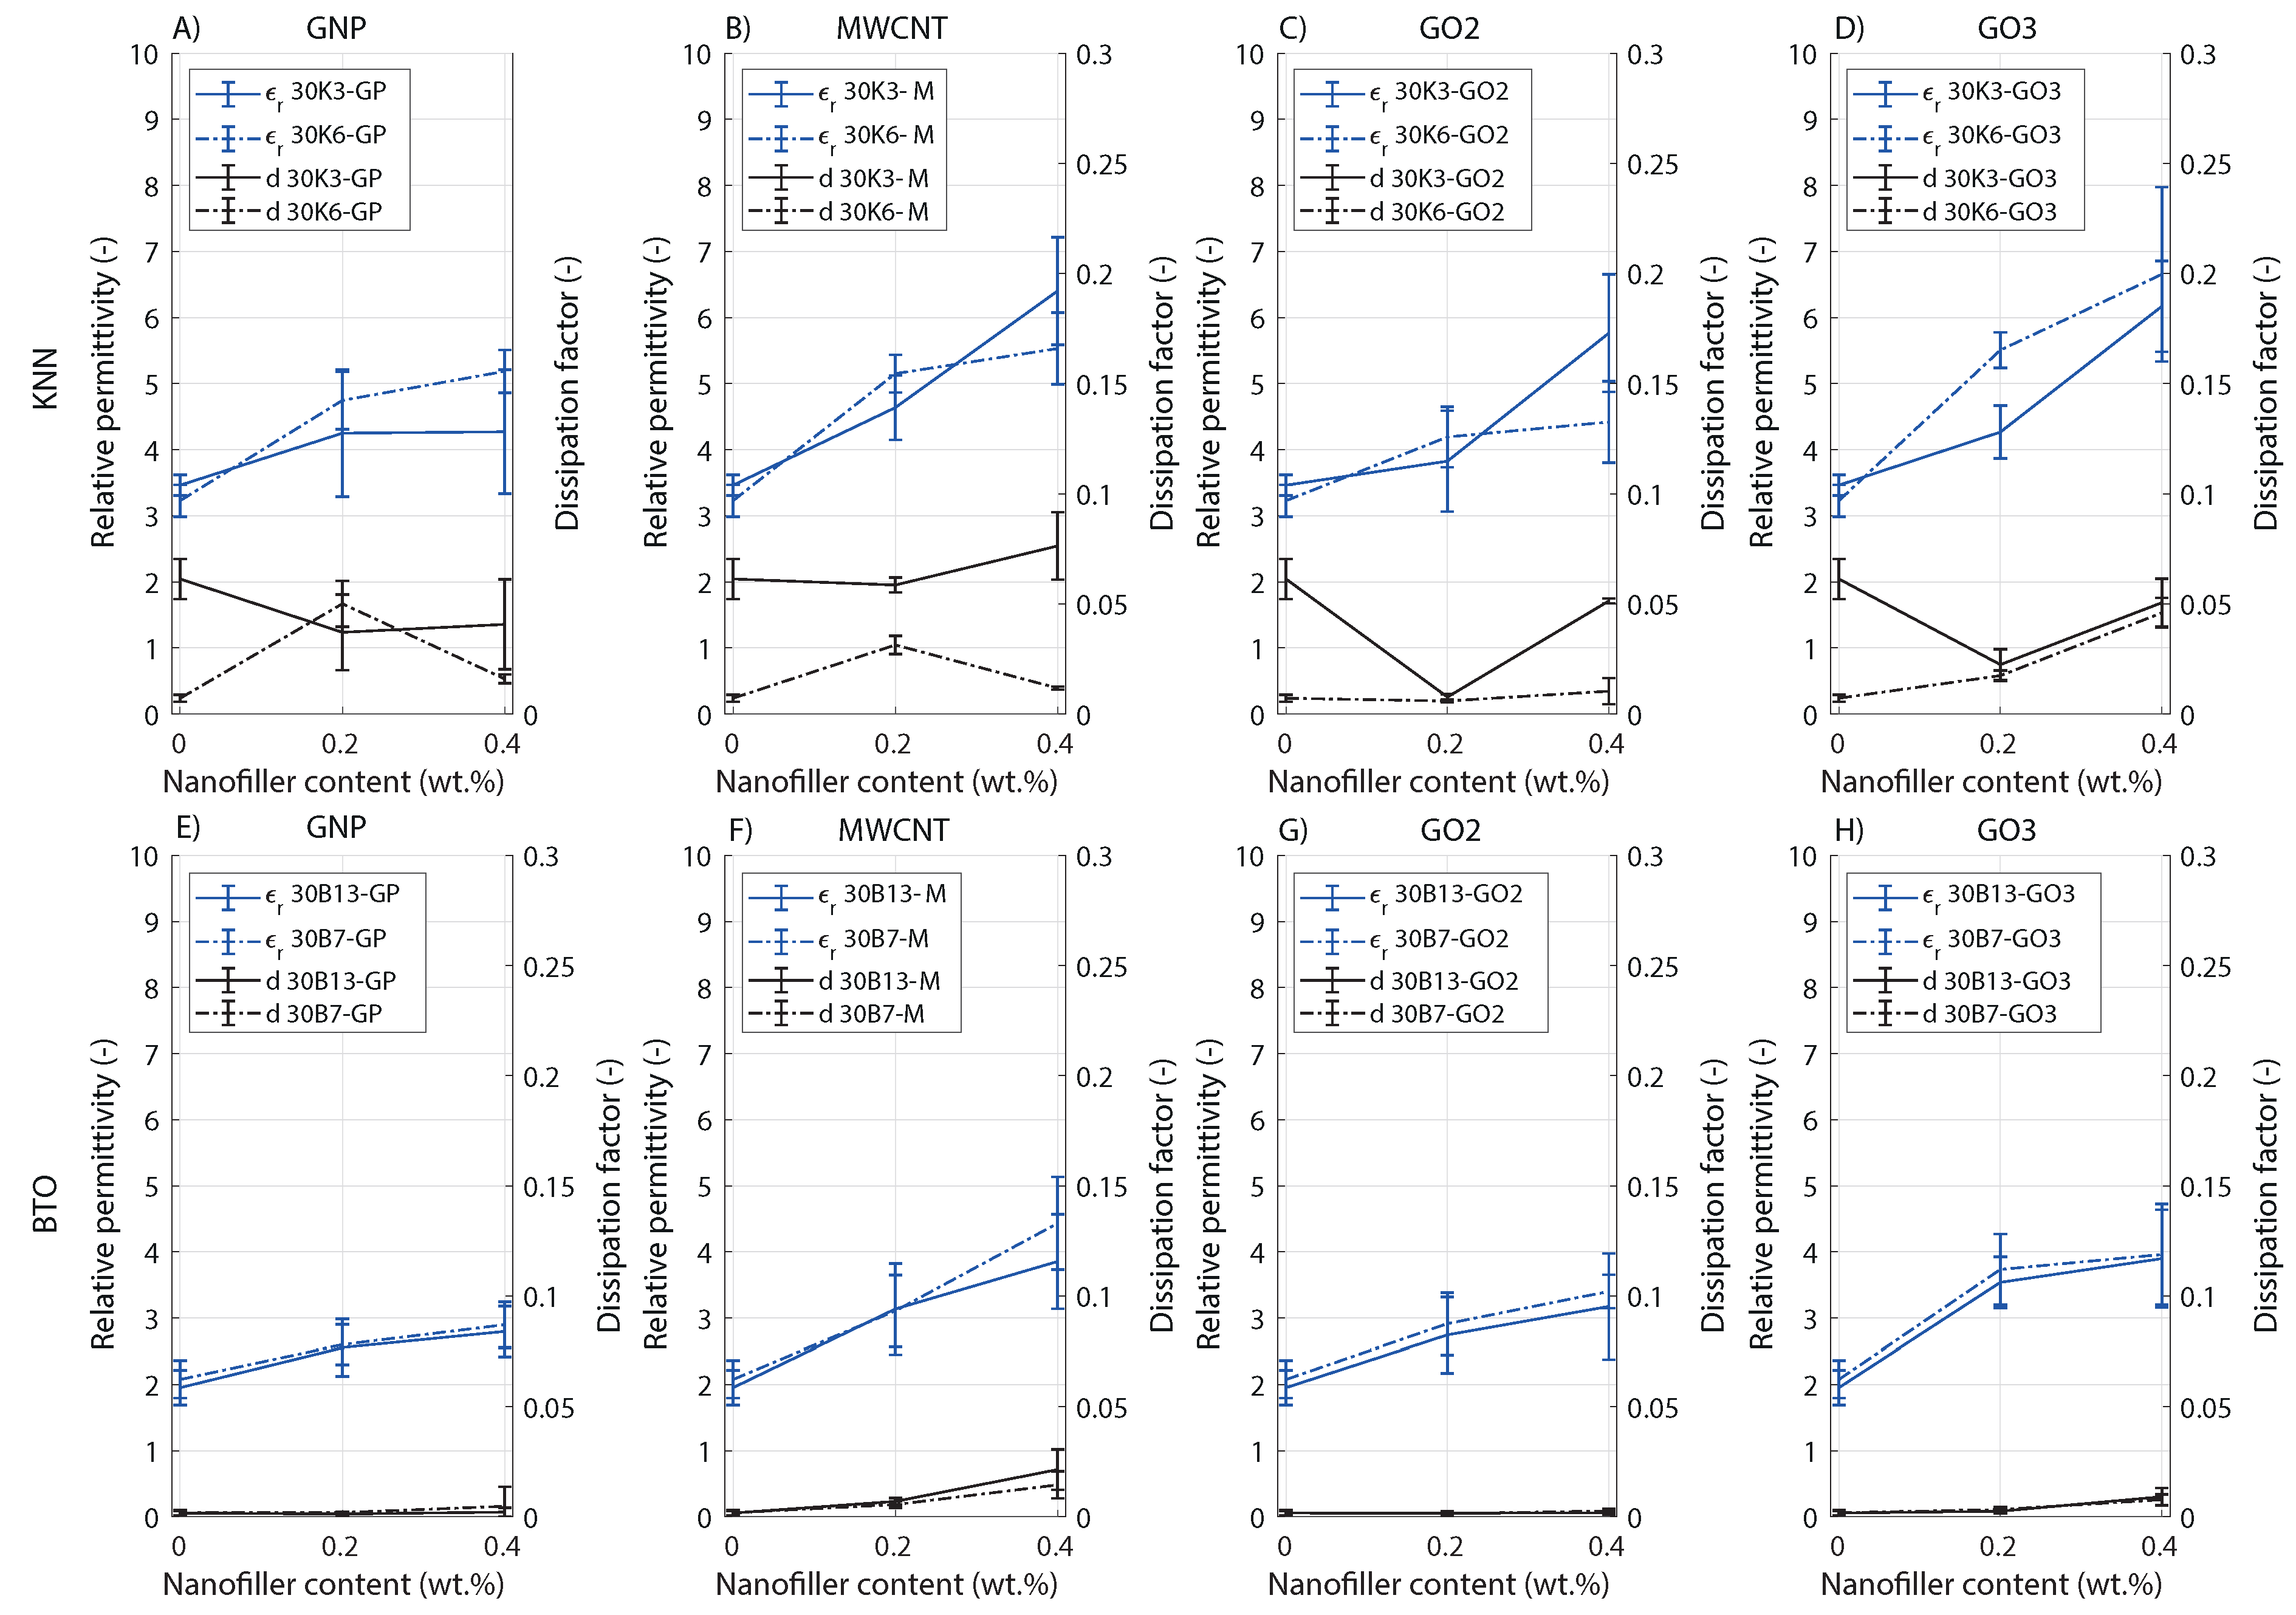
3.3. Dielectric Properties
4. Results and Discussion: Detailed Characterization of Selected Composites
4.1. Material Selection
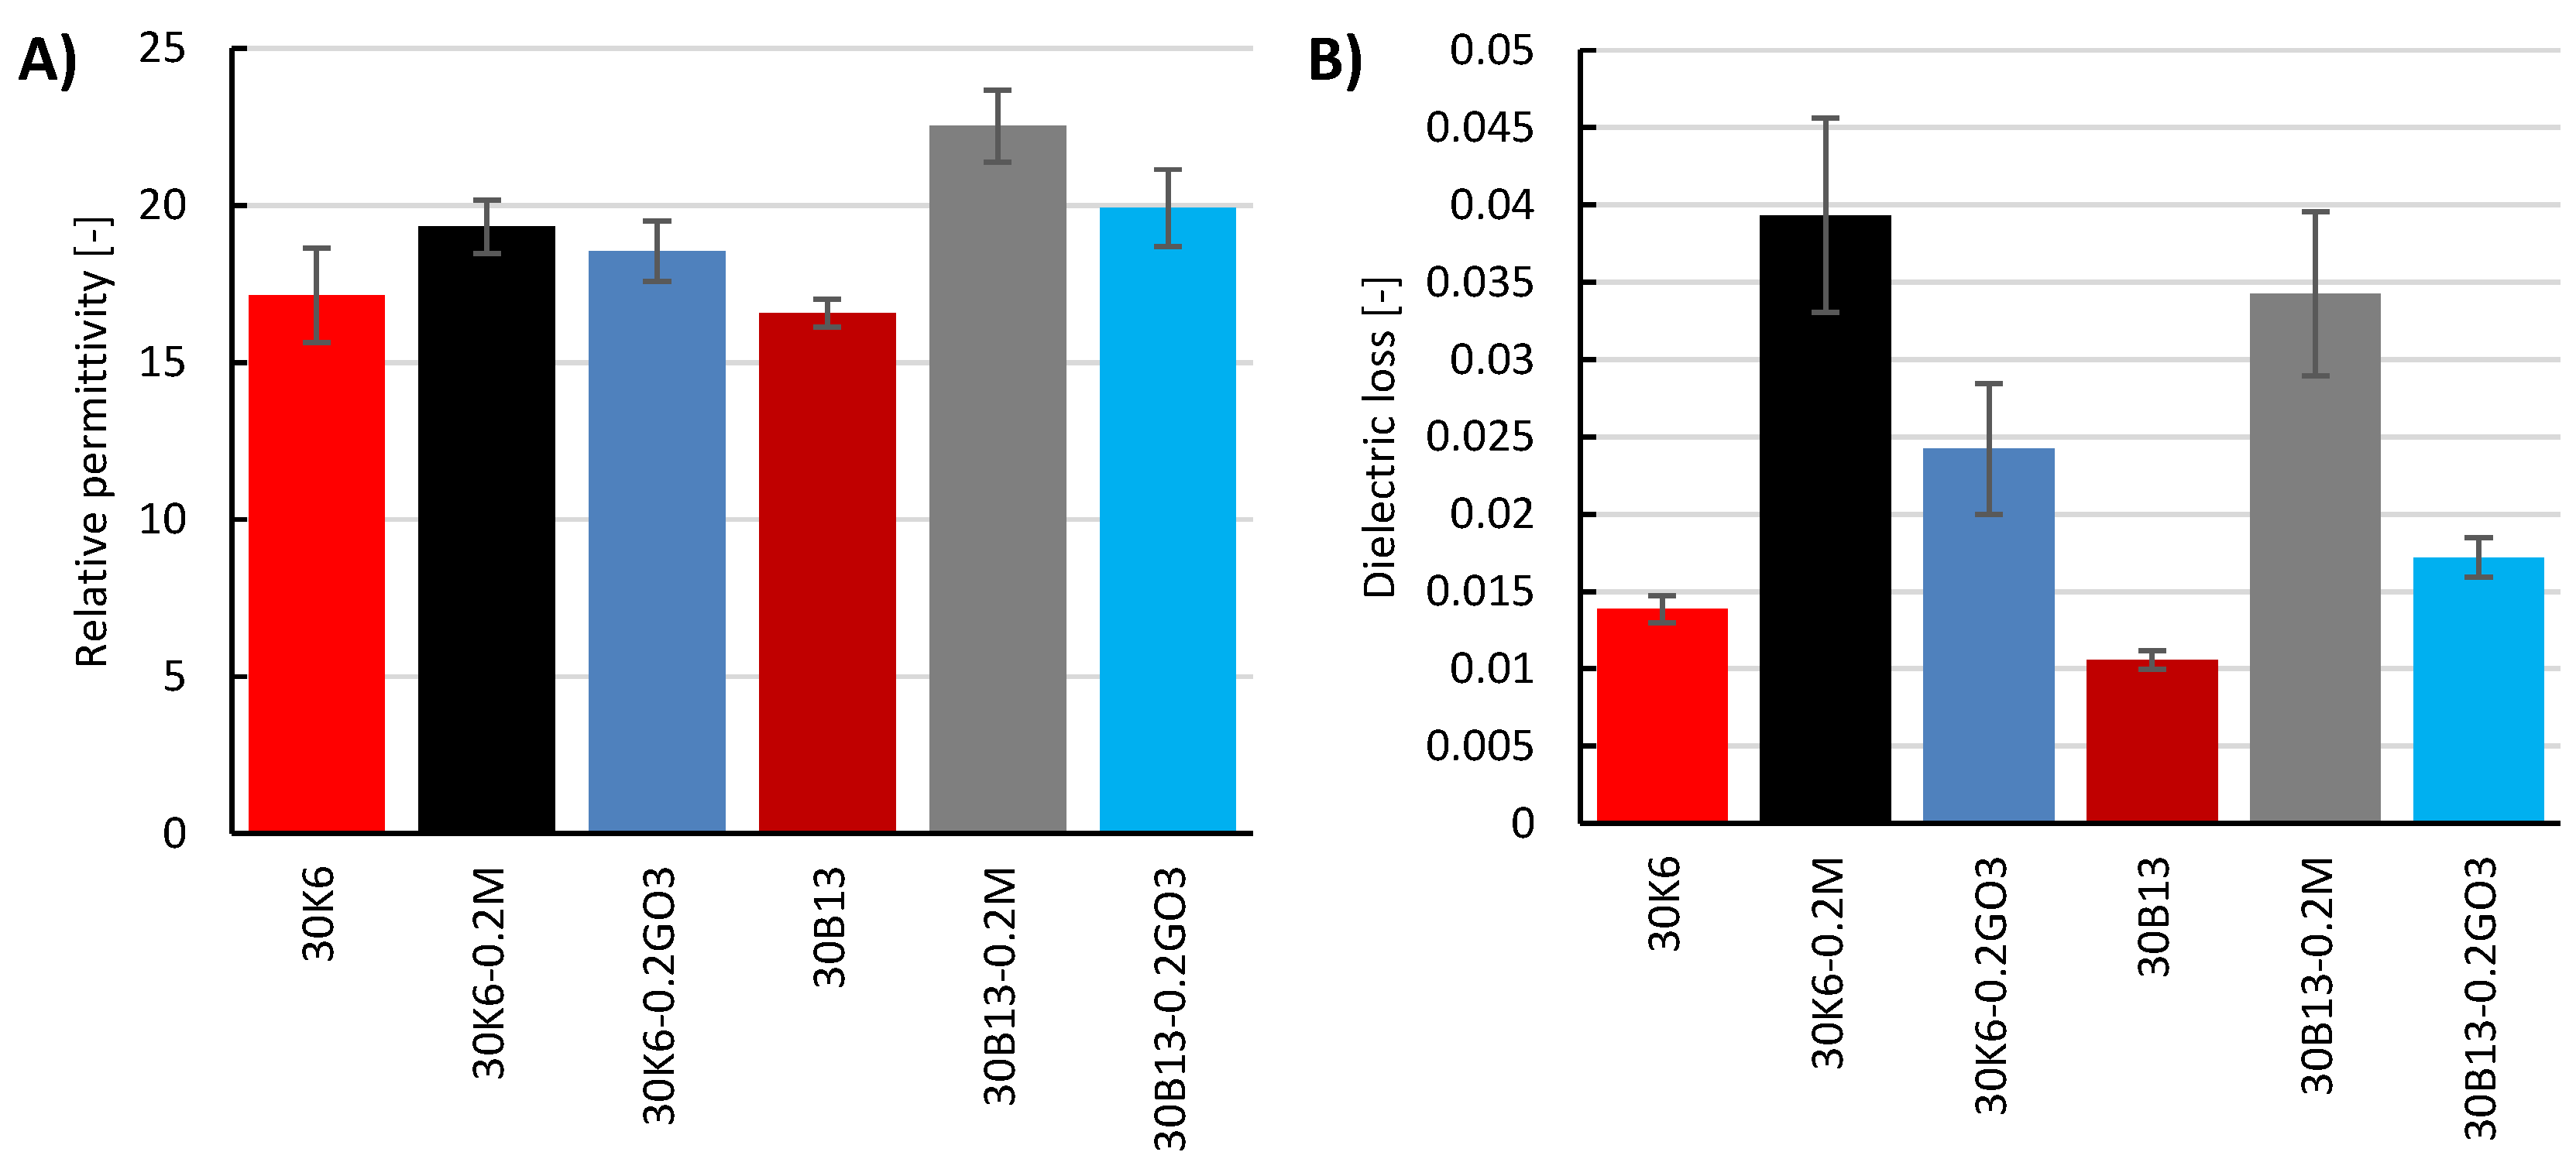
4.2. Dielectric Properties with Applied Electrodes
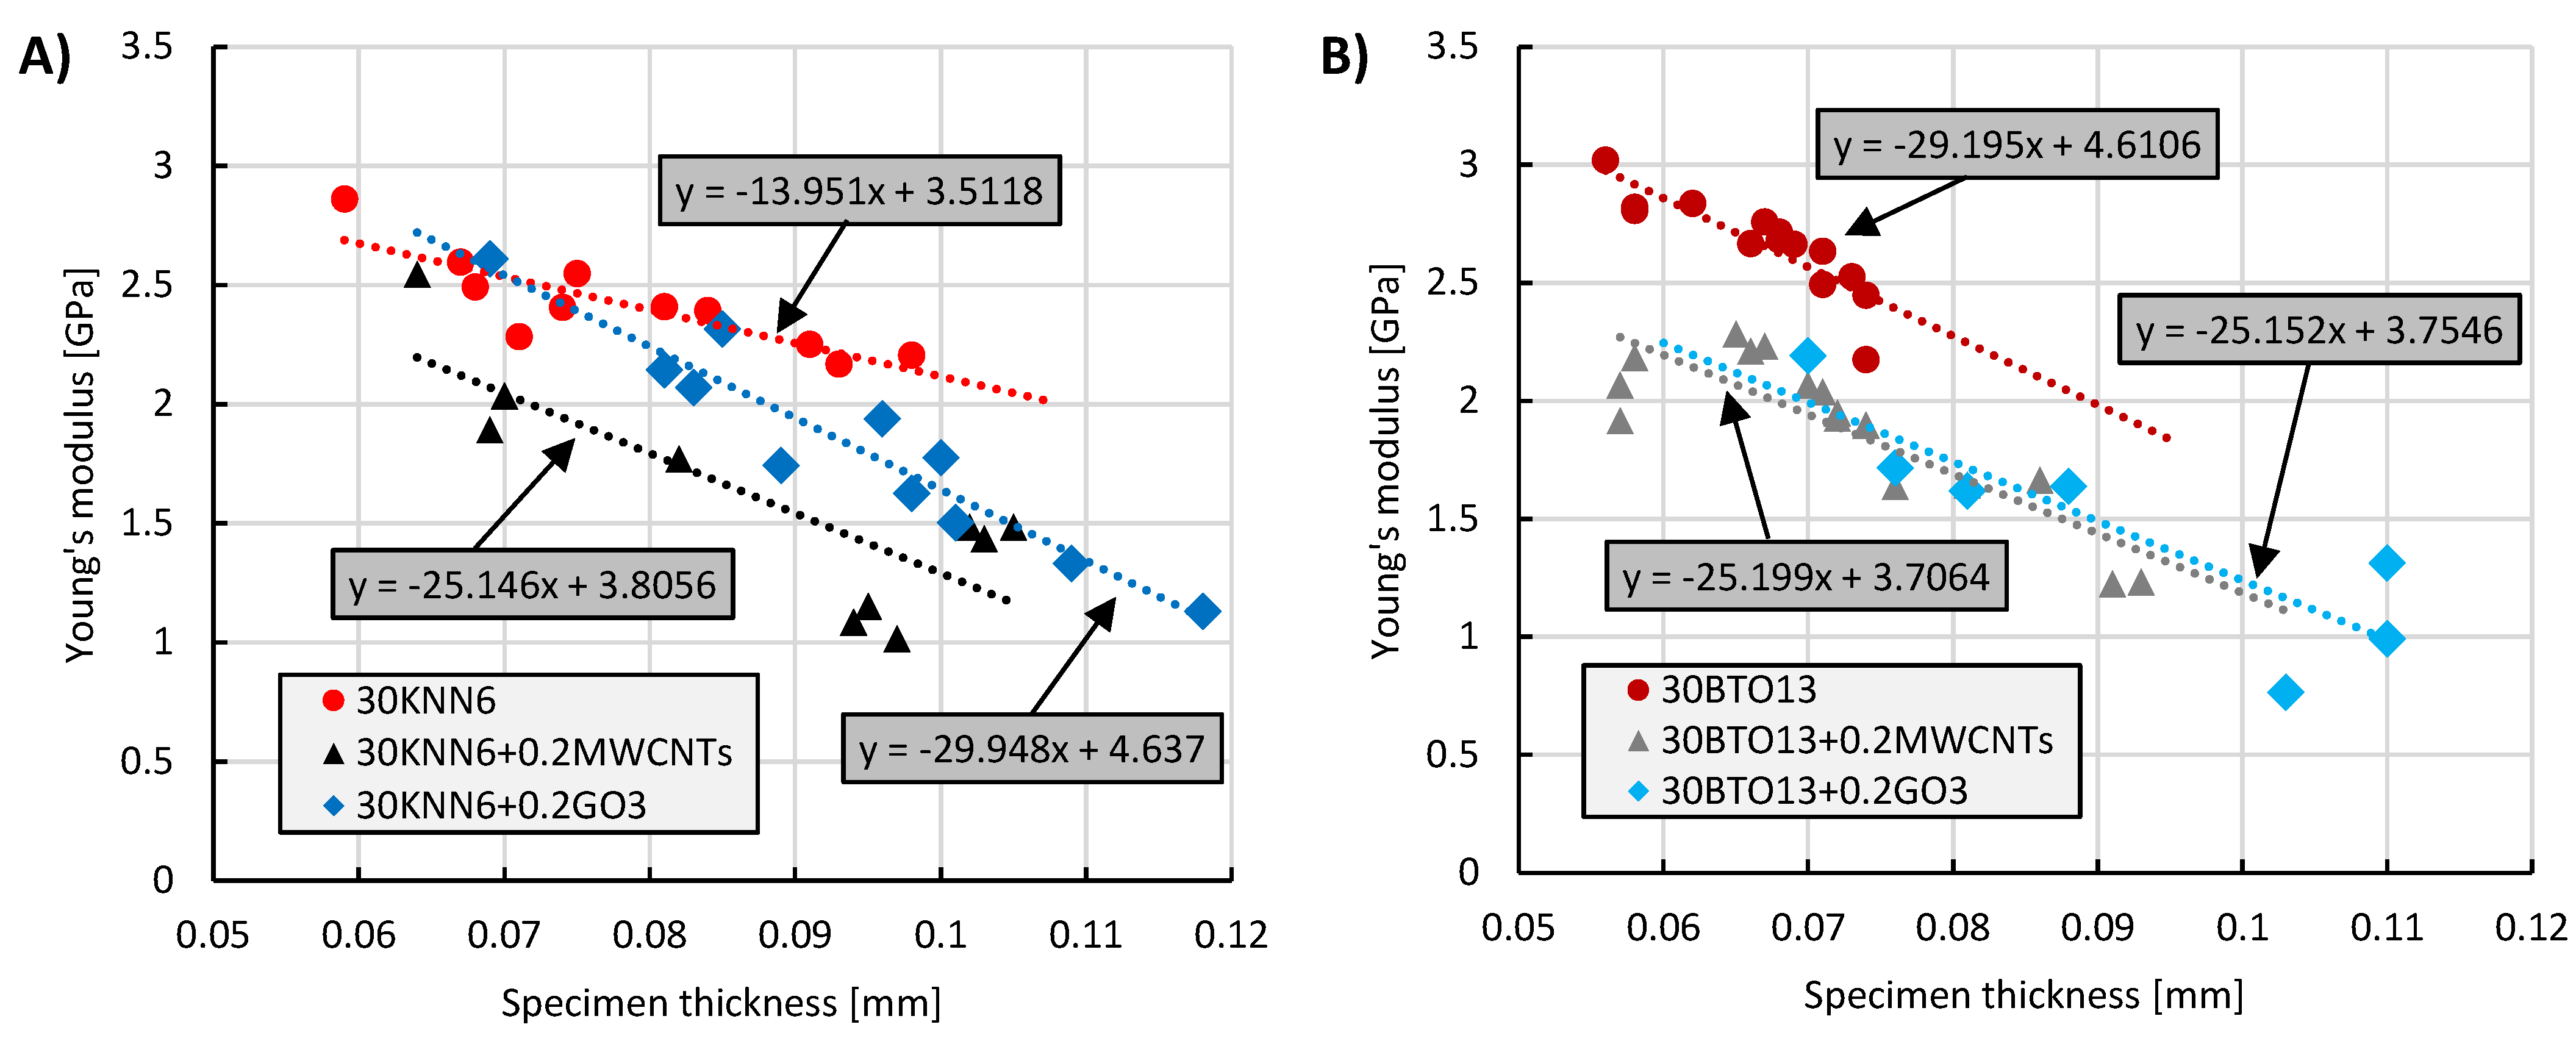
4.3. Young’s Modulus
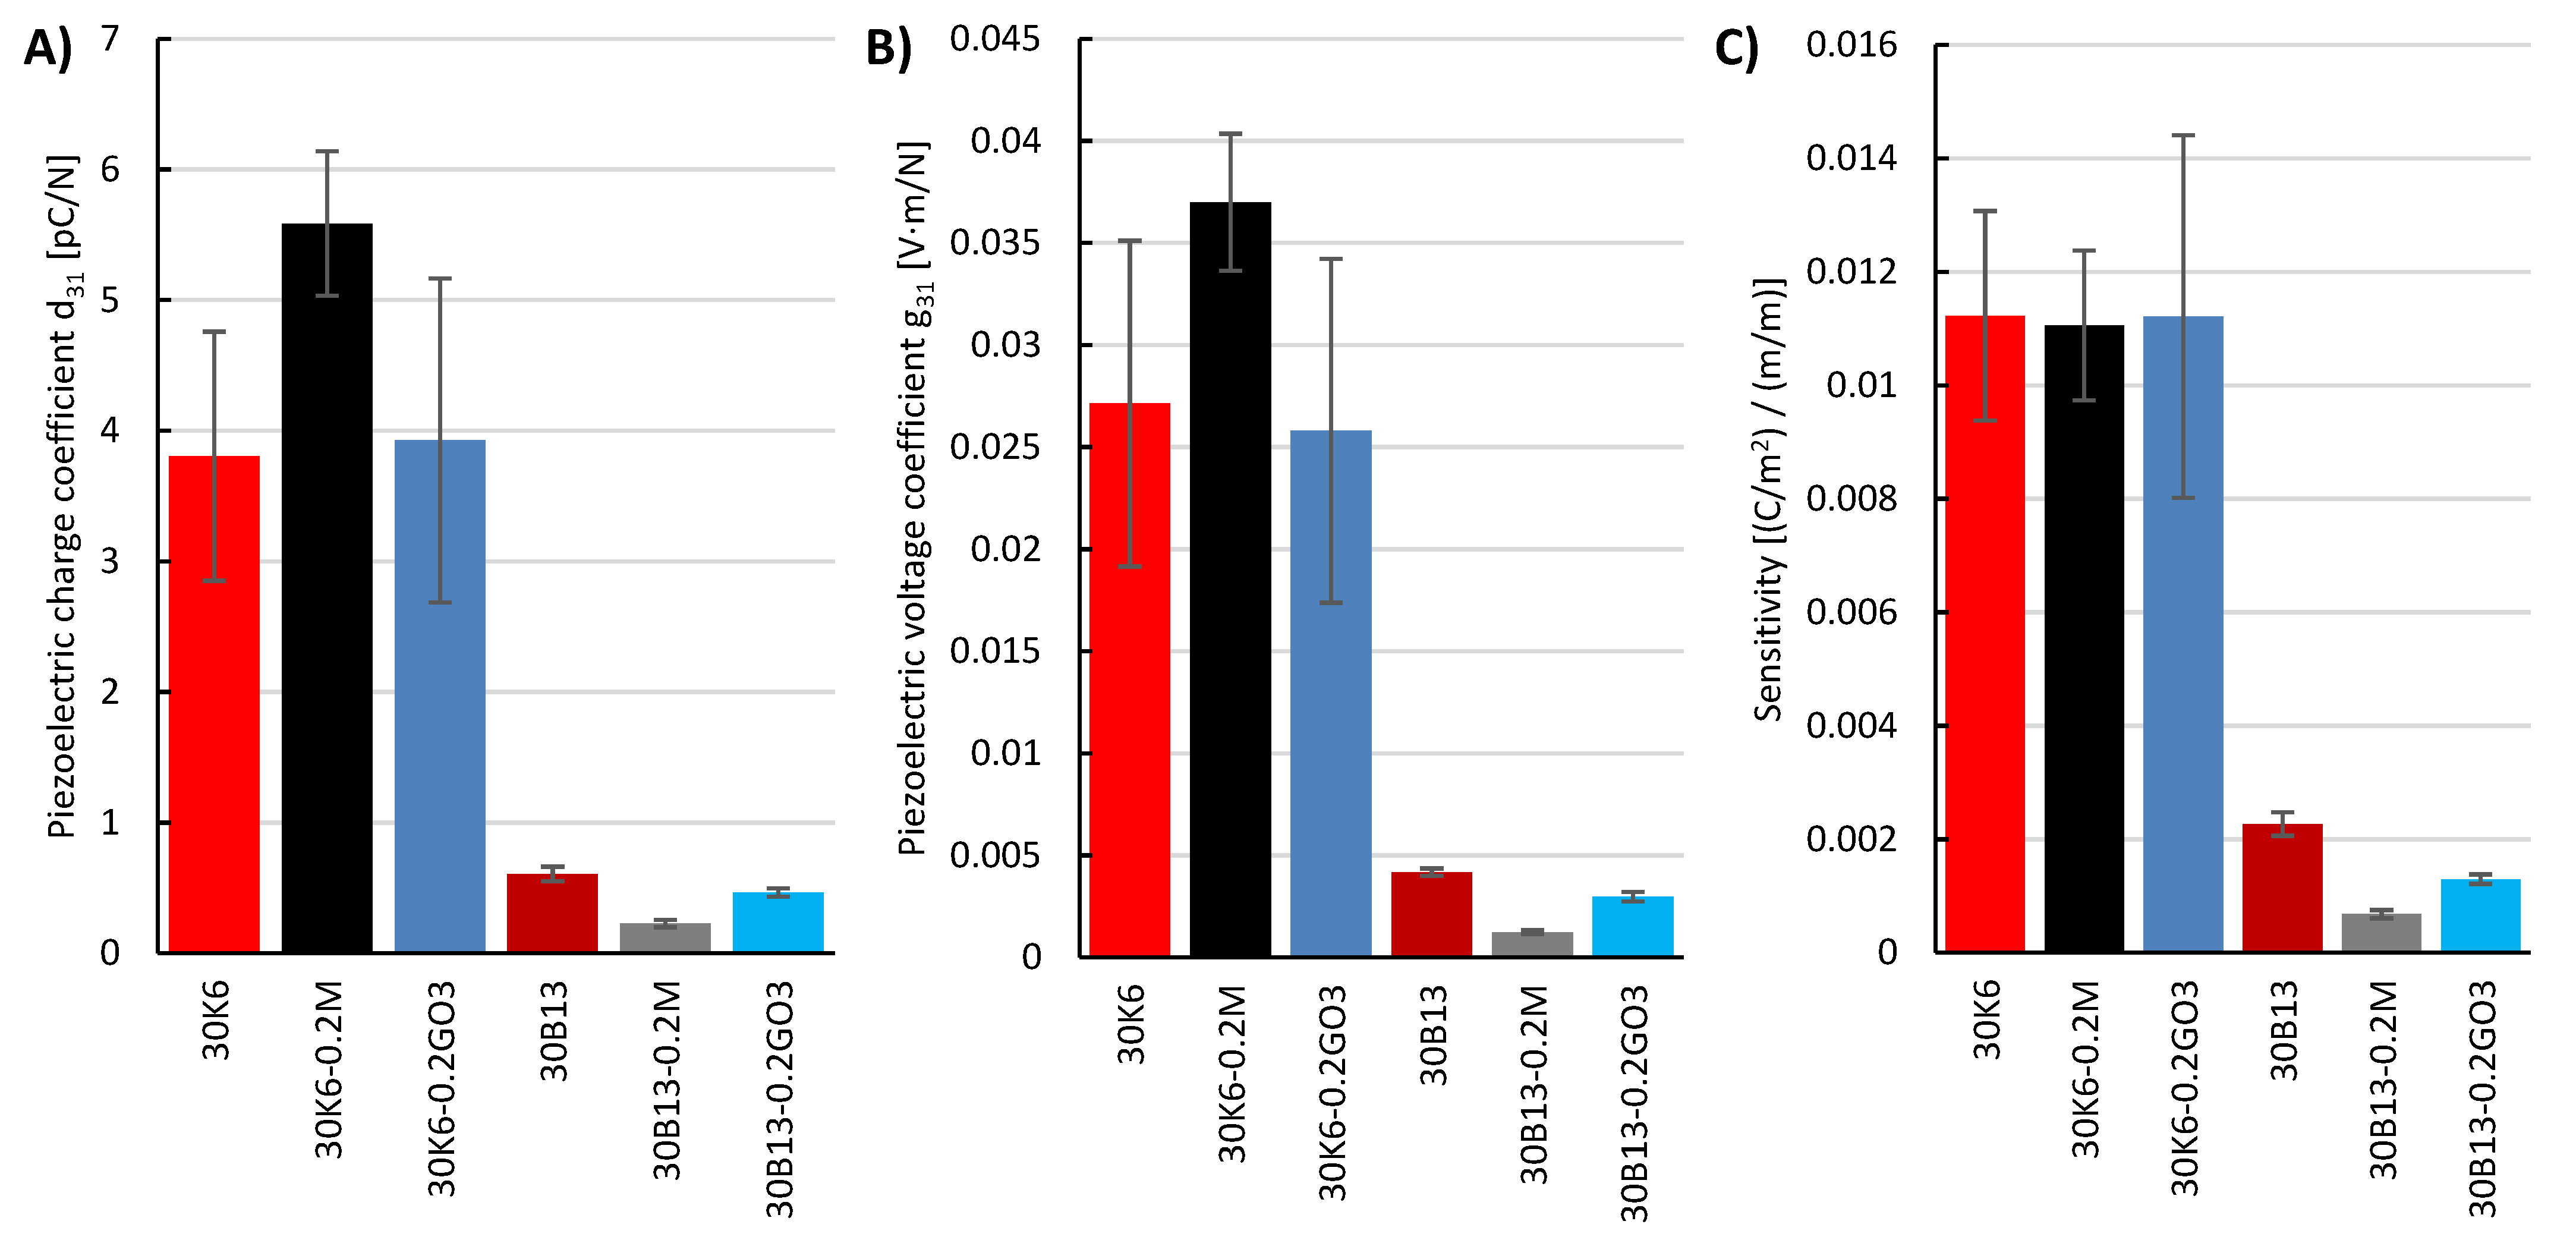
4.4. Sensor Poling and Piezoelectric Properties
5. Conclusions
Supplementary Materials
Author Contributions
Funding
Institutional Review Board Statement
Informed Consent Statement
Acknowledgments
Conflicts of Interest
References
- Sundar, U.; Cook-Chennault, K.A.; Banerjee, S.; Refour, E. Dielectric and piezoelectric properties of percolative three-phase piezoelectric polymer composites. J. Vac. Sci. Technol. B 2016, 34, 041232. [Google Scholar] [CrossRef]
- Tang, J.; Liu, J.; Huang, H. Dielectric, Piezoelectric and Ferroelectric Properties of Flexible 0–3 Type PZT/PVDF Composites Doped with Graphene. J. Electron. Mater. 2019, 48, 4033–4039. [Google Scholar] [CrossRef]
- Tiller, B.; Reid, A.; Zhu, B.; Guerreiro, J.; Domingo-Roca, R.; Curt Jackson, J.; Windmill, J.F.C. Piezoelectric microphone via a digital light processing 3D printing process. Mater. Des. 2019, 165, 1–7. [Google Scholar] [CrossRef]
- Wang, Z.; Narita, F. Corona Poling Conditions for Barium Titanate/Epoxy Composites and their Unsteady Wind Energy Harvesting Potential. Adv. Eng. Mater. 2019, 21, 1900169. [Google Scholar] [CrossRef]
- Ponraj, B.; Bhimireddi, R.; Varma, K.B.R. Effect of nano- and micron-sized K0.5Na0.5NbO3 fillers on the dielectric and piezoelectric properties of PVDF composites. J. Adv. Ceram. 2016, 5, 308–320. [Google Scholar] [CrossRef] [Green Version]
- Lin, J.; Chen, G.; Yang, W.; Li, H.; Lei, Q. New potassium sodium niobate/poly(vinylidene fluoride) functional composite films with high dielectric permittivity. J. Polym. Res. 2016, 23, 152. [Google Scholar] [CrossRef]
- Newnham, R.E.; Safari, A.; Giniewicz, J.; Fox, B.H. Composite piezoelectric sensors. Ferroelectrics 1984, 60, 15–21. [Google Scholar] [CrossRef]
- Newnham, R.E.; Skinner, D.P.; Cross, L.E. Connectivity and piezoelectric-pyroelectric composites. Mater. Res. Bull. 1978, 13, 525–536. [Google Scholar] [CrossRef]
- James, N.K. Piezoelectric and Dielectric Properties of Polymer-Ceramic Composites for Sensors. Master’s Thesis, Delft University of Technology, Delft, The Netherlands, 17 June 2015. [Google Scholar]
- Karapuzha, A.S. Exploration of Non-MPB PZT Compositions for High Piezoelectric Voltage Sensitive 0-3 Composites. Master’s Thesis, Delft University of Technology, Delft, The Netherlands, 17 December 2014. [Google Scholar]
- Mascarenhas, N.T. Highly Flexible Lead-Free Piezoelectric Composites: For Vibration Damping and Noise Cancellation Applications. Master’s Thesis, Delft University of Technology, Delft, The Netherlands, 27 November 2015. [Google Scholar]
- Lammering, R.; Gabbert, U.; Sinapius, M.; Schuster, T.; Wieach, P. Lamb-Wave Based Structural Health Monitoring in Polymer Composites; Springer: Berlin/Heidelberg, Germany, 2018. [Google Scholar]
- Banerjee, S. An Experimental and Theoretical Analysis of Two and Three Phase Epoxy Based Piezoelectric Composites. Master’s Thesis, The State University of New Jersey, New Brunswick, NJ, USA, May 2013. [Google Scholar] [CrossRef]
- Han, K.; Safari, A.; Riman, R.E. Colloidal Processing for Improved Piezoelectric Properties of Flexible 0-3 Ceramic-Polymer Composites. J. Am. Ceram. Soc. 1991, 74, 1699–1702. [Google Scholar] [CrossRef]
- Sa-Gong, G.; Safari, A.; Jang, S.J.; Newnham, R.E. Poling flexible piezoelectric composites. Ferroelectr. Lett. Sect. 1986, 5, 131–142. [Google Scholar] [CrossRef]
- Takahashi, H. Development of lead-free BaTiO3 ceramics possessing enhanced piezoelectric properties. Electron. Comm. Jpn. 2012, 95, 20–26. [Google Scholar] [CrossRef]
- Aksel, E.; Jones, J.L. Advances in lead-free piezoelectric materials for sensors and actuators. Sensors 2010, 10, 1935–1954. [Google Scholar] [CrossRef] [PubMed]
- Maeder, M.D.; Damjanovic, D.; Setter, N. Lead Free Piezoelectric Materials. J. Electroceram. 2004, 13, 385–392. [Google Scholar] [CrossRef]
- Liu, J.; Tian, G.; Qi, S.; Wu, Z.; Wu, D. Enhanced dielectric permittivity of a flexible three-phase polyimide–graphene–BaTiO3 composite material. Mater. Lett. 2014, 124, 117–119. [Google Scholar] [CrossRef]
- Luo, C.; Hu, S.; Xia, M.; Li, P.; Hu, J.; Li, G.; Jiang, H.; Zhang, W. A Flexible Lead-Free BaTiO3/PDMS/C Composite Nanogenerator as a Piezoelectric Energy Harvester. Energy Technol. 2018, 6, 922–927. [Google Scholar] [CrossRef]
- Ferreira, O.B.; Venkat, R.S.; Boller, C. Development of the Fabrication Process and Characterization of Piezoelectric BaTiO3/Epoxy Composite Used for Coated Ultrasonic Transducer Patterns in Structural Health Monitoring. In Proceedings of the 19th World Conference on Non-Destructive Testing, Munich, Germany, 13–17 June 2016. [Google Scholar] [CrossRef]
- Wang, Z.; Abe, S.; Narita, F. On the Energy Harvesting Potential of Lead-Free Piezoelectric Composites from Air-Flow and Temperature Change. Res. Dev. Mater. Sci. 2018, 5, 000607. [Google Scholar] [CrossRef]
- Deutz, D.B.; Mascarenhas, N.T.; van der Zwaag, S.; Groen, W.A. Enhancing energy harvesting potential of (K,Na,Li)NbO3-epoxy composites via Li substitution. J. Am. Ceram. Soc. 2017, 100, 1108–1117. [Google Scholar] [CrossRef] [Green Version]
- Gupta, M.K.; Kim, S.W.; Kumar, B. Flexible High-Performance Lead-Free Na0.47K0.47Li0.06NbO3 Microcube-Structure-Based Piezoelectric Energy Harvester. ACS Appl. Mater. Interfaces 2016, 8, 1766–1773. [Google Scholar] [CrossRef]
- Jeong, C.K.; Park, K.I.; Ryu, J.; Hwang, G.T.; Lee, K.J. Large-Area and Flexible Lead-Free Nanocomposite Generator Using Alkaline Niobate Particles and Metal Nanorod Filler. Adv. Funct. Mater. 2014, 24, 2620–2629. [Google Scholar] [CrossRef]
- Bhalla, S.; Moharana, S.; Talakokula, V.; Kaur, N. Piezoelectric Materials: Applications in SHM, Energy Harvesting and Bio-Mechanics, 1st ed.; Athena Academic Ltd. and John Wiley & Sons Ltd.: Hoboken, NJ, USA, 2017; pp. 225–233. [Google Scholar] [CrossRef] [Green Version]
- Egerton, L.; Dillonu, D.M. Piezoelectric and Dielectric Properties of Ceramics in the System Potassium-Sodium Niobate. J. Am. Ceram. Soc. 1959, 42, 438–442. [Google Scholar] [CrossRef]
- Bechmann, R. Elastic, Piezoelectric, and Dielectric Constants of Polarized Barium Titanate Ceramics and Some Applications of the Piezoelectric Equations. J. Acoust. Soc. Am. 1956, 28, 347–350. [Google Scholar] [CrossRef]
- Jaffe, H. Piezoelectric Ceramics. J. Am. Ceram. Soc. 1958, 41, 494–498. [Google Scholar] [CrossRef]
- Qin, Y.; Zhang, J.; Yao, W.; Wang, C.; Zhang, S. Domain Structure of Potassium-Sodium Niobate Ceramics Before and After Poling. J. Am. Ceram. Soc. 2015, 98, 1027–1033. [Google Scholar] [CrossRef]
- Nan, C.-W.; Shen, Y.; Ma, J. Physical Properties of Composites Near Percolation. Annu. Rev. Mater. Sci. 2010, 40, 131–151. [Google Scholar] [CrossRef]
- Dang, Z.-M.; Shen, Y.; Nan, C.-W. Dielectric behavior of three-phase percolative Ni–BaTiO3/polyvinylidene fluoride composites. Appl. Phys. Lett. 2002, 81, 4814–4816. [Google Scholar] [CrossRef]
- Petrossian, G.; Aliheidari, N.; Ameli, A. Thermoplastic Polyurethane/Lead Zirconate Titanate/Carbon Nanotube Composites with Very High Dielectric Permittivity and Low Dielectric Loss. J. Compos. Sci. 2020, 4, 137. [Google Scholar] [CrossRef]
- Sakamoto, W.K.; de Souza, E.; Das-Gupta, D.K. Electroactive properties of flexible piezoelectric composites. Mater. Res. 2001, 4, 201–204. [Google Scholar] [CrossRef]
- Sakamoto, W.K.; Marin-Franch, P.; Das-Gupta, D.K. Characterization and application of PZT/PU and graphite doped PZT/PU composite. Sens. Actuators Phys. 2002, 100, 165–174. [Google Scholar] [CrossRef]
- De Melo, C.C.N.; Beatrice, C.A.G.; Pessan, L.A.; de Oliveira, A.D.; Machado, F.M. Analysis of Nonisothermal Crystallization Kinetics of Graphene Oxide-Reinforced Polyamide 6 Nanocomposites. Thermochim. Acta 2018, 667, 111–121. [Google Scholar] [CrossRef]
- Gómez, H.; Ram, M.K.; Alvi, F.; Villalba, P.; Stefanakos, E.; Kumar, A. Graphene-conducting polymer nanocomposite as novel electrode for supercapacitors. J. Power Source 2011, 196, 4102–4108. [Google Scholar] [CrossRef]
- Patsidis, A.C.; Kalaitzidou, K.; Anastassopoulos, D.L.; Vradis, A.A.; Psarras, G.C. Graphite nanoplatelets and/or barium titanate/polymer nanocomposites: Fabrication, thermomechanical properties, dielectric response and energy storage. J. Chin. Adv. Mater. Soc. 2014, 2, 207–221. [Google Scholar] [CrossRef]
- Ravindran, A.R.; Feng, C.; Huang, S.; Wang, Y.; Zhao, Z.; Yang, J. Effects of Graphene Nanoplatelet Size and Surface Area on the AC Electrical Conductivity and Dielectric Constant of Epoxy Nanocomposites. Polymers 2018, 10, 477. [Google Scholar] [CrossRef] [PubMed] [Green Version]
- Babu, I. Piezoelectric Composites: Design, Fabrication and Performance Analysis. PhD Thesis, Eindhoven University of Technology, Eindhoven, The Netherlands, 1 January 2013. [Google Scholar] [CrossRef]
- Xu, W.; Ding, Y.; Jiang, S.; Chen, L.; Liao, X.; Hou, H. Polyimide/BaTiO3/MWCNTs three-phase nanocomposites fabricated by electrospinning with enhanced dielectric properties. Mater. Lett. 2014, 135, 158–161. [Google Scholar] [CrossRef]
- Liu, J.; Wu, Y.; Shen, J.; Gao, Y.; Zhang, L.; Cao, D. Polymer-nanoparticle interfacial behavior revisited: A molecular dynamics study. Phys. Chem. Chem. Phys. 2011, 13, 13058–13069. [Google Scholar] [CrossRef] [PubMed]
- De Oliveira, A.D.; Beatrice, C.A.G. Polymer Nanocomposites with Different Types of Nanofiller. In Nanocomposites—Recent Evolutions; Sivasankaran, S., Ed.; IntechOpen: London, UK, 2019; pp. 103–128. [Google Scholar]
- Banerjee, S.; Cook-Chennaul, K.A. Influence of Al Particle Size and Lead Zirconate Titanate (PZT) Volume Fraction on the Dielectric Properties of PZT-Epoxy-Aluminum Composites. J. Eng. Mater. Technol. 2011, 133, 041016. [Google Scholar] [CrossRef]
- Cui, X.; Zhang, C.; Hao, R.; Hou, Y. Liquid-phase exfoliation, functionalization and applications of graphene. Nanoscale 2011, 3, 2118. [Google Scholar] [CrossRef] [PubMed]
- Chiappone, A.; Roppolo, I.; Naretto, E.; Fantino, E.; Calignano, F.; Sangermano, M.; Pirri, F. Study of graphene oxide-based 3D printable composites: Effect of the in situ reduction. Compos. Part B 2017, 124, 9–15. [Google Scholar] [CrossRef]
- Li, H.; Bubeck, C. Photoreduction Process of Graphene Oxide and Related Applications. Macromol. Res. 2013, 21, 290–297. [Google Scholar] [CrossRef]
- Eng, H.; Maleksaeedi, S.; Yu, S.; Choong, Y.Y.C.; Wiria, F.E.; Kheng, R.E.; Wei, J.; Su, P.-C.; Tham, P.H. Development of CNTs-filled photopolymer for projection stereolithography. Rapid Prototyp. J. 2017, 23, 129–136. [Google Scholar] [CrossRef]
- Lin, D.; Jin, S.; Zhang, F.; Wang, C.; Wang, Y.; Zhou, C.; Cheng, G.J. 3D stereolithography printing of graphene oxide reinforced complex architectures. Nanotechnology 2015, 26, 434003. [Google Scholar] [CrossRef] [Green Version]
- Manapat, J.Z.; Chen, Q.; Ye, P.; Advincula, R.C. 3D Printing of Polymer Nanocomposites via Stereolithography. Macromol. Mater. Eng. 2017, 302, 1600553. [Google Scholar] [CrossRef]
- Chiulan, I.; Voicu, Ş.I.; Batalu, D. The Use of Graphene and Its Derivatives for the Development of Polymer Matrix Composites by Stereolithographic 3D Printing. Appl. Sci. 2022, 12, 3521. [Google Scholar] [CrossRef]
- Hyeonseo, J.; Sunghun, C. Comparative Studies on Polyurethane Composites Filled with Polyaniline and Graphene for DLP-Type 3D Printing. Polymers 2020, 12, 67. [Google Scholar] [CrossRef] [Green Version]
- Oliveira, A.D.; Beatrice, C.A.G.; Passador, F.R.; Pessan, L.A. Polyetherimide-based nanocomposites materials for hydrogen storage. In Proceedings of the Regional Conference Graz, Graz, Austria, 21–25 September 2015; Volume 1779, p. 040006. [Google Scholar] [CrossRef] [Green Version]
- Min, Y.; Akbulut, M.; Kristiansen, K.; Golan, Y.; Israelachvili, J. The role of interparticle and external forces in nanoparticle assembly. Nat. Mater. 2008, 7, 527–538. [Google Scholar] [CrossRef] [PubMed]
- Feng, Z.; Li, Y.; Xin, C.; Tang, D.; Xiong, W.; Zhang, H. Fabrication of Graphene-Reinforced Nanocomposites with Improved Fracture Toughness in Net Shape for Complex 3D Structures via Digital Light Processing. J. Carbon Res. 2019, 5, 25. [Google Scholar] [CrossRef] [Green Version]
- Huang, Y.Y.; Terentjev, E.M. Dispersion of Carbon Nanotubes: Mixing, Sonication, Stabilization, and Composite Properties. Polymers 2012, 4, 275–295. [Google Scholar] [CrossRef] [Green Version]
- Mitkus, R.; Scharnofske, M.; Sinapius, M. Characterization 0.1 wt.% Nanomaterial/Photopolymer Composites with Poor Nanomaterial Dispersion: Viscosity, Cure Depth and Dielectric Properties. Polymers 2021, 13, 3948. [Google Scholar] [CrossRef]
- Ha, J.-H.; Lee, S.-E.; Park, S.-H. Effect of Dispersion by Three-Roll Milling on Electrical Properties Filler Length of Carbon Nanotube Composites. Materials 2019, 12, 3823. [Google Scholar] [CrossRef] [Green Version]
- Goh, P.S.; Ng, B.C.; Ismail, A.F.; Aziz, M.; Sanip, S.M. Surfactant dispersed multi-walled carbon nanotube/polyetherimide nanocomposite membrane. Solid State Sci. 2010, 12, 2155–2162. [Google Scholar] [CrossRef]
- Suherman, H.; Dweiri, R.; Mahyoedin, Y.; Duskiardi, D. Investigation of electrical-mechanical performance of epoxy-based nanocomposites filled with hybrid electrically conductive fillers. Mater. Res. Express 2019, 6, 115010. [Google Scholar] [CrossRef]
- Kaur, I.; Ellis, L.-J.; Romer, I.; Tantra, R.; Carriere, M.; Allard, S.; Mayne-L’Hermite, M.; Minelli, C.; Unger, W.; Potthoff, A.; et al. Dispersion of Nanomaterials in Aqueous Media: Towards Protocoll Optimization. J. Vis. Exp. 2017, 130, e56074. [Google Scholar] [CrossRef] [Green Version]
- Miller-Ihli, N. Automated Ultrasonic Mixing Accessory for Slurry Sampling into a Graphite Furnace Atomic Absorption Spectrometer. J. Anal. At. Spectrom. 1989, 4, 295–297. [Google Scholar] [CrossRef]
- Chen, Z.; Song, X.; Lei, L.; Chen, X.; Fei, C.; Chiu, C.T.; Qian, X.; Ma, T.; Yang, Y.; Shung, K.; et al. 3D Printing of Piezoelectric Element for Energy Focusing and Ultrasonic Sensing. Nano Energy 2016, 27, 78–86. [Google Scholar] [CrossRef] [Green Version]
- Dang, Z.-M.; Yuan, J.-K.; Zha, J.-W.; Zhou, T.; Li, S.-T.; Hu, G.-H. Fundamentals, process and applications of high-permittivity polymer-matrix composites. Prog. Mater. Sci. 2012, 57, 660–723. [Google Scholar] [CrossRef]
- Arlt, K.; Wegener, M. Piezoelectric PZT/PVDF-copolymer 0-3 Composites: Aspects on Film Preparation and Electrical Poling. IEEE Trans. Dielectr. Electr. Insul. 2010, 17, 1178–1184. [Google Scholar] [CrossRef]
- Yao, D.; Cui, H.; Hensleigh, R.; Smith, P.; Alford, S.; Bernero, D.; Bush, S.; Mann, K.; Wu, F.; Chin-Nieh, M.; et al. Achieving the Upper Bound of Piezoelectric Response in Tunable, Wearable 3D Printed Nanocomposites. Adv. Funct. Mater. 2019, 29, 1903866. [Google Scholar] [CrossRef]
- Chen, Z.; Li, Z.; Li, J.; Liu, C.; Lao, C.; Fu, Y.; Liu, C.; Li, Y.; Wang, P.; He, Y. 3D printing of ceramics: A review. J. Eur. Ceram. Soc. 2019, 39, 661–687. [Google Scholar] [CrossRef]
- Cui, H.; Hensleigh, R.; Yao, D.; Maurya, D.; Kumar, P.; Kang, M.G.; Priya, S.; Zheng, X.R. Three-dimensional printing of piezoelectric materials with designed anisotropy and directional response. Nat. Mater. 2019, 18, 234–241. [Google Scholar] [CrossRef]
- Mitkus, R.; Pierou, A.; Feder, J.; Sinapius, M. Investigation and Attempt to 3D Print Piezoelectric 0-3 Composites Made of Photopolymer Resins and PZT. In Proceedings of the Conference on Smart Materials, Adaptive Structures and Intelligent Systems, Irvine, CA, USA, 15 September 2020. [Google Scholar] [CrossRef]
- Liska, R.; Schuster, M.; Inführ, R.; Turecek, C.; Fritscher, C.; Seidl, B.; Schmidt, V.; Kuna, L.; Haase, A.; Varga, F.; et al. Photopolymers for rapid prototyping. J. Coat. Technol. Res. 2007, 4, 505–510. [Google Scholar] [CrossRef]
- Hull, C.W. Apparatus for Production of Three-Dimensional Objects by Stereolithography. US Patent US4575330A, 11 March 1986. Available online: https://patents.google.com/patent/US4575330A/en (accessed on 26 January 2023).
- Stansbury, J.W.; Idacavage, M.J. 3D printing with polymers: Challenges among expanding options and opportunities. Dent. Mater. J. 2016, 32, 54–65. [Google Scholar] [CrossRef]
- Song, X.; Chen, Z.; Lei, L.; Shung, K.; Zhou, Q.; Chen, Y. Piezoelectric component fabrication using projection-based stereolithography of barium titanate ceramic suspensions. Rapid Prototyp. J. 2017, 23, 44–53. [Google Scholar] [CrossRef]
- Fantino, E.; Chiappone, A.; Calignano, F.; Fontana, M.; Pirri, F.; Roppolo, I. In Situ Thermal Generation of Silver Nanoparticles in 3D Printed Polymeric Structures. Materials 2016, 9, 589. [Google Scholar] [CrossRef] [PubMed] [Green Version]
- Jang, J.H.; Wang, S.; Pilgrim, S.M.; Schulze, W.A. Preparation and Characterization of Barium Titanate Suspensions for Stereolithography. J. Am. Ceram. Soc. 2000, 83, 1804–1806. [Google Scholar] [CrossRef]
- Mitkus, R.; Sinapius, M. Piezoelectric Ceramic/Photopolymer Composites Curable with UV Light: Viscosity, Curing Depth, and Dielectric Properties. J. Compos. Sci. 2022, 6, 212. [Google Scholar] [CrossRef]
- Yang, Y.; Chen, Z.; Song, X.; Zhu, B.; Hsiai, T.; Wu, P.-I.; Xiong, R.; Shi, J.; Chen, Y.; Zhou, Q.; et al. Three dimensional printing of high dielectric capacitor using projection based stereolithography method. Nano Energy 2016, 22, 414–421. [Google Scholar] [CrossRef] [Green Version]
- Kim, K.; Zhu, W.; Qu, X.; Aaronson, C.; McCall, W.R.; Chen, S.; Sirbuly, D.J. 3D optical printing of piezoelectric nanoparticle-polymer composite materials. ACS Nano 2014, 8, 9799–9806. [Google Scholar] [CrossRef] [PubMed]
- Kim, K.; Middlebrook, J.L.; Chen, J.E.; Zhu, W.; Chen, S.; Sirbuly, D.J. Tunable Surface and Matrix Chemistries in Optically Printed (0-3) Piezoelectric Nanocomposites. ACS Appl. Mater. Interfaces 2016, 8, 33394–33398. [Google Scholar] [CrossRef] [PubMed]
- Mitkus, R.; Taleb, A.A.; Sinapius, M. An Attempt to Topology Optimize 3D Printed Piezoelectric Composite Sensors for Highest D31 Output. In Proceedings of the ASME 2021 Conference on Smart Materials, Adaptive Structures and Intelligent Systems. ASME 2021 Conference on Smart Materials, Adaptive Structures and Intelligent Systems, Virtual, Online, 14–15 September 2021. [Google Scholar] [CrossRef]
- Fantino, E.; Chiappone, A.; Roppolo, I.; Manfredi, D.; Bongiovanni, R.; Pirri, C.F.; Calignano, F. 3D Printing of Conductive Complex Structures with In Situ Generation of Silver Nanoparticles. Adv. Mater. 2016, 28, 3712–3717. [Google Scholar] [CrossRef]
- Travitzky, N.; Bonet, A.; Dermeik, B.; Fey, T.; Filbert-Demut, I.; Schlier, L.; Schlordt, T.; Greil, P. Additive Manufacturing of Ceramic-Based Materials. Adv. Eng. Mater. 2014, 16, 729–754. [Google Scholar] [CrossRef]
- Roloff, T.; Mitkus, R.; Lion, J.; Sinapius, M. 3D printable piezoelectric composite sensors for guided ultrasonic wave detection. In Proceedings of the 8th International Electronic Conference on Sensors and Applications, Basel, Switzerland, 1–15 November 2021. [Google Scholar] [CrossRef]
- Schmidt, D. Modenselektive Übertragung von Lambwellen in Faserverbundstrukturen. PhD Thesis, Teschnische Universität Braunschweig, Braunschweig, Germany, 2014. [Google Scholar]
- Takahashi, H.; Yoshiki, N.; Tani, J.; Matsuta, K.; Qiu, J.; Tsurekawa, S. Lead-Free Barium Titanate Ceramics with Large Piezoelectric Constant Fabricated by Microwave Sintering. Jpn. J. Appl. Phys. 2006, 45, L30–L32. [Google Scholar] [CrossRef]
- Babu, I.; van den Ende, D.A.; de With, G. Processing and characterization of piezoelectric 0-3 PZT/LCT/PA composites. J. Phys. D Appl. Phys. 2010, 43, 425402. [Google Scholar] [CrossRef] [Green Version]
- Halloran, J.W. Ceramic Stereolithography: Additive Manufacturing for Ceramics by Photopolymerization. Annu. Rev. Mater. Res. 2016, 46, 19–40. [Google Scholar] [CrossRef]
- Badev, A.; Abouliatim, Y.; Chartier, T.; Lecamp, L.; Lebaudy, P.; Chaput, C.; Delage, C. Photopolymerization kinetics of a polyether acrylate in the presence of ceramic fillers used in stereolithography. J. Photochem. Photobiol. A Chem. 2011, 222, 117–122. [Google Scholar] [CrossRef]
- Sun, C.; Zhang, X. Experimental and numerical investigations on microstereolithography of ceramics. J. Appl. Phys. 2002, 92, 4796. [Google Scholar] [CrossRef] [Green Version]
- Griffith, M.L.; Halloran, J.W. Freeform Fabrication of Ceramics via Stereolithography. J. Am. Ceram. Soc. 1996, 79, 2601–2608. [Google Scholar] [CrossRef] [Green Version]
- Gonzalez, G.; Chiappone, A.; Roppolo, I.; Fantino, E.; Bertana, V.; Perrucci, F.; Scaltrito, L.; Pirri, F.; Sangermano, M. Development of 3D printable formulations containing CNT with enhanced electrical properties. Polymer 2017, 109, 246–253. [Google Scholar] [CrossRef]
- Bomlai, P.; Wichianrat, P.; Muensit, S.; Milne, S.J. Effect of Calcination Conditions and Excess Alkali Carbonate on the Phase Formation and Particle Morphology of Na0.5K0.5NbO3 Powders. J. Am. Ceram. Soc. 2007, 90, 1650–1655. [Google Scholar] [CrossRef]
- Kumar, P.; Pattanaik, M. Sonia, Synthesis and characterizations of KNN ferroelectric ceramics near 50/50 MPB. Ceram. Int. 2013, 39, 65–69. [Google Scholar] [CrossRef]
- Skidmore, T.A.; Milne, S.J. Phase development during mixed-oxide processing of a [Na0.5K0.5NbO3]1-x − [LiTaO3]x powder. J. Mater. Res. 2007, 22, 2265–2272. [Google Scholar] [CrossRef]
- Dwivedi, S.; Pareek, T.; Kumar, S. Structure, dielectric, and piezoelectric properties of K0.5Na0.5NbO3 -based lead-free ceramics. RSC Adv. 2018, 8, 24286–24296. [Google Scholar] [CrossRef] [Green Version]
- Zhu, F.; Skidmore, T.A.; Bell, A.J.; Comyn, T.P.; James, C.W.; Ward, M.; Milne, S.J. Diffuse dielectric behaviour in Na0.5K0.5NbO3– LiTaO3–BiScO3 lead-free ceramics. Mater. Chem. Phys. 2011, 129, 411–417. [Google Scholar] [CrossRef]
- Panomsuwan, G.; Manuspiya, H. A comparative study of dielectric and ferroelectric properties of sol–gel-derived BaTiO3 bulk ceramics with fine and coarse grains. Appl. Phys. A 2018, 124, 713. [Google Scholar] [CrossRef]
- Li, X.; Shih, W.H. Size Effects in Barium Titanate Particles and Clusters. J. Am. Ceram. Soc. 1997, 80, 2844–2852. [Google Scholar] [CrossRef]
- Huang, K.-C.; Huang, T.-C.; Hsieh, W.-F. Morphology-controlled synthesis of barium titanate nanostructures. Inorg. Chem. 2009, 48, 9180–9184. [Google Scholar] [CrossRef] [PubMed]
- Maiwa, H. Piezoelectric properties of BaTiO3 ceramics prepared by hot isostatic pressing. J. Ceram. Soc. Japan 2013, 121, 655–658. [Google Scholar] [CrossRef] [Green Version]
- Zeinabad, H.A.; Zarrabian, A.; Saboury, A.A.; Alizadeh, A.M.; Falahati, M. Interaction of single and multi wall carbon nanotubes with the biological systems: Tau protein and PC12 cells as targets. Sci. Rep. 2016, 6, 26508. [Google Scholar] [CrossRef] [Green Version]
- Wei, J.; Saharudin, M.S.; Vo, T.; Inam, F. N,N-Dimethylformamide (DMF) Usage in Epoxy/Graphene Nanocomposites: Problems Associated with Reaggregation. Polymers 2017, 9, 193. [Google Scholar] [CrossRef] [Green Version]
- Shuai, C.; Feng, P.; Gao, C.; Shuai, X.; Xiao, T.; Peng, S. Graphene oxide reinforced poly(vinyl alcohol): Nanocomposite scaffolds for tissue engineering applications. J. RSC Adv. 2015, 5, 25416–25423. [Google Scholar] [CrossRef]
- Cui, C.; Baughman, R.H.; Iqbal, Z.; Kazmar, T.R.; Dahlstrom, K. Piezoelectrics and Related Devices from Ceramics Dispersed in Polymers. U.S. Patent US5951908A, 14 September 1999. [Google Scholar]
- Payo, I.; Hale, J.M. Dynamic characterization of piezoelectric paint sensors under biaxial strain. Sens. Actuators A Phys. 2010, 163, 150–158. [Google Scholar] [CrossRef]
- Kok, S.L.; Lau, K.-T.; Ahsan, Q. Substrate-Free Thick-Film Lead Zirconate Titanate (PZT) Performance Measurement Using Berlincourt Method. Adv. Mater. Res. 2014, 895, 204–210. [Google Scholar] [CrossRef]
- Gentry, S.P.; Halloran, J.W. Depth and width of cured lines in photopolymerizable ceramic suspensions. J. Eur. Ceram. Soc. 2013, 33, 1981–1988. [Google Scholar] [CrossRef]
- Chabok, H.; Zhou, C.; Chen, Y.; Eskandarinazhad, A.; Zhou, Q.; Shung, K. Ultrasound Transducer Array Fabrication Based on Additive Manufacturing of Piezocomposites. In Proceedings of the ASME/ISCIE 2012 International Symposium 2012, St. Louis, MI, USA, 18–20 June 2012; pp. 433–444. [Google Scholar] [CrossRef]
- Azan, V.; Lecamp, L.; Lebaudy, P.; Bunel, C. Simulation of the photopolymerization gradient inside a pigmented coating. Prog. Org. Coat. 2007, 58, 70–75. [Google Scholar] [CrossRef]
- Dang, Z.-M.; Fan, L.-Z.; Shen, Y.; Nan, C.-W. Dielectric behavior of novel three-phase MWNTs/BaTiO3/PVDF composites. Mater. Sci. Eng. B 2003, 103, 140–144. [Google Scholar] [CrossRef]
- Babu, I.; de With, G. Enhanced electromechanical properties of piezoelectric thin flexible films. Compos. Sci. Technol. 2014, 104, 74–80. [Google Scholar] [CrossRef]
- Guan, X.; Zhang, Y.; Li, H.; Ou, J. PZT/PVDF composites doped with carbon nanotubes. Sens. Actuators A Phys. 2013, 194, 228–231. [Google Scholar] [CrossRef]
- Liu, X.F.; Xiong, C.X.; Sun, H.J.; Dong, L.J.; Li, R.; Liu, Y. Piezoelectric and dielectric properties of PZT/PVC and graphite doped with PZT/PVC composites. Mater. Sci. Eng. B 2006, 127, 261–266. [Google Scholar] [CrossRef]
- Banerjee, S.; Du, W.; Sundar, U.; Cook-Chennault, K.A. Piezoelectric and Dielectric Characterization of MWCNT-Based Nanocomposite Flexible Films. J. Nanomater. 2018, 2018, 6939621. [Google Scholar] [CrossRef]
- Banerjee, S.; Cook-Chennault, K.A.; Du, W.; Sundar, U.; Halim, H.; Tang, A. Piezoelectric and dielectric characterization of corona and contact poled PZT-epoxy-MWCNT bulk composites. Smart Mater. Struct. 2016, 25, 115018. [Google Scholar] [CrossRef]
- Granzow, T.; Kounga, A.B.; Aulbach, E.; Rödel, J. Electromechanical poling of piezoelectrics. Appl. Phys. Lett. 2006, 88, 252907. [Google Scholar] [CrossRef]
- Wu, J.; Xiao, D.; Wu, W.; Chen, Q.; Zhu, J.; Yang, Z.; Wang, J. Composition and poling condition-induced electrical behavior of (Ba0.85Ca0.15)(Ti1-xZrx)O3 lead-free piezoelectric ceramics. J. Eur. Ceram. Soc. 2012, 32, 891–898. [Google Scholar] [CrossRef]
- Du, H.; Tang, F.; Luo, F.; Zhou, W.; Qu, S.; Pei, Z. Effect of poling condition on piezoelectric properties of (K0.5Na0.5)NbO3–LiNbO3 lead-free piezoelectric ceramics. Mater. Sci. Eng. B 2007, 137, 175–179. [Google Scholar] [CrossRef]
- Egusa, S.; Iwasawa, N. Piezoelectric paints as one approach to smart structural materials with health-monitoring capabilities. Smart Mater. Struct. 1998, 7, 438–445. [Google Scholar] [CrossRef]
- Egusa, S.; Iwasawa, N. Piezoelectric paints: Preparation and application as built-in vibration sensors of structural materials. J. Mater. Sci. 1993, 28, 1667–1672. [Google Scholar] [CrossRef]
- Payo, I.; Hale, J.M. Sensitivity analysis of piezoelectric paint sensors made up of PZT ceramic powder and water-based acrylic polymer. Sens. Actuators A Phys. 2011, 168, 77–89. [Google Scholar] [CrossRef]
- Umemura, N.; Yoshida, K.; Kato, K. Phase-matching properties of KNbO3 in the mid-infrared. Appl. Opt. 1999, 38, 991–994. [Google Scholar] [CrossRef]
- Karvounis, A.; Timpu, F.; Vogler-Neuling, V.V.; Savo, R.; Grange, R. Barium Titanate Nanostructures and Thin Films for Photonics. Adv. Opt. Mater. 2020, 8, 2001249. [Google Scholar] [CrossRef]
- Wemple, S.H.; Didomenico, M.; Camlibel, I. Dielectric and optical properties of melt-grown BaTiO3. J. Phys. Chem. Solids 1968, 29, 1797–1803. [Google Scholar] [CrossRef]
- Müller, M.T.; Hilarius, K.; Liebscher, M.; Lellinger, D.; Alig, I.; Pötschke, P. Effect of Graphite Nanoplate Morphology on the Dispersion and Physical Properties of Polycarbonate Based Composites. Materials 2017, 10, 545. [Google Scholar] [CrossRef] [Green Version]


| KNN6 | BTO13 | |||||
|---|---|---|---|---|---|---|
| Property | 0 wt.% Nanofiller | 0.2 wt.% MWCNTs | 0.2 wt.% GO3 | 0 wt.% Nanofiller | 0.2 wt.% MWCNTs | 0.2 wt.% GO3 |
| No. of specimens poled full cycle | 1/17 | 1/14 | 2/28 | 5/20 | 0/20 | 0/20 |
| Max. electric field reached , kV/mm | 30 | 30 | 30 | 30 | 25.6 | 16.5 |
| Max. current consumed , μA | 0 | 0.024 | 0.23 | 0 | 1.816 | 0.112 |
| Most often breakdown condition | While holding at max electric field | Electric field ramp-up | Electric field ramp-up | While holding at max electric field | Electric field ramp-up | Electric field ramp-up |
| KNN6 | BTO13 | |||||
|---|---|---|---|---|---|---|
| Property (Average) | 0 wt.% Nanofiller | 0.2 wt.% MWCNTs | 0.2 wt.% GO3 | 0 wt.% Nanofiller | 0.2 wt.% MWCNTs | 0.2 wt.% GO3 |
| Thickness, μm | 101 | 96 | 87 | 68 | 64 | 72 |
| Young’s modulus, GPa | 2.103 | 1.404 | 2.046 | 2.616 | 2.105 | 1.952 |
| Relative permittivity | 17.132 | 19.321 | 18.533 | 16.563 | 22.529 | 19.9145 |
| Dielectric loss | 0.014 | 0.039 | 0.024 | 0.011 | 0.034 | 0.017 |
| , pC/N | −3.8054 | −5.586 | −3.925 | −0.607 | −0.227 | −0.465 |
| , V/m | −0.027 | −0.037 | −0.0268 | −0.004 | −0.001 | −0.003 |
| Sensitivity, (C/m2)/(m/m) | 0.0112 | 0.0111 | 0.0112 | 0.0023 | 0.0007 | 0.0013 |
| Sensitivity/thickness, (C/m2)/(m/m)/(mm) | 0.111 | 0.116 | 0.130 | 0.033 | 0.011 | 0.018 |
| Material Composition | Sensitivity, (C/m2)/(m/m) | Source |
|---|---|---|
| 30 vol% KNN6 + Photopolymer | 0.0112 ± 0.00185 | This study (30KNN6) |
| 30 vol% KNN6 + 0.2 wt% MWCNTs + Photopolymer | 0.0111 ± 0.00132 | This study (30KNN6-0.2M) |
| 30 vol% KNN6 + 0.2 wt% GO3 + Photopolymer | 0.0112 ± 0.00171 | This study (30KNN6-0.2GO3) |
| 52 vol% PZT + Epoxy | 0.034 | [119] |
| 52 vol% PZT + Epoxy | 0.035 | [120] |
| 22 vol% PZT + Acrylic paint | 0.0183 ± 0.0015 | [105] |
| 22 vol% PZT + Acrylic paint | 0.0212 ± 0.0008 | [121] |
Disclaimer/Publisher’s Note: The statements, opinions and data contained in all publications are solely those of the individual author(s) and contributor(s) and not of MDPI and/or the editor(s). MDPI and/or the editor(s) disclaim responsibility for any injury to people or property resulting from any ideas, methods, instructions or products referred to in the content. |
© 2023 by the authors. Licensee MDPI, Basel, Switzerland. This article is an open access article distributed under the terms and conditions of the Creative Commons Attribution (CC BY) license (https://creativecommons.org/licenses/by/4.0/).
Share and Cite
Mitkus, R.; Piechowiak, L.; Sinapius, M. Characterization of UV Light Curable Piezoelectric 0-0-3 Composites Filled with Lead-Free Ceramics and Conductive Nanoparticles. J. Compos. Sci. 2023, 7, 89. https://doi.org/10.3390/jcs7020089
Mitkus R, Piechowiak L, Sinapius M. Characterization of UV Light Curable Piezoelectric 0-0-3 Composites Filled with Lead-Free Ceramics and Conductive Nanoparticles. Journal of Composites Science. 2023; 7(2):89. https://doi.org/10.3390/jcs7020089
Chicago/Turabian StyleMitkus, Rytis, Lena Piechowiak, and Michael Sinapius. 2023. "Characterization of UV Light Curable Piezoelectric 0-0-3 Composites Filled with Lead-Free Ceramics and Conductive Nanoparticles" Journal of Composites Science 7, no. 2: 89. https://doi.org/10.3390/jcs7020089