

From Flat Plates to Sinusoidal Structures: Influence of Geometry on the Energy Absorption Capability of Carbon/Epoxy Composites

Abstract
:1. Introduction
2. Experimental Section
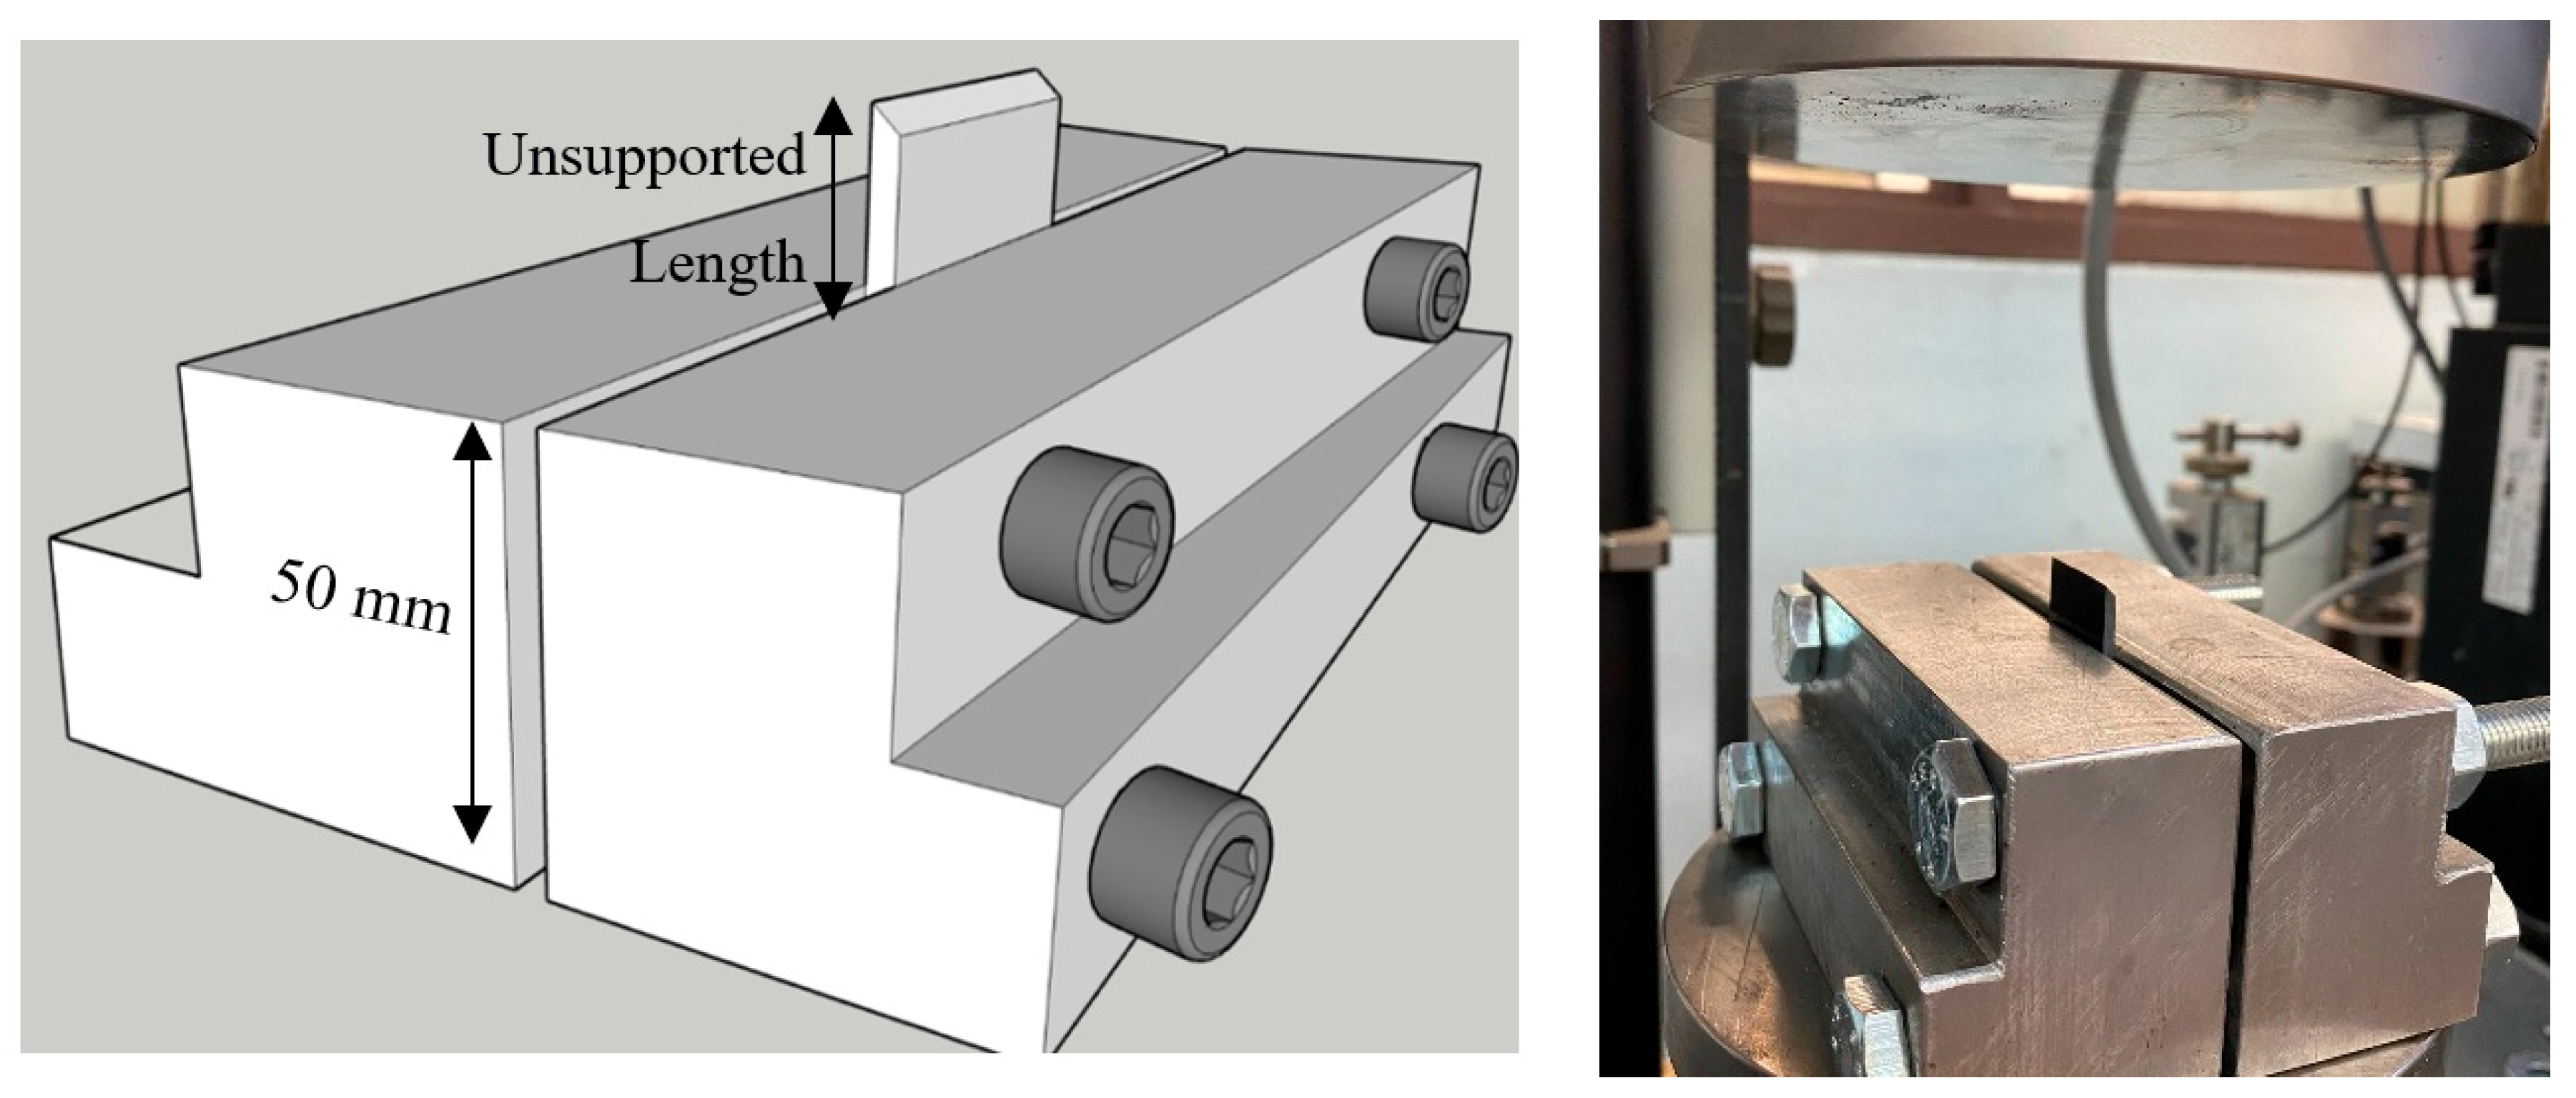
2.1. Flat Plate
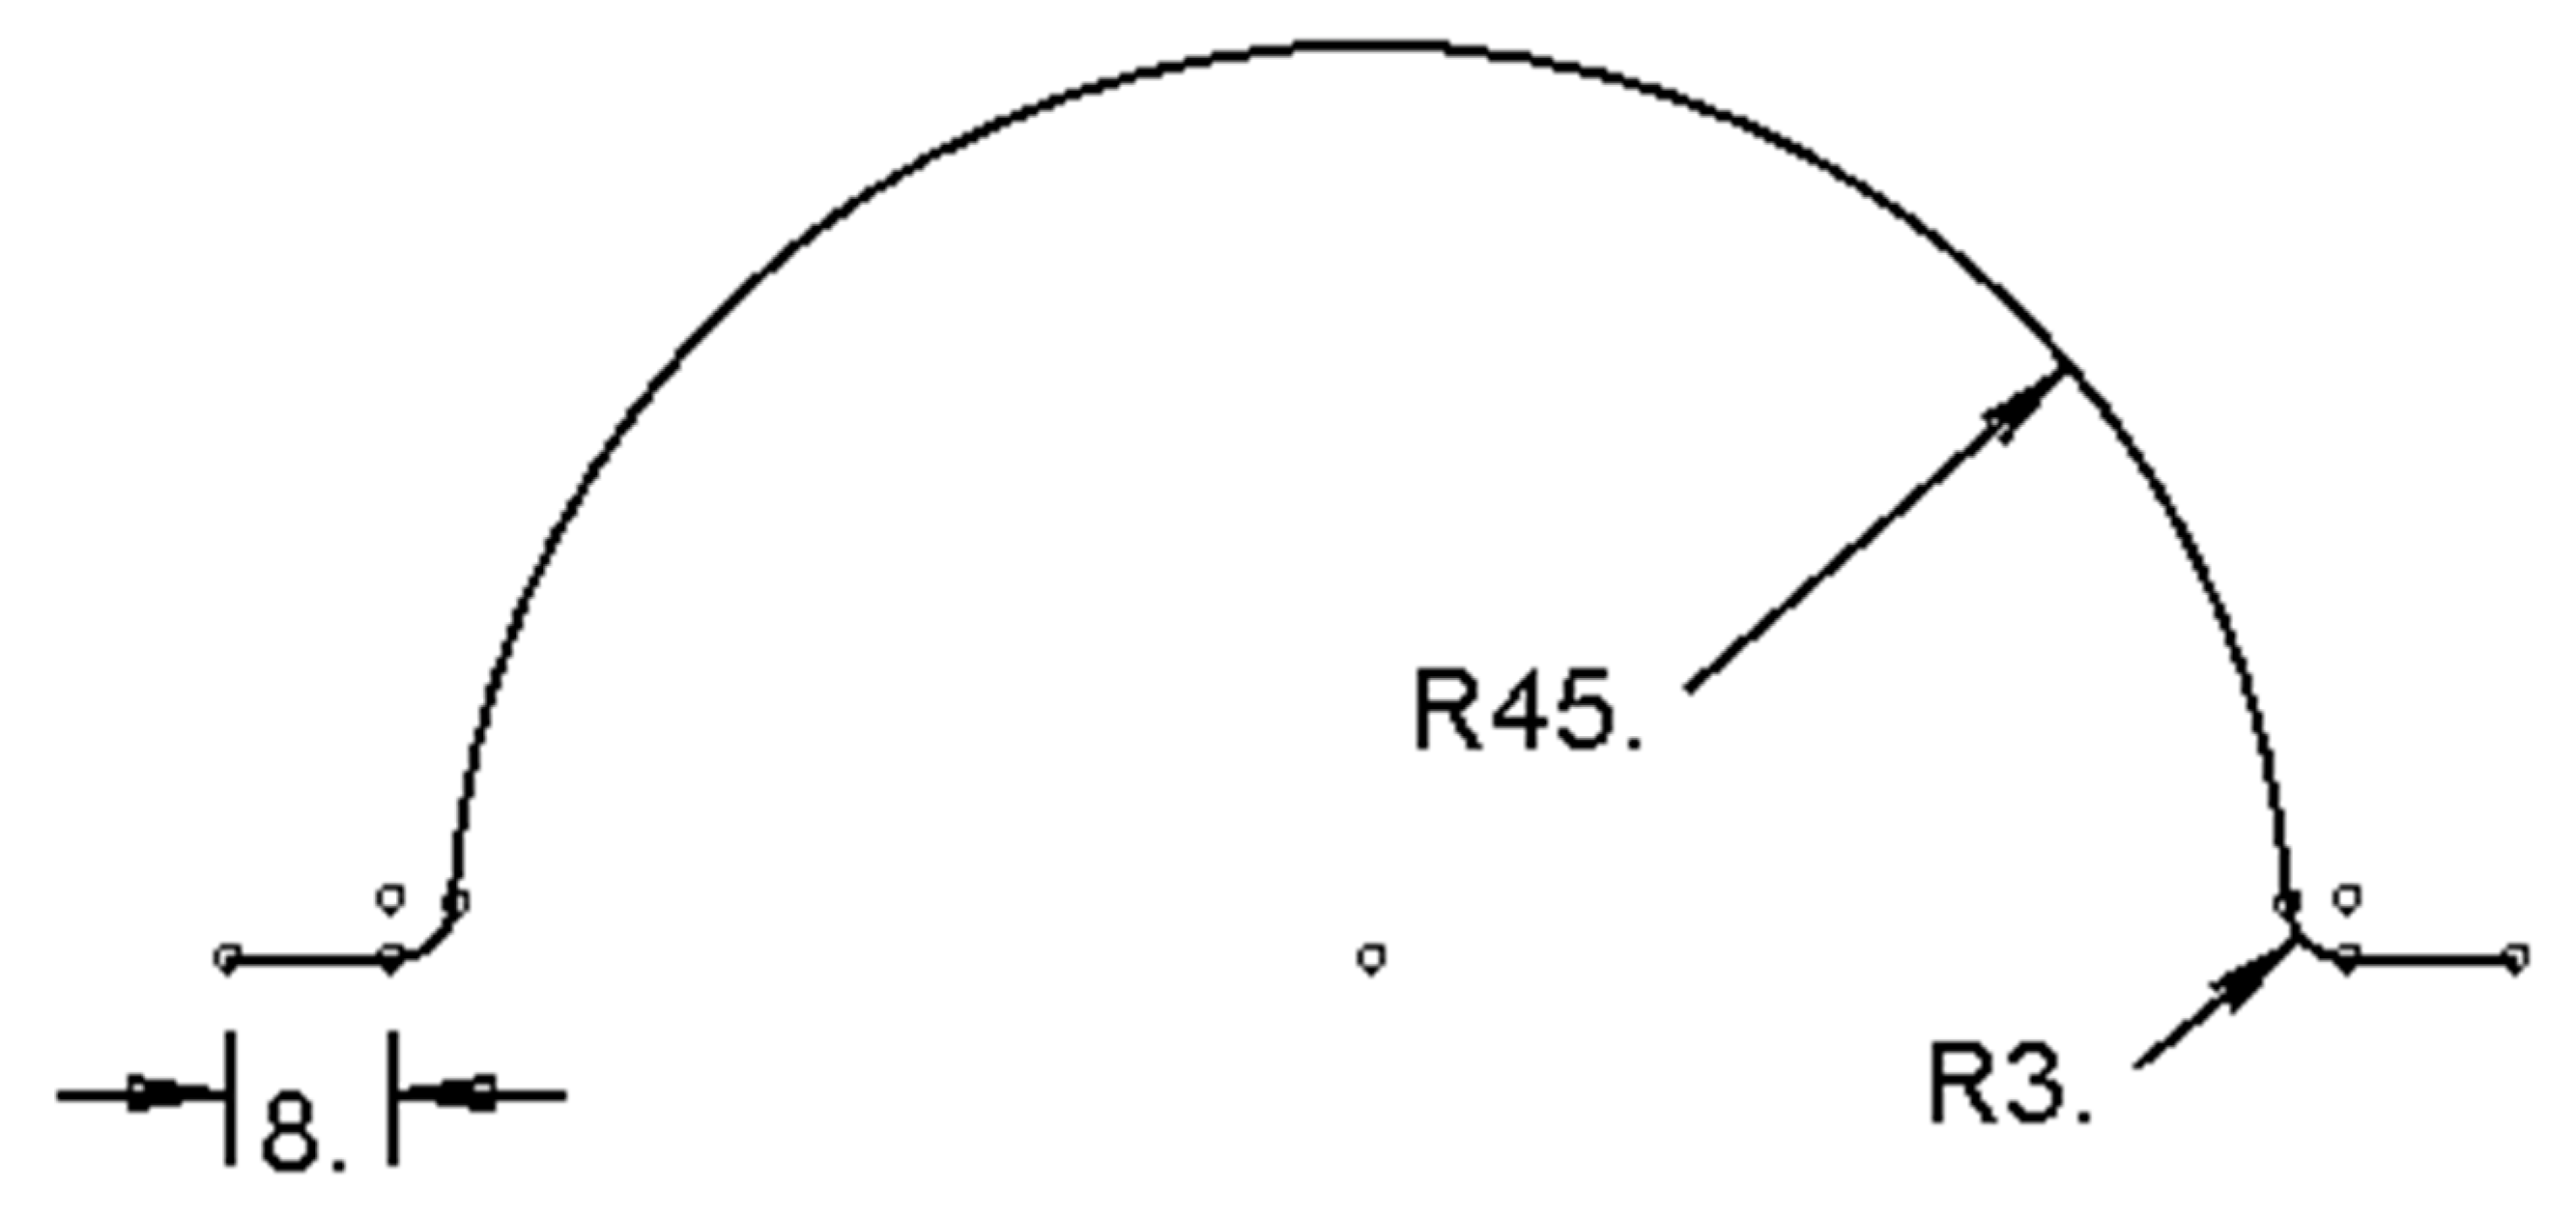
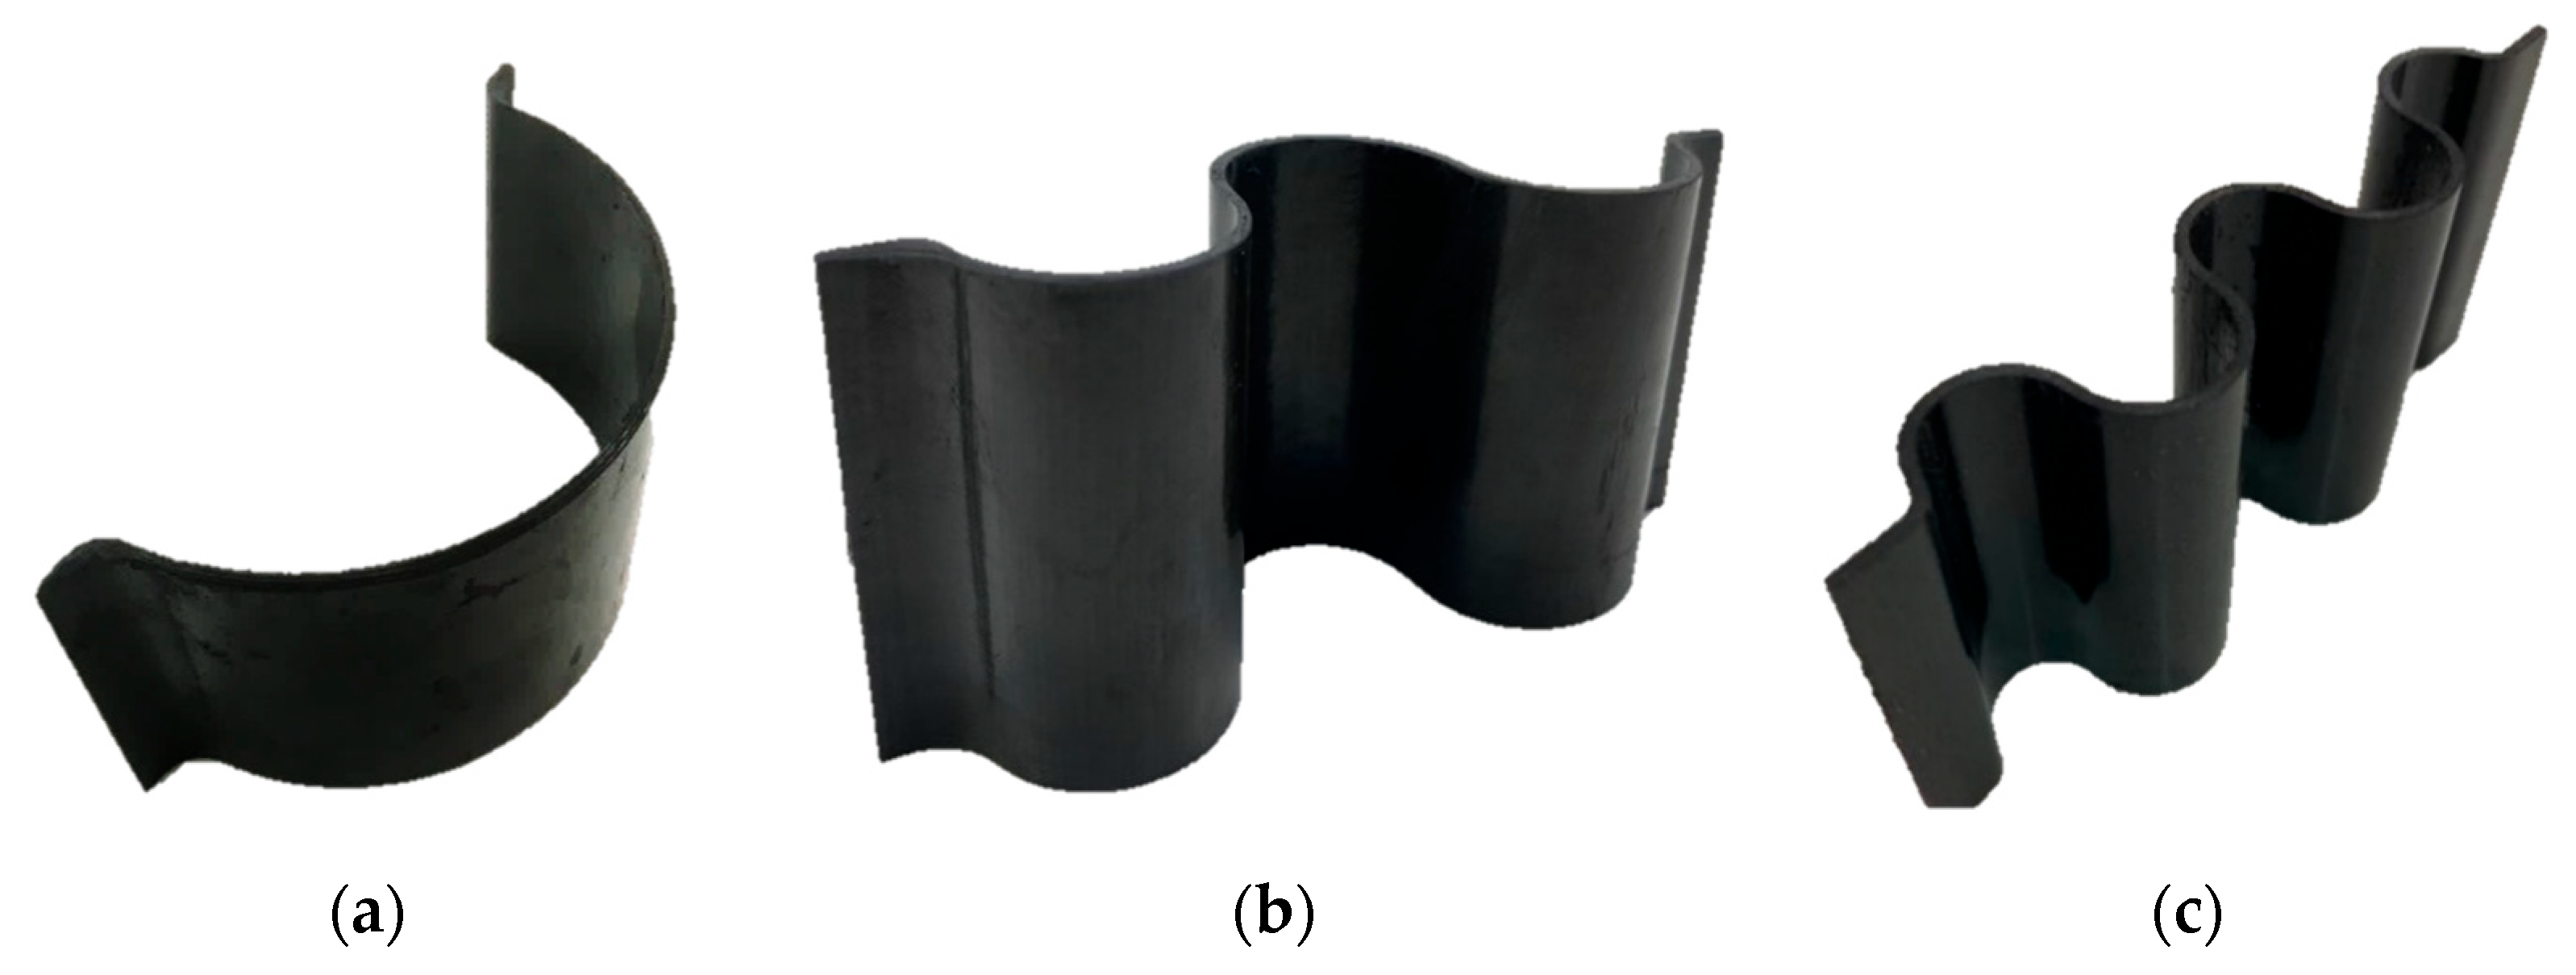
2.2. Semi-Circle Structure
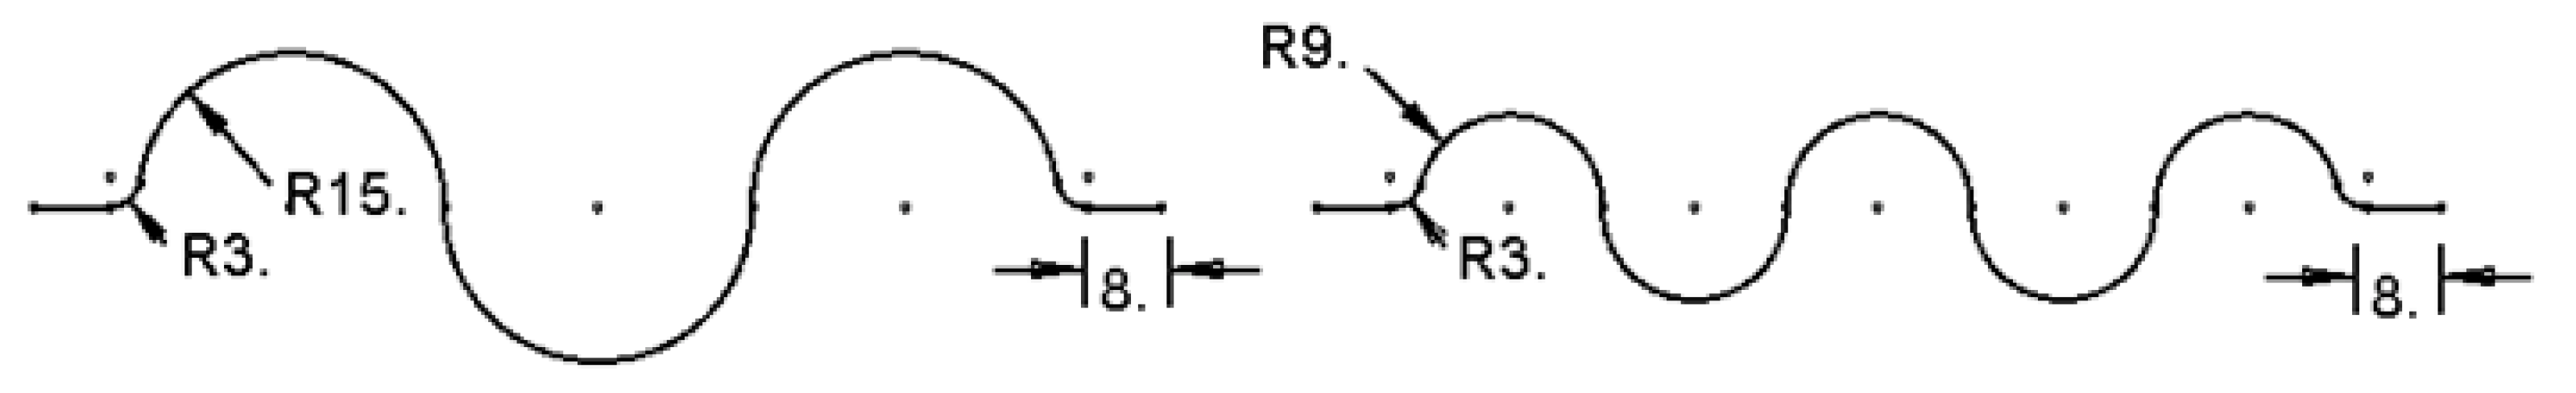
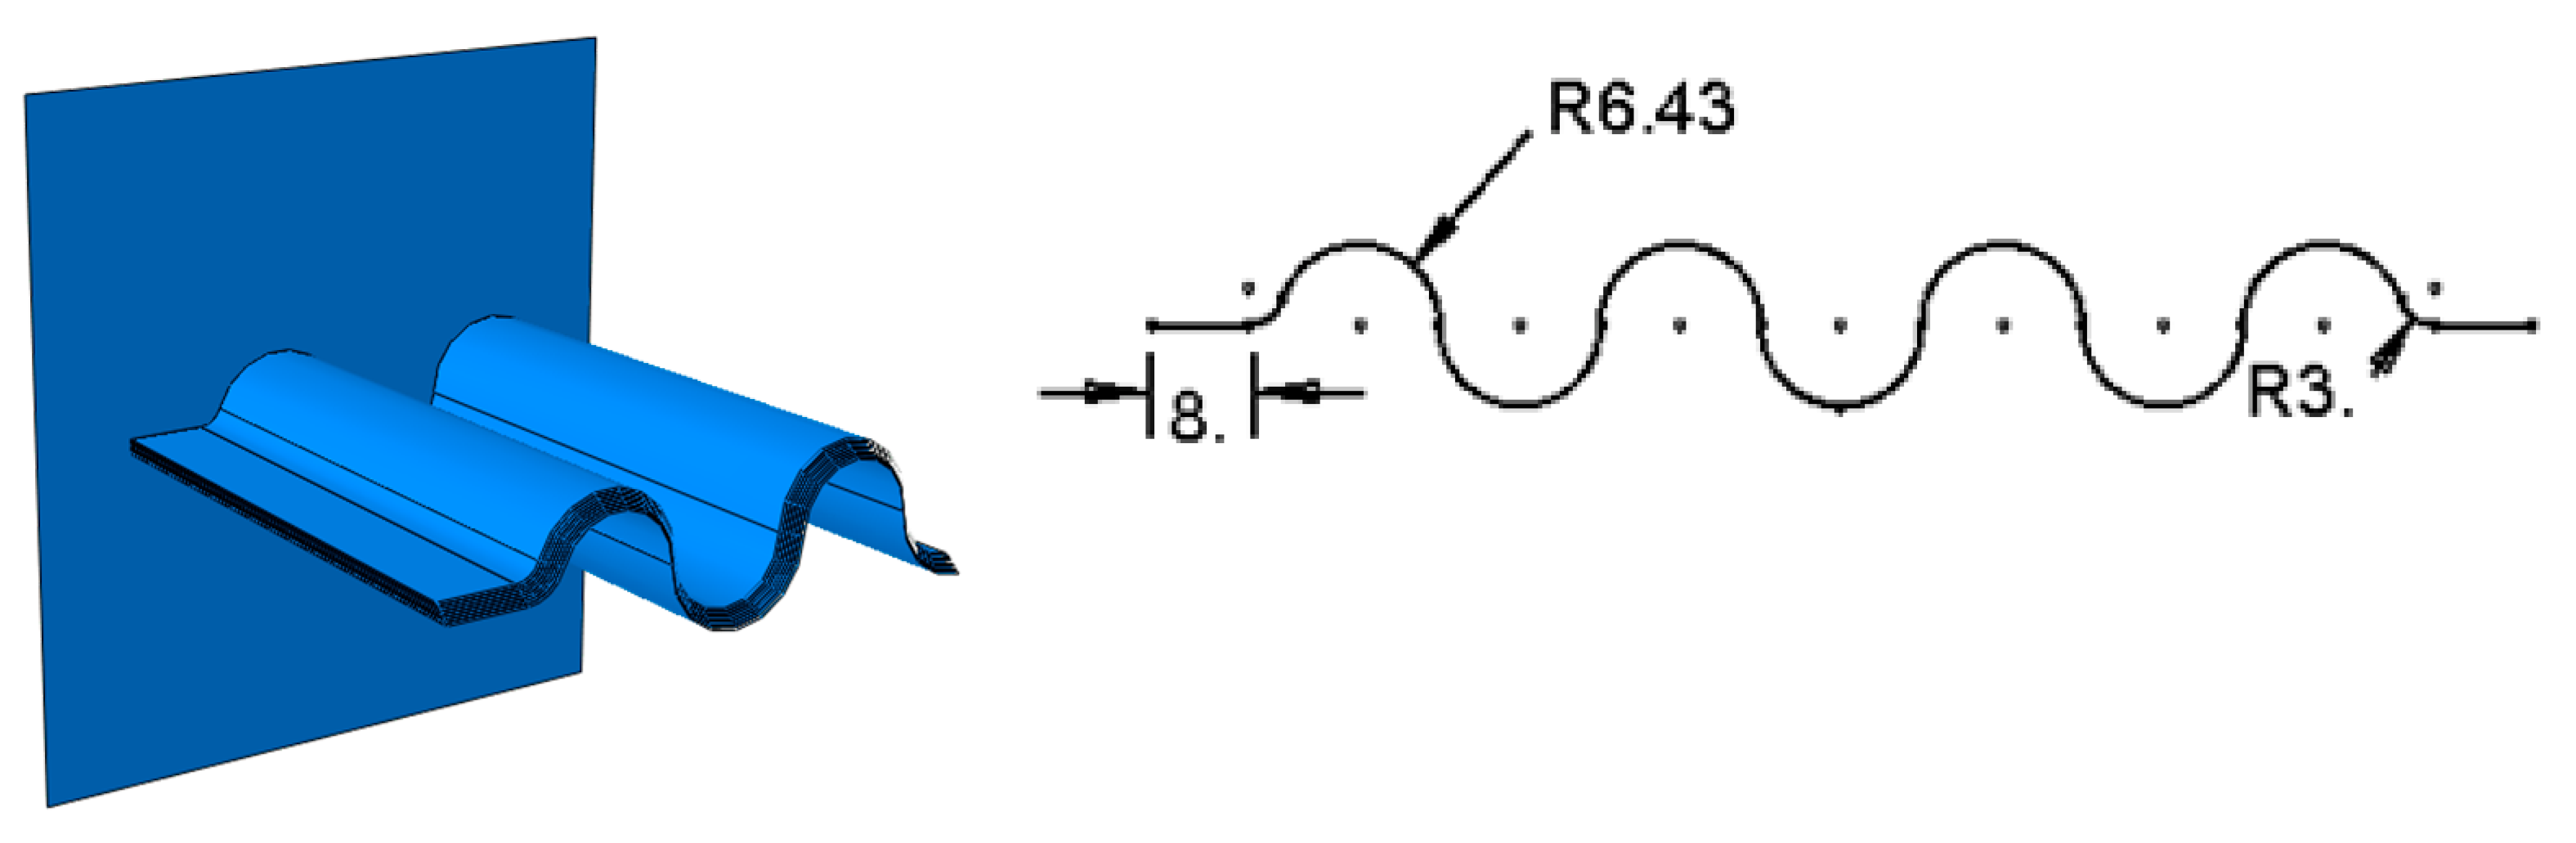
2.3. Sinusoidal Structures
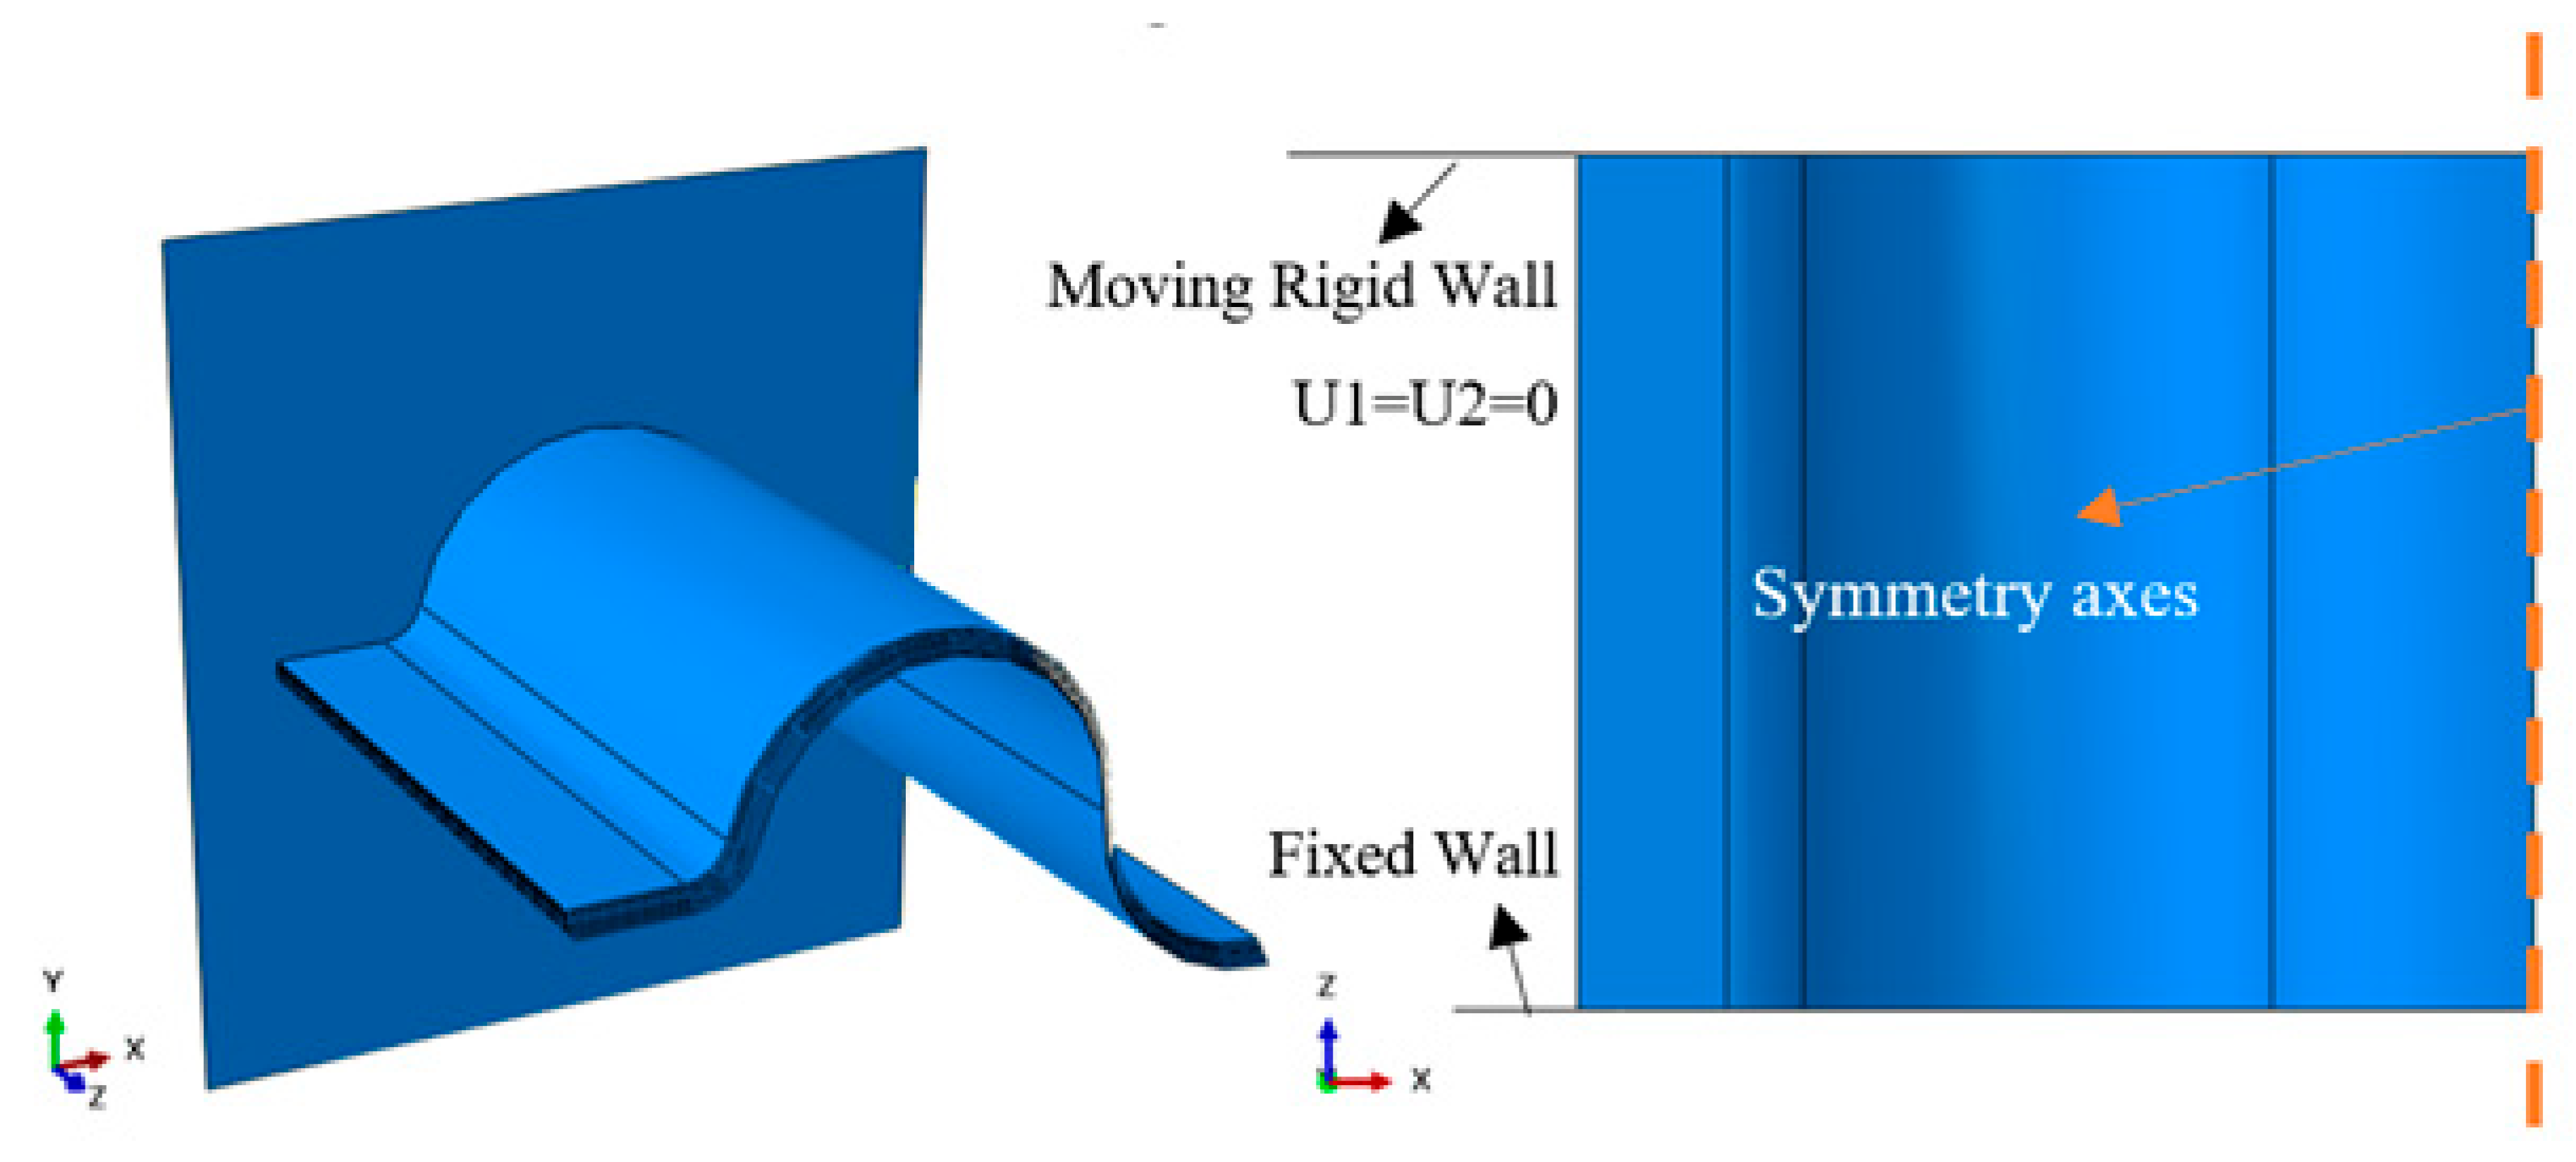
3. Numerical Model
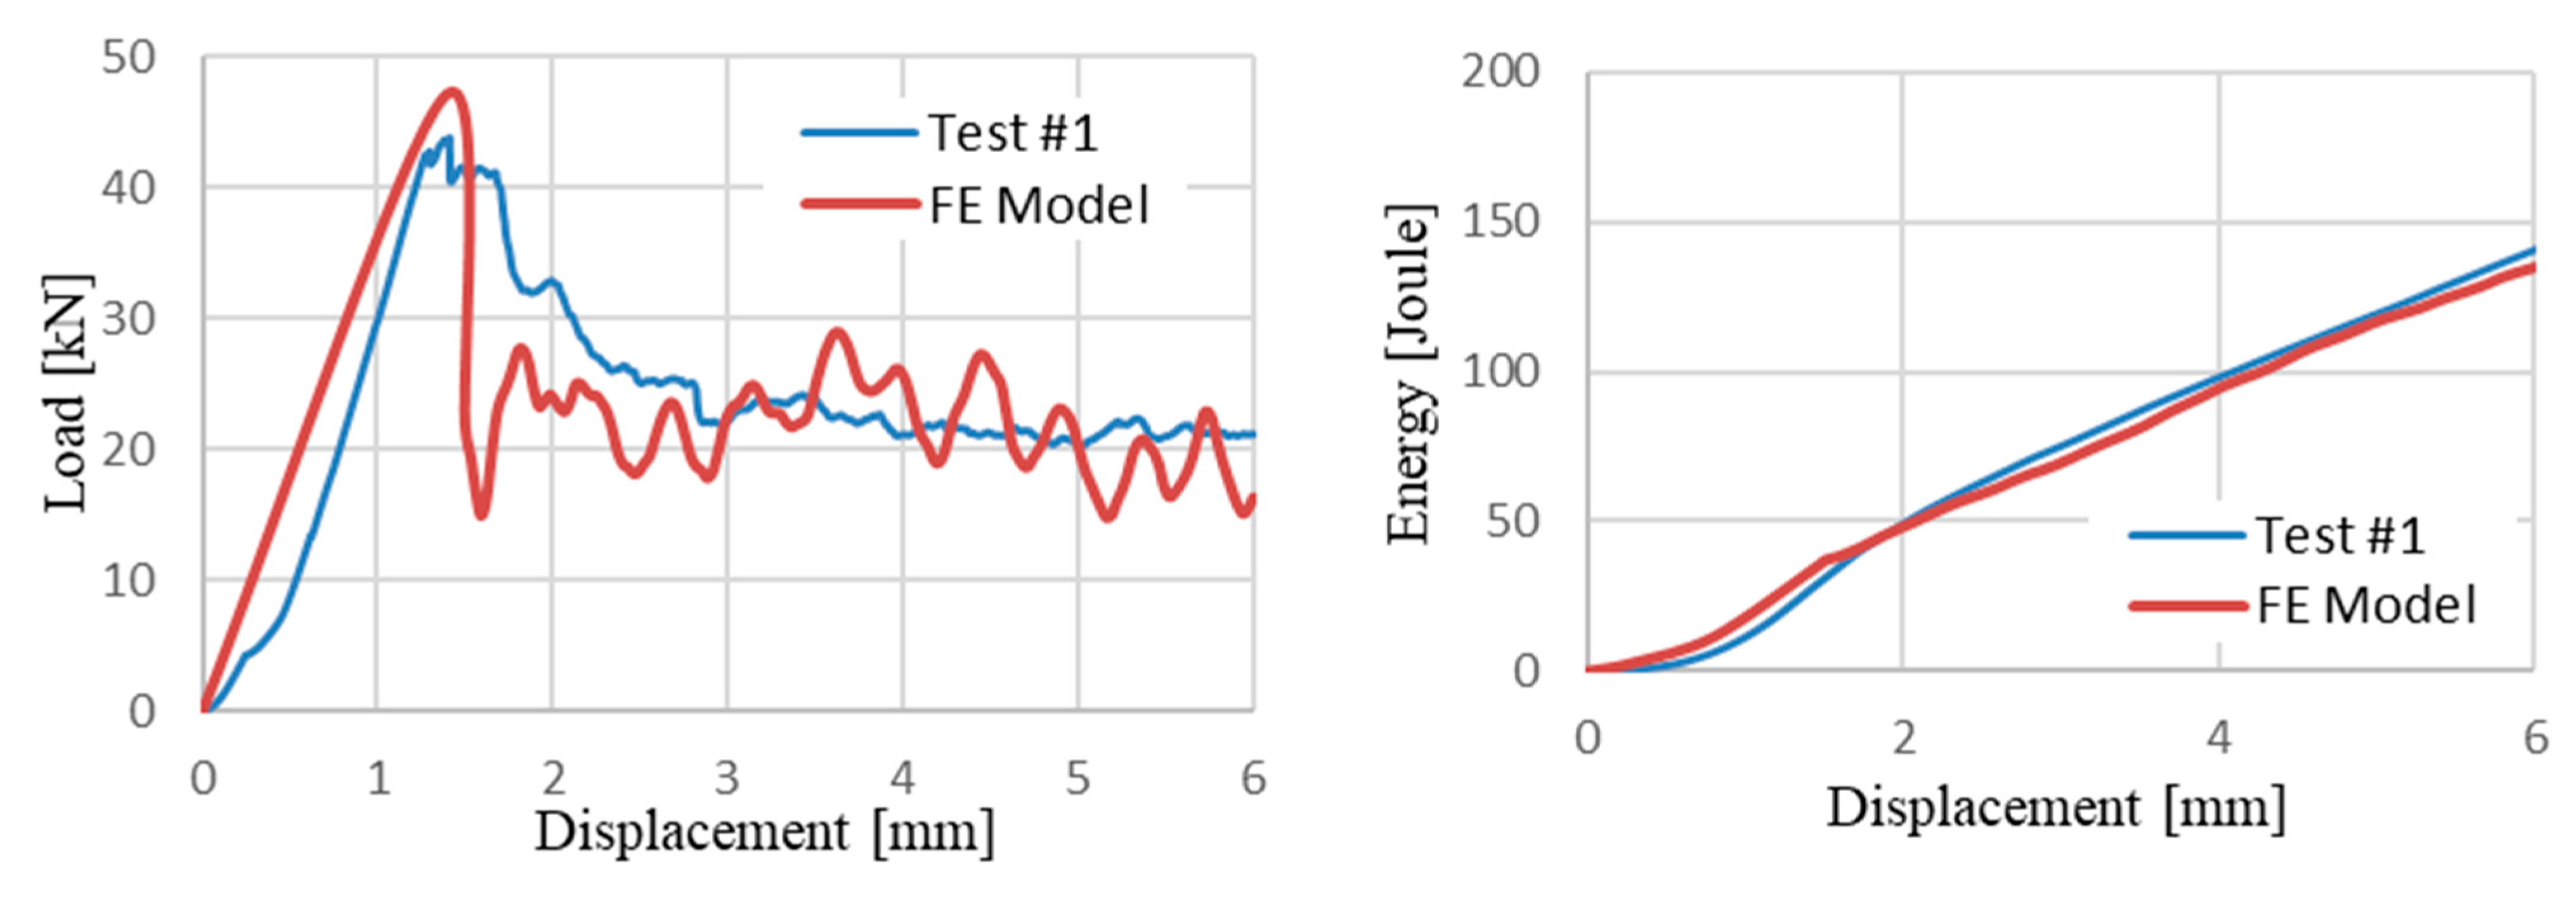
3.1. Validation
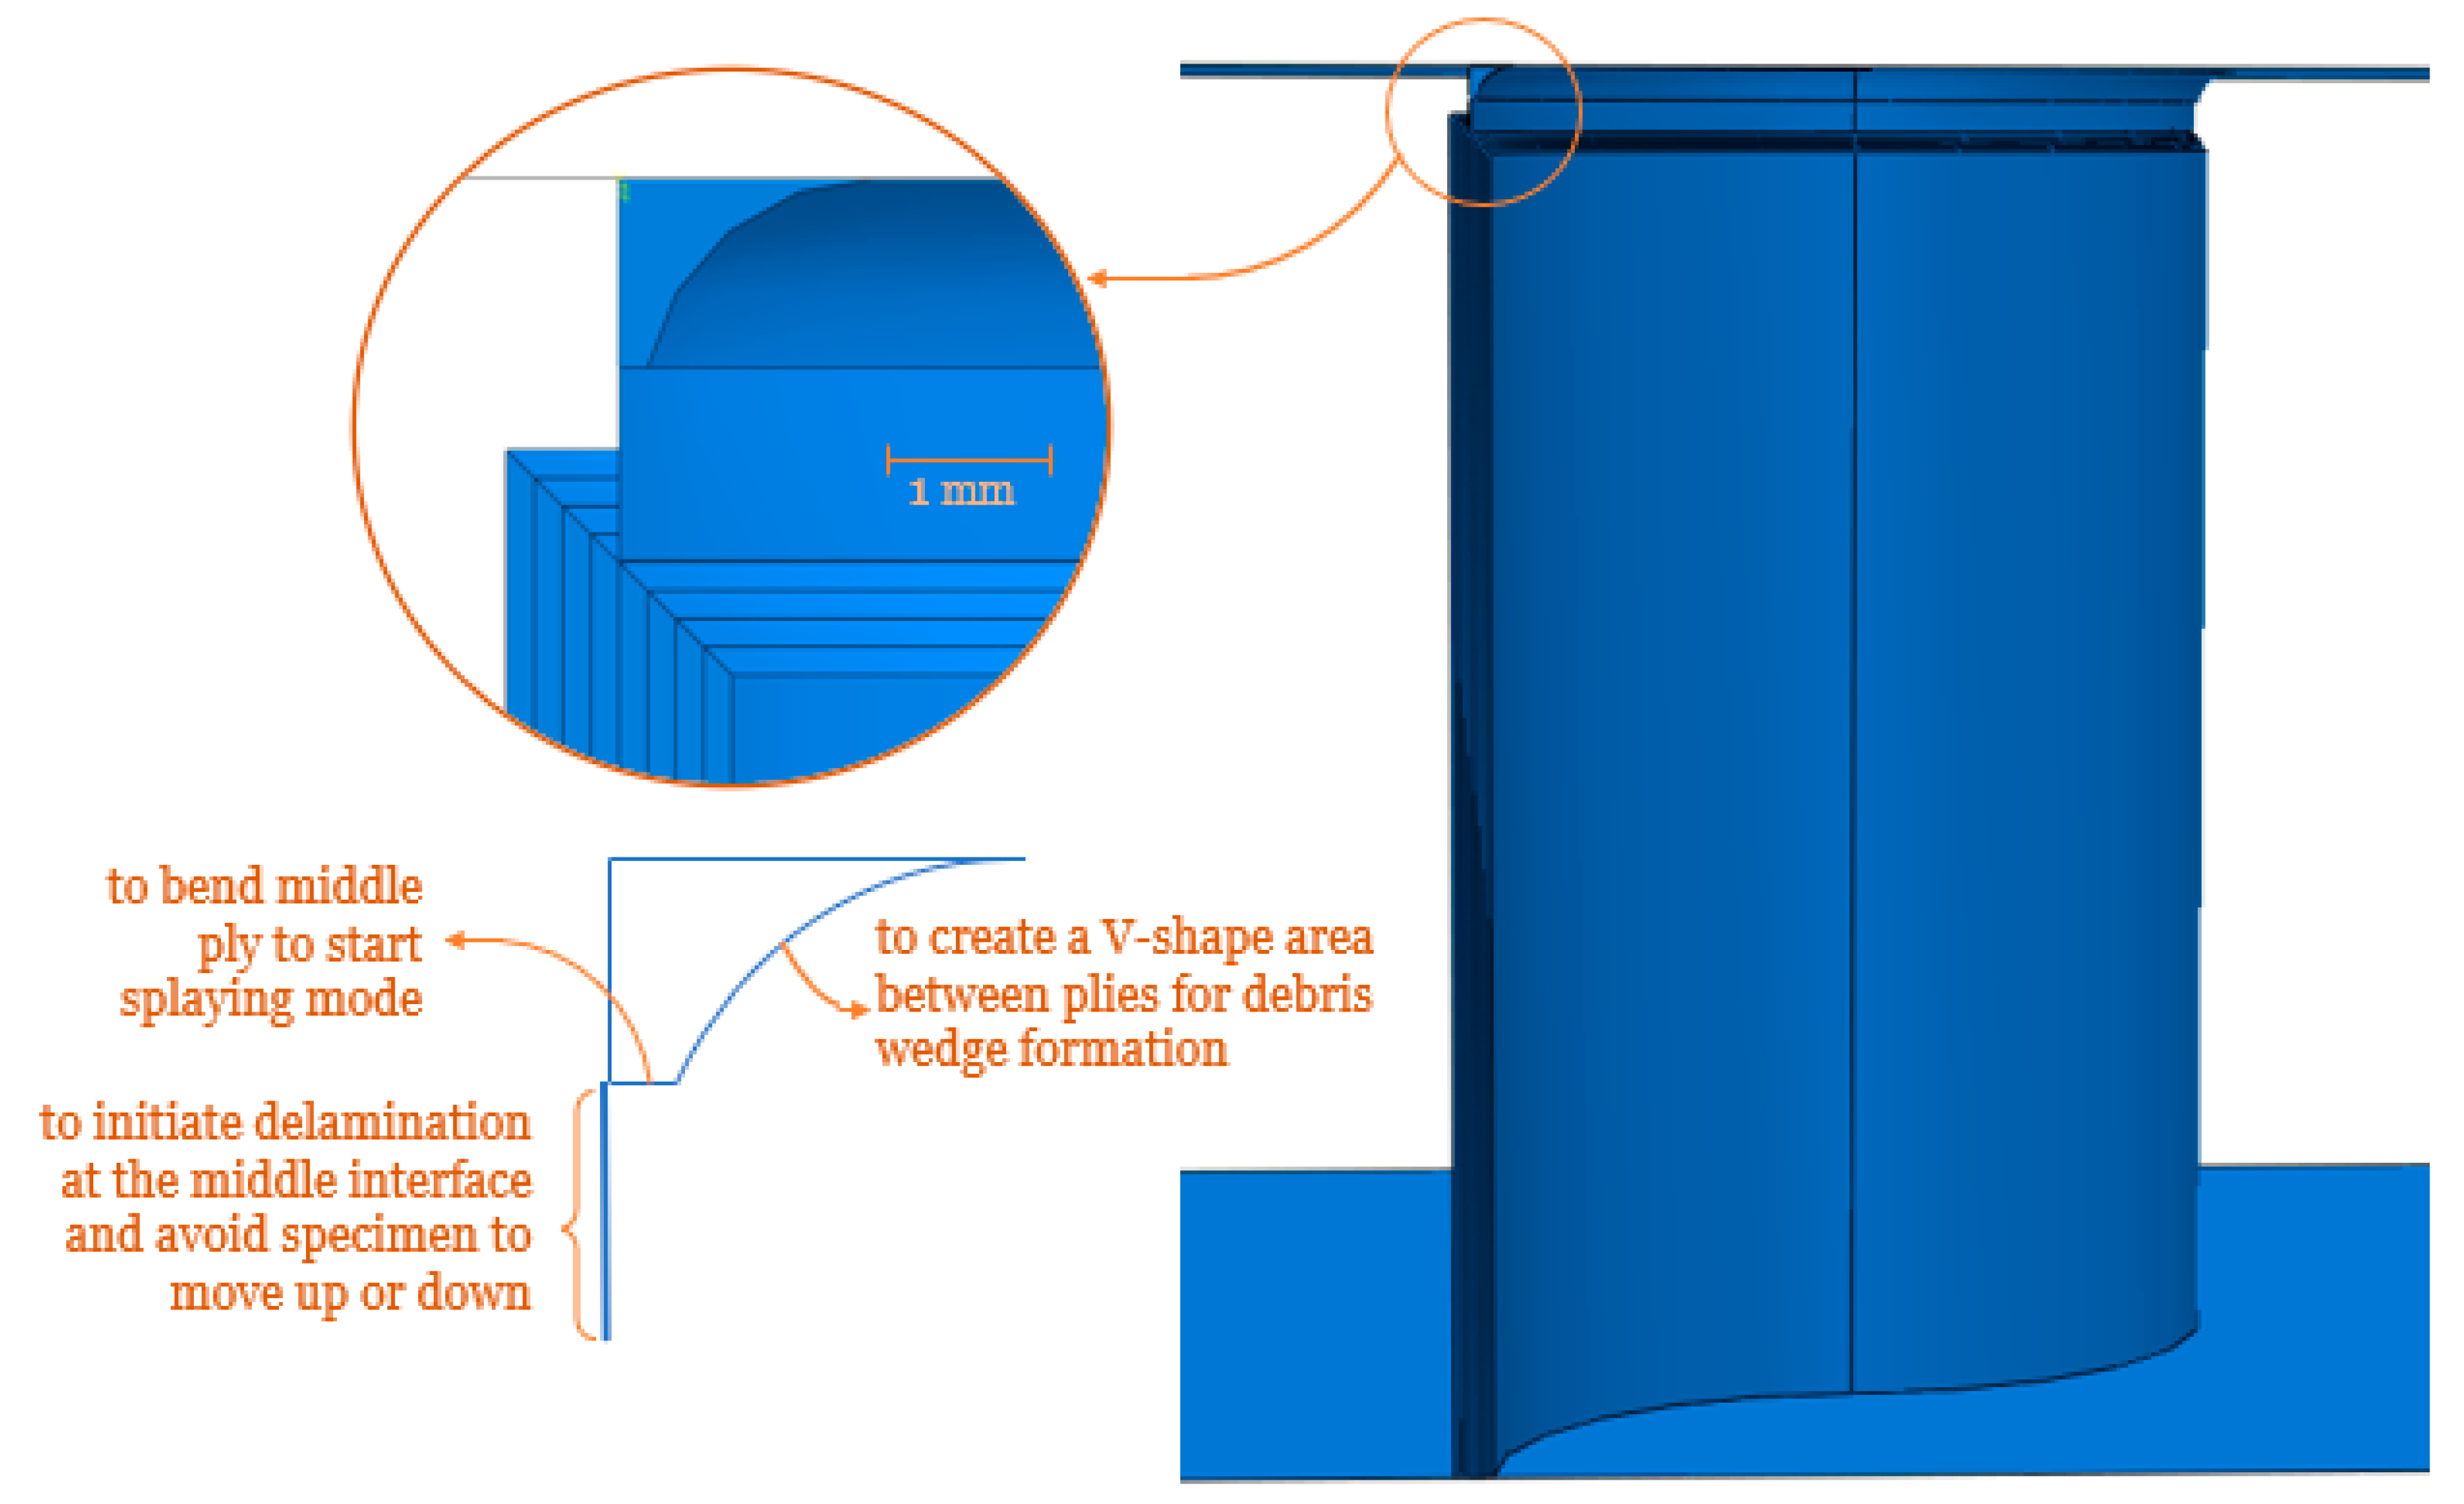
3.2. The Idea of Artificial Plug-Initiator
3.3. Sinusoidal Structure with 7 Curvatures
4. Results and Discussion
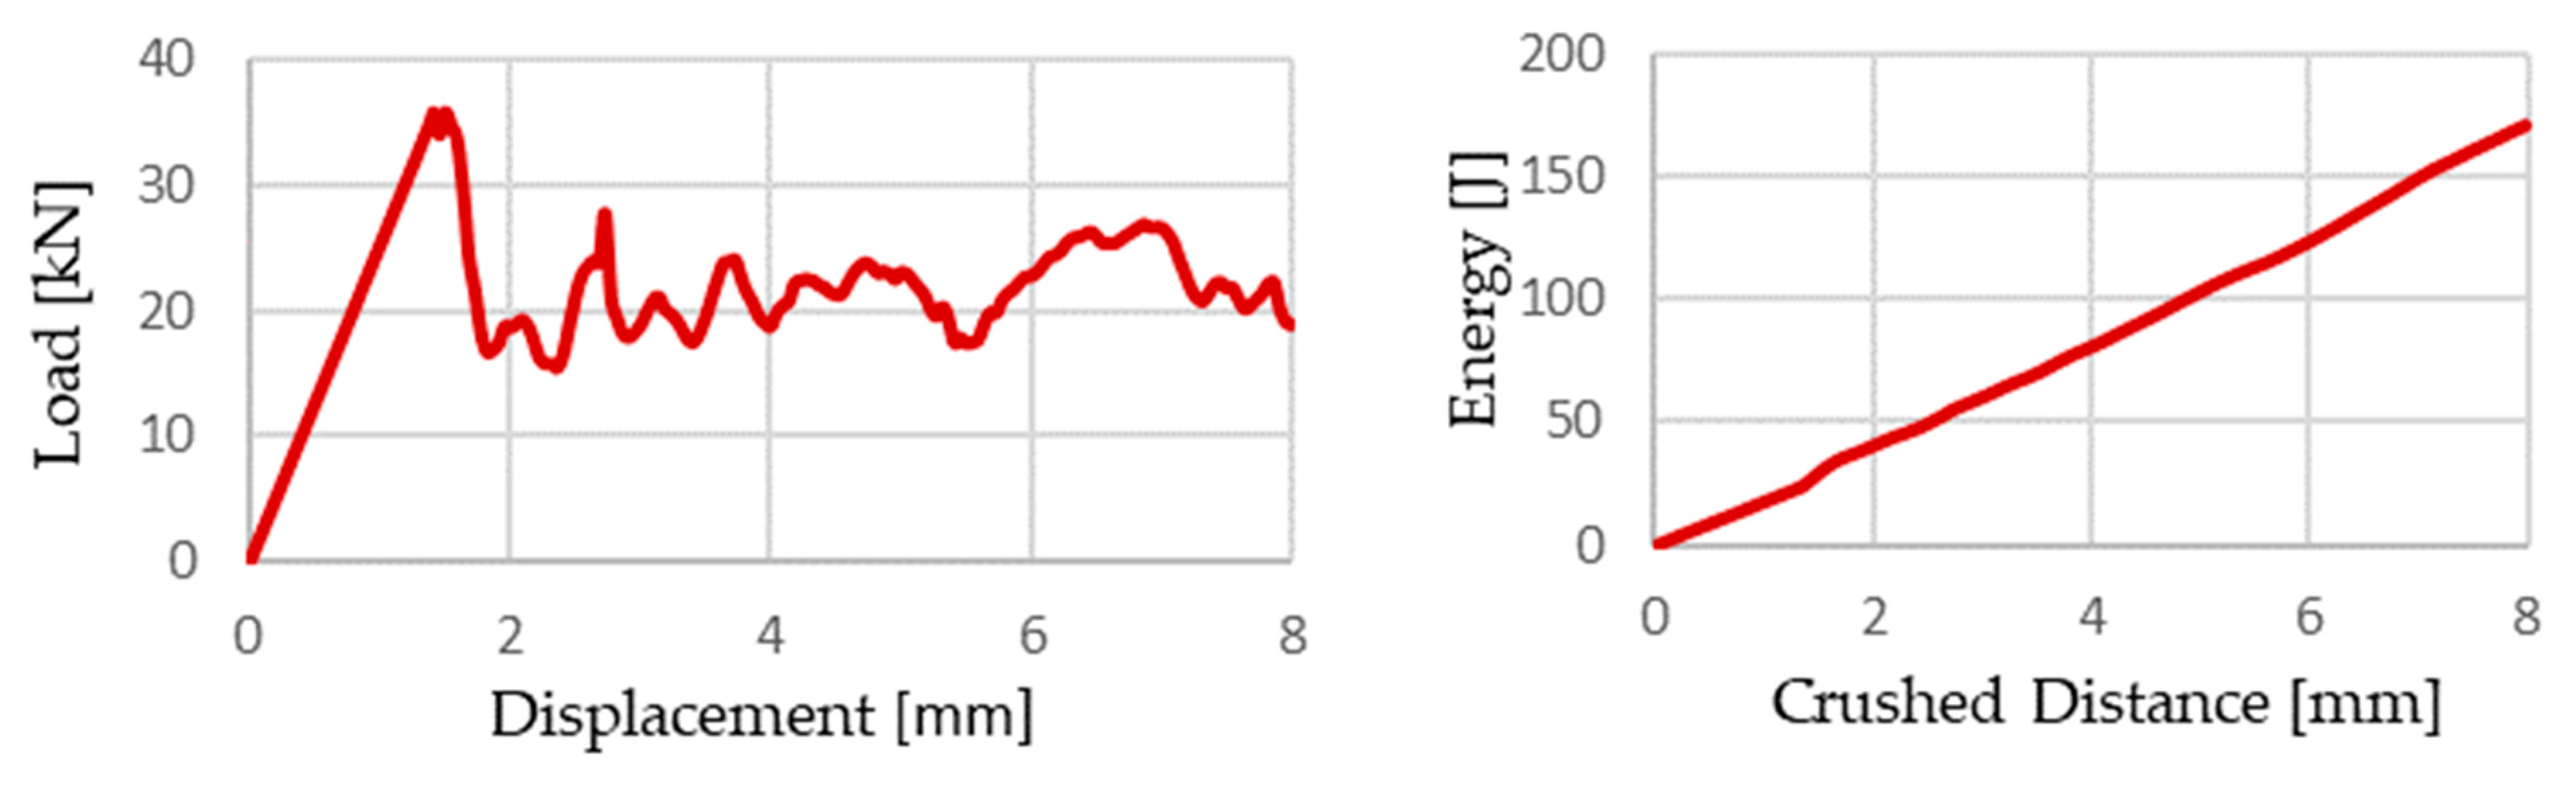
4.1. Experimental Results of Flat Plate
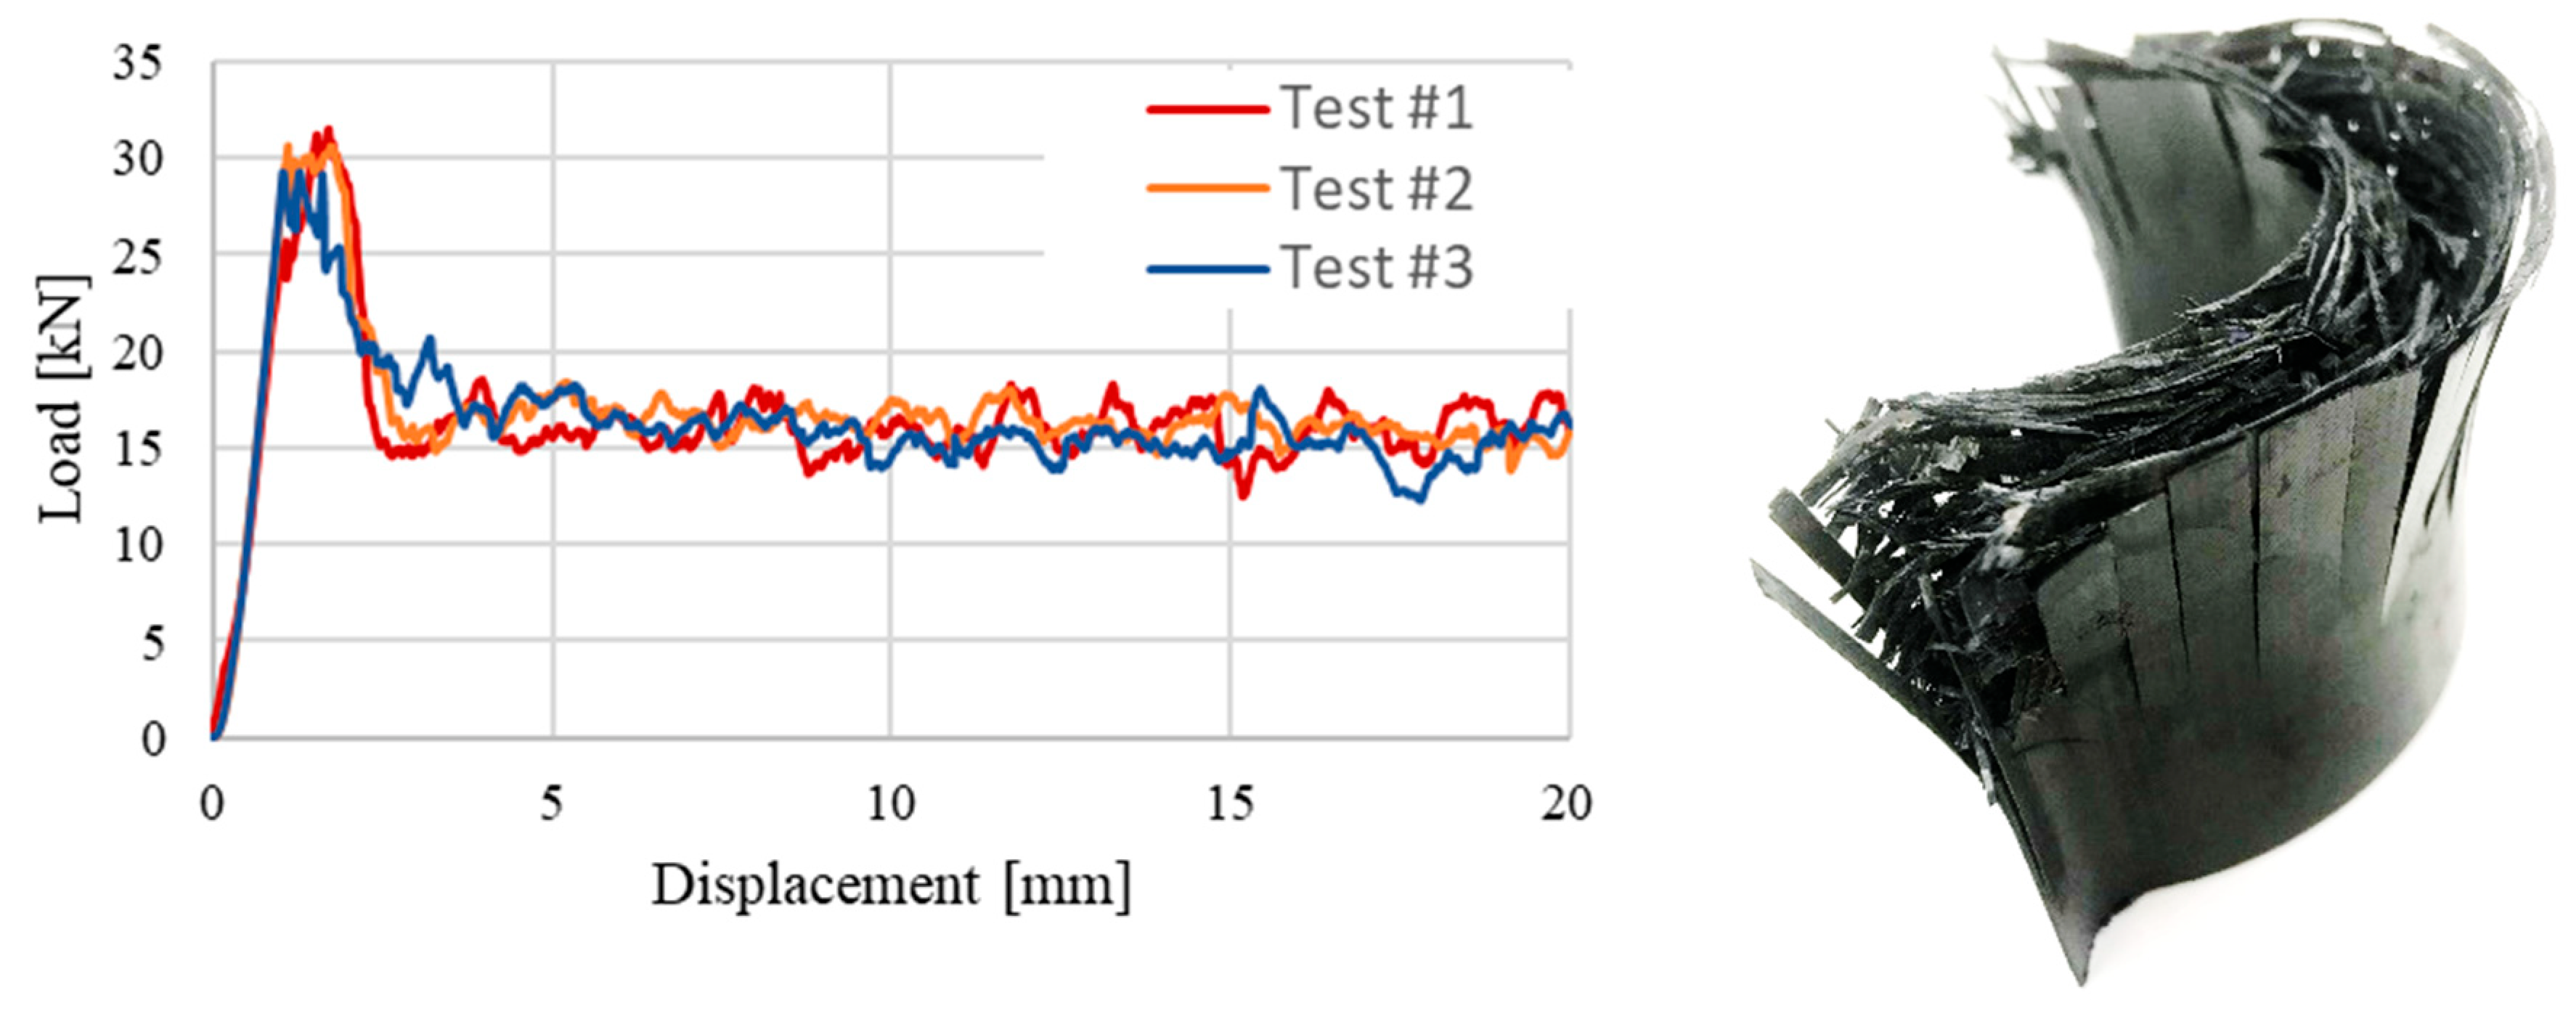
4.2. Experimental Results of Semi-Circle Specimens
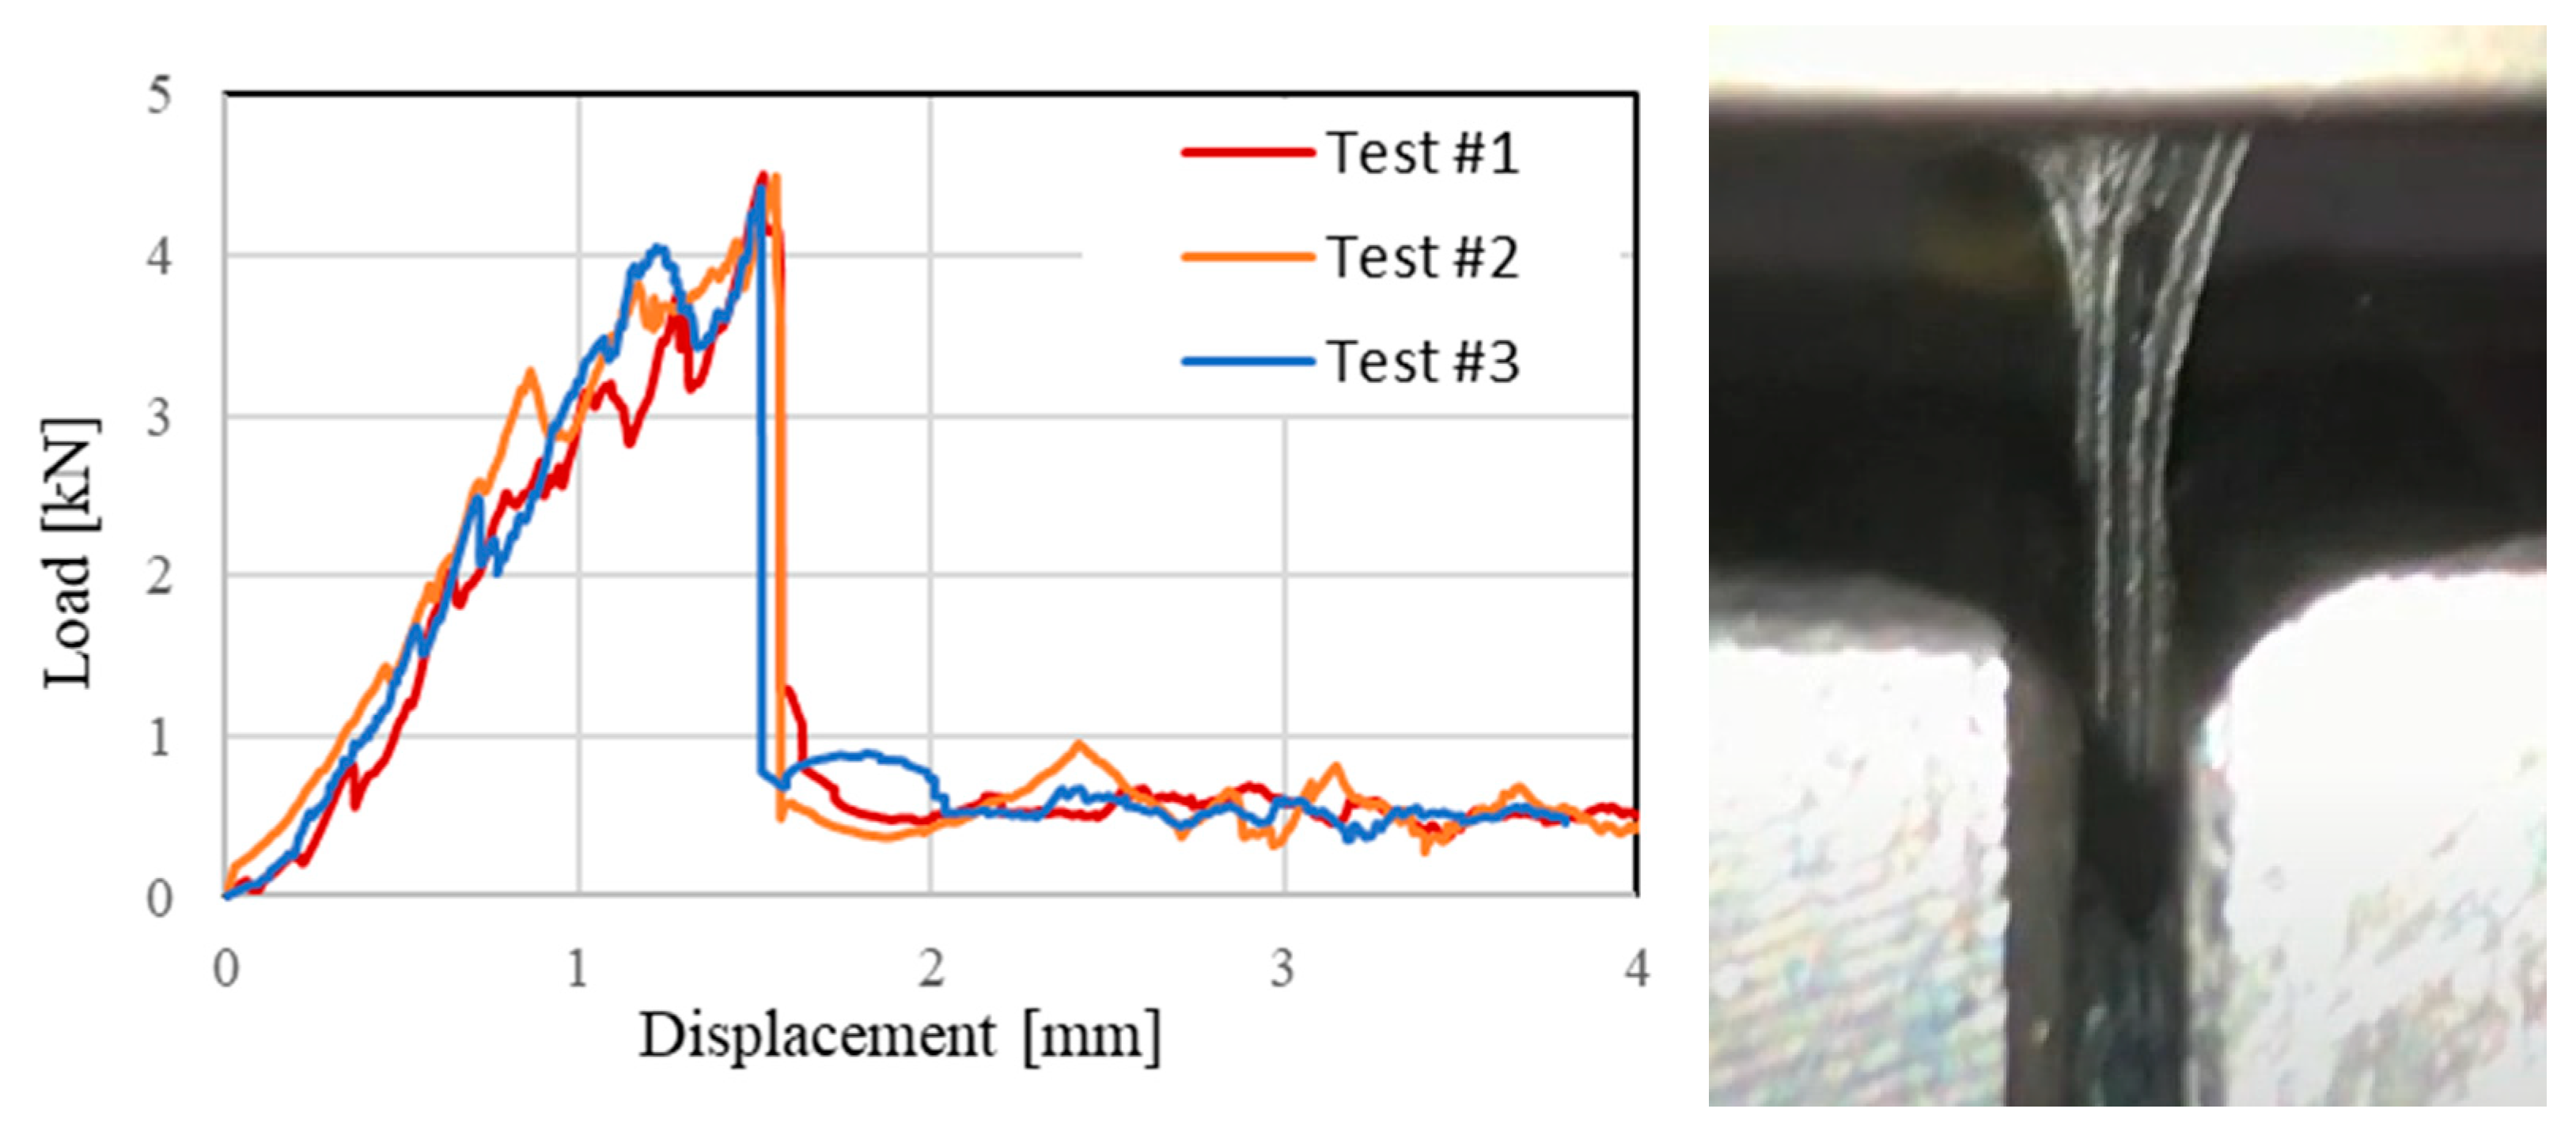
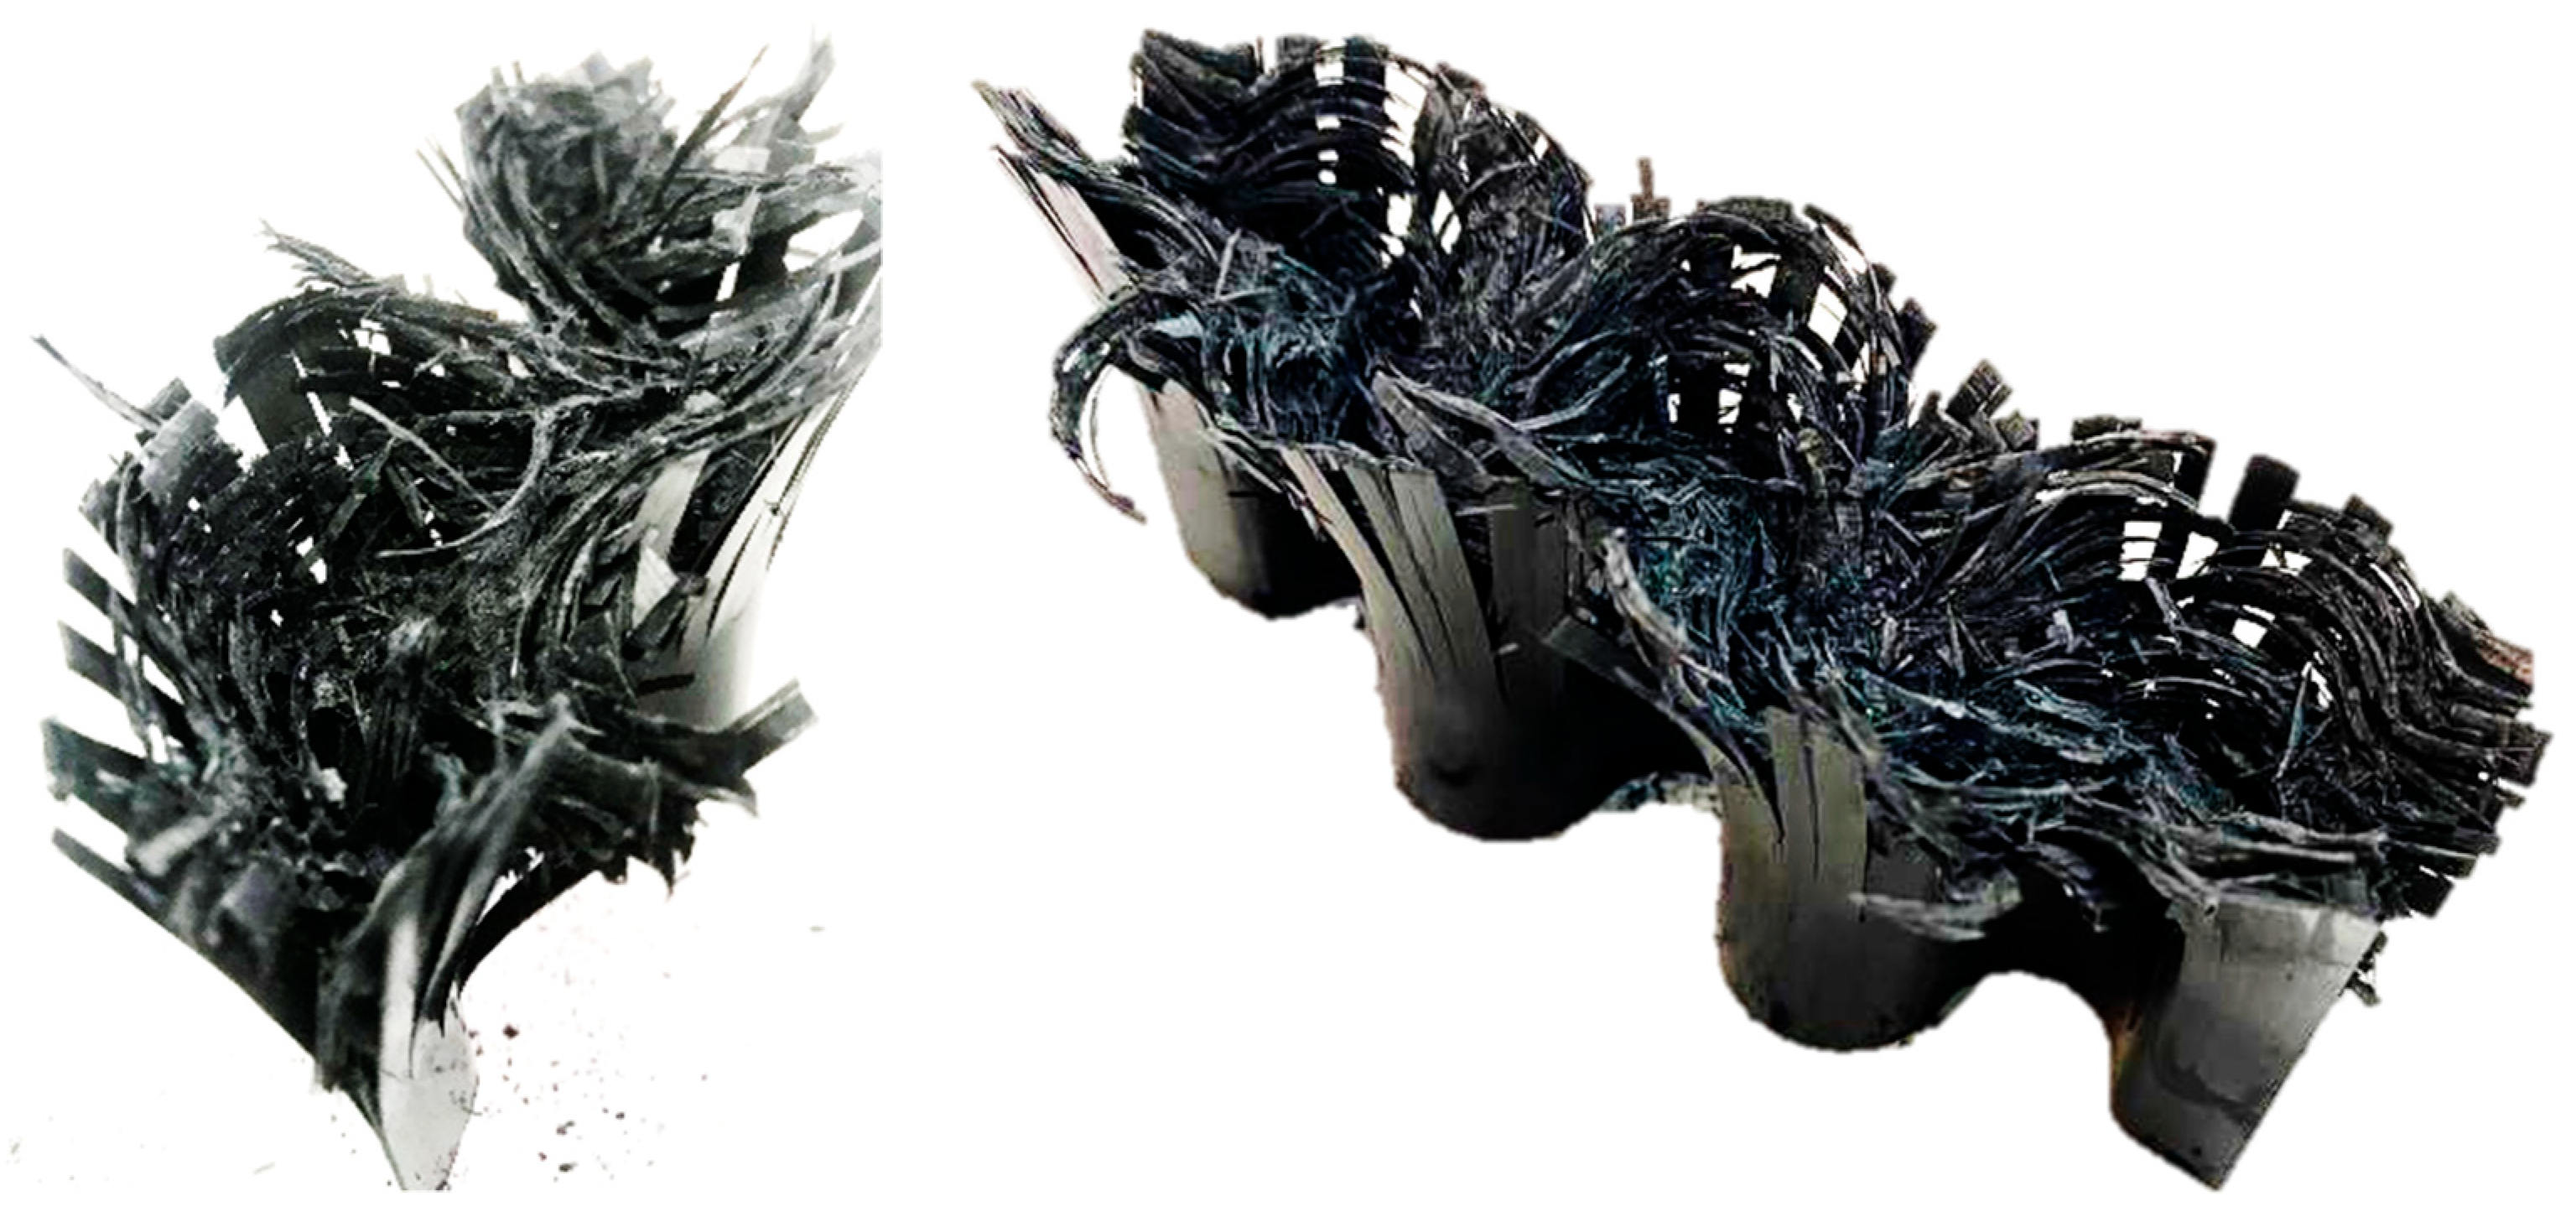
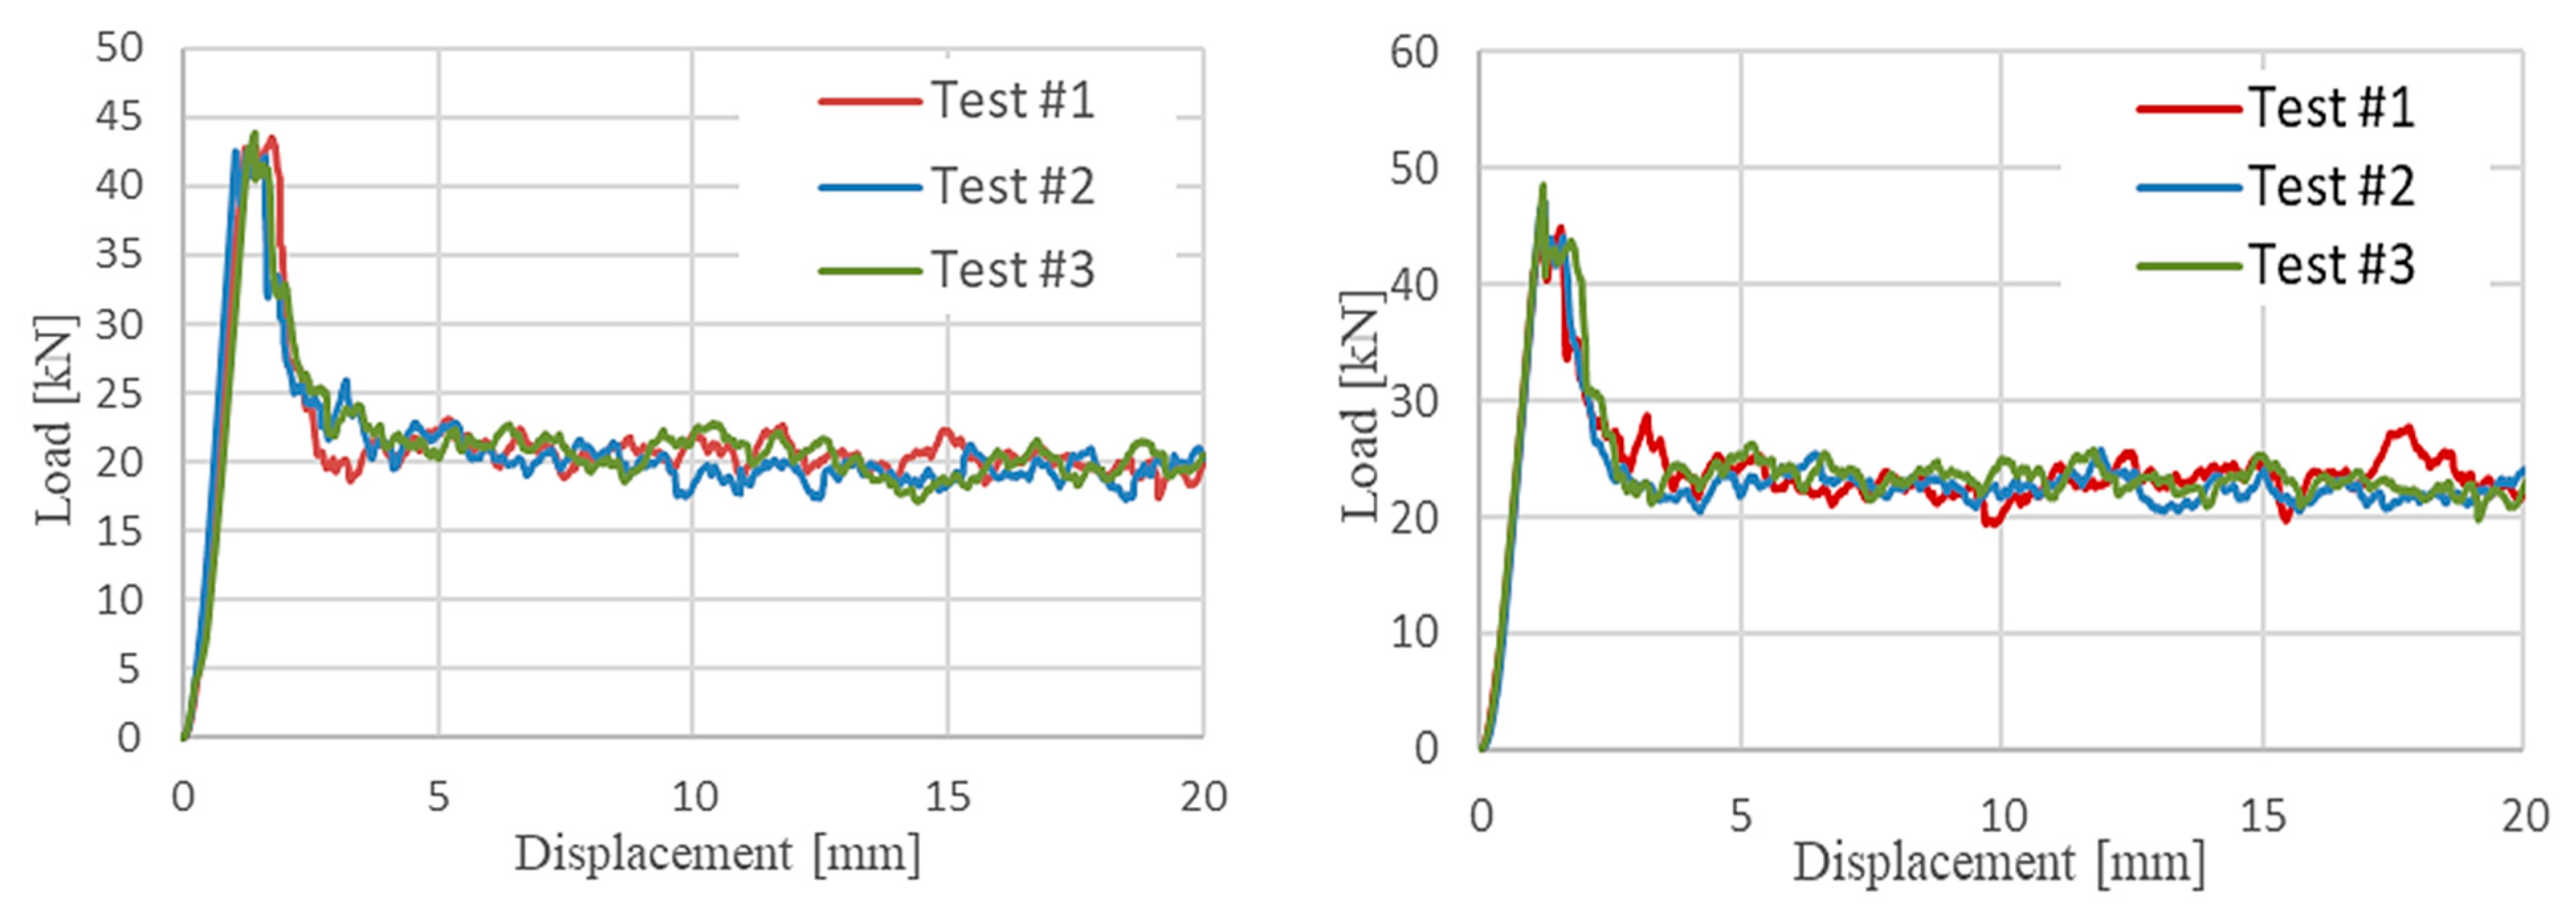
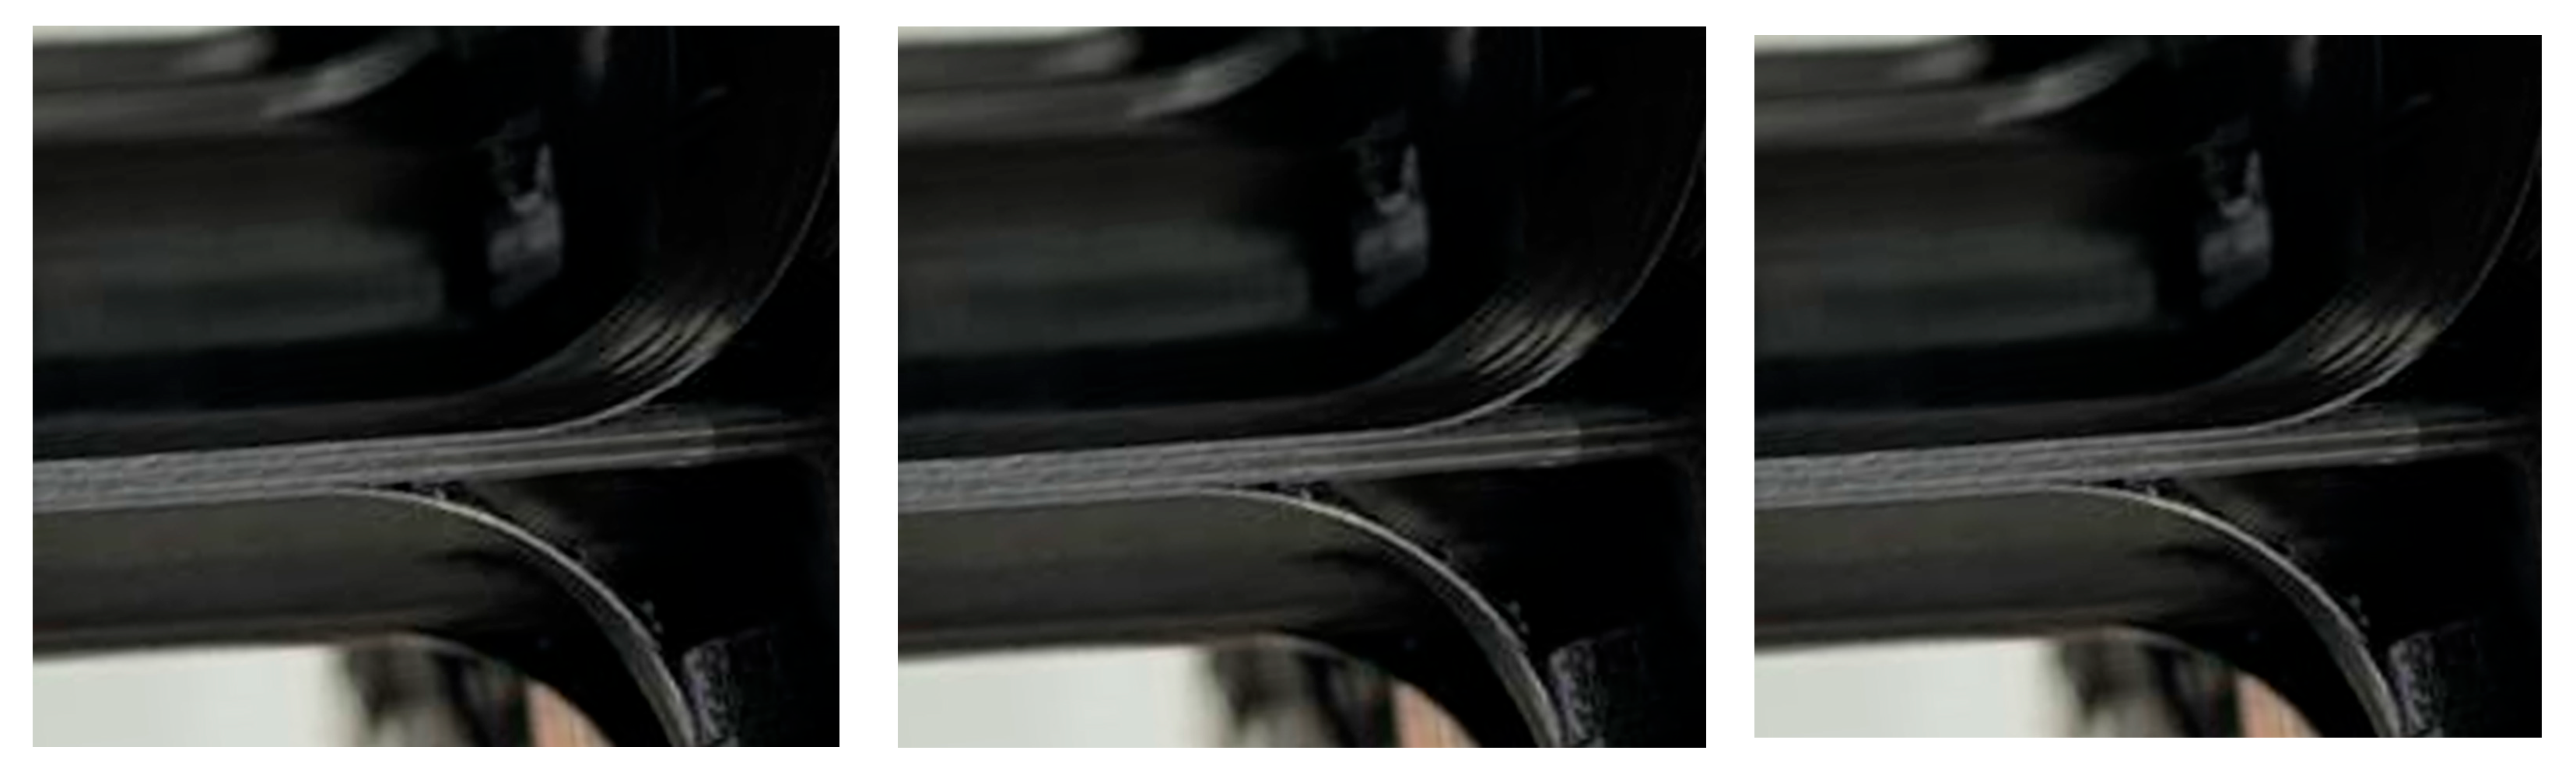
4.3. Experimental Results of Sinusoidal Specimens
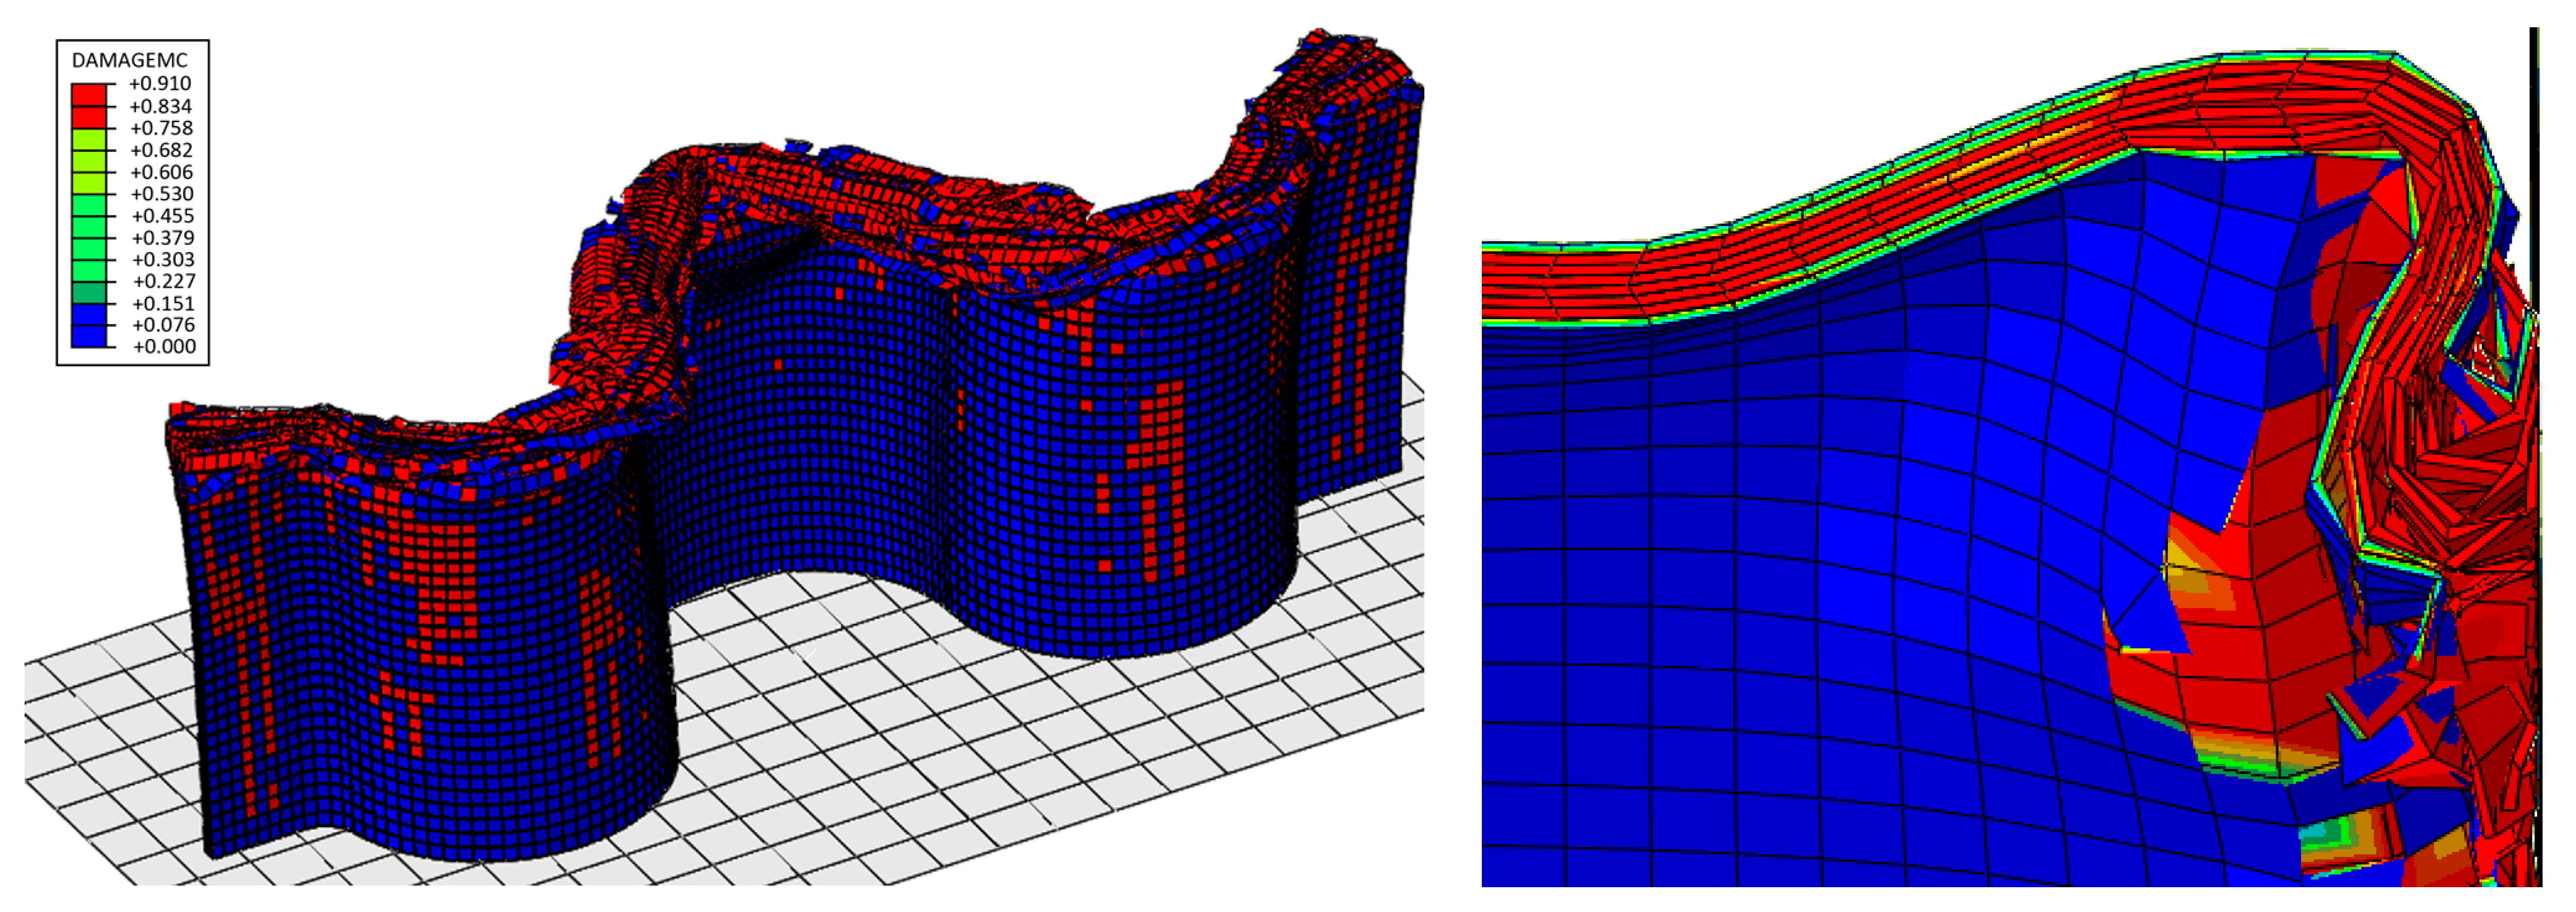
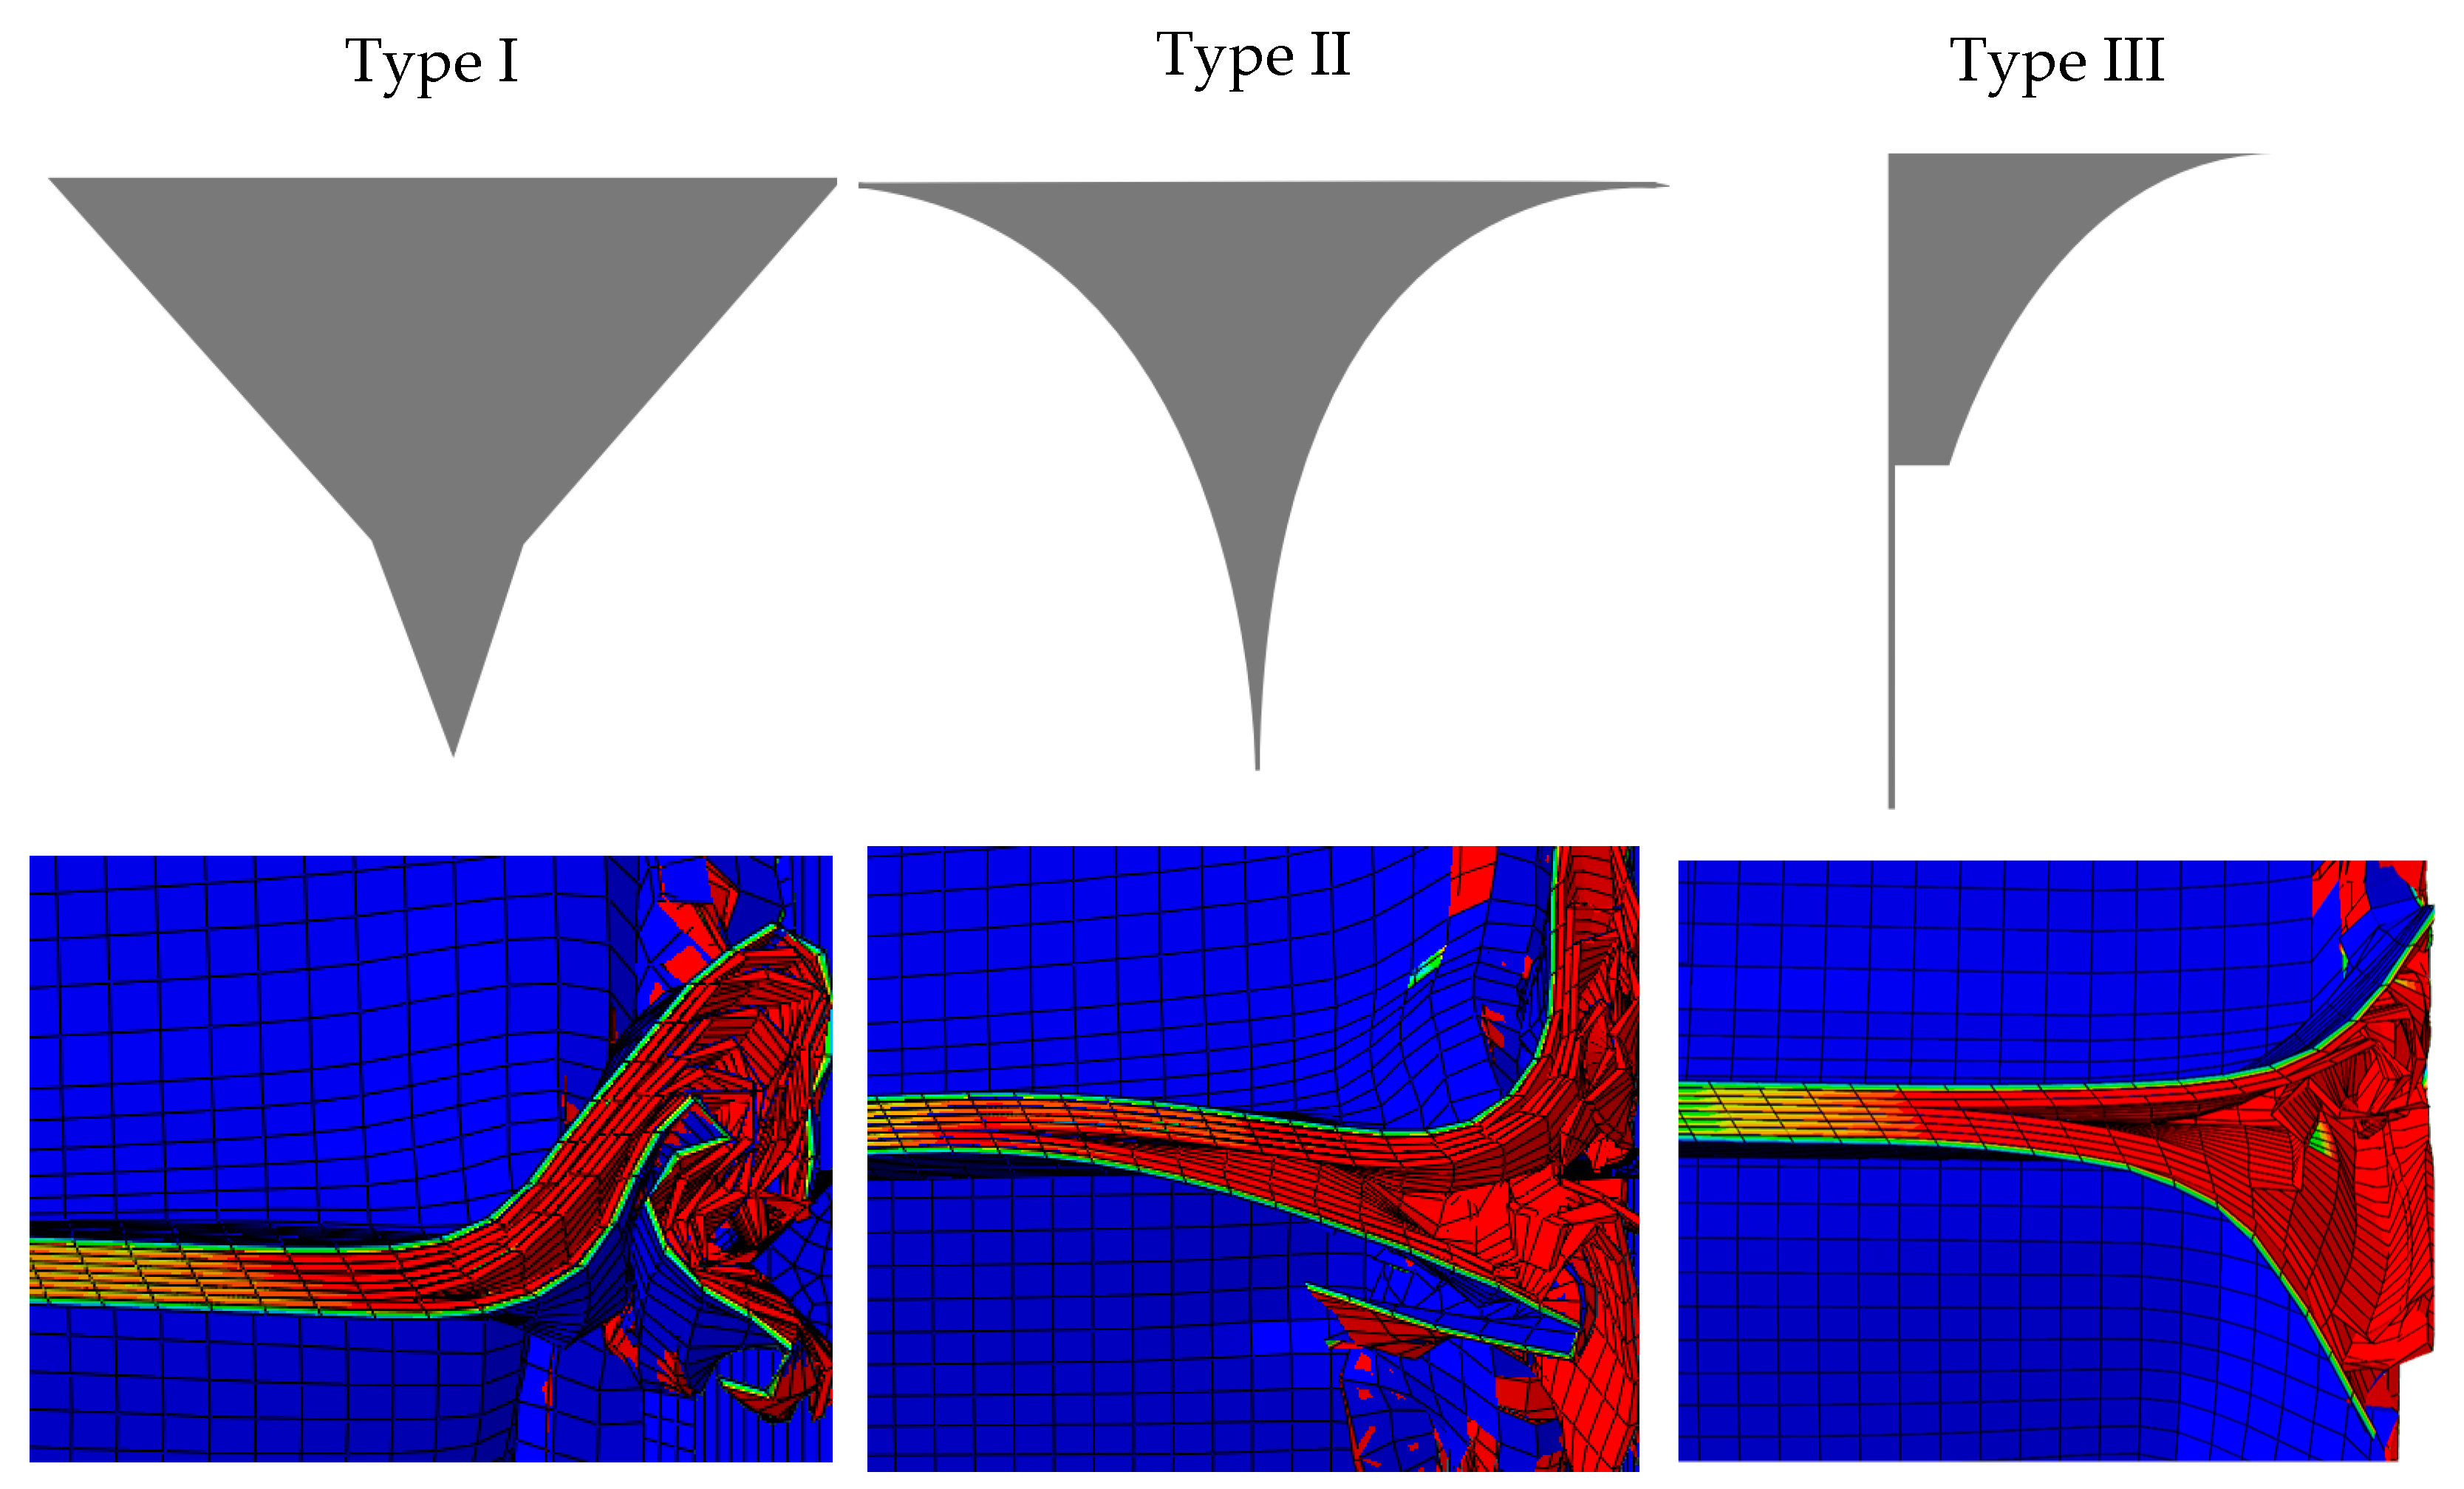
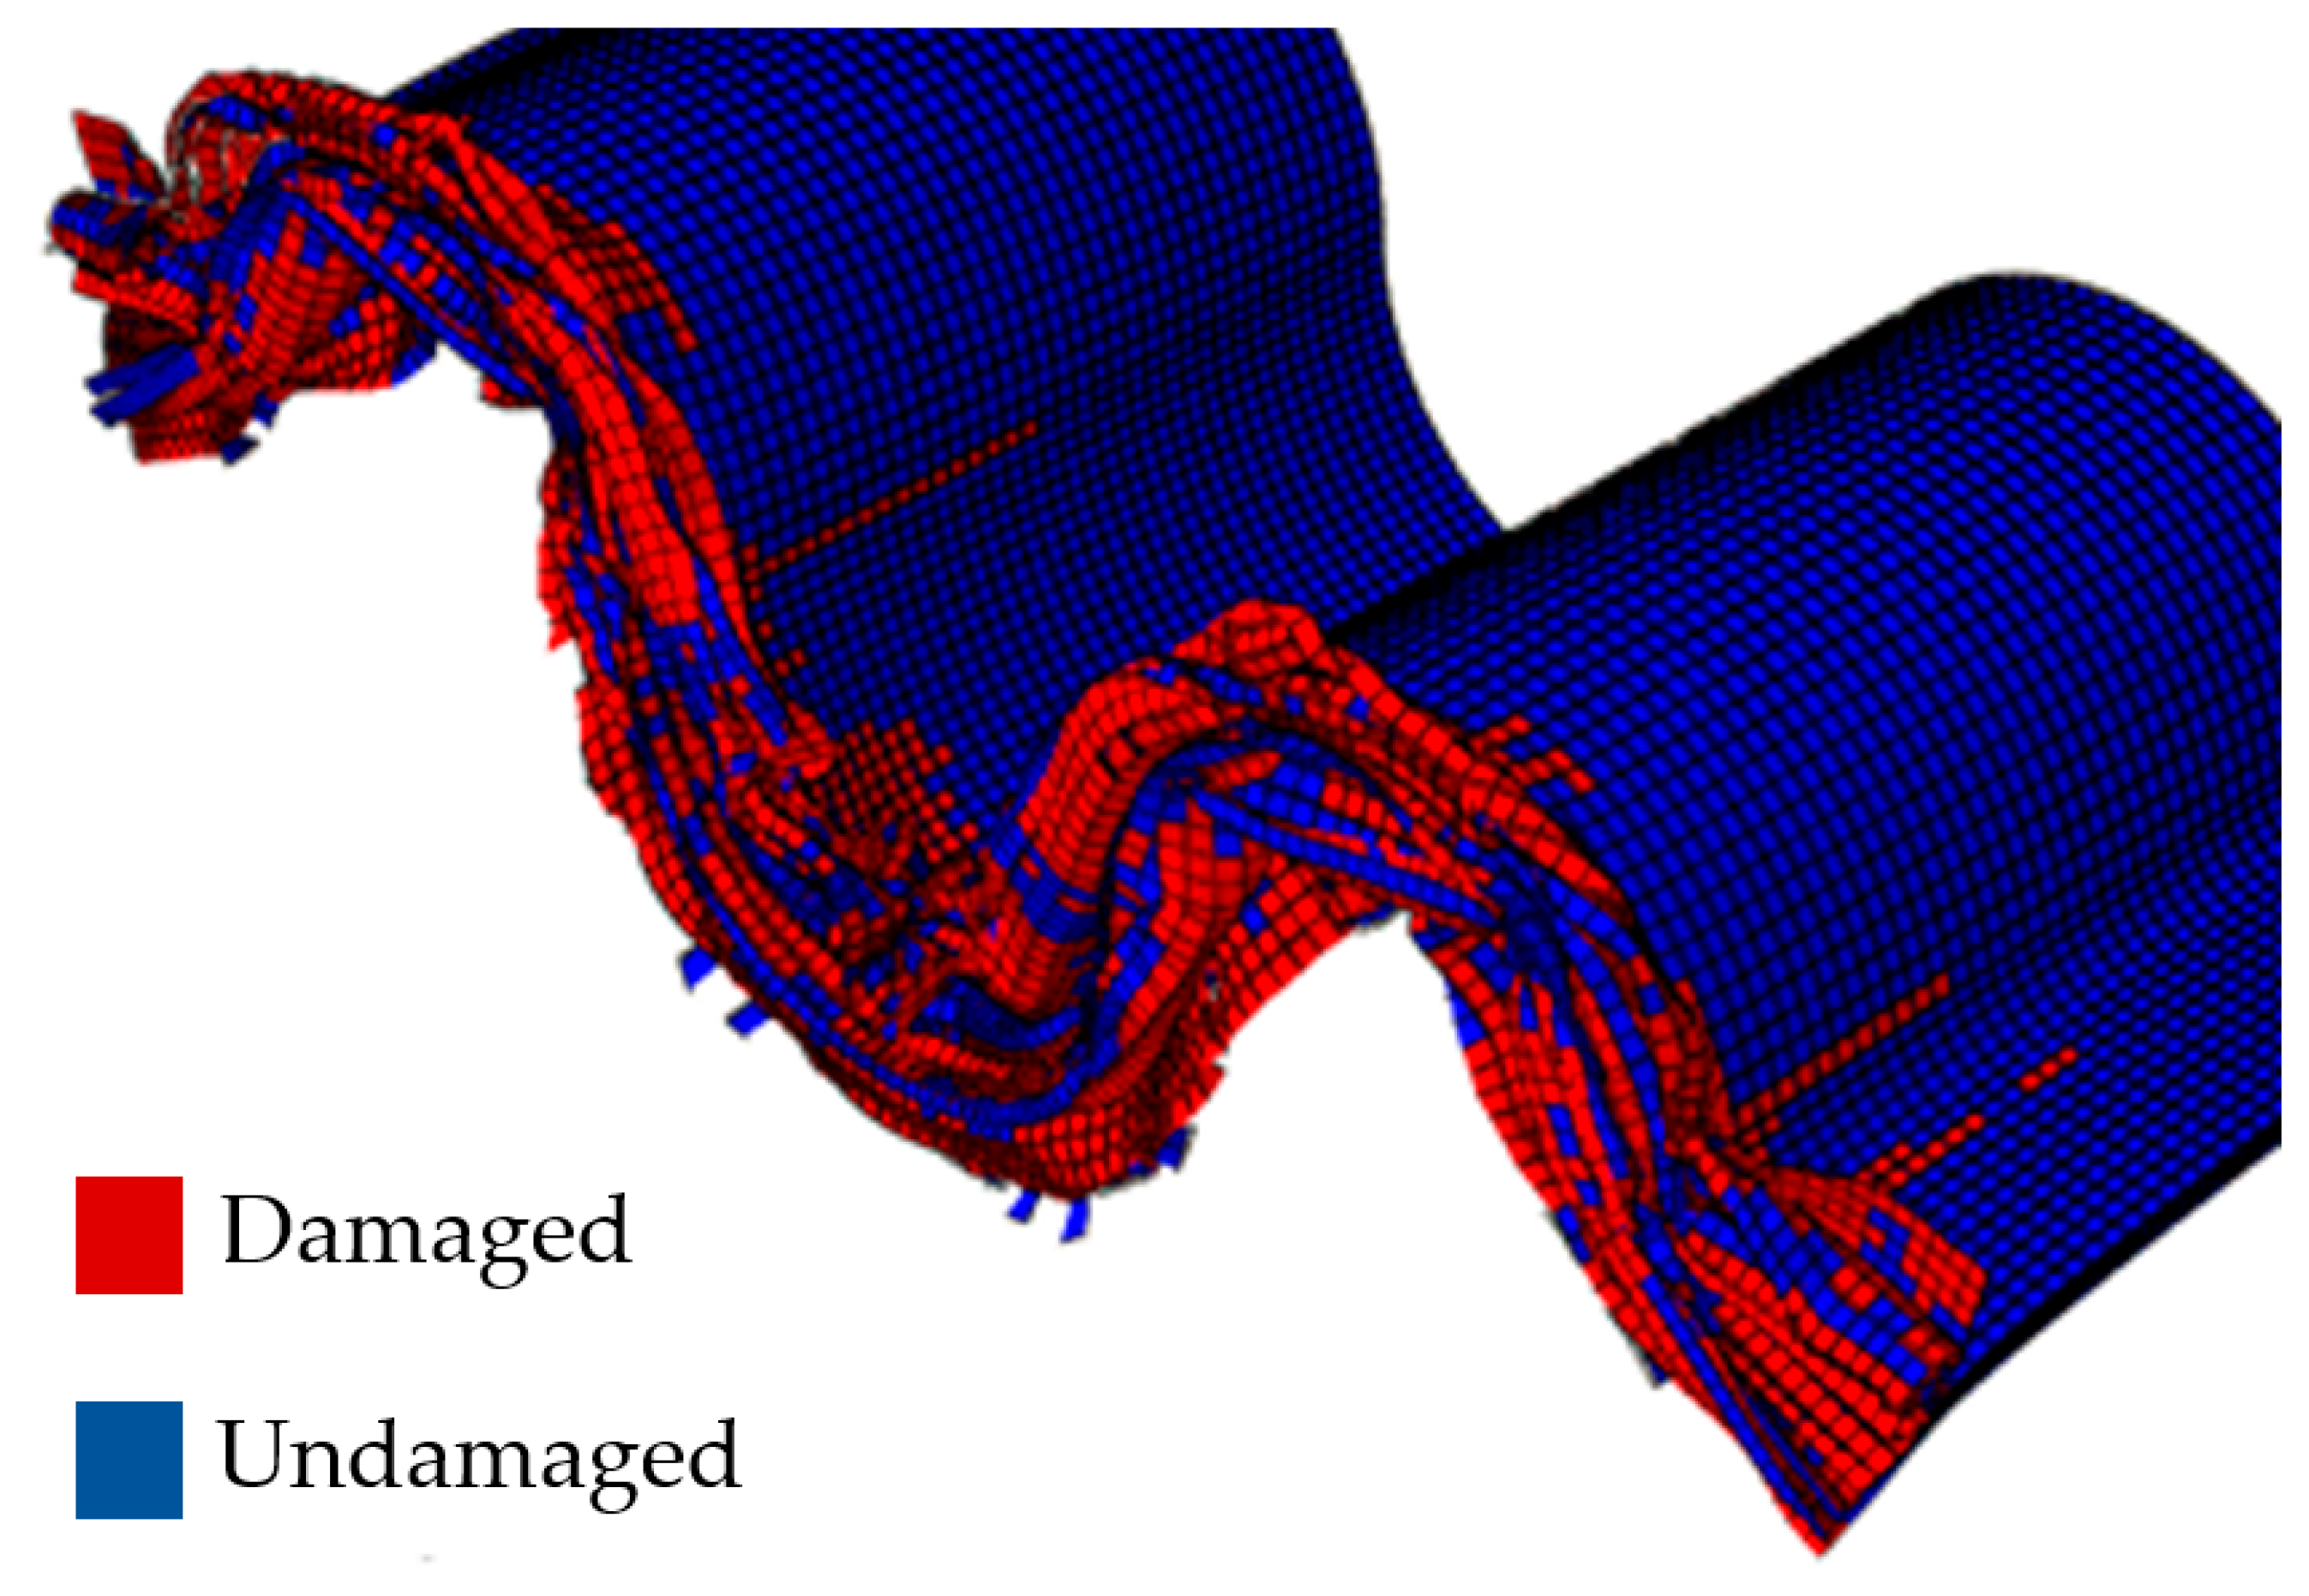
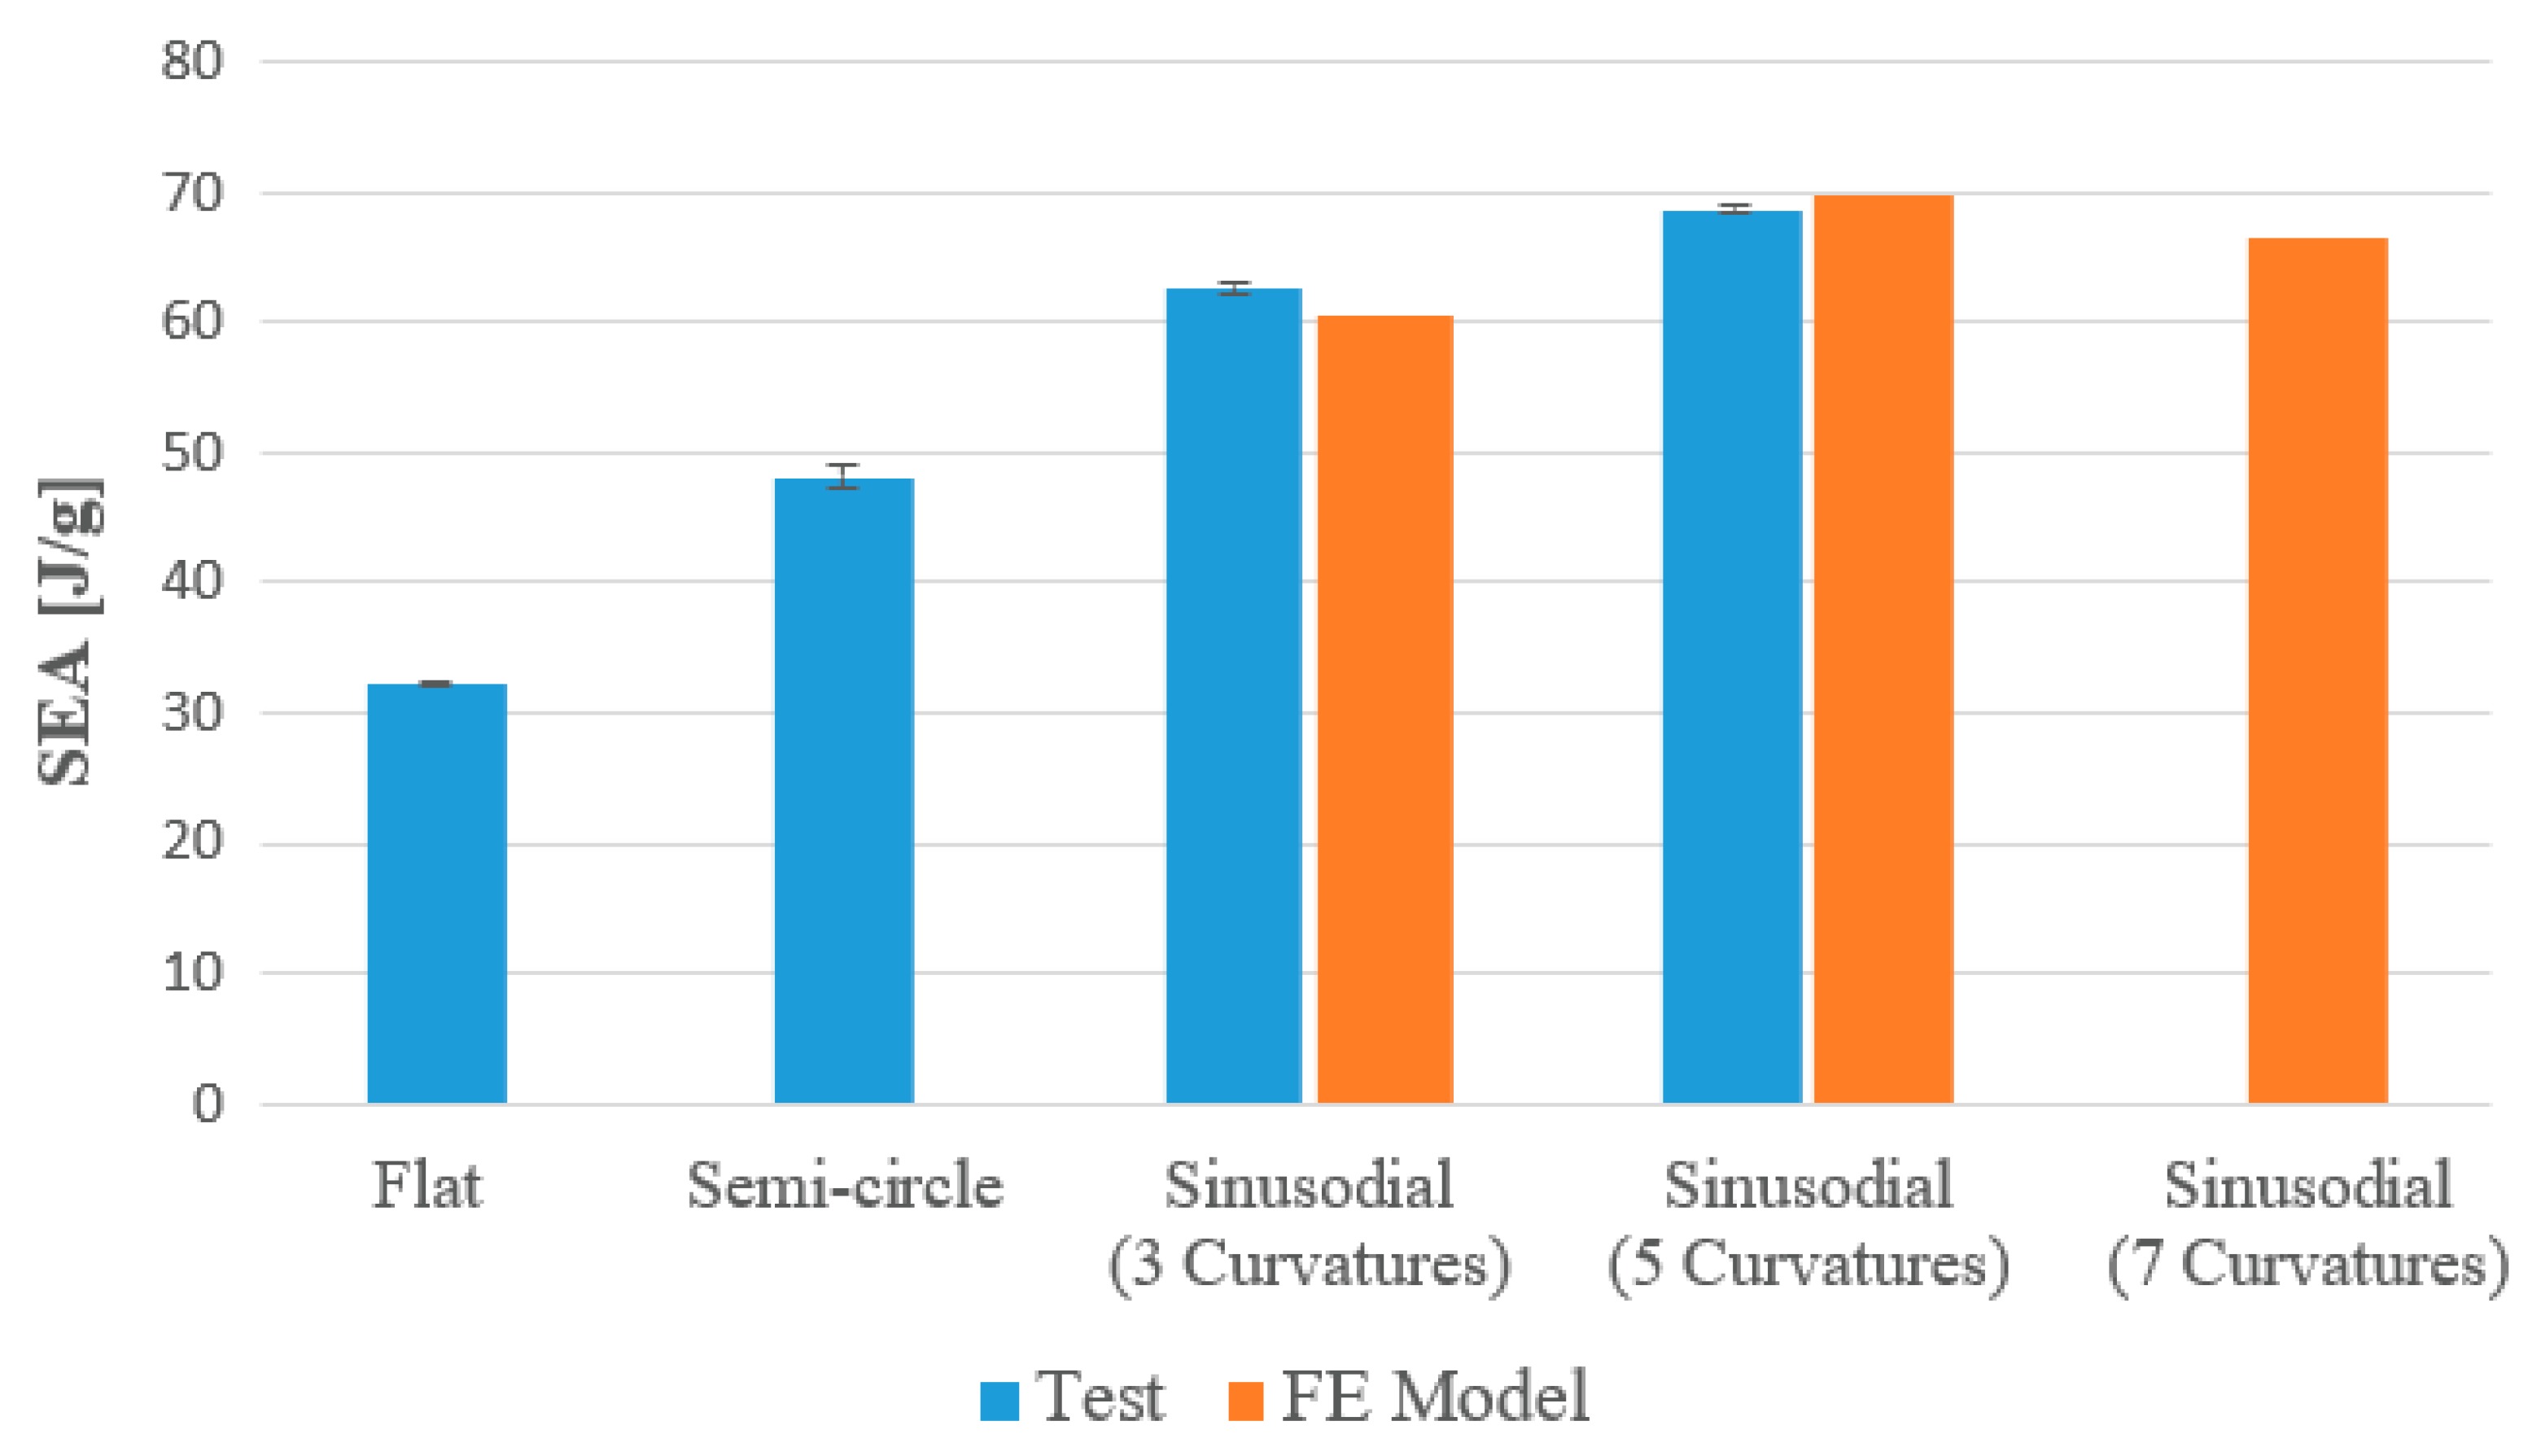
4.4. Numerical Results
5. Conclusions
Author Contributions
Funding
Data Availability Statement
Conflicts of Interest
References
- Farley, G.L. Energy—Absorption Capability of Composite Tubes and Beams. Ph.D Thesis, Virginia Polytechnic Institute and State University, Hampton, VA, USA, 1989. [Google Scholar]
- Bisagni, C. Experimental investigation of the collapse modes and energy absorption characteristics of composite tubes. Int. J. Crashworthiness 2009, 14, 365–378. [Google Scholar] [CrossRef]
- Hull, D. A unified approach to progressive crushing of fibre-reinforced composite tubes. Compos. Sci. Technol. 1991, 40, 377–421. [Google Scholar] [CrossRef]
- Carruthers, J.J.; Kettle, A.P.; Robinson, A.M. Energy Absorption Capability and Crashworthiness of Composite Material Structures: A Review. Appl. Mech. Rev. 1998, 51, 635–649. [Google Scholar] [CrossRef]
- Jacob, G.C.; Fellers, J.F.; Simunovic, S.; Starbuck, J.M. Energy Absorption in Polymer Composites for Automotive Crashworthiness. J. Compos. Mater. 2002, 36, 813–850. [Google Scholar] [CrossRef]
- Israr, H.; Rivallant, S.; Bouvet, C.; Barrau, J. Finite element simulation of 0°/90° CFRP laminated plates subjected to crushing using a free-face-crushing concept. Compos. Part A Appl. Sci. Manuf. 2014, 62, 16–25. [Google Scholar] [CrossRef]
- Bergmann, T.; Heimbs, S. Progressive bearing failure of composites for crash energy absorption. In Dynamic Response and Failure of Composite Materials and Structures; Lopresto, V., Antonio, L., Serge, A., Eds.; Elsevier: Amsterdam, The Netherlands, 2017; pp. 299–334. [Google Scholar]
- Mahdi, E.; Hamouda, M.S.; Sebaey, T.A. The effect of fiber orientation on the energy absorption capability of axially crushed composite tubes. Mater. Des. 2014, 56, 923–928. [Google Scholar] [CrossRef]
- Hu, D.; Zhang, C.; Ma, X.; Song, B. Effect of fiber orientation on energy absorption characteristics of glass cloth/epoxy composite tubes under axial quasi-static and impact crushing condition. Compos. Part A Appl. Sci. Manuf. 2016, 90, 489–501. [Google Scholar] [CrossRef]
- Sivagurunathan, R.; Way, S.L.T.; Sivagurunathan, L.; Yaakob, M.Y. The Effects of Triggering Mechanisms on the Energy Absorption Capability of Circular Jute/Epoxy Composite Tubes under Quasi-Static Axial Loading. J. Reinf. Plast. Compos. 2018, 37, 824–840. [Google Scholar] [CrossRef]
- Jiménez, M.; Miravete, A.; Larrodé, E.; Revuelta, D. Effect of trigger geometry on energy absorption in composite profiles. Compos. Struct. 2000, 48, 107–111. [Google Scholar] [CrossRef]
- Sawamura, S.; Yamazaki, Y.; Yoneyama, S.; Koyanagi, Y. Multi-scale numerical simulation of impact failure for cylindrical CRFP. Adv. Compos. Mater. 2021, 30, 19–38. [Google Scholar] [CrossRef]
- Feraboli, P. Development of a Modified Flat-plate Test Specimen and Fixture for Composite Materials Crush Energy Absorption. J. Compos. Mater. 2009, 43, 1967–1990. [Google Scholar] [CrossRef]
- Bru, T.; Walderström, P.; Gutkin, R.; Vyas, G.M. Development of a Test Method for Evaluating the Crushing Behaviour of Unidirectional Laminates. J. Compos. Mater. 2017, 57, 1–11. [Google Scholar] [CrossRef]
- Thornton, P. Energy Absorption in Composite Structures. J. Compos. Mater. 1979, 13, 248–262. [Google Scholar] [CrossRef]
- Mamalis, A.; Robinson, M.; Manolakos, D.; Demosthenous, G.; Ionnidis, M.; Carruthers, J. Review: Crashworthy capability of composite material structures. Compos. Struct. 1997, 37, 109–134. [Google Scholar] [CrossRef]
- Farley, G.L.; Jones, R.M. Crushing Characteristics of Composite Tubes with “Near-Elliptical” Cross Sections. J. Compos. Mater. 1992, 26, 1741–1751. [Google Scholar] [CrossRef]
- Alhyari, O.; Newaz, G. Energy Absorption in Carbon Fiber Composites with Holes. J. Carbon Res. 2021, 7, 16. [Google Scholar] [CrossRef]
- Hanagud, S.; Craig, I.; Sriram, P.; Zhou, W. Energy Absorption Behavior of Graphite Epoxy Composite Sine Webs. J. Compos. Mater. 1989, 23, 448–459. [Google Scholar] [CrossRef]
- Wiggenraad, J.F.M.; Santoro, D.; Lepage, F.; Kindervater, C.; Mañez, H.C. Development of a crashworthy composite fuselage concept for a commuter aircraft. NLR-TP 2001, 108, 11. [Google Scholar]
- Sokolinsky, V.S.; Indermuehle, K.C.; Hurtado, J.A. Numerical simulation of the crushing process of a corrugated composite plate. Compos. Part A Appl. Sci. Manuf. 2013, 42, 1119–1126. [Google Scholar] [CrossRef]
- Hexcel. HexPly ® 8552—Product Data Sheet; EU Version; Hexcel: Stamford, CT, USA, 2016. [Google Scholar]
- Hashin, Z. Failure critera for unidirectional fibre composites. J. Appl. Mech. 1980, 47, 329–334. [Google Scholar] [CrossRef]
- Lubineau, G. On a damage mesomodel for laminates: Micro–meso relationships, possibilities, and limits. Comp. Sci. Technol. 2001, 15, 2149–2158. [Google Scholar]
- Camanho, P.P.; Davila, G.G.; Moura, M.F. Numerical simulation of mixed-mode progressive delamination in composite. Mater. Sci. Compos. 2003, 16, 1415–1438. [Google Scholar] [CrossRef]
- Turon, A.; Dávila, C.; Camanho, P.; Costa, J. An engineering solution for mesh size effects in the simulation of delamination using cohesive zone models. Eng. Fract. Mech. 2007, 74, 1665–1682. [Google Scholar] [CrossRef]
- Oz, F.E.; Ahmadvashaghbash, S.; Ersoy, N. Damage mode identification in transverse crack tension specimens using acoustic emission and correlation with finite element progressive damage model. Compos. Part B Eng. 2019, 165, 84–95. [Google Scholar] [CrossRef]
- Oz, F.E.; Calik, E.; Ersoy, N. Finite element analysis and acoustic emission monitoring of progressive failure of corrugated core composite structures. Compos. Struct. 2020, 253, 112775. [Google Scholar] [CrossRef]
- Ahmadvashaghbash, S.; Engül, M.; Öz, F.E.; Ersoy, N. A Comparative Numerical Study Aiming to Reduce Computation Cost for Mode-I Delamination Simulations. In Proceedings of the ECCM-18, Athens, Greek, 24–28 June 2018. [Google Scholar]
- ABAQUS. Standard User’s Manual; Version 6.14; Dassault Systemes Simulia, Inc.: Johnston, RI, USA, 2014. [Google Scholar]


| Description | Unit | Variable | Value |
|---|---|---|---|
| Density | g/cm3 | 1.58 | |
| Longitudinal Modulus | GPa | 141 | |
| Transverse Modulus | Gpa | = | 9.75 |
| Principal Poisson’s Ratio | - | 0.267 | |
| Shear Moduli in 1–2 Plane | GPa | 5.2 | |
| Shear Moduli in 2–3 Plane | GPa | 3.19 | |
| Longitudinal Tensile Strength | MPa | 2200 | |
| Longitudinal Compressive Strength | MPa | 1500 | |
| Transverse Tensile Strength | MPa | 81 | |
| Transverse Compressive Strength | MPa | 260 | |
| In-plane Shear Strength | MPa | 80 | |
| Interfacial Strength (Mode I) | MPa | 35 | |
| Interfacial Strength (Modes II and III) | MPa | 70 | |
| Fracture Toughness (Normal) | [kJ/mm2] | 0.28 | |
| Fracture Toughness (Shear) | [kJ/mm2] | 2.59 |
| Specimen No. | SEA [J/g] | Average |
|---|---|---|
| #1 | 32.31 | 32.14 |
| #2 | 32.18 | |
| #3 | 31.94 |
| Specimen No | SEA [J/g] | Average |
|---|---|---|
| #1 | 48.22 | 48.09 |
| #2 | 48.94 | |
| #3 | 47.12 |
| Number of Curvatures | Specimen No | SEA [J/g] | Average |
|---|---|---|---|
| 3 | #1 | 62.71 | 62.64 |
| #2 | 62.18 | ||
| #3 | 63.03 | ||
| 5 | #1 | 69.01 | 68.73 |
| #2 | 68.24 | ||
| #3 | 68.94 |
Disclaimer/Publisher’s Note: The statements, opinions and data contained in all publications are solely those of the individual author(s) and contributor(s) and not of MDPI and/or the editor(s). MDPI and/or the editor(s) disclaim responsibility for any injury to people or property resulting from any ideas, methods, instructions or products referred to in the content. |
© 2023 by the authors. Licensee MDPI, Basel, Switzerland. This article is an open access article distributed under the terms and conditions of the Creative Commons Attribution (CC BY) license (https://creativecommons.org/licenses/by/4.0/).
Share and Cite
Engül, M.; Ersoy, N. From Flat Plates to Sinusoidal Structures: Influence of Geometry on the Energy Absorption Capability of Carbon/Epoxy Composites. J. Compos. Sci. 2023, 7, 56. https://doi.org/10.3390/jcs7020056
Engül M, Ersoy N. From Flat Plates to Sinusoidal Structures: Influence of Geometry on the Energy Absorption Capability of Carbon/Epoxy Composites. Journal of Composites Science. 2023; 7(2):56. https://doi.org/10.3390/jcs7020056
Chicago/Turabian StyleEngül, Mehmet, and Nuri Ersoy. 2023. "From Flat Plates to Sinusoidal Structures: Influence of Geometry on the Energy Absorption Capability of Carbon/Epoxy Composites" Journal of Composites Science 7, no. 2: 56. https://doi.org/10.3390/jcs7020056