Article

Green Hydrogen Generation from Eco-Friendly and Cost-Effective Red Sea Water Using a Highly Photocatalytic Nanocomposite Film, As2O3/Poly-3-methylaniline

by
Mohamed Rabia
1,
Asmaa M. Elsayed
2,
Maha Abdallah Alnuwaiser
3,* and
Madeha A. Awad
4
1
Nanomaterials Science Research Laboratory, Chemistry Department, Faculty of Science, Beni-Suef University, Beni-Suef 62514, Egypt
2
TH-PPM Group, Physics Department, Faculty of Science, Beni-Suef University, Beni-Suef 62514, Egypt
3
Department of Chemistry, College of Science, Princess Nourah bint Abdulrahman University, P.O. Box 84428, Riyadh 11671, Saudi Arabia
4
Physics Department, Faculty of Science, Sohag University, Sohag 82511, Egypt
*
Author to whom correspondence should be addressed.
J. Compos. Sci. 2023, 7(11), 463; https://doi.org/10.3390/jcs7110463
Submission received: 8 September 2023 / Revised: 30 September 2023 / Accepted: 16 October 2023 / Published: 5 November 2023
(This article belongs to the Section Nanocomposites)

Abstract

:
The primary objective of this research is to address the energy challenges by introducing an innovative nanocomposite material. This material is designed to facilitate the conversion of environmentally friendly and economically viable Red Sea water into hydrogen gas. The ultimate goal of this work is to pave the way for the development of a practical device that can be employed within households and industrial settings to directly convert water into hydrogen gas. This novel nanocomposite material synthesized through oxidative polymerization comprises As2O3 and Poly-3-methylaniline (P3MA). This material possesses an extensive absorption range, spanning up to 700 nm, and features a bandgap of 1.75 eV, making it a promising candidate for use as a photoelectrode in green hydrogen production. The unique aspect of this setup lies in the utilization of Red Sea water, a natural sacrificing agent, as the electrolyte, rendering the process eco-friendly and cost-effective. When it is employed as a photoelectrode, this material exhibits high sensitivity to green hydrogen production, generating 6 moles/10 cm2·h of hydrogen. At a voltage of −0.83 V, the current density values are measured as −0.08 mA·cm−2 (Jph) in light and −0.02 mA·cm−2 (Jo) in darkness. Furthermore, the photoelectrode’s responsiveness to light is assessed with different optical filters, revealing the optimal performance at 340 nm, where Jph reaches −0.052 mA·cm−2. These outcomes provide strong evidence of the photoactivity of the As2O3/P3MAphotoelectrode for green hydrogen production using Red Sea water. This underscores its potential for the development of an electrochemical cell for the direct conversion of sea water into H2 gas.

1. Introduction

The main reasons for producing clean energy that is not harmful to the environment are the global energy crisis and environmental challenges. Especially due to increased pollution, which has begun to instill fear, and the decline of fossil fuels, the demand for clean energy has increased. Much of the world’s power is sourced from fossil deposits, which has a major role in the pollution of layers of the atmosphere, causing the phenomenon of global warming [1,2,3]. H2 gas is the cheapest and most widely applied renewable energy source. Through photocatalysis, scientists can produce H2 from various electrolytes: bases, acids, and neutral mediums [4,5]. In addition, many companies and factories use this gas as an alternative fuel to fossil fuels. The less fossil fuels are used, the less dangerous the gas emissions will be, such as carbon dioxide, nitrogen, and sulfur oxides. H2 gas is also characterized by its combustibility and good performance [6,7]. But the generation of H2 gas as a clean and renewable fuel requires stable and sufficient photocatalysts in the future. H2 gas can be an alternative to fossil fuels as an energy source [8]. Hydrogen is produced via the electrolysis of water, and this process requires an electrical voltage greater than 1.23 V to produce H gas due to slow oxygen reactions [9,10]. In 1972, Fujishima and Honda invented the water-dispersion (PWS) photocatalytic method using ultraviolet light for the first time. Next, the researchers produced H gas using photocatalysts and semiconductors. The production of H gas via photocatalysis and direct water dispersion is a good method and can give a solution to the current energy shortage [11,12]. The light reactions applied to generate H2 gas are performed on metal sulfide, oxides, or polymer semiconductor materials that have a great optical performance and additional commercial advantages, such as, they can be mass produced or have low costs [13]. To increase the production of H2, these selected materials are favorable to have a large surface area that reflects the number of active sites, so that the nanomaterials, nanowires, or sheets are ready for the H2 generation process [7,14,15,16]. The photocatalytic interactions of semiconductors show prominent photocatalytic water scattering activity. However, the photocatalytic degradation and rapid recombination of the photocatalyst have reduced the appreciable applications of photocatalytic H2 gas production. To solve this problem, many types of applications have been proposed. For example, carbon-based materials, noble metals, and nonmetals as well as homo- and hetero-structures are doped using transition metal oxide polymers into interchangeable metal-substitutable compounds, especially in electronic devices [17,18]. The primary goal of the researchers in developing these polymers is to reach an optimal band vacuum of 1.2 to 1.5 eV, which is achieved through the induction of photon capture inside the molecular texture of these materials. This development is illustrated by the nanoformulation and composite using additives that have a wide range of light responses. There are some studies conducted on polymer compounds to disperse water and generate H2 gas. Some studies have worked on the PANI composite with TiO2 through testing their photocatalytic performance from a water solution, and the produced Jph value has a limited performance [19]. Also, there are additional previous studies on using polymer composites for hydrogen production, but these studies depended on using an acid medium, such as H2SO4 or HCl as an electrolytes, and the generated Jph values were very limited. Some of these materials are polyaniline/MoS, Ni/polyaniline, and poly(3-aminobenzoic acid) frameworks [19,20,21].
This study introduces a new photoelectrode for producing green hydrogen using Red Sea water, which is both environmentally friendly and cost-effective. The As2O3/P3MA photoelectrode is thoroughly characterized after its preparation, and its excellent absorption and small bandgap make it ideal for hydrogen generation. The sensitivity of the photoelectrode is evaluated using a three-electrode cell and optical filters to adjust the light frequency. The amount and rate of hydrogen gas production are determined based on Jph and Jo values.

2. Experimental Details

2.1. Characterization and Materials

m-Toluidine and sodium arsenite (NaAsO2) were obtained from Merck, Rahway, NJ, USA, dimethylformamide (DMF) and silver paste were obtained from Sigma Aldrich, Saint Louis, MO, USA, and Na2S2O8 was obtained from Pio-Chem, Cairo, Egypt.
The characterization of materials was carried out using various analytical techniques. XRD (PANalytical) was used for confirming the chemical composition by analyzing 2 theta degrees. XPS (Kratos, UK) was performed to understand the elemental composition of the materials by analyzing the electron photon phenomenon. FTIR (Bruken) was applied to determine the function groups of the materials. SEM (ZEISS) was used to determine the 3D topography of the material, while TEM (JEOL) was used for 2D morphology confirmation. Additionally, the absorbance of the materials was determined using a Perkin Elmer spectrophotometer device, and the bandgap was calculated using the Tauc equation.

2.2. Preparation of P3MA and As2O3/P3MA

P3MA and As2O3/P3MA nanocomposites were prepared using the same technique, which involves adding the oxidant suddenly (fast addition) to the monomer dissolved in HCl acid at 25 °C. In terms of adding the oxidant to the monomer, the process involves a rapid, one-step addition of the oxidant solution to the monomer solution. This swift addition promotes the formation of nanopolymer, effectively preventing the formation of large granules. The oxidant used for the monomer was K2S2O8, while for As2O3/P3MA, it was a combination of 0.12 M K2S2O8 and 0.15 M NaAsO2. The monomer used in both reactions was 0.06 M 3-methylaniline, which dissolved in 0.5 M HCl under stirring for 30 min in atotal solution of 100 mL. The polymer obtained from the reaction was then collected using the centrifugation method after one day, purified, and dried at 60 °C thoroughly.

2.3. The Hydrogen Generation System

The process of hydrogen generation was conducted using Red Sea water as the naturally occurring electrolyte, eliminating the need for any additional electrolytes. This electrochemical reaction was facilitated within a three-electrode cell configuration, which included the As2O3/P3MA nanocomposite film as the primary electrode, graphite serving as the auxiliary electrode, and a calomel electrode fulfilling the role of the third electrode.
To quantify the production of hydrogen gas during this process, a specialized device known as the CHI608E was employed. This device is capable of measuring and recording important parameters, particularly the current density under both light and dark conditions. Under illumination, the device records a current density denoted as Jph, representing the photo-induced current density. This parameter is crucial for assessing the efficiency of hydrogen generation in the presence of light, which could be derived from various sources, including natural sunlight or artificial illumination.
In the absence of light, the device records another current density labeled as Jo, representing the dark current density. This measurement provides insights into the hydrogen generation process when no external light source is present. Understanding the dark current density is important as it allows the assessment of hydrogen production efficiency in conditions where illumination is not a factor, helping to distinguish between photo-induced and non-photo-induced contributions to the overall current.
The CHI608E device, with its ability to monitor current density under both illuminated and non-illuminated conditions, plays a crucial role in characterizing the effectiveness of the hydrogen generation reaction in Red Sea water using the As2O3/P3MA nanocomposite film electrode. These data are essential for evaluating the performance and potential applications of the hydrogen generation process, particularly in environmentally relevant and sustainable contexts. The optical filters were inserted for controlling the light wavelengths using a metal halide lamp. The hydrogen generation system is shown in Figure 1.

3. Results and Discussion
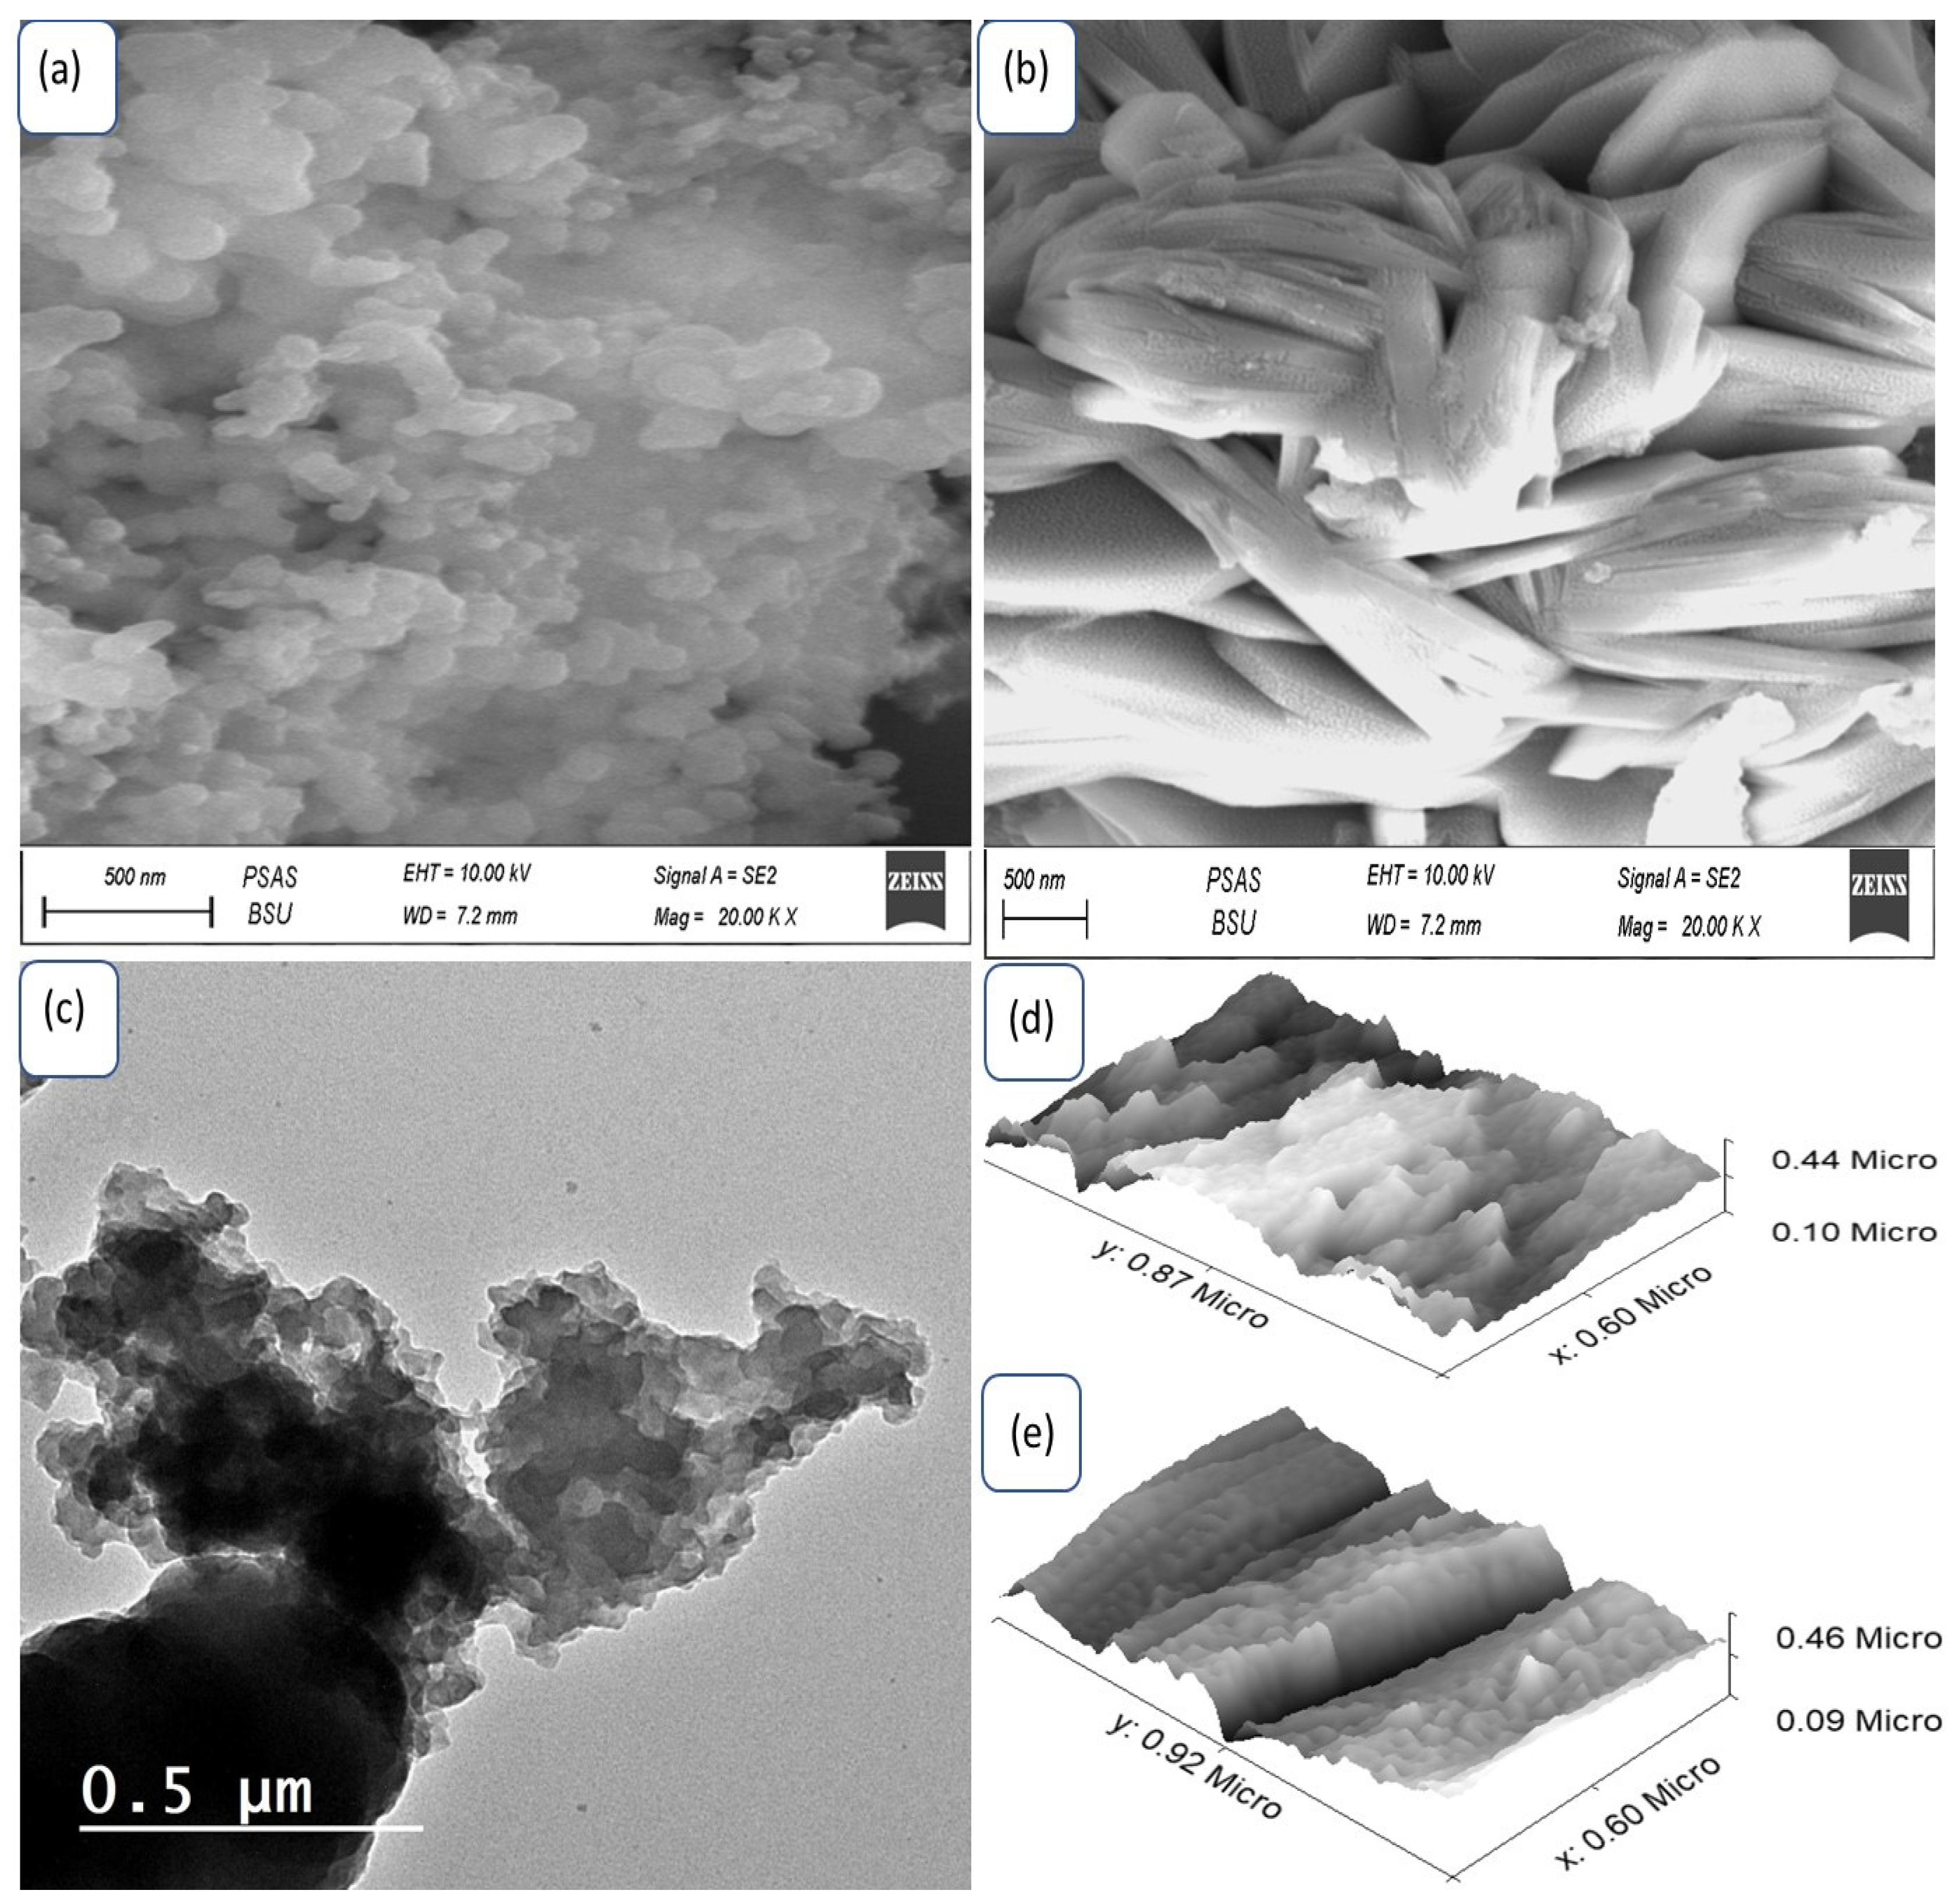
3.1. Analyses

The XRD pattern of P3MA and As2O3/P3MA (Figure 2a) was determined through the diffraction angles at which the X-rays constructively interfered with each other after interacting with the crystal lattice. Through this interaction, the P3MA has abroad bands at 15° confirms the amorphous behavior of this prepared polymer; this matched well with the aniline derivate polymers.
However, the emergence of distinct peaks at 21° and 24.6° signifies the establishment of crystalline characteristics within the composite material. This crystalline nature is attributed to the chemical bonding interactions formed between P3MA and the inorganic As2O3, resulting from the incorporation of oxide within the polymer matrix [22]. The XRD pattern also shows sharp peaks related to As2O3 [23] at 26.5°, 28.5°, 31.7°, 34.4°, and 45.4°, which allowed the calculation of the crystalline size (D) using Scherrer’s equation (Equation (1)) [24]. By using the strongest peak at 34.4° and the full width half maximum value, the calculated D value was found to be 22 nm.
D = 0.9λ/W cosθ
The FTIR spectroscopic analysis data of both P3MA and the As2O3/P3MA composite are presented in Figure 2b. In the FTIR spectra of P3MA, several distinctive bands were observed, each corresponding to specific chemical groups and functional bonds within the molecule. Firstly, the bands observed at wavenumbers 3406 cm−1 and 2915 cm−1 are indicative of certain functional groups. The band at 3406 cm−1 is associated with N-H, suggesting the presence of amino (N-H) groups in the P3MA structure. Meanwhile, the band at 2915 cm−1 corresponds to C-H, indicating the presence of carbon–hydrogen (C-H) bonds in the molecule.
Another noteworthy feature in the FTIR spectra of P3MA is the band at 1727 cm−1. This band is assigned to N-H, which further emphasize the presence of amino groups within the P3MA compound. Additionally, two distinct bands are observed at 1640 cm−1 and 1529 cm−1, which can be attributed to the vibrations of the C=C and C-N bonds, respectively. These bands signify the presence of double carbon–carbon (C=C) bonds and carbon–nitrogen (C-N) bonds in the molecular structure of P3MA. Lastly, the FTIR spectrum of P3MA reveals a band at 1370 cm−1, which is associated with the stretching vibrations of the C-N bond. This particular bond is characteristic of amine groups, further confirming the presence of nitrogen-containing functional groups in P3MA.
These bands are attributed to the presence of P3MA in the composite. In the case of the As2O3/P3MA composite, there are a few new observed bands, indicating the chemical reaction between As2O3 and P3MA. However, there are little shifts in some band positions, indicating that there is some interaction between the two materials. The band at 3406 cm−1 represents the N-H stretching vibration of P3MA, which shows a shift towards a higher wavenumber (3410 cm−1), indicating the interaction of N-H with As2O3. The band at 1640 cm−1 is for the C=C vibration, showing a shift towards a lower wavenumber (1602 cm−1) [25], indicating the interaction of C=C with As2O3. These shifts in the band positions confirm the presence of As2O3 in the composite, as well as its interaction with P3MA.
To further analyze the elemental structure of the As2O3/P3MA composite, XPS analyses were conducted, and the results are shown in Figure 2c,d for the composite and As elements, respectively. The pure P3MA polymer exhibited characteristic peaks in the 1s spectra at 400 and 285 eV, corresponding to the N and C elements, respectively [26]. Additionally, the presence of HCl in the acid medium used during synthesis led to an enhancement in the conductivity of the polymer, as indicated by the peak for Cl element at 199 eV.
The presence of As2O3 as an inorganic filler within the polymer matrix was confirmed by examining the As3d3/2 spectrum (44.3 eV, depicted by the brown curve) and the As3d5/2 spectrum (45.4 eV, represented by the red curve). These spectra clearly indicate that the oxidation state of arsenic (As) is III. Furthermore, the intense peak observed at 532 eV in the O1s spectrum provides further confirmation of the presence of As2O3 compound within the composite.
The amount of light absorbed by a material over a given distance is referred to as optical absorbance, and it is illustrated in Figure 3a for P3MA (black curve) and As2O3/P3MA composite (red curve). P3MA displays good absorbance at 370 and 600 nm, whereas the formation of As2O3/P3MA exhibits a broad optical absorbance that extends to about 800 nm due to the incorporation of As2O3 within the P3MA chains. This significant absorbance covers a wide optical range, extending to the IR region. The band gap of the composite is calculated to be 1.75 nm using the Tauc equation (Equation (2)) [27,28], as indicated in Figure 3b, indicating an ideal band gap. We used the absorbance coefficient (α), frequency (ν), and plank constant (h) for this evaluation. Therefore, this composite holds a promising potential for optical applications, such as solar cell layers or optoelectronic light sensing [29,30].
(αhν)0.5 = A(hν − Eg)
The morphologies of P3MA and As2O3/P3MA nanomaterials were examined using SEM analysis, as depicted in Figure 4b, respectively. The formation of the composite resulted in a significant change in morphology, accompanied by improvements in the chemical and optical properties [31]. The compact nanofiber structure observed in the nanocomposite indicates enhanced crystallinity and optical behavior [32]. These nanofibers are composed of numerous particles that are in contact with each other and elongated together, leading to an increase in their overall length. In contrast, the nonuniform morphology of P3MA reflects its limited properties. This behavior is well demonstrated in the TEM image (Figure 4c), where interconnected particles form the As2O3/P3MA nanocomposite. Furthermore, roughness analysis using the Gwydion theoretical program (Figure 4e) confirms the formation of compacted nanofibers that are tightly interconnected. Conversely, Figure 4d shows non-compacted particles with a nonuniform distribution in the P3MA sample.

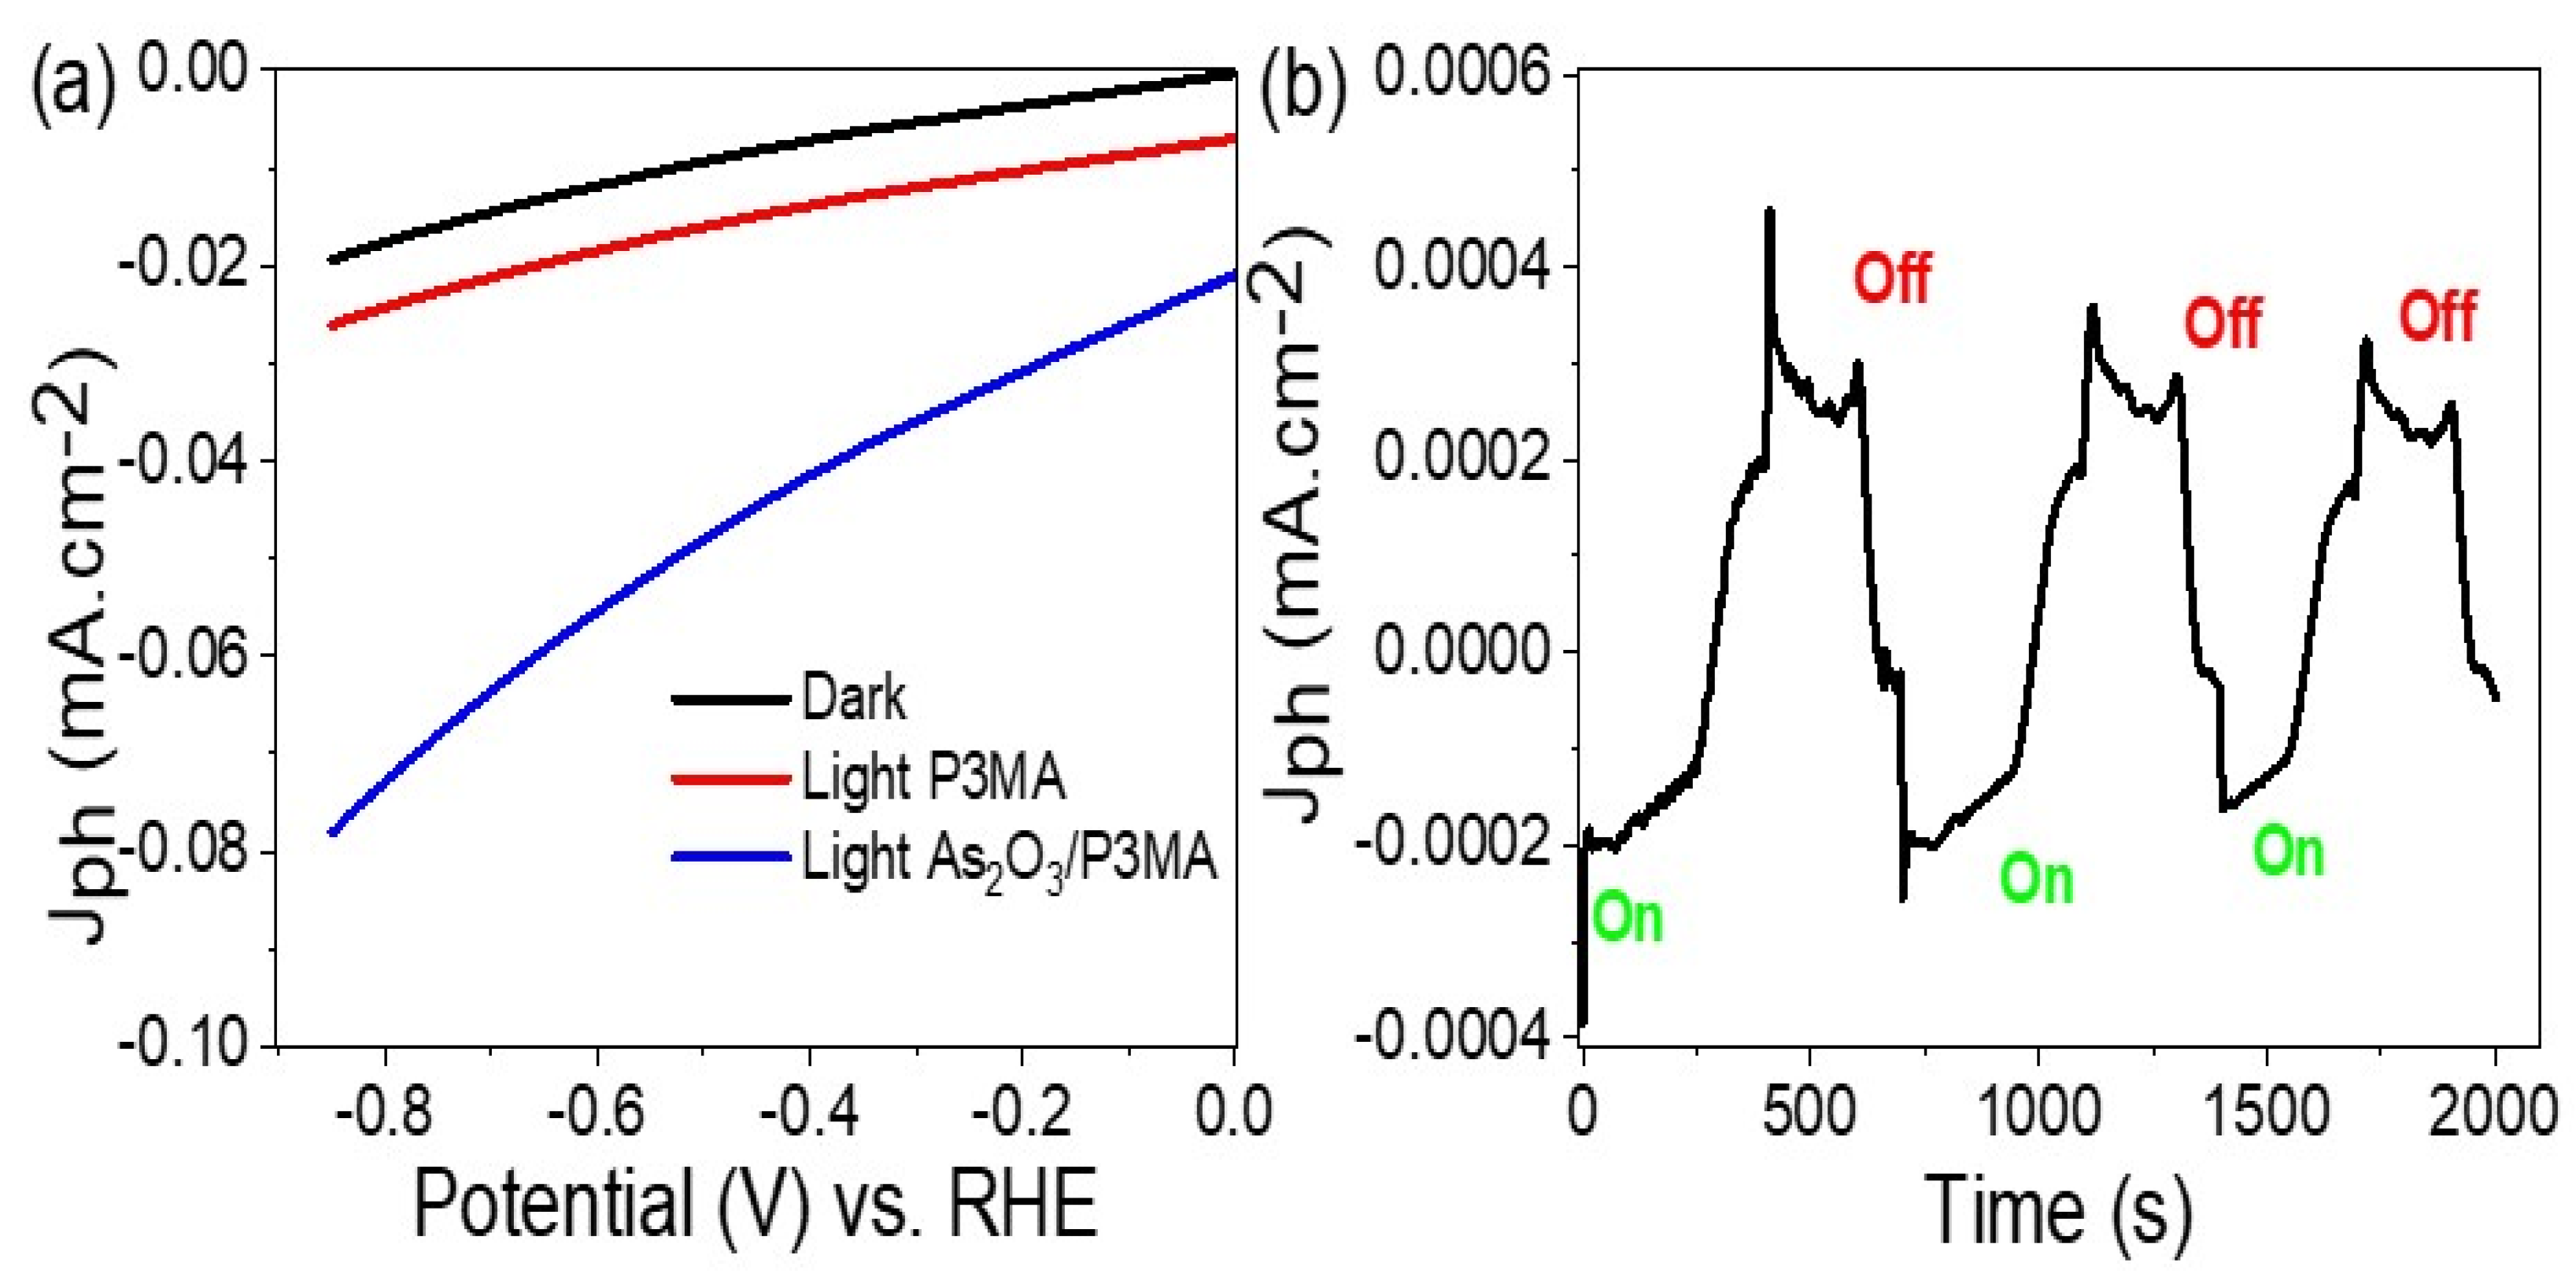
3.2. Red Sea Water (Electrolyte) for Hydrogen Generation: The Electrochemical Study

The concentrations of heavy metals in the electrolyte used for hydrogen generation in this electrochemical study are presented in Table 1, and they are derived from Red Sea water. The Jph values were evaluated under different light conditions to investigate the sensitivity of the As2O3/P3MA composite photoelectrode to light photons. When the photoelectrode is illuminated, hot electrons are generated, which then migrate to the Red Sea water for an electrochemical reaction that results in the splitting of the water molecules. This electrochemical study was conducted using the CHI station to measure the current–voltage or current–time relations. Overall, these studies aimed to explore the potential of the As2O3/P3MA composite photoelectrode for efficient photoelectrochemical water splitting.
The As2O3/P3MA composite photoelectrode showed a higher rate of hydrogen generation under light (Figure 5a) compared to the Jo value in the dark. This suggests that a photocatalytic reaction occurred on the surface of the As2O3/P3MA composite under light illumination. The bandgap of this composite is 1.75 eV, which is smaller than the UV or visible light range. This indicates that the transfer of electrons occurs easily under these light regions, forming an electron cloud on the surface of the photoelectrode [34]. In the presence of sea water, these electrons find their way to the solution, where the heavy metal plays the role of a sacrificing agent to promote the splitting reaction. The difference in Jph and Jo values of −0.08 and −0.02 mA·cm−2 at (−0.83 V), respectively, is an indication of this process. The smooth light curve suggests a Schottky barrier reaction [35,36], indicating the generation of electrons under light illumination. For the P3MA under light illumination, in the presence of light, the Jph value exhibits a notable increase, reaching −0.028 mA·cm−2 at −0.83 V. This enhanced response signifies the heightened sensitivity of this pure polymer to incident photons of light, which induce electron transitions at higher energy levels, specifically the LUMO (Lowest Unoccupied Molecular Orbital). This behavior underscores the semiconducting characteristics of this promising polymer. The smallest Jo value represents the self-current of the As2O3/P3MA composite due to its semiconductive nature.
Figure 5b shows the current density–time (J-t) curves of the As2O3/P3MA composite photoelectrode under chopped light illumination. The up and down behaviors of the J values represent the sensitivity of this photoelectrode under both dark and light conditions at limited bias potential values. The positive current value in dark conditions represents the self-current of the photoelectrode due to its semiconductive nature [37,38]. The negative current values under light conditions indicate a photocatalytic reaction on the surface of the composite under the motivation of incidence light. The negative bands represent the transfer of electrons to the sea water and the consequent hydrogen gas production. The smooth curves between the peaks represent the Schottky barrier reaction that gives an indication of the generation of electrons under light motivation [35,39,40,41]. The remarkable durability of the metal oxide materials encapsulated within the P3MA matrix significantly enhances the stability and consistency of the As2O3/P3MA composite, as depicted in Figure 4b. Furthermore, the composite’s resistance to corrosion and its inherent semiconductor properties play a pivotal role in ensuring its repeatability and reliability. Overall, these results demonstrate the potential of the As2O3/P3MA composite photoelectrode for hydrogen generation with high sensitivity to light illumination.
The sensitivity of the photoelectrode to light frequency was estimated by illuminating the As2O3/P3MA composite photoelectrode surface with different photon wavelengths and measuring the resulting Jph values, as shown in Figure 6a. The frequency of light is represented by the different wavelengths of 340, 540, and 730 nm, with increasing energy associated with smaller wavelengths from 730 to 340 nm. This resulted in an increase in Jph values in the direction of the decreasing wavelength, with the optimum value at 340 nm being −0.052 mA·cm−2, as depicted in Figure 6b. The increase in Jph values under high-frequency light is normal and represents greater electron transfer with increasing photon energy [42,43,44]. A notable aspect of this study is the potential commercial application of the prepared photoelectrode for Jph generation under a wide optical region, enabling the conversion of Red Sea water to hydrogen gas using a three-electrode cell, which is consistent with previous studies by Rabia et al. [45,46,47,48].
Photocathodes are essential components in various optical and electronic devices, thanks to their remarkable efficiency in converting incident photons into electrons. What sets these photocathodes apart is their exceptional performance across a wide optical spectrum, spanning from the UV to IR wavelengths. This broad range of operation allows photocathodes to harness the entire spectrum of light, particularly excelling in the Vis and IR regions. The key to this impressive versatility lies in the unique properties of the composite materials used in the photocathode. These materials have a small bandgap, which measures at just 1.75 eV. This small bandgap significantly influences the energy of the incident photons that interact with the photocathode’s surface, as described by the famous Einstein Equation, E = mc2.
Let us explore how this relationship between the bandgap and incident photon energy works in practice. At a wavelength of 730 nm, the energy of the incident photons is calculated using the Einstein Equation. This yields an energy value of 1.81 eV. This energy exceeds the photocathode’s small bandgap of 1.75 eV. Transitioning to a shorter wavelength of 540 nm, the energy of the incident photons increases, and it measures at 2.3 eV. Again, this energy surpasses the photocathode’s bandgap, ensuring efficient photon-electron conversion. Moving further into the ultraviolet spectrum, at a wavelength of 340 nm, the energy of the incident photons rises substantially to 3.6 eV. As expected, this energy comfortably exceeds the 1.75 eV bandgap of the photocathode material. These calculations exemplify the remarkable capacity of the photocathode to absorb a wide range of photon energies, making it efficient not only in the visible spectrum, but also in the ultraviolet and infrared regions. This adaptability is invaluable for a variety of applications, such as photodetectors, image sensors, and photomultiplier tubes, where capturing a broad range of light wavelengths is crucial. Moreover, the capability of the photocathode to harness photons with energies higher than its bandgap allows the generation of free electrons, which can be subsequently utilized in various electronic devices. This photocathode’s ability to efficiently convert photons into electrons across this broad optical spectrum is of immense importance in scientific research, industrial applications, and even in everyday technologies like digital cameras and night-vision devices.
The incident photons, owing to their ample energy, can readily instigate the formation of electron–hole pairs within the energy levels of the composite materials. This initial step sets in motion the separation of electrons and holes, culminating in the liberation of high-energy electrons. These liberated electrons subsequently engage with neighboring solutions to facilitate the production of hydrogen gas. Within this intricate series of chemical and physical processes, the generated Jph values assume a pivotal role as a vital metric for assessing the overall efficiency of the reaction.
To delve deeper into this complex process, let us break down and elaborate on each of its key components. Photon Energy Initiation: The incident photons, with their substantial energy levels, play a pivotal role in triggering the reaction. When they strike the photocathode, they carry enough energy to excite electrons within the composite materials. This excitation leads to the creation of electron–hole pairs within the material. Electron–Hole Pair Separation: Following the creation of electron–hole pairs, these charged entities are separated due to the internal properties of the photocathode material. Electrons are liberated from their respective holes, and this process is crucial for enabling subsequent chemical reactions. The Release of High-Energy Electrons: The liberated electrons, often referred to as “hot electrons” due to their elevated energy levels, are released from the photocathode. These high-energy electrons are primed for further interaction with neighboring solutions.
Hydrogen Gas Generation: In the presence of these liberated high-energy electrons, a chemical reaction is initiated, which leads to the generation of hydrogen gas. These electrons act as catalysts, facilitating the reduction of protons (H+ ions) to produce molecular hydrogen (H2) from water or other suitable reactants. Jph Values as Efficiency Indicators: Throughout this intricate sequence of events, the generated Jph values are of paramount significance. Jph, or the photocurrent, represents the flow of electric current produced as a result of photon absorption and electron liberation. It serves as a critical indicator of the overall efficiency of the reaction. Higher Jph values indicate the more efficient conversion of incident photons into useful electrical or chemical energy.
In practical terms, the ability of the photocathode to efficiently create electron–hole pairs and release high-energy electrons is central to its performance in applications such as photocatalysis for hydrogen generation. The use of hot electrons as catalysts in the production of hydrogen gas offers a sustainable and environmentally friendly approach to fuel production. This process can be applied using renewable energy technologies, offering a promising avenue for clean hydrogen production.
In summary, the incident photons’ energy initiates a chain of events, including the creation of electron–hole pairs, the separation of electrons and holes, the release of high-energy electrons, and the subsequent generation of hydrogen gas. The assessment of Jph values is crucial for evaluating the efficiency of this reaction, with higher values indicating the more effective utilization of incident photons for the desired output, making it a key parameter in the realm of sustainable energy and catalysis.
The efficiency of the photoelectrode for hydrogen gas production can be reflected by calculating the moles of hydrogen gas generated during the splitting of Red Sea water (Figure 7). The Faraday law can be used to calculate the moles of substance, which is given by the formula: moles of substance = (electric current × time)/(Faraday’s constant × number of electrons transferred in the reaction) [49]. The estimated moles of H2 generated using the As2O3/P3MA composite photoelectrode is 6 moles/10 cm2·h, which is a significant amount for production of H2 gas from sea water without the use of any external electrolytes.

4. Conclusions

A highly optical As2O3/P3MA nanocomposite with a 1.75 eV bandgap is prepared via oxidative polymerization using NaAsO2 and K2S2O8. Due to its great absorption behavior in a wide optical range up to 700 nm, this composite is promoted as a photoelectrode for green hydrogen production.
The Red Sea water electrolyte is used as a hydrogen source, and the heavy metals work as a natural sacrificing agent for water splitting. This As2O3/P3MA photoelectrode shows a great sensitivity for green hydrogen, with 6 moles/10 cm2·h of hydrogen production. The great sensitivity of this photoelectrode is proved by the fact that the Jph and Jo values are −0.08 and −0.02 mA.cm−2 at (−0.83 V), respectively. Under testing this photoelectrode in various light frequency spectra using optical filters, the Jph has an optimum value at 340 nm of −0.052 mA·cm−2. This light sensitivity confirms the photoactivity of the fabricated As2O3/P3MA photoelectrode for green hydrogen using free Red Sea water. Moreover, this study is a promising for future studies on designing an electrochemical cell for the direct conversion of the Red Sea water into H2 fuel.

Author Contributions

M.R. and M.A.A. (Maha Abdallah Alnuwaiser) performed writing and supervision. M.R., A.M.E., M.A.A. (Maha Abdallah Alnuwaiser) and M.A.A. (Madeha A. Awad) conducted the experiment and supervision. M.A.A. (Maha Abdallah Alnuwaiser) has a funding for this study. All authors have read and agreed to the published version of the manuscript.

Funding

Princess Nourah bint Abdulrahman University Researchers Supporting Project number (PNURSP2023R186), Princess Nourah bint Abdulrahman University, Riyadh, Saudi Arabia.

Data Availability Statement

All data generated of this work are included in this article.

Conflicts of Interest

The authors declare no conflict of interest.

References

  1. Gado, M.G.; Hassan, H. Potential of Prospective Plans in MENA Countries for Green Hydrogen Generation Driven by Solar and Wind Power Sources. Sol. Energy 2023, 263, 111942. [Google Scholar] [CrossRef]
  2. AlZohbi, G.; AlShuhail, L.; Almoaikel, A. An Estimation of Green Hydrogen Generation from Wind Energy: A Case Study from KSA. Energy Rep. 2023, 9, 262–267. [Google Scholar] [CrossRef]
  3. Meda, U.S.; Rajyaguru, Y.V.; Pandey, A. Generation of Green Hydrogen Using Self-Sustained Regenerative Fuel Cells: Opportunities and Challenges. Int. J. Hydrogen Energy 2023, 48, 28289–28314. [Google Scholar] [CrossRef]
  4. Iñarrea, J. Photo-Oscillations in MgZnO/ZnO Heterostructures. Sci. Rep. 2022, 12, 22463. [Google Scholar] [CrossRef]
  5. El Nady, J.; Shokry, A.; Khalil, M.; Ebrahim, S.; Elshaer, A.M.; Anas, M. One-Step Electrodeposition of a Polypyrrole/NiO Nanocomposite as a Supercapacitor Electrode. Sci. Rep. 2022, 12, 3611. [Google Scholar] [CrossRef]
  6. Modibane, K.D.; Waleng, N.J.; Ramohlola, K.E.; Maponya, T.C.; Monama, G.R.; Makgopa, K.; Hato, M.J. Poly(3-Aminobenzoic Acid) Decorated with Cobalt Zeolitic Benzimidazolate Framework for Electrochemical Production of Clean Hydrogen. Polymers 2020, 12, 1581. [Google Scholar] [CrossRef]
  7. Zhang, N.; Ma, W.; Wu, T.; Wang, H.; Han, D.; Niu, L. Edge-Rich MoS2 Naonosheets Rooting into Polyaniline Nanofibers as Effective Catalyst for Electrochemical Hydrogen Evolution. Electrochim. Acta 2015, 180, 155–163. [Google Scholar] [CrossRef]
  8. Tilley, S.D. Recent Advances and Emerging Trends in Photo-Electrochemical Solar Energy Conversion. Adv. Energy Mater. 2019, 9, 1802877. [Google Scholar] [CrossRef]
  9. Yu, J.M.; Lee, J.; Kim, Y.S.; Song, J.; Oh, J.; Lee, S.M.; Jeong, M.; Kim, Y.; Kwak, J.H.; Cho, S.; et al. High-Performance and Stable Photoelectrochemical Water Splitting Cell with Organic-Photoactive-Layer-Based Photoanode. Nat. Commun. 2020, 11, 5509. [Google Scholar] [CrossRef]
  10. Nerkar, D.M.; Jaware, S.E.; Padhye, G.G. Fabrication of a Novel Flexible Room Temperature Hydrogen Sulfide (H2S) Gas Sensor Based on Polypyrrole Films. Int. J. Sci. Res. 2013, 5, 2319–7064. [Google Scholar]
  11. Lei, Y.; Huang, Z.H.; Yang, Y.; Shen, W.; Zheng, Y.; Sun, H.; Kang, F. Porous Mesocarbon Microbeads with Graphitic Shells: Constructing a High-Rate, High-Capacity Cathode for Hybrid Supercapacitor. Sci. Rep. 2013, 3, srep02477. [Google Scholar] [CrossRef] [PubMed]
  12. Singh, A.; Chandra, A. Graphite Oxide/Polypyrrole Composite Electrodes for Achieving High Energy Density Supercapacitors. J. Appl. Electrochem. 2013, 43, 773–782. [Google Scholar] [CrossRef]
  13. Sharma, R.; Almáši, M.; Punia, R.C.; Chaudhary, R.; Nehra, S.P.; Dhaka, M.S.; Sharma, A. Solar-Driven Polymer Electrolyte Membrane Fuel Cell for Photovoltaic Hydrogen Production. Int. J. Hydrogen Energy 2023. [Google Scholar] [CrossRef]
  14. Ghosh, S.; Kouamé, N.A.; Ramos, L.; Remita, S.; Dazzi, A.; Deniset-Besseau, A.; Beaunier, P.; Goubard, F.; Aubert, P.H.; Remita, H. Conducting Polymer Nanostructures for Photocatalysis under Visible Light. Nat. Mater. 2015, 14, 505–511. [Google Scholar] [CrossRef] [PubMed]
  15. Das, M.; Sarker, A.K. Multilayer Engineering of Polyaniline and Reduced Graphene Oxide Thin Films on a Plastic Substrate for Flexible Optoelectronic Applications Using NIR. Russ. J. Appl. Chem. 2020, 93, 1561–1570. [Google Scholar] [CrossRef]
  16. Wang, D.; Liu, Y.; Sun, J.; Sun, Z.; Liu, F.; Du, L.; Wang, D. Fabrication and Characterization of Gelatin/Zein Nanofiber Films Loading Perillaldehyde for the Preservation of Chilled Chicken. Foods 2021, 10, 1277. [Google Scholar] [CrossRef]
  17. Praveen Kumar, S.; Sharafudeen, P.C.; Elumalai, P. High Entropy Metal Oxide@graphene Oxide Composite as Electrocatalyst for Green Hydrogen Generation Using Anion Exchange Membrane Seawater Electrolyzer. Int. J. Hydrogen Energy 2023. [Google Scholar] [CrossRef]
  18. Peng, Y.P.; Liu, C.C.; Chen, K.F.; Huang, C.P.; Chen, C.H. Green Synthesis of Nano-Silver–Titanium Nanotube Array (Ag/TNA) Composite for Concurrent Ibuprofen Degradation and Hydrogen Generation. Chemosphere 2021, 264, 128407. [Google Scholar] [CrossRef]
  19. Kanwal, F.; Rani, I.; Batool, A.; Sandali, Y.; Li, C.; Shafique, S.; Irfan, A.; Sulaman, M. Enhanced Dielectric and Photocatalytic Properties of TiO2-Decorated RGO/PANI Hybrid Composites Synthesized by in-Situ Chemical Oxidation Polymerization Route. Mater. Sci. Eng. B 2023, 298, 116837. [Google Scholar] [CrossRef]
  20. Suresh, S.; Sindhu, V. CeO2/PANI/MoS2 Composite Electrode for Symmetric Supercapacitor Application. J. Indian Chem. Soc. 2022, 99, 100727. [Google Scholar] [CrossRef]
  21. Aka, C.; Akgöl, O.; Karaaslan, M.; Akyol, M. Broadband Electromagnetic Wave Absorbing via PANI Coated Fe3O4 Decorated MoS2 Hybrid Nanocomposite. J. Alloys Compd. 2023, 967, 171702. [Google Scholar] [CrossRef]
  22. Zhao, Y.; Wu, C.; Peng, G.; Chen, X.; Yao, X.; Bai, Y.; Wu, F.; Chen, S.; Xu, X. A New Solid Polymer Electrolyte Incorporating Li10GeP2S12 into a Polyethylene Oxide Matrix for All-Solid-State Lithium Batteries. J. Power Sources 2016, 301, 47–53. [Google Scholar] [CrossRef]
  23. Bioud, Y.A.; Boucherif, A.; Belarouci, A.; Paradis, E.; Drouin, D.; Arès, R. Chemical Composition of Nanoporous Layer Formed by Electrochemical Etching of P-Type GaAs. Nanoscale Res. Lett. 2016, 11, 446. [Google Scholar] [CrossRef]
  24. Basak, M.; Rahman, M.L.; Ahmed, M.F.; Biswas, B.; Sharmin, N. The Use of X-Ray Diffraction Peak Profile Analysis to Determine the Structural Parameters of Cobalt Ferrite Nanoparticles Using Debye-Scherrer, Williamson-Hall, Halder-Wagner and Size-Strain Plot: Different Precipitating Agent Approach. J. Alloys Compd. 2022, 895, 162694. [Google Scholar] [CrossRef]
  25. Tabačiarová, J.; Mičušík, M.; Fedorko, P.; Omastová, M. Study of Polypyrrole Aging by XPS, FTIR and Conductivity Measurements. Polym. Degrad. Stab. 2015, 120, 392–401. [Google Scholar] [CrossRef]
  26. Kuroki, S.; Nabae, Y.; Chokai, M.; Kakimoto, M.A.; Miyata, S. Oxygen Reduction Activity of Pyrolyzed Polypyrroles Studied by 15N Solid-State NMR and XPS with Principal Component Analysis. Carbon 2012, 50, 153–162. [Google Scholar] [CrossRef]
  27. Jubu, P.R.; Yam, F.K.; Igba, V.M.; Beh, K.P. Tauc-Plot Scale and Extrapolation Effect on Bandgap Estimation from UV–Vis–NIR Data—A Case Study of β-Ga2O3. J. Solid State Chem. 2020, 290, 121576. [Google Scholar] [CrossRef]
  28. Dolgonos, A.; Mason, T.O.; Poeppelmeier, K.R. Direct Optical Band Gap Measurement in Polycrystalline Semiconductors: A Critical Look at the Tauc Method. J. Solid State Chem. 2016, 240, 43–48. [Google Scholar] [CrossRef]
  29. Basyooni, M.A.; Zaki, S.E.; Eker, Y.R. Fast Optoelectronic Gas Sensing with P-Type V2O5/WS2/Si Heterojunction Thin Film. Mater. Chem. Phys. 2023, 310, 128491. [Google Scholar] [CrossRef]
  30. Ko, Y.H.; Nagaraju, G.; Lee, S.H.; Yu, J.S. Facile Preparation and Optoelectronic Properties of CuO Nanowires for Violet Light Sensing. Mater. Lett. 2014, 117, 217–220. [Google Scholar] [CrossRef]
  31. AlAbdulaal, T.H.; Yahia, I.S. Optical Linearity and Nonlinearity, Structural Morphology of TiO2-Doped PMMA/FTO Polymeric Nanocomposite Films: Laser Power Attenuation. Optik 2021, 227, 166036. [Google Scholar] [CrossRef]
  32. Huang, C.L.; Lee, K.M.; Liu, Z.X.; Lai, R.Y.; Chen, C.K.; Chen, W.C.; Hsu, J.F. Antimicrobial Activity of Electrospun Polyvinyl Alcohol Nanofibers Filled with Poly[2-(Tert-Butylaminoethyl) Methacrylate]-Grafted Graphene Oxide Nanosheets. Polymers 2020, 12, 1449. [Google Scholar] [CrossRef] [PubMed]
  33. Omar, H.H.; Abdullatif, B.M.; El-Kazan, M.M.; El-Gendy, A.M. Red Sea Water and Biochemical Composition of Seaweeds at Southern Coast of Jeddah, Saudi Arabia. Life Sci. J. 2013, 10, 1073–1080. [Google Scholar]
  34. Sagadevan, S.; Vennila, S.; Marlinda, A.R.; Al-Douri, Y.; Rafie Johan, M.; Anita Lett, J. Synthesis and Evaluation of the Structural, Optical, and Antibacterial Properties of Copper Oxide Nanoparticles. Appl. Phys. A Mater. Sci. Process. 2019, 125, 1–9. [Google Scholar] [CrossRef]
  35. Kim, J.S.; Choi, Y.J.; Woo, H.J.; Yang, J.; Song, Y.J.; Kang, M.S.; Cho, J.H. Schottky-Barrier-Controllable Graphene Electrode to Boost Rectification in Organic Vertical P–N Junction Photodiodes. Adv. Funct. Mater. 2017, 27, 1704475. [Google Scholar] [CrossRef]
  36. Periyanagounder, D.; Gnanasekar, P.; Varadhan, P.; He, J.H.; Kulandaivel, J. High Performance, Self-Powered Photodetectors Based on a Graphene/Silicon Schottky Junction Diode. J. Mater. Chem. C 2018, 6, 9545–9551. [Google Scholar] [CrossRef]
  37. Yuan, C.; Zhou, Y.; Zhu, Y.; Liang, J.; Wang, S.; Peng, S.; Li, Y.; Cheng, S.; Yang, M.; Hu, J.; et al. Polymer/Molecular Semiconductor All-Organic Composites for High-Temperature Dielectric Energy Storage. Nat. Commun. 2020, 11, 3919. [Google Scholar] [CrossRef]
  38. Shahi, M.; Paterson, A.F. Small Molecule versus Polymer Semiconductors. Ref. Modul. Mater. Sci. Mater. Eng. 2023, 1, 95–107. [Google Scholar] [CrossRef]
  39. Zeng, L.H.; Chen, Q.M.; Zhang, Z.X.; Wu, D.; Yuan, H.; Li, Y.Y.; Qarony, W.; Lau, S.P.; Luo, L.B.; Tsang, Y.H. Multilayered PdSe2/Perovskite Schottky Junction for Fast, Self-Powered, Polarization-Sensitive, Broadband Photodetectors, and Image Sensor Application. Adv. Sci. 2019, 6, 1901134. [Google Scholar] [CrossRef]
  40. Zhang, T.F.; Li, Z.P.; Wang, J.Z.; Kong, W.Y.; Wu, G.A.; Zheng, Y.Z.; Zhao, Y.W.; Yao, E.X.; Zhuang, N.X.; Luo, L.B. Broadband Photodetector Based on Carbon Nanotube Thin Film/Single Layer Graphene Schottky Junction. Sci. Rep. 2016, 6, 38569. [Google Scholar] [CrossRef]
  41. Lee, J.H.; Lee, W.W.; Yang, D.W.; Chang, W.J.; Kwon, S.S.; Park, W. Il Anomalous Photovoltaic Response of Graphene-on-GaN Schottky Photodiodes. ACS Appl. Mater. Interfaces 2018, 10, 14170–14174. [Google Scholar] [CrossRef] [PubMed]
  42. Hameed, S.A.; Ewais, H.A. Kinetics and Mechanism of the Redox Reaction between Malachite Green and Iron(III) in Aqueous and Micellar Media. Transit. Met. Chem. 2014, 39, 199–204. [Google Scholar] [CrossRef]
  43. Ewais, H.A.; Dahman, F.D.; Abdel-Khalek, A.A. Inner-Sphere Oxidation of Ternary Iminodiacetatochromium(III) Complexes Involving DL-Valine and L-Arginine as Secondary Ligands. Isokinetic Relationship for the Oxidation of Ternary Iminodiacetato-Chromium(III) Complexes by Periodate. Chem. Cent. J. 2009, 3, 3. [Google Scholar] [CrossRef] [PubMed]
  44. Ewais, H.A.; Al-Otaibi, F.D.; Abdel-Khalek, A.A. Kinetics and Mechanism of Oxidation of Iminodiacetatochromium(III) by Periodate. Inorg. React. Mech. 2006, 6, 39–47. [Google Scholar] [CrossRef]
  45. Almohammedi, A.; Shaban, M.; Mostafa, H.; Rabia, M. Nanoporous TiN/TiO2/Alumina Membrane for Photoelectrochemical Hydrogen Production from Sewage Water. Nanomaterials 2021, 11, 2617. [Google Scholar] [CrossRef]
  46. Hadia, N.M.A.; Abdelazeez, A.A.A.; Alzaid, M.; Shaban, M.; Mohamed, S.H.; Hoex, B.; Hajjiah, A.; Rabia, M. Converting Sewage Water into H2 Fuel Gas Using Cu/CuO Nanoporous Photocatalytic Electrodes. Materials 2022, 15, 1489. [Google Scholar] [CrossRef]
  47. Khalafalla, M.A.H.; Hadia, N.M.A.; Elsayed, A.M.; Alruqi, M.; El Malti, W.; Shaban, M.; Rabia, M. ATO/Polyaniline/PbS Nanocomposite as Highly Efficient Photoelectrode for Hydrogen Production from Wastewater with Theoretical Study for the Water Splitting. Adsorpt. Sci. Technol. 2022, 2022, 5628032. [Google Scholar] [CrossRef]
  48. Abdelazeez, A.A.A.; Hadia, N.M.A.; Mourad, A.H.I.; El-Fatah, G.A.; Shaban, M.; Ahmed, A.M.; Alzaid, M.; Cherupurakal, N.; Rabia, M. Effect of Au Plasmonic Material on Poly M-Toluidine for Photoelectrochemical Hydrogen Generation from Sewage Water. Polymers 2022, 14, 768. [Google Scholar] [CrossRef]
  49. Javed, M.S.; Shah, S.S.A.; Najam, T.; Siyal, S.H.; Hussain, S.; Saleem, M.; Zhao, Z.; Mai, W. Achieving High-Energy Density and Superior Cyclic Stability in Flexible and Lightweight Pseudocapacitor through Synergic Effects of Binder-Free CoGa2O4 2D-Hexagonal Nanoplates. Nano Energy 2020, 77, 105276. [Google Scholar] [CrossRef]
Figure 1. The schematic diagram of the hydrogen generation system.
Jcs 07 00463 g001
Figure 2. (a) X-ray pattern and (b) FTIR spectroscopy of P3MA and As2O3/P3MA nanocomposite. XPS spectra survey of (c) As2O3/P3MA nanocomposite and (d) As3d3/2 (brown) and As3d5/2 (red) spectra.
Jcs 07 00463 g002
Figure 3. (a) Optical (b) the energy band gap for of As2O3/P3MA (red curve) and P3MA (black curve).
Jcs 07 00463 g003
Figure 4. SEM of (a) P3MA and (b) As2O3/P3MA nanocomposite. (c) TEM of As2O3/P3MA nanocomposite. Theoretical modeling: cross section and roughness of (d) P3MA and (e) As2O3/P3MA nanocomposite.
Jcs 07 00463 g004
Figure 5. The produced Jph and Jo values under light and dark conditions, respectively, through the (a) current–voltage and (b) current–time relations.
Jcs 07 00463 g005
Figure 6. (a) The response of As2O3/P3MA photoelectrode for various frequency light (current voltage) (b) the Jph values at −0.83 V.
Jcs 07 00463 g006
Figure 7. The estimated hydrogen moles through the As2O3/P3MA nanocomposite photoelectrode.
Jcs 07 00463 g006
Table 1. The Red Sea water with metal concentrations [33].
Heavy MetalConc. (mg/L)
B0.132
Pb0.008
Zn0.044
Ni0.001
Cr0.005
Mn0.009
Cd0.001
Cu0.10
Fe0.012
Disclaimer/Publisher’s Note: The statements, opinions and data contained in all publications are solely those of the individual author(s) and contributor(s) and not of MDPI and/or the editor(s). MDPI and/or the editor(s) disclaim responsibility for any injury to people or property resulting from any ideas, methods, instructions or products referred to in the content.

