Article

Synthesis and Properties of Rubidium Salts of Phosphotungstic Acid

by
Andrey A. Belmesov
1,2,
Alexander A. Glukhov
1,2,
Maxim V. Tsvetkov
1,2,
Lyubov V. Shmygleva
2,
Timofey A. Shikhov
1,
Aleksey O. Lembikov
3,
Anton A. Belov
3,
Nikita P. Ivanov
3 and
Oleg O. Shichalin
1,3,*
1
Sakhalin State University, 33, Kommunistichesky Ave., Yuzhno-Sakhalinsk 693000, Russia
2
Federal Research Center of Problems of Chemical Physics and Medicinal Chemistry, Russian Academy of Sciences, 1 Academician Semenov Av., Chernogolovka 142432, Russia
3
Far Eastern Federal University, 10 Ajax Bay, Russky Island, Vladivostok 690922, Russia
*
Author to whom correspondence should be addressed.
J. Compos. Sci. 2023, 7(11), 454; https://doi.org/10.3390/jcs7110454
Submission received: 2 October 2023 / Revised: 14 October 2023 / Accepted: 25 October 2023 / Published: 1 November 2023

Abstract

:
The work is devoted to the study of the influence of synthesis conditions on the properties of water-insoluble rubidium salts of phosphotungstic acid (PTA). Such heteropoly compounds have a wide range of applications, including in the field of electrocatalysts and solid electrolytes for various electrochemical devices. The acid salts of PTA with high activity of acid sites on the particle surface are of particular interest. It is known that the properties of water-insoluble PTA salts strongly depend on synthesis conditions, such as the ratio of reagents, temperature, concentrations, and other parameters. The work examines the influence of the ratio and concentration of reagents on the sizes of crystallites and agglomerates, specific surface area (SSA), porosity, water content, and ionic conductivity of the synthesized PTA salts. The SSA value of the obtained samples varied in the range of 84–123 m2 g−1, and the ionic conductivity was 13–90 mS cm−1 at room temperature and 75% RH. An increase in the acid concentration and the degree of proton substitution led to an increase in SSA, accompanied by an increase in particle sizes without changing the size of crystallites. The results of the work may be useful for the development of new materials based on the obtained salts in many fields, including hydrogen energy.

1. Introduction

Rubidium salts of phosphotungstic acid (PTA) are one of the classes of heteropoly compounds that can be used in various fields, including the development of effective materials for electrochemical devices, such as fuel cells, gas sensors, and redox flow batteries [1,2,3,4,5,6,7,8,9,10]. Water-insoluble salts of PTA are widely used in organic catalysis [11,12,13], electrocatalysis [14], doping of polymer membranes [1,2,15,16], and various other fields due to an excellent combination of properties: high acidity, specific surface area (SSA), porosity, thermal stability, proton conductivity, and low solubility in water [17,18,19,20,21,22,23,24]. Water-insoluble salts of PTA (containing cations such as cesium, rubidium, ammonium, or silver) have improved properties compared with the initial acid. Insoluble salts of PTA self-assemble into large particles (with an average size of 100–2000 nm) during the synthesis process. These agglomerates are composed of small crystallites 10–50 nm in size [21,23,24,25,26,27,28,29,30]. This structure determines the developed surface and high porosity. Acid salts of PTA are of greatest interest since they have the maximum specific concentration of acid sites per unit surface area of particles [31,32].
Among the water-insoluble PTA salts, rubidium salts are promising for various applications. Thus, in [33], it was shown that rubidium salts have a larger SSA and pore volume compared with cesium salts; therefore, they can be used as catalysts in organic synthesis [34], including in the reactions of hydrogenation and dehydrogenation of organic compounds [35].The catalytic effect of rubidium salts of PTA promotes the activation of the bond between hydrogen and organic molecules, which allows reactions to be carried out with high efficiency [36]. Hybrid Nafion membranes doped with the rubidium salt of PTA show higher values of conductivity and strength compared with membranes doped with cesium salt [15]. It is worth noting that the ionic conductivity of rubidium and cesium salts of PTA has similar values and is the highest among other insoluble salts of PTA [20,22]. At the same time, the solubility of these salts in water is the lowest among other insoluble PTA salts [37]. Thus, rubidium salts of PTA are promising compounds for the development of hydrogen energy. Like cesium salts, they can be used to create effective electrocatalysts for water electrolysis [38,39] or for polymer membrane modification [15,40].
The properties of insoluble PTA salts strongly depend on synthesis conditions. Thus, by varying the synthesis parameters, it is possible to change the sizes of crystallites and particles/agglomerates, SSA, porosity, composition, ionic conductivity, etc. [18,21,23,24,41,42]. To obtain the most active catalysts, different synthesis parameters are varied: the type of initial reagents, their concentration and ratio, precipitate washing modes, synthesis temperature, and subsequent annealing temperature. From this point of view, cesium salts of PTA have been most widely studied [19,23,24,32]. In addition, there are a number of publications on ammonium [19,21,43,44], potassium [32,45,46], and silver [30,47,48] salts. Rubidium salts of PTA remain the least studied. For example, in [37], a number of samples of rubidium salts of PTA with different degrees of proton substitution from 1.8 to 3 were obtained. However, only data on the solubility, water content, and composition of the resulting salts were presented. Data on ionic conductivity, SSA, and particle size of rubidium salts of PTA are not available in the literature.
Therefore, the purpose of this work was to study the influence of synthesis conditions (ratios and concentrations of reagents) on the physicochemical and ion-conducting properties of rubidium salts of PTA. Studying the influence of synthesis conditions on the properties of rubidium salts of PTA will expand scientific knowledge about such compounds and their potential for various applications.

2. Experimental

2.1. Synthesis of the Rubidium Salts of PTA

The synthesis of RbxH3−xPW12O40 (1 ≤ x ≤ 3) was carried out by neutralizing an aqueous solution of PTA with a solution of RbCl. All chemicals were purchased from Nevareaktiv LLC (Saint-Petersburg, Russia) at 99.9% purity without additional purification. PTA was obtained using a well-known method [49]. Two series of “kmM-x” samples were obtained (k is the concentration of PTA, x is the stoichiometric degree of proton substitution). PTA concentrations (k) were 2.5 and 14 mM; the concentration of the rubidium chloride solution was 1.5 times higher than the concentration of PTA. The volumes of mixed solutions were determined from stoichiometric ratios to obtain a salt with the required value of the degree of proton substitution (x). The obtained milky-white suspensions were centrifuged to separate insoluble salts, followed by decantation of the mother liquor. The resulting precipitate was washed using ultrasound and centrifugation 7 times and dried in an oven at 60 °C for 3 days; the powders thus obtained were white or white-gray in color.

2.2. Sample Characterization

Microphotographs of the samples were obtained using a scanning electron emission microscope (SEM) LEO SUPRA 25 (Carl Zeiss, Jena, Germany). Energy-dispersive X-ray spectroscopy analysis (EDX) was also performed alongside the microscopy.
Particle size distribution was determined on the “Analysette 22 Next” laser diffractometer (Fritsch, Idar-Oberstein, Germany).
The specific surface area (SSA) of the samples was determined by the nitrogen adsorption–desorption method on a QUADRASORB SI instrument (Anton Paar Quantachrome Instruments, Boynton Beach, FL, USA). Samples were degassed for 3 h at 300 °C in a helium atmosphere. Sample preparation and calculation of the specific surface area were carried out in accordance with the methodology of [50].
The crystalline structure of the obtained samples was studied using X-ray diffraction (XRD) analysis at room temperature. The measurements were carried out in the range 2θ = 5–80° in 0.04° increments on an Aeris instrument (Malvern Panalytical B.V., Almelo, The Netherlands) using CuKα radiation. For the identification of crystalline phases, the PDF-4+ ICDD database was used. Calculation of the crystalline parameters was performed using the Rietveld refinement method in Topas software. The coherent scattering region (CSR) was determined using the Sherer equation in the Fityk-1.3.1 software.
The Fourier-transform infrared (FTIR) spectra of the prepared samples were recorded at ambient pressure on the spectrometer Vertex 70 V (Germany) at room temperature using a Bruker diamond attachment in the 50–4500 cm−1 range (resolution 4 cm−1, 50 scans).
The amount of water in the samples was determined by simultaneous thermal analysis (STA) on Netzsch STA 409 PC Luxx and QMS 403 C Aëolos instruments (Netzsch, Selb, Germany). The thermogravimetric analysis (TGA) and differential scanning calorimetry (DSC) curves were recorded in the temperature range of 25–300 °C under an argon atmosphere at a heating rate of 10 °C/min.
The ion conductivity of the samples was measured by impedance spectroscopy in a symmetric two-electrode cell on an Elins P40X potentiostat with an FRA module (Russia) in the frequency range of 2 MHz–1 Hz with an amplitude of 10 mV. The samples were pressed between titanium electrodes at a pressure of 3 MPa in a cell with a diameter of 5 mm. The temperature was controlled using a Huber Pilot One CC 805 thermostat (Germany). The Nyquist plots were analyzed by a graphoanalytical method.

3. Results and Discussion

3.1. Sample Composition and Morphology

Figure 1 shows typical SEM images of the obtained acidic rubidium salts RbxH3−xPW12O40. All particles have a spherical shape and sizes in the range of 0.1 to 2 μm. There is a tendency for particle sizes to increase with higher concentrations of the PTA solution, which contrasts with the data obtained for cesium salts in [24]. The distribution of particles in all studied salts has a monomodal form and is well described by the lognormal equation (Figure 2). The average particle size varies in the range of 0.3–0.5 µm (Table 1). Along with an increase in the stoichiometric degree of substitution of protons x, an increase in the average particle size (except for the 14mM-1 sample) and SSA are observed, regardless of the PTA concentration. As in the case of cesium salts [24], the rubidium content determined by the EDX method is higher than the theoretically expected value (Table 1). The typical EDX spectrum with corresponding SEM image is shown in Figure 2. Neutral rubidium salt of PTA can be obtained only by increasing the ratio of reagents. The samples with the highest degree of proton substitution x = 3 have the largest SSA = 123 m2 and 120 m2, respectively. In general, the increase in SSA with x increasing correlates with literature data for cesium salts [19,31,51]. However, the SSA of cesium salts prepared using the same method, which was used in this work, does not depend on x and is 103 and 136 m2 g–1 for PTA concentrations of 2.5 and 14 mM, respectively [24].
The nitrogen adsorption–desorption isotherms for the studied rubidium salts are presented in Figure 3a. According to the IUPAC classification, such isotherms are of different types. The isotherms of samples with an SSA < 100 m2 g−1 are of the type IV; hysteresis loop at relative pressure p/p0 between 0.4 and 1.0 exhibits an H2 type. In these cases, capillary condensation takes place in mesopores, and the distribution of pore size and shape is not well defined. This is confirmed by the character of the differential pore size distribution, obtained by the density functional theory (DFT) method (Figure 3b). The average pore size calculated by the Barrett–Joyner–Halenda method is 3.4 and 4.3 nm for the salts, synthesized at PTA concentrations of 14 and 2.5 mM, respectively.
The isotherm of the 14mM-2.5 sample is type II, corresponding to the case of polymolecular adsorption. The absence of a hysteresis loop indicates the absence of capillary condensation and, accordingly, the absence of mesopores. A steep rise in the isotherm in the low-pressure region and a high value of the C parameter indicate the presence of micropores. To estimate the volume of micropores (Vmicro), a comparative t-plot method was used; the analyzed isotherm was rearranged into a dependence of the adsorption value not on p/p0 but on t (the statistical thickness of the adsorption film). It allowed for the determinationof Vmicro, excluding adsorption on the outer surface, which is equal to 0.01 cm3g−1 (Table 1).
The adsorption–desorption isotherms for the salts with the highest SSA value are of type I. This type of isotherm is typical for adsorption on microporous adsorbents. Due to a different adsorption mechanism (volumetric filling of micropores instead of polymolecular adsorption), the BET theory is not applicable tomicroporous samples. The Dubinin–Radushkevich (DR) method of microporosity calculation was used. The Vmicro for these two samples is four times higher than for the other studied samples and is 0.04–0.05 cm3g−1 (Table 1), with an average pore size of 1.2–1.3 nm.

3.2. Crystalline Phases

The obtained samples of PTA salts with different degrees of proton substitution have similar XRD peak positions (Figure 4c). The corresponding diffraction maxima are characteristic of the rubidium salt of PTA with the general formula Rb3(PO4)(W12O36) PDF #01-076-4195, of unsubstituted PTA H3(PO4)(W12O36) PDF #01-070-4202, and of acid salts with intermediate degrees of proton substitution. PTA, as well as its acidic and fully substituted rubidium salts, have a cubical crystal lattice belonging to the space group P n 3 _ m (Figure 3a). A model image of the structure of a fully substituted rubidium salt of PTA is shown in Figure 3b. The intensity of the diffraction maximum, which belongs to the crystallographic plane with Miller indices (110), decreases as the rubidium content in the resulting salts increases. According to the diffraction patterns of the reference structures, the intensity of the diffraction maximum (110) for unsubstituted PTA reaches the highest value in comparison with the fully substituted salt (Figure 4a). This is in good agreement with the increase in the intensity of the diffraction maximum (110) along with the decrease in the degree of proton substitution, which was observed in the XRD patterns of the experimental samples (Figure 3b). The crystallographic plane (110) intersects predominantly the positions of rubidium atoms in the crystal lattice of the resulting substances (Figure 4b), so the intensity of this reflection is directly related to the rubidium content.
Table 2 shows the values of the crystalline parameters of the obtained samples of rubidium salts of PTA, calculated by the Rietveld method. The weighted deviation factor R2 during the calculation did not exceed 10%. The crystal lattice parameter a does not depend on the salt synthesis conditions and is varied in the range of a = 11.67–11.68 Å, which is slightly higher than the literature data (a = 11.63 ± 0.03 Å) [22]. The calculated value of the crystal lattice parameter a is comparable to the value of a for ammonium salts of PTA (11.7 Å) [21,43,52]. However, the calculated value of a is lower than the value of the lattice parameter for cesium and silver salts of PTA (11.8–11.9 Å) [23,24,28,51,53,54,55]. As the degree of substitution of protons x increases, the occupancy of positions corresponding to rubidium atoms also increases. The calculation of the CSR (LXRD) was carried out using the Scherrer formula with the coefficient K = 0.9, corresponding to spherical particles. The LXRD value varies in the range of 19–46 nm (Table 2), which is slightly higher than the literature data (LXRD = 12 nm according to [22]). In general, this crystallite size value is characteristic of water-insoluble PTA salts (12–70 nm).

3.3. FTIR Spectra

The FTIR spectra of the obtained samples of rubidium salts of PTA with different degrees of proton substitution are presented in Figure 5. The most intense changes in the absorption bands of FTIR spectra are observed in the range of 500–1100 cm–1. According to the literature data, this range corresponds to the Keggin anion PW12O403− [23,56]. The Keggin anion is a very rigid structural formation. Its structure does not depend on the degree of substitution of protons by other cations or on the degree of hydration of the salt. Consequently, the band intensities and the frequencies of vibrational transitions are also practically independent of these parameters. Therefore, the Keggin anion is suitable for use as an internal standard. In this regard, the intensities of the ν(OH) and δ(HOH) bands of H2O molecules and proton hydrates can be normalized to the intensities ν(WO). In the present study, the FTIR spectra were normalized to the most intense band at 781 cm−1 (Figure 4a), corresponding to the Keggin anion.
High-intensity bands at 773 cm–1, 885 cm–1, 981 cm–1, and 1078 cm–1 correspond to stretching vibrations of the P–O, W=O, and W–O–W bonds. Medium-intensity bands at 522 cm–1 and 595 cm–1 characterize bending vibrations of the O–P–O and W–O–W bonds.
The presence of a narrow band at 1620 cm–1 in the FTIR spectra (Figure 4) indicates bending vibrations of the H–O–H bond. This is explained by the adsorption of water molecules in the pore space of rubidium salts of PTA with the formation of intermolecular hydrogen bonds. The peak at 1415 cm–1 can be explained by the presence of rubidium chloride impurities. As can be seen from Figure 5b, this peak is observed only in the FTIR spectrum of sample 14mM-2.5. A continuous broad shoulder toward low frequencies from the maximum at 3600 cm–1 is caused by vibrational transitions of hydrates of higher protons [57].

3.4. Water Content

Typical STA curves for the obtained samples of PTA salts with different degrees of proton substitution have a similar appearance (Figure 6b). Heating the samples to a temperature of 145–190 °C is accompanied by a loss of mass in one stage due to the dehydration of the salts (Figure 6a). This is confirmed by the mass spectra of the outlet gases, in which there are ion currents with ratios m/z = 18 and m/z = 17, characteristic of water molecules H2O and OH- particles, respectively. The total mass loss for the obtained samples with different degrees of rubidium substitution varies in the range of 95.2–97.8%. At the same time, samples obtained from solutions with a PTA concentration of k = 2.5 mM, as well as samples with high degrees of proton substitution x, have larger total mass losses. The dehydration of these samples is also completed at a higher temperature. The position of the maximum endothermic peak on the DSC curves does not depend on the synthesis conditions of the studied rubidium salts and lies in the region of 65–90 °C.
Based on the data from STA, the number of water molecules per salt molecule was calculated (Table 3). The total mass loss for synthesized PTA salts varies in the range of 2–5% (Figure 5b), which corresponds to n = 4–9 water molecules per salt molecule (Table 3). With an increase in the concentration of PTA k during synthesis and the degree of proton substitution x, an increase in water content n in the obtained samples is also observed. This observation correlates well with an increase in SSA (Table 1). Since the observed dehydration process is a one-stage process (Figure 6), it can be assumed that the water contained in the samples is adsorbed on their surface and not bound in the crystal structure of the studied rubidium salts of PTA.

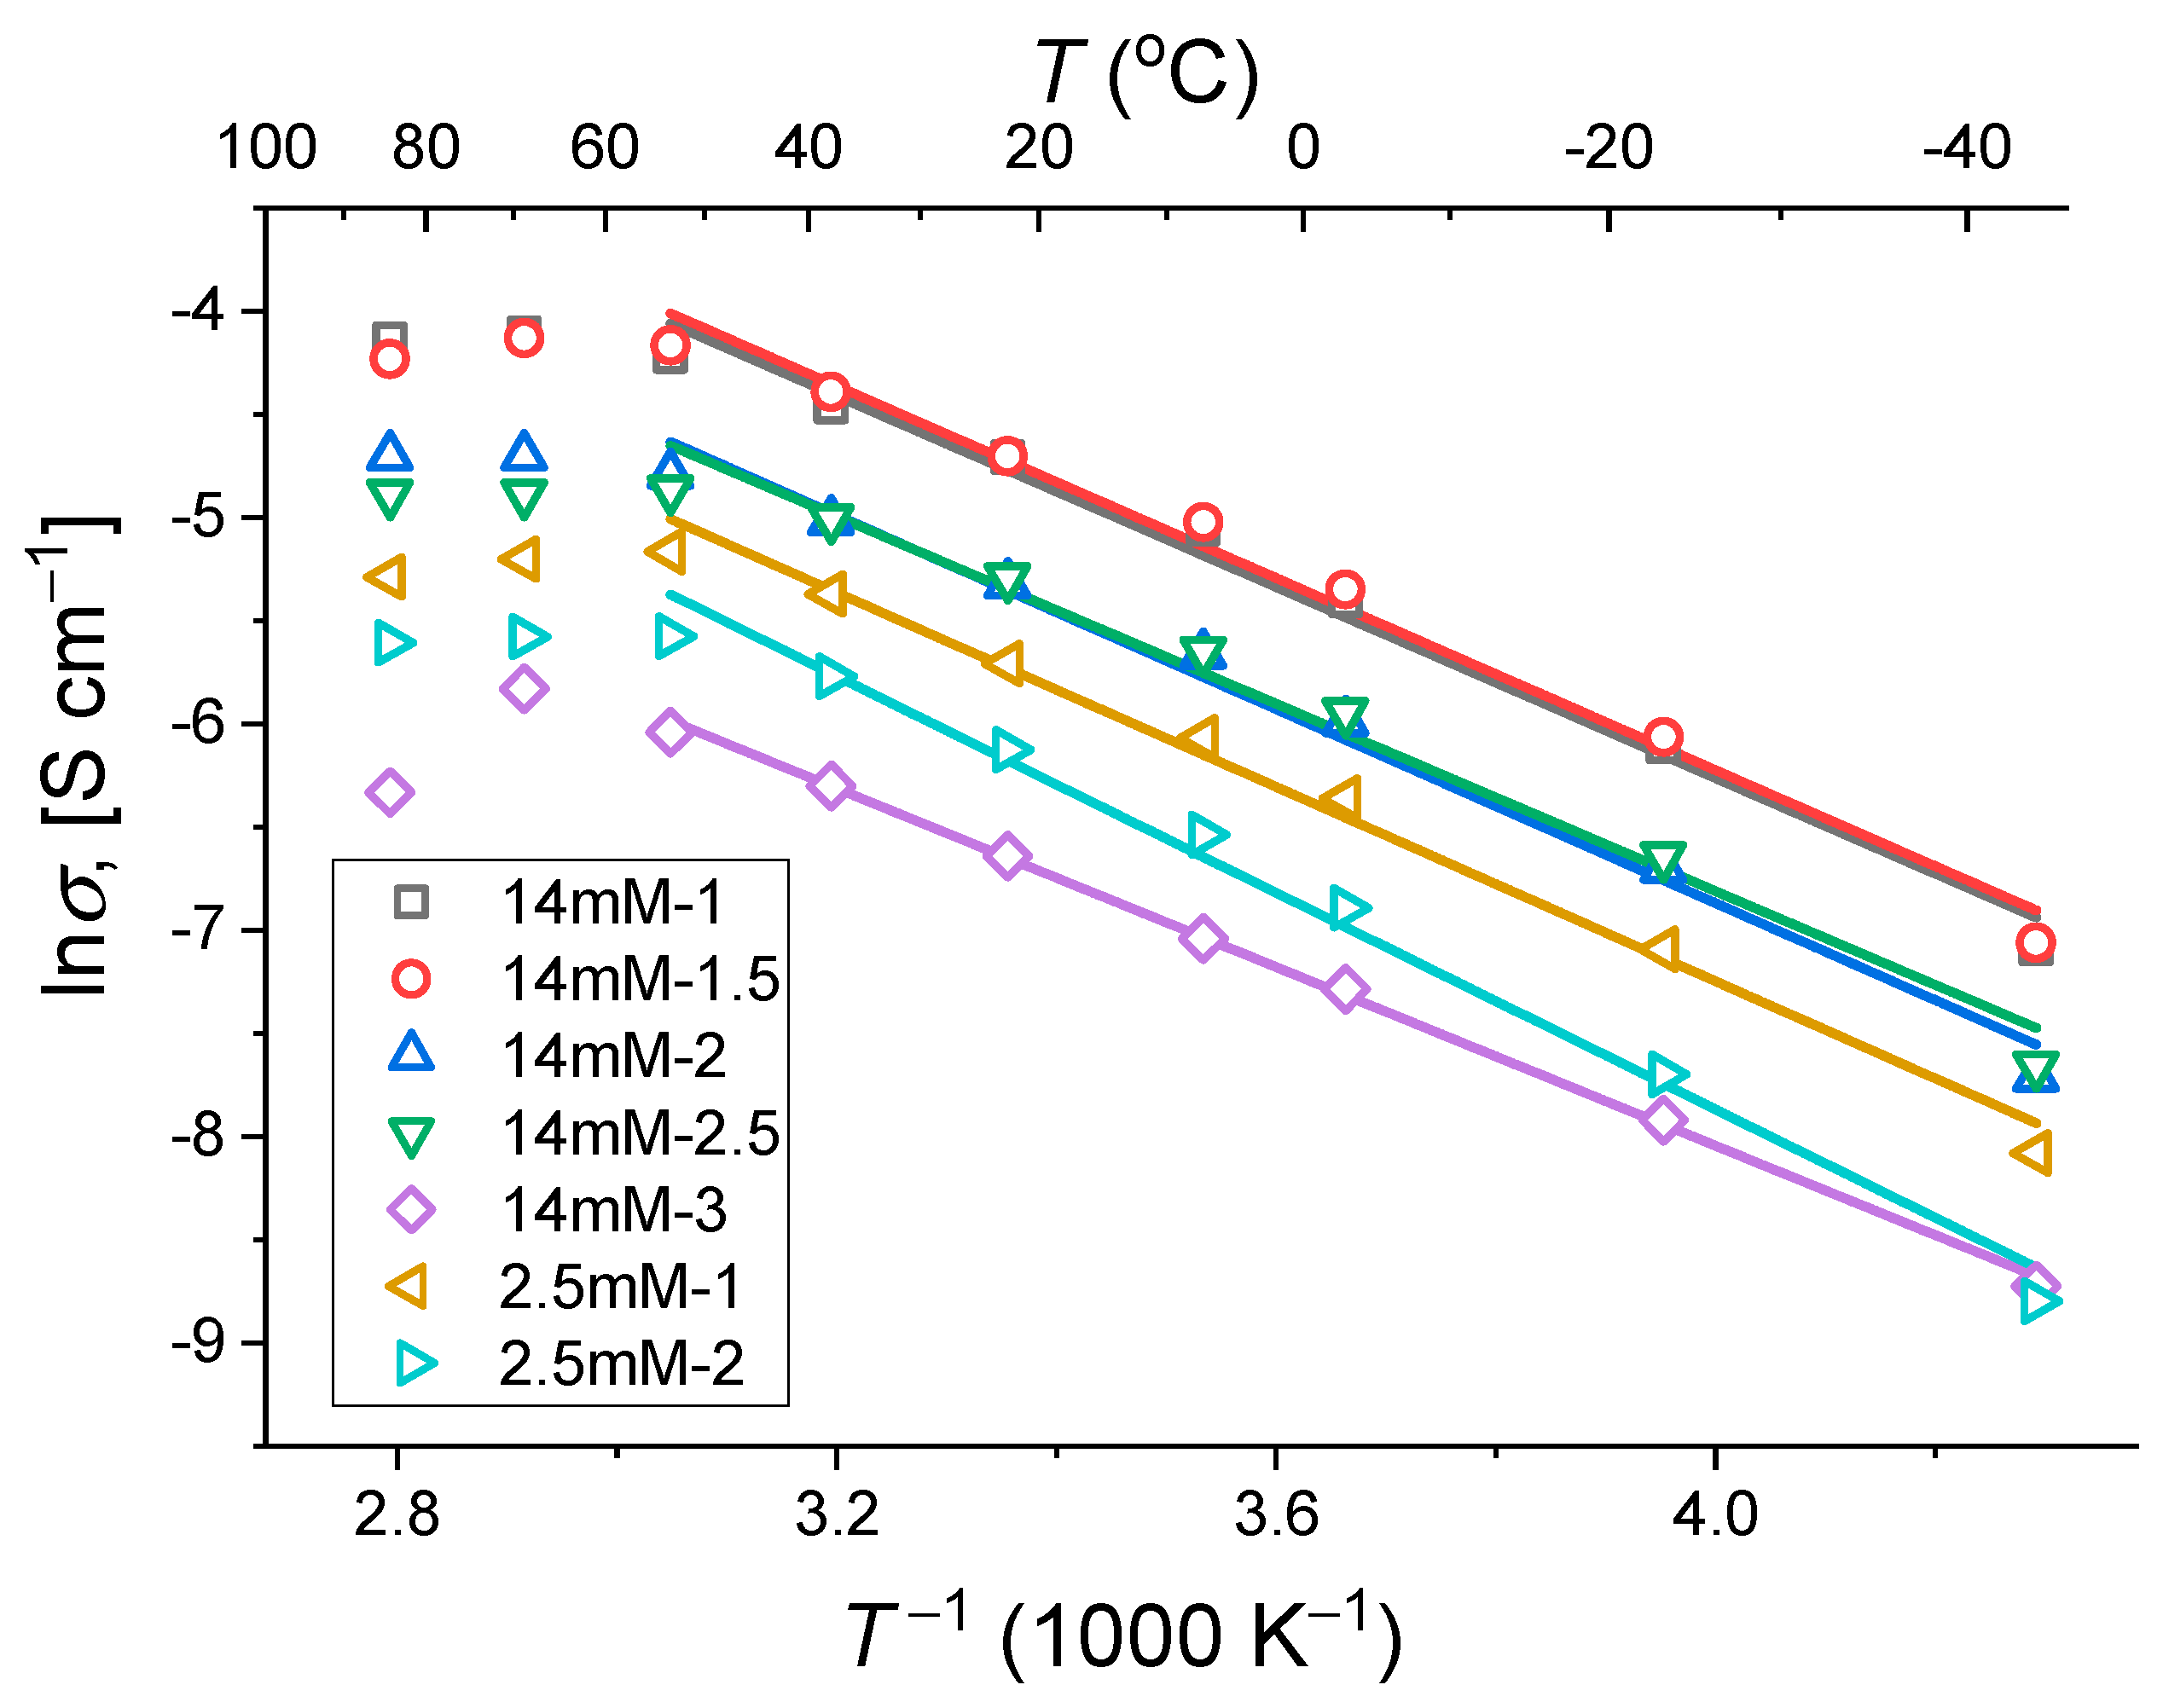
3.5. Ionic Conductivity

The ionic conductivity of samples kept at RH = 75% was determined from the impedance spectra. Figure 7 shows a graph of the temperature dependence of the specific ionic conductivity of the studied samples. In the temperature range from −40 to +55 °C, the curves are well described by the Arrhenius equation. As the ambient temperature increases above 55 °C, a deviation from linearity σ in Arrhenius coordinates is observed with a decrease in conductivity, which is apparently due to the removal of water from the samples, as confirmed by TGA data (Figure 6b). The activation energy of conductivity, calculated from the slope of the straight lines, does not depend on the synthesis conditions and is Eσ = 20 ± 2 eV (Table 3), which indicates the same nature of ionic conductivity in this temperature range.
At room temperature (25 °C), the specific ionic conductivity of the studied rubidium salts lies in the range of 9 to 1.3 mS cm−1, which is consistent with the literature data (5 mS cm−1 at RH = 90% [22]). In the series of samples from 14mM-1 to 14mM-3 (Table 3), a decrease in ionic conductivity is observed (Table 3), even though the water content increases. In addition, a decrease in the concentration of PTA samples also leads to a decrease in the value of ionic conductivity. As was shown in [28], the main charge carriers in water-insoluble PTA salts are protons, and their transfer occurs mainly along the surface of crystallites and large particles or agglomerates consisting of them. In the studied samples, the number of protons in this series changes insignificantly, but it can be assumed that their number can vary greatly on the surface and volume of the crystallite, depending on the synthesis conditions. Therefore, a number of additional studies are required to accurately describe the reasons for this behavior and the mechanism of ionic conduction.

4. Conclusions

For the first time, the influence of such synthesis conditions as the ratio of reagents and the concentration of PTA on the most important properties of rubidium salts RbxH3−xPW12O40 (composition, particle morphology, crystalline structure, water content, and ion conductivity) was studied. The degree of proton substitution by rubidium ions weakly depends on the ratio of the reagents; rubidium salts of the composition RbH2PW12O40 and Rb3PW12O40 could not be obtained under the synthesis conditions studied. An increase in the ratio of reagents and a decrease in the concentration of the PTA solution leads to a decrease in the CSR, while the crystal lattice parameter a remains unchanged. An increase in SSA and the average particle size of the resulting salts is observed with higher ratios of reagents and lower PTA concentrations. The presence of adsorption water in the samples is confirmed by the direct dependence of the water content in the samples on the SSA value. An anomalous decrease in specific ionic conductivity with an increase in the number of water molecules per salt molecule and similar values of the degree of proton substitution x indicates a significant contribution of charge carriers and their distribution in the crystallites of rubidium salts. We recommend synthesizing salts in high concentrations and with the addition of a small amount of cesium chloride (2.5–3 mole per 1 mol of PTA). In this case, salts with a larger SSA and water content will be obtained. All these factors will positively affect the catalysis of reactions or water retention in polymer membrane modification. Optimization of parameters for the synthesis of rubidium salts of PTA can contribute to the creation of effective functional materials for various fields of application.

Author Contributions

A.A.B. (Andrey A. Belmesov)—Data curation, Methodology, Software; A.A.G. Data curation, Methodology, Software; M.V.T. Data curation, Methodology, Software, L.V.S.—Conceptualization, Writing—review & editing, T.A.S.—Validation, A.O.L.—Validation, A.A.B. (Anton A. Belov)—Validation, N.P.I.—Validation; O.O.S.—Conceptualization, Project administration, Writing—original draft, Resources. All authors have read and agreed to the published version of the manuscript.

Funding

The work was funded by the State Assignment of Sakhalin State University (registration no. 122012500156-1).

Data Availability Statement

The data presented in this study are available on request from the corresponding author.

Acknowledgments

The work was carried out in accordance with the State Assignment of Sakhalin State University (registration no. 122012500156-1). The work has been performed using the equipment of the Federal Research Center for Problems of Chemical Physics and Medical Chemistry, Russian Academy of Sciences.

Conflicts of Interest

The authors declare no conflict of interest.

References

  1. Asensio, J.A.; Sánchez, E.M.; Gómez-Romero, P. Proton-Conducting Membranes Based on Benzimidazole Polymers for High-Temperature PEM Fuel Cells. A Chemical Quest. Chem. Soc. Rev. 2010, 39, 3210. [Google Scholar] [CrossRef]
  2. Herring, A.M. Inorganic–Polymer Composite Membranes for Proton Exchange Membrane Fuel Cells. J. Macromol. Sci. Part C Polym. Rev. 2006, 46, 245–296. [Google Scholar] [CrossRef]
  3. Amirinejad, M.; Madaeni, S.S.; Navarra, M.A.; Rafiee, E.; Scrosati, B. Preparation and Characterization of Phosphotungstic Acid-Derived Salt/Nafion Nanocomposite Membranes for Proton Exchange Membrane Fuel Cells. J. Power Sources 2011, 196, 988–998. [Google Scholar] [CrossRef]
  4. Treglazov, I.; Leonova, L.; Dobrovolsky, Y.; Ryabov, A.; Vakulenko, A.; Vassiliev, S. Electrocatalytic Effects in Gas Sensors Based on Low-Temperature Superprotonics. Sens. Actuators B Chem. 2005, 106, 164–169. [Google Scholar] [CrossRef]
  5. Ayranci, R.; Torlak, Y.; Soganci, T.; Ak, M. Trilacunary Keggin Type Polyoxometalate-Conducting Polymer Composites for Amperometric Glucose Detection. J. Electrochem. Soc. 2018, 165, B638–B643. [Google Scholar] [CrossRef]
  6. Morosanova, M.A.; Morosanova, E.I. Silica-Titania Xerogel Doped with Mo,P-Heteropoly Compounds for Solid Phase Spectrophotometric Determination of Ascorbic Acid in Fruit Juices, Pharmaceuticals, and Synthetic Urine. Chem. Cent. J. 2017, 11, 3. [Google Scholar] [CrossRef]
  7. Kim, C.; Wu, I.; Kuo, M.-C.; Carmosino, D.J.; Bloom, E.W.; Seifert, S.; Cullen, D.A.; Ha, P.; Lindell, M.J.; Jiang, R.; et al. Improved Fuel Cell Chemical Durability of an Heteropoly Acid Functionalized Perfluorinated Terpolymer-Perfluorosulfonic Acid Composite Membrane. J. Electrochem. Soc. 2023, 170, 024505. [Google Scholar] [CrossRef]
  8. Motz, A.R.; Kuo, M.-C.; Bender, G.; Pivovar, B.S.; Herring, A.M. Heteropoly Acid Functionalized Membranes for High Performance and Chemically Stable Fuel Cell Operation. ECS Trans. 2018, 86, 421–429. [Google Scholar] [CrossRef]
  9. Liu, Y.; Zhang, J.; Lu, S.; Xiang, Y. Polyoxometalate-Based Electrolyte Materials in Redox Flow Batteries: Current Trends and Emerging Opportunities. Mater. Rep. Energy 2022, 2, 100094. [Google Scholar] [CrossRef]
  10. Barros, Á.; Artetxe, B.; Eletxigerra, U.; Aranzabe, E.; Gutiérrez-Zorrilla, J.M. Systematic Approach to the Synthesis of Cobalt-Containing Polyoxometalates for Their Application as Energy Storage Materials. Materials 2023, 16, 5054. [Google Scholar] [CrossRef]
  11. Enferadi-Kerenkan, A.; Do, T.-O.; Kaliaguine, S. Heterogeneous Catalysis by Tungsten-Based Heteropoly Compounds. Catal. Sci. Technol. 2018, 8, 2257–2284. [Google Scholar] [CrossRef]
  12. Bhadra, K.H.; Yadav, G.D. Atom Economical Benzylation of Phenol with Benzyl Alcohol Using 20 % (w/w)Cs2.5H0.5PW12O40 Supported on Mesocellular Foam Silica (MCF) and Its Kinetics. Microporous Mesoporous Mater. 2018, 263, 190–200. [Google Scholar] [CrossRef]
  13. Galadima, A.; Muraza, O. Role of Zeolite Catalysts for Benzene Removal from Gasoline via Alkylation: A Review. Microporous Mesoporous Mater. 2015, 213, 169–180. [Google Scholar] [CrossRef]
  14. Zurowski, A.; Kolary-Zurowska, A.; Marassi, R.; Kulesza, P.J. Development of Multifunctional Catalysts for Electrooxidation of Ethanol. ECS Trans. 2010, 25, 147–154. [Google Scholar] [CrossRef]
  15. Osipov, A.K.; Safronova, E.Y.; Yaroslavtsev, A.B. Hybrid Materials Based on the Nafion Membrane and Acid Salts of Heteropoly Acids MxH3−xPW12O40 and MxH4−xSiW12O40 (M = Rb and Cs). Pet. Chem. 2016, 56, 1014–1019. [Google Scholar] [CrossRef]
  16. Akbari, S.; Hamed Mosavian, M.T.; Moosavi, F.; Ahmadpour, A. Elucidating the Morphological Aspects and Proton Dynamics in a Hybrid Perfluorosulfonic Acid Membrane for Medium-Temperature Fuel Cell Applications. Phys. Chem. Chem. Phys. 2018, 20, 29778–29789. [Google Scholar] [CrossRef]
  17. Okamoto, K.; Uchida, S.; Ito, T.; Mizuno, N. Self-Organization of All-Inorganic Dodecatungstophosphate Nanocrystallites. J. Am. Chem. Soc. 2007, 129, 7378–7384. [Google Scholar] [CrossRef]
  18. Matachowski, L.; Drelinkiewicz, A.; Rachwalik, R.; Zimowska, M.; Mucha, D.; Ruggiero-Mikołajczyk, M. Preparation and Characterization of Mesoporous Cs2HPW12O40 Salt, Active in Transformation of m-Xylene. Appl. Catal. A Gen. 2013, 450, 19–27. [Google Scholar] [CrossRef]
  19. Izumi, Y.; Ogawa, M.; Urabe, K. Alkali Metal Salts and Ammonium Salts of Keggin-Type Heteropolyacids as Solid Acid Catalysts for Liquid-Phase Friedel-Crafts Reactions. Appl. Catal. A Gen. 1995, 132, 127–140. [Google Scholar] [CrossRef]
  20. Ukshe, E.A.; Leonova, L.S.; Korosteleva, A.I. Protonic Conduction in Heteropoly Compounds. Solid State Ion. 1989, 36, 219–223. [Google Scholar] [CrossRef]
  21. Shmygleva, L.V.; Kayumov, R.R.; Baranov, A.A.; Shilov, G.V.; Leonova, L.S. Influence of Calcination Temperature of Acidic Ammonium Salts of Phosphotungstic Acid on Their Composition and Properties. J. Solid State Chem. 2021, 303, 122527. [Google Scholar] [CrossRef]
  22. Safronova, E.Y.; Osipov, A.K.; Baranchikov, A.E.; Yaroslavtsev, A.B. Proton Conductivity of MxH3−xPX12O40 and MxH4−xSiX12O40 (M = Rb, Cs; X = W, Mo) Acid Salts of Heteropolyacids. Inorg. Mater. 2015, 51, 1157–1162. [Google Scholar] [CrossRef]
  23. Baranov, A.A.; Domashnev, D.I.; Leonova, L.S.; Belmesov, A.A.; Antonenko, A.O.; Nefedov, D.Y.; Shmygleva, L.V.; Dobrovolsky, Y.A. Effect of Solution PH on Morphology and Electrochemical Properties of Cesium Salts of Phosphotungstic Acid. Mater. Sci. Eng. B Solid-State Mater. Adv. Technol. 2020, 256, 114544. [Google Scholar] [CrossRef]
  24. Baranov, A.; Leonova, L.; Belmesov, A.; Domashnev, D.; Levchenko, A.; Shmygleva, L.; Karelin, A.; Dremova, N.; Dobrovolsky, Y. Acidic Cesium Salts of Phosphotungstic Acid: Morphology, Water Content and Ionic Conductivity. Solid State Ion. 2022, 379, 115902. [Google Scholar] [CrossRef]
  25. Okuhara, T.; Watanabe, H.; Nishimura, T.; Inumaru, K.; Misono, M. Microstructure of Cesium Hydrogen Salts of 12-Tungstophosphoric Acid Relevant to Novel Acid Catalysis. Chem. Mater. 2000, 12, 2230–2238. [Google Scholar] [CrossRef]
  26. Inumaru, K.; Nakajima, H.; Ito, T.; Misono, M. Porous Aggregates of Unidirectionally Oriented (NH4)3PW12O40 Microcrystallites: Epitaxial Self-Assembly. Chem. Lett. 1996, 25, 559–560. [Google Scholar] [CrossRef]
  27. Inumaru, K. “Sponge Crystal”: A Novel Class of Microporous Single Crystals Formed by Self-Assembly of Polyoxometalate (NH4)3PW12O40 Nanocrystallites. Catal. Surv. Asia 2006, 10, 151–160. [Google Scholar] [CrossRef]
  28. Chikin, A.I.; Chernyak, A.V.; Jin, Z.; Naumova, Y.S.; Ukshe, A.E.; Smirnova, N.V.; Volkov, V.I.; Dobrovolsky, Y.A. Mobility of Protons in 12-Phosphotungstic Acid and Its Acid and Neutral Salts. J. Solid State Electrochem. 2012, 16, 2767–2775. [Google Scholar] [CrossRef]
  29. Holclajtner-Antunović, I.; Bajuk-Bogdanović, D.; Popa, A.; Sasca, V.; Nedić Vasiljević, B.; Rakić, A.; Uskoković-Marković, S. Preparation, Characterization and Catalytic Activity of Mesoporous Ag2HPW12O40/SBA-15 and Ag2HPW12O40/TiO2 Composites. Mater. Chem. Phys. 2015, 160, 359–368. [Google Scholar] [CrossRef]
  30. Holclajtner-Antunović, I.; Bajuk-Bogdanović, D.; Popa, A.; Nedić Vasiljević, B.; Krstić, J.; Mentus, S.; Uskoković-Marković, S. Structural, Morphological and Catalytic Characterization of Neutral Ag Salt of 12-Tungstophosphoric Acid: Influence of Preparation Conditions. Appl. Surf. Sci. 2015, 328, 466–474. [Google Scholar] [CrossRef]
  31. Okuhara, T. Water-Tolerant Solid Acid Catalysts. Chem. Rev. 2002, 102, 3641–3666. [Google Scholar] [CrossRef]
  32. Corma, A.; Martínez, A.; Martínez, C. Acidic Cs+, NH4+, and K+ Salts of 12-Tungstophosphoric Acid as Solid Catalysts for Isobutane/2-Butene Alkylation. J. Catal. 1996, 164, 422–432. [Google Scholar] [CrossRef]
  33. Okuhara, T. Microporous Heteropoly Compounds and Their Shape Selective Catalysis. Appl. Catal. A Gen. 2003, 256, 213–224. [Google Scholar] [CrossRef]
  34. Moradgholi, F.; Lari, J.; Parsa, M.V.; Mirkharrazi, M. Nano-Rb2HPW12O40 as an Efficient and Novel Catalyst for One-Pot Synthesis of β-Amino Ketones. Acta Chim. Slov. 2016, 63, 781–789. [Google Scholar] [CrossRef] [PubMed]
  35. Park, S.; Lee, S.H.; Song, S.H.; Park, D.R.; Baeck, S.-H.; Kim, T.J.; Chung, Y.-M.; Oh, S.-H.; Song, I.K. Direct Synthesis of Hydrogen Peroxide from Hydrogen and Oxygen over Palladium-Exchanged Insoluble Heteropolyacid Catalysts. Catal. Commun. 2009, 10, 391–394. [Google Scholar] [CrossRef]
  36. Lewis, R.J.; Edwards, J.K.; Freakley, S.J.; Hutchings, G.J. Solid Acid Additives as Recoverable Promoters for the Direct Synthesis of Hydrogen Peroxide. Ind. Eng. Chem. Res. 2017, 56, 13287–13293. [Google Scholar] [CrossRef]
  37. Healy, T.V. Heteropoly Salts. Radiochim. Acta 1964, 2, 146–156. [Google Scholar] [CrossRef]
  38. Menegazzo, F.; Signoretto, M.; Ghedini, E.; Strukul, G. Looking for the “Dream Catalyst” for Hydrogen Peroxide Production from Hydrogen and Oxygen. Catalysts 2019, 9, 251. [Google Scholar] [CrossRef]
  39. Bretzler, P.; Köhler, K.; Nikiforov, A.V.; Christensen, E.; Berg, R.W.; Bjerrum, N.J. Efficient Water Splitting Electrolysis on a Platinum-Free Tungsten Carbide Electrocatalyst in Molten CsH2PO4 at 350–390 °C. Int. J. Hydrogen Energy 2020, 45, 21262–21272. [Google Scholar] [CrossRef]
  40. Osipov, A.K.; Volkov, A.O.; Safronova, E.Y.; Yaroslavtsev, A.B. Ion Transfer Asymmetry in Nafion Membranes with Gradient Distribution of Acid Salts of Heteropoly Acids. Russ. J. Inorg. Chem. 2017, 62, 723–728. [Google Scholar] [CrossRef]
  41. Pérez-Maqueda, L.A.; Matijević, E. Preparation of Uniform Colloidal Particles of Salts of Tungstophosphoric Acid. Chem. Mater. 1998, 10, 1430–1435. [Google Scholar] [CrossRef]
  42. Akbay, E.Ö.; Demir, G. A Comparative Study on Characterization of 12-Tungstophosphoric Acid Cesium Salt Depending on Synthesis Methods. Asian J. Chem. 2014, 26, 6061–6066. [Google Scholar] [CrossRef]
  43. Satam, J.R.; Jayaram, R.V. Acetylation of Alcohols, Phenols and Amines Using Ammonium Salt of 12-Tungstophosphoric Acid: Environmentally Benign Method. Catal. Commun. 2008, 9, 2365–2370. [Google Scholar] [CrossRef]
  44. Santos, J.S.; Dias, J.A.; Dias, S.C.L.; Garcia, F.A.C.; MacEdo, J.L.; Sousa, F.S.G.; Almeida, L.S. Mixed Salts of Cesium and Ammonium Derivatives of 12-Tungstophosphoric Acid: Synthesis and Structural Characterization. Appl. Catal. A Gen. 2011, 394, 138–148. [Google Scholar] [CrossRef]
  45. Holclajtner-Antunović, I.; Mioč, U.B.; Todorović, M.; Jovanović, Z.; Davidović, M.; Bajuk-Bogdanović, D.; Laušević, Z. Characterization of Potassium Salts of 12-Tungstophosphoric Acid. Mater. Res. Bull. 2010, 45, 1679–1684. [Google Scholar] [CrossRef]
  46. Todorović, M.R.; Holclajtner-Antunović, I.; Mioč, U.B.; Bajuk-Bogdanović, D. Characterization of Insoluble Monovalent K+, Tl+ and Ag+ Salts of 12-Tungstophosphoric Acid. Mater. Sci. Forum 2007, 555, 207–212. [Google Scholar] [CrossRef]
  47. Holclajtner-Antunović, I.D.; Popa, A.; Bajuk-Bogdanović, D.V.; Mentus, S.; Nedić Vasiljević, B.M.; Uskoković-Marković, S.M. Synthesis and Characterization of Acid Silver Salts of 12-Tungstophosphoric Acid. Inorganica Chim. Acta 2013, 407, 197–203. [Google Scholar] [CrossRef]
  48. Zhu, S.; Gao, X.; Dong, F.; Zhu, Y.; Zheng, H.; Li, Y. Design of a Highly Active Silver-Exchanged Phosphotungstic Acid Catalyst for Glycerol Esterification with Acetic Acid. J. Catal. 2013, 306, 155–163. [Google Scholar] [CrossRef]
  49. Rosenheim, A.; Jaenicke, J. Zur Kenntnis Der Iso- und Heteropolysäuren. XV. Mitteilung Über Heteropolywolframate und Einige Heteropolymolybdänate. Z. Anorg. Allg. Chem. 1917, 101, 235–275. [Google Scholar] [CrossRef]
  50. Papynov, E.K.; Portnyagin, A.S.; Modin, E.B.; Mayorov, V.Y.; Shichalin, O.O.; Golikov, A.P.; Pechnikov, V.S.; Gridasova, E.A.; Tananaev, I.G.; Avramenko, V.A. A Complex Approach to Assessing Porous Structure of Structured Ceramics Obtained by SPS Technique. Mater. Charact. 2018, 145, 294–302. [Google Scholar] [CrossRef]
  51. Essayem, N.; Coudurier, G.; Fournier, M.; Védrine, J.C. Acidic and Catalytic Properties of CsxH3-XPW12O40 Heteropolyacid Compounds. Catal. Lett. 1995, 34, 223–235. [Google Scholar] [CrossRef]
  52. Inumaru, K.; Nakajima, H.; Hashimoto, M.; Misono, M. Catalysis Heteropoly Compounds. Part 39. Preparation of Acidic Ammonium Dodecatungstophosphate Catalysts by Homogeneous Precipitation and Their Structures. Nippon Kagaki Kaishi 1998, 6, 390–397. [Google Scholar] [CrossRef]
  53. Gayraud, P.Y.; Essayem, N.; Védrine, J.C. H3PW12O40 Acid Dispersed on Its Cs Salt: Improvement of Its Catalytic Properties by Mechanical Mixture and Grinding. Catal. Lett. 1998, 56, 35–41. [Google Scholar] [CrossRef]
  54. Chzhao, T.; Ukshe, A.E.; Leonova, L.S.; Dobrovol’skii, Y.A. Platinized-Heteropolycompound-Based Nanostructured Catalysts for Low-Temperature Hydrogen-Air Fuel Cells. Russ. J. Electrochem. 2011, 47, 595–604. [Google Scholar] [CrossRef]
  55. Okuhara, T.; Mizuno, N.; Misono, M. Catalytic Chemistry of Heteropoly Compounds. Adv. Catal. 1996, 41, 113–252. [Google Scholar] [CrossRef]
  56. Matachowski, L.; Drelinkiewicz, A.; Mucha, D.; Kryściak-Czerwenka, J.; Rachwalik, R. Preparation of Active Cs2HPW12O40 Catalyst with the ‘Core–Shell’ Secondary Structure by a Self-Organizing Process. Appl. Catal. A Gen. 2014, 469, 239–249. [Google Scholar] [CrossRef]
  57. Essayem, N.; Holmqvist, A.; Gayraud, P.; Vedrine, J.; Ben Taarit, Y. In Situ FTIR Studies of the Protonic Sites of H3PW12O40 and Its Acidic Cesium Salts MxH3−xPW12O40. J. Catal. 2001, 197, 273–280. [Google Scholar] [CrossRef]
Figure 1. SEM images of the obtained samples with different degrees of proton substitution and SEM image and corresponding EDX spectra of sample 2.5mM-2.
Jcs 07 00454 g001
Figure 2. Particle size distributions of the obtained rubidium salts.
Jcs 07 00454 g002
Figure 3. Nitrogen adsorption (solid points)—desorption (open points) isotherms (a) and differential pore size distribution (b) for studied salts.
Jcs 07 00454 g003
Figure 4. XRD pattern of the 2.5mM-1 sample (a), a model image of the Rb3(PO4)(W12O36) structure (b), and XRD patterns of the obtained salts (c).
Jcs 07 00454 g004
Figure 5. FTIR spectra of the obtained rubidium salts in the 1200–400 cm−1 range (a) and in the 4000–1200 cm−1 range (b).
Jcs 07 00454 g005
Figure 6. STA and ion current flow curves for 14mM-1 sample (a), and TGA curves for the obtained samples (b).
Jcs 07 00454 g006
Figure 7. Temperature dependences of the specific ionic conductivity of the studied rubidium salts.
Jcs 07 00454 g007
Table 1. Degrees of proton substitution (x), average particle sizes, SSA, pore (V), and micropore (Vmicro) volumes of the obtained samples.
SampleTheoretical xx by EDXParticle Size,
μm
SSA,
m2 g–1
Vmicro
(cm3g−1)
V (cm3g−1)
BETDFT
14mM-112.20.4083.90.01 t0.110.091
14mM-1.51.52.20.3084.10.011 t0.150.130
14mM-222.20.4298.60.010 t0.0740.061
14mM-2.52.52.00.491140.010 t
14mM-332.60.501230.048 DR0.060
2.5mM-111.70.3470.60.007 t0.100.086
2.5mM-222.90.471200.040 DR0.057
t—Calculated by the t-plot method; DR—calculated by the DR method.
Table 2. Crystalline properties of the obtained rubidium salts.
SampleLattice Parameter
a = b = c, Ȧ
Occupancy of Rb AtomsLXRD, nmUnit Cell Volume V, nm3
14mM-111.6810.877321.71.594
14mM-1.511.6840.877341.41.595
14mM-211.6820.946325.21.594
14mM-2.511.6720.998220.41.590
14mM-311.6691.041018.81.589
2.5mM-111.6770.881245.91.589
2.5mM-211.6820.989119.71.589
Table 3. Amount of water per molecule of salt (n), specific ionic conductivity at 25 °C (σ25°C), and activation energy of conductivity (Eσ) of the obtained samples.
Samplenσ25°C, mS cm−1Eσ, eV
14mM-16.29.00.20
14mM-1.55.49.10.20
14mM-26.74.90.20
14mM-2.56.85.00.19
14mM-38.61.30.19
2.5mM-13.83.30.20
2.5mM-27.12.20.22
Disclaimer/Publisher’s Note: The statements, opinions and data contained in all publications are solely those of the individual author(s) and contributor(s) and not of MDPI and/or the editor(s). MDPI and/or the editor(s) disclaim responsibility for any injury to people or property resulting from any ideas, methods, instructions or products referred to in the content.

