Article

Stiffness Degradation under Cyclic Loading Using Three-Point Bending of Hybridised Carbon/Glass Fibres with a Polyamide 6,6 Nanofibre Interlayer

Department of Mechanical and Product Design Engineering, Swinburne University of Technology, John St., Hawthorn, VIC 3122, Australia
*
Author to whom correspondence should be addressed.
J. Compos. Sci. 2022, 6(9), 270; https://doi.org/10.3390/jcs6090270
Submission received: 16 August 2022 / Revised: 3 September 2022 / Accepted: 9 September 2022 / Published: 14 September 2022
(This article belongs to the Special Issue Carbon-Based Polymer Nanocomposites)

Abstract

:
The stiffness degradation of hybrid carbon/glass fibre composites are investigated under cyclic loading in three-point bending. The composites are compared to toughened composites interlayered with PA 6,6 nanofibre (veil) and a matrix toughened with 5% rubber particulate. With the incorporation of veil into the hybridised composite, the hybrid interface experienced extensive localised delamination, due to crack deflection, causing longitudinal cracking between the fibre and veil interface. It is observed that delamination was redirected and reduced by veil interlayering, due to crack bridging as the cracks propagated. The carbon fibre composites toughened by rubber particulate showed similar stiffness retention to carbon fibre after 1,000,000 cycles. The veil interlayering within carbon fibre improved the stiffness retention by 66.87% for the flexural modulus, compared to carbon fibre and rubber toughened carbon fibre laminates. In both glass and carbon fibre samples, the stiffness retention with veil showed a 10-fold increase in fatigue life, compared with untoughened controls. It is observed from the failure mechanics that veil acted as a randomly orientated fibre layer, rather than a matrix toughener.

1. Introduction

Automotive bodies and structures are steadily changing from metal to composite materials [1]. There is a reluctance to switch to a high-costing fibre, such as carbon fibre, for composites within the automotive industry [2]. Chopped strand composites are more common replacements for automotive inserts currently, but have significantly lower tensile strength than continuous fibre reinforced plastics (FRP) [3,4]. For automotive and structural applications, such as springs [5] or rods [6], CFRP offers high tensile strength, high tensile modulus, and lower density than steel, thus reducing the component size and weight [7].
The cost and mechanical strength issues are addressed with the hybridisation of carbon and glass fibres toughened with a Pa 6,6 veil. Compared with pure CFRP, the hybridisation of carbon and glass fibres into a reinforced plastic creates components with improved flexural strain and comparably lower cost [8]. However, pure glass fibre reinforced plastics (GFRP) have drawbacks, with lower flexural modulus [9] and fatigue life [10], compared with pure CFRP. The fraction of carbon fibre content is directly related to flexural strength and modulus, but the strain decreases with carbon fibre content [6,10]. With tension–tension fatigue, Naito et al. [11] showed that the modulus was based on the fibre volume fracture of CFRP in tension testing. Additionally, Naito et al. showed the failure of the hybrids was dominated by glass fibre at lower stress characteristics, but higher stress carbon fibre dominated the mechanical characteristics. Quasi-static testing of hybridised carbon and glass fibres has shown that the flexural strength of the hybrid can be increased by 16.6%, relative to carbon fibre content, with optimised stacking [9,12]. The positive hybrid effects from stacking sequences show that carbon fibre content can be reduced whilst improving the flexural modulus of GFRPs [13]. Numerous authors have reported on both intra-ply and inter-ply hybridisation and concluded that sequences of carbon and glass fibre can be optimised, with the failure strain improved by up to 166% [12], although 40% is more typically recorded [9,14,15,16,17]. During fatigue loading in bending, the initiation of traverse matrix cracking leads to delamination and further fibre failure [6,18]. Traverse cracking is further increased by the difference in modulus between the high and low elongation fibre [18].
Increasing the compressibility of the material, to delay delamination and debonding, can be achieved with thermoplastic additives, such as rubber particulate [19] or a thermoplastic matrix. The key issue with thermoplastic matrices or modified epoxy is the curing [20,21,22] and modulus of the composites [21,23]. Epoxy, due to its ease of use, good stiffness, and low cost, is an appealing matrix for CFRP in many applications [6,11,24,25]. In Wu et al. [26], the tensile strength of the composite material is excellent and comparable with steel; however, it loses the majority of the modulus gained with the incorporation of CFRP.
Thermoplastics tend to have a poor mechanical performance, when compared to epoxy, but improved strain as they are less brittle as a matrix [27]. The inclusion of CFRP to GFRP increases both the modulus and fatigue life, thus replacing or adding a thermoplastic to the matrix to increase toughness, which would result in reduced modulus, thus requiring increased part geometry to compensate in load bearing applications. The use of epoxy thermoplastic mixtures, such as rubber particulates, is an excellent way to improve impact and fracture toughness in composites, while low quantities have been shown to have minimal impact on the modulus of epoxy resin [28,29]. However, rubber has been shown to interfere with curing by affecting the Tg of the matrix [20].
This article aims to investigate modulus retention effects between carbon and glass under cyclic loading, using both an interlayer nanofibre and rubber particulate. The interlayering is a polyamide 6,6 electrospun veil (PA 6,6) with hybrid composites, showing a flexural strain increase when used with composite laminates [30]. The primary focus will be on how the inclusion of interlayer toughening affects the failure strain under dynamic bending, as well as the locations of crack initiation withing the hybrid composites. The behaviour of interlayer toughening during cyclic loading can improve the understanding of the matrix-veil interaction in dynamic testing, which has been previously determined in quasi-static interlaminar fracture toughness testing [31,32]. A series of dynamic bending tests were used to investigate the dynamic stress distribution of hybrid composites with toughening. The tests include the examination of the dynamic failure mechanisms of the hybrids under repeated cyclic loading, from 50 to 90% maximum flexural stress.
Using interlayer toughening, Hojo et al. [33] demonstrated that the fatigue life improved as the energy required to initiate crack propagation was increased, and interlayer toughening provided an increase of 3.3 to 3.5 times to the crack growth resistance. Determining how the matrix toughness affects the failure mechanism in cyclic loading for hybrid fibre composites has received little attention thus far. Although, Mode-I fracture toughness of toughened carbon fibre has been investigated with carbon nanotubes (CNT) [34], CNT and thermoplastic interlayering [35,36], or interlayering with nanofibres [37,38,39,40,41,42]. Lowering the flexural modulus is one issue with thermoplastic toughening of thermosetting matrices. The inclusion of glass fibre leads to a further reduction in the flexural modulus of the composite. Song et al. [35] used polyamide 6,6 nanofibres and CNT to improve the flexural strength of carbon fibre, showing that PA 6,6 nanofibres increased the maximum loading of the composite laminate by 13%. Limiting factors in toughness research include stiffness degradation and failure mechanism changes with interlaminar fracture toughness.
The phases of stiffness degradation, shown in Figure 1 are: Phase I, inter fibre failure (IFF); Phase II, delamination (DEL); and Phase III, fibre failure (FF). Phase I is characterised by an exponential drop in modulus. Phase II is more gradual, as the crack propagation is linear. Phase III is catastrophic, whereby over 70% of the modulus is lost due to fibre failure.
During Phase I of fracturing, under cyclic loading, inter fibre failure occurs with the matrix cracking. For UD fabric, the veil creates a defined interlaminar region, rather than consolidation of the fibres. This can result in early matrix cracking. The toughening mechanisms of veils are covered in Quan et al. [31], concluding that for veil interlayering, the nanofibre type is crucial for interlaminar fracture toughness. In mixed Mode I/II of the composites, Quan et al. showed the crack propagation of CFRP with PA-12 veil occurred between the interface of the interlayer and the carbon fibre layer. The veils which maintained structure or dissolved into particles within the matrix had a greater impact, as crack deflection or bridging mechanisms were active. Further analysis of the toughening mechanism will be investigated under dynamic cyclic loading, in order to determine partial and veil effects at high amplitudes and the point at which the nanofibre toughening mechanisms fails.
In dynamic bending and general structural application, delamination and interfacial debonding are the main initiators of the final fatigue failure [43]. In tension–tension fatigue, the residual strength is found to be directly related to the residual stiffness, both of which degrade non-linearly with cycles [44]. DorMohammdi et al. [45], when examining damage tolerance, showed that the majority of the fatigue strength and stiffness is lost within the first stage of interfacial debonding. Stiffness degradation can be used as an accurate indicator of the macroscopic progression of the laminate towards failure [46]. The simple beam structure is used to evaluate the flexural fatigue of the interface between glass and carbon fibre.
Evaluation of the current rule of mixture for hybrid fatigue behaviour will also be included in this article. The evaluation will use flexural strength and modulus derived from the rule of mixture (RoM) to predict stiffness degradation. A key comparison is based on the type of toughening used causes the material to behave more in line with the rule of the mixture, as HFRP has previously been shown to have poor correlation to the rule of mixture, previously.

2. Methodology and Materials

2.1. Resin and Fibre Characteristics

The prepregs used were 300 g per square meter (gsm) metre crimped unidirectional carbon fibre and 900 gsm crimped glass fibre, both crimped with glass fibre crimping. Both prepregs use a diamine hardener confirmed by Fourier transfer infrared spectroscopy (FTIR). The samples were placed in a 200 mm2 square spacer with a depth of 2 mm and compressed under 18 MPa using a Labtech heated press, as per Table 1.
Quasi static three-point bending was used to determine the maximum flexural strength achievable by each composite laminate. The maximum flexural properties were determined and shown below in Table 2.

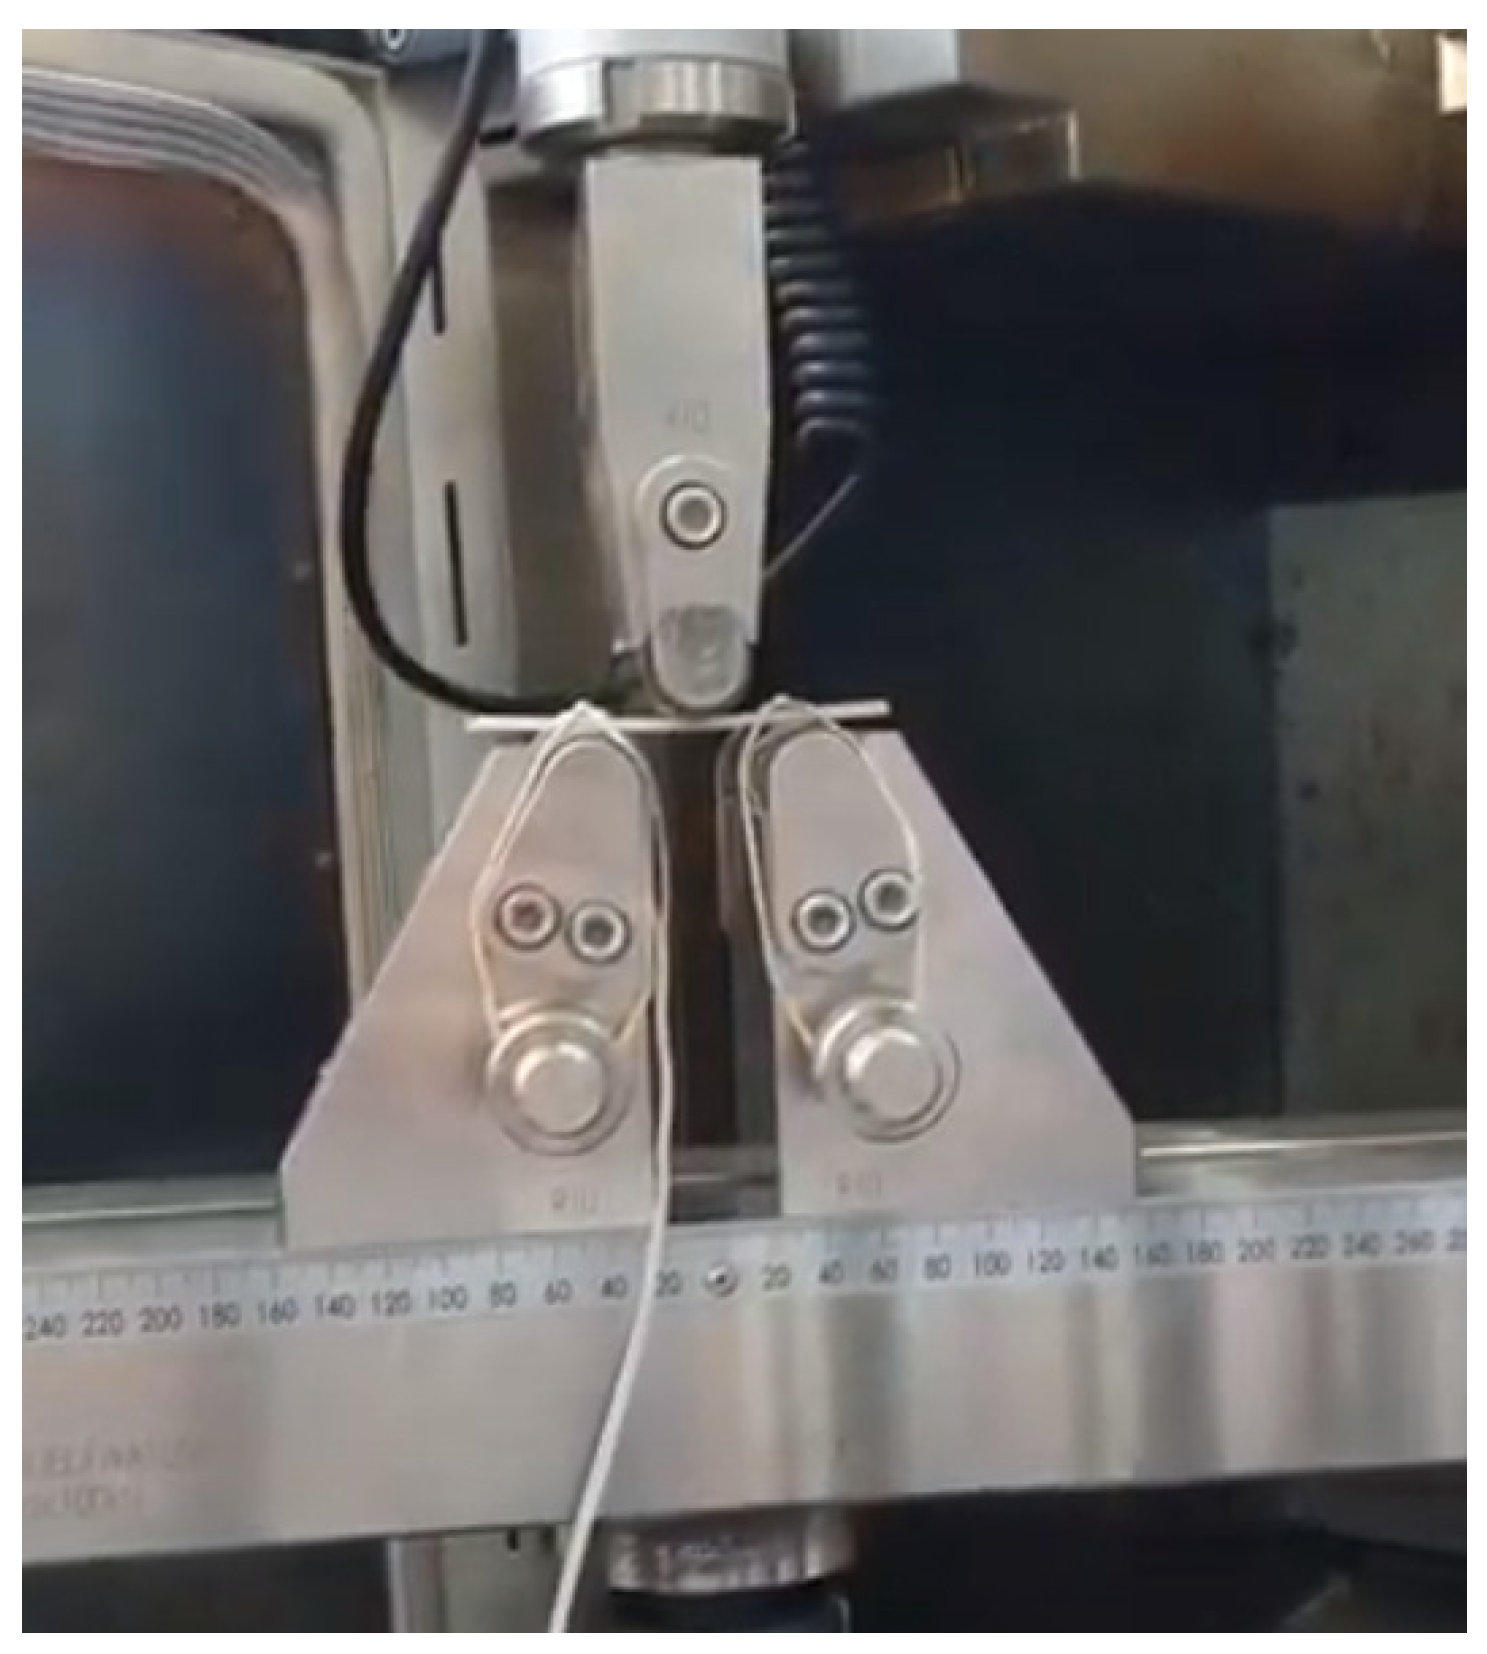
2.2. Fatigue Testing Cycles

The setup of the fatigue rig utilised a Instron-100 kN Universal testing machine, shown in Figure 2. Tests were conducted at a cycle rate of 5 Hz, as per the ASTM D7264 for three-point bending [47]. Fatigue stress and cycles were selected from the fatigue study of Seiberer et al. [48], to make it comparable to previous carbon fibre studies.
Cyclic loading under a three-point bending setup was used to determine stiffness degradation. Stiffness degradation is measured for both low cycle high amplitude and high cycle low amplitude fatigue.
High cycle low amplitude used 50% maximum flexural strength to 1,000,000 cycles to determine the stiffness fatigue. The high amplitude cyclic loading used the FRP’s maximum flexural strength as outlined in Table 1. Totals of 50, 70 and 90% of the maximum flexural stress were used for the stress and cycle (SN) curves, which were calculated using quasi-static testing of the coupons shown in Table 3. Three samples were tested, for each sample set, to produce the SN curve. The stiffness degradation using high cycles was conducted at 0, 1, 100,000, and 1 million cycles.
The following cycles, shown in Table 4, were run on the hybrid composites; it should be noted that, although, at 90% loading, the material was run to 100,000 cycles, a majority of samples failed before reaching 100,000 cycles. Hysteresis loops were recorded for 70% load capacity at 4000 cycles to accurately gauge stiffness degradation.
The setup in Figure 2 shows the gripping of the carbon glass hybrid. The samples were prepared at 80 mm length, 2 mms thickness, and 20 mm width, with the three-point bending rig set at a span of 40 mm to satisfy the 1:20 span to thickness ratio. The head diameter was kept at 10 mm, with the grippers at 10 mm diameter, as well to be consistent with quasi-static testing performed previously, in order to obtain the carbon and glass maximum flexural strength.
Samples were cycled up to maximum loading then cycled down to 10% of maximum force, for 4000, 100,000, and 1,000,000 cycles. The three test cycles are undertaken to examine the composite laminates stiffness degradation at different failure stages. Strain readings were taken using the FLAB-3-11-3LJC-F single element strain gauge.

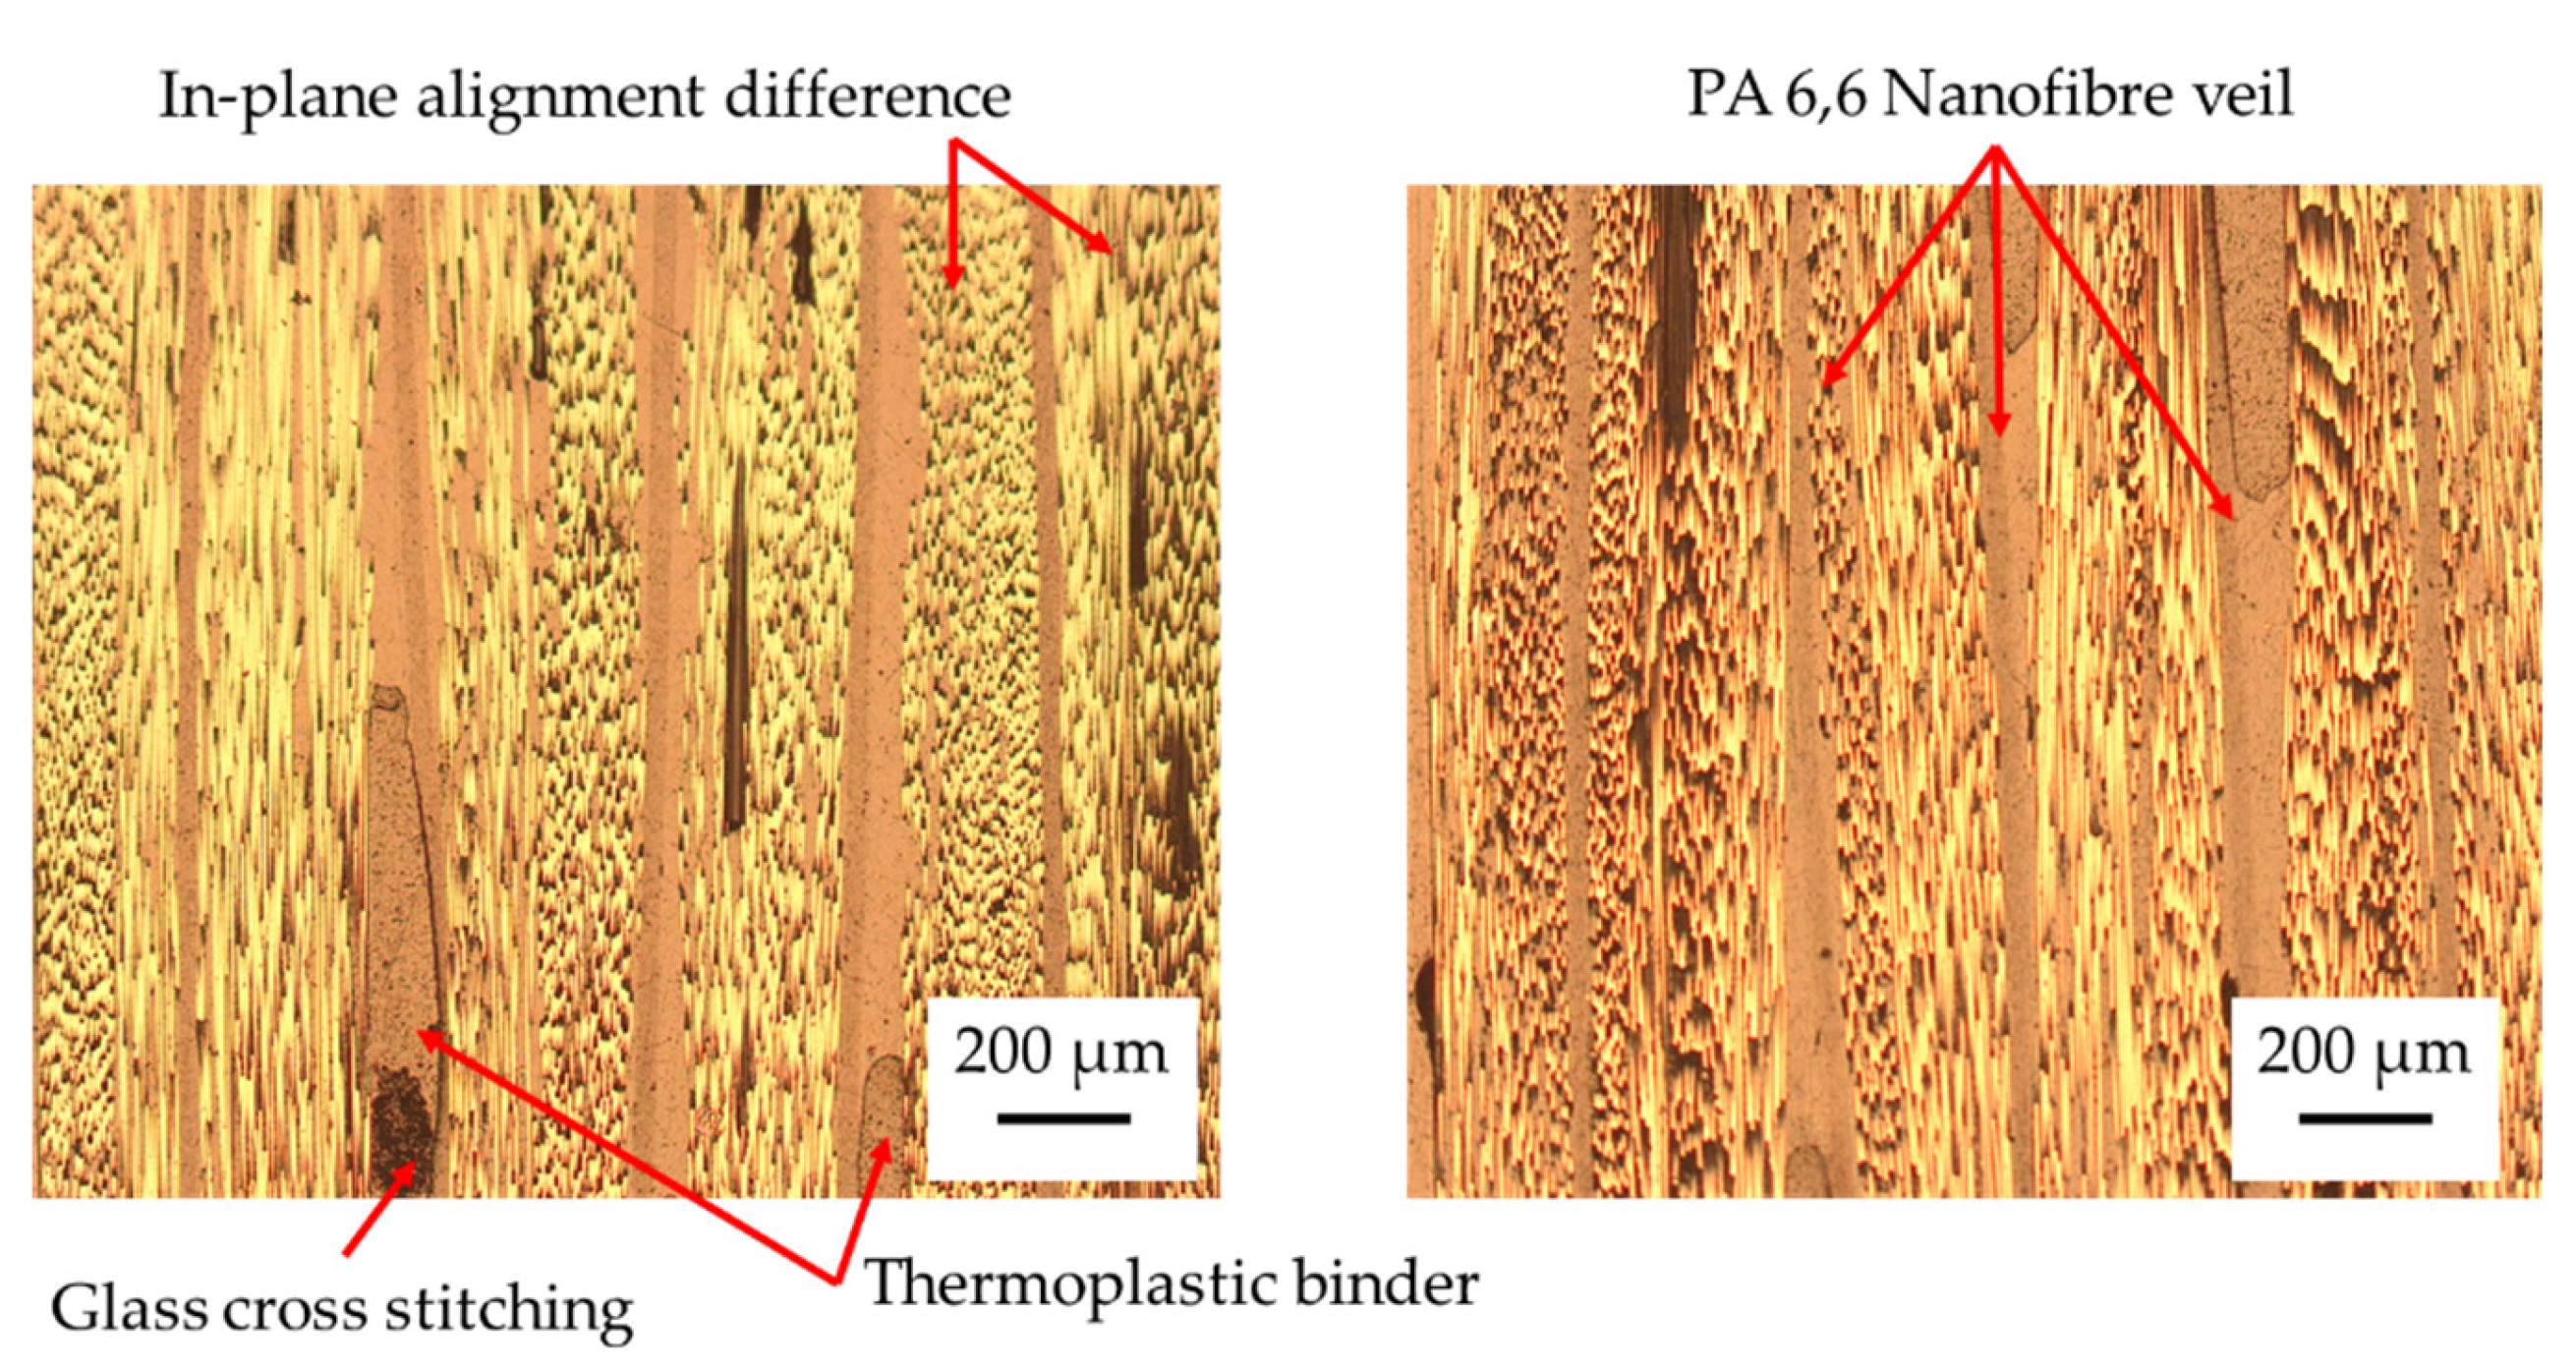
2.3. Optical and SEM Analysis of Composite Laminates

Analysis of the microstructure of the crack initiation and level of delamination was undertaken using a BX61 Olympus microscope, and SEM analysis was made with a Zeiss Supra 40 VP. SEM imaging was used for glass fibre transparency, where optical could not view void content and delamination length. Orientation of the material was determined by the strain gauging on the sample, which was removed before mounting. The fibre failure and crack lengths were measured with optical microscopy, due to a higher field of view.
To investigate fibre and matrix cracking, a cut through of the composites are taken and polished using the Struers brittle material method.
The fibre volume fraction and void content were analysed using optical microscopy of the cross-sections.
Due to the crimping of the fabric, as shown in Figure 3, during curing, there was a further change in the unidirectional fibre angle, causing a waviness. The void content and fibre volume fraction were also measured using the same imagery selection method as for void content.
Void content was taken from particle analysis in ImageJ software using optical micrographs. Image J is an open-source software package using Java. The void content across each control and veil toughened group is shown in the void content analysis section.

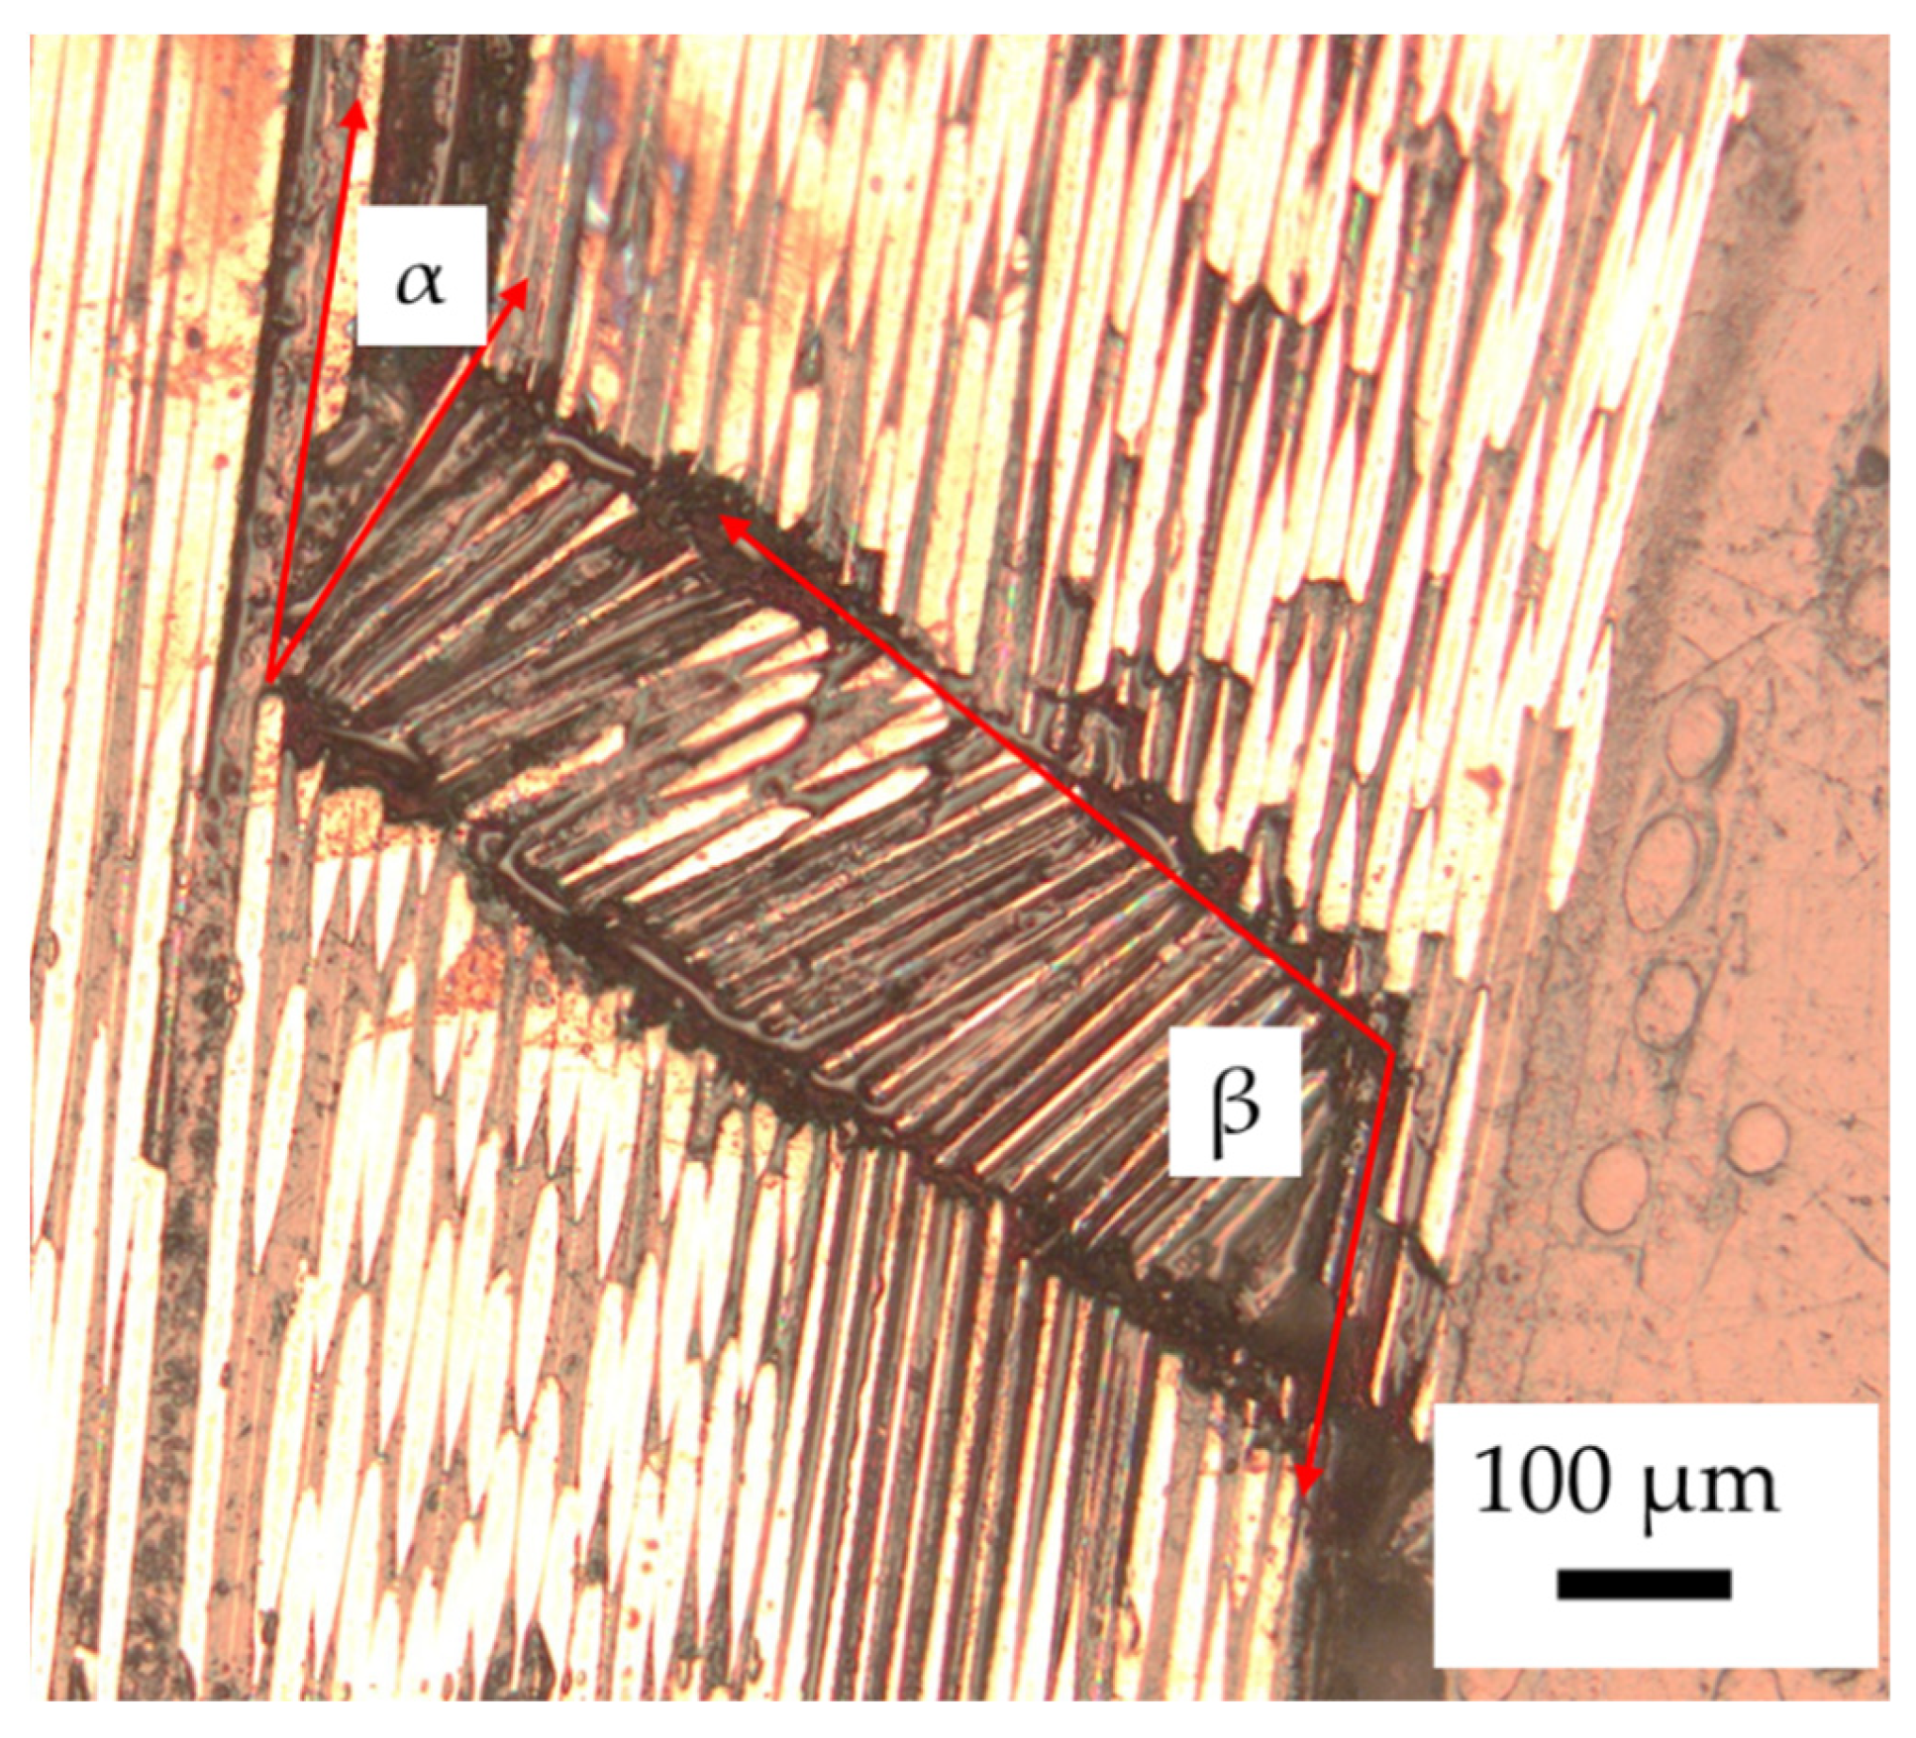
2.4. Assessment of the Kink Band Angle Is Taken Using the Angle Measurement Function of ImageJ to Assess the Kink Band

Measurement of the kink band angle using optical microscopy. The kink band is the fibre fracture mechanisms resulting in an angular tilt of the fibres form the x position to z [49].
Using microscopy to measure the kink band angle of the fibre, a quantitative evaluation of CFRP failure is undertaken, as shown in Figure 4.
The α and β angles are important as the α angle dictated the fibre and matrix debonding length. A large α will result in higher debonding.

3. Results

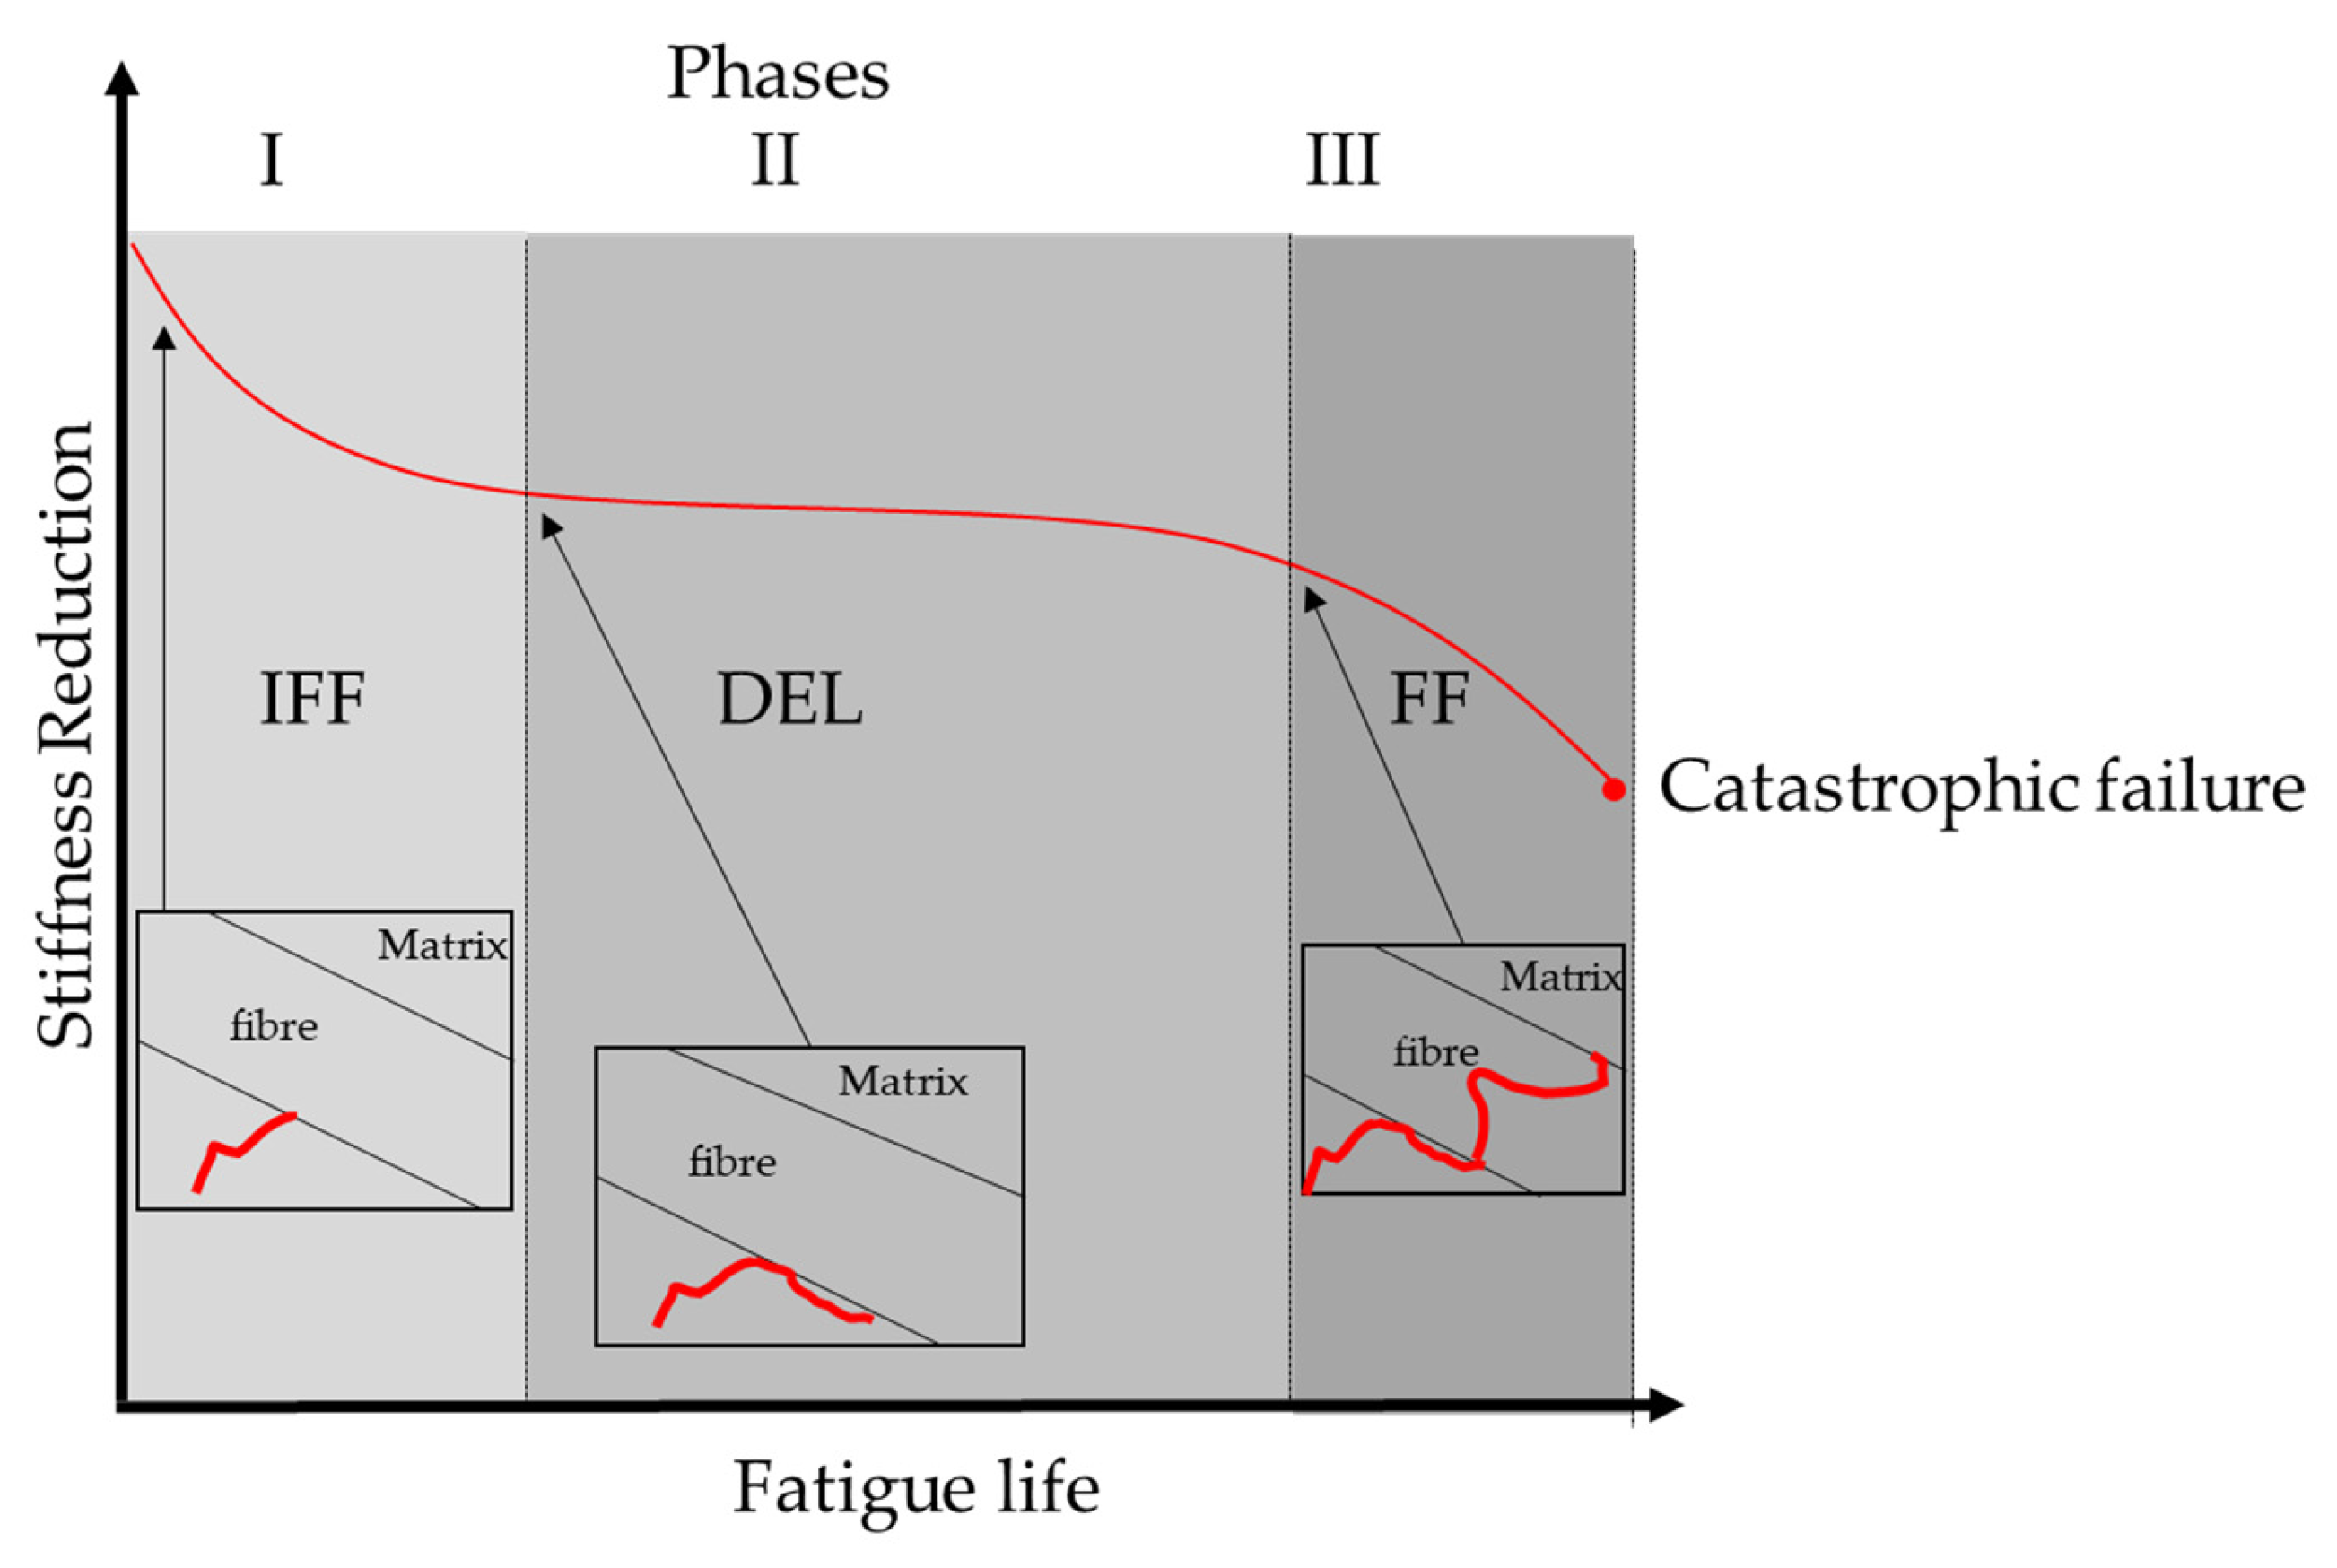
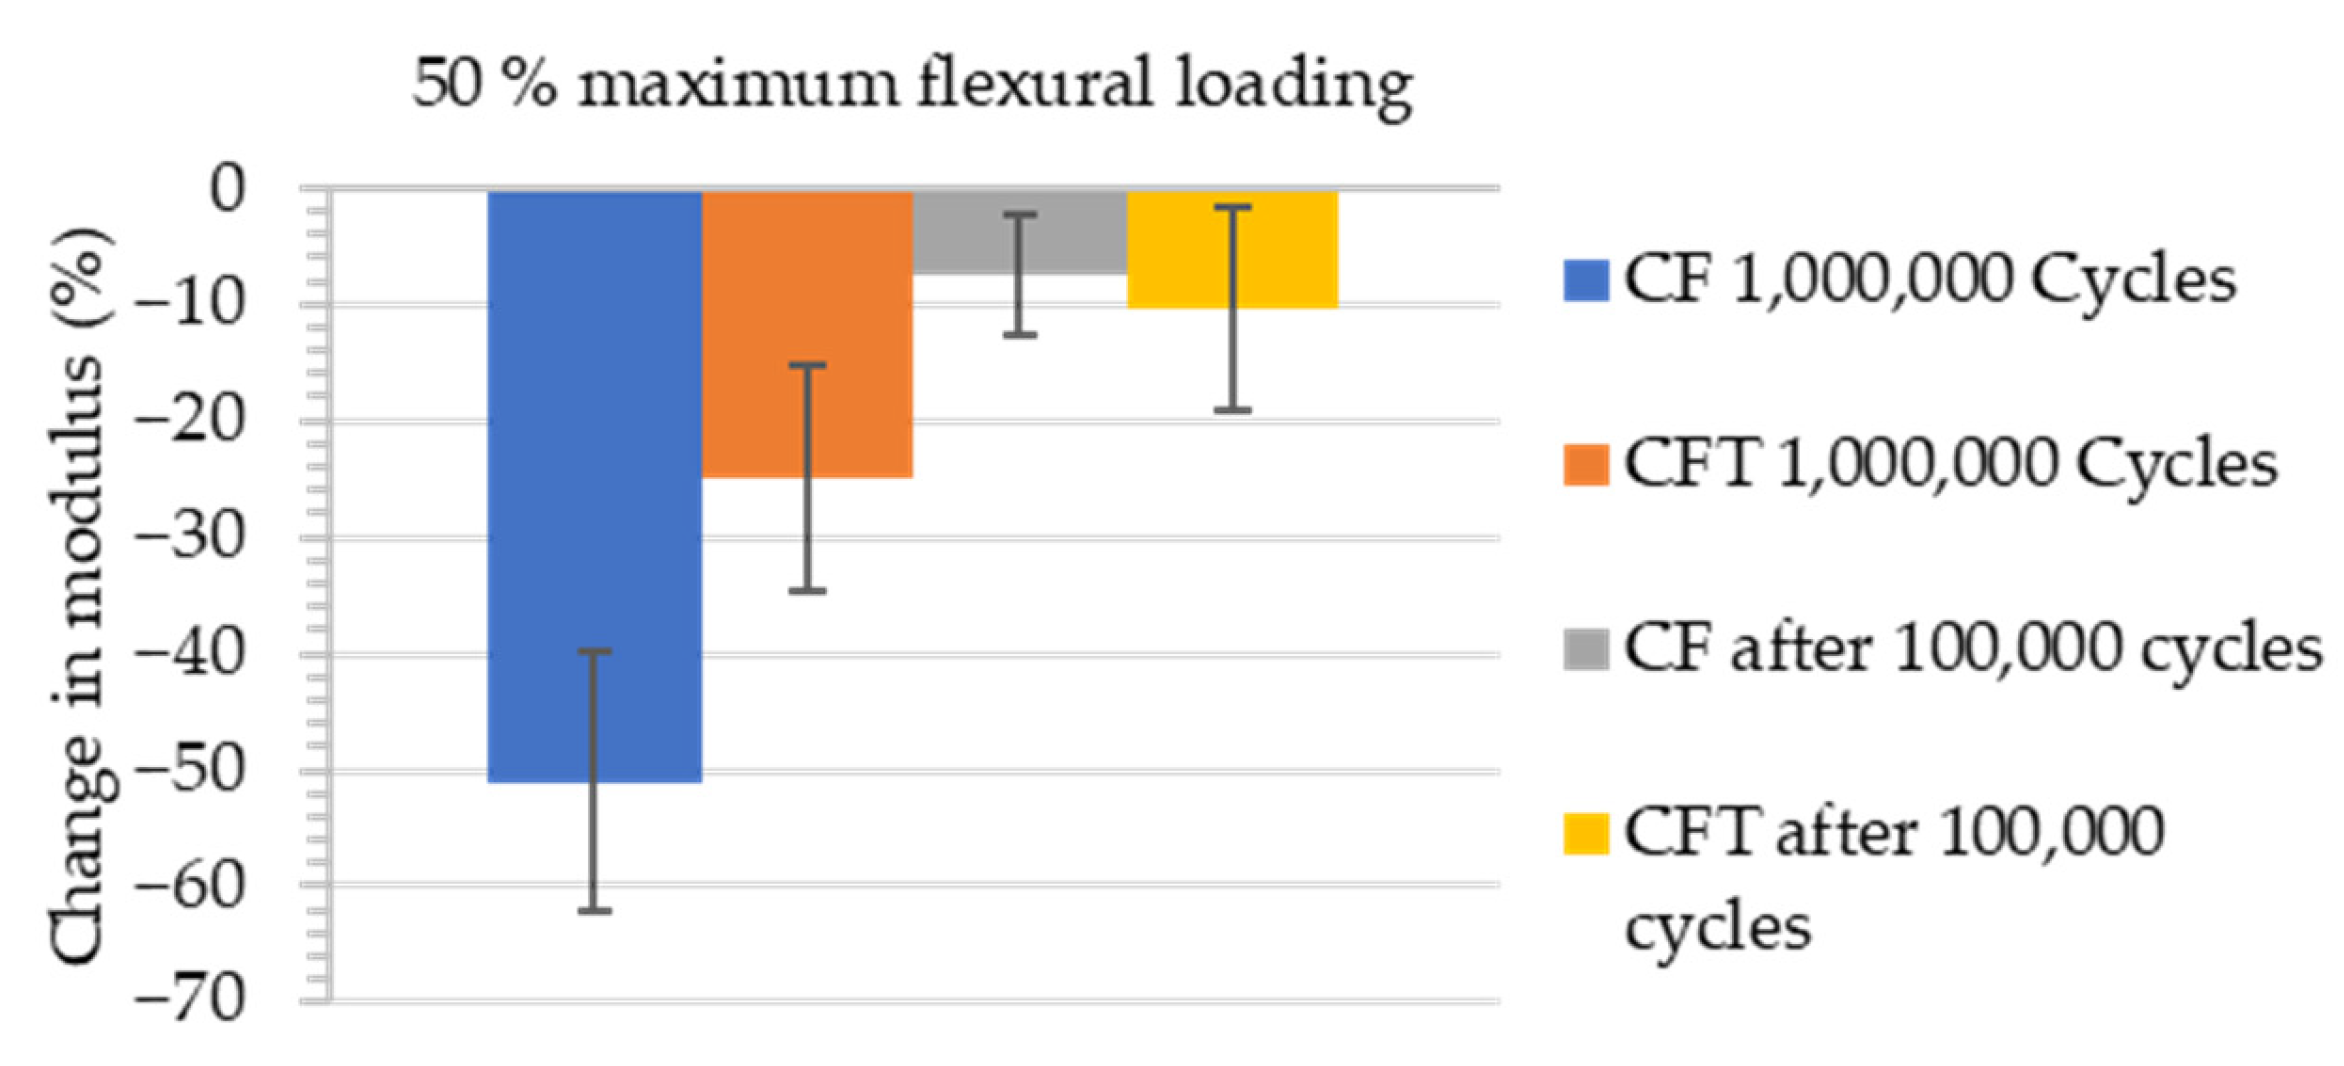
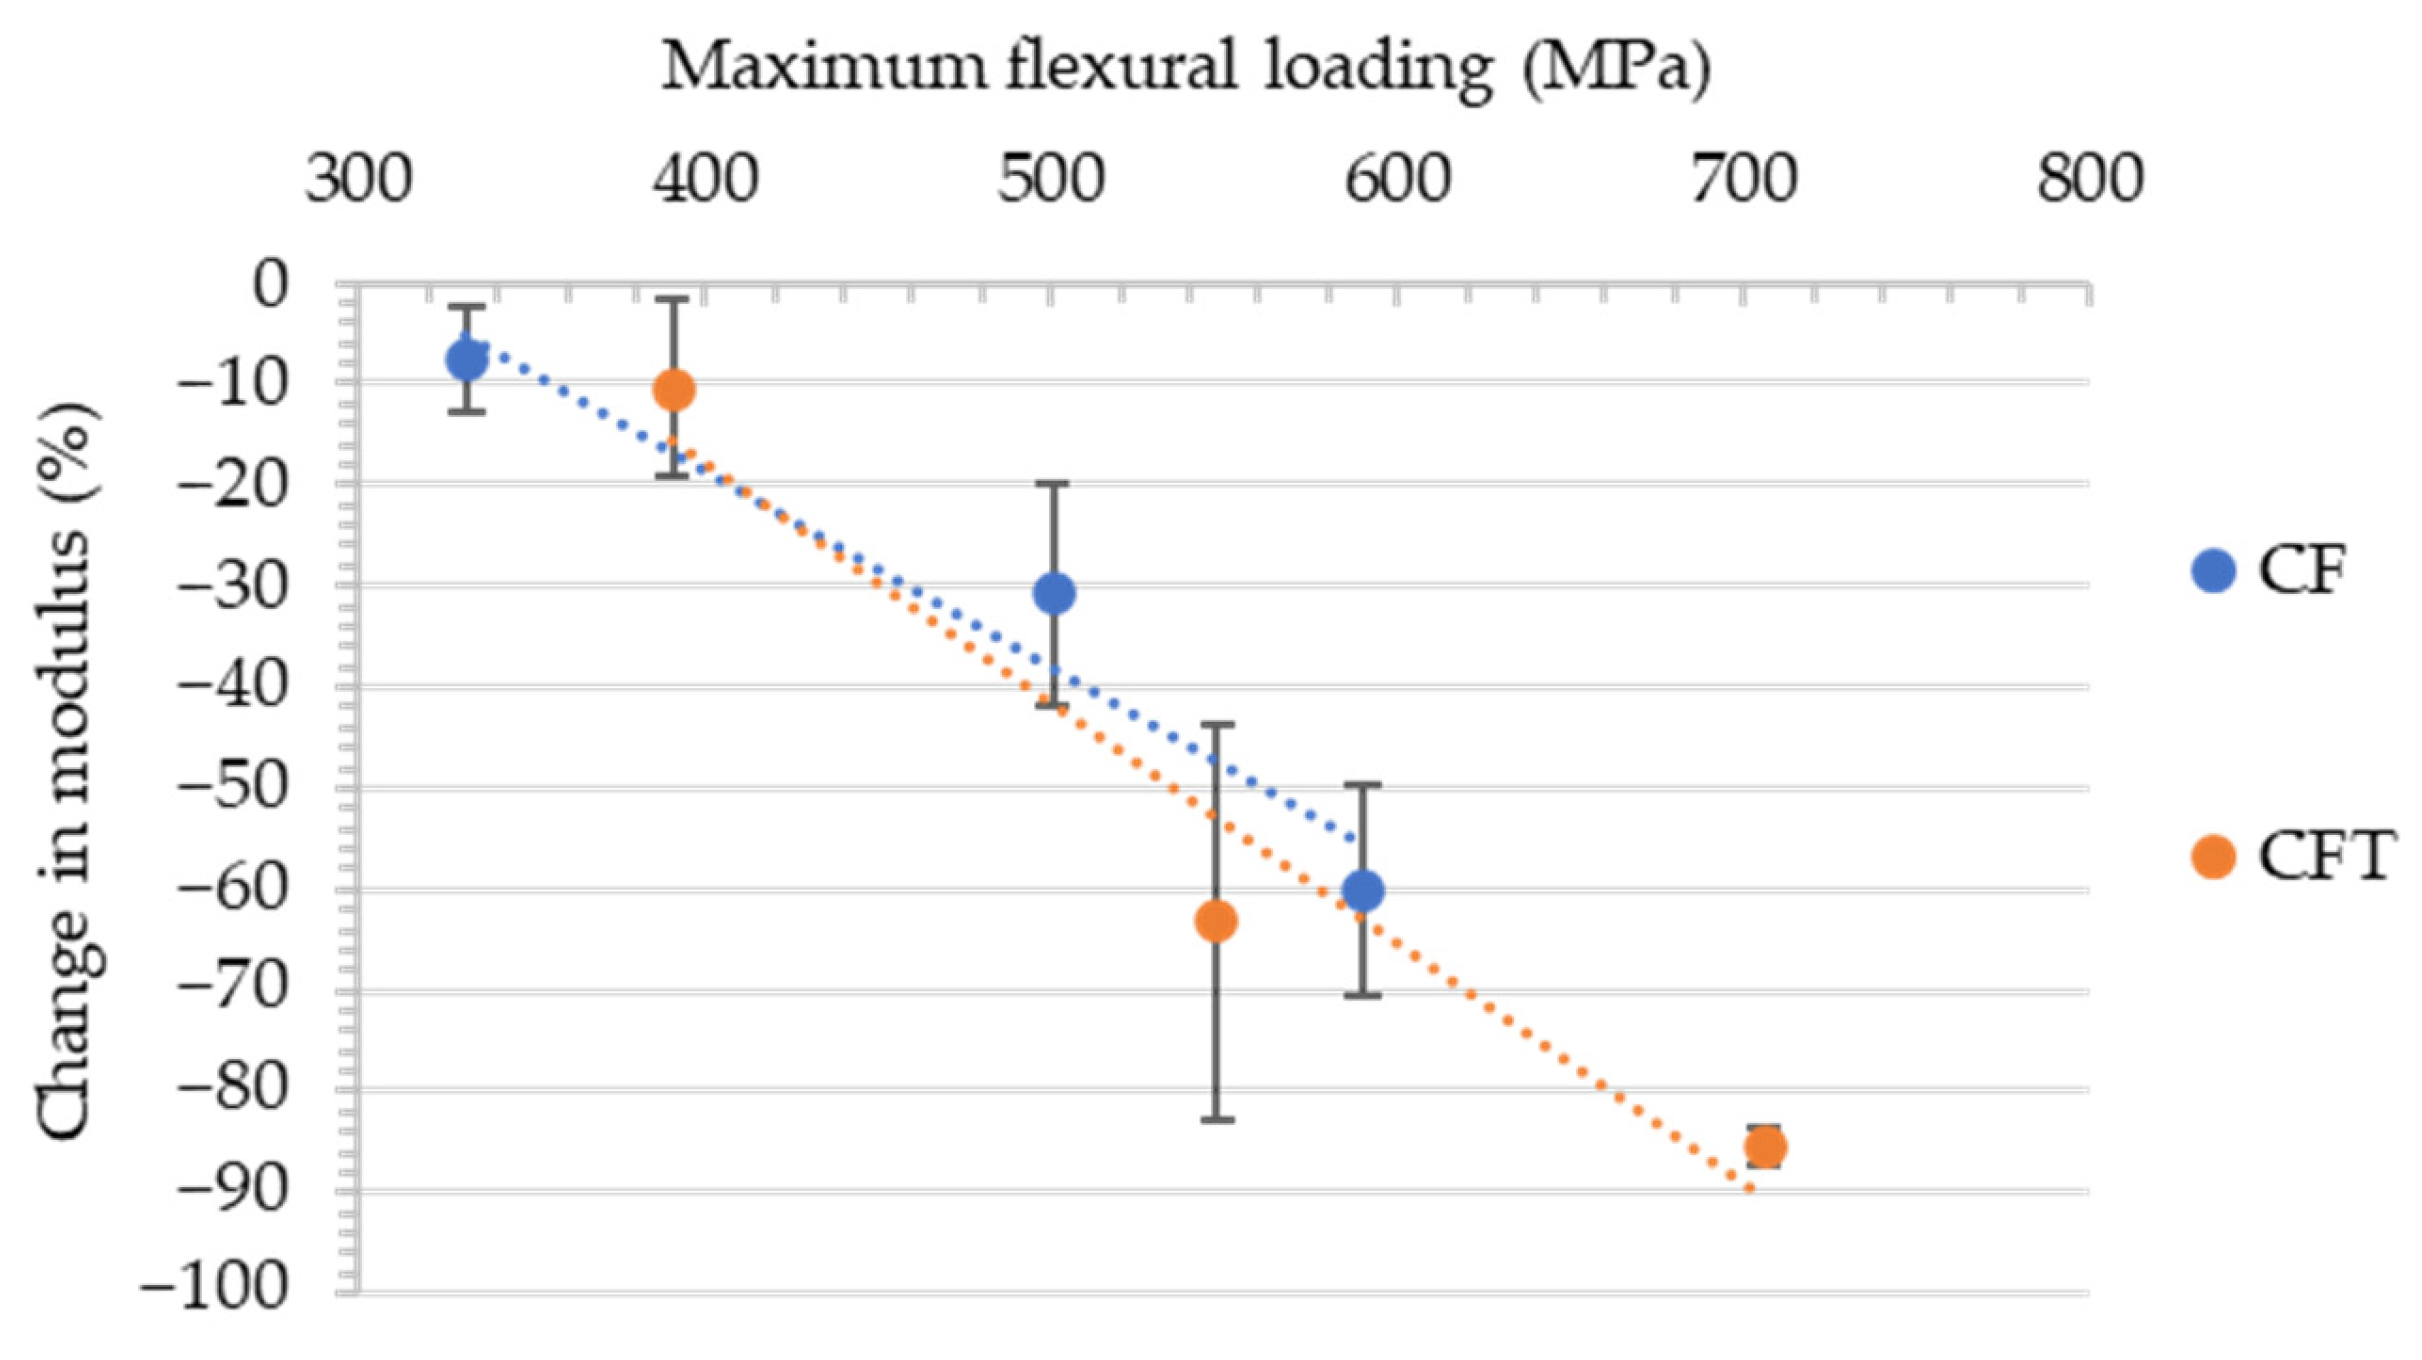
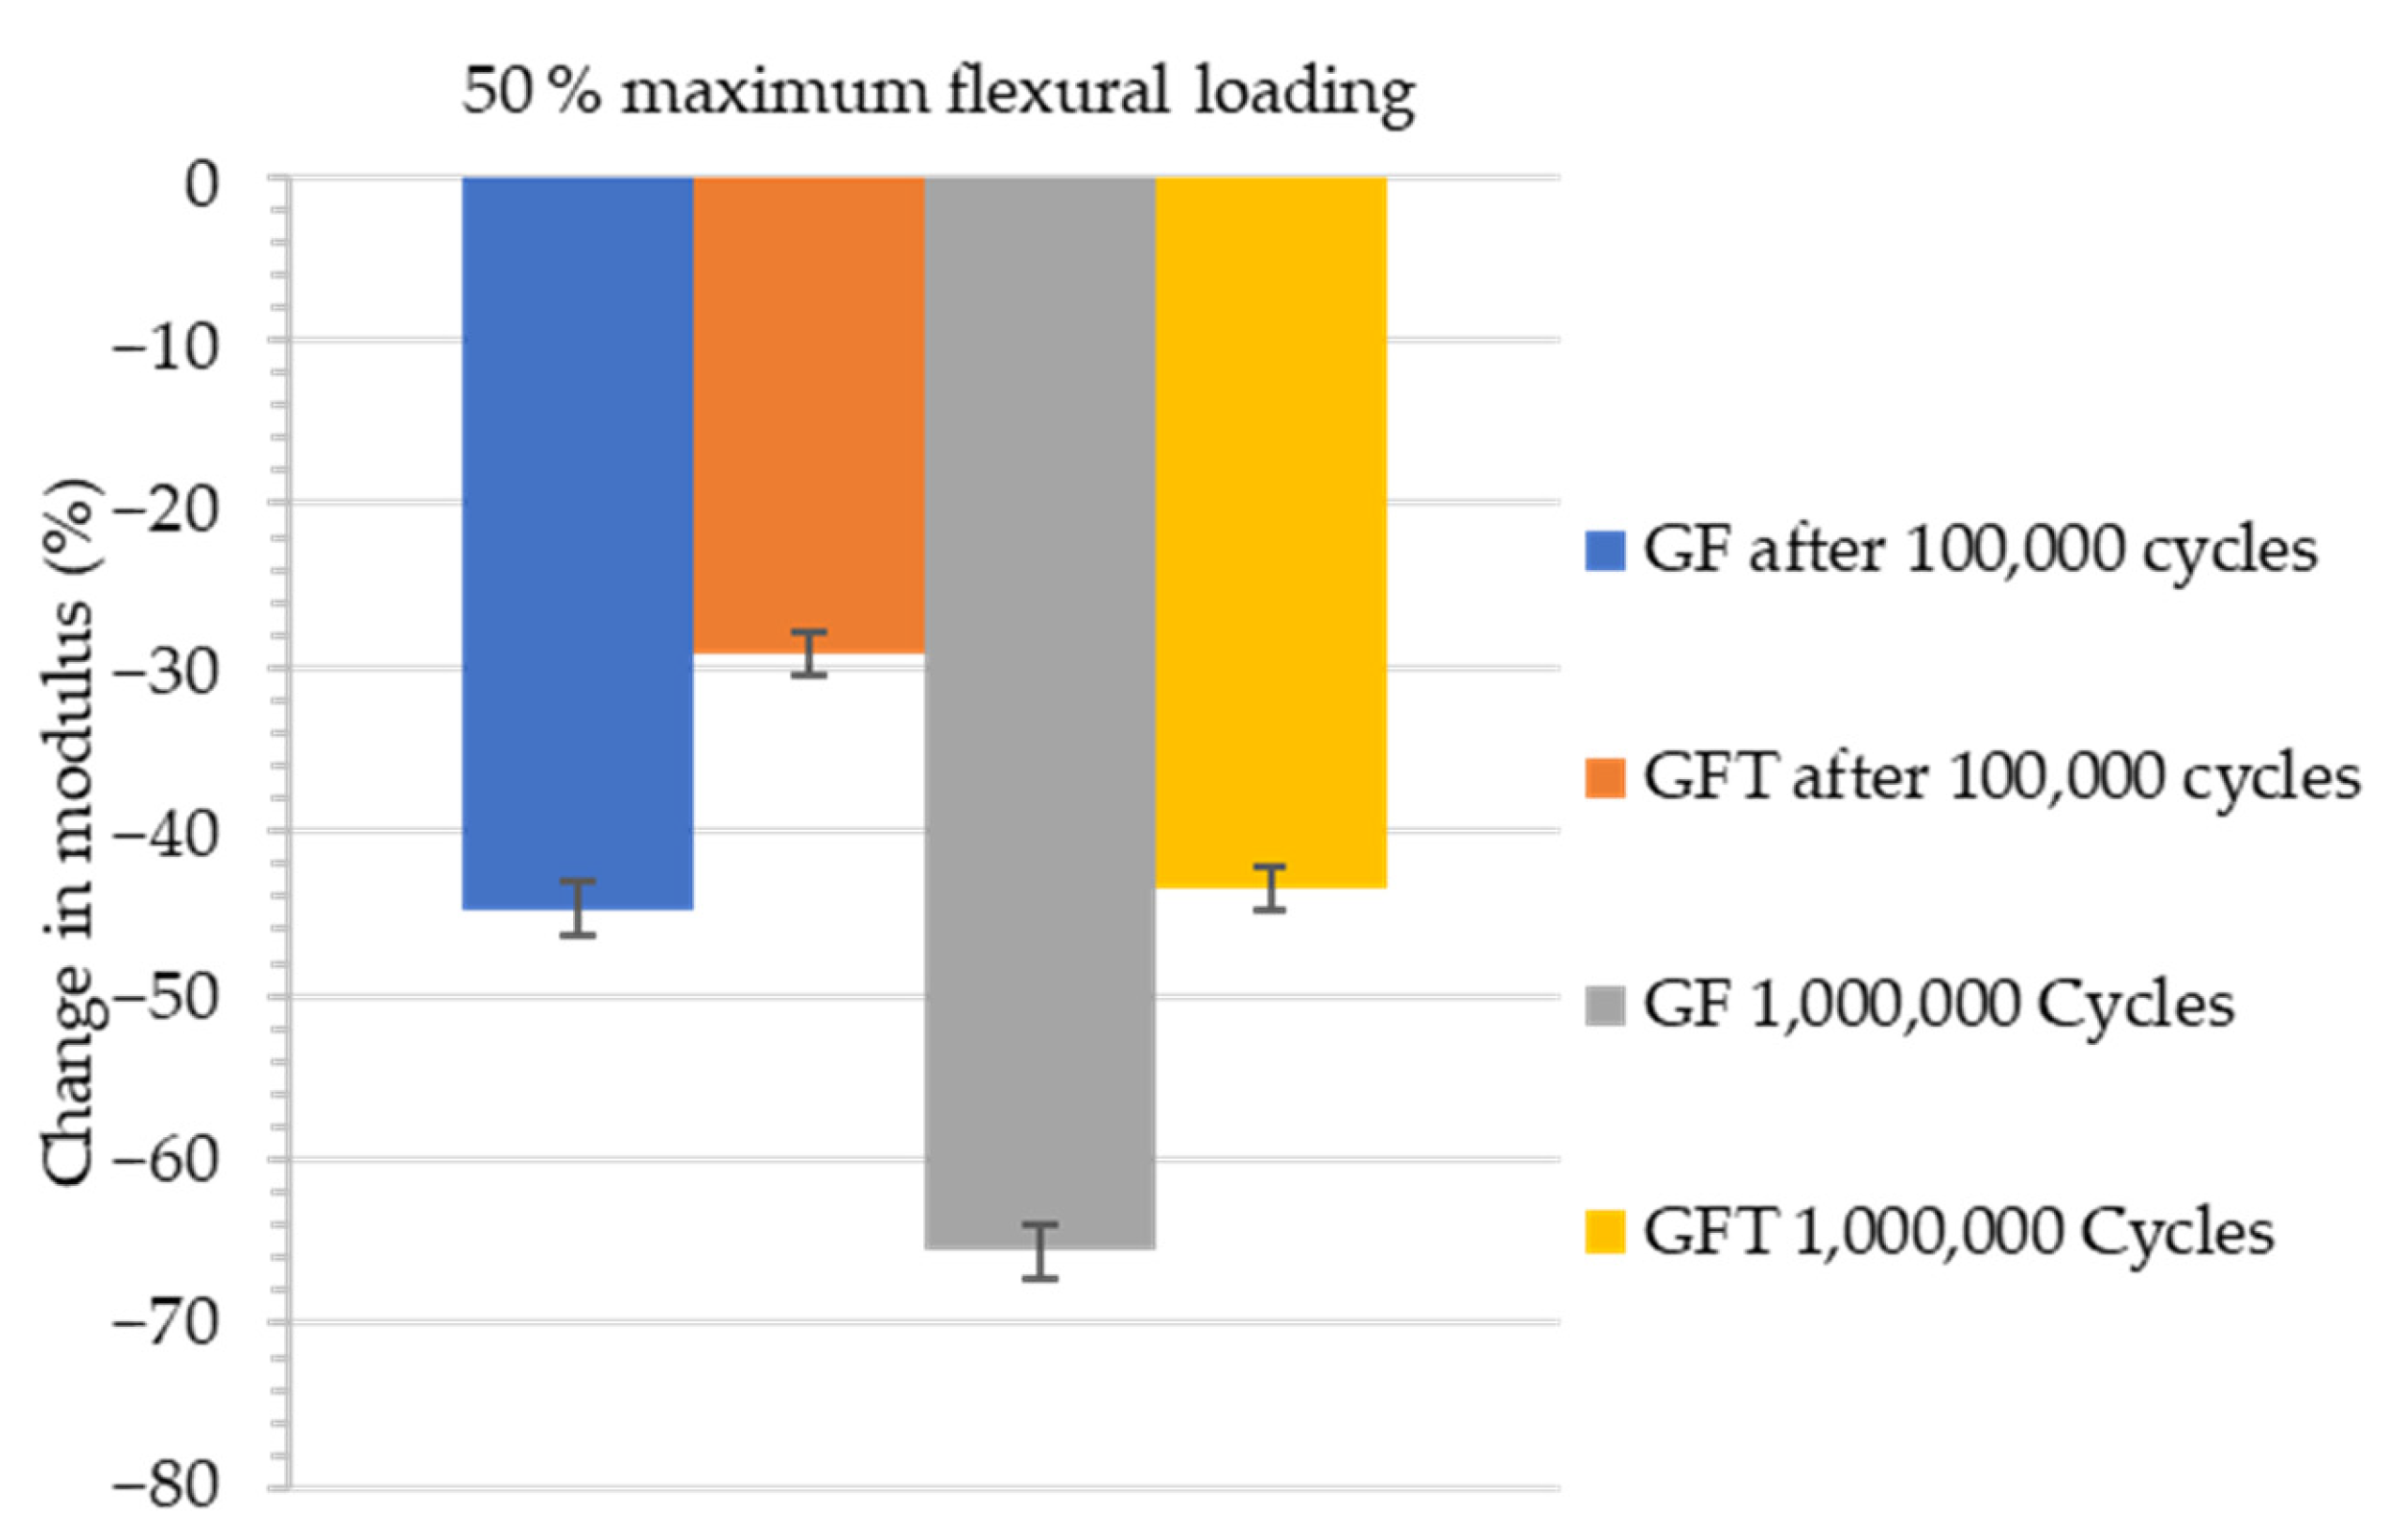
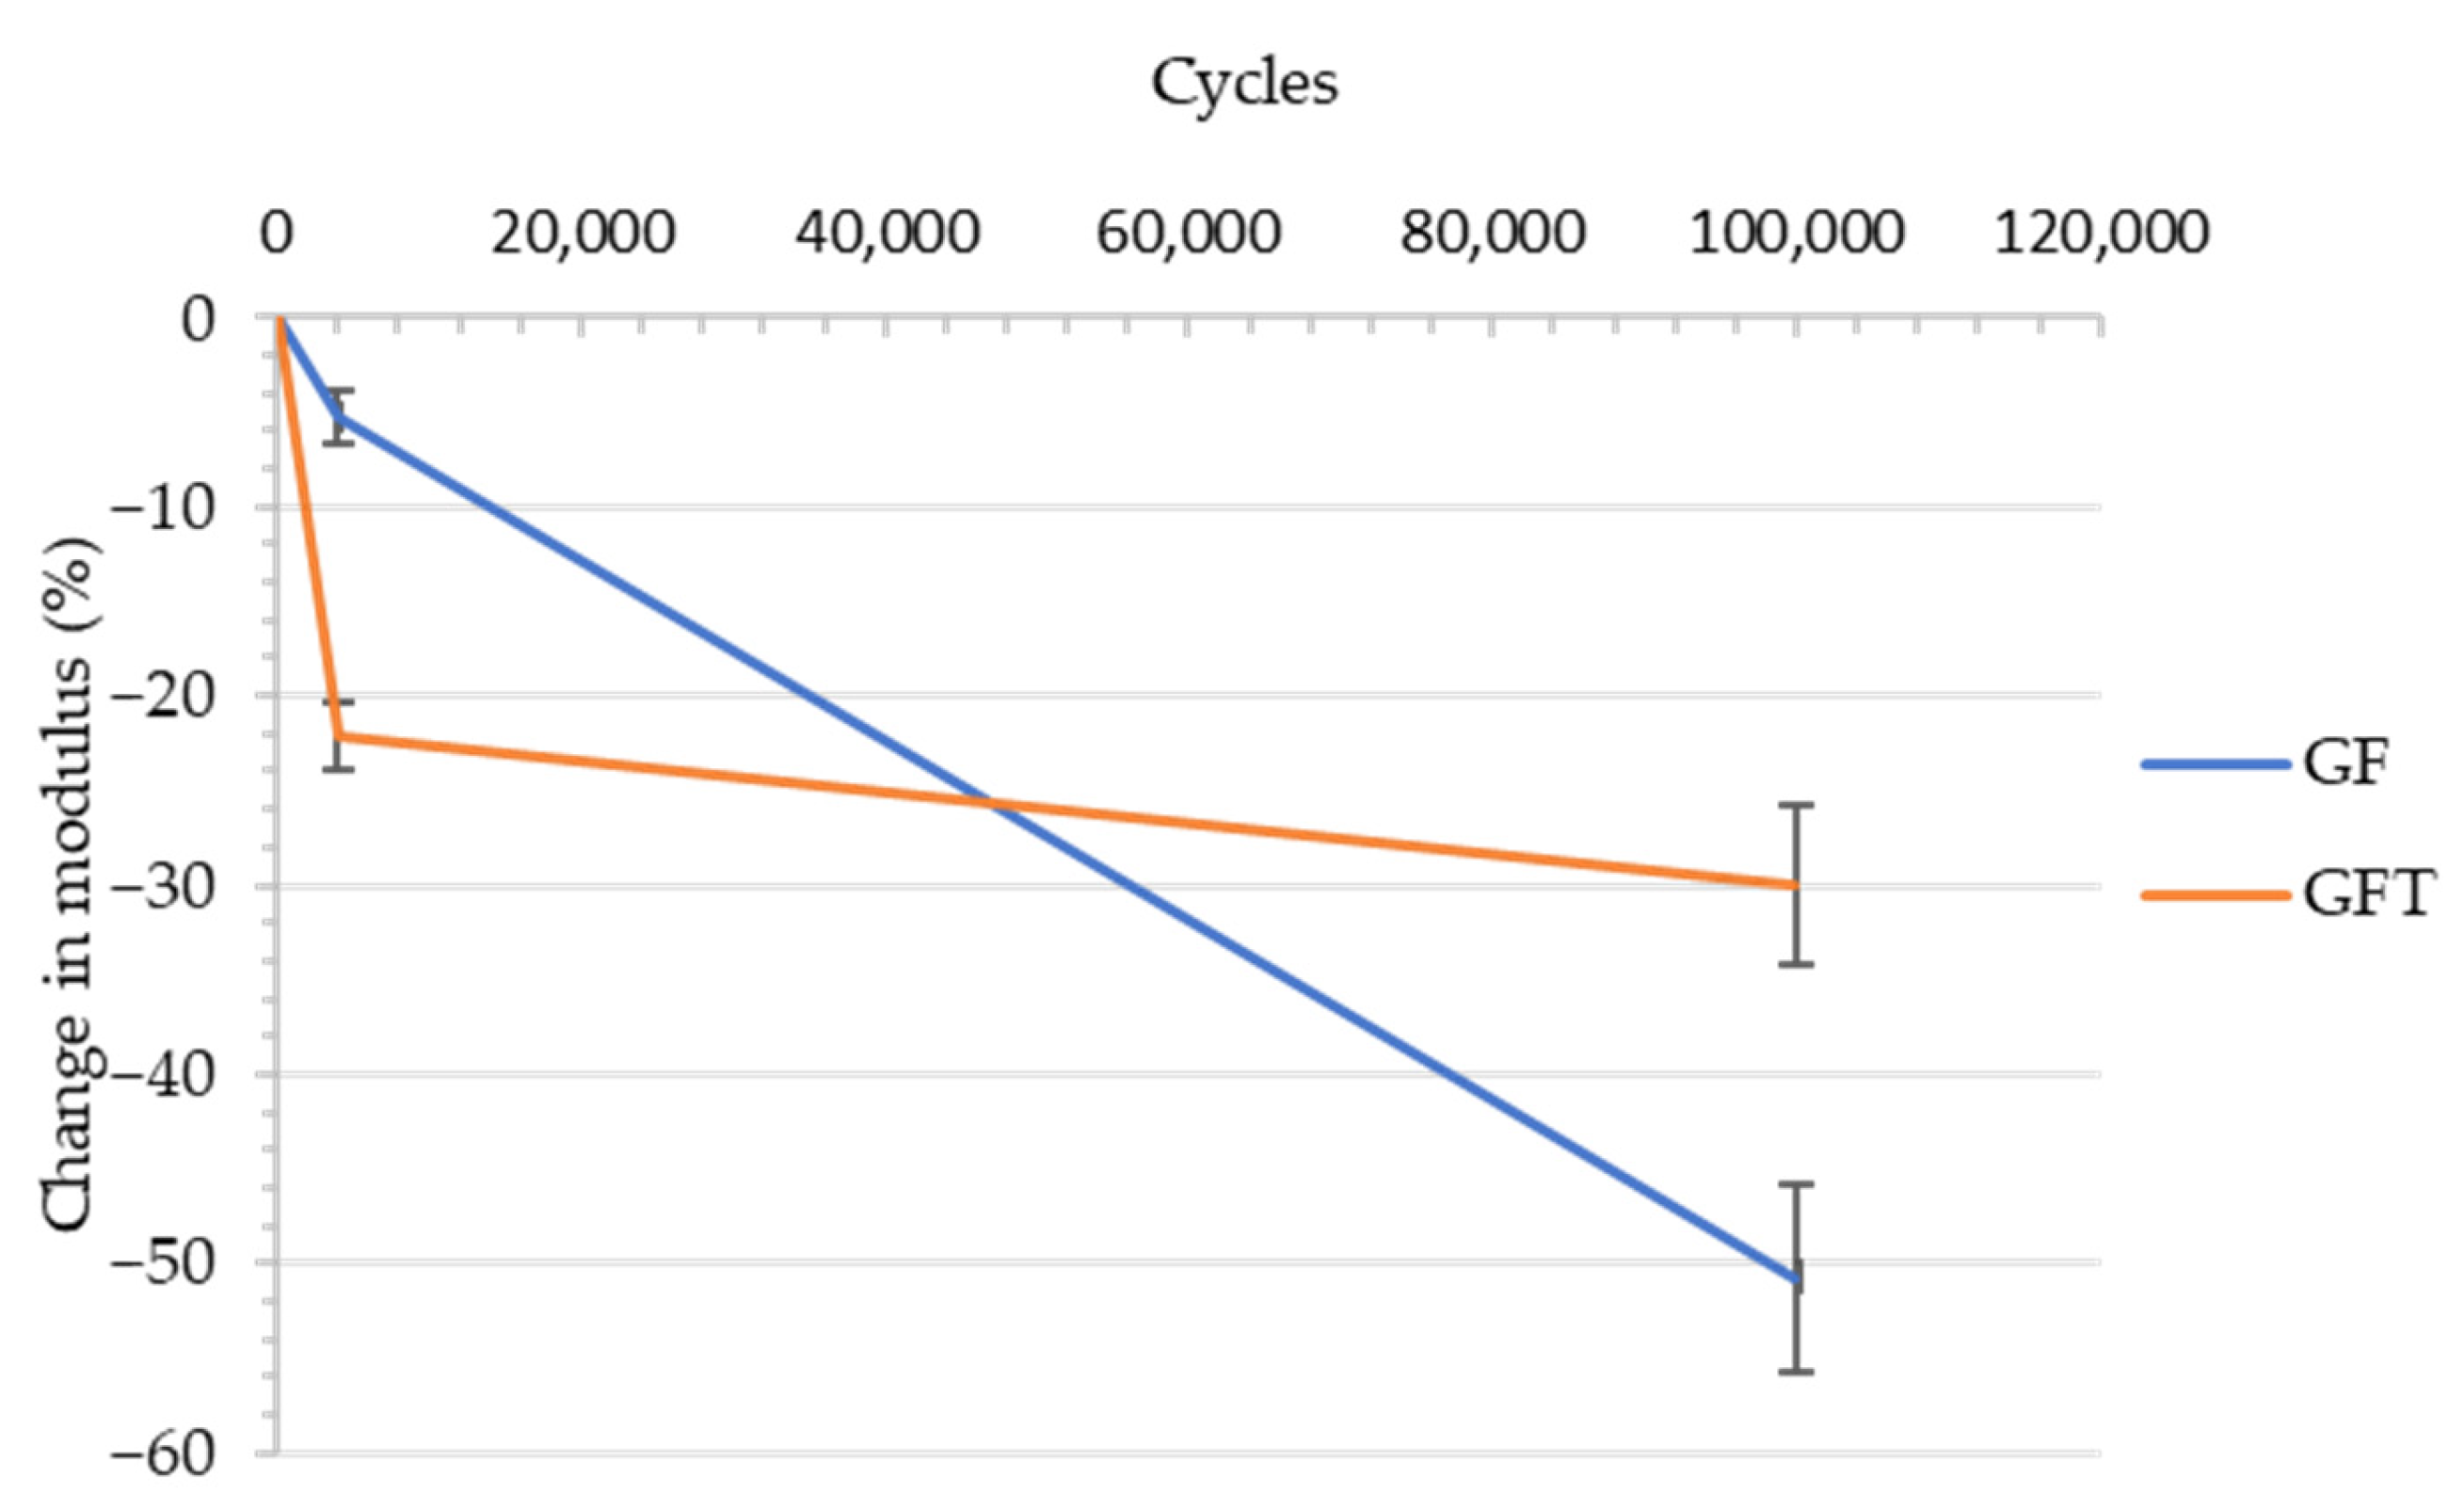
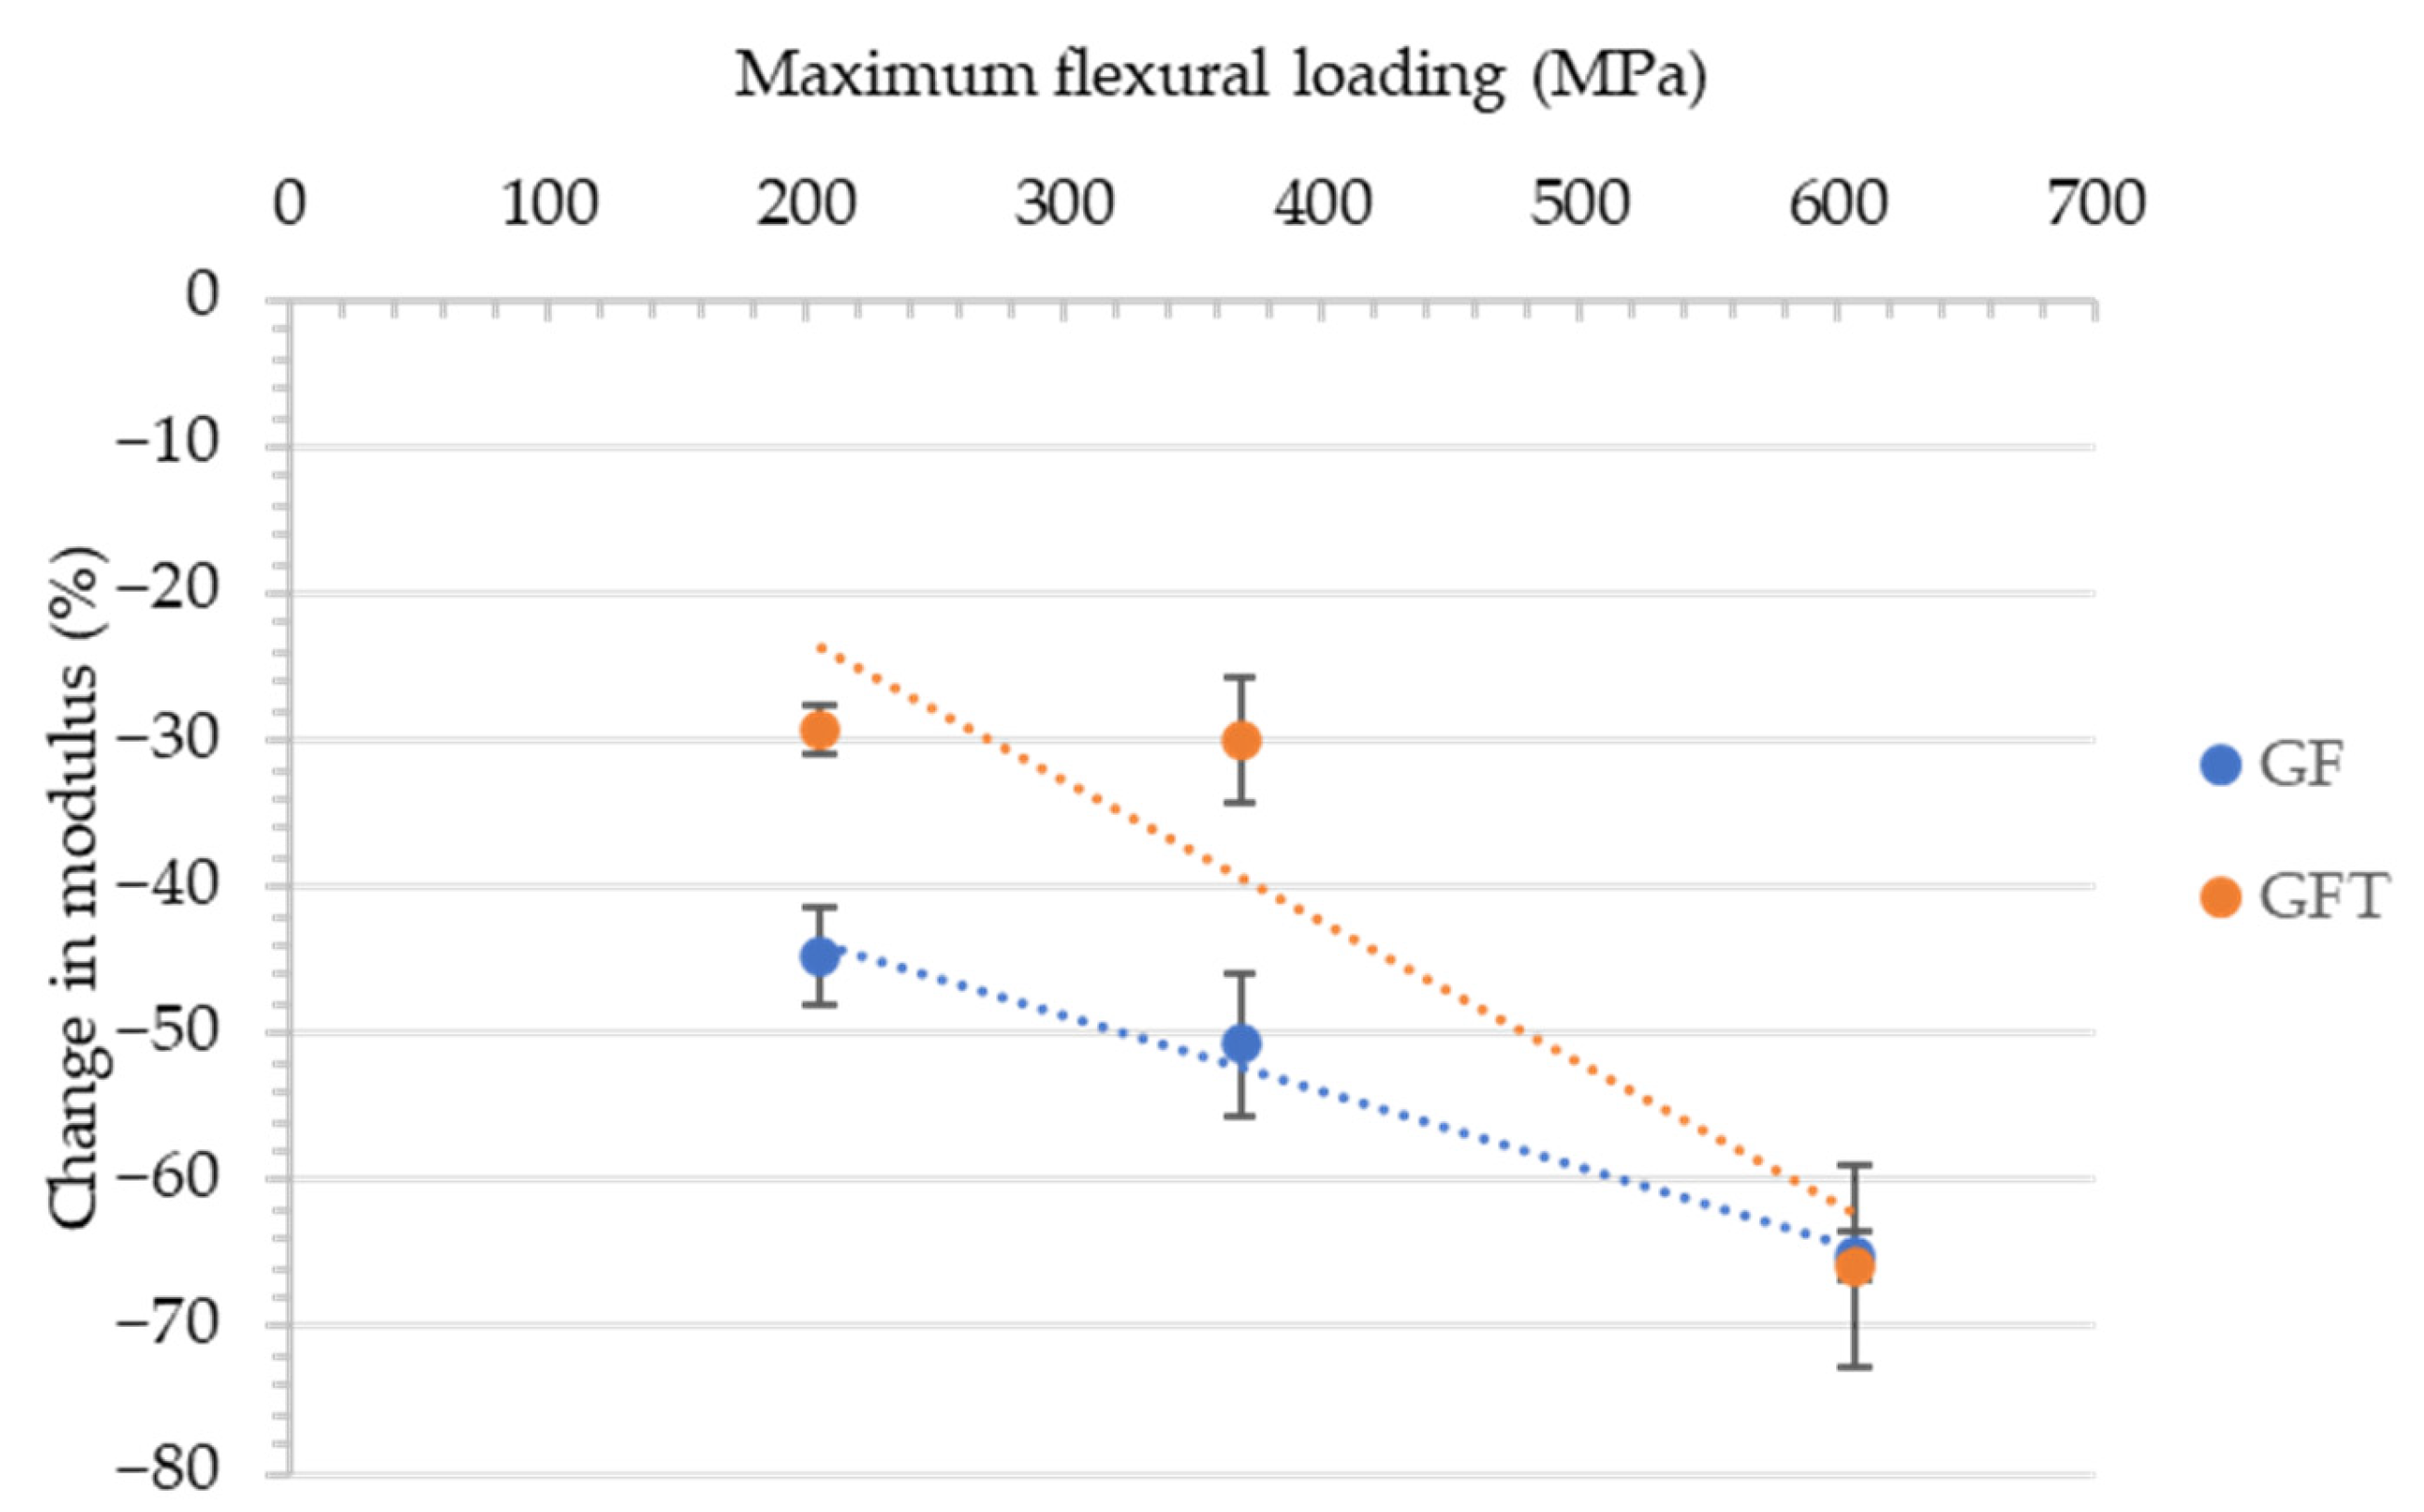
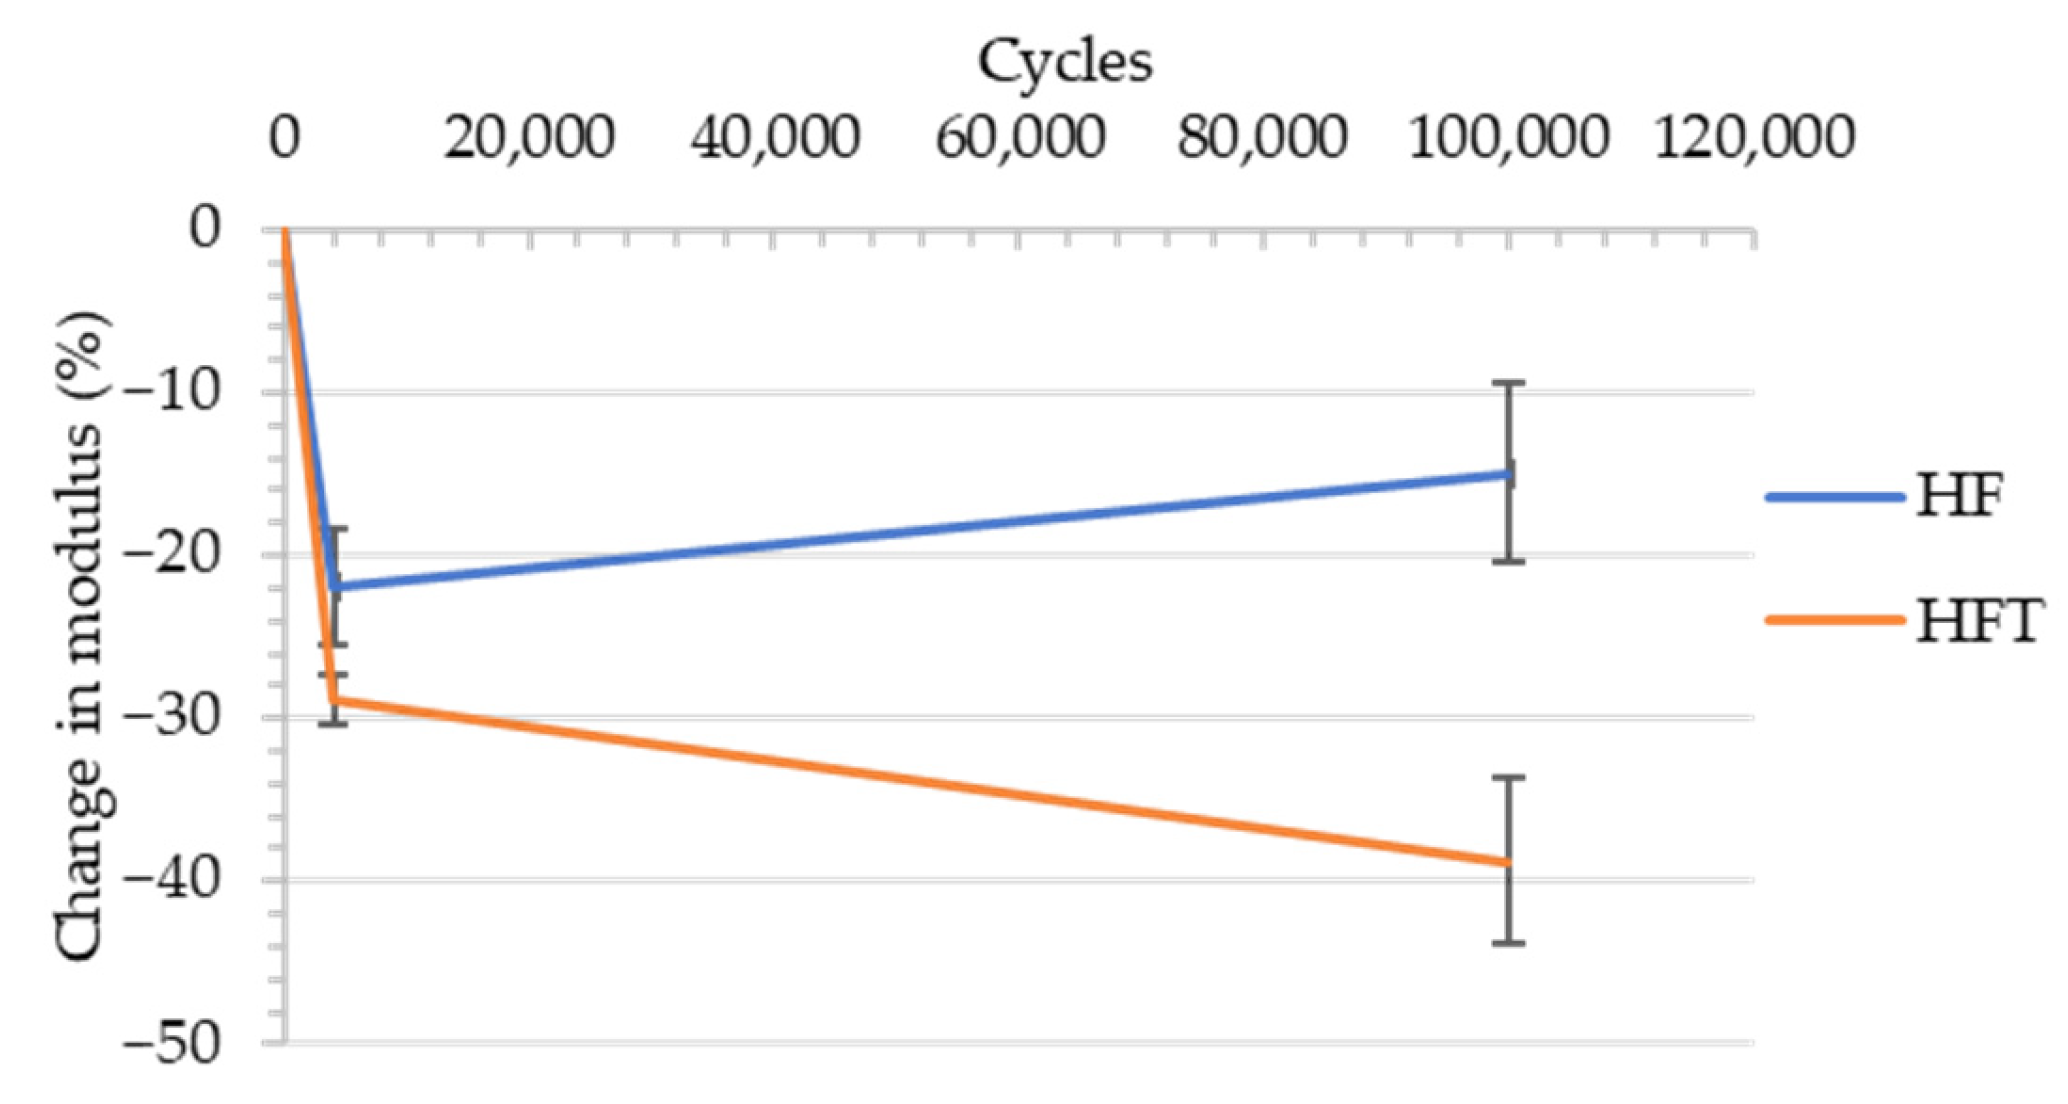
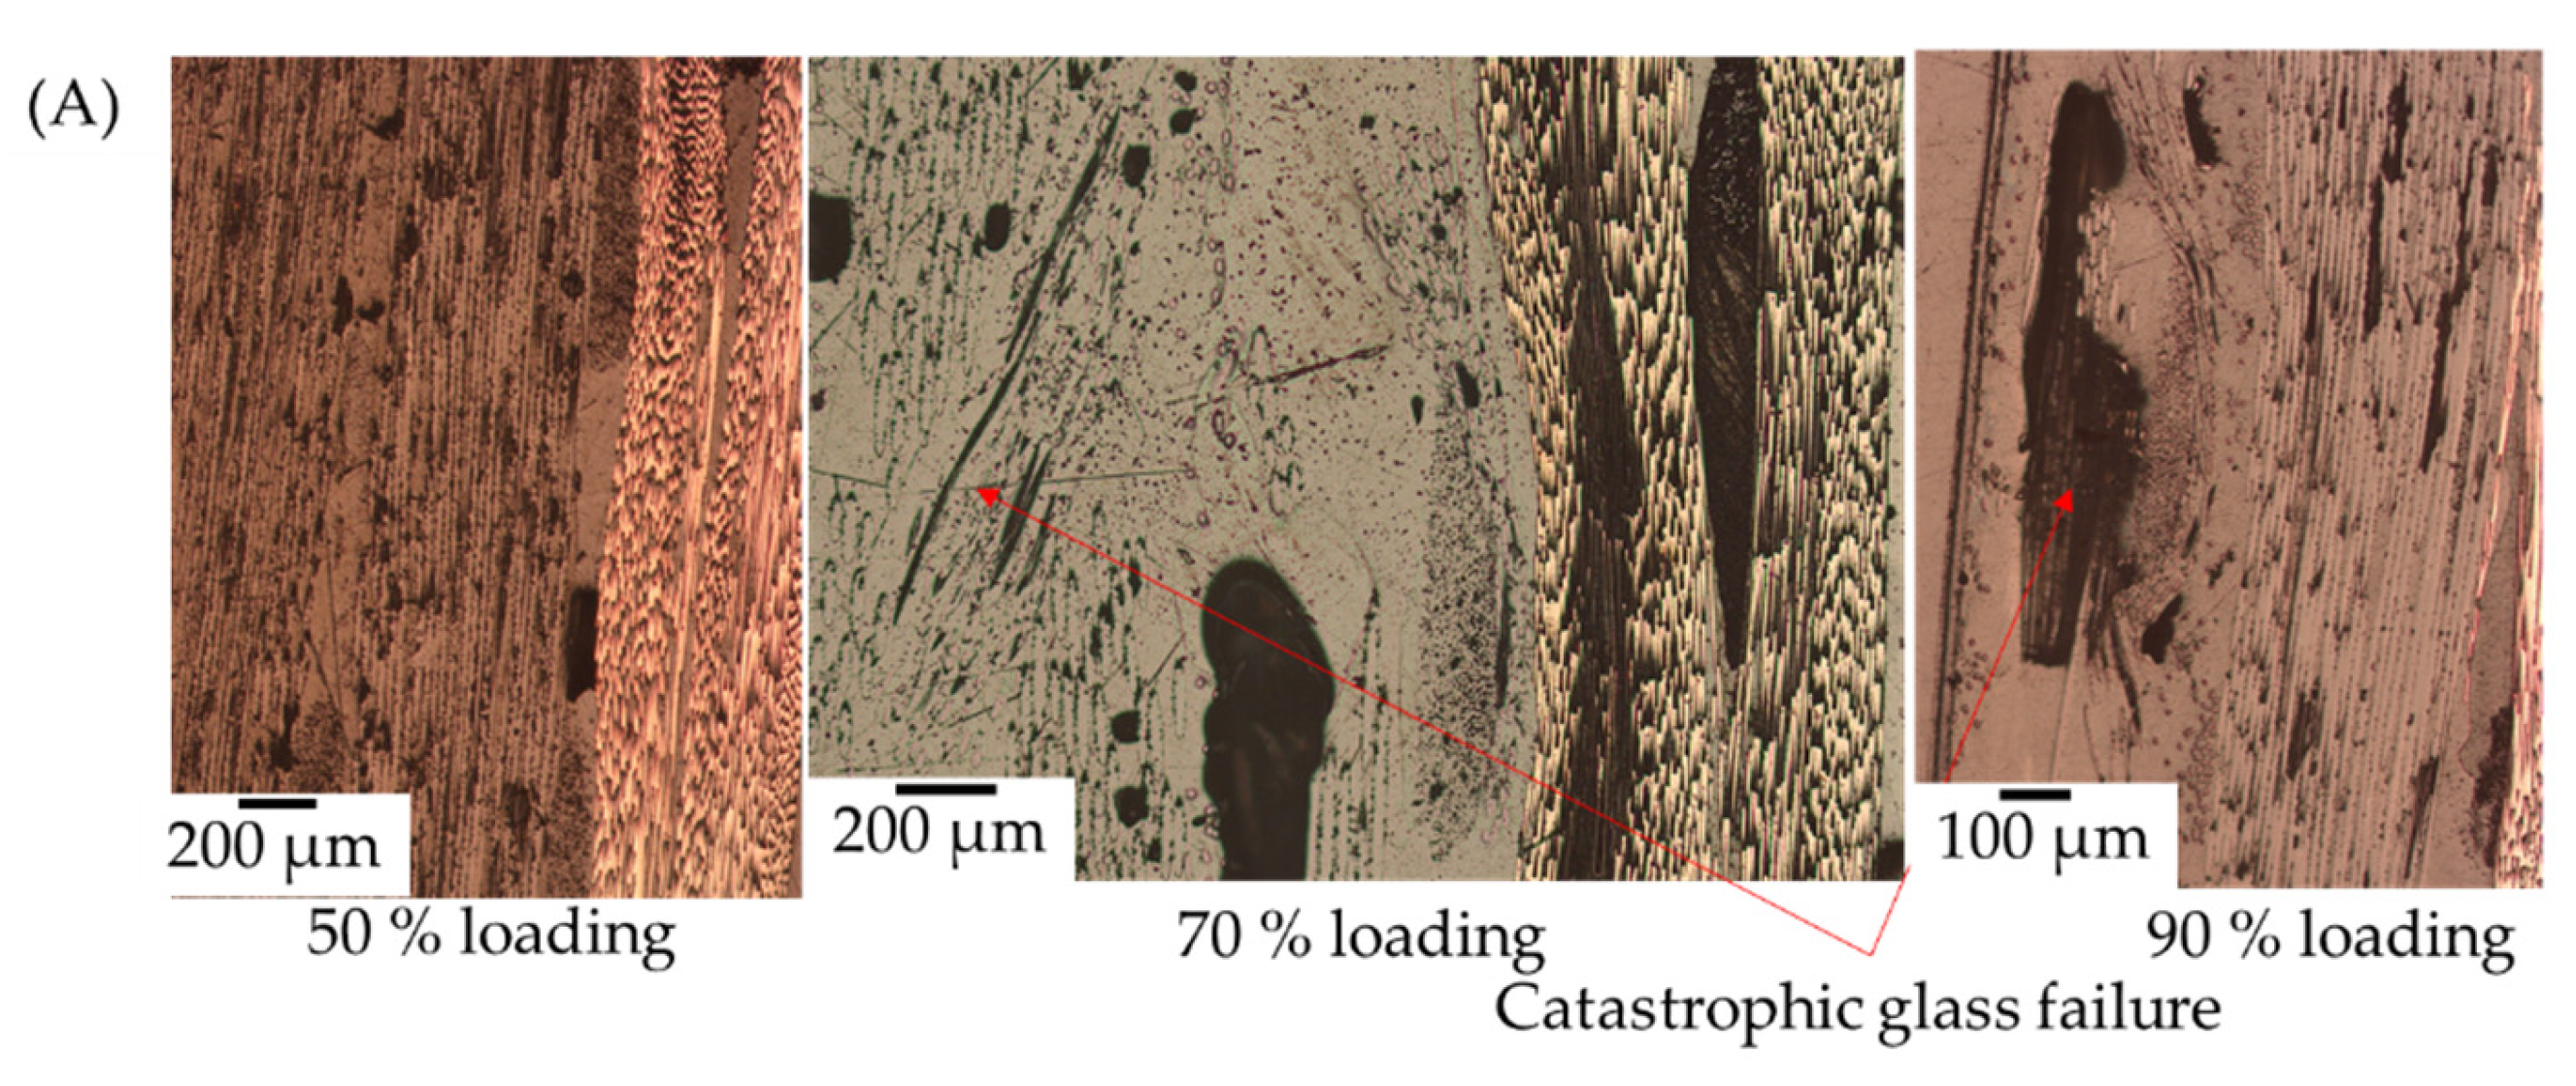
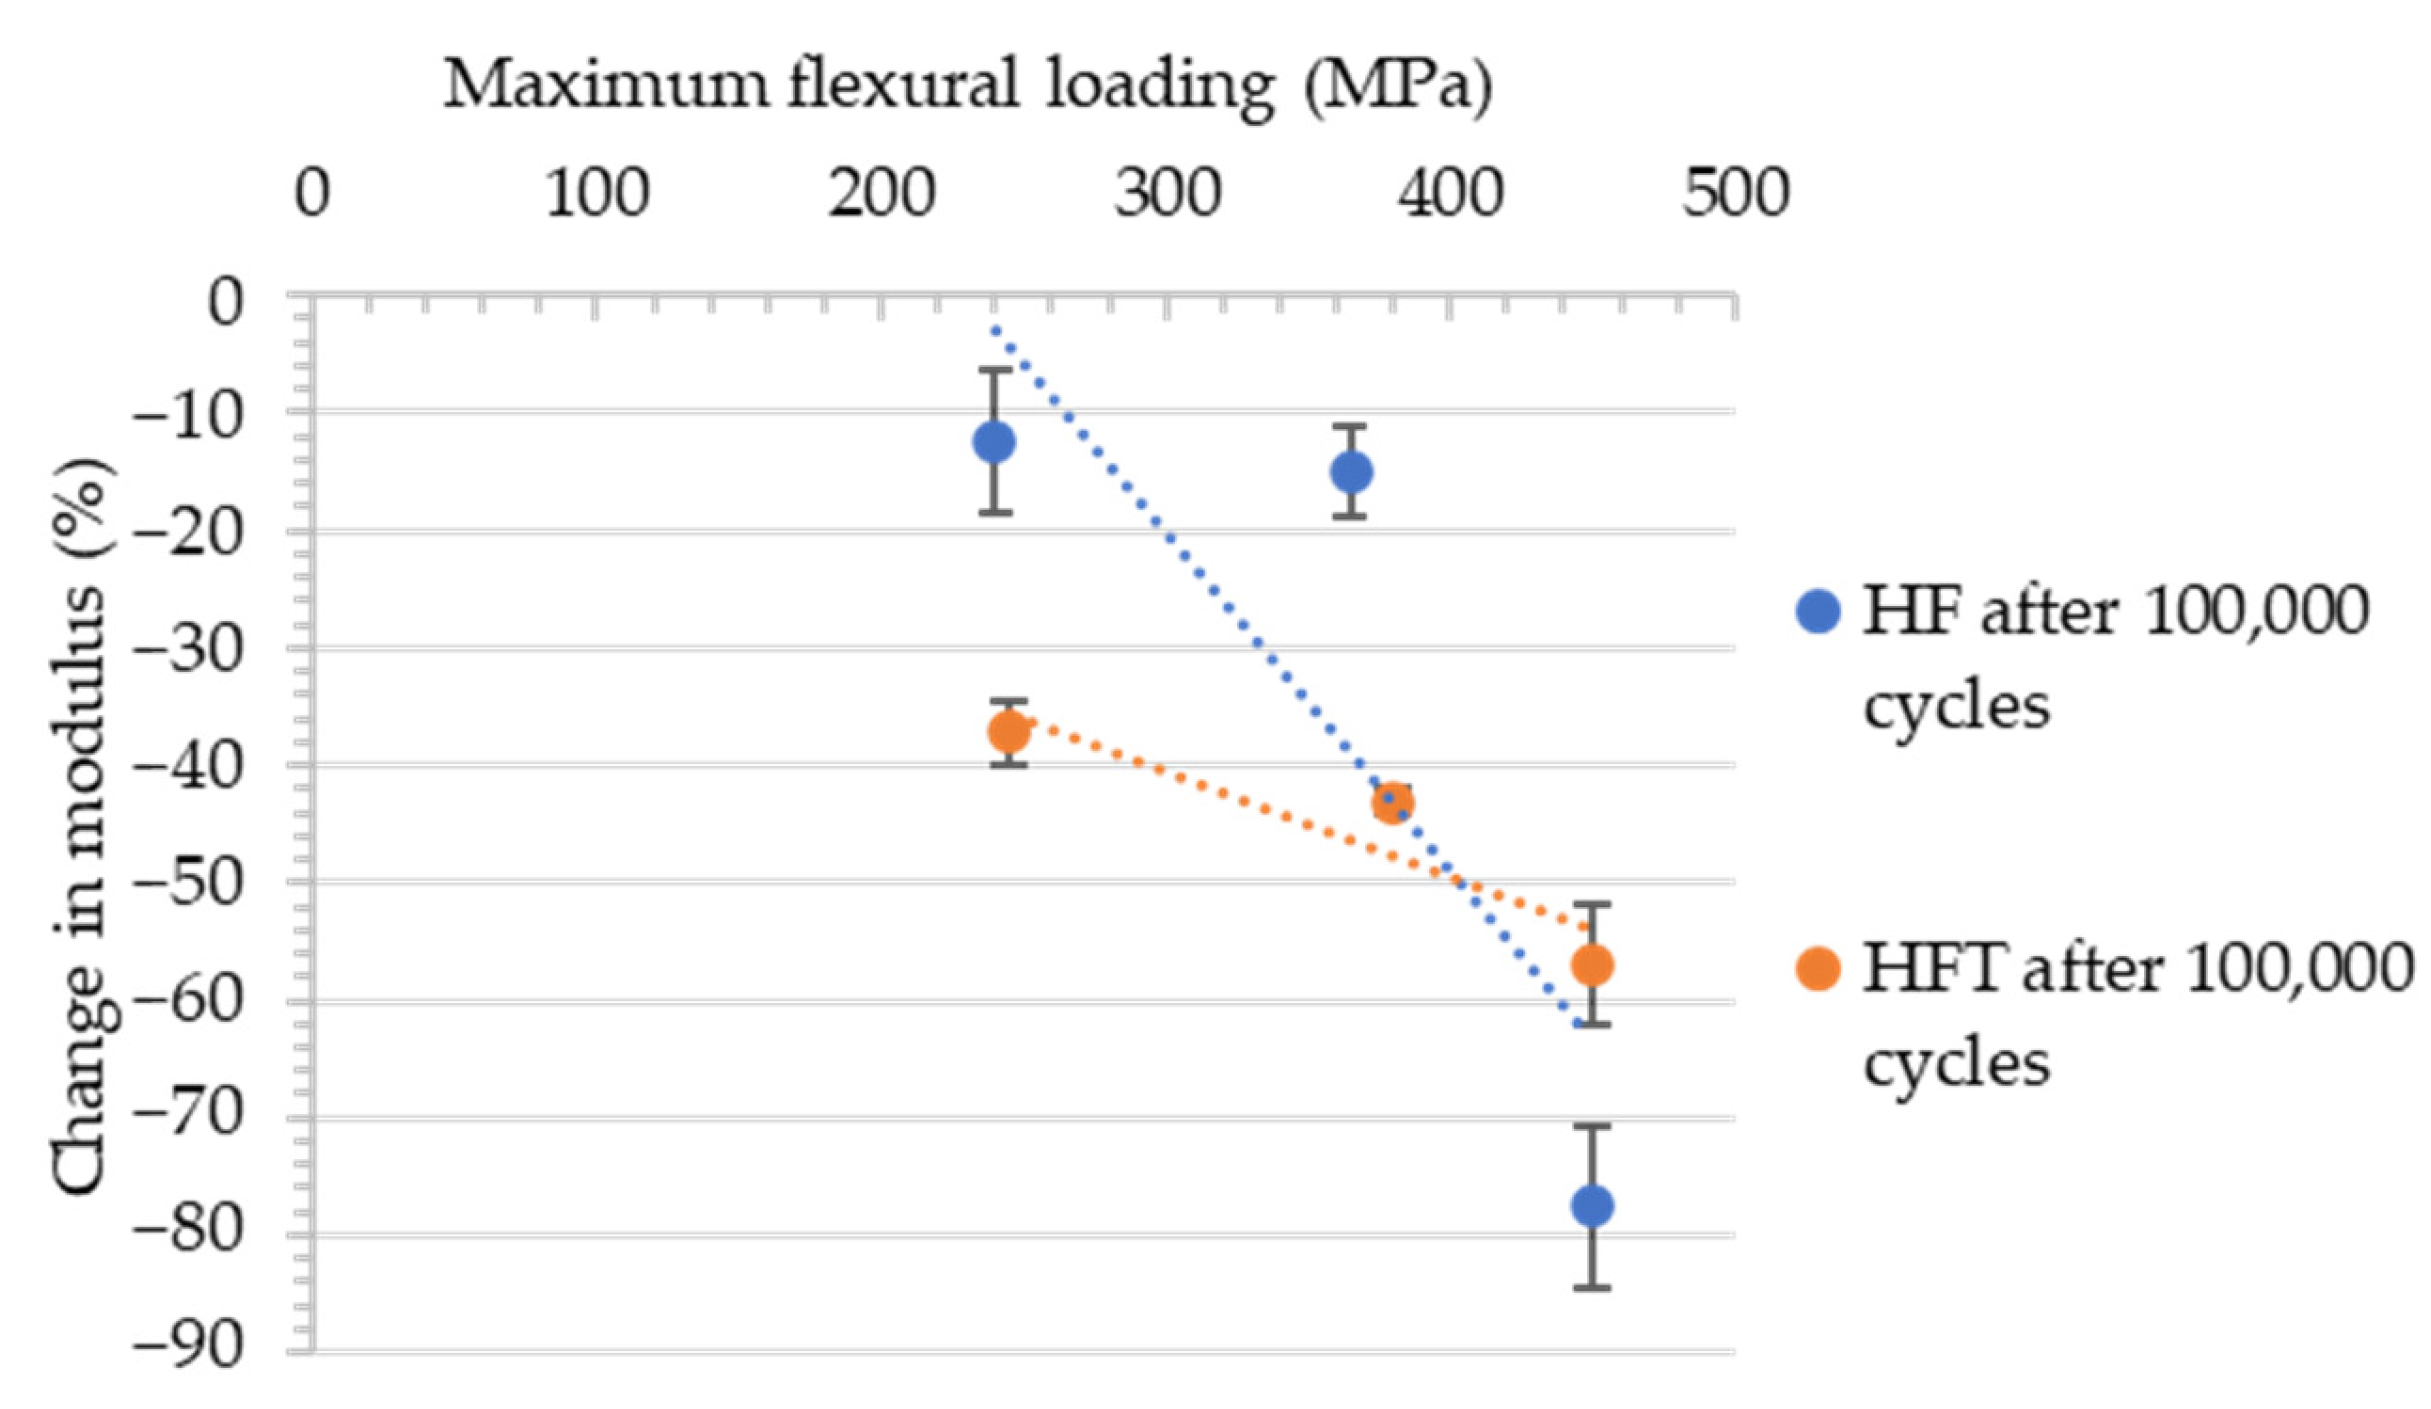
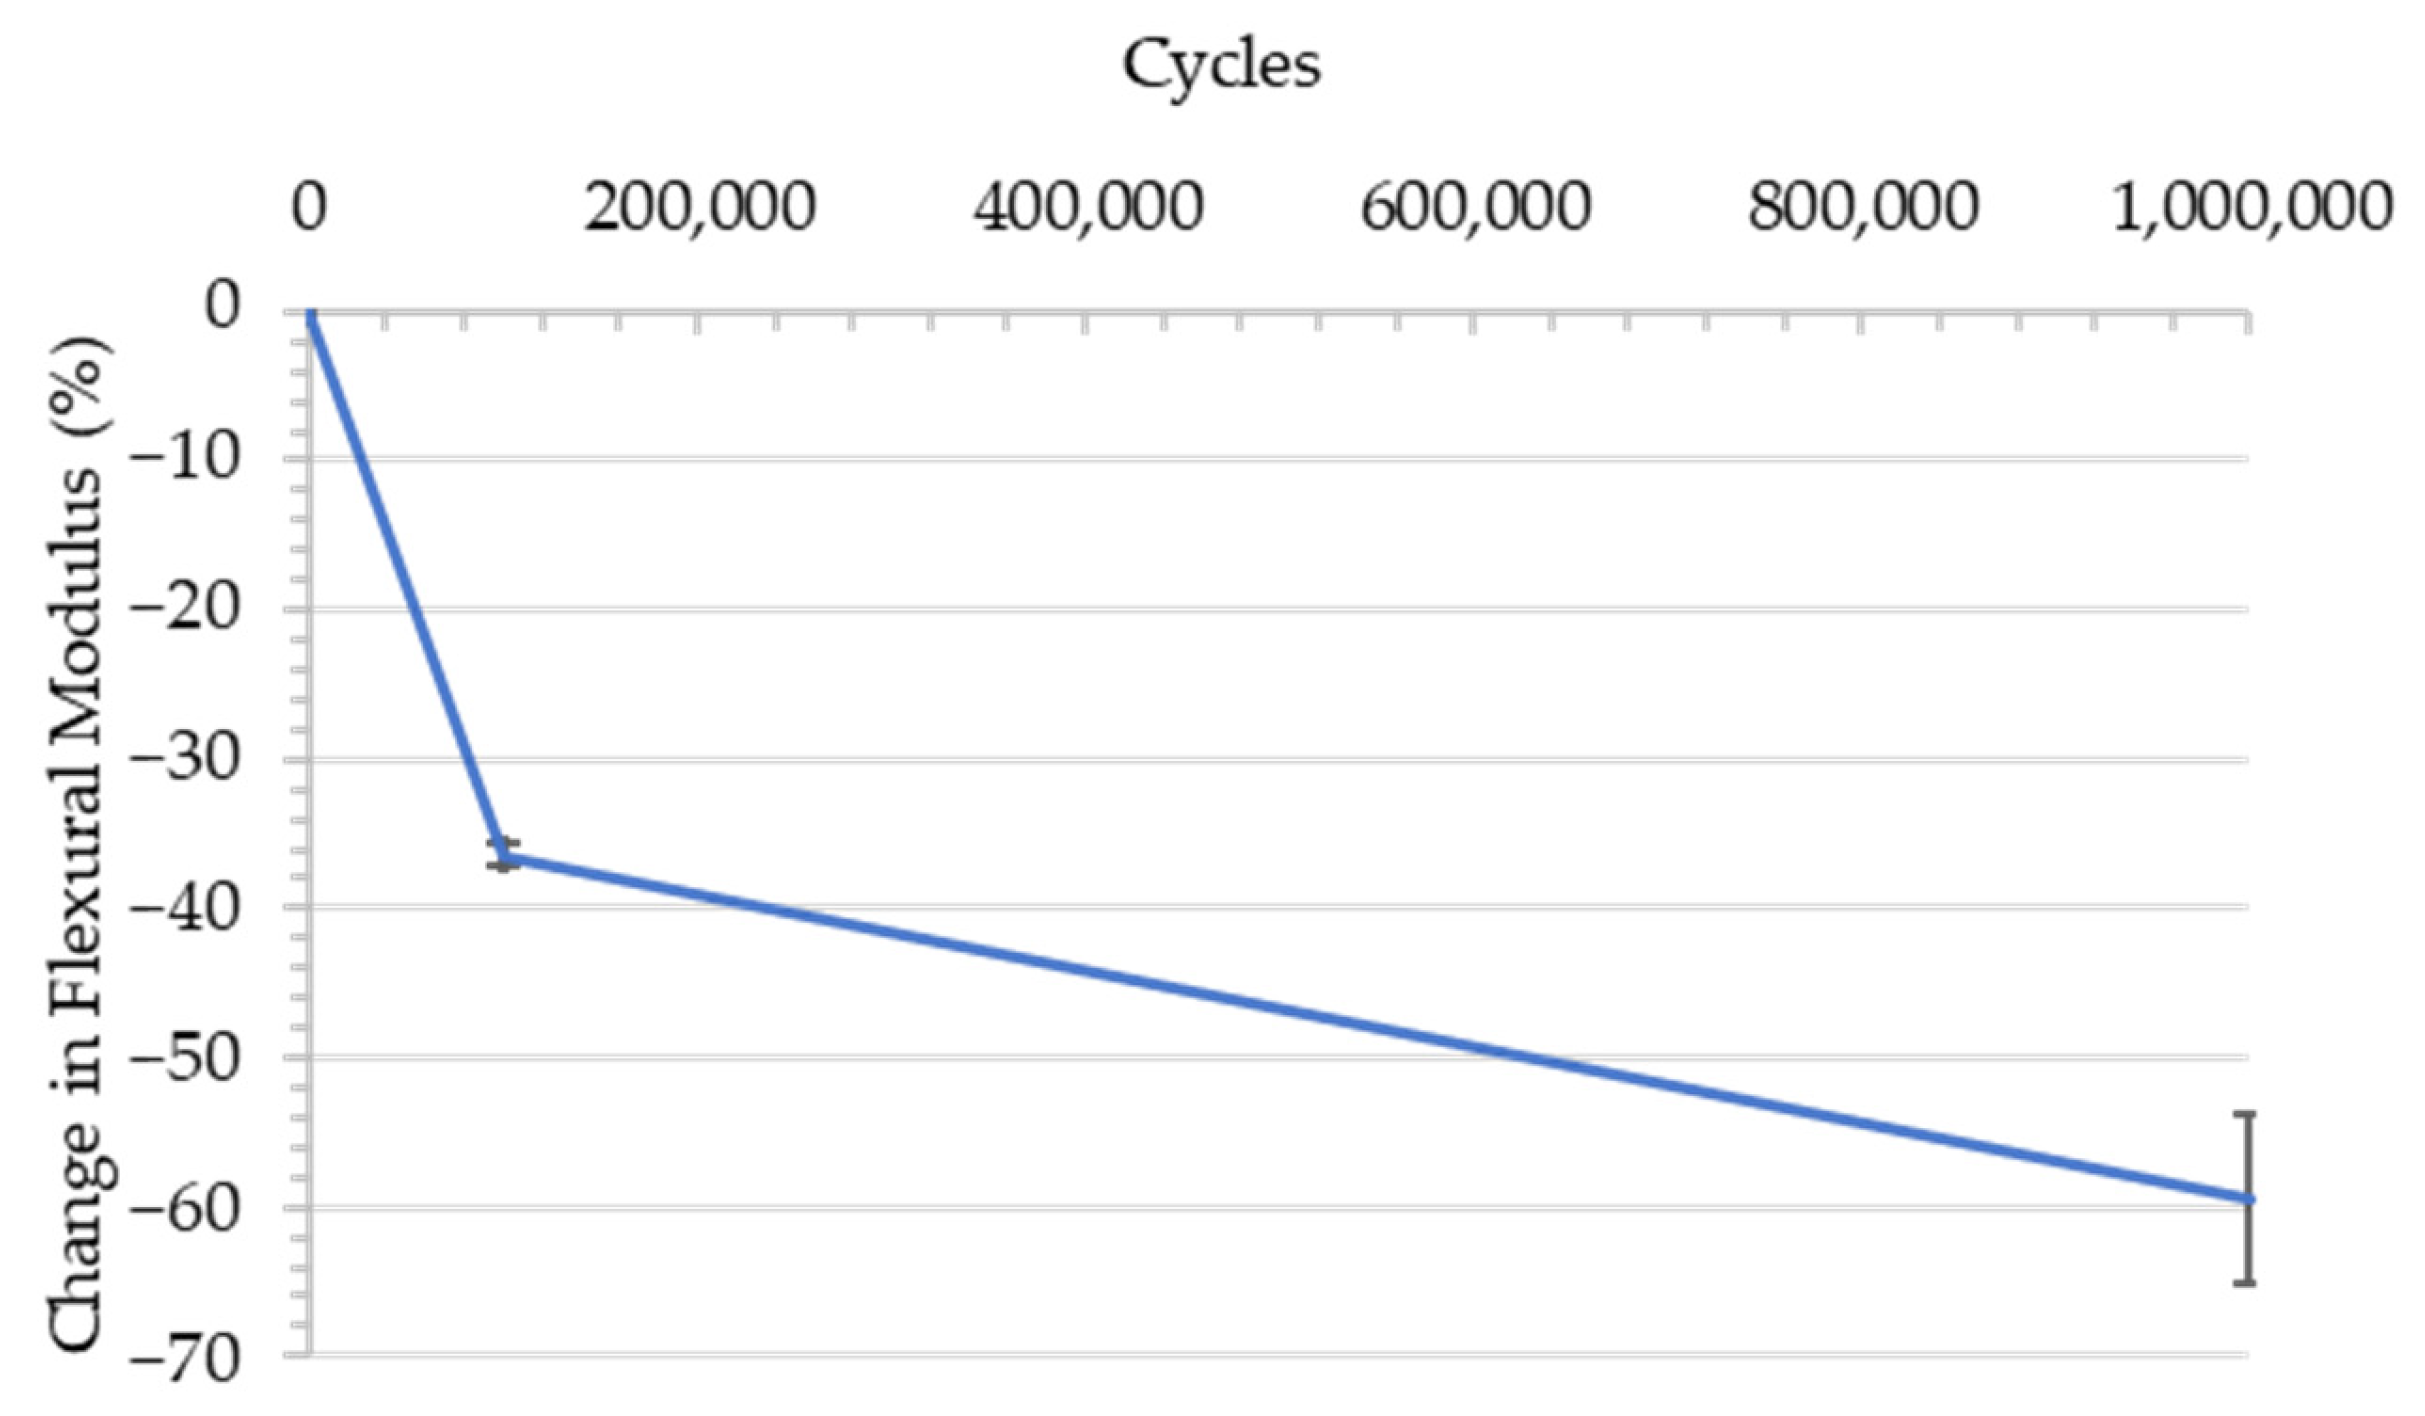
3.1. Stiffness Degradation as a Function of Maximum Flexural Strength

Quasi-static testing was undertaken to determine the composite’s maximum flexural strength: for carbon fibre, the samples were tested at 700, 600, and 400 N; for toughened carbon fibre, samples were tested at 850, 660, and 470 N. In terms of percentages, this corresponded to 90, 70, and 50% of the material’s maximum flexural strength, with the actual newton loading of the material being 70, 60, and 150 N higher in the toughen samples than the untoughened samples.
The section covers the carbon fibre toughened with PA 6,6 nanofibre veil. In static testing, the veil toughening was shown to increase the modulus of the carbon fibre; however, it was unclear whether this quantity was statistically significant. To better quantify the statistical significance of the modulus, increased stiffness degradation were used. Cyclic three-point bending at 50% of the maximum flexural strength loading and unloading of the sample were used to determine the overall stiffness of the material over 100,000 cycles. The results were then compared with those of higher loadings to determine whether the veil can increase the loading capacity of carbon fibre. Finally, to establish a baseline test for the carbon fibre, one million cycles at 50% maximum flexural strength were performed, which is a typical number of cycles from previous literature.
CF shows high fatigue resistance with the minimal modulus drop after 100,000 cycles for both was expected. CF experienced minor matrix cracking before 100,000 cycles, dropping the modulus by 10.4% and at 7.6% and 10.4% for CF and CFT, respectively. Interlaminar cracking occurring after 1,000,000 cycles for all samples, shown in Figure 5, reduced the CF and CFT by 51.0% and 24.9%, respectively. The significant differences in the failure were that CFT showed less cracking around cross-stitching.
After 1,000,000 cycles at 50% maximum flexural strength, significant modulus retention was shown by CFT samples, as the veil toughened CFT samples showed 24.9% modulus loss in comparison to the CF samples of 51%. The resulting failure after 1,000,000 cycles is shown in Figure 6, as the crack propagation reaches the adjacent ply. One key difference with CFT was the matrix cracking appeared to be trapped by the veil, as shown in Figure 6B. After 1,000,000 cycles, significantly more instances of matrix cracking were observed, with very few instances of fibre failure observed.
For the CF sample, a drop in stiffness to 31.4 GPa was recorded after 1 million cycles. This drop in stiffness was observed as interlaminar cracking, as well as between-fibre cracking in the fibre layer, as shown in Figure 6. In the CFT sample, inter-ply failure was recorded after 1 million cycles, and the average modulus was 52.4 GPa, a 66.87% higher retention in modulus compared to CF. Compared with 100,000 cycles, testing at 1,000,000 cycles showed that the veil toughening; while it did not prevent crack initiation, it significantly reduced crack propagation. The cracks were prevented by the veil from propagating through the laminate, localising failure, and preventing stiffness degradation over time. Figure 7 indicates that the veil toughening showed little effect on high cyclic loading, rather than improving crack growth resistance and preventing fibre failure due to high stress amplitude. The distribution of the modulus at each loading condition after 100,000 cycles is shown in Figure 7.
A comparison between stiffness degradation and amplitude is shown below in Figure 7. Although the CFT had a higher loading, the stiffness loss between the two fibres was more consistent with that of the veil toughened samples. Consistency in stiffness degradation is important for predictive modelling, with premature failing and other random failures resulting in deviations. At 90% maximum loading, the fibres were expected to catastrophically break, and the resulting failure mechanisms were observed to be kink banding for both CFT and CF.
The veil toughened sample in Figure 7 showed a decrease of 28.4%, compared with CF, where a 10.52% loss of stiffness was recorded. Both CF and CF T showed minor matrix cracking occurring around the cross-stitching. For carbon fibre in Figure 8, the failure toughening showed improved matrix cracking; although, at higher loading conditions, the veil toughening did not prevent catastrophic failure, due to fibre breaking. This feature is evident in the formation of kink banding in both CF and CFT samples, where static testing buckling was observed, rather than the formation of kink banding. In static testing, kink banding was only observed with CFT samples. After 100,000 cycles, there is clearer kink band formation in the first and second carbon layer, as shown in Figure 8B for 70% and 90% loading.
The veil toughening and carbon fibre labelled CFT was shown to have a higher strain of 0.3% before failure. However, 20,000 additional cycles elapsed before CF failed catastrophically. At 90% maximum loading, the CF and CFT had experienced catastrophic failure in all samples, with an average modulus of 10.23 GPa for CFT and 25.46 GPa for CF. CFT’s 90% higher modulus suggests that the fibre yield is not prevented with veil toughening at higher amplitudes. Most fibre failure occurred at 70%, with total failure at 90% maximum loading. With failure, the veil samples encountered a large drop in modulus.
After 100,000 cycles, there was clearer kink band formation in the first and second carbon layer, as shown in Figure 8. The formation of kink banding is also visible in the residual moduli of the beam, as CF was reduced to 50.29 GPa, compared with the 52.68 ± 3.84 GPa of CFT. Both sets had a data point that catastrophically failed, with residual moduli of 10.8 and 11.5 GPa for CF and CFT, respectively.
The cause of catastrophic failure in both samples is the formation of a kink band. In veil toughened samples, the losses are shown as kink band formations that occur in the top layers, as shown in Figure 8. At lower amplitudes, the matrix cracking resulted in a minor loss of moduli. Both carbon fibre samples showed layer-by-layer failure; at 70% loading, the CF sample showed cracking at the neutral axis, which contributed to the complete failure observed.
The testing of amplitude would suggest that, after 100,000 cycles, the ideal load condition would be 500 N, rather than a higher loading, as the CF and CFT samples-maintained stiffness after 1 million cycles at 50% loading.
A comparison between stiffness degradation and amplitude is shown below in Figure 8. Comparison of the fibre tilt angle due to kink banding is shown in Figure 8, where kink bands present in 90% CF were recorded at 92° for the β angle. In CFT 70% the kink band β angle was 85° for the second ply and 80° for the compression ply, at 90% over 129°, which was recorded due to the catastrophic failure. The veil toughening was shown to have little impact on the fibre tilt angle when kink banging occurs at high stress amplitudes.
For CF, 70% was 2.31, which is consistent, as minimal delamination was recoded; in comparison to CF, 90% α was 18.5.
The debonding length α for CFT 70% was 13.63, which is equivalent to the debonding angle of 90% CFT of 14°. This similarity in debonding angle suggests that the interplay failure is higher in the veil toughened samples of CF.

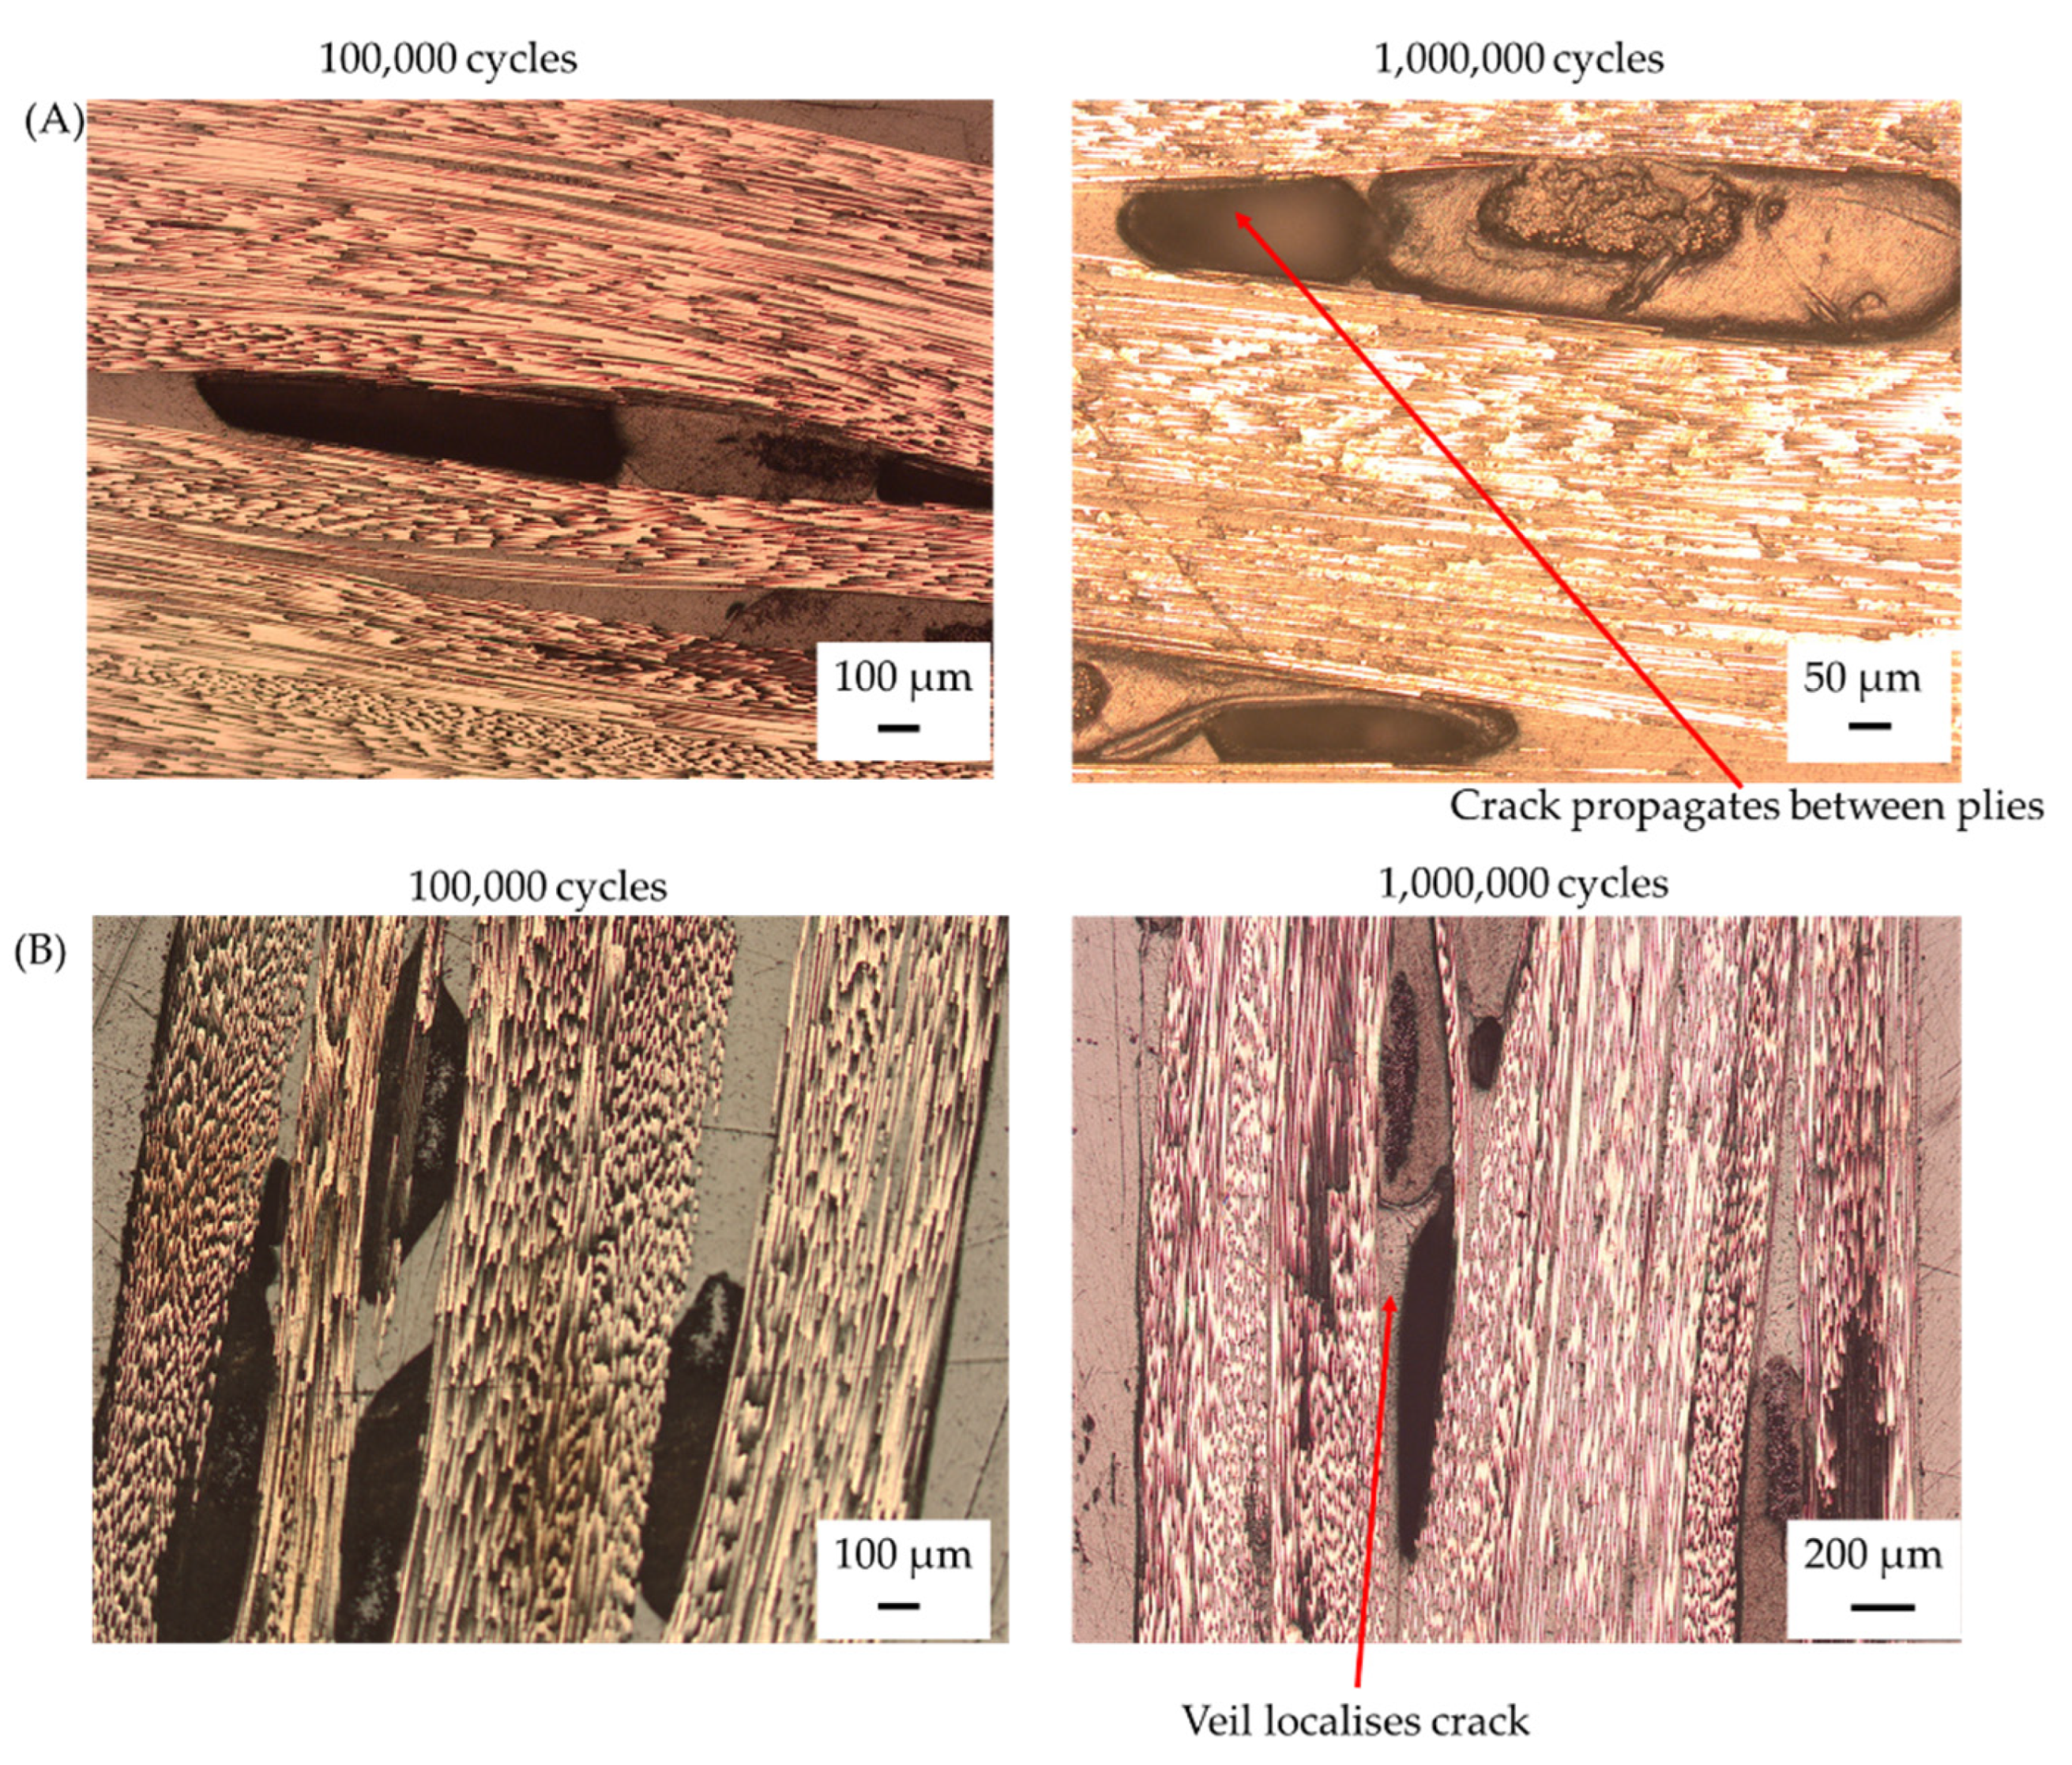
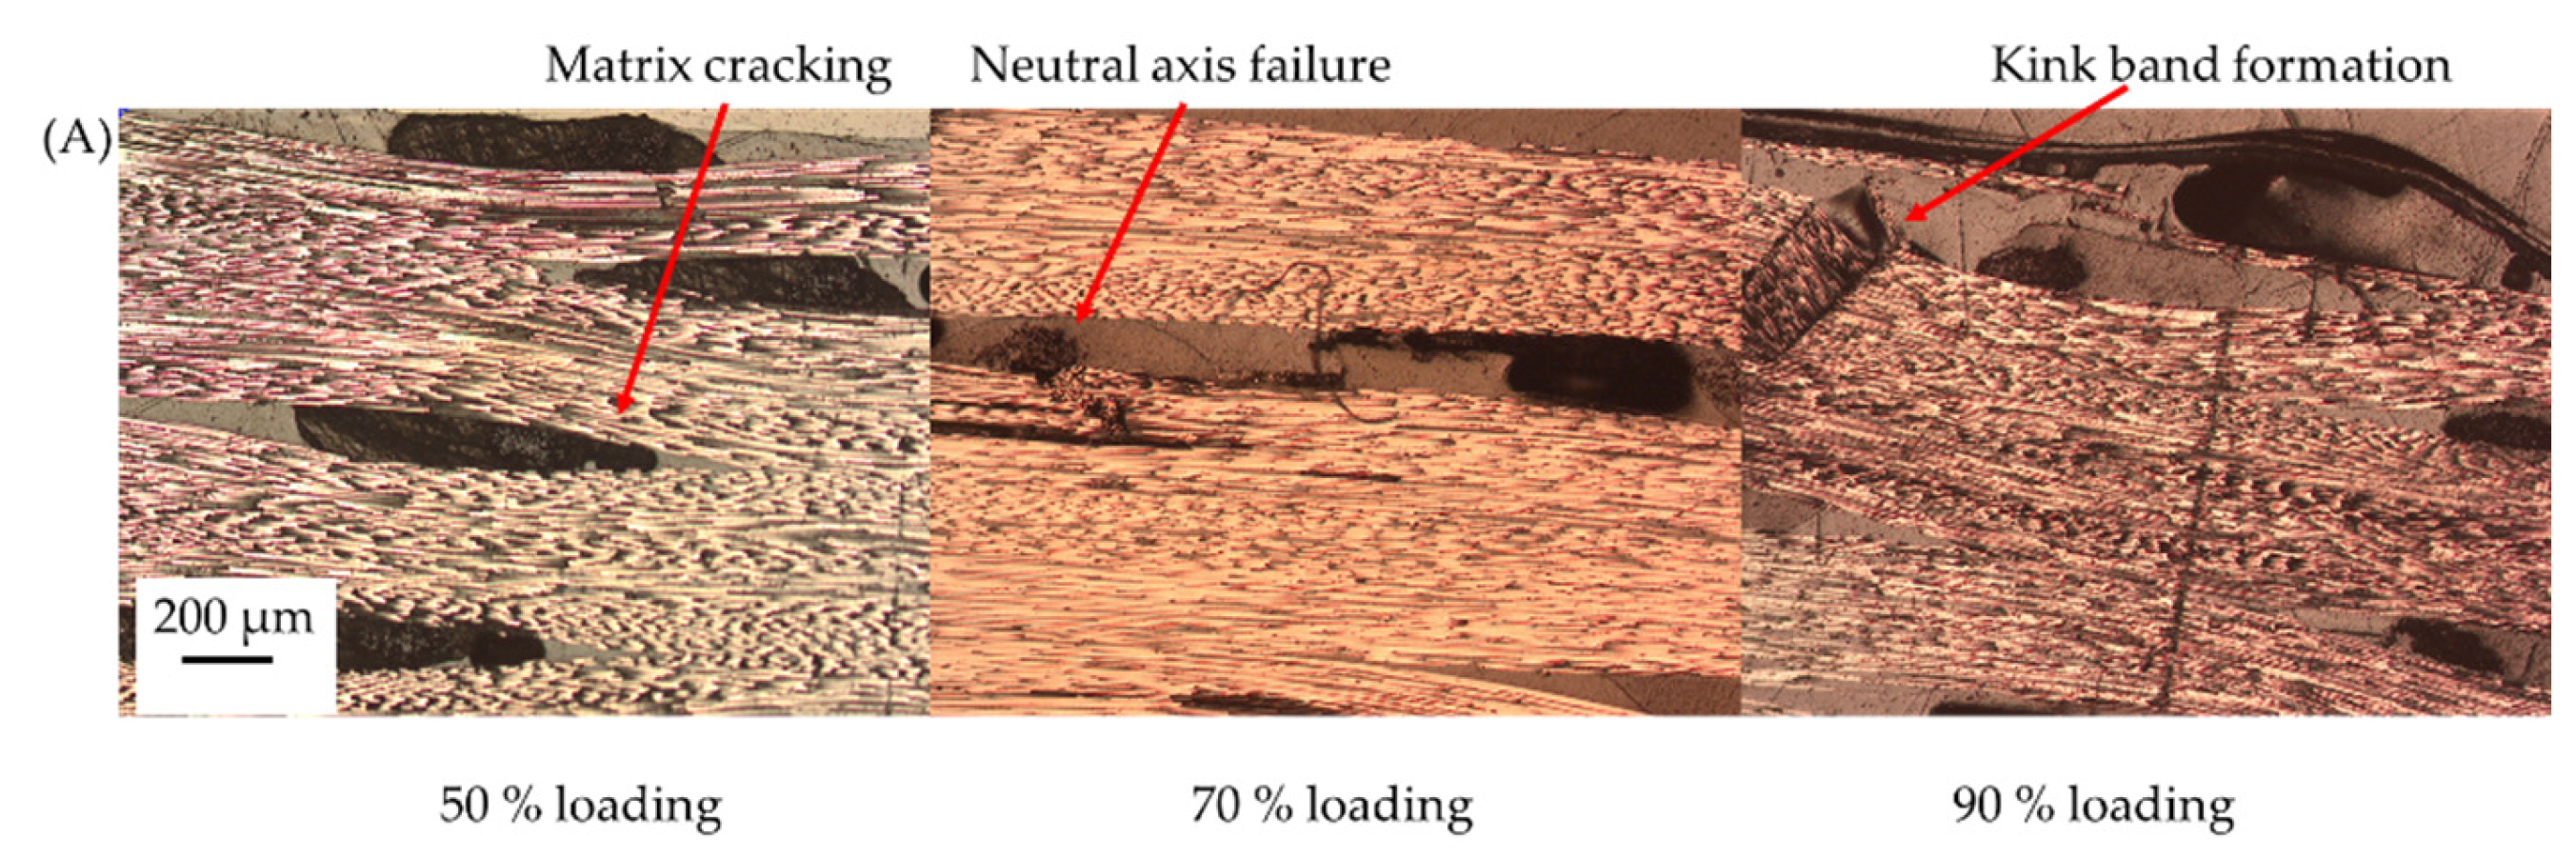
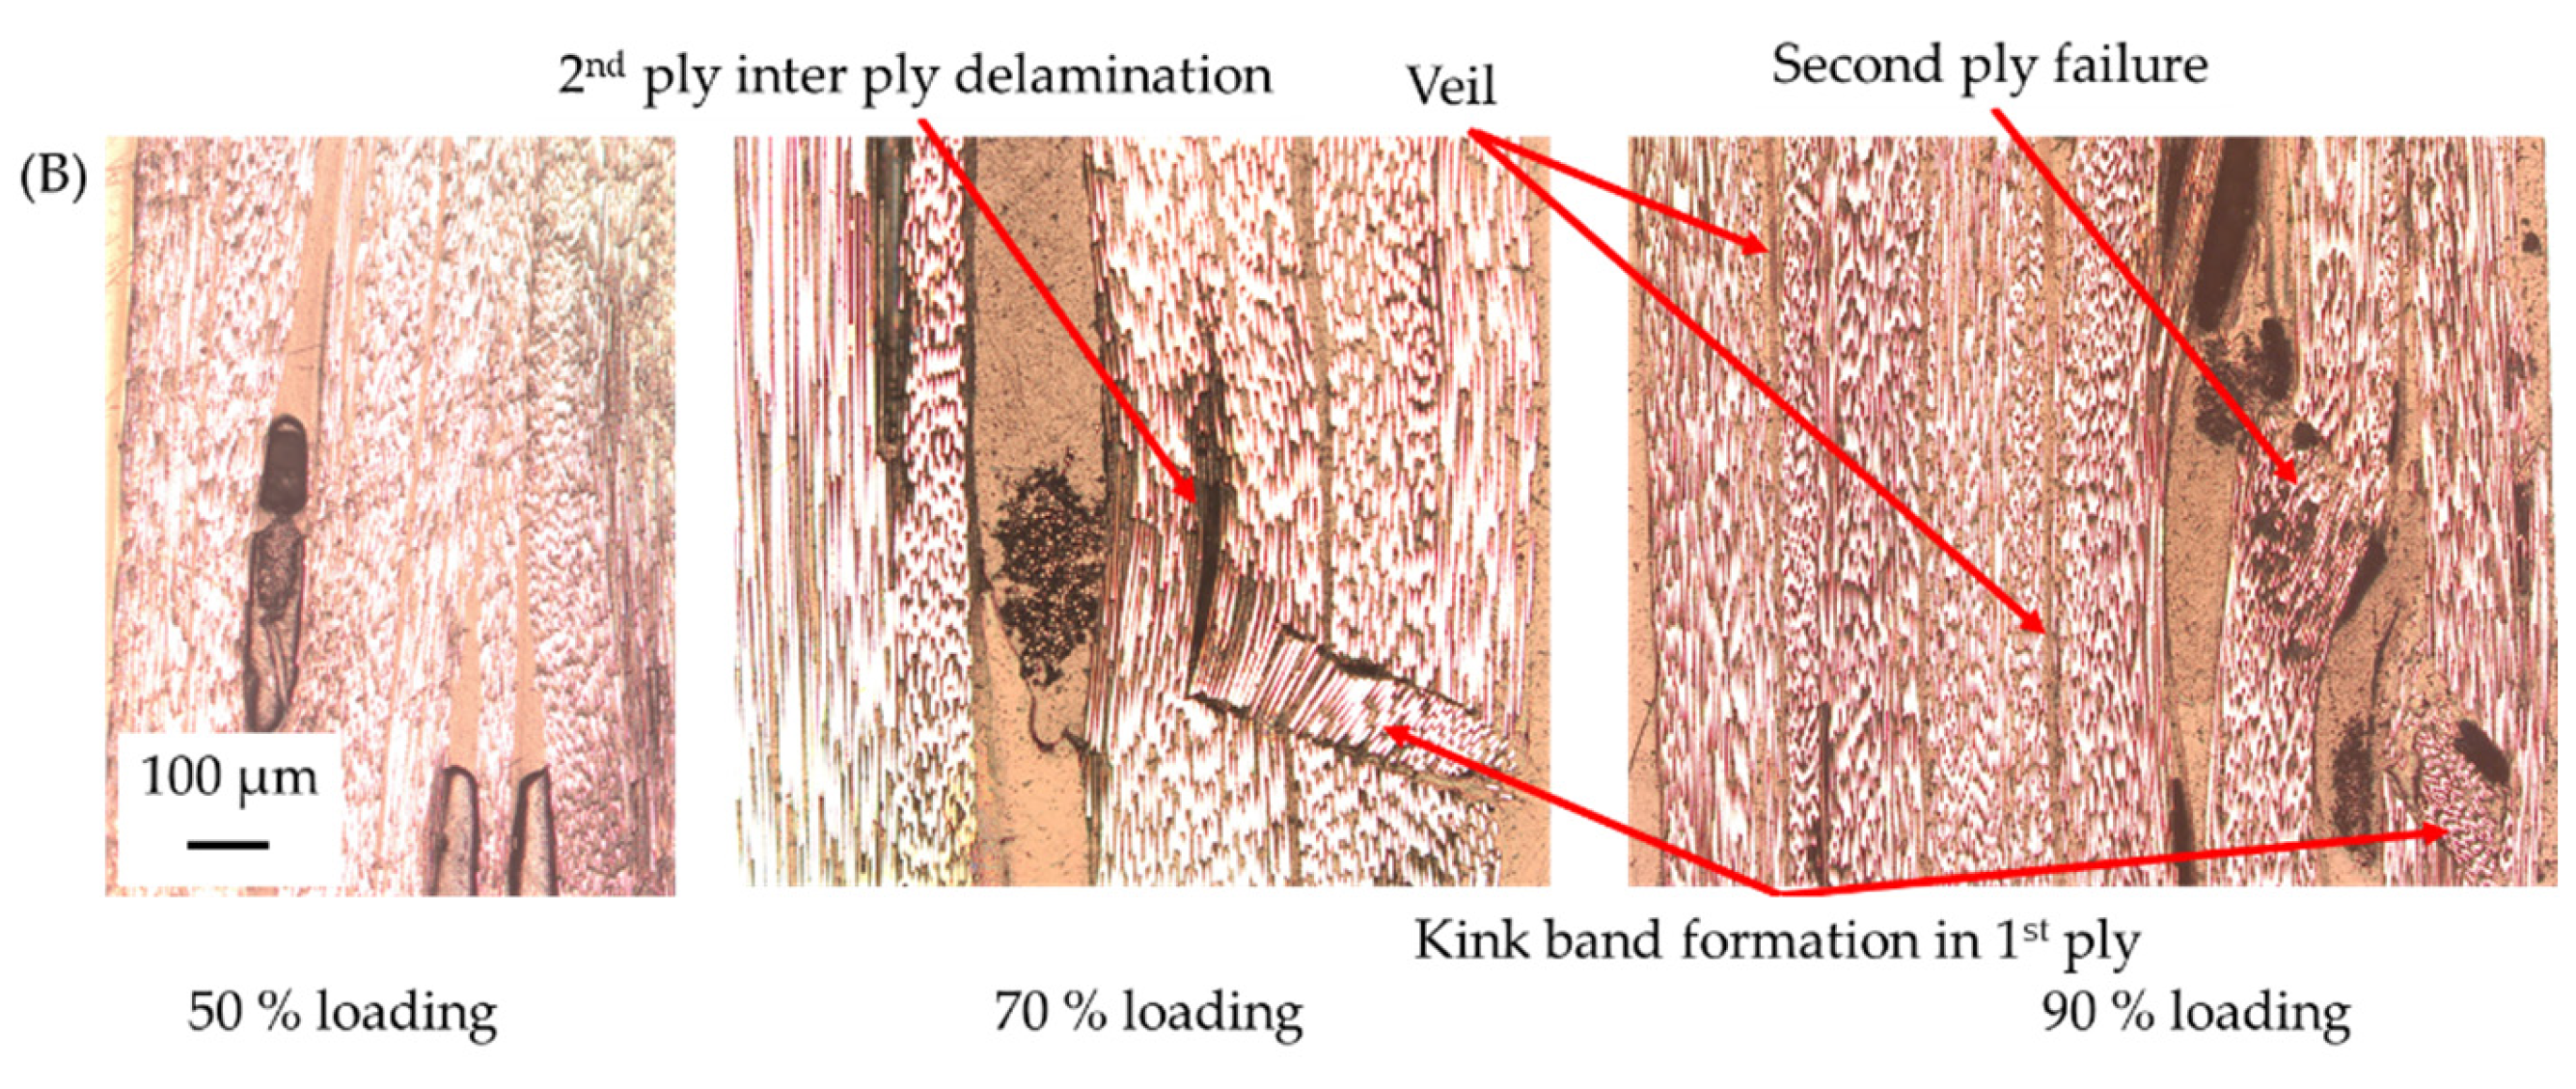
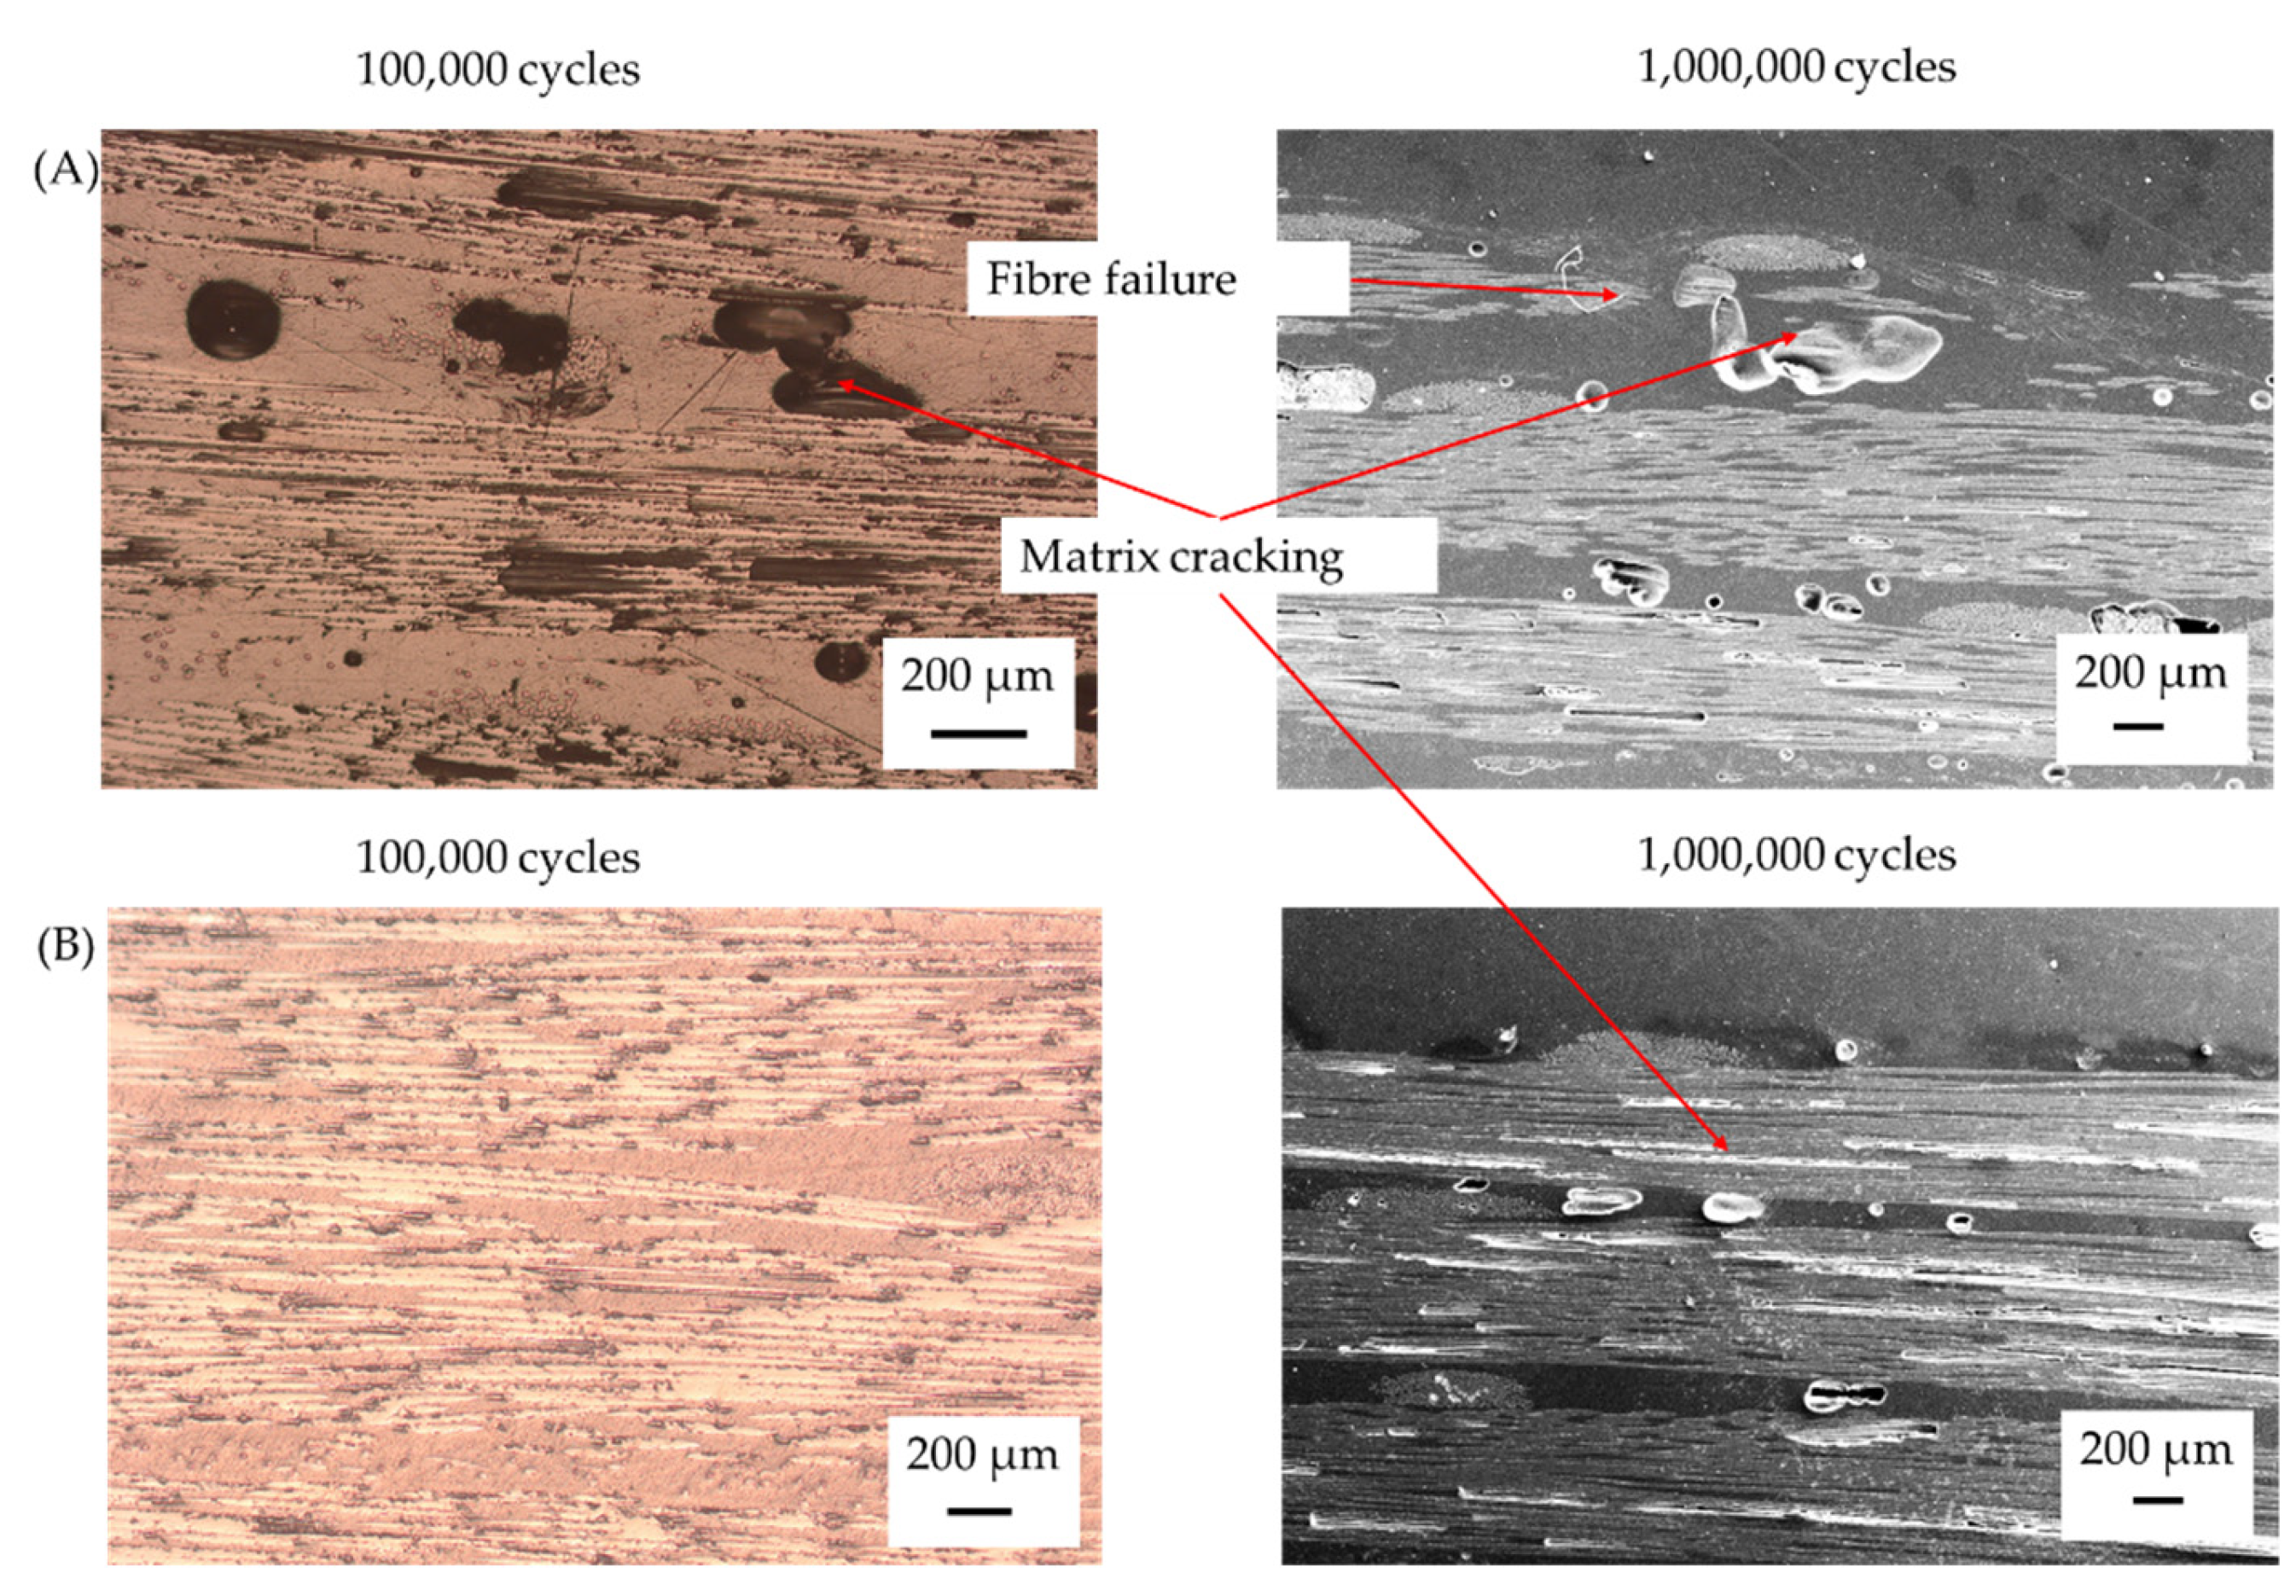
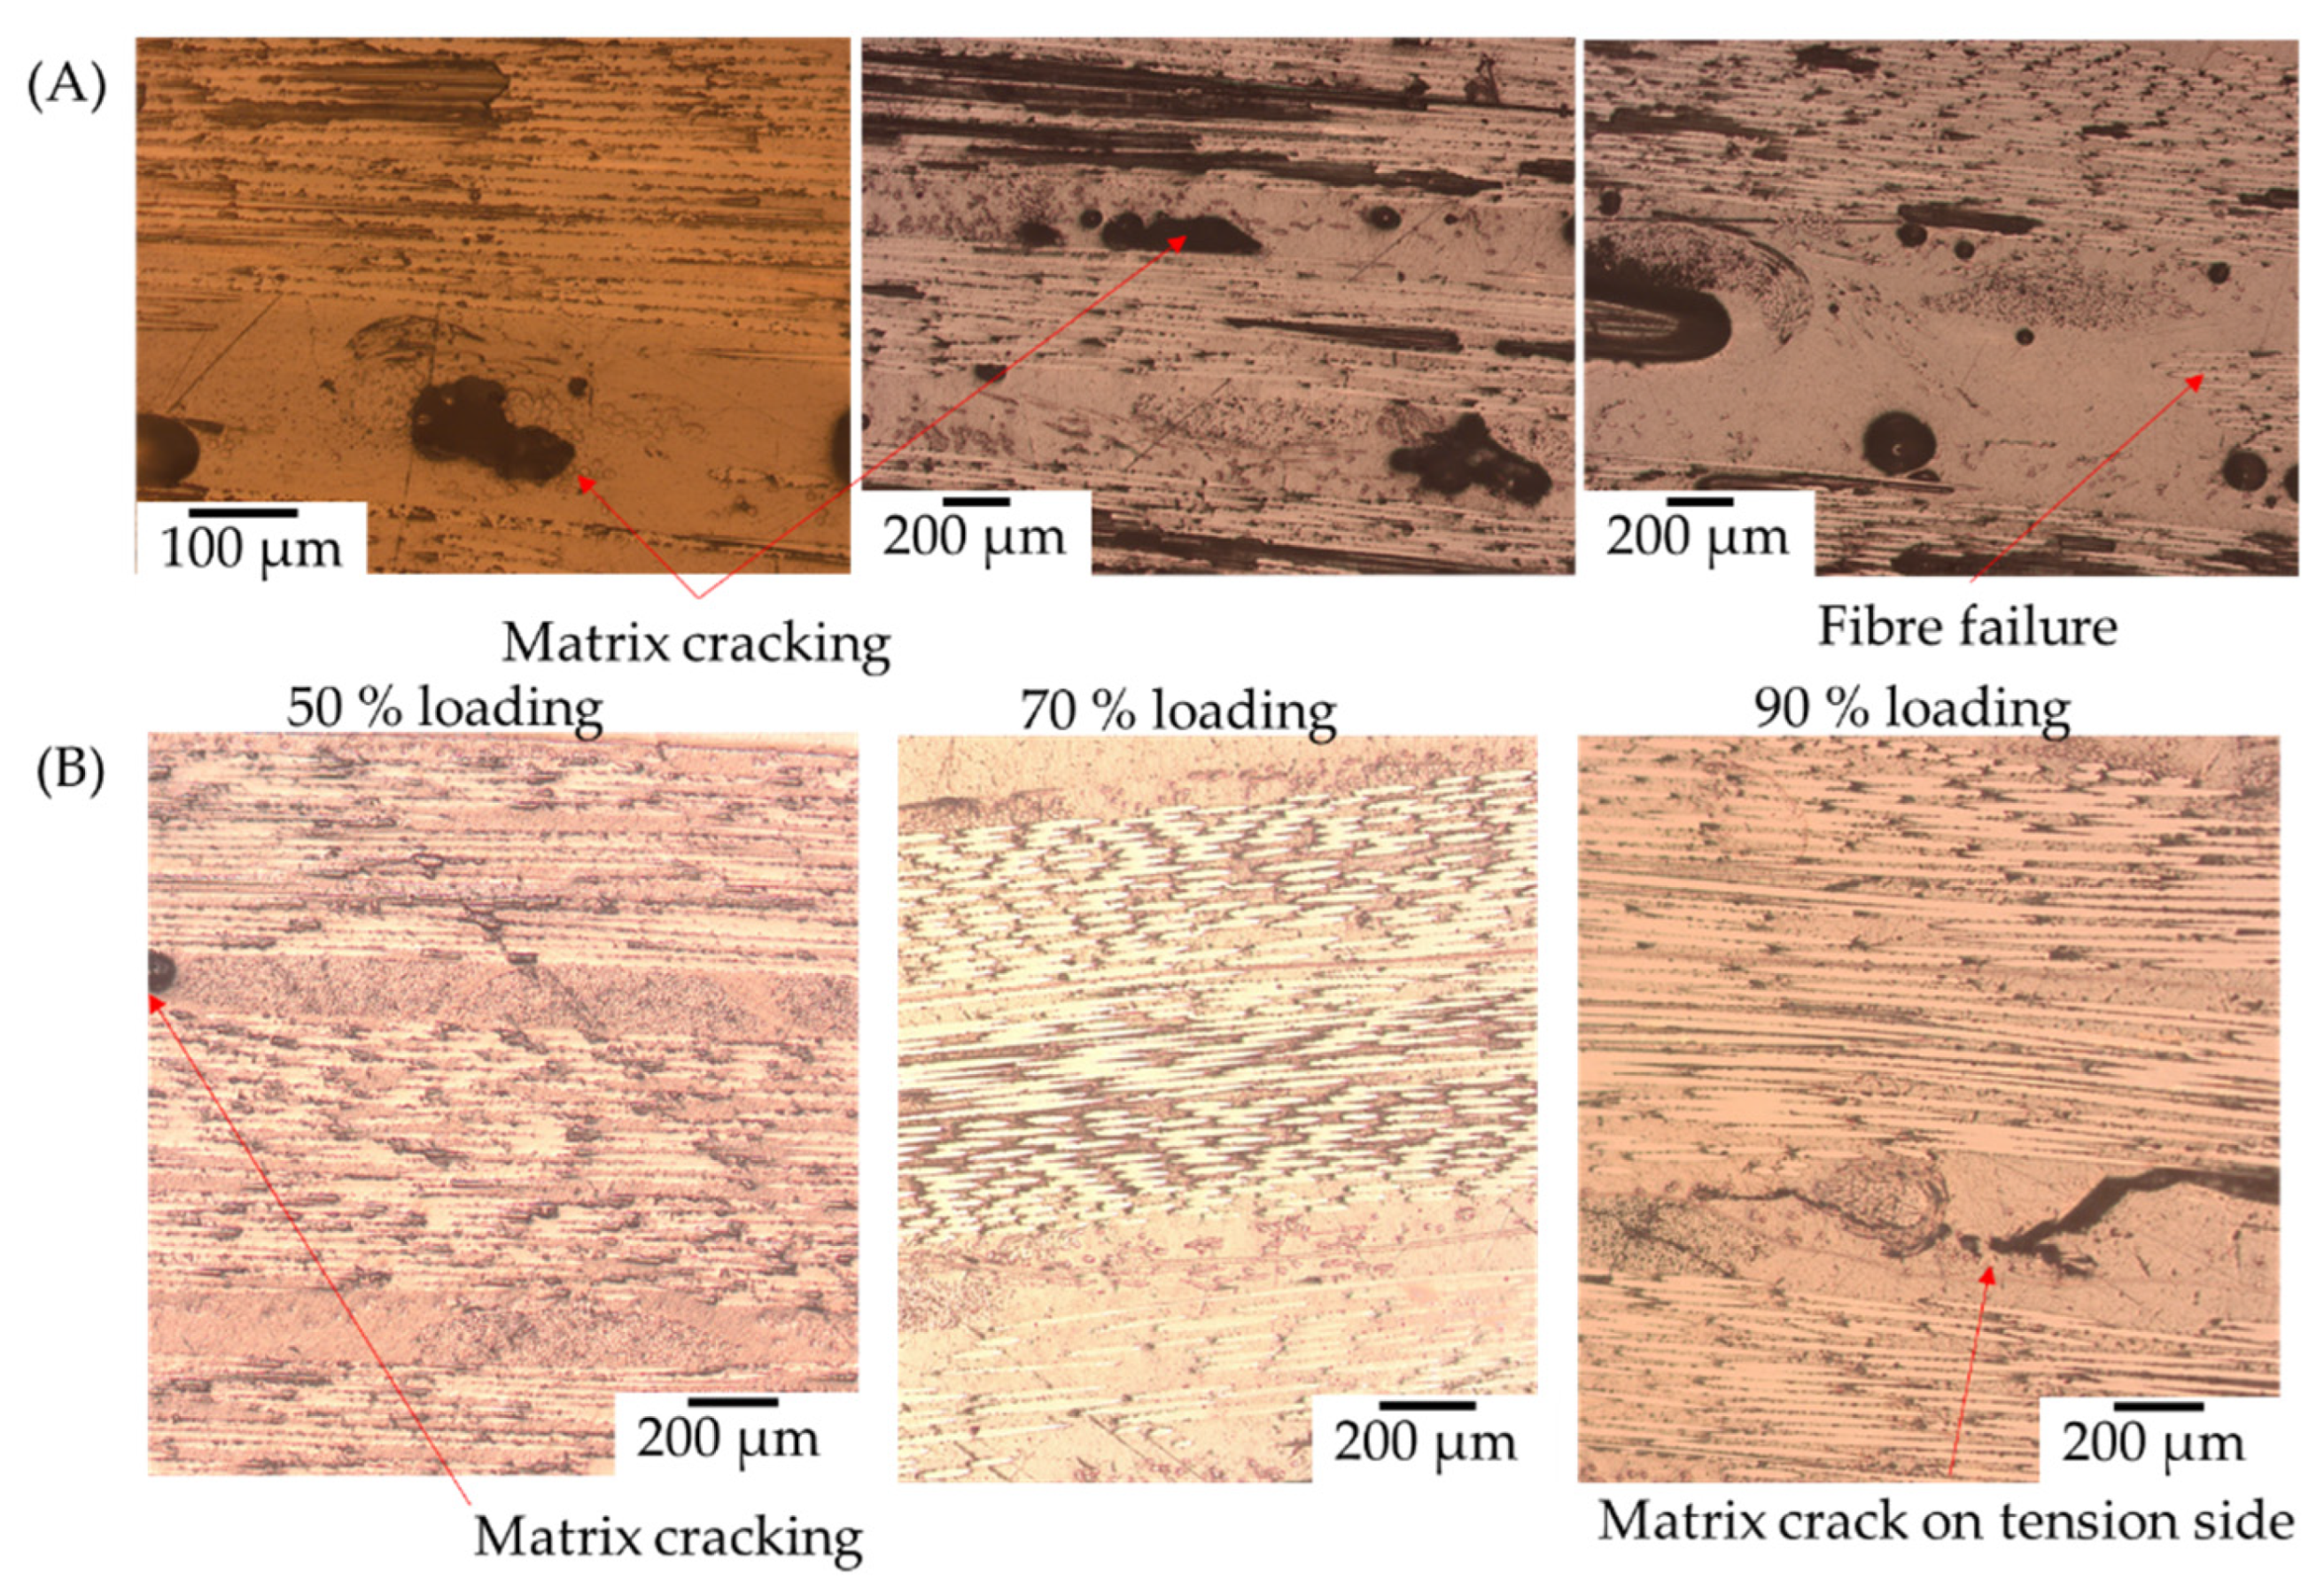
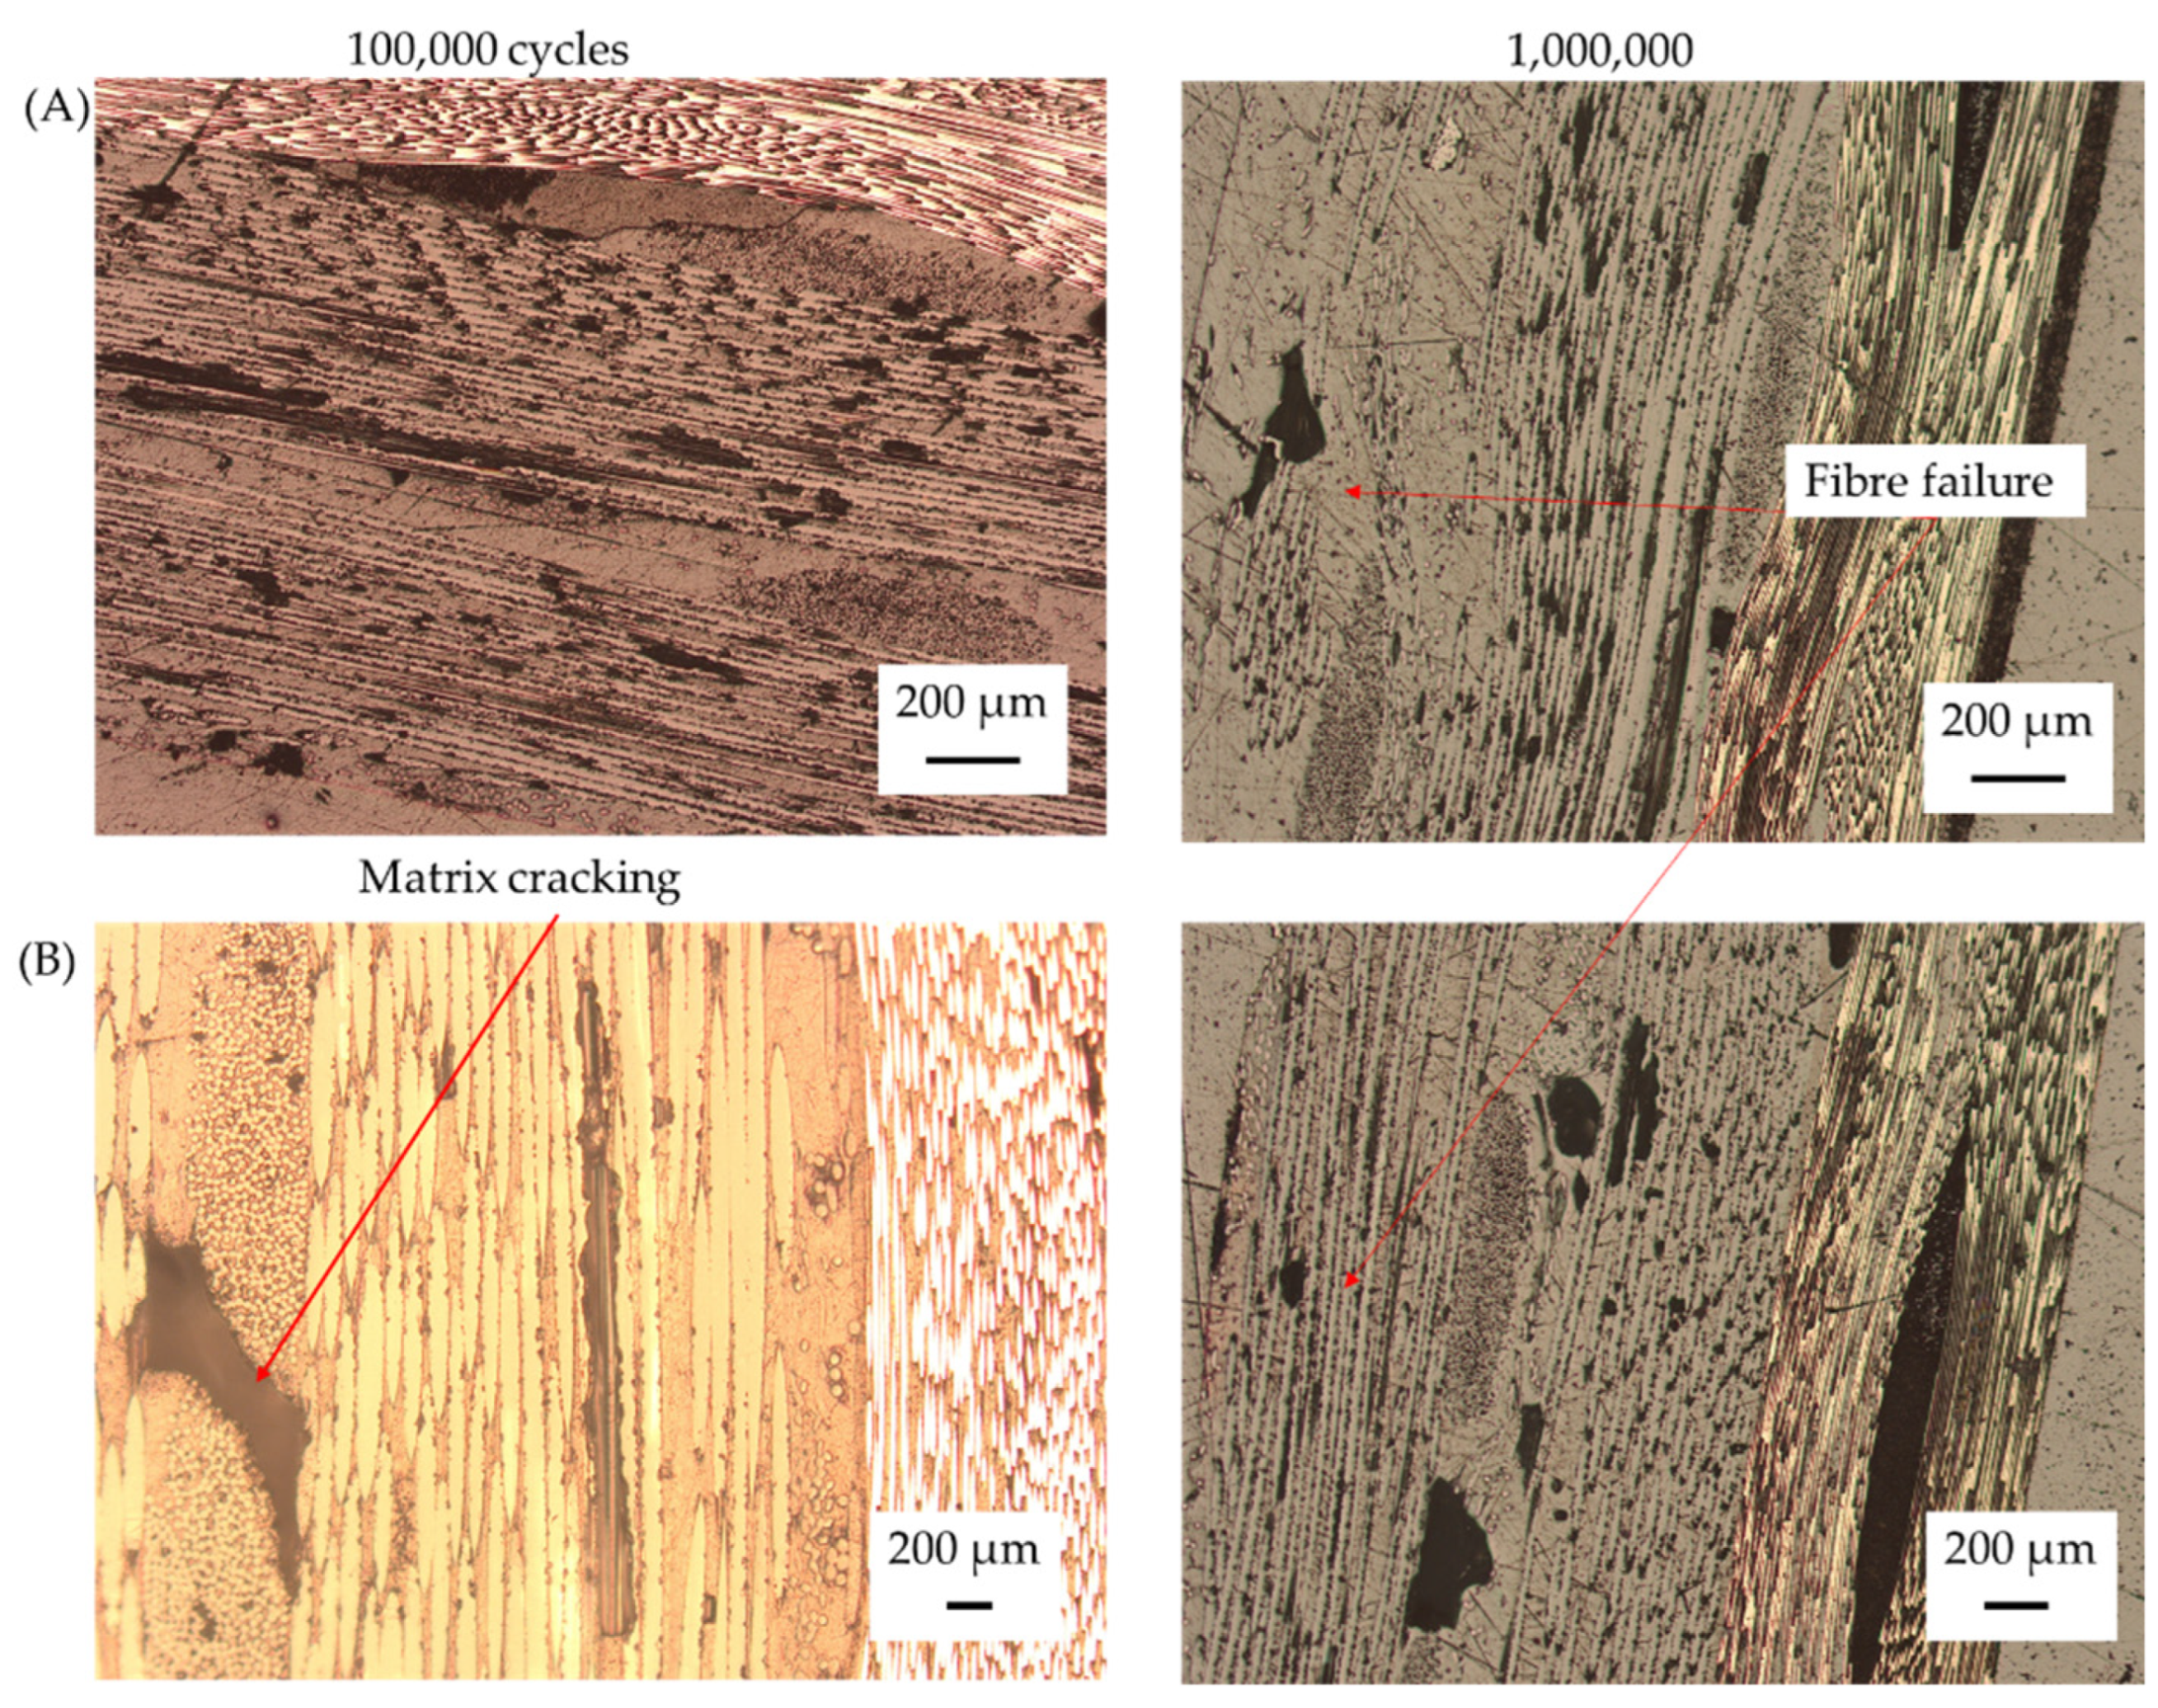
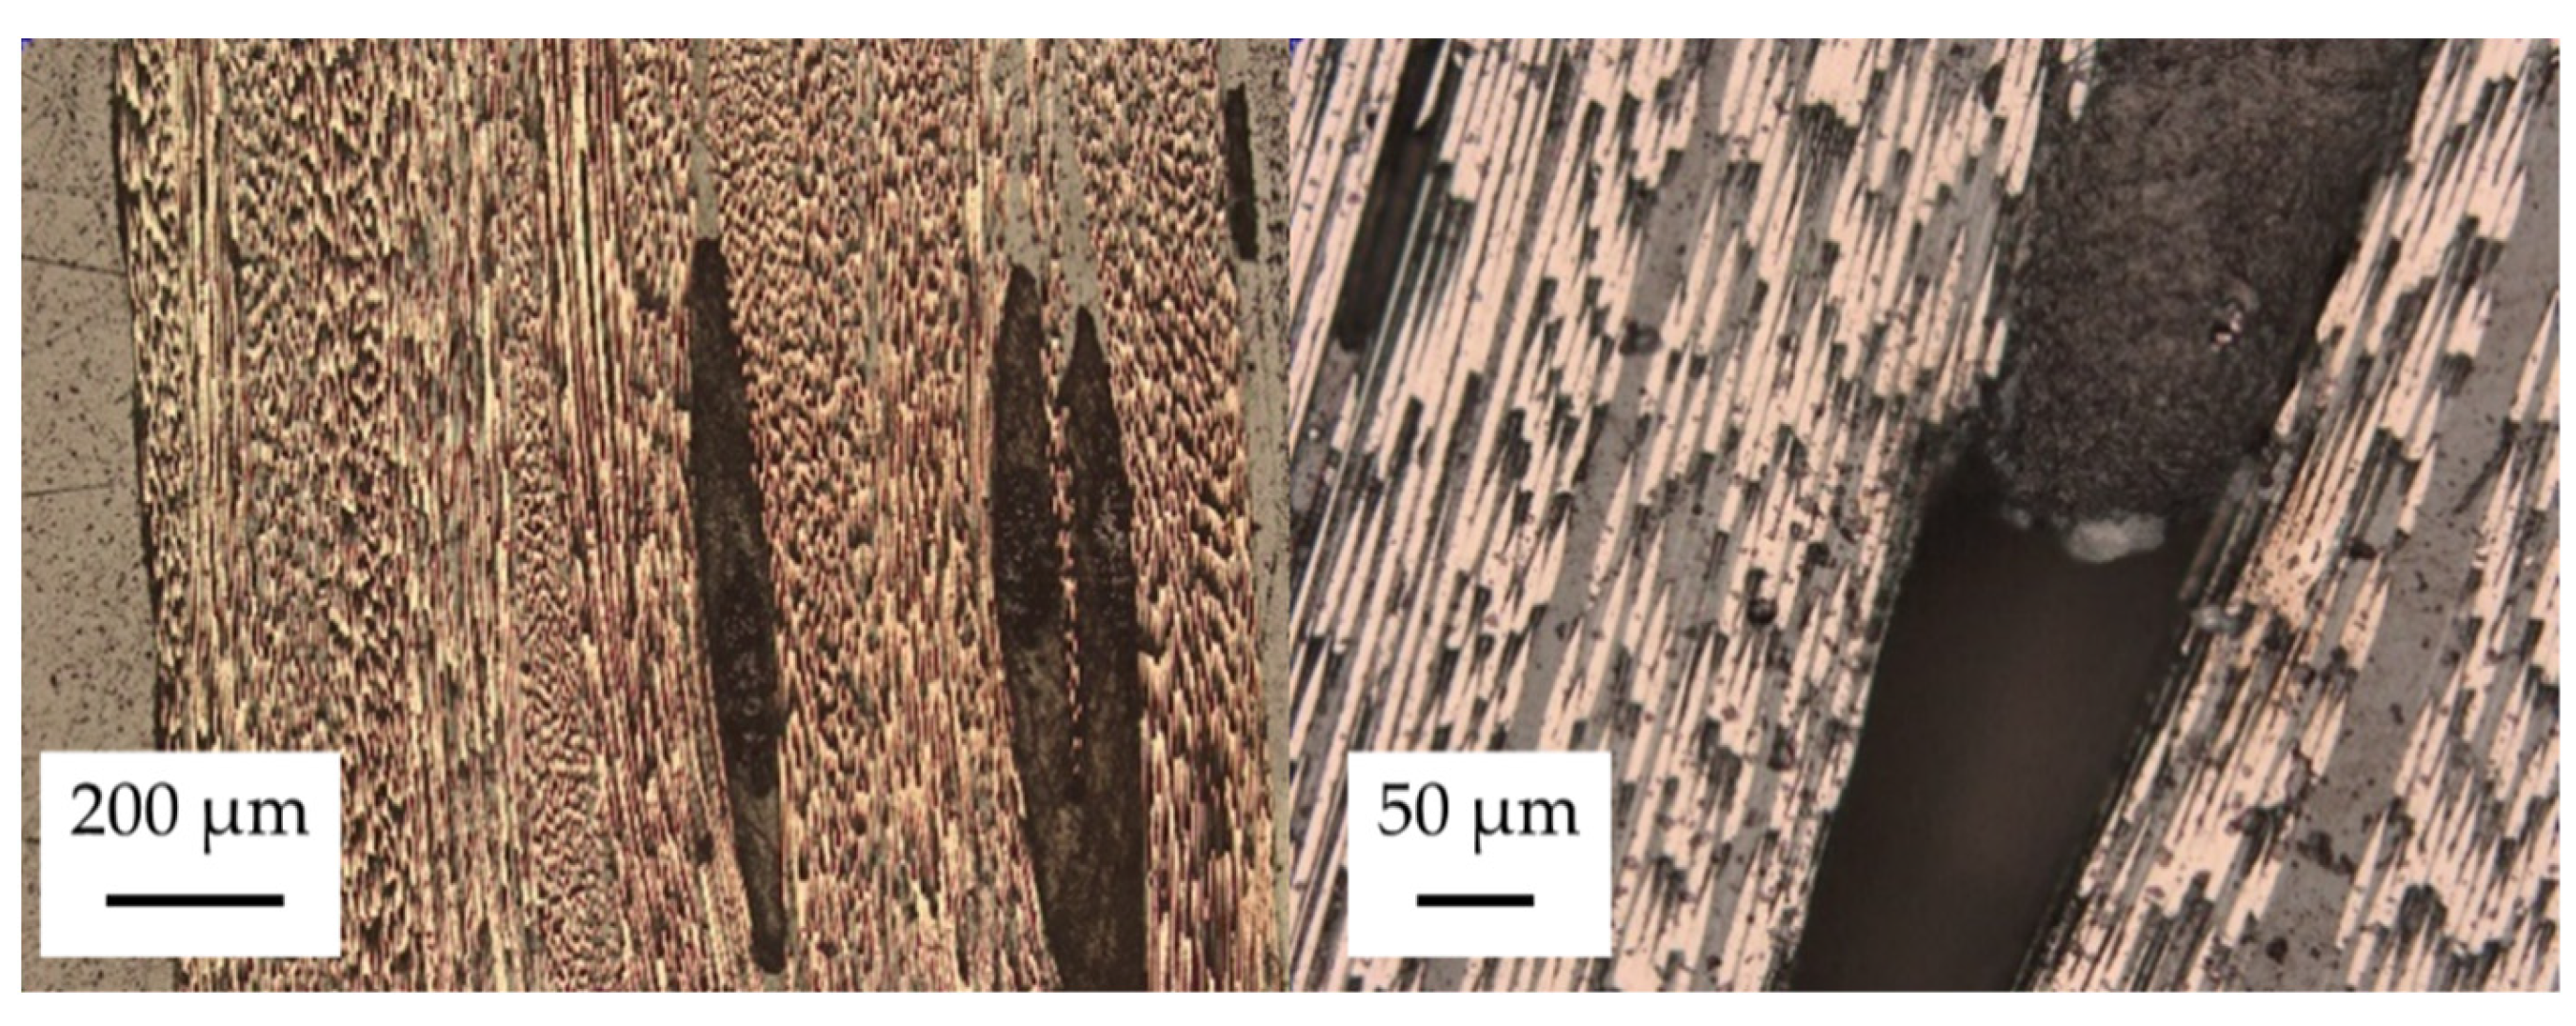
3.2. Fatigue Failure Mechanisms of Glass Fibre under Cyclic Loading

Compared with carbon fibre, glass fibre is shown to have 10–100 times less cycles to failure under fatigue loading [50]. It is expected that glass will show significant failure over 100,000 cycles for even 50% maximum loading. Glass has significantly less tension strength, and it is expected that minor tension cracking should be experienced, as was shown in the quasi-static testing. The glass fibre modulus loss after 1,000,000 and 100,000 cycles loaded at 50% maximum flexural strengths is shown in Figure 9.
For GF samples, after 43,000 cycles, there was observed fibre failure, with early matrix cracking at 300 cycles, resulting in a drop in modulus. GF and GFT showed moduli of 24.266 and 29.433 GPa, respectively, corresponding to 44.05 and 29.19% reductions in the moduli. Figure 10 shows optical imaging results: there was significantly less matrix cracking in the 100,000 GFT samples, resulting in the high stiffness retention. After 1 million cycles, the GF samples showed a 65.187% reduction in the modulus, a direct result of compressive failure, as shown in Figure 10.
After 100,000 cycles, several instances of matrix cracking were observed in Figure 10, the majority of which originated on the compression side of the samples for both GF and GFT. After 1 million cycles, the compression layer in the control sample was observed to have significant out-of-plane failure due to crushing.
With a loading of 70% of the maximum flexural strength, the GF showed a 50.12% decrease in modulus, compared with 0 cycles, with an average flexural modulus of 21.633 GPa. The veil toughened sample showed a 32.91% decrease with a modulus of 29.1 GPa. At higher cycles, the veil toughening showed a better modulus retention than untoughened samples. Neither GF nor GFT showed fibre failure; however, extensive delamination was present in the GF samples. The main cause of cracking was observed around cross-stitching, which can be seen failing in Figure 11B.
The optical evaluation of the glass fibre shows little difference between the 4000 and 100,000 cycle marks, in terms of failure mechanism. Most of the failure was delamination and matrix cracking occurring around the cross-stitching.
At 70% flexural strength, the hysteresis loop showed initiation of cracks within 3000 cycles. The difference between the number of cycles to initial cracking for the carbon and glass fibre was over 4000 cycles, and the CF and CFT samples had secondary cracking occurring after 20,000 cycles. The secondary drop is attributed to further the development of delamination, as observed in the GF loaded at 70% maximum flexural loading. The delamination lengths tended to occur on the tension side, due to ply matrix delamination, which caused the flexural strain to drop, compared with GF, where a fibre failure was observed in the tension and compression layers.
For the glass fibre samples, broken fibres appeared on the tension and compression layer resulting in large delamination lengths, the result is a drop in stiffness degradation after 4000 cycles. Fibre failure occurred as early as 2000 cycles, as the glass fibre failed due to catastrophic delamination. After 100,000 cycles the neutral axis for both GF and GFT remains undamaged.
Glass fibre showed the highest level of stiffness loss after 100 cycles. However, further stiffness loss beyond this point was recorded for both GF and GFT, which had over 2.5% strain and, according to quasi-static testing, should cause fibre failure in both samples. As shown in Figure 12, GF and GFT had significant reductions in the moduli after 50 cycles, indicating that fibre breakage occurred almost immediately with 90% loading.
The GF sample had a residual modulus of 15.30 GPa, compared to the GFT modulus of 14.166 GPa, with the delamination of the fabrics and fibre failure occurring in both samples. At higher cyclic amplitude, the veil toughening samples showed an increased number of cycles to failure, compared to their untoughened counterparts. However, at higher amplitude there was no difference in stiffness degradation as shown in Figure 13.
The results in Figure 14 indicate that matrix failure in GFT does not occur until higher stress amplitudes than GF. With 70% GFT showing less failure progression with the increase stress amplitude, compared with GF, with Figure 14B showing little matrix cracking with samples at 50 or 70%. For all fibre types, 90% of the maximum flexural strength results in fibre failure in 100,000 cycle testing. The GFT samples had a mix of catastrophic failure and partial failure; only at 90% does matrix cracking start to occur, which leads to the higher modulus, shown in Figure 14.
On the tension side of the sample, fibre failure was observed in optical microscopy at 90% maximum flexural loading. Tension failure also occurred at 70% maximum flexural loading. The point at which this tension loading occurred is theorised to be at the 3000-cycle mark, due to breakage in the strain gauge, leading to delaminating the strain gauge from the tension side.
From Figure 14, there are clear indicators that the drop in strain in the control samples is compression fibre failure caused by matrix cracking. The initial stiffness of the material is significantly lower in GFT samples, compared with GF, with the percentage difference in overall stiffness loss less than in toughened samples, with a comparison to 50% loading between GF and GFT, showing there is significant matrix cracking without the additional nanofibre matrix reinforcement. At 90% flexural loading for 100,000 cycles, veil toughening was found to reduce catastrophic delamination, resulting in fibre failure, where crack propagation follows the veil, rather than crossing layers.
Overall tension side failure is common with the glass fibre—when hybridised with carbon fibre, this becomes a dominate fibre failure. The next section will evaluate hybrid glass and carbon fibre for stiffness degradation.

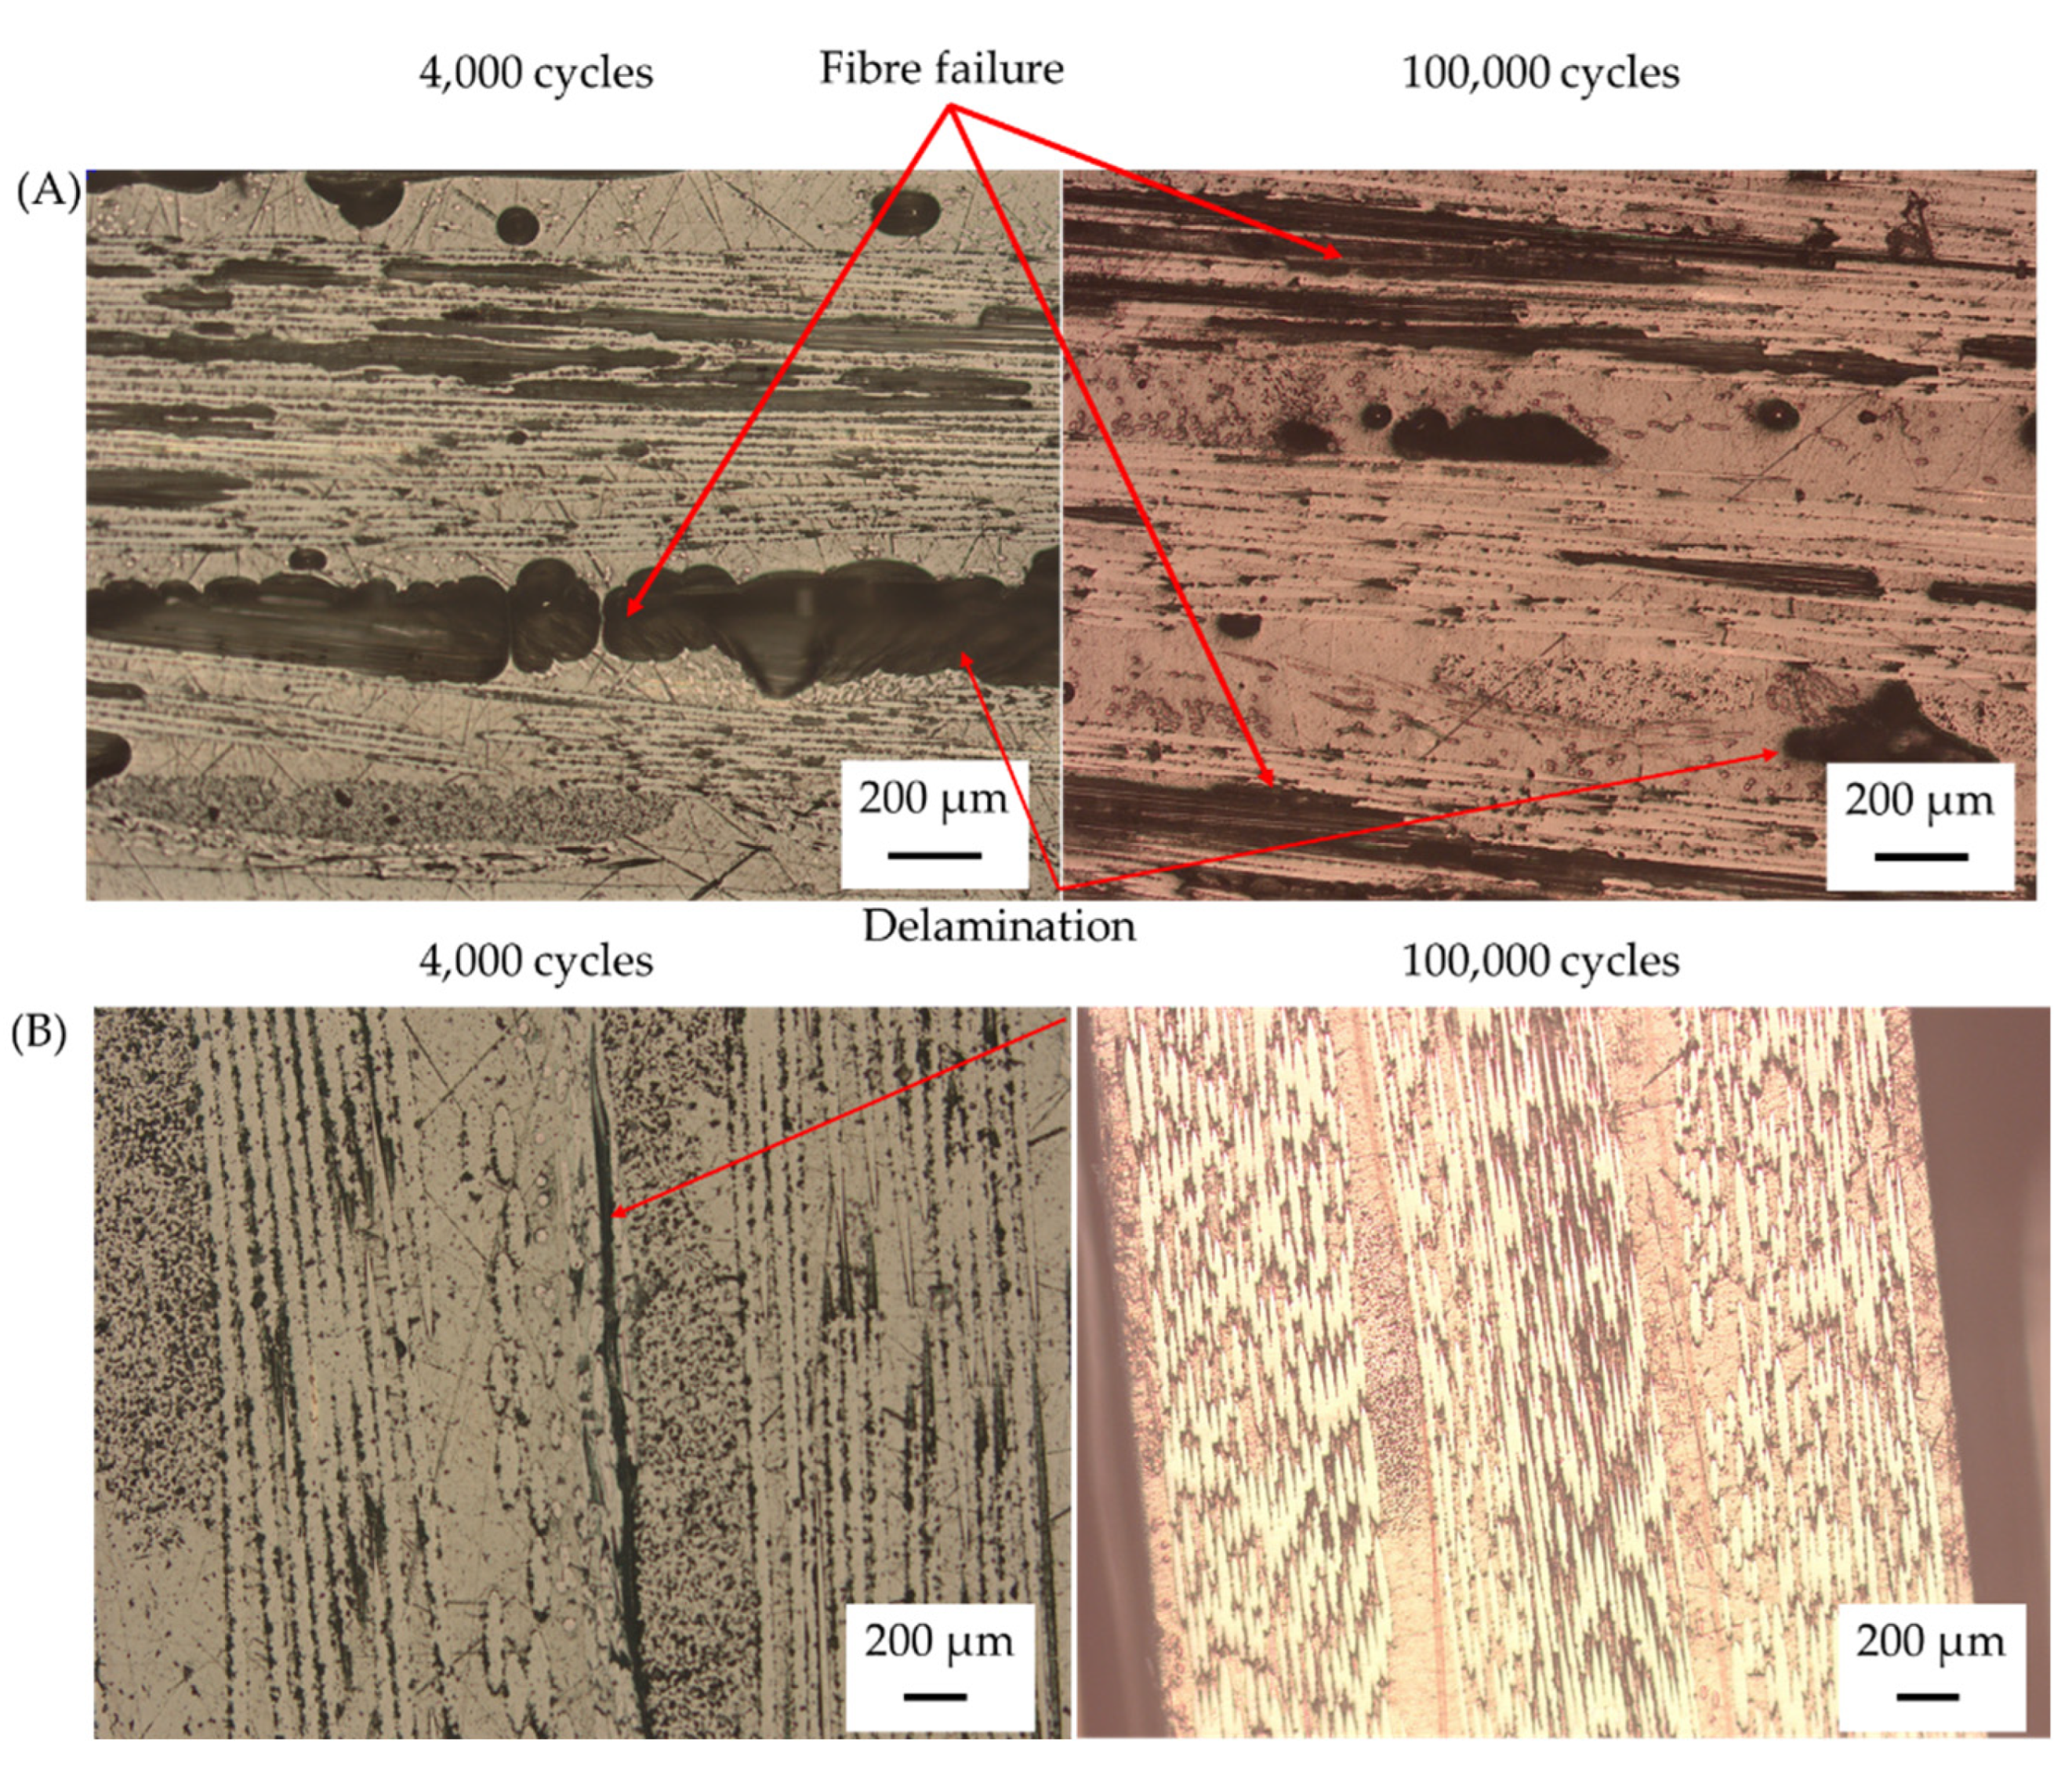
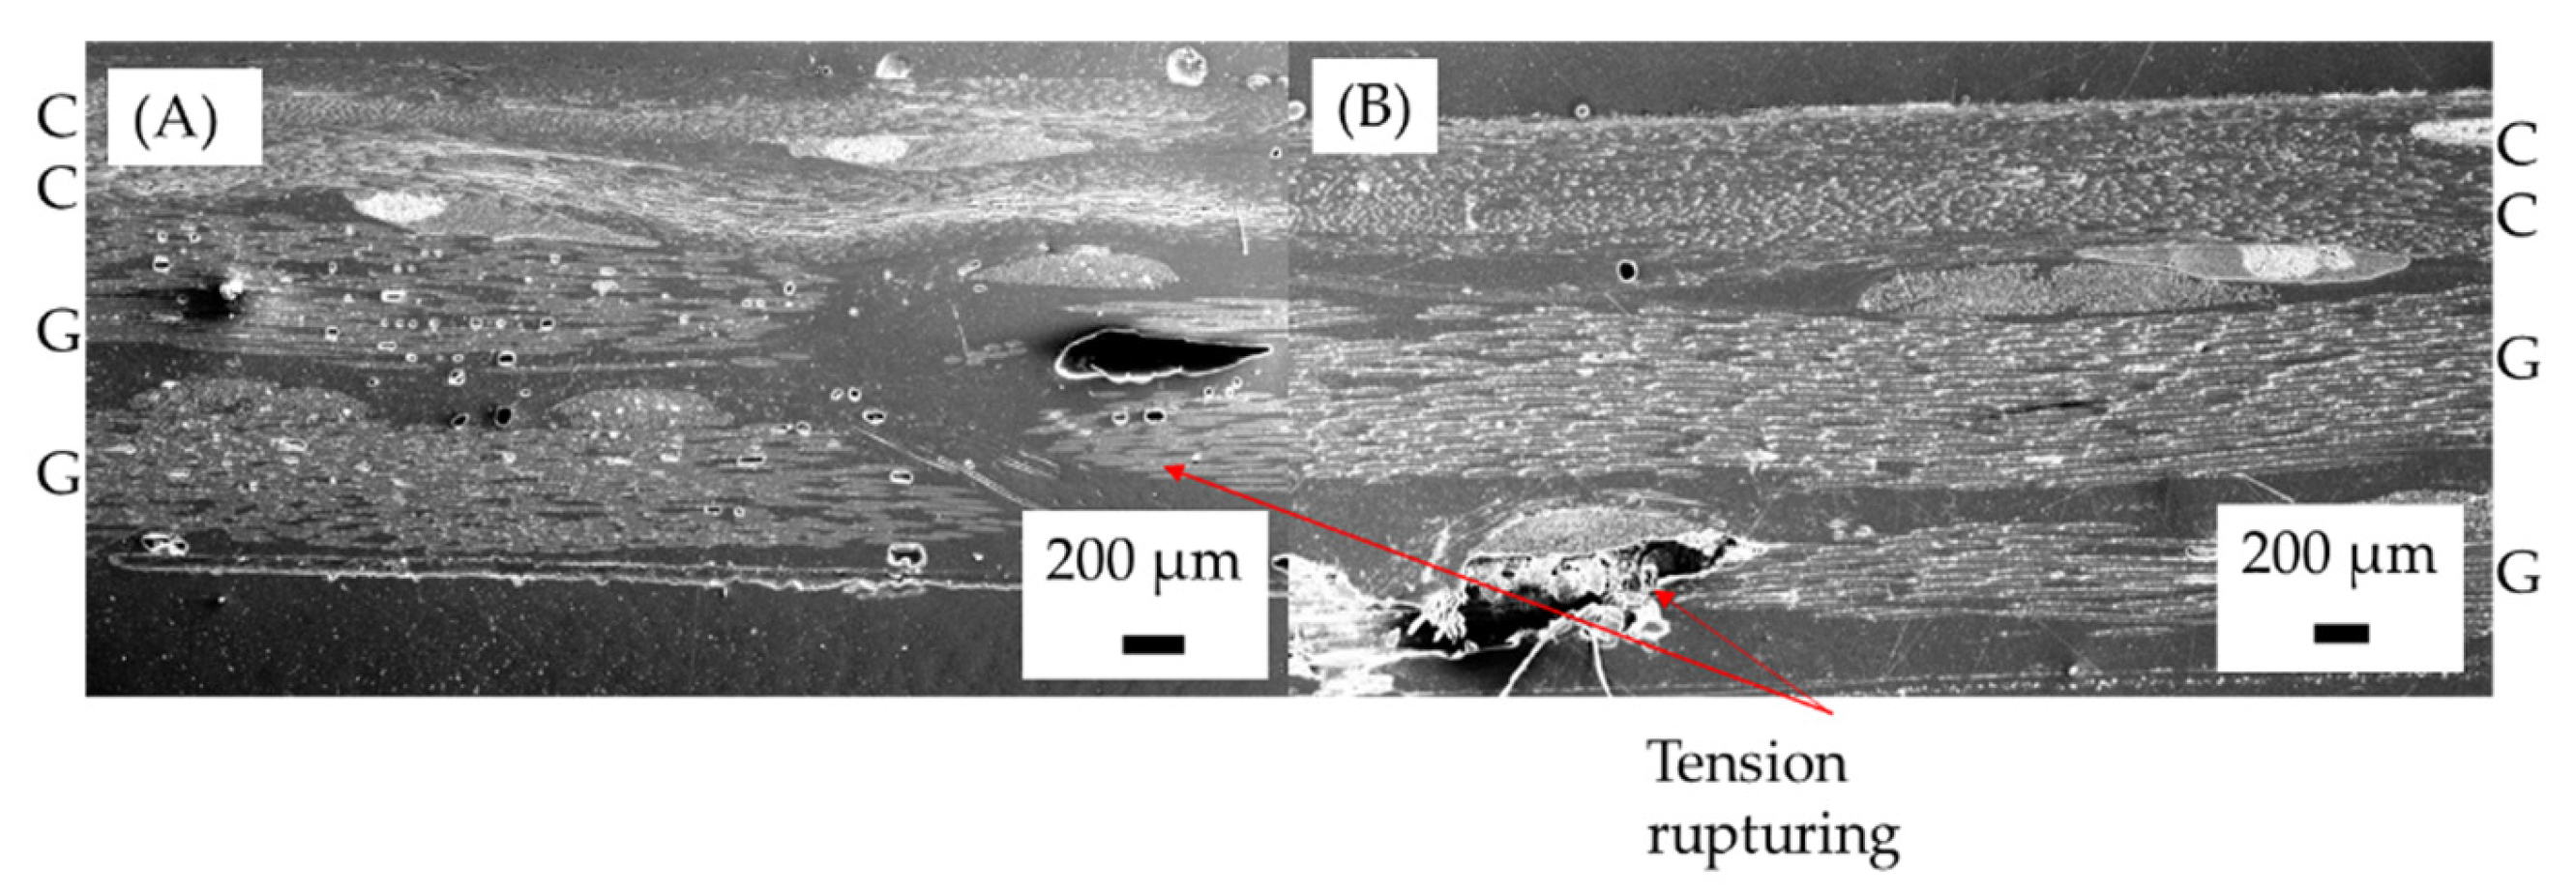
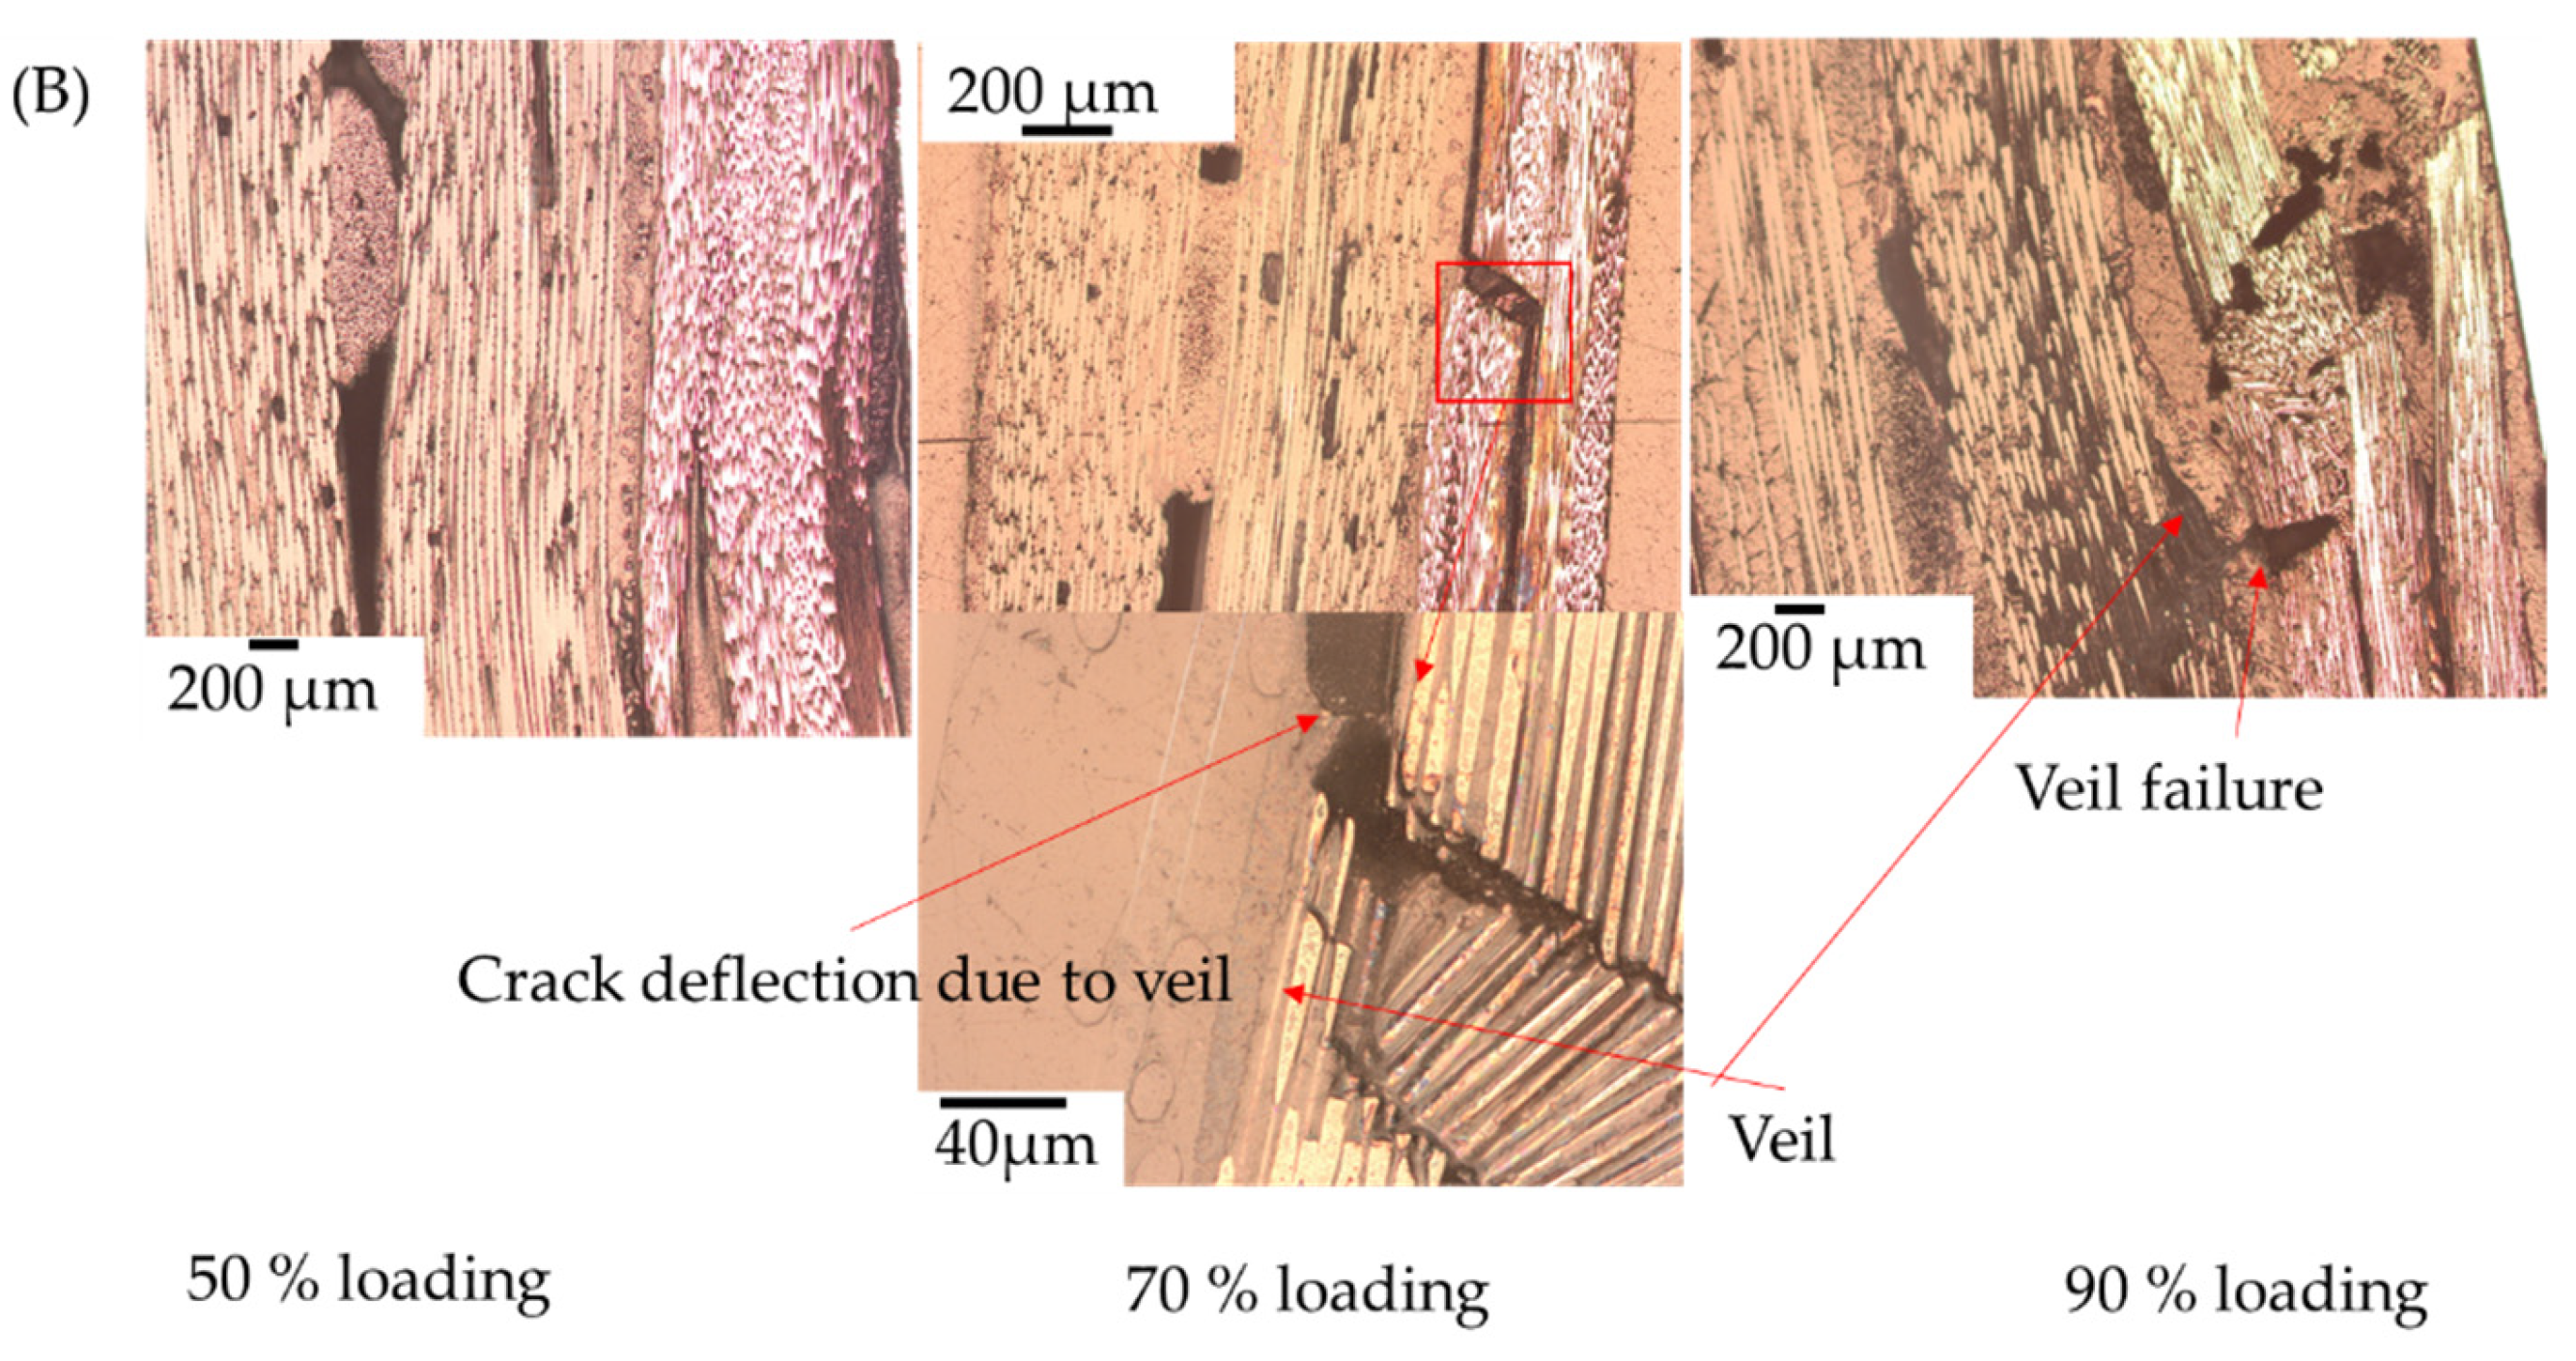
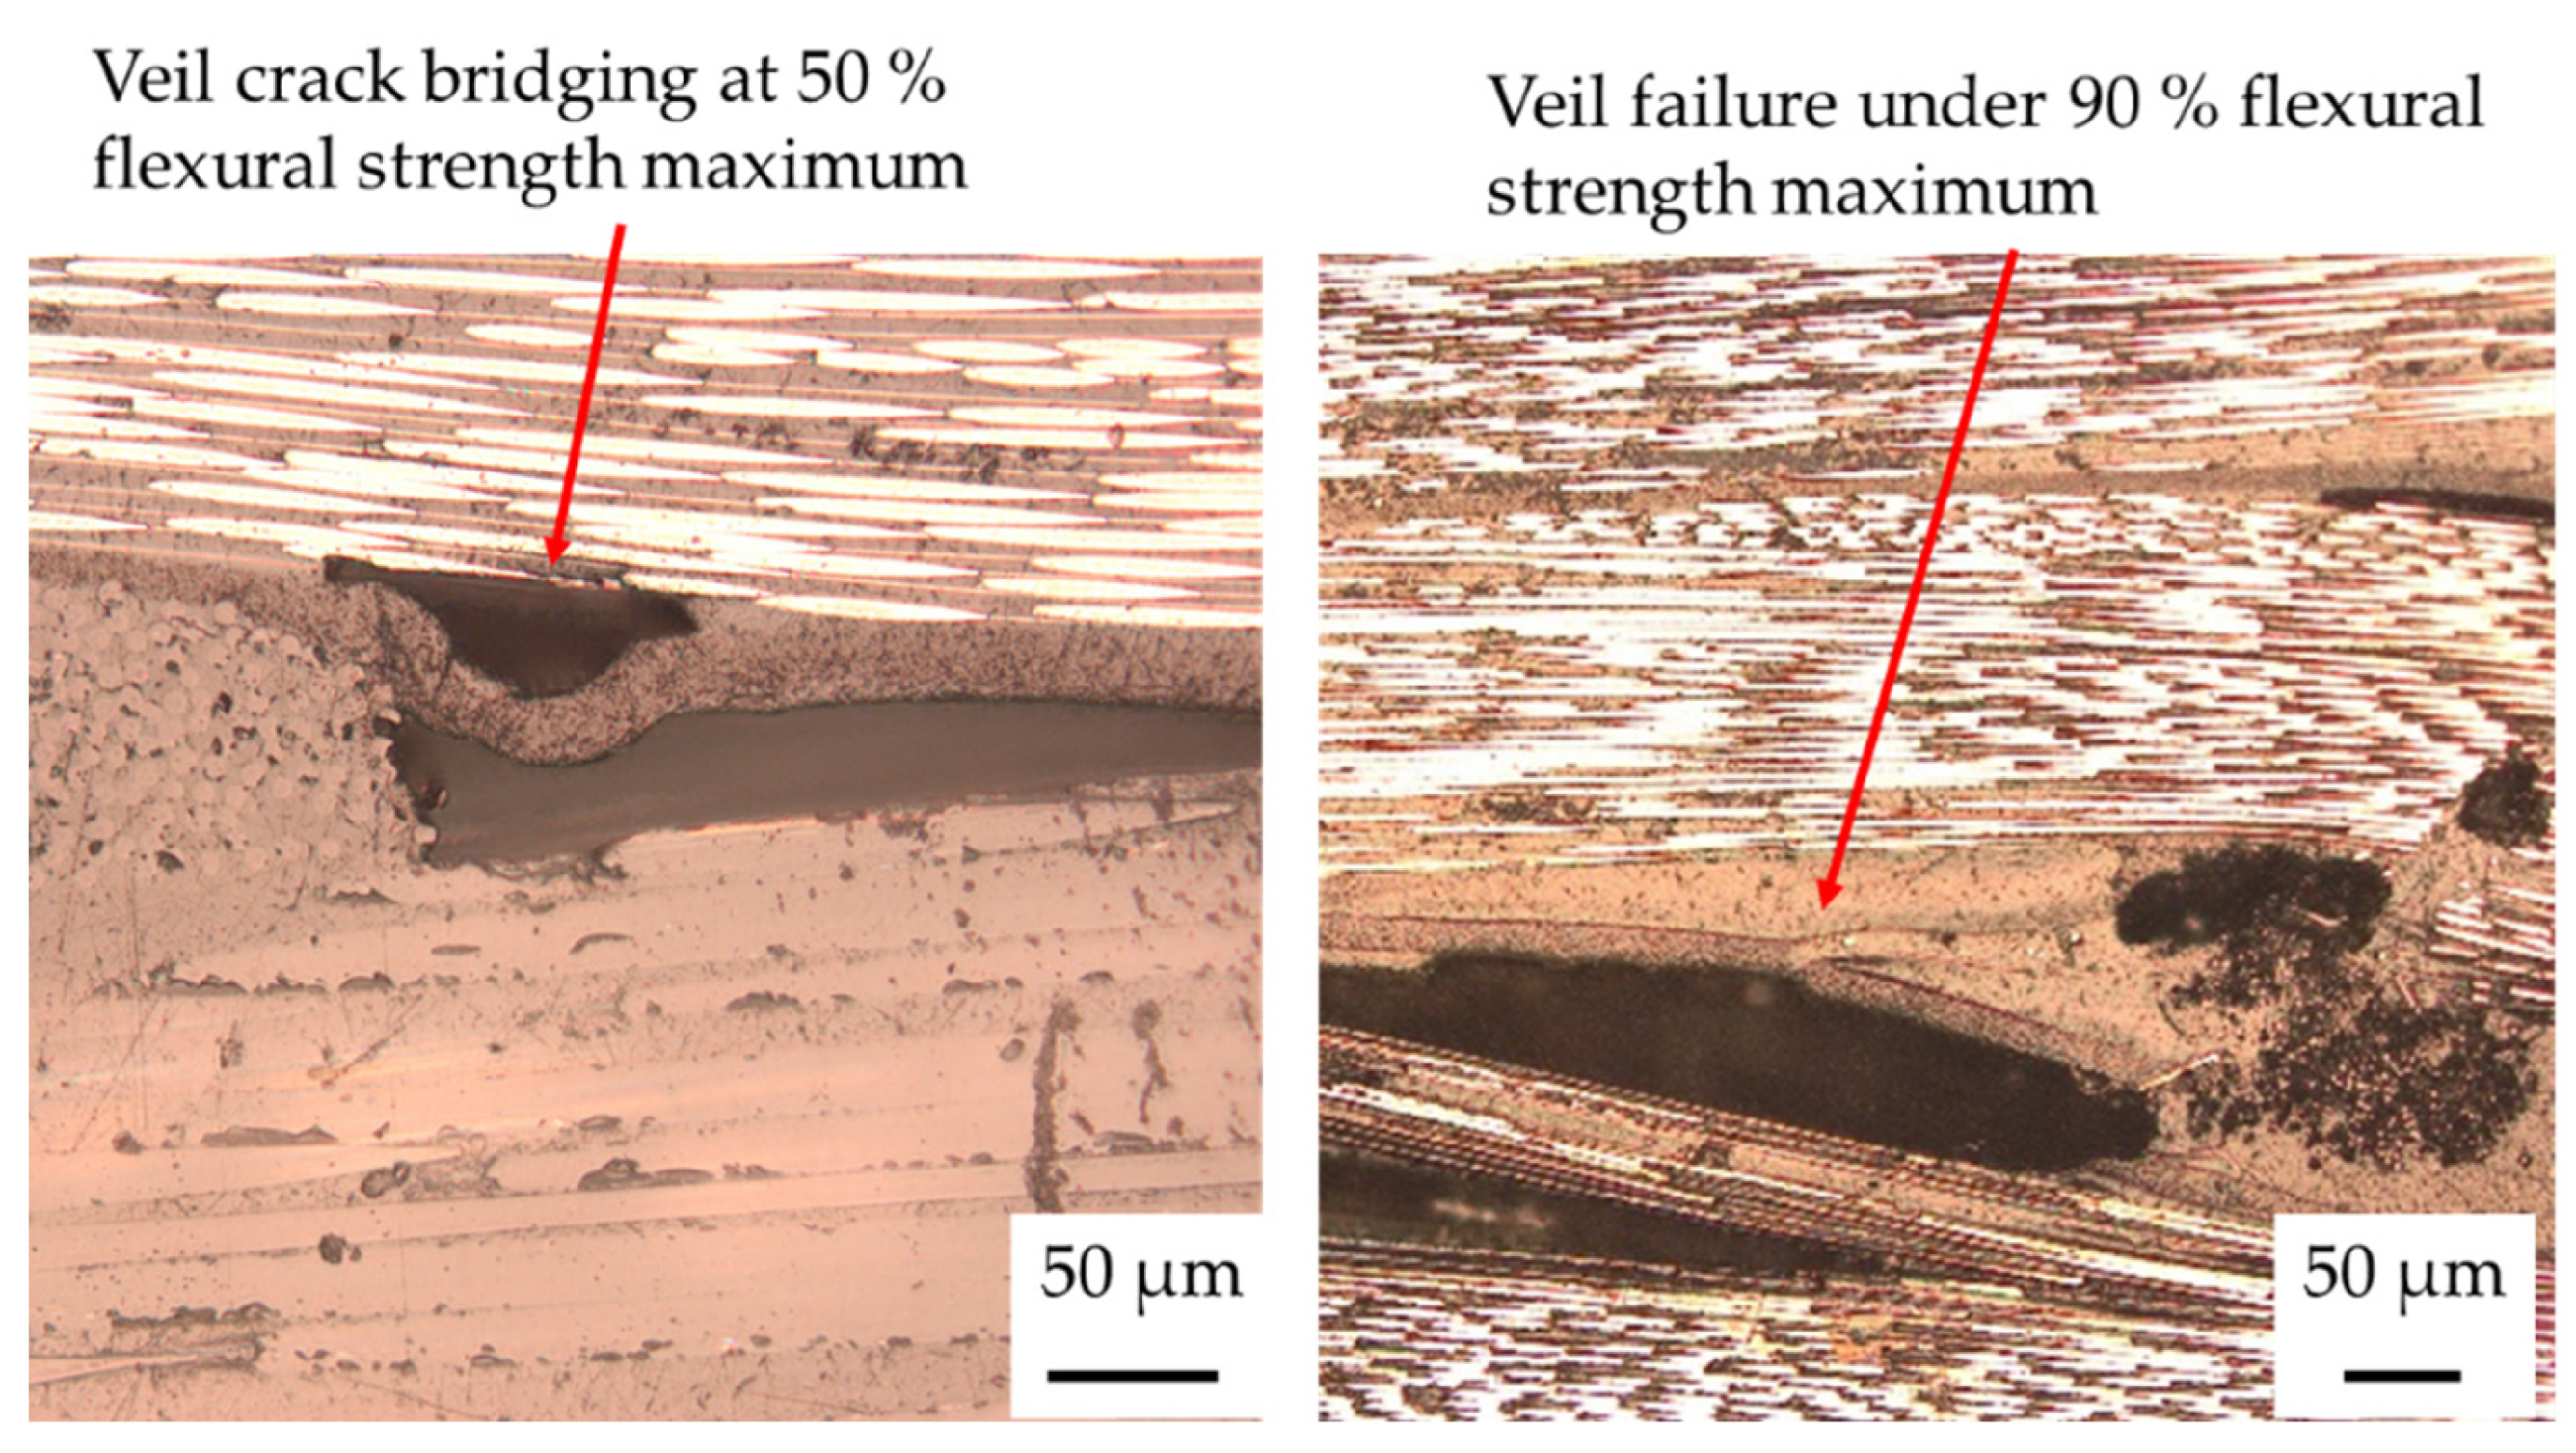
3.3. Fatigue Failure Mechanisms of Hybrid Glass and Carbon Fibre under Cyclic Loading

This section will investigate the delamination and fibre failure of hybrid glass and carbon fabric in a 1:1 glass to carbon fibre ply ratio and 3:1 fibre volume fraction of glass to carbon fibre ratio.
As per the previous sections, 100,000 and 1,000,000 cycles at 50% of the maximum loading were used to investigate the matrix cracking between the glass and carbon plies. Cyclic loading, in comparison to static testing, resulted in carbon fibre undergoing compression failure under buckling, as well as kink band failure with veil toughening. The lower cycle loading promoted carbon glass interfacial cracking, which was used to determine the effect of the veil on the interface.
The difference between HF and HFT samples after 100,000 cycles was the degree of glass fibre tensile failure, as shown in Figure 15.
The stiffness degradation after 100,000 cycles for HF was 37.07 ± 6.85 GPa, a 12.56% reduction, compared with quasi-static testing. The stiffness degradation of the hybrid toughened sample was higher at 41.53%; however, both data sets had a similar average modulus, with HFT having an average of 31.57 ± 2.71 GPa. After 1 million cycles, HF catastrophically failed, whereas HFT maintained a 25.8 GPa modulus.
The decrease in strain after glass fibre failure was substantiated in the optical imaging of the hybrid fabric, as is shown in Figure 16. The GF and GFT samples, after 40,000 cycles, had significant matrix cracking and fibre failure, which also occurred in the HF samples. However, this occurred much earlier in the cyclic loading than it did previous glass fibre samples, most likely due to the tension side of the glass fibre in the hybrid failing, rather than the carbon fibre, with its higher tensile strength. Both HF and HFT showed an increase in modulus at around 400,000 to 600,000 cycles. The increase in modulus was a tensile rupturing of the glass fibre. The change in stress concentration to the carbon fibre layers under compression and tension resulted in a lower strain, as the higher modulus material was under the loading.
From the optical imaging of the hybrid fabric, the clear occurrence of delamination between glass and carbon fibre was the initial cause of stiffness reduction. The delamination caused the stress concentration to be unevenly distributed between the carbon and glass fibres. The HFT samples had less delamination between the glass and carbon fibre layers than the HF samples did. After 1,000,000 cycles, the tension rupturing of the HF sample showed a breakthrough in the second glass layer on the neutral axis, in comparison to HFT, where the glass fibre breakage resulted in minor fabric breaking. These results are consistent with the stress-strain curves, where there is less stiffness loss.
With hybridisation of the glass and carbon fibre, it was expected that the delamination occurring between carbon and glass fibre layers would lead to catastrophic failure. Delamination was the mechanism causing catastrophic failure in static testing. Dynamic testing, on the other hand, had shown that the tension side of the glass fibre tended to break before carbon under compression at 50 and 70% maximum loading. A lower number of cycles in Figure 17, show that at 70% maximum loading the highest modulus loss is by 4000 cycles.
HF showed a modulus of 36.1 ± 1.25 GPa after 4000 cycles and 26.95 ± 3.65 GPa after 100,000 cycles. HFT recorded a modulus of 38.4 GPa at 4000 cycles and modulus of 33.083 ± 1.16 GPa at 40,000 cycles. The machine stopped for each HF sample, due to reaching the displacement limit, indicating fibre failure. In toughened samples, the delamination at 480 N was shown to prevent the loss of stiffness, compared to the control HF, which lost maximum stiffness after 100 cycles. However, microscopy showed that the stiffness increased after initial glass fibre failure and was observable as matrix cracking, resulting in a drop in the modulus. After 400 cycles, the GF and GFT experienced fibre cracking in the GF layers, as shown in Figure 18A,B.
For HF, there was extensive glass fibre failure, with inter-ply carbon failure on the bottom layer. The carbon fibre layer in HFT, however, was shown to fail by kink banding with extensive delamination between the carbon–carbon and carbon–glass layers. Figure 19 shows an important failure mechanism with the veil, where the veil maintains structure without breaking during matrix cracking, thus reducing the area of failure. After 100,000 cycles, kink banding occurred in the second carbon fibre layer due to inter-ply delamination from the first carbon fibre layer failure. After 100,000 cycles, the glass fibre began to fail, leading to further reduction in flexural modulus as fibre cracking occurred and resulting in the carbon fibre layer ply cracking. The ply cracking was not observed in HFT, which maintained the higher modulus after 100,000 cycles.
Both glass and carbon fibre in hybridisation experienced tension rupturing and compression failure of the carbon. However, HFT was expected to not have failed, due to the stiffness retention. It is, therefore, theorised that the breaking of carbon occurs in such a way that a modulus of 23.20 GPa is still achievable, which would suggest a pseudo-ductile effect, whereby the fragmentation of carbon under compression is fragmented in such a way that it still maintains structural strength. The HFT samples-maintained loading to 100,000 cycles, compared with the HF samples, which only lasted 40,000 cycles. This was also shown with the glass fibre, where the control samples failed before the toughened samples.
The HFT shows the same kink banding formation as the CF and CFT samples within the carbon layer for HFT, the α angle was 6.9°, and β was 83.5°. The kink banding angle β was similar to CFRP at the same stress levels; however, the α angle was higher. The increase in kink band angle was consistent with the CF and GF interface debonding to a higher degree, due to the change in modulus between CF and GF.
The results gathered from Figure 20 indicate that the difference between 320 and 480 N loading was minimal. This result is most likely due to glass fibre failure with no carbon fibre failure at these points, which results in a minimal difference. Although the initial results of the HFT were lower than the HF for modulus, at 50 and 70% loading, the HFT results had a lower margin of error. The previous glass and carbon fabrics had the same drop for 50 and 70% loading, suggesting the veil toughening had a negative, or no, effect on matrix cracking.
In dynamic testing, there were numerous instances observed of the PA 6,6 nanofibre bridging cracks as shown in Figure 21. This crack bridging behaviour is the primary hypothesis for the increase in stiffness retention over the cycles, as the veil physically holds the matrix together and redirects crack growth.
At 90% maximum loading, the HFT sample reached 100,000 cycles, in comparison to the HF, which failed after 40,000 cycles. For all three coupons, the HF samples failed with an average of 9.49 GPa flexural modulus, with HFT having an average flexural modulus of 23.20 ± 5.13 GPa. Using optical microscopy, the fibre failure leading to stiffness degradation was shown in both the carbon fibre and glass fibre layers.

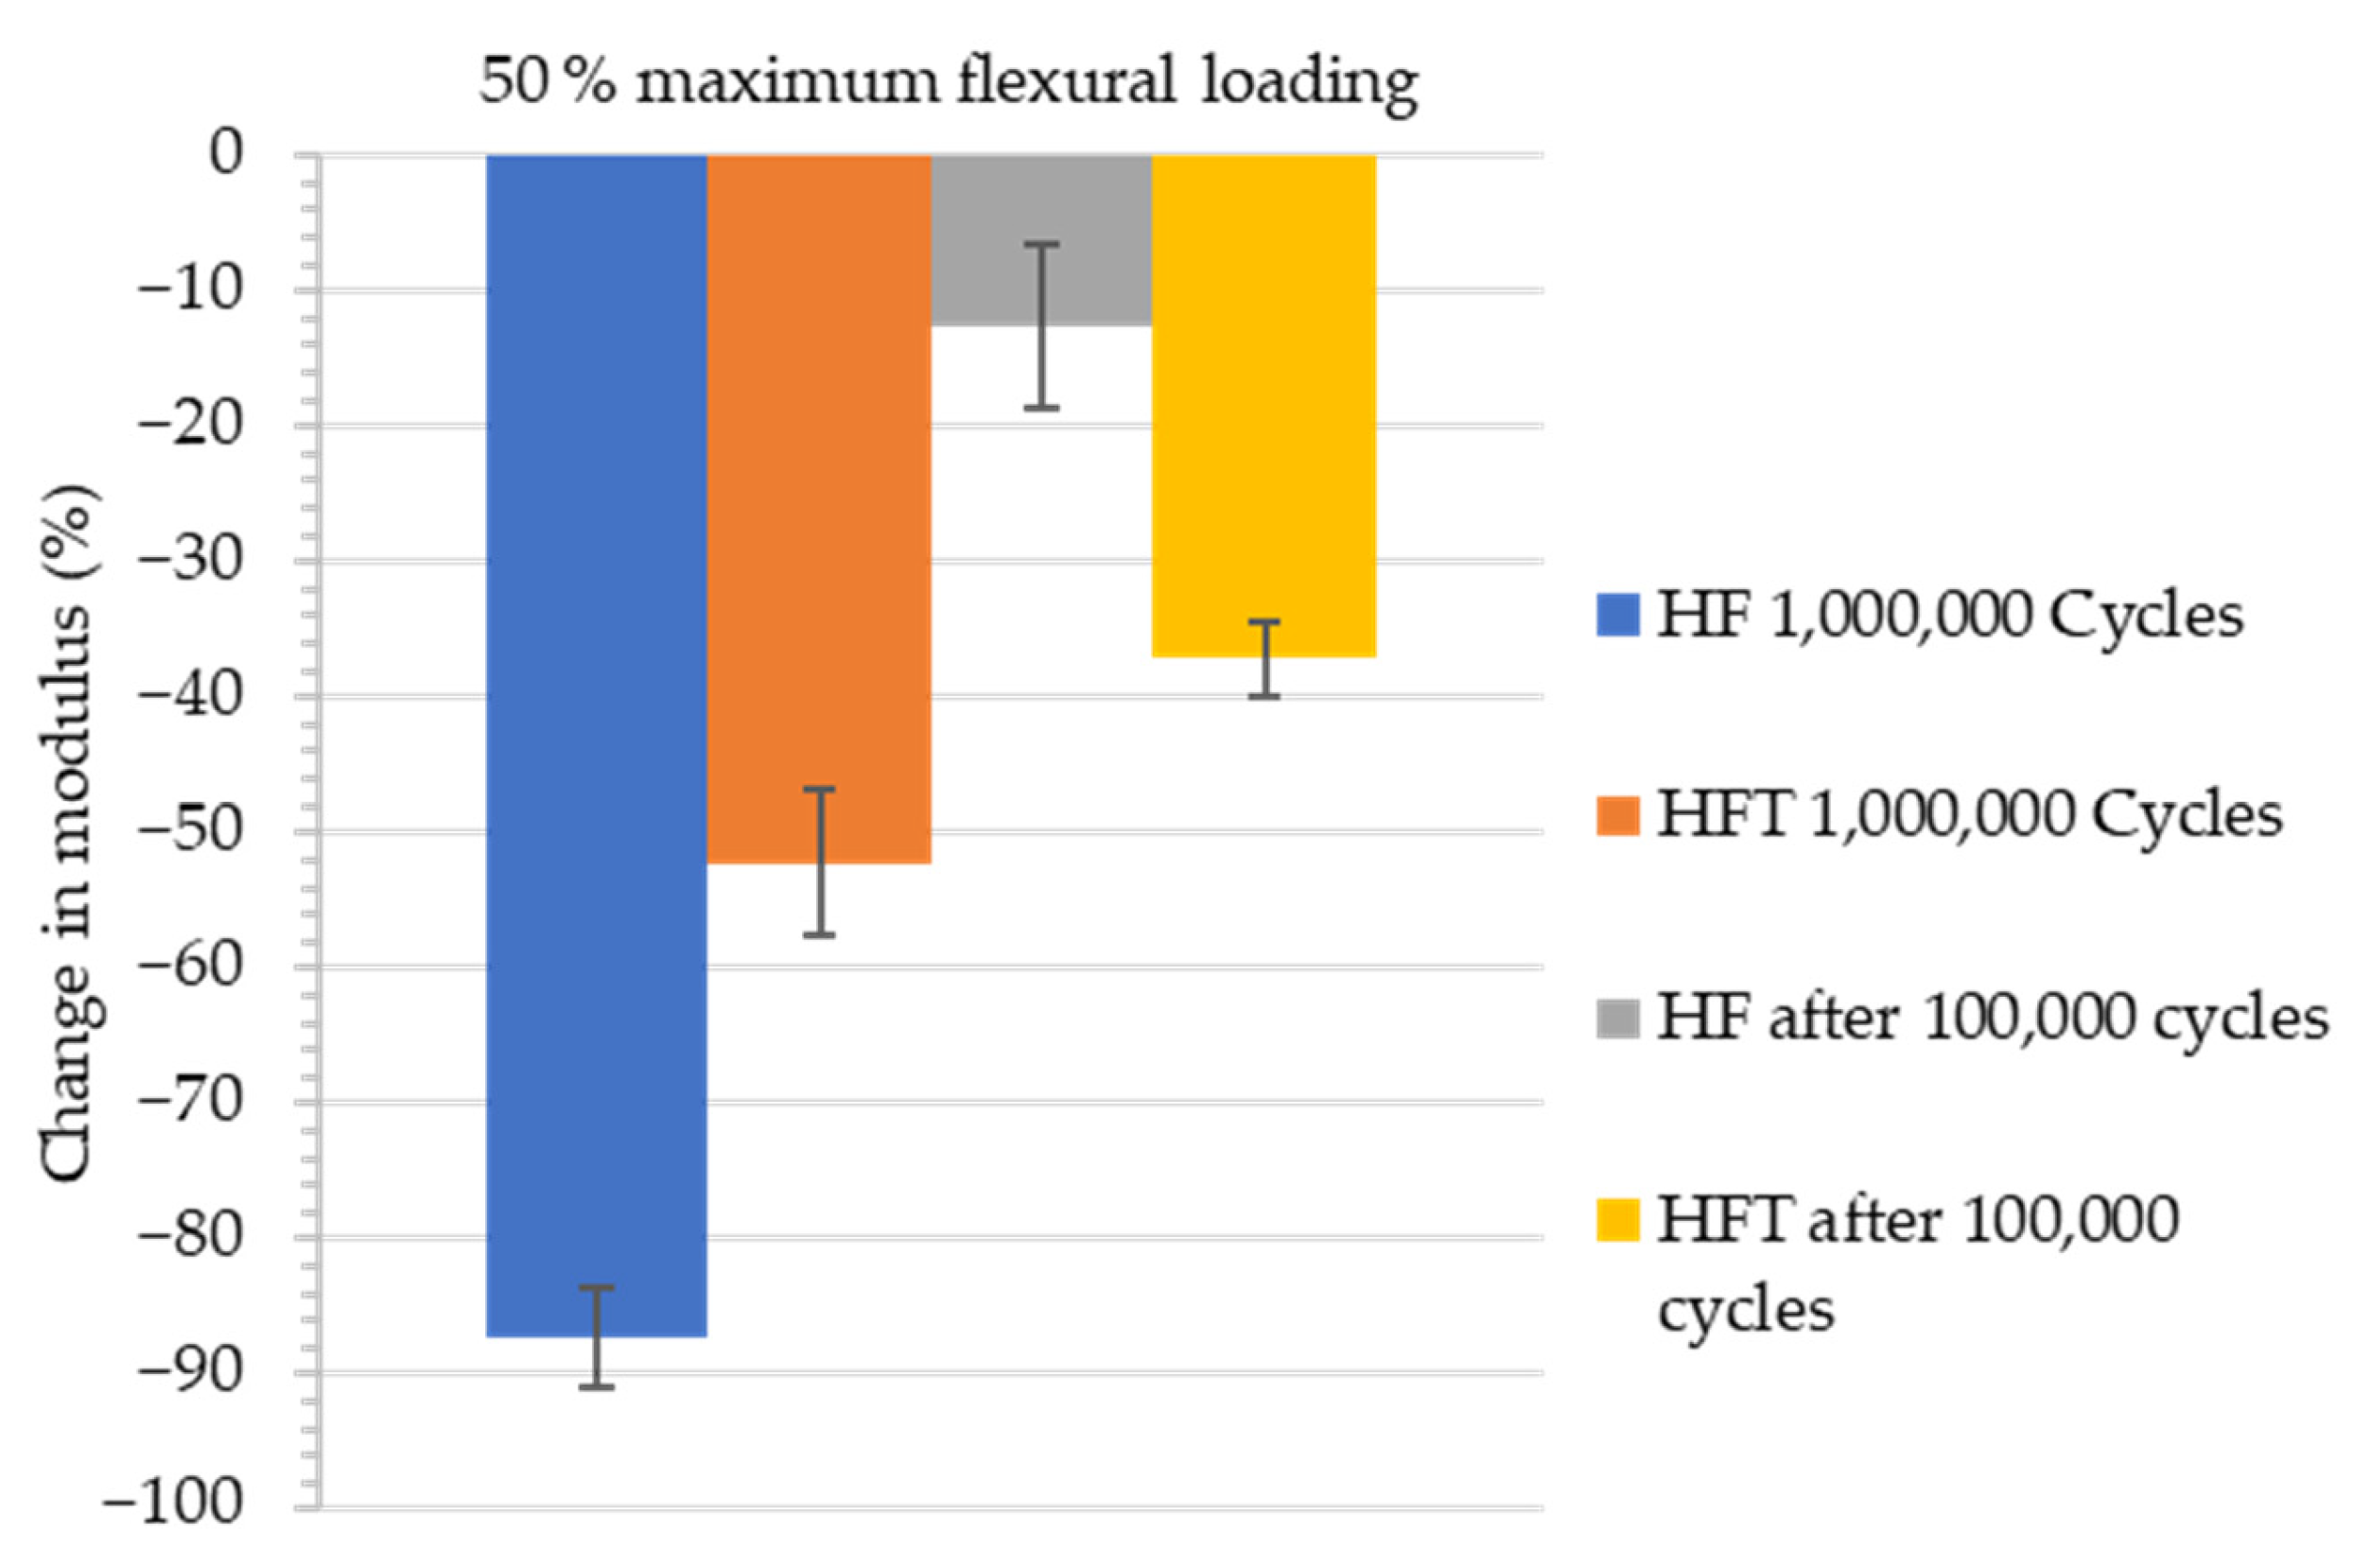
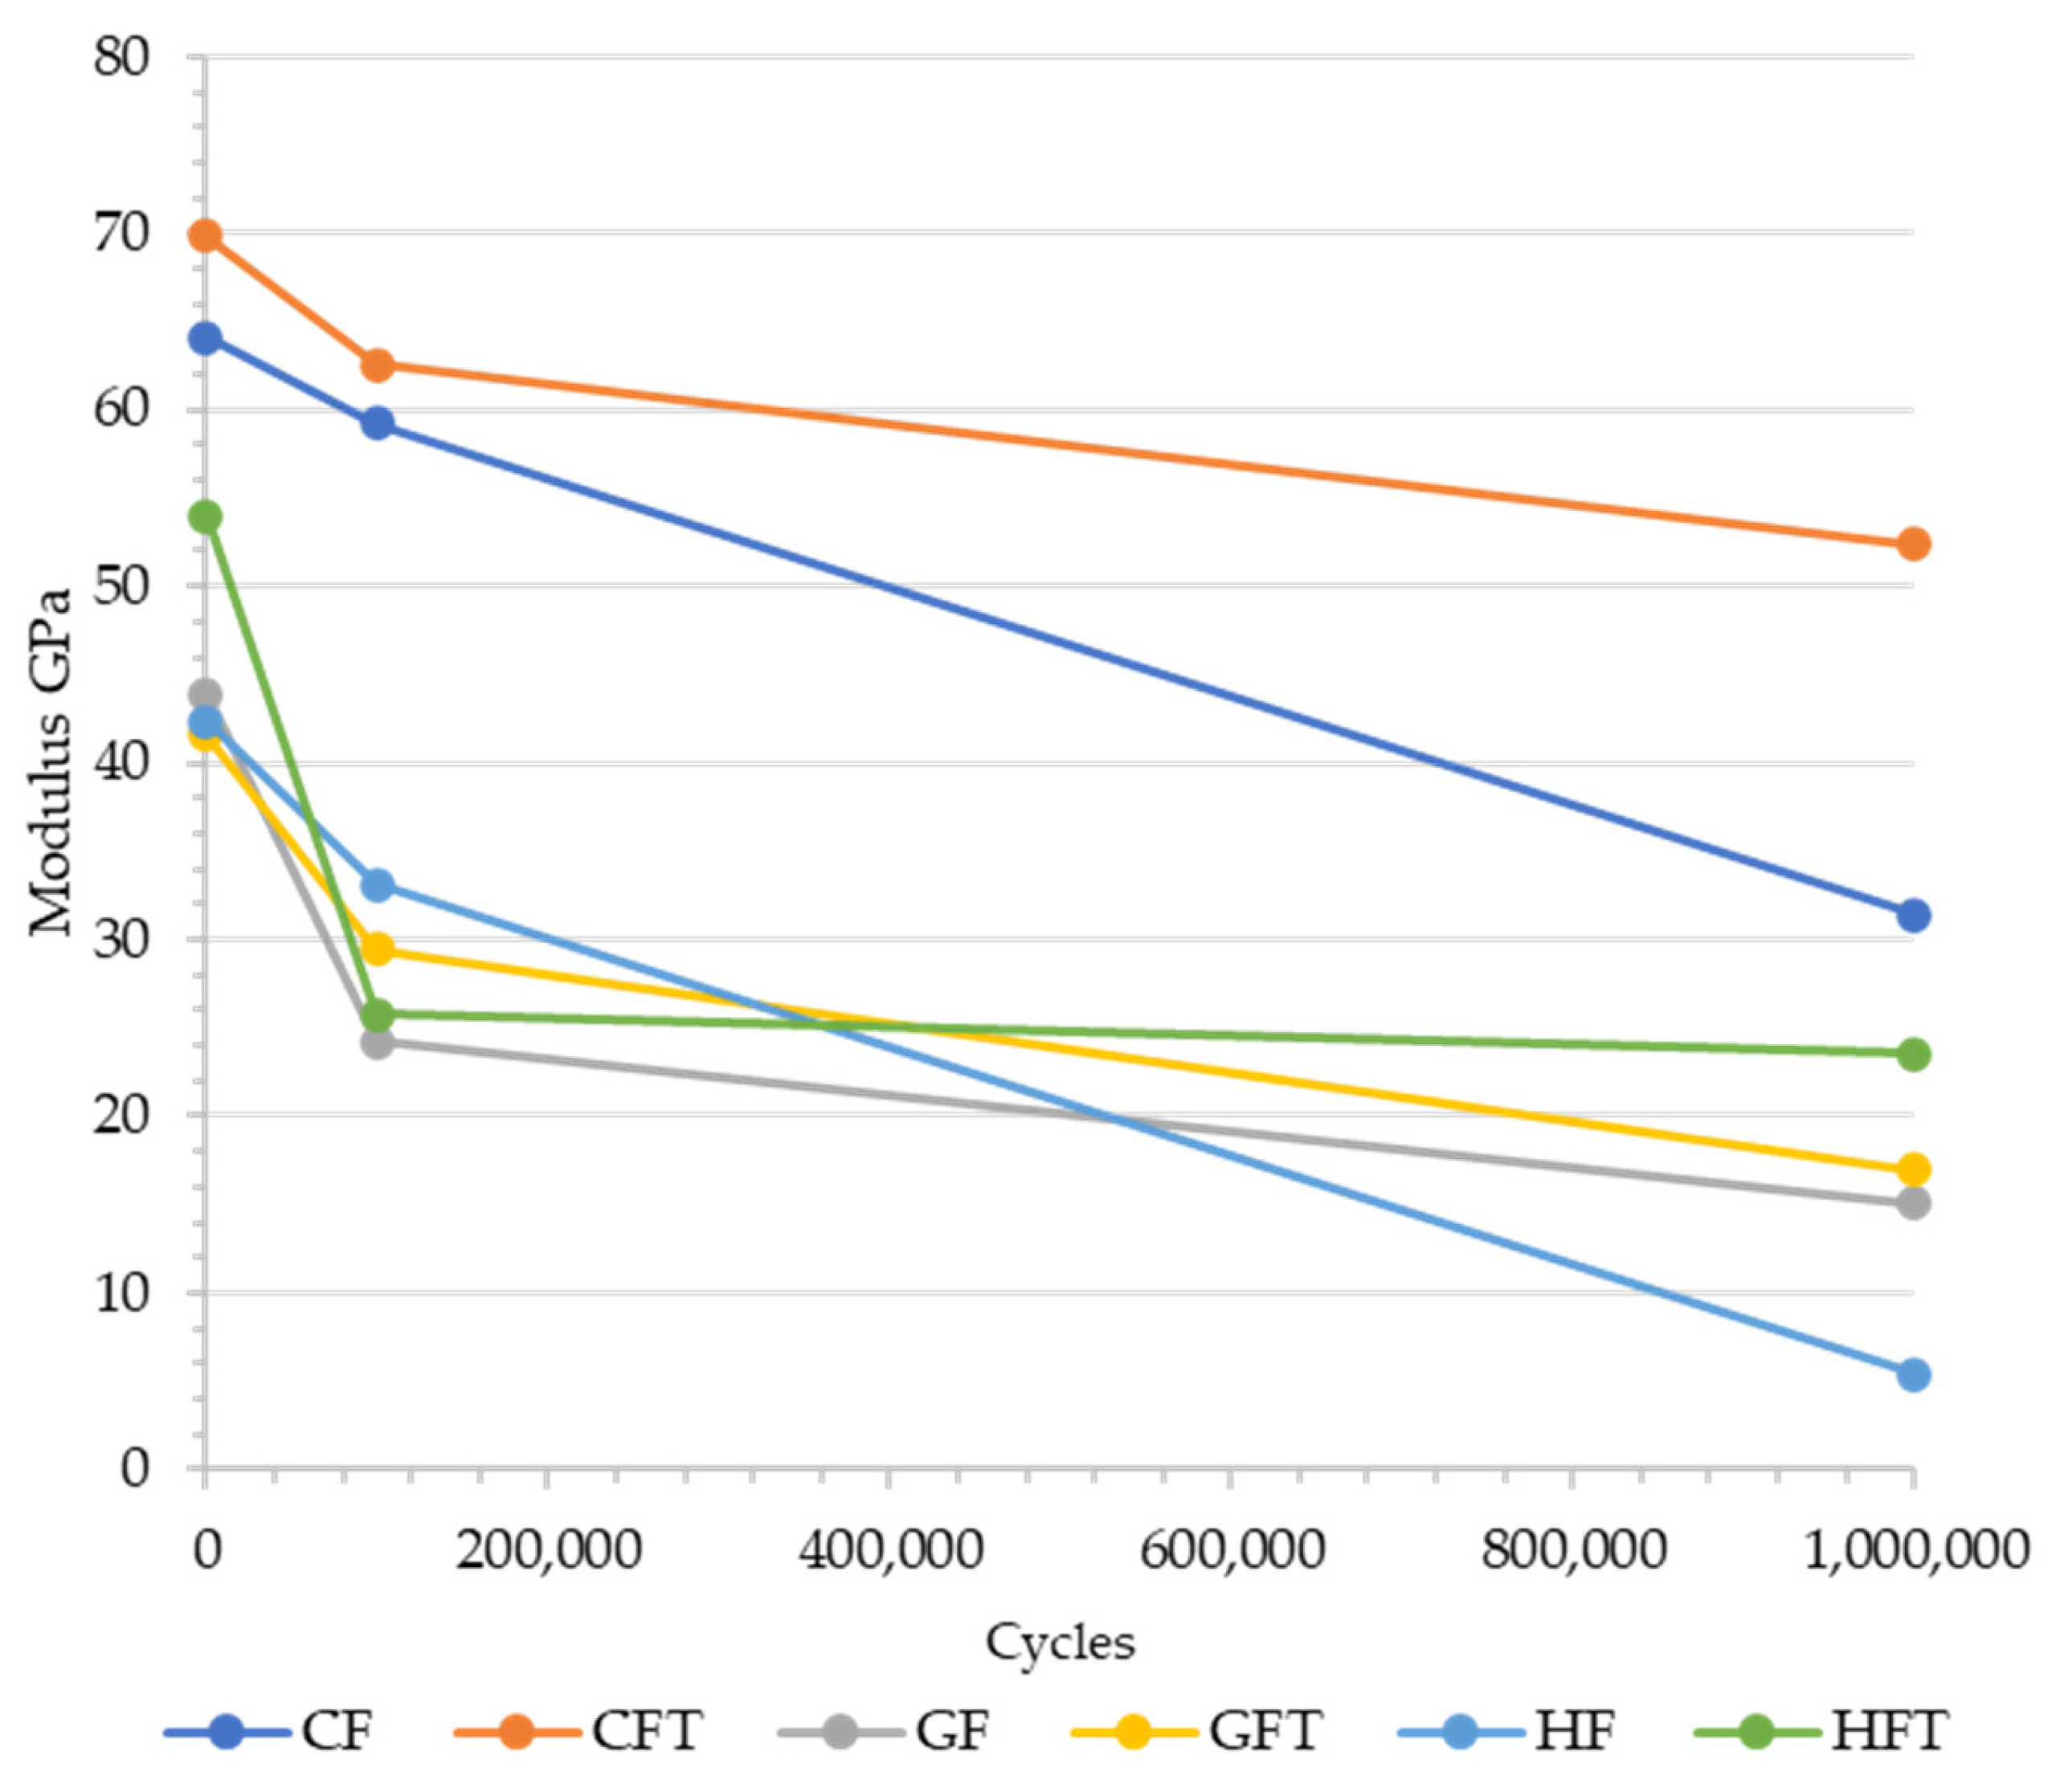
3.4. Comparison of Cycles and Flexural Modulus Retention

The importance of the veil in reducing matrix cracking from propagating into delamination failure is shown in Figure 22. The cracking was unchanged with the presence of veil; although, compared with the control fibre samples, the propagations of these cracks show that, over time, there was a retention in the modulus.
Veil toughening in CFT and HFT showed a distinct plateau, with HFT having almost the same modulus at 1,000,000 cycles as at 100,000 cycles, suggesting that 50% maximum loading is insufficient for causing fibre failure within carbon fibre plies of the HFT.
In comparison, the HF material catastrophically failed at the fibre interface, causing carbon fibre cracking, while the HFT maintains modulus. Glass fabric showed the least improvement to the matrix strain, as the glass fibre was semi-ductile, and the incorporation of thermoplastic nanofibre had minimal strengthening effect. The HF sample was shown to have a modulus degradation below that of the glass fibre, suggesting premature catastrophic failure. The HFT, in comparison, had 17.83% less modulus after 1 million cycles, when compared to CFT.

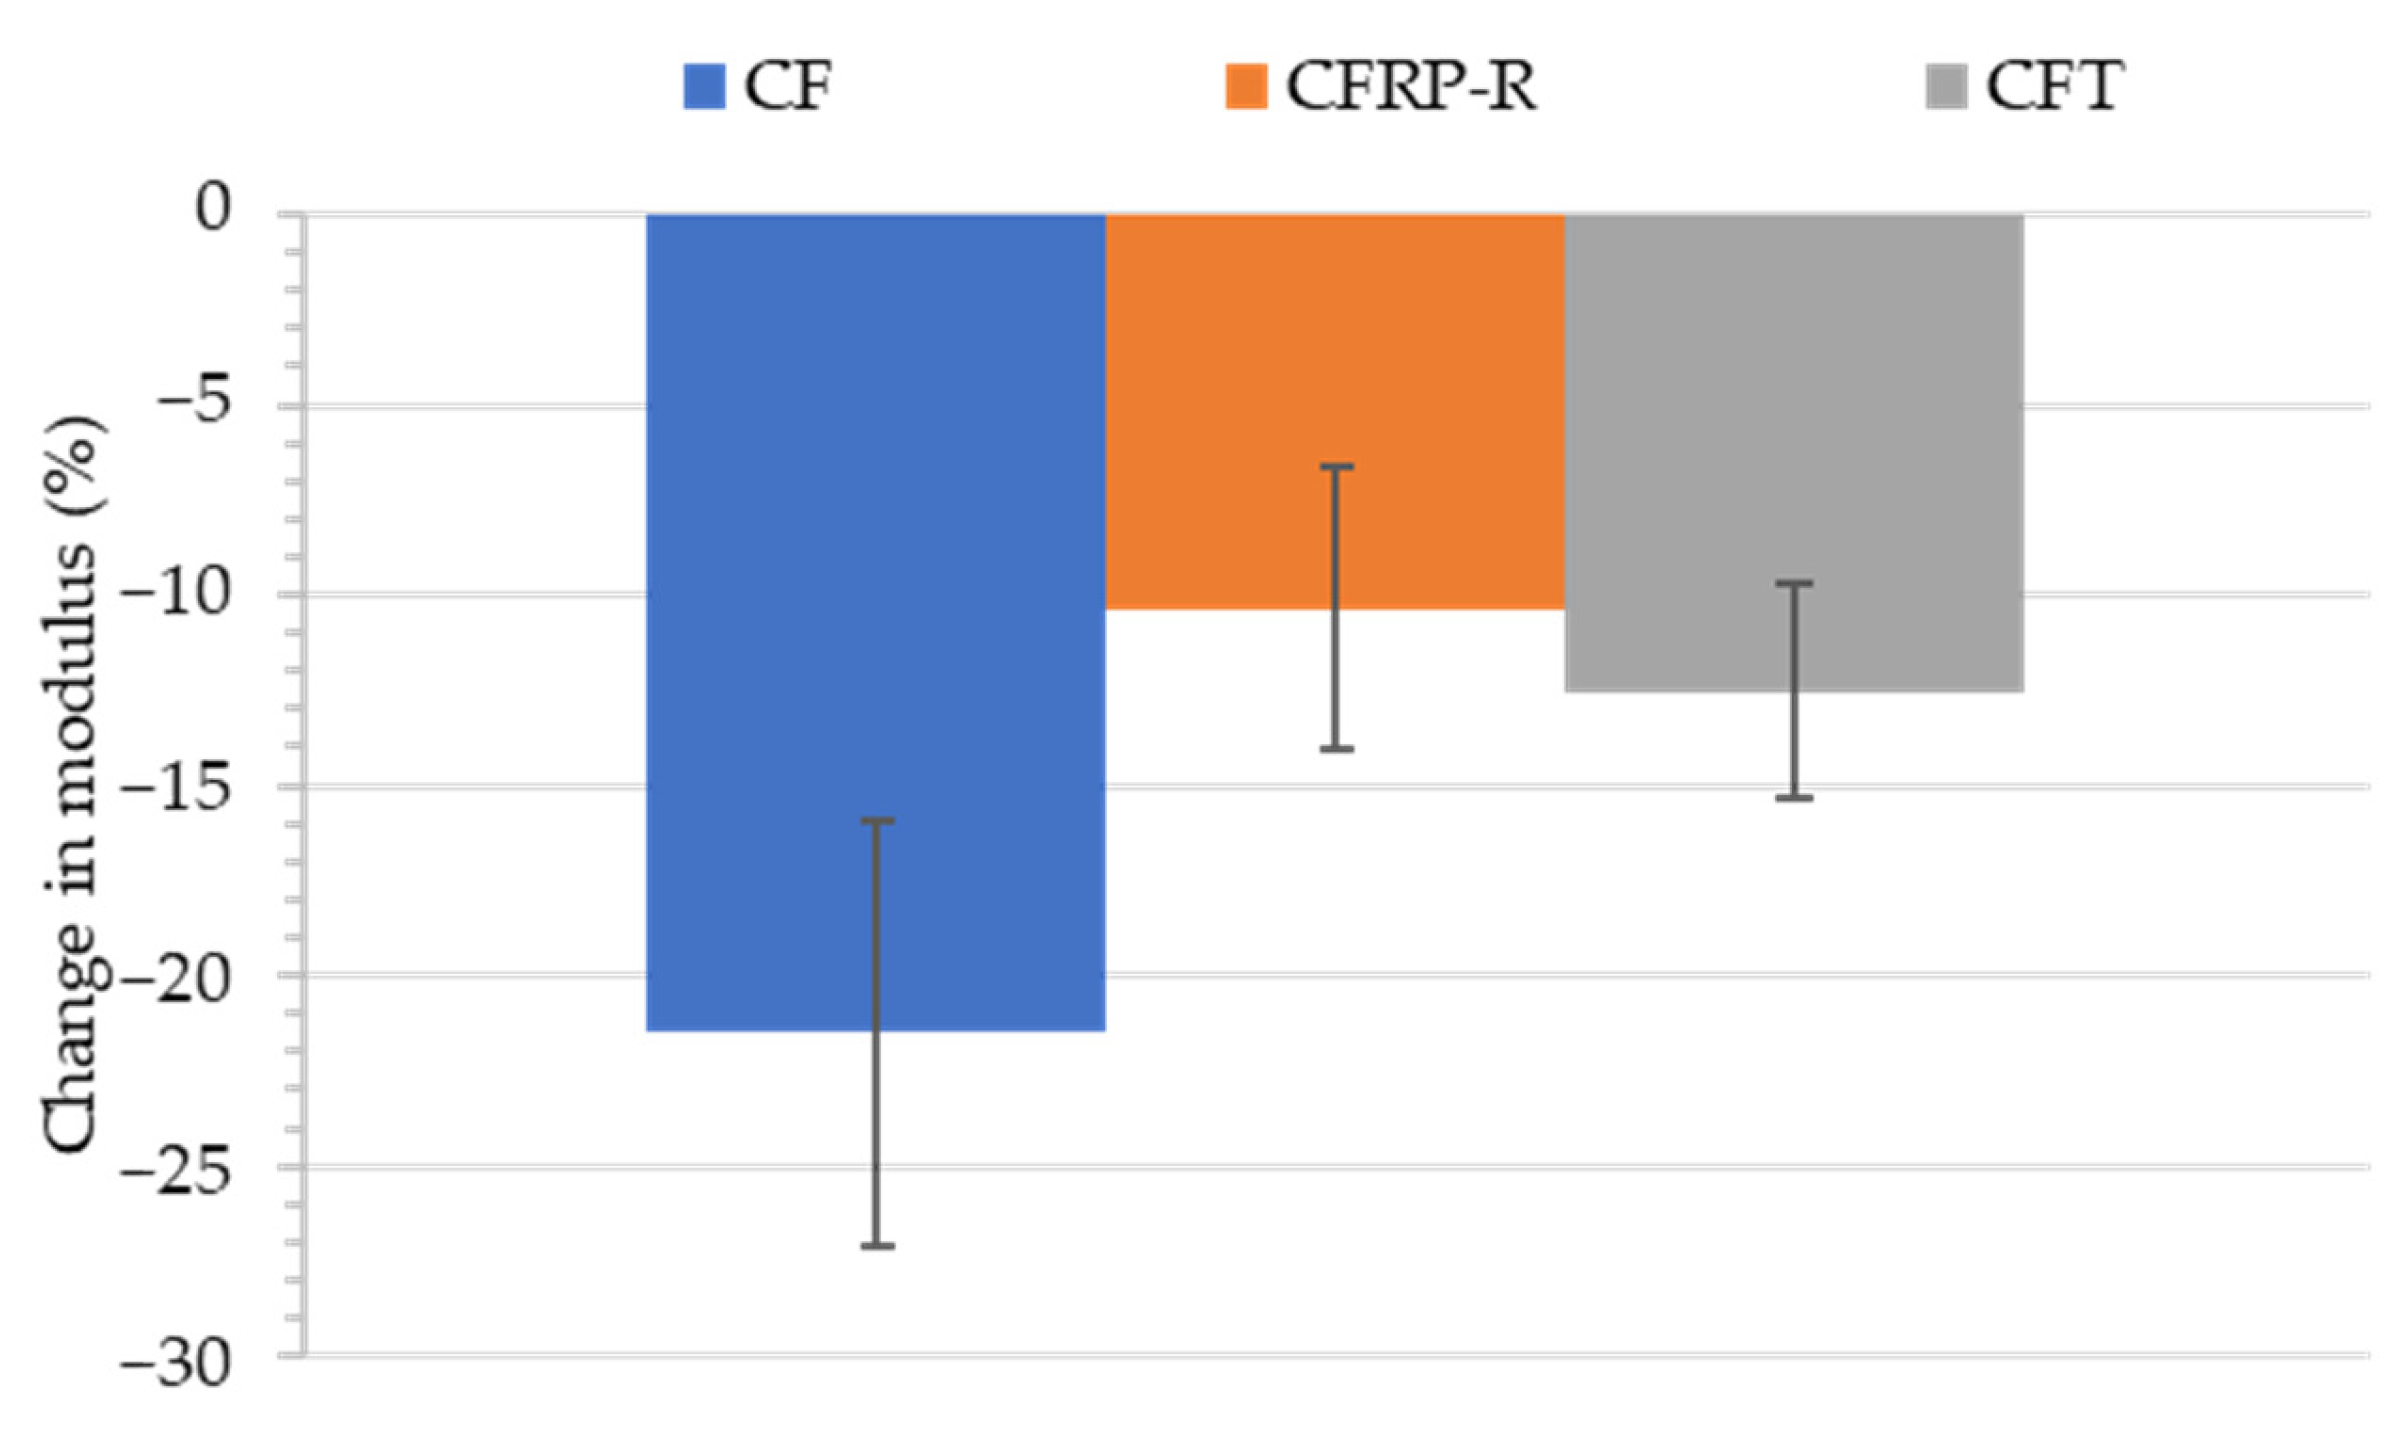
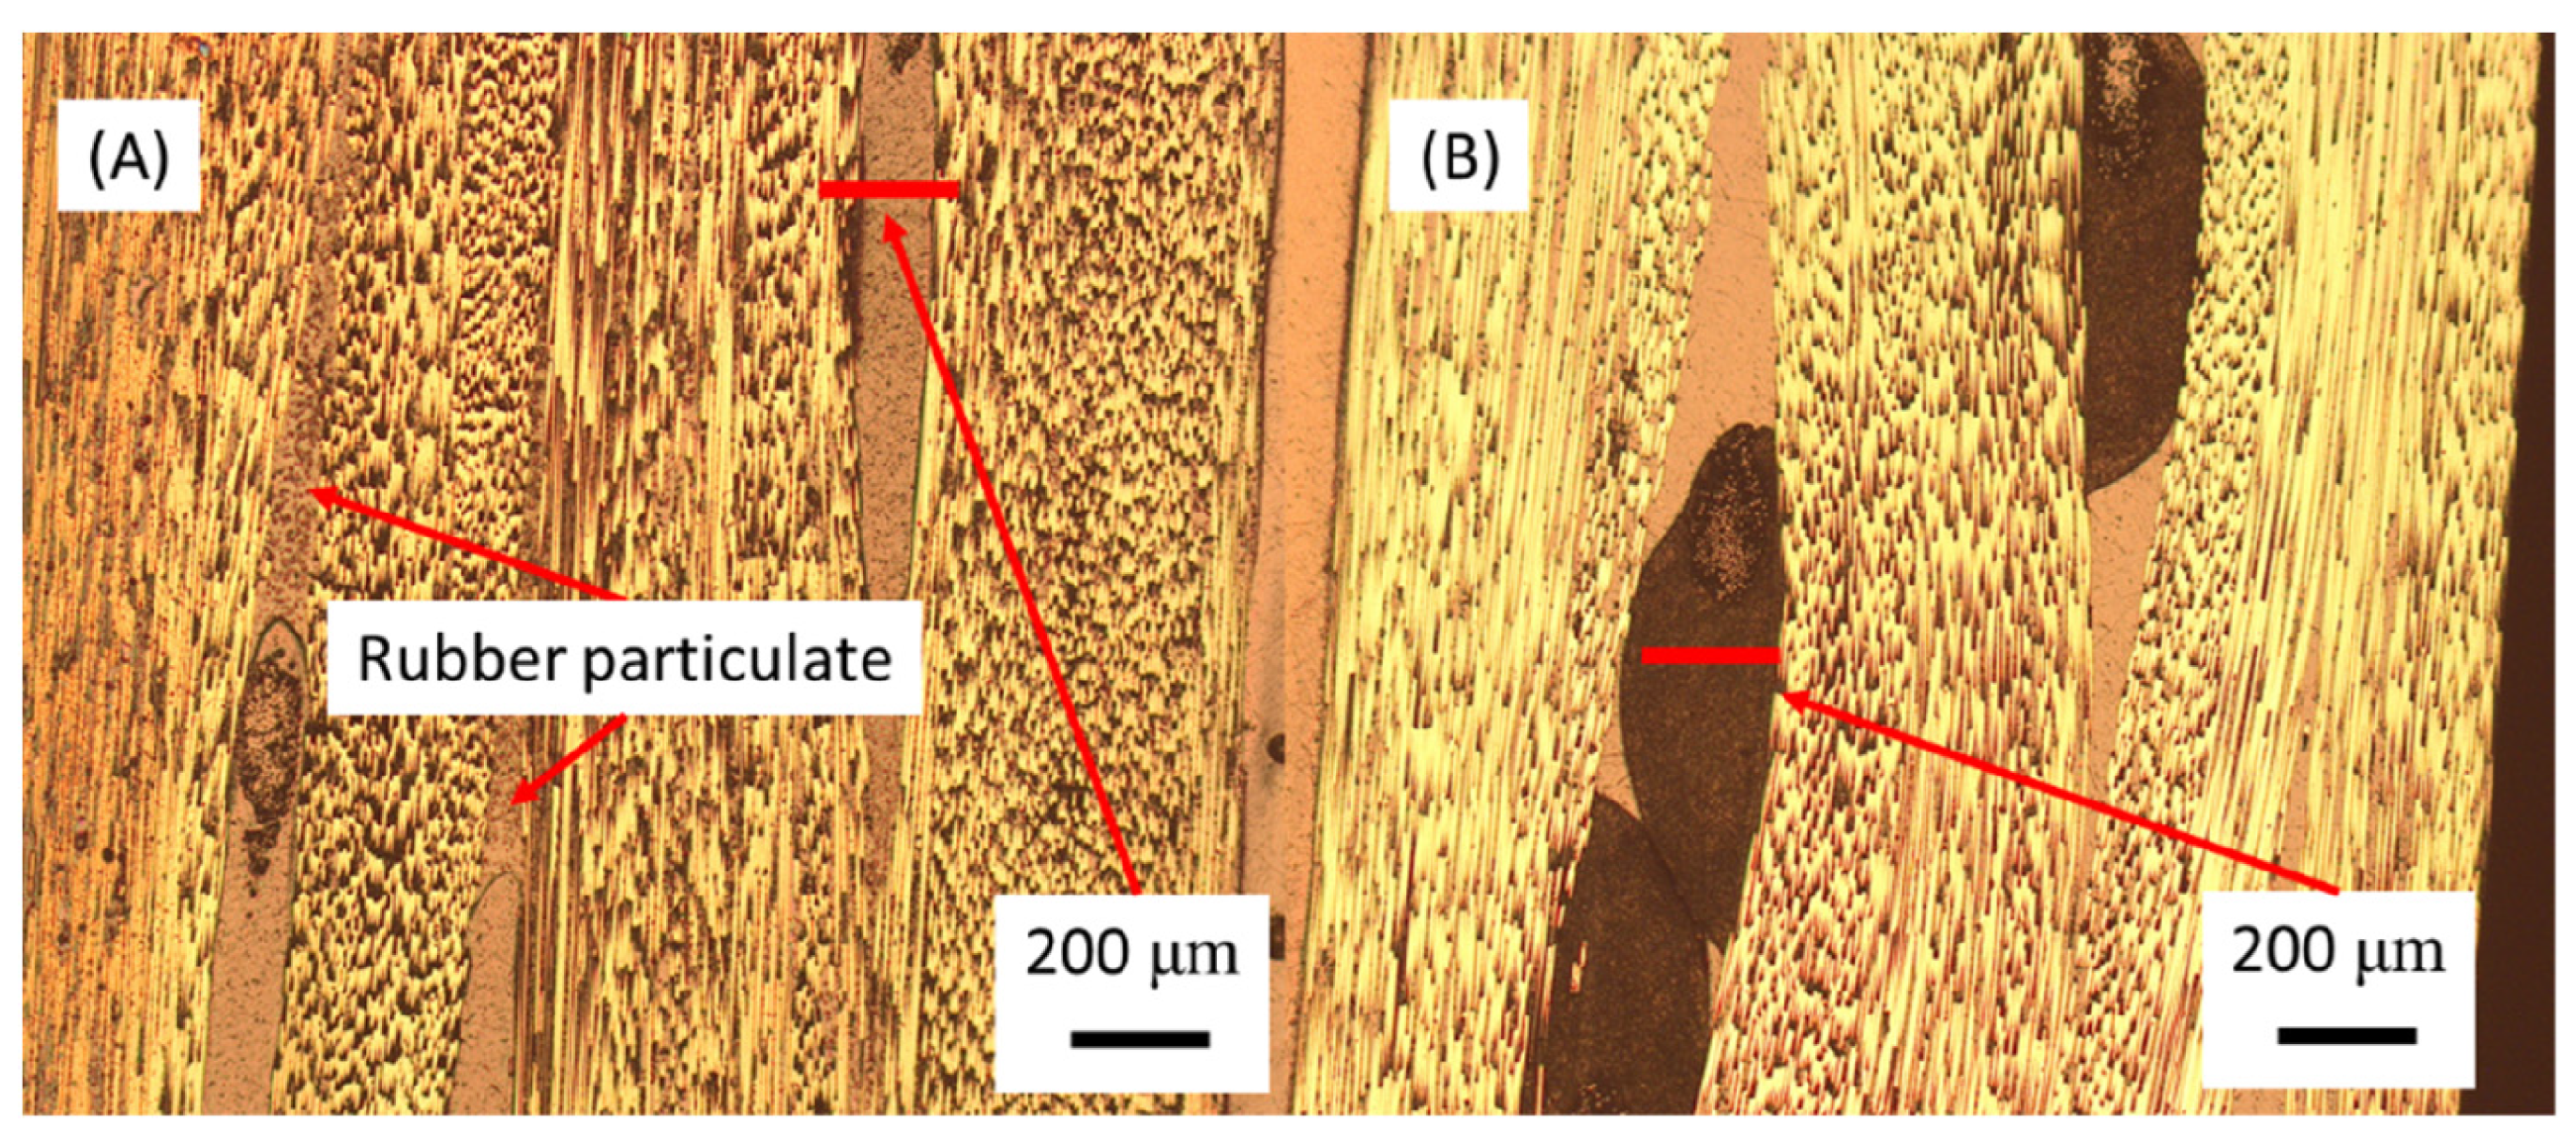
3.5. Rubber Toughening Comparison

This section compares CFRP toughened with a rubber particulate and interlayer veil. Interlayering and matrix toughening are compared initially in quasi-static three-point bend testing to gauge modulus and maximum flexural strength.
The failure mechanisms were investigated at a lower loading, as shown in Figure 23.
After 1,000,000 cycles, the CF-R was shown to have the same decrease in strain as at around 100,000 cycles. Additionally, there were decreases in the modulus at around 500,000 cycles, which is thought to be due to fibre failure, where the stress concentration rests on the second layer of carbon fibre; therefore, the strain returned to a lower state after a failure.
For 100,000 cycles, the strain wave was shown to decrease with the number of cycles as the wave progressed towards 100,000 cycles. Therefore, it is thought that the wave patterns in the strain cycle curve are related to matrix cracking. In the SEM images of the failure area, however, only minor matrix cracking was observed, suggesting that this failure was a micro mechanism in the form of inter-ply failure, as with CFT, which is difficult to characterise from cut-throughs. With Y-direction cut-throughs, however, cracking of the fabric can be seen in between fibres, suggesting that similarly to CFT, CFR propagates the cracks through the inter fibre region. It was found that, with less rubber particulate in the interlaminar region, interlaminar cracking requires less energy to initiate and propagate cracks.
As rubber toughening is a lower-cost alternative to nanofibre, this research project investigated rubber as a comparison. The inclusion of particulate and nanofibre showed an increase in strain, compared with CFRP in quasi-static testing. The maximum loading of toughened structures appeared to increase, although there is statistically little difference between CF, CF-rubber, and CF veil toughened samples as shown in Figure 24.
The amplitude chosen for cyclic loading was 70% of the yield flexural strength; this is used for veil and rubber toughening, as both of these samples failed with the same yield strength. The comparable flexural strength and failure mechanism required a cyclic loading study to find differences in how the failure mechanisms behave in dynamic loading scenarios.
CF-R after 300 cycles drops to a modulus of 40.96 GPa, in comparison to veil toughened CFRP, where 50.29 GPa was the average after 4000 cycles at the same loading. The rubber toughened material has low intrinsic stiffness, due to being round, particularly where the veil electrospinning allows for a higher interconnective matrix, due to being a fibre. The mechanism by which the rubber stops crack propagation is crack deflection. As shown in the microscopy, there was no fibre breaking along the coupon; rather, the matrix appeared to break around cross-stitching, similar to the other samples. Unlike CFT, the rubber toughening did not show signs of crack bridging or deflection in microscopic analysis.
Both the rubber and veil showed improvements in stiffness retention, in comparison to the control CF. It is important to note that rubber toughening requires a higher curing temperature, due to the change in the glass transition temperature; additionally, the rubber toughening had a lower modulus at 54.52 GPa.
It was noted that the fibre misalignment of the CFRP-R was lower than CF and CFT, with 4.17° shown below Figure 25. The CFRP-R has significantly more compression on the cross-stitching, leading to less waviness, with the cross-stitching being compressed to 0.1 mm.
The cross-stitching shown in Figure 25 for CFRP-R is significantly compressed, compared to CF samples. The cross-stitching results in a high elongation of the thermoplastic cross-stitching material, whilst in CF, oval shapes are produced.

4. Conclusions

The control samples that were subjected to higher magnitude loading tended to catastrophically fail, with 70% amplitude showing over 40% stiffness degradation for CF, GF, and HF. The HFT samples subjected to 90% of the maximum loading experienced glass fibre tension failure, compared to samples at a million cycles with matrix cracking, but no fibre failure was observed.
Initially, there was a drop in the modulus after 100,000 cycles, compared with the untoughened sample. This was characterised by the random nanofibre, which had a lower modulus than the matrix, therefore contributing less stiffness to the overall composite than the epoxy-based matrix. However, the longitudinal crack reduction resulted in lower stiffness degradation over 1,000,000 cycles, which is beneficial to composites, with the CFT sample showing a 66.87% higher modulus than CF.
In carbon fibre samples, the cracks were centred around the cross-stitch. Similarly, in quasi-static testing, the cross-stitching of the carbon fibre was observed to be the propagation point of the fatigue failure in both high amplitude and cyclic testing. In comparison with the glass fibre, cracking of the fibre was observed within the samples subjected to high cycles. At higher stress loading, the glass fibre was observed to have less stiffness degradation, as the fibre bundles had more flexural strength, due to size, than the carbon fibre.
In three-point bending under cyclic loading, the toughened composites at 1 and 2 million cycles had longitudinal cracking. In comparison with the control samples, the longitudinal cracks were trapped between the boundaries of the fibre and nanofibre. The trapping of the crack propagation resulted in a changing stress concentration, thus stopping the stress concentrating on the fibres as the matrix fibre bonding still occurred.
Overall, the veil toughening showed an increase in cycles to failure for high amplitude. The failure mechanisms, however, remained the same for veil toughening. The lack of change in failure mechanisms suggests that fatigue failure is more gradual, thus promoting kink band failure, rather than premature buckling. The kink band angle was overall higher in veil toughened samples, which was a result of the interplay failure caused by fibre debonding.
Glass fibre showed extensive rupturing on the tension side, rather than the compression side. On the compression side, there was delamination. The hybridisation of the two fibres demonstrated that carbon fibre hybrids have a higher fatigue life, and failure occurred much later in the testing cycles than it did for glass fibre counterparts. Hybridisation resulted in premature failure of the glass and carbon fibre layers, thus resulting in the formation of two plateau regions as the strain dropped during bending.
When testing using millions of cycles, the veil showed higher stiffness retention, suggesting less matrix cracking. The crack deflection and blunting of veil toughening that was observed in microscopy was shown to only be effective under 600 MPa, beyond which the matrix cracking was able to break veil interlayering. The delamination effect between the veil and fibre interface divides the interlaminar region, which, in longer cycle times, results in more stiffness retention.

Author Contributions

Methodology, A.B.; conceptualization, A.B.; writing—original draft preparation A.B., M.N. and B.X.C.; writing—review and editing, A.B., M.N., B.E. and B.X.C.; supervision, B.F., M.N. and B.E. All authors have read and agreed to the published version of the manuscript.

Funding

This research was funded by Ford Motor Company grant number URP2016-4010R.

Institutional Review Board Statement

Not applicable.

Informed Consent Statement

Not applicable.

Data Availability Statement

Data available upon request.

Conflicts of Interest

The authors declare no conflict of interest.

References

  1. Chai, B.X.; Eisenbart, B.; Nikzad, M.; Fox, B.; Blythe, A.; Blanchard, P.; Dahl, J. Simulation-based optimisation for injection configuration design of liquid composite moulding processes: A review. Composites. Part A Appl. Sci. Manuf. 2021, 149, 106540. [Google Scholar] [CrossRef]
  2. Elias, P.K.; Aikaterini-Flora, T.; Raquel-Miriam, S.; Marta, M.; Cláudio Monterio Dos, S.; Vanessa, I.; Robert, B.; Guan, G.; Agustin, C.; Ignaas, V.; et al. Research and development in carbon fibers and advanced high-performance composites supply chain in europe: A roadmap for challenges and the industrial uptake. J. Compos. Sci. 2019, 3, 86. [Google Scholar] [CrossRef]
  3. Heckadka, S.S.; Nayak, S.Y.; Narang, K.; Vardhan Pant, K. Chopped Strand/Plain Weave E-Glass as Reinforcement in Vacuum Bagged Epoxy Composites. J. Mater. 2015, 2015, 957043. [Google Scholar] [CrossRef]
  4. Rashid, B.; Sadeq, A.; Ebraheem, M.; Mohammed, A.R. Mechanical properties of hybrid woven roving and chopped strand mat glass fabric reinforced polyester composites. Mater. Res. Express 2019, 6, 105208. [Google Scholar] [CrossRef]
  5. Dong, C.; Davies, I.J. Effect of stacking sequence on the flexural properties of carbon and glass fibre-reinforced hybrid composites. Adv. Compos. Hybrid Mater. 2018, 1, 530–540. [Google Scholar] [CrossRef]
  6. Naito, K. Flexural Properties of Carbon/Glass Hybrid Thermoplastic Epoxy Composite Rods Under Static and Fatigue Loadings. Appl. Compos. Mater. 2021, 28, 753–766. [Google Scholar] [CrossRef]
  7. Adam, H. Carbon fibre in automotive applications. Mater. Des. 1997, 18, 349–355. [Google Scholar] [CrossRef]
  8. Kalantari, M.; Dong, C.; Davies, I.J. Numerical investigation of the hybridisation mechanism in fibre reinforced hybrid composites subjected to flexural load. Compos. Part B Eng. 2016, 102, 100–111. [Google Scholar] [CrossRef]
  9. Wang, Q.; Wu, W.; Gong, Z.; Li, W. Flexural Progressive Failure of Carbon/Glass Interlayer and Intralayer Hybrid Composites. Materials 2018, 11, 619. [Google Scholar] [CrossRef]
  10. Ribeiro, F.; Sena-Cruz, J.; Vassilopoulos, A.P. Tension-tension fatigue behavior of hybrid glass/carbon and carbon/carbon composites. Int. J. Fatigue 2021, 146, 106143. [Google Scholar] [CrossRef]
  11. Naito, K. Static and fatigue tensile properties of carbon/glass hybrid fiber-reinforced epoxy composites. Sci. Rep. 2022, 12, 6298. [Google Scholar] [CrossRef] [PubMed]
  12. Swolfs, Y.; Gorbatikh, L.; Verpoest, I. Fibre hybridisation in polymer composites: A review. Compos. Part A Appl. Sci. Manuf. 2014, 67, 181–200. [Google Scholar] [CrossRef]
  13. Qingtao, W.; Weili, W.; Wei, L. Compression Properties of Interlayer and Intralayer Carbon/Glass Hybrid Composites. Polymers 2018, 10, 343. [Google Scholar] [CrossRef]
  14. Wu, W.W.; Wei, Q.L. Comparison of tensile and compressive properties of carbon/glass interlayer and intralayer hybrid composites. Materials 2018, 11, 1105. [Google Scholar] [CrossRef]
  15. Ikbal, H.; Wang, Q.; Azzam, A.; Li, W. GF/CF hybrid laminates made through intra-tow hybridization for automobile applications.(Report). Fibers Polym. 2016, 17, 1505. [Google Scholar] [CrossRef]
  16. Dong, C. Uncertainties in flexural strength of carbon/glass fibre reinforced hybrid epoxy composites. Compos. Part B Eng. 2016, 98, 176–181. [Google Scholar] [CrossRef]
  17. Swolfs, Y.; Verpoest, I.; Gorbatikh, L. Maximising the hybrid effect in unidirectional hybrid composites. Mater. Des. 2016, 93, 39–45. [Google Scholar] [CrossRef]
  18. Kar, N.K.; Barjasteh, E.; Hu, Y.; Nutt, S.R. Bending fatigue of hybrid composite rods. Compos. Part A Appl. Sci. Manuf. 2011, 42, 328–336. [Google Scholar] [CrossRef]
  19. Ray, D.; Comer, A.J.; Rosca, I.; Obande, W.; Clancy, G.; Stanley, W. Core-shell rubber nanoparticle toughened carbon fibre/epoxy composites. In Proceedings of the 16th European Conference on Composite Materials, ECCM 2014, Seville, Spain, 22–26 June 2014. [Google Scholar]
  20. Puglia, D.; Kenny, J.M. Cure Kinetics of Epoxy/Rubber Polymer Blends. In Handbook of Epoxy Blends; Parameswaranpillai, J., Hameed, N., Pionteck, J., Woo, E.M., Eds.; Springer: New York, NY, USA, 2017. [Google Scholar]
  21. Kim, D.S.; Kim, S.C. Rubber modified epoxy resin. I: Cure kinetics and chemorheology. Polym. Eng. Sci. 1994, 34, 625–631. [Google Scholar] [CrossRef]
  22. Sinclair, J.W. Effects of Cure Temperature on Epoxy Resin Properties. J. Adhes. 1992, 38, 219–234. [Google Scholar] [CrossRef]
  23. Bard, S.; Demleitner, M.; Weber, R.; Zeiler, R.; Altstädt, V. Effect of Curing Agent on the Compressive Behavior at Elevated Test Temperature of Carbon Fiber-Reinforced Epoxy Composites. Polymers 2019, 11, 943. [Google Scholar] [CrossRef] [PubMed]
  24. Felice, R.; Antonio, N.; Fausto, T.; Pierpaolo, C. Marine Application of Fiber Reinforced Composites: A Review. J. Mar. Sci. Eng. 2020, 8, 26. [Google Scholar] [CrossRef]
  25. Leon, M.; Kim, B.; Helga Nørgaard, P.; Justine, B.; Malcolm, M.; Bent, F.S. Materials for wind turbine blades: An overview. Materials 2017, 10, 1285. [Google Scholar] [CrossRef]
  26. Wu, Z.; Wang, X.; Iwashita, K.; Sasaki, T.; Hamaguchi, Y. Tensile fatigue behaviour of FRP and hybrid FRP sheets. Compos. Part B Eng. 2010, 41, 396–402. [Google Scholar] [CrossRef]
  27. Liu, B.; Xu, A.; Bao, L. Preparation of carbon fiber-reinforced thermoplastics with high fiber volume fraction and high heat-resistant properties. J. Thermoplast. Compos. Mater. 2015, 30, 724–737. [Google Scholar] [CrossRef]
  28. Carolan, D.; Ivankovic, A.; Kinloch, A.J.; Sprenger, S.; Taylor, A.C. Toughened carbon fibre-reinforced polymer composites with nanoparticle-modified epoxy matrices. J. Mater. Sci. 2017, 52, 1767–1788. [Google Scholar] [CrossRef]
  29. Thomas, R.; Yumei, D.; Yuelong, H.; Le, Y.; Moldenaers, P.; Weimin, Y.; Czigany, T.; Thomas, S. Miscibility, morphology, thermal, and mechanical properties of a DGEBA based epoxy resin toughened with a liquid rubber. Polymer 2008, 49, 278–294. [Google Scholar] [CrossRef]
  30. Mohammadi, R.; Ahmadi Najafabadi, M.; Saghafi, H.; Saeedifar, M.; Zarouchas, D. A quantitative assessment of the damage mechanisms of CFRP laminates interleaved by PA66 electrospun nanofibers using acoustic emission. Compos. Struct. 2021, 258, 113395. [Google Scholar] [CrossRef]
  31. Quan, D.; Yue, D.; Ma, Y.; Zhao, G.; Alderliesten, R. On the mix-mode fracture of carbon fibre/epoxy composites interleaved with various thermoplastic veils. Compos. Commun. 2022, 33, 101230. [Google Scholar] [CrossRef]
  32. Shekar, C.; Singaravel, B.; Deva Prasad, S.; Venkateshwarlu, N.; Srikanth, B. Mode-I fracture toughness of glass/carbon fiber reinforced epoxy matrix polymer composite. Mater. Today: Proc. 2021, 41, 833–837. [Google Scholar] [CrossRef]
  33. Hojo, M.; Matsuda, S.; Tanaka, M.; Ochiai, S.; Murakami, A. Mode I delamination fatigue properties of interlayer-toughened CF/epoxy laminates. Compos. Sci. Technol. 2006, 66, 665–675. [Google Scholar] [CrossRef]
  34. Zhou, H.; Du, X.; Liu, H.-Y.; Zhou, H.; Zhang, Y.; Mai, Y.-W. Delamination toughening of carbon fiber/epoxy laminates by hierarchical carbon nanotube-short carbon fiber interleaves. Compos. Sci. Technol. 2017, 140, 46–53. [Google Scholar] [CrossRef]
  35. Song, Y.; Zheng, N.; Dong, X.; Gao, J. Flexible carboxylated CNT/PA66 nanofibrous mat interleaved carbon fiber/epoxy laminates with improved interlaminar fracture toughness and flexural properties. Ind. Eng. Chem. Res. 2020, 59, 1151–1158. [Google Scholar] [CrossRef]
  36. Zheng, N.; Huang, Y.; Liu, H.-Y.; Gao, J.; Mai, Y.-W. Improvement of interlaminar fracture toughness in carbon fiber/epoxy composites with carbon nanotubes/polysulfone interleaves. Compos. Sci. Technol. 2017, 140, 8–15. [Google Scholar] [CrossRef]
  37. Pozegic, T.R.; King, S.G.; Fotouhi, M.; Stolojan, V.; Silva, S.R.P.; Hamerton, I. Delivering interlaminar reinforcement in composites through electrospun nanofibres. Adv. Manuf. Polym. Compos. Sci. 2019, 5, 155–171. [Google Scholar] [CrossRef]
  38. Cristina, M.; Miren, B.; Nieves, M.; Ana, P.-M.; Jon, M.; Jorge, G.; Jose Manuel, L.; Estíbaliz, A.; Jose Luis, V. Effect of Different Types of Electrospun Polyamide 6 Nanofibres on the Mechanical Properties of Carbon Fibre/Epoxy Composites. Polymers 2018, 10, 1190. [Google Scholar] [CrossRef]
  39. Ahmadloo, E.; Gharehaghaji, A.A.; Latifi, M.; Saghafi, H.; Mohammadi, N. Effect of PA66 nanofiber yarn on tensile fracture toughness of reinforced epoxy nanocomposite. Proc. Inst. Mech. Eng. Part C J. Mech. Eng. Sci. 2018, 233, 2033–2043. [Google Scholar] [CrossRef]
  40. Del Saz-Orozco, B.; Ray, D.; Stanley Walter, F. Effect of thermoplastic veils on interlaminar fracture toughness of a glass fiber/vinyl ester composite. Polym. Compos. 2015, 38, 2501–2508. [Google Scholar] [CrossRef]
  41. Jiang, S.; Chen, Y.; Duan, G.; Mei, C.; Greiner, A.; Agarwal, S. Electrospun nanofiber reinforced composites: A review. Polym. Chem. 2018, 9, 2685–2720. [Google Scholar] [CrossRef]
  42. Arinstein, A.A. Electrospun Polymer Nanofibers. A Physicist’s Point of View. Singapore: Jenny Stanford Publishing; Pan Stanford Publishing: Singapore, 2018. [Google Scholar]
  43. Alam, P.; Mamalis, D.; Robert, C.; Floreani, C.; Ó Brádaigh, C.M. The fatigue of carbon fibre reinforced plastics—A review. Composites. Part B Eng. 2019, 166, 555–579. [Google Scholar] [CrossRef] [Green Version]
  44. Wang, C.; Zhang, J. Experimental and analytical study on residual stiffness/strength of CFRP tendons under cyclic loading. Materials 2020, 13, 5653. [Google Scholar] [CrossRef] [PubMed]
  45. DorMohammdi, S.; Godines, C.; Abdi, F.; Huang, D.; Repupilli, M.; Minnetyan, L. Damage-tolerant composite design principles for aircraft components under fatigue service loading using multi-scale progressive failure analysis. J. Compos. Mater. 2017, 51, 2181–2202. [Google Scholar] [CrossRef]
  46. Yang, Y.; Liu, X.; Wang, Y.-Q.; Gao, H.; Li, R.; Bao, Y. A progressive damage model for predicting damage evolution of laminated composites subjected to three-point bending. Compos. Sci. Technol. 2017, 151, 85–93. [Google Scholar] [CrossRef]
  47. ASTM D7264/D7264M-07; Standard Test Method for Flexural Properties of Polymer Matrix Composite Materials. ASTM International: West Conshohocken, PA, USA, 2015.
  48. Sieberer, S.; Nonn, S.; Schagerl, M. Fatigue behaviour of discontinuous carbon-fibre reinforced specimens and structural parts. Int. J. Fatigue 2020, 131, 105289. [Google Scholar] [CrossRef]
  49. Wang, Y.; Emerson, M.J.; Conradsen, K.; Dahl, A.B.; Dahl, V.A.; Maire, E.; Withers, P.J. Evolution of fibre deflection leading to kink-band formation in unidirectional glass fibre/epoxy composite under axial compression. Compos. Sci. Technol. 2021, 213, 108929. [Google Scholar] [CrossRef]
  50. Javaid, U.; Ling, C.; Cardiff, P. Mechanical performance of carbon-glass hybrid composite joints in quasi-static tension and tension-tension fatigue. Eng. Fail. Anal. 2020, 116, 104730. [Google Scholar] [CrossRef]
Figure 1. Fracture behaviour under cyclic loading of CFRP and CFRP-Veil, where the red lines represent crack propagation within the composite laminate. Phase I, inter fibre failure (IFF); Phase II delamination (DEL); Phase III fibre failure (FF).
Jcs 06 00270 g001
Figure 2. Three-point bending set up for cyclic loading of CFRP, GFRP, and hybrids.
Jcs 06 00270 g002
Figure 3. Optical microscopy of CFRP with veil to determine fibre alignment, void content in CFRF and GFRP.
Jcs 06 00270 g003
Figure 4. Kink band formation in CFRP, where α is the rotation angle of fibre and β is the kink band angle.
Jcs 06 00270 g004
Figure 5. CFRP stiffness degradation 1,000,000 cycles at 50% maximum flexural loading for 100,000 and 1 million cycles of 330 MPa cycle.
Jcs 06 00270 g005
Figure 6. Total of 50% maximum flexural loading CF tested at (A) 100,000 and 1 million cycles, and (B) CFT tested at 100,000 and 1 million cycles.
Jcs 06 00270 g006
Figure 7. Cyclic loading of CFRP and CFRP veil toughened with PA 6,6 for 100,000 cycles at 50, 70, and 90% maximum flexural strength. Designated CF and CFT for the control CFRP and veil toughened control CFRP, respectively. Samples individual loading for CF is 330 MPa, 500 MPa, and 544 MPA and CFT loaded at 390 MPa, 550 MPa, and 705 MPa.
Jcs 06 00270 g007
Figure 8. (A) CF and (B) CFT fibre failure evaluation from loading conditions 50, 70, and 90%.
Jcs 06 00270 g008aJcs 06 00270 g008b
Figure 9. Glass fibre at 50% flexural strength cyclic loading. Samples designated GF and GFT, cycled for 100,000 cycles at 400 N loading for 100,000 and 1 million cycles.
Jcs 06 00270 g009
Figure 10. Optical analysis of GFRP after at 50% maximum flexural loading for (A) GF for 100,000 cycles and after 1 million cycles (B) GFT for 100,000 cycles and after 1 million cycles.
Jcs 06 00270 g010
Figure 11. Optical imaging of glass fibre at 70% maximum loading: (A) GF after 4000 and 100,000 cyles and (B) veil toughened GFT after 4000 cycles and 100,000 cycles.
Jcs 06 00270 g011
Figure 12. Flexural moduli change after 4000 and 100,000 cycles for GF and GFT loaded at 70% maximum flexural loading.
Jcs 06 00270 g012
Figure 13. Glass fibre samples tested under cyclic loading at 50, 70, and 90% of their maximum loading. For GF the maximum flexural strength for each percentage was 260, 360, and 600 MPa, respectively.
Jcs 06 00270 g013
Figure 14. (A) GF and (B) GFT fibre failure evaluation from loading conditions.
Jcs 06 00270 g014
Figure 15. Hybrid fibre at 50% flexural strength cyclic loading. HF and HFT under cyclic 3 point bending for 100,000 and 1,000,000 cycles.
Jcs 06 00270 g015
Figure 16. Optical images of hybrid carbon and glass fibre after three-point bending at 50% maximum flexural strength for: (A) HF after 100,000 and 1,000,000 cycles; (B) HFT 100,000 and 1,000,000 cycles.
Jcs 06 00270 g016
Figure 17. Modulus drop for hybrid HF and HFT composites after 4000 and 100,000 cycles at 70% maximum flexural strength.
Jcs 06 00270 g017
Figure 18. Hybrid fibre reinforced plastic cycled at 70% maximum flexural loading under SEM imaging to image glass fibres for HF after (A) 4000 cycles and HFT after (B) 4000.
Jcs 06 00270 g018
Figure 19. Cyclic loading of HFRP under 50, 70, and 90% loading in three-point bending for (A) HF and (B) HFT.
Jcs 06 00270 g019aJcs 06 00270 g019b
Figure 20. Cyclic loading of hybrid and veil toughened hybrid with PA 6,6 for 100,000 cycles at 50, 70, and 90% maximum flexural strength. Samples individual loading for HF is 240, 365, and 450 MPA and HFT loaded at 245, 380, and 450 MPa.
Jcs 06 00270 g020
Figure 21. PA 6,6 nanofibre crack bridging in HFT and CFT.
Jcs 06 00270 g021
Figure 22. Number of cycles, compared with the modulus of CFRP, GFRP, and HFRP and their veil toughened counterparts.
Jcs 06 00270 g022
Figure 23. Rubber toughened CFRP after 100,000, with 1,000,000 cycles at 470 N flexural modulus loss graph.
Jcs 06 00270 g023
Figure 24. Stress and cycles of CFRP-R at 700 N and comparison to veil and control CFRP microscopy of failure area.
Jcs 06 00270 g024aJcs 06 00270 g024b
Figure 25. Microscopy of the (A) CFRP-R and (B) CF samples to determine cross-stitching compression.
Jcs 06 00270 g025
Table 1. Curing cycle of carbon fibre glass fibre and hybrid fibre in compression moulding.
Curing CycleTemperaturePreheat (Seconds)Degassing (Seconds)Full Pressed (Seconds)Cooling (Seconds)
1100 °C30305400
2130 °C600540300
Table 2. CFRP and GFRP composite flexural strength, including hybrid CFRP/GFRP of 1:3 FVF ratio or 1:1 ply ratio, denoted as HF, where C denotes carbon fibre ply G denotes glass fibre and T denotes PA 6,6 veil interlayer.
Sample NameFlexural Strength
(MPa)
Flexural Modulus
(GPa)
CF (CCCCCC)950.5564.09
CFT (CTCTCTCTCTC)995.8569.85
GF (GGG)856.2743.89
GFT (GTGTG)797.1841.57
HF (CCGG)495.8342.40
HFT (CCTGG)547.0953.99
Table 3. Flexural loading for cyclic testing in N. With carbon fibre ply’s labelled with C and glass fibre ply’s labelled G the inclusion of veil toughening is labelled with a T.
Sample Name90% Maximum Loading (N)70% Maximum Loading (N)50% Maximum Loading (N)
CF (CCCCCC)600500330
CFT (CTCTCTCTCTC)700550390
GF (GGG)600360200
GFT (GTGTG)600360200
HF (CCGG)450380240
HFT (CCTGG)450380240
Table 4. Load case and number of cycles.
Load Case Scenario 4000 Cycles100,000
Cycles
100,000,000
Cycles
50% maximum flexural strength 5 Hz5 Hz5 Hz
70% maximum flexural strength5 Hz5 Hz
90% maximum flexural strength5 Hz5 Hz
Publisher’s Note: MDPI stays neutral with regard to jurisdictional claims in published maps and institutional affiliations.

