1. Introduction
Many modern technologies require materials that have combined properties that cannot be found in classic metal alloys and ceramic or polymeric materials. This is especially true for systems designed for aerospace, submarine, and transportation applications. The combinations of different properties and the range of materials has been and is still growing due to the introduction of composite systems. Many sectors of science and technology are addressed to the study and application of materials of different nature to be used as anticorrosive coatings. Of interest is the application of graphene as a nano additive. Added to plastics or composite materials, it makes them more resistant and electrically conductive. Composite materials already exist that exploit carbon or glass fibers for these purposes, but the use of graphene allows these results to be achieved with minimal amounts of material. The nanostructure’s high surface area allows it to maximize interaction with the surrounding material. The fascinating properties of graphene have driven scientific and technological research to develop more and more techniques aimed at its industrial production. Unfortunately, the preparation of single graphene layers requires long times and not negligible costs. We are looking for cheaper graphene structures and with less time for realization but that which maintain the chemical, physical, and chemical–physical characteristics of graphene.
A very interesting innovative material are the graphene nanoplatelets or GNPs that consist of small systems of overlapping graphene single planes. GNPs can be prepared in several ways. One technique is based on the use of graphite with intercalated chemical compounds [
1,
2,
3]. The intercalating chemicals are generally sulfates and nitrates that specifically arrange themselves between the sp2 carbon planes. When this material is subjected to thermal shocks of the order of thousands of degrees Kelvin, the intercalated substances vaporize, causing the layers to move away, forming graphene nanoplates [
4,
5,
6,
7]. The formation of sulfate and nitrate vapors creates a change in the dielectric constant of the atmosphere and sparks are formed: an electric arc has occurred. After microwave treatment, the graphene structures appear under an SEM microscope with a typical structure called worm-like. With simple techniques such as sonication or with an ultrasonic bath, the GNP flakes are obtained dispersed and not in the form of agglomerates [
8,
9,
10,
11].
The lateral dimensions of the GNP obtained by this method range from 2 to 10 µm and have a thickness between 2 and 9 nm, which corresponds to a number of graphene layers ranging from 4 to about 11, [
12,
13,
14,
15]. GNPs are among the carbon nanostructures that are most widely used as fillers in composite materials to reinforce or add properties to the matrix. In fact, by dosing their quantity and calculating parameters such as the percolation threshold, it is possible to obtain conductive materials that have excellent mechanical, thermal, or strength properties. Countless other applications are possible given the very similar properties to graphene that they possess—among these is their use in electronic devices [
8,
11].
Generally, composites consist of two phases: the matrix and the dispersed phase. The final result is a function of the properties of the constituents, their quantity, and the geometry of the dispersed phase. The matrix is the component present in a greater quantity and supports the other phase, it is continuous and isotropic. Depending on the final application of the composite, different types of matrices are used: polymeric, metallic, or ceramic. The dispersed phase, or filler, is represented by the reinforcing components, which increase and/or modify the characteristics of the matrix. These can also be of various types from fibers to particles [
16]. To the mixture of polymers making up the resin, a cross-linking agent or hardener is added, which is usually represented by an amine. This must at least possess two reactive sites to allow crosslinking. The curing agent chemically combines with the resin and leads to the formation of the crosslink. The crosslinking density of the final product depends on the percentage and nature of the curing agent. Amines are very well suited for this role as they allow a rapid curing process, even at room temperature in about one to two hours. The final product has excellent properties of resistance to chemicals and solvents, thermal and electrical stability. These properties are enhanced if the material is subjected to further curing at elevated temperatures [
17].
The field of nanocomposites can take more avenues, due to the incredible properties of these materials, such as flame resistance, electro-optical properties, ability to act as a barrier and reinforcement, bactericidal functionalities, or use in cosmetic applications. In this new field of research, polymer nanocomposites represent a new class of materials with great potential. The nanometric dimensions of the filler allow to reach a high degree of dispersion of the latter in the matrix and this translates into optical, electrical, mechanical, and chemico–physical properties much more pronounced compared to classical composites. A further aspect to be emphasized, dependent on the size of the dispersed phase, is the amount of filler required. By adding a very low percentage amount of reinforcement (less than 1–2%) to the polymer matrix, improved chemical and physical properties can be observed. Unfortunately, the deterioration process cannot be completely prevented and, therefore, corrosion control strategies focus on slowing down the kinetics and/or its mechanism [
18].
Of particular interest are systems that exploit graphene and derivatives as fillers, epoxy resins as a matrix, or both. The nanofiller has been proven to improve the barrier properties of the system and reduce the absorption of water and solutes. This is because the infiltrating molecules are deflected by the impermeable fillers that increase the tortuosity of their path and delay diffusion [
19]. Polymer composites consisting of epoxy resin and GNP exhibit greater resistance to diffusion of liquid or solute molecules within them than systems consisting of pure epoxy resin [
20]. It has also been verified that the concentration of nanofiller dispersed in the matrix affects its characteristics. In particular, when the percentage of filler increases, the uptake of aqueous solutions decreases. This behavior is well explained by the barrier effect that the nanostructures exert by increasing the tortuosity of the diffusion direction of the liquid molecules [
21]. More in-depth studies have associated the great performance of epoxy resin/GNP composites with hydrophobicity characteristics that mimic biological systems [
18]. In such composites, associated with the hydrophobicity of the bio-mimetic surface, the behavior of the resin acting as a physical coating to the substrate and the presence of graphene compounds to retard diffusion remains crucial.
More recently the improvements by graphene on physical properties of epoxy at extremely small loading when incorporated appropriately, along with the structure, preparation and properties of epoxy/graphene nanocomposites have been reviewed, focusing on the processing methods and mechanical, electrical, thermal, and fire-retardant properties of the nanocomposites [
22]. Moreover, a facile, green, and novel approach to prepare epoxy/graphene nanocomposites, involving microwaving a commercial graphene precursor and mechanically stirring to produce graphene platelets in a hot, liquid-state epoxy resin, eliminating the need for organic solvents and surfactants, was presented last year [
23]. This work allowed one to show that the use of microwave radiation yields an environmentally sustainable, low-cost, and simple method for the development of polymer nanocomposites containing exfoliated and well-dispersed graphene platelets. Last, but not least, recent advances and trends of nanofilled/nanostructured epoxies have been the subject of an extensive review of the works published in the period 2016–2020 on polymer nanocomposites based on epoxy resins, with special reference to the dispersion and functionalization of different nanofillers, including nanoparticles, nanotubes, as well as organic–inorganic hybrid materials [
24].
Deterioration is expressed differently for different materials. In the case of metals, we speak of corrosion, which is generally electrolytic in nature and begins on the surface of the metal. For polymers, however, it is more appropriate to define the process of damage as a degradation. This phenomenon is generated when the polymeric material comes into contact with the external environment and is different from the corrosion that can occur on a metal surface. A wide variety of reactions with negative consequences can happen to the polymer. In most cases, a polymer compound will degrade by dissolution in a solvent, swelling, or breaking of covalent bonds as a result of chemical reactions, exposure to heat, or radiation. As a general rule, the greater the similarity in chemical structure between the solvent and the polymer, the greater the likelihood of witnessing dissolution of the latter.
Swelling refers to the process of swelling of the material due to diffusion within the compound of a liquid or solute. The small molecules of the solute infiltrate and occupy positions between the polymer chains, leading to a pulling away of the macromolecules. This process causes the sample to expand and swell. As a result, intermolecular secondary forces weaken and the material becomes softer and more ductile. The diffusion process is identified as a transport phenomenon since it is generally dependent on the passage of particles from a higher concentration zone to a less concentrated one. Temperature or radiation can also affect damage to a material.
Corrosive environments include the atmosphere, aqueous solutions, soils, acids, bases, organic solvents, molten salts, liquid metals, and even the human body. Atmospheric corrosion is the phenomenon that leads to the most damage and loss. Moisture contains dissolved oxygen, which is one of the primary corrosive agents, followed by sulfur compounds and chlorine salts. This is particularly noticeable in marine atmospheres rich in sodium chloride and for devices directly exposed to seawater that contains an average of 3.5% salt (predominantly sodium chloride). In industrial environments, dilute sulfuric acid solutions from acid rain can cause serious corrosion problems. Acid rain results from the emission of sulfur dioxide (SO2) and nitrogen oxides (NOx) into the atmosphere. These react primarily with water and oxygen to produce sulfuric and nitric acids, resulting in acid rain. The main sources of SO2 and NOx are refineries, industries, motor vehicles, power generators, and only to a small extent these oxides come from natural sources such as volcanoes.
This work aims to study the behavior of composites consisting of epoxy resin and different concentrations of GNPs subjected to aging by chemical agents, such as sulfuric acid and potassium chloride, in order to test the additional protection against the attack of such chemical agents, provided by the addition of the carbonaceous nanofiller in the composite material. This paper is organized as follows. In
Section 1, a quick overview of the properties and characteristics of GNP is given. This is followed by a description of classical composite materials, which aims at defining structural characteristics and advantages that they can offer in the different technological applications, in particular when nanostructured materials are used as reinforcements.
Section 2 contains an exposition of the techniques, tools, and materials used in the preparation and characterization of graphene epoxy/nanoplate nanocomposites. The third section describes the thin film preparation methods, including the mechanism of curing the resin with an amine hardener. In the last section, the results obtained from the various analyses on pure resin thin films and Epoxy/GNP composite thin films are discussed.
2. Materials and Methods
2.1. Materials
One of the main prerogatives of a composite material lies in the good dispersion of the filler in the matrix, a necessary requirement to maximize the interaction between the two phases. At a practical level, a good level of dispersion of the graphenic filler in the epoxy matrix was obtained in this work through the combined action of centrifugation and sonication techniques. The second phase of the preparation is dedicated to the deposition of the composites in the form of thin films and the spin-coating technique is used.
For the dispersion and homogenization of Graphene Nanoplates fillers in the epoxy resin matrix, we used a Planetary Centrifugal Vacuum Mixer -THINKY MIXER ARV-310, which, unlike a classic centrifuge, uses, for the homogenization of samples, the combined action of two motions. The first is a rotation around the axis passing through the base of the container where the sample is placed. The second is a revolution whose reference axis is the one passing through the center of the mixing chamber. Rotation and revolution occur at reduced pressure. Vacuum leads to the elimination of air bubbles entrained in the sample at the microscopic level, which is particularly useful for high viscosity materials.
In the liquid used, i.e., epoxy resin, it would be difficult to disperse the GNPs given its viscosity. In the present case, the sonication, in addition to the dispersion of the filler, favors the separation of the graphene layers of GNPs and the disintegration of any clusters. The dispersion obtained is excellent and allows the preparation of composites with good electrical, mechanical, and chemical properties.
After homogenizing the two phases and dispersing the graphene filler, the curing agent is added to the solution and deposition is performed. The deposition method used is spin-coating. The final film thickness depends on various factors such as the viscosity of the resin, the nature of the substrate, the spin velocity, and the acceleration. In particular, the spin speed plays a key role in the process and can range from a few hundred up to 12,000 rpm. One of the advantages of using spin-coating in the preparation of thin films is the repeatability of the method. In fact, by controlling all the variables that occur during production, the final thickness of the thin film can be easily predicted.
The analysis techniques chosen to follow the behavior of the samples during aging aim to identify if the diffusion of the corrosive solution inside the film takes place, if there are structural changes in the polymer chain of the epoxy matrix and if aging has relevant surface effects. With infrared analysis knowing the frequencies, one can identify functional groups (group frequencies) and specific compounds using correlation tables. IR spectroscopy is rarely used as a quantitative analysis due to the difficulty in sample preparation and the complexity of the spectrum. In this work, we will use IR spectroscopy to determine if diffusion of the corrosive solution occurs in the area below the surface. In particular, the possible appearance of the O-H bond stretching signal of water falling between about 3700 and 3000 cm−1 will be studied. An analysis of the bands at low wave numbers will be conducted to detect any changes in the chain or signals of interest. The instrument used is a Cary Agilent 630.
In this work, one of the main reasons of interest towards the use of Raman spectroscopy lies in the fact that it allows to identify and characterize graphene samples, impossible with infrared spectroscopy as they do not present dipole moment variations. The investigation of data collected by Raman spectroscopy will also be useful to visualize any changes in the polymer chain of the epoxy resin as a result of attack by corrosive chemicals. The Raman spectrometer used is the In-Via Renishaw equipped with a 633 nm laser and Leika confocal optical microscope.
The samples studied in this work are analyzed using scanning electron microscopy (SEM). After exposure to the primary electron beam, the secondary electrons emitted from the surface of the sample are recorded and an image with good resolution is obtained, which provides an instantaneous mapping of the probed area. In addition, with the X-ray study, scanning electron microscopy can also be used to perform elemental analysis. The SEM survey has proven particularly useful to us, for exploring the surface of the samples after aging and seeing how corrosion has changed that area. The SEM used in this work is a Tescan VEGAII series medium chamber, thermionic source, and in which the position of the beam is controlled automatically. The microscope is also equipped with a Bruker microanalysis, XFlash 5010 sensor with a resolution of 123 eV.
The epoxy resin used for the preparation of composites is the Epikote 828 commercially obtained by the reaction between Epichlorohydrin and Bisphenol A. The curing agent required for polymer crosslinking is called A1 and is obtained by reacting tetraethylenpentamine and formaldehyde in a 1:1 molar ratio [
25]; for the purposes of this work, a curing agent used was prepared at INFN, National Laboratories of Frascati. The intercalated graphite from which the GNPs were obtained is marketed by Asbury. The 10% sulfuric acid solution was obtained by diluting H
2SO
4 to 98%, Sigma-Aldrich. The 3.5% potassium chloride solution was obtained by solubilizing KCl salt crystals with 99% purity, Sigma-Aldrich.
The work carried out is aimed at studying the behavior of composite materials in the form of thin films subjected to aging in a corrosive environment. In particular, Epoxy/GNP composite materials are immersed in 10% Sulfuric Acid H2SO4 and in an aqueous solution of 3.5% potassium chloride KCl. The aging study is followed from the first day the samples come into contact with the corrosive agent up to a maximum of thirty-one days. Measurements are made on the mass, infrared, and Raman spectra and investigations with the SEM. These analyses are repeated over several days, starting with the initial samples on day zero and ending with day 31. The frequency of data collection during aging was chosen higher in the first week and then decreased towards the last days because it is expected that any phenomena, which may occur between the corrosive chemicals and the samples, have a faster kinetics at the beginning of the process.
2.2. Preparation of Nanocomposites Based on Epoxy Resin and GNP
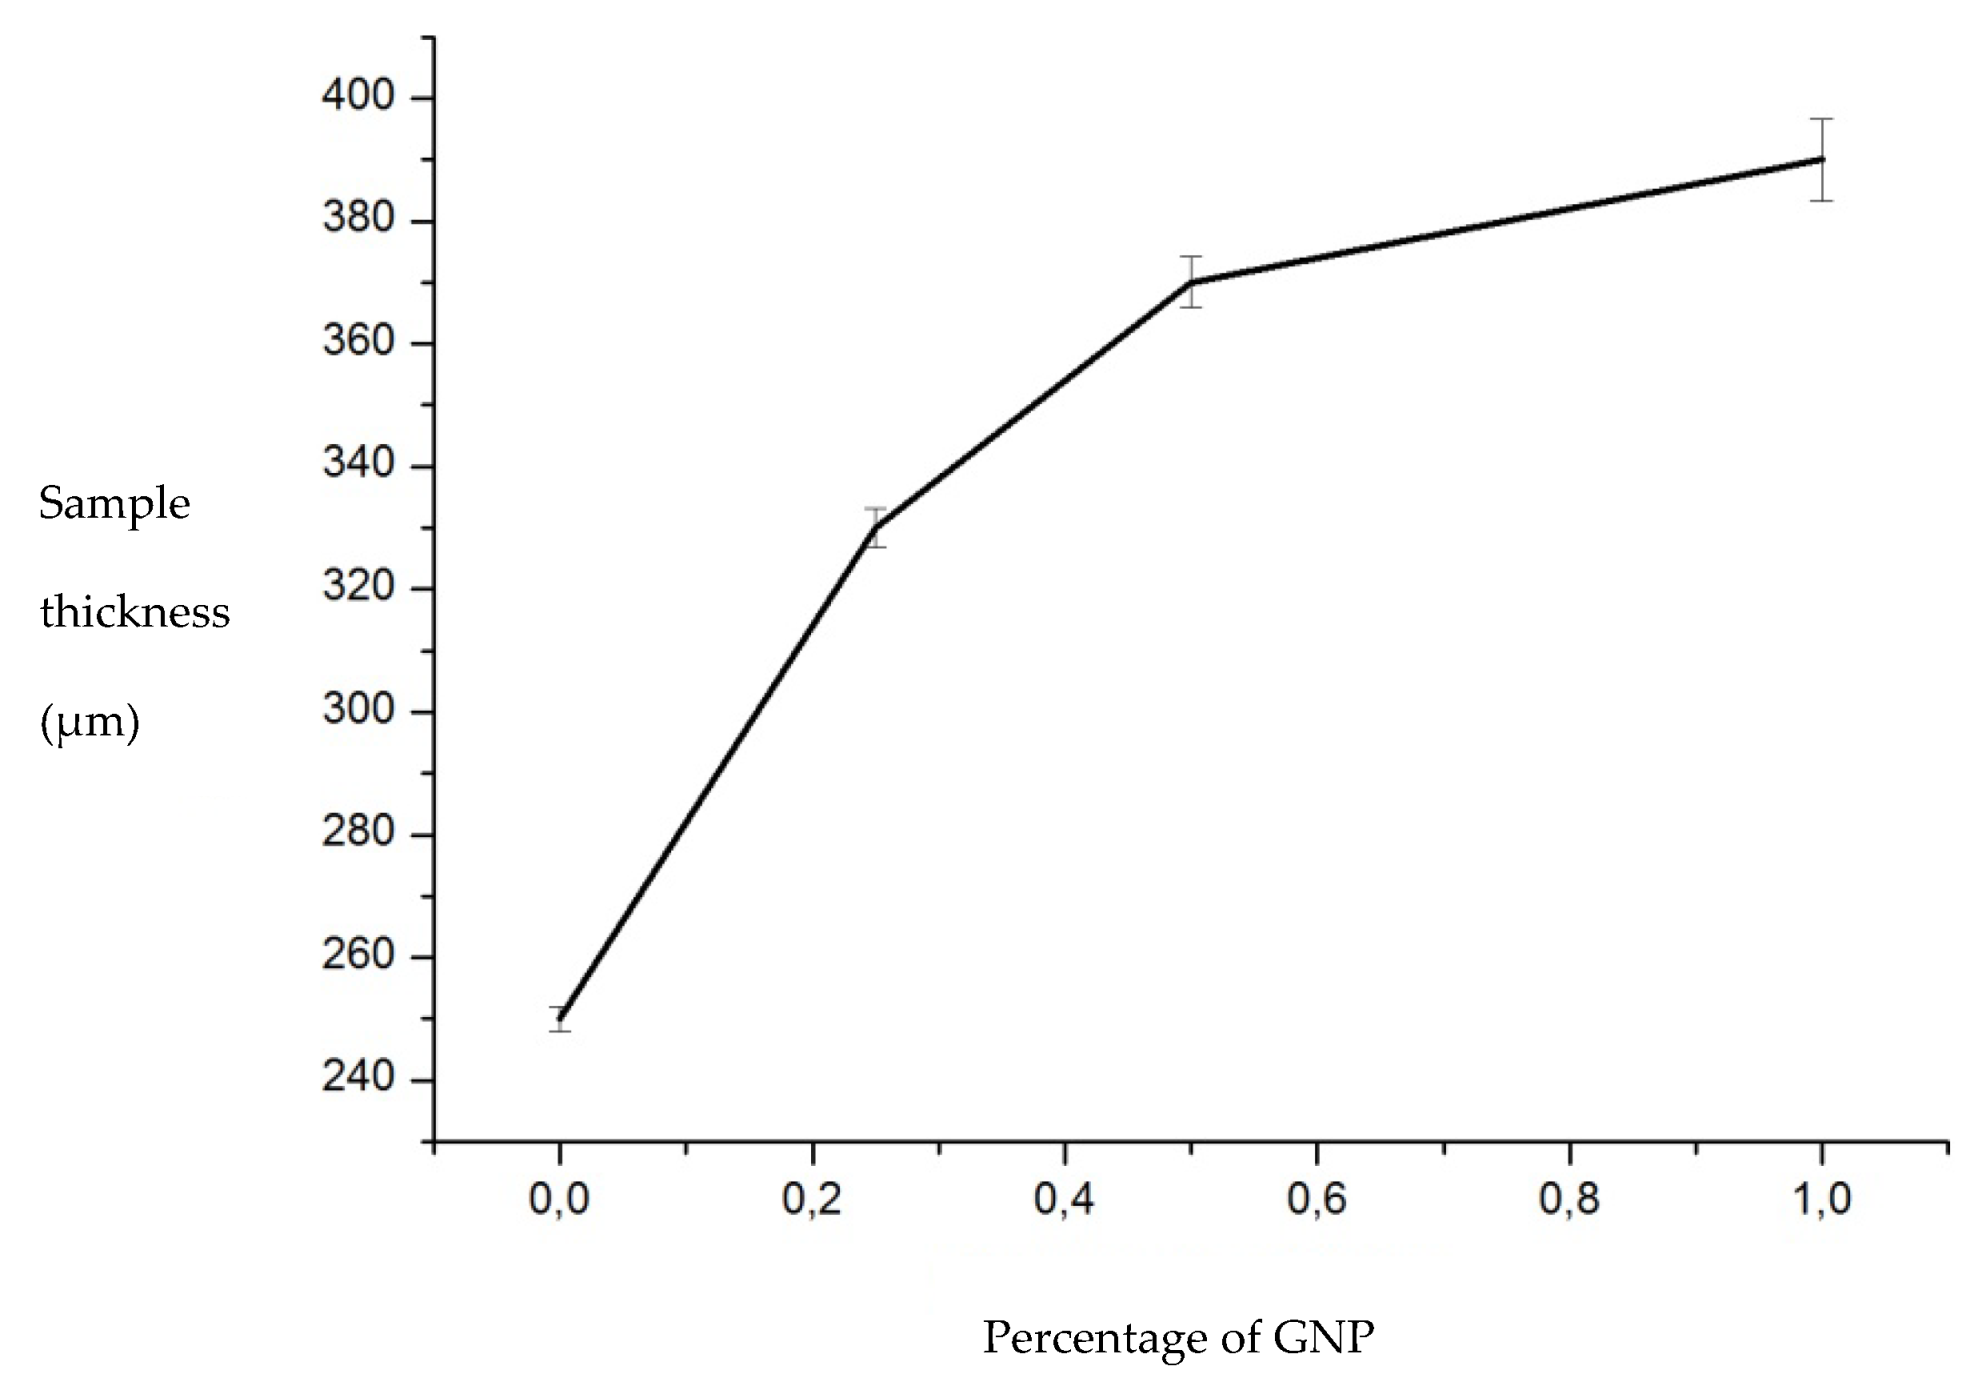
In order to understand if, and in what way, the presence of GNP influences the degradation process of the polymer matrix, several composites with different concentrations of filler are examined. The samples with percentage amounts of Graphene Nanoplates equal to 0.25%, 0.5%, and 1% are studied. At the same time, we follow the behavior of samples without the presence of GNPs, consisting only of pure epoxy resin. In addition, the thin films related to the various compositions, are prepared with different thicknesses, varying the spinning speed during deposition.
It was chosen to deposit the thin films on a glassy support. In particular, we use slides having surface of 15 mm × 15 mm and thickness varying from 0.13 mm to 0.17 mm. A drop of composite with mass equal to 0.2500 g, weighed with an analytical balance, is deposited on the slide. This drop is distributed over the entire surface of the substrate using the spin coater. The deposition takes place with 4 consecutive steps, for a total of 1 min and 6 s. The last step has a variable speed depending on the thickness of the film to be obtained. We chose to prepare films with thicknesses of about 250, 100, and 50 µm, which correspond to spin speeds of 1000, 2000, and 5000 rpm, respectively. These values refer to samples with pure resin. The thickness of the composites has variable values depending on the percentage of GNP. In fact, as the percentage increases, the thickness increases as well, since the presence of nanoplates causes an enlargement of the composite structure. The thickness trend with respect to the concentration of GNP, at the same rpm, is shown in the following graph (
Figure 1).
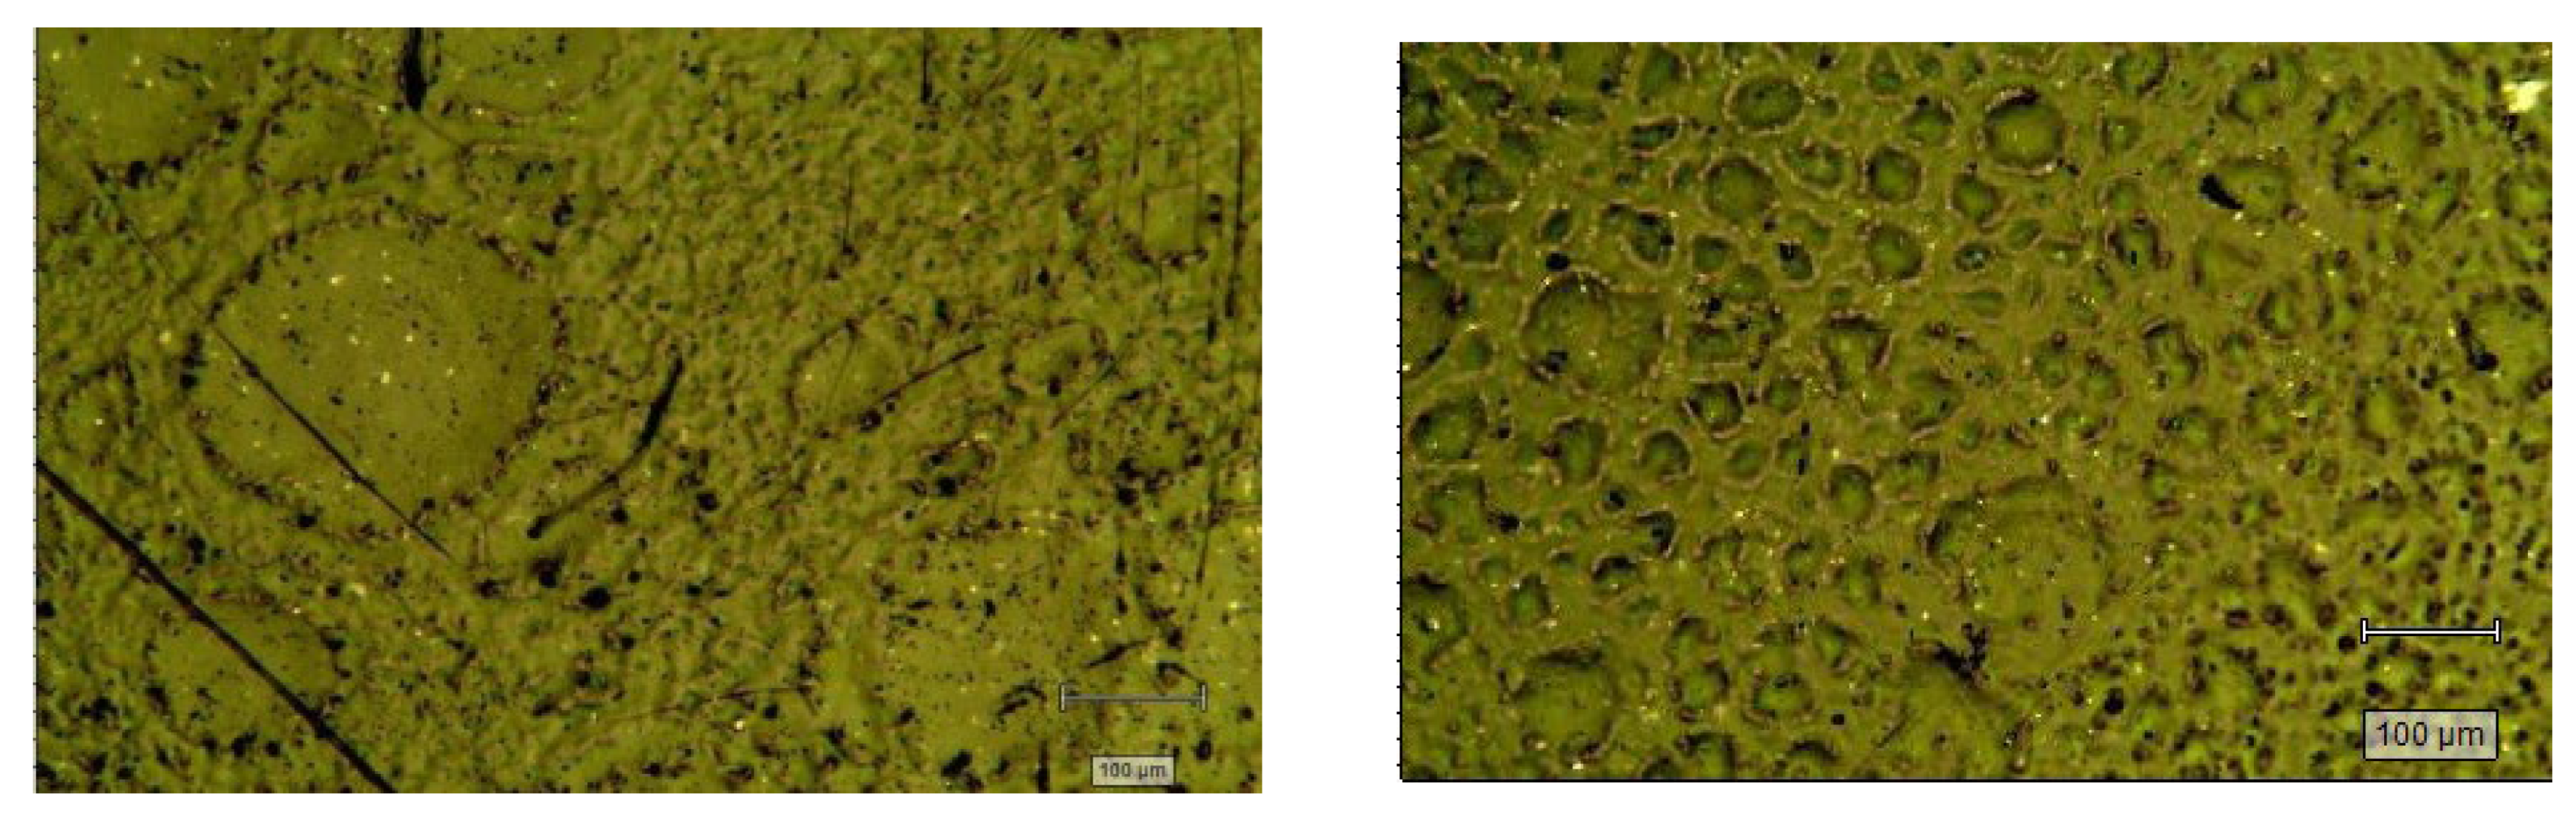
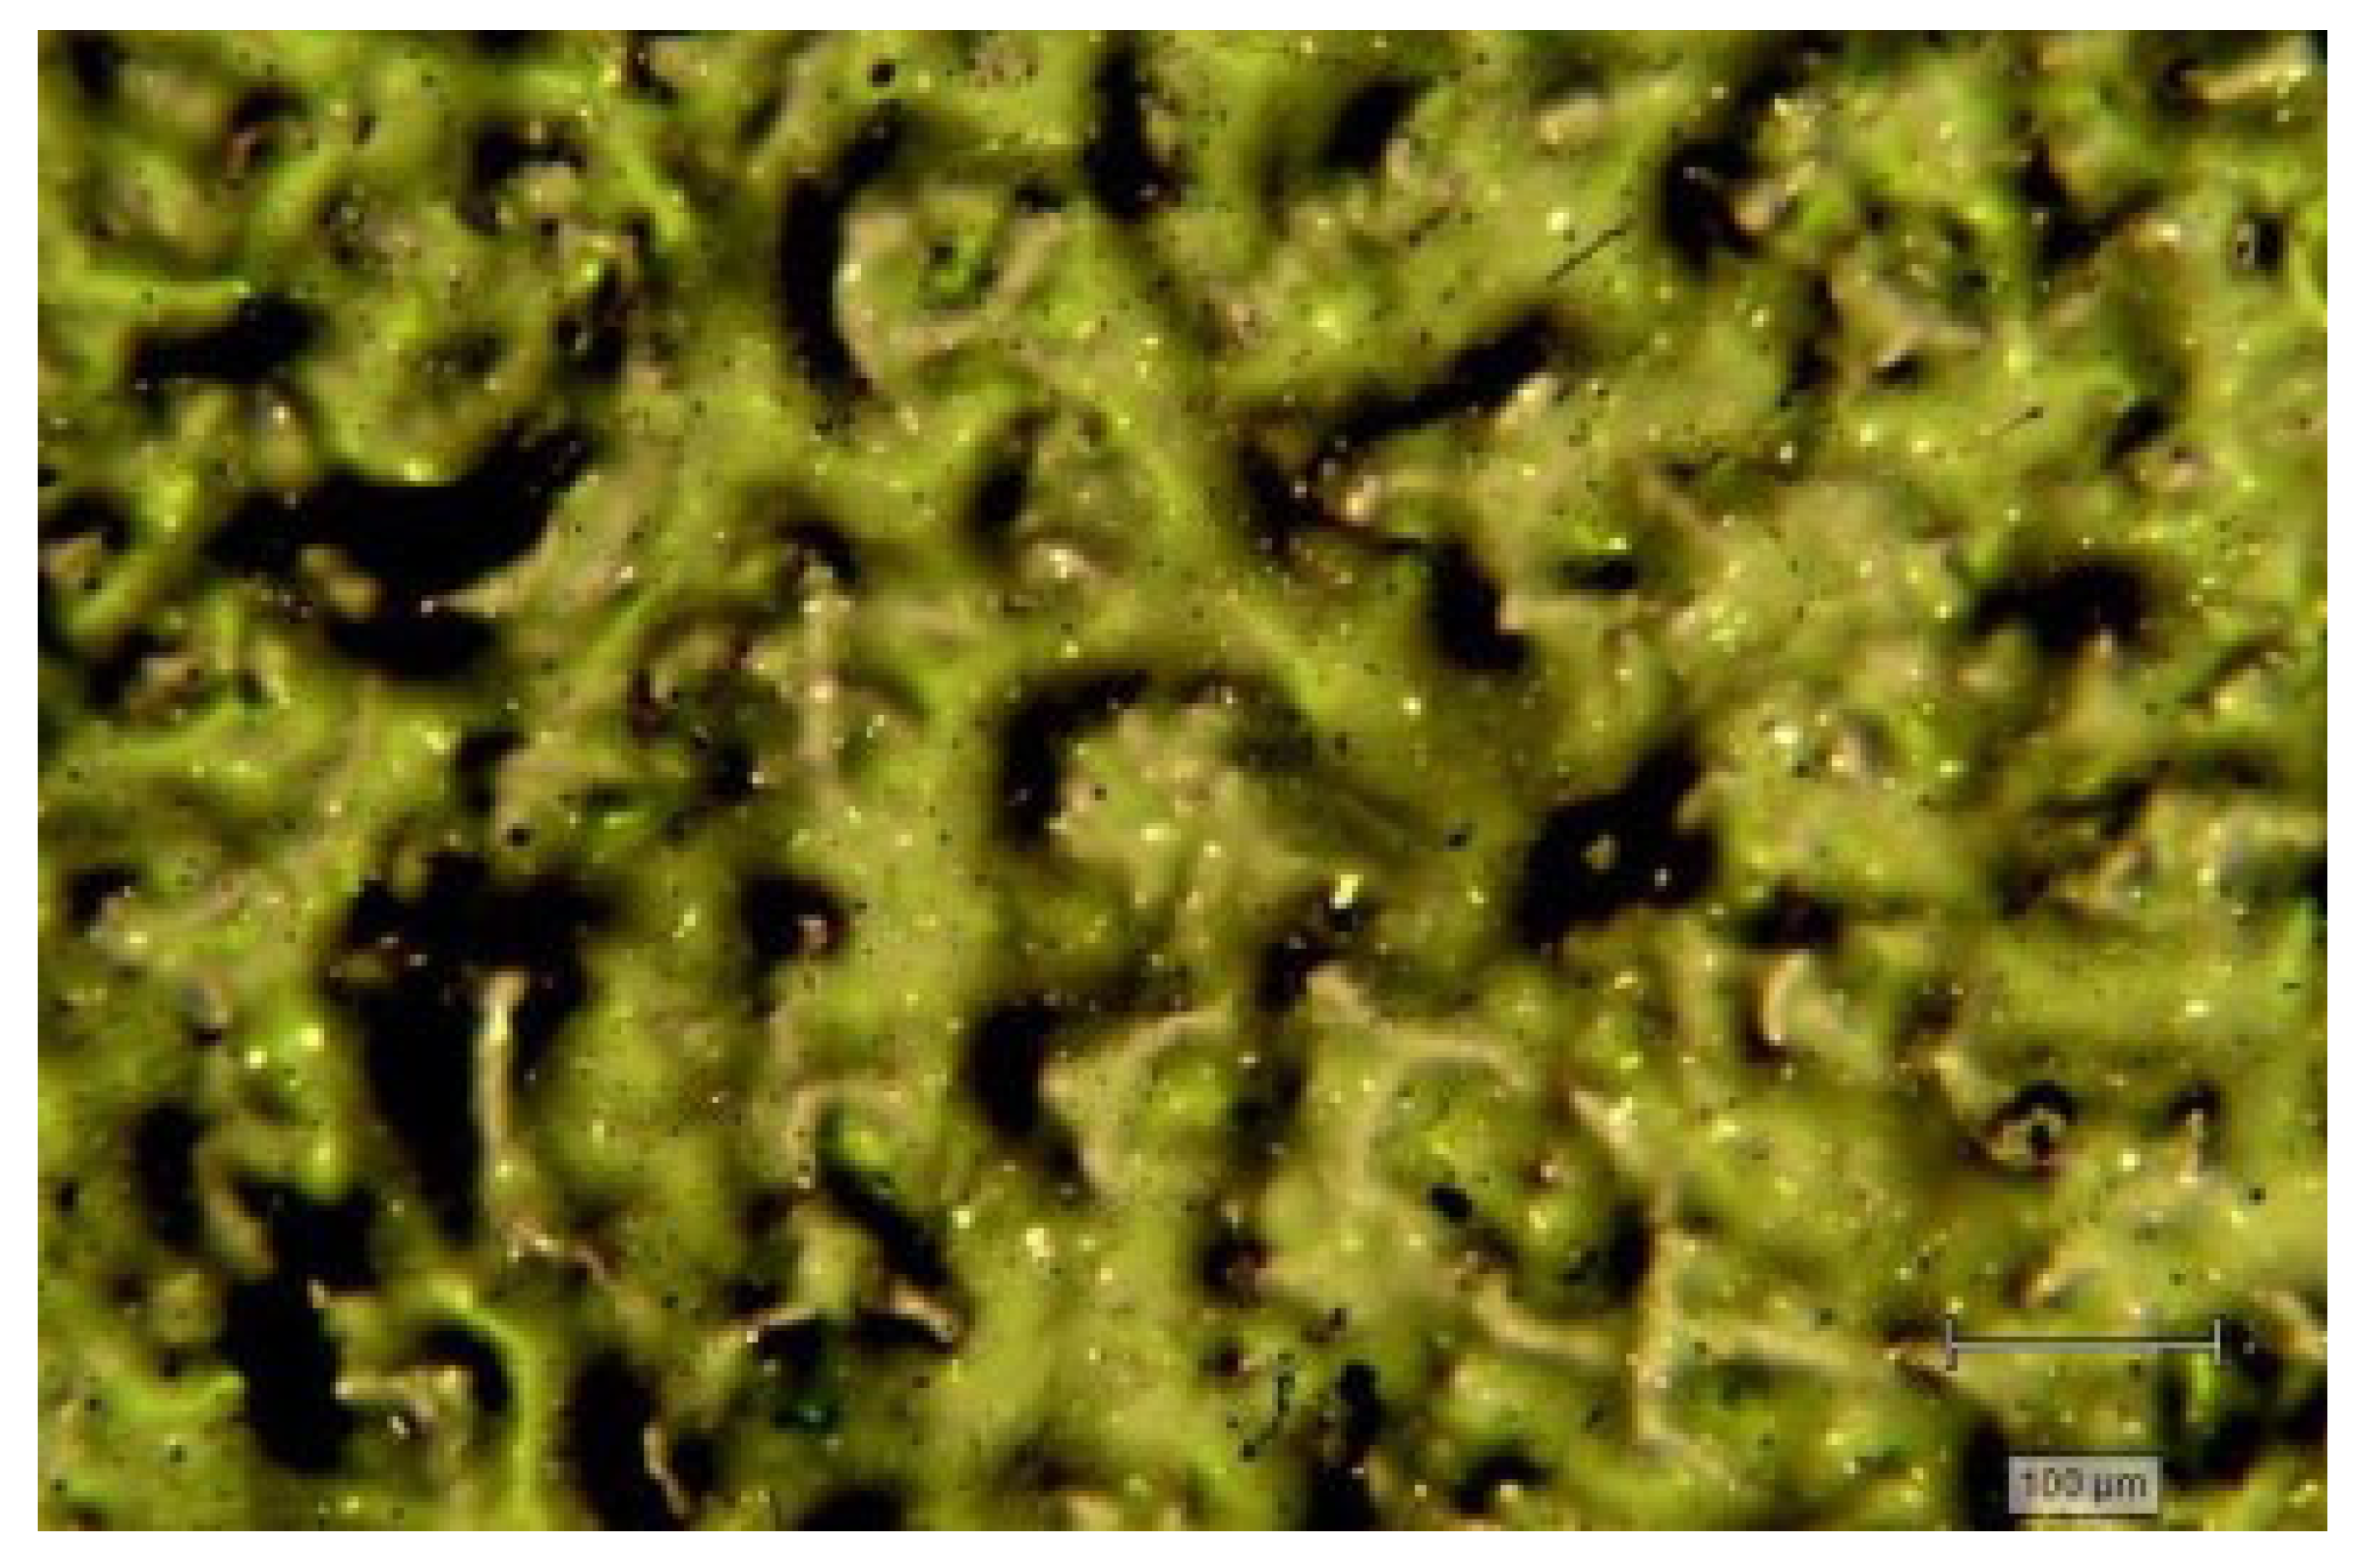
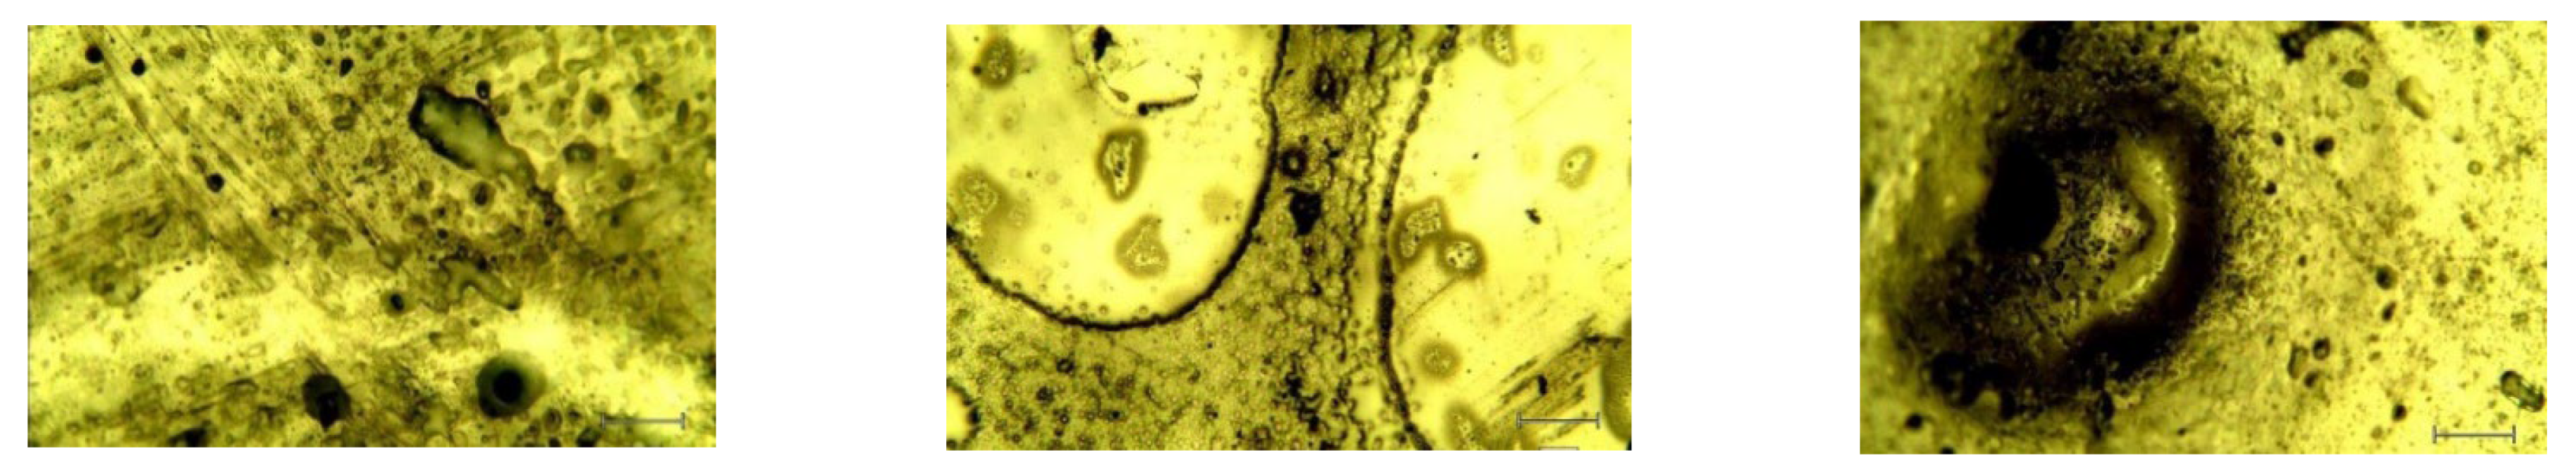
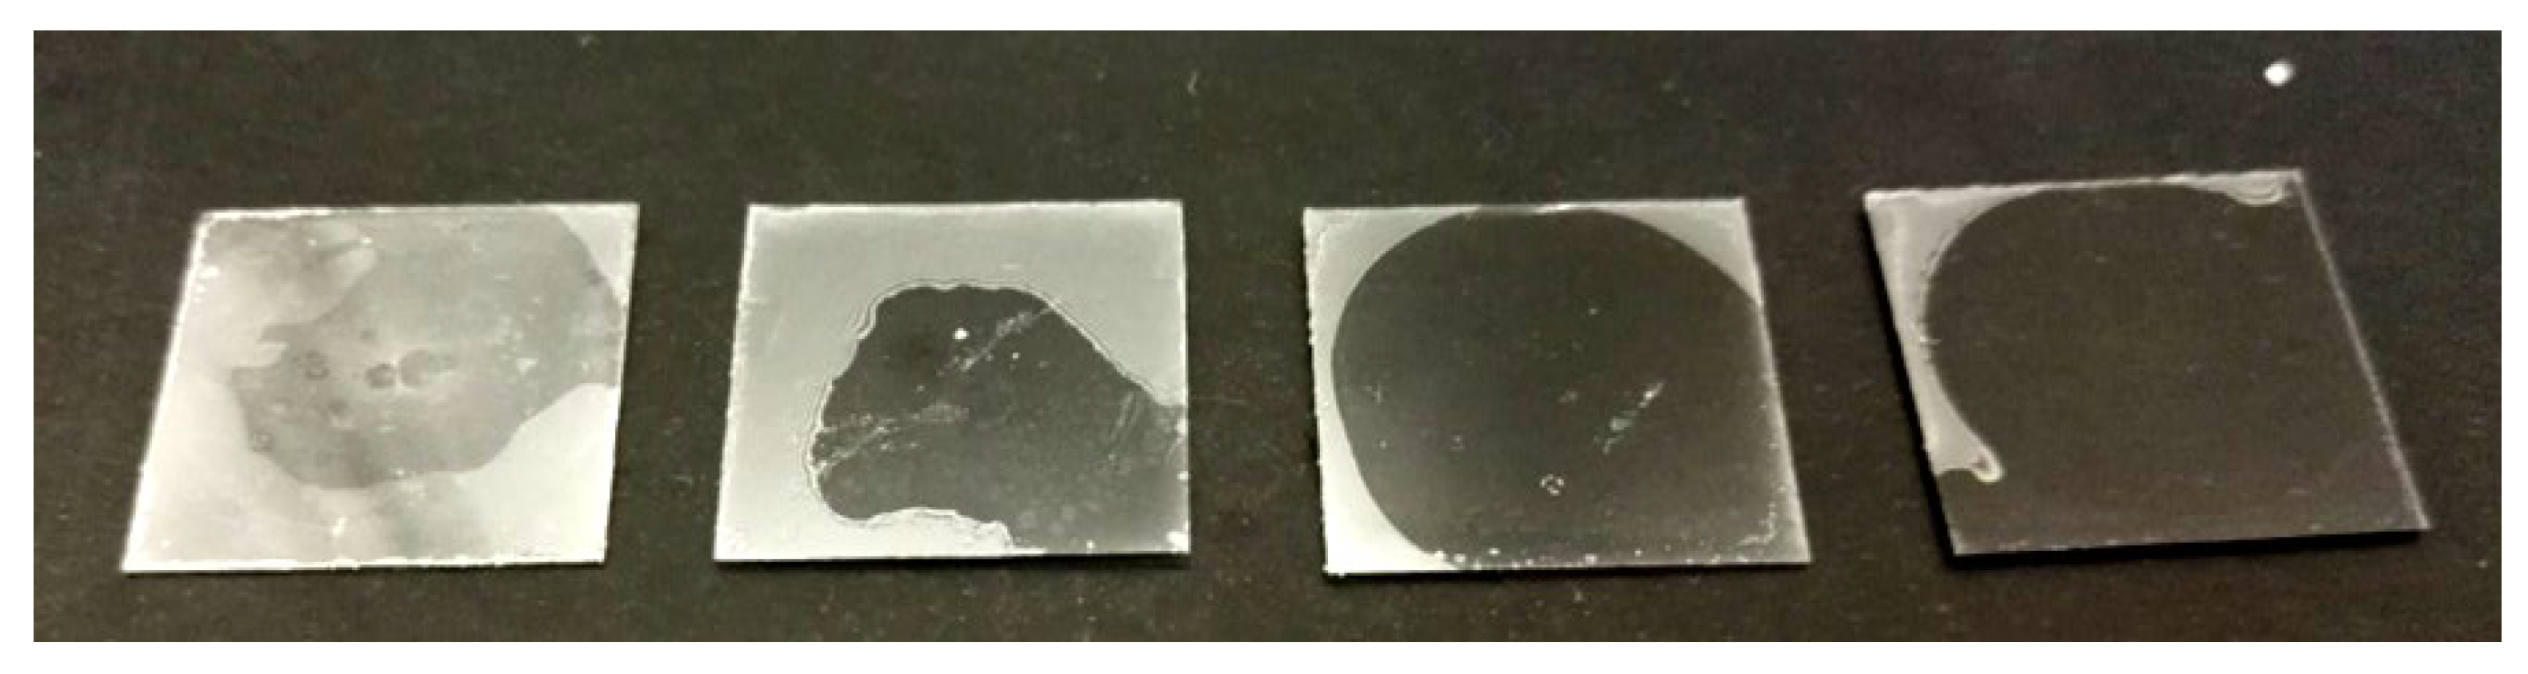
It has been noticed that the thickness variation with respect to the filler concentration decreases as the spin coater speed increases. This can be explained by thinking that, as the rotation speed increases, the centrifugal force increases, which makes the surfaces of the films more homogeneous, distributing the composite more evenly on the support. This behavior is confirmed by optical microscope images, showing an increase in the surface roughness of the samples as the GNP concentration increases (
Figure 2).
2.3. Methods
Once the composites are ready and have been deposited as thin films, they undergo treatment in an oven at 313 K for 60 min. The crosslink formation reaction begins. The nucleophilic groups of the curing agent (the nitrogen of the amine groups and the oxygen of the hydroxyl groups) attack the carbons of the epoxy groups in the polymer chains, causing the ring to open. The reaction proceeds through the attack by the terminal amine nitrogen on the epoxy ring. The hydroxyl oxygen and other nitrogen atoms in the chain act in a similar manner. After the 60 min in the oven, the composites are subsequently left at room temperature for 24 h so that the cross-linking reaction continues. After that, a final treatment is performed in a 353 K oven to complete the cross-linking process. The end result is a polymeric lattice, where the polymer chains of the epoxy resin are immobilized and interconnected by the curing agent.
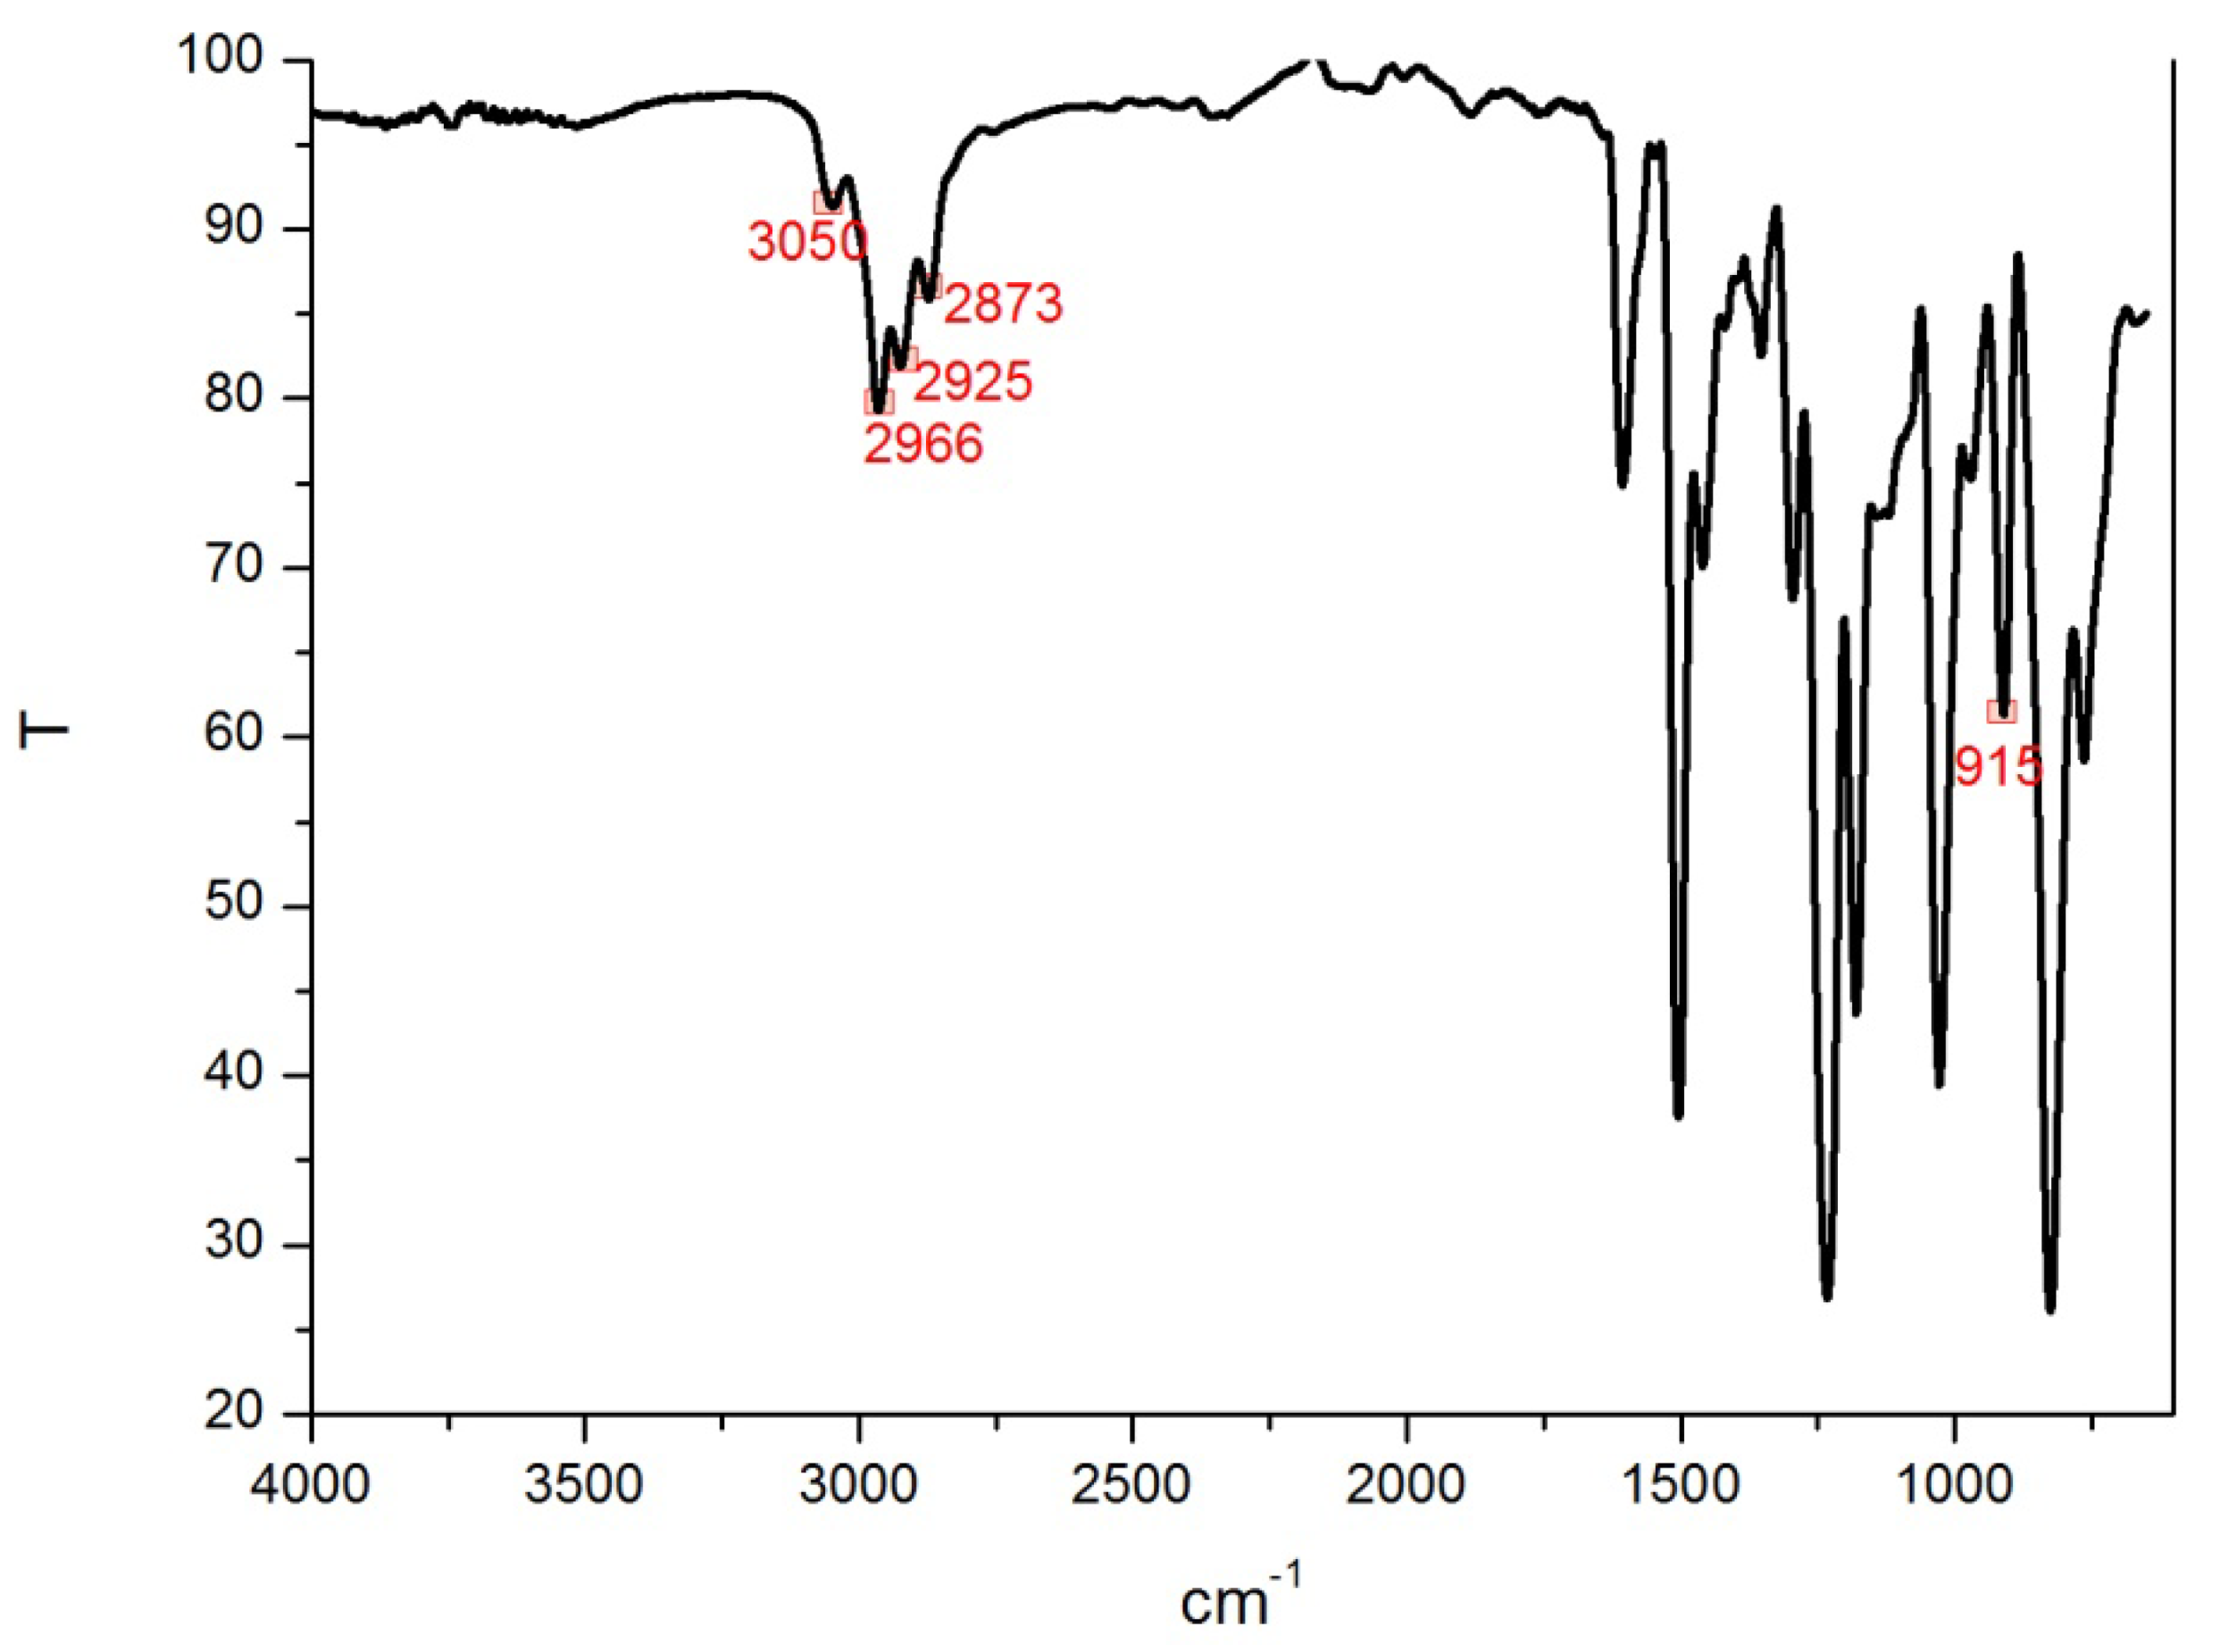
Crosslink formation is further ascertained by spectroscopic analysis of the samples by comparing the IR spectrum of the liquid epoxy resin, and that of the heat-treated samples after addition of a hardener. The spectrum of the liquid resin is shown in
Figure 3. The signal at 3050 cm
−1 related to the -CH-O-CH
2- stretching of the epoxy ring and those at 2966 and 2925 cm
−1 of the asymmetric stretching of the -CH
3- and -CH
2- bonds are identified. The symmetric stretching of these two groups has a visible peak at 2873 cm
−1. In the area between 2000 and 1500 cm
−1, there are the overtones of the C-H bonds of the aromatic ring and the signals of the stretching of C=C-H always belonging to the benzene ring. An additional interesting signal for understanding the curing process is the bending of the bond between -CH-O-CH
2- of the epoxy ring at 915 cm
−1 [
26].
We note the appearance of a peak at 1110 cm−1 that was associated with the signal of the C-N stretching. Interesting evidence is the presence of the signal at 915 cm−1 of the -CH-O-CH2- bending and at 3050 cm−1 of the -CH-O-CH2- stretching of the epoxy ring even after the curing treatment. This indicates that not all of the epoxy rings in the resin have reacted with the nucleophilic groups of the curing agent. This preparation procedure is valid for composites. The realization of samples with pure resin, is carried out with a similar procedure, but it omits the sonication, filtration, and the second treatment with the planetary mixer Thinky, i.e., all those steps of the preparation phase aimed at optimizing the dispersion of graphene filler in the polymer matrix.
The composites and resins are now ready to undergo aging. Before starting the process, weight measurements are made with an analytical balance, IR and Raman spectra are taken, and samples are studied with SEM. In particular, infrared spectroscopy will be used to conduct qualitative and semi-quantitative analyses on the presence of water and to detect any surface changes to the polymer chain that may occur during the aging period. The infrared spectrophotometer used has an IR beam with a calculated sample penetration depth in the range of 0.53 to 2.83 µm [
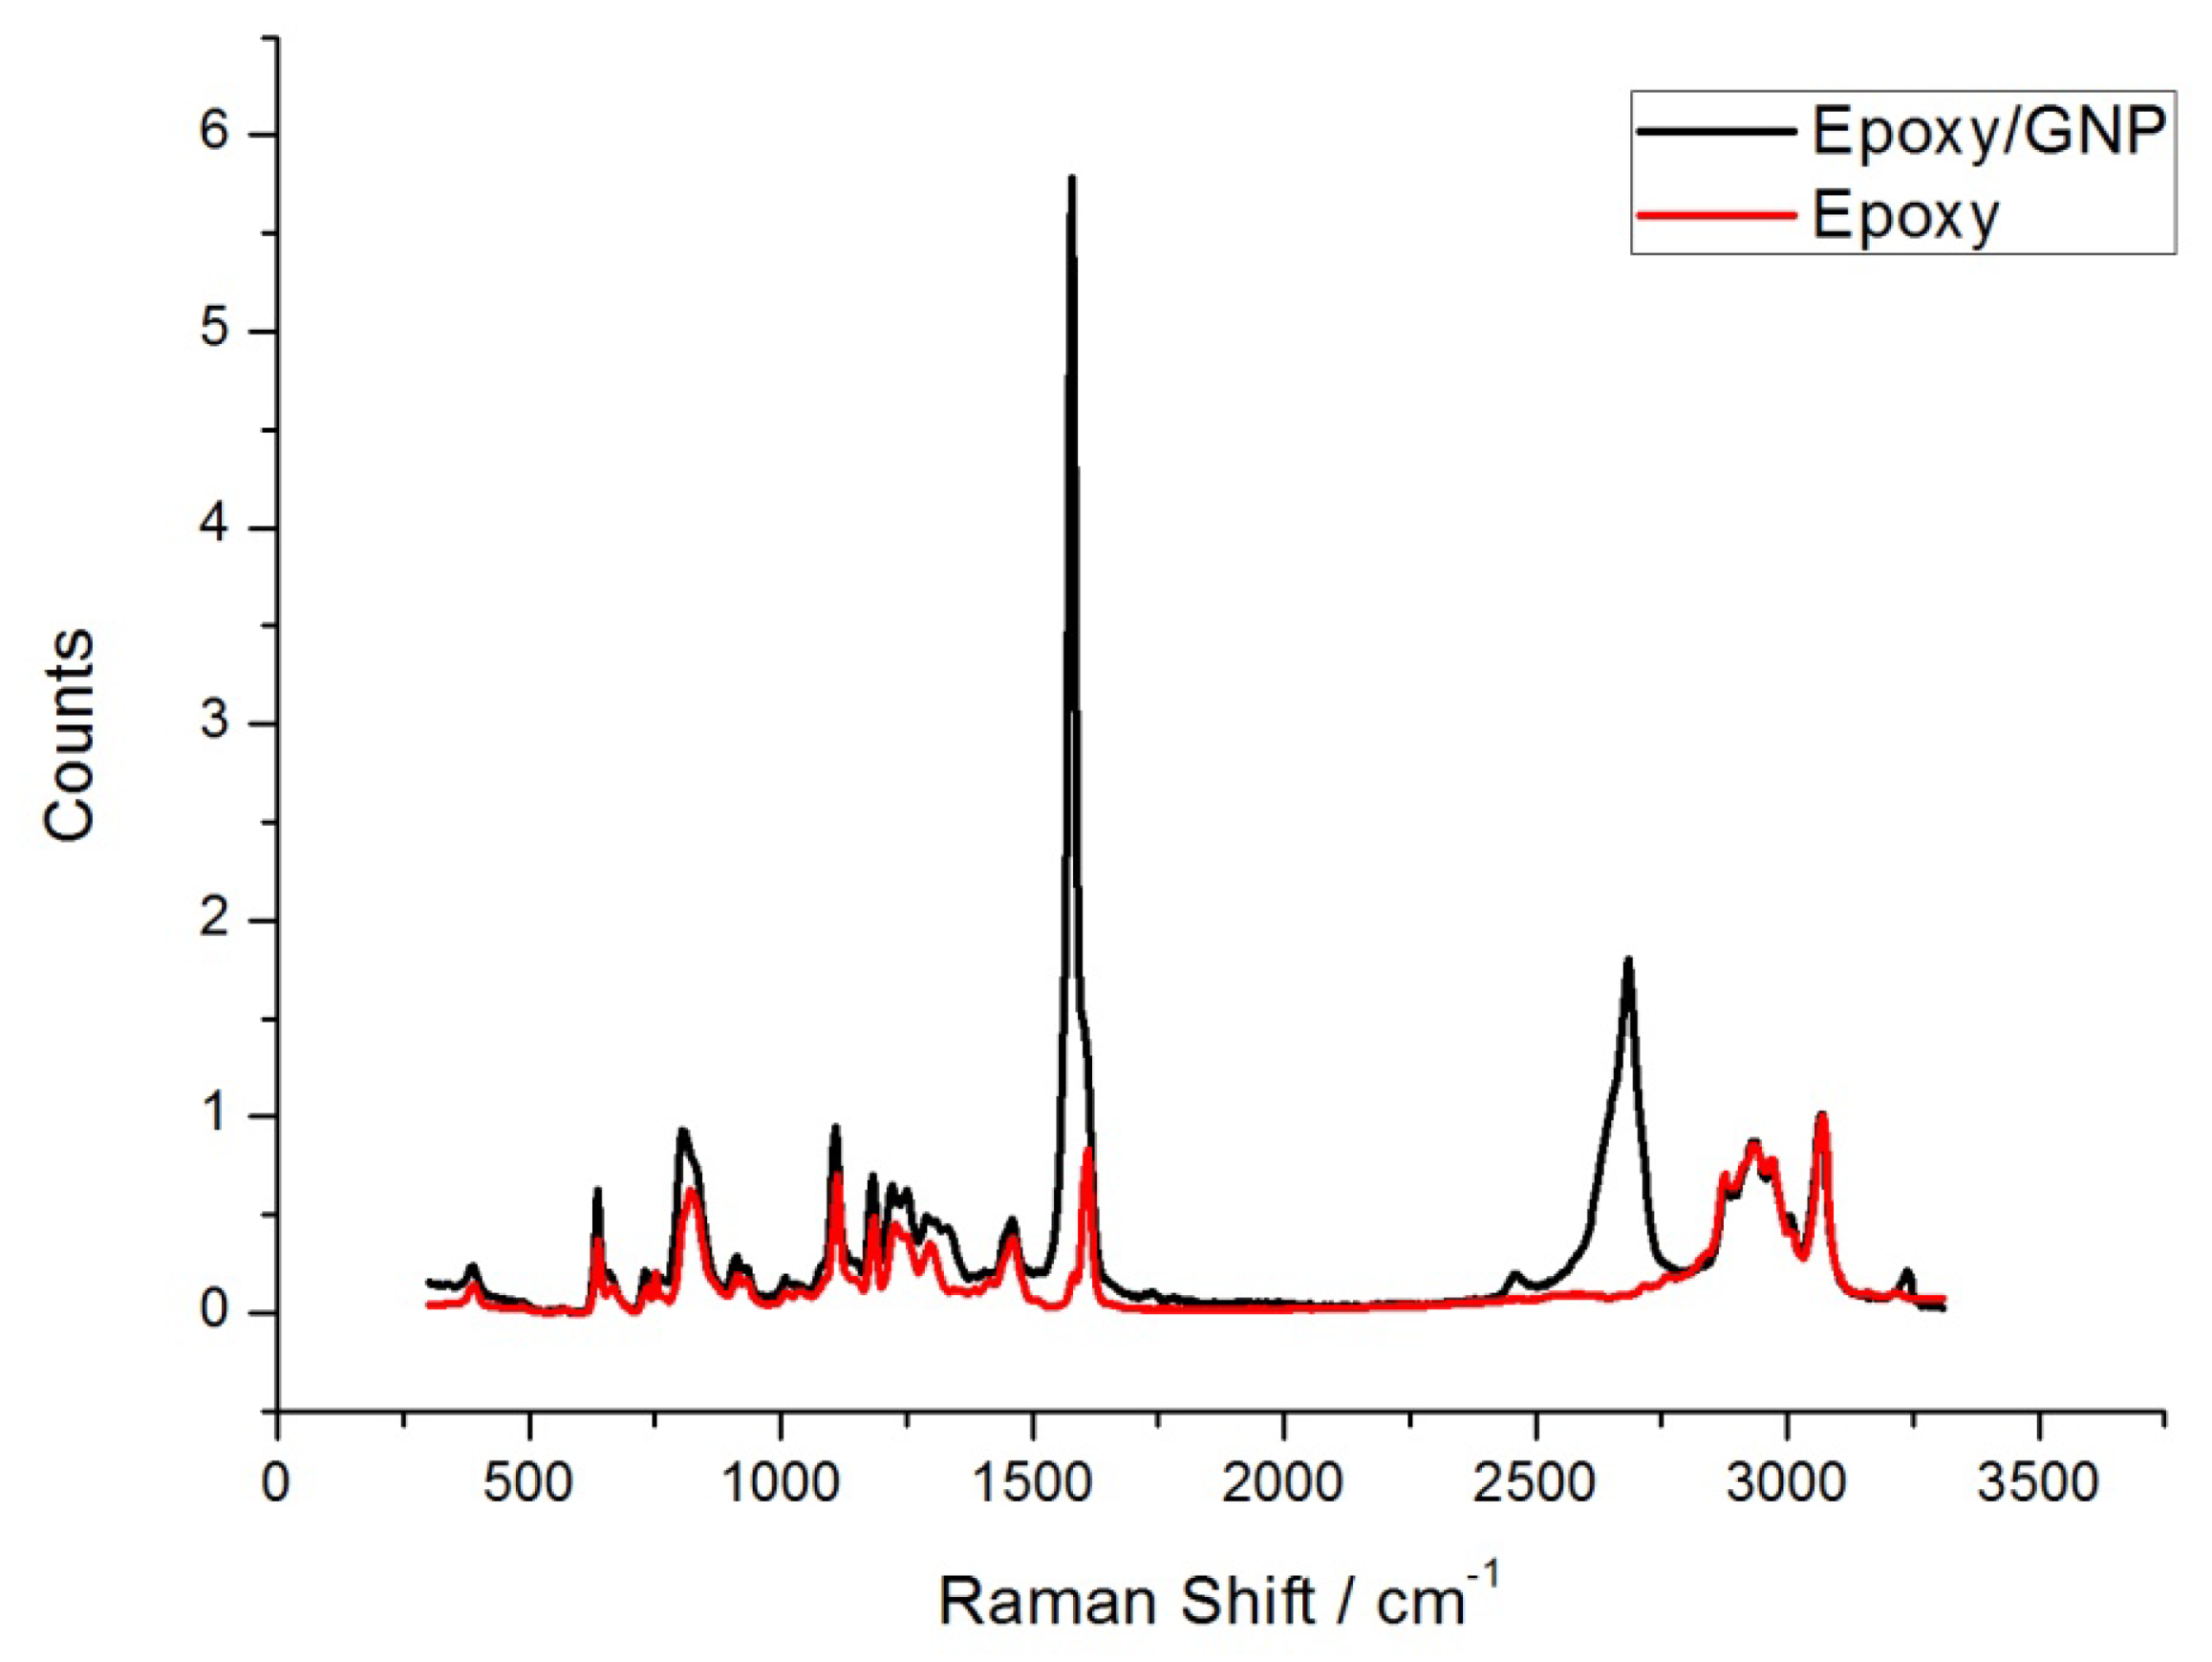
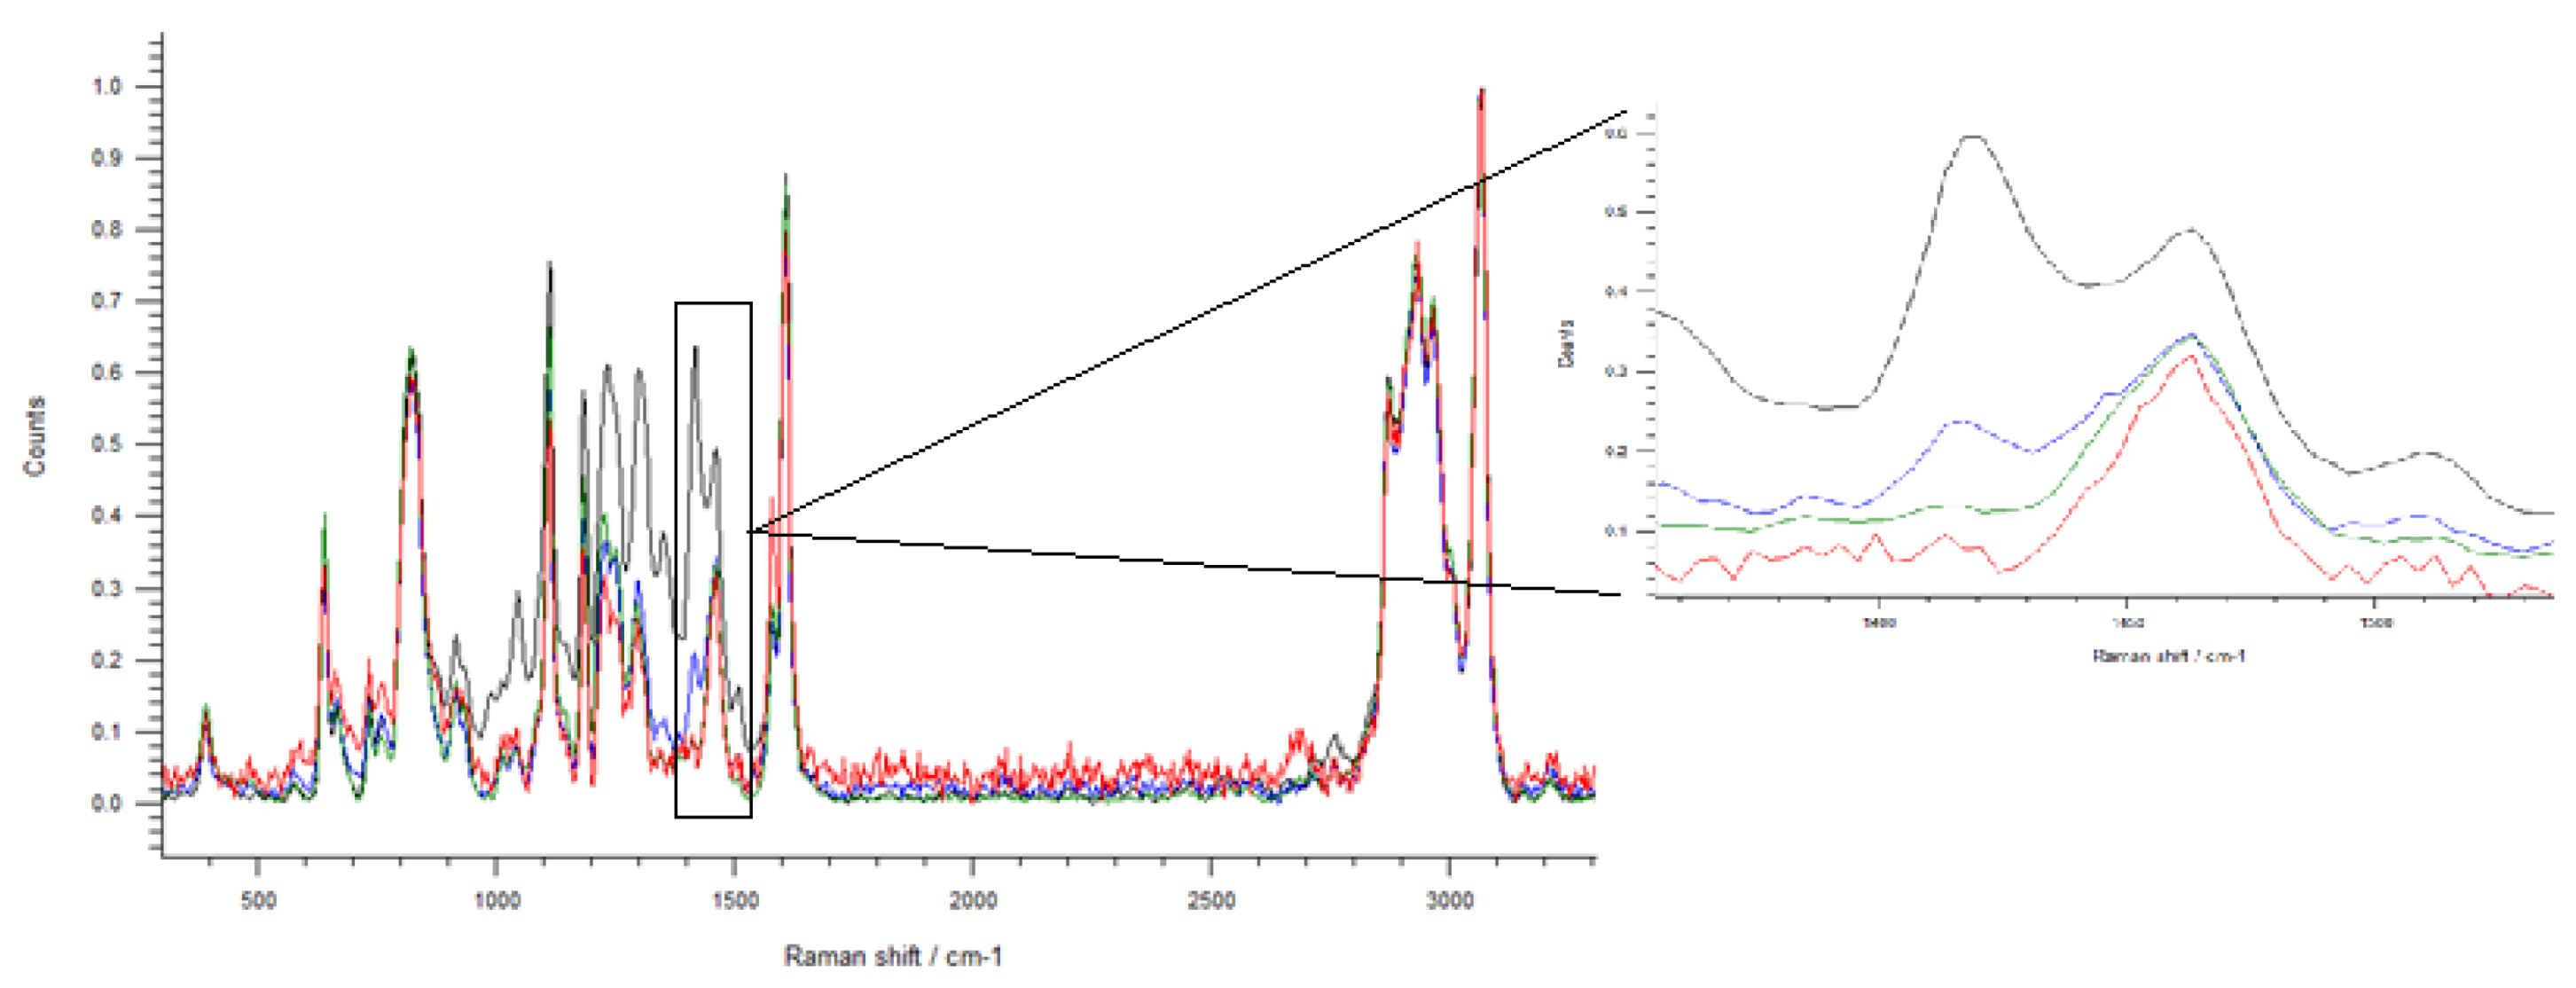
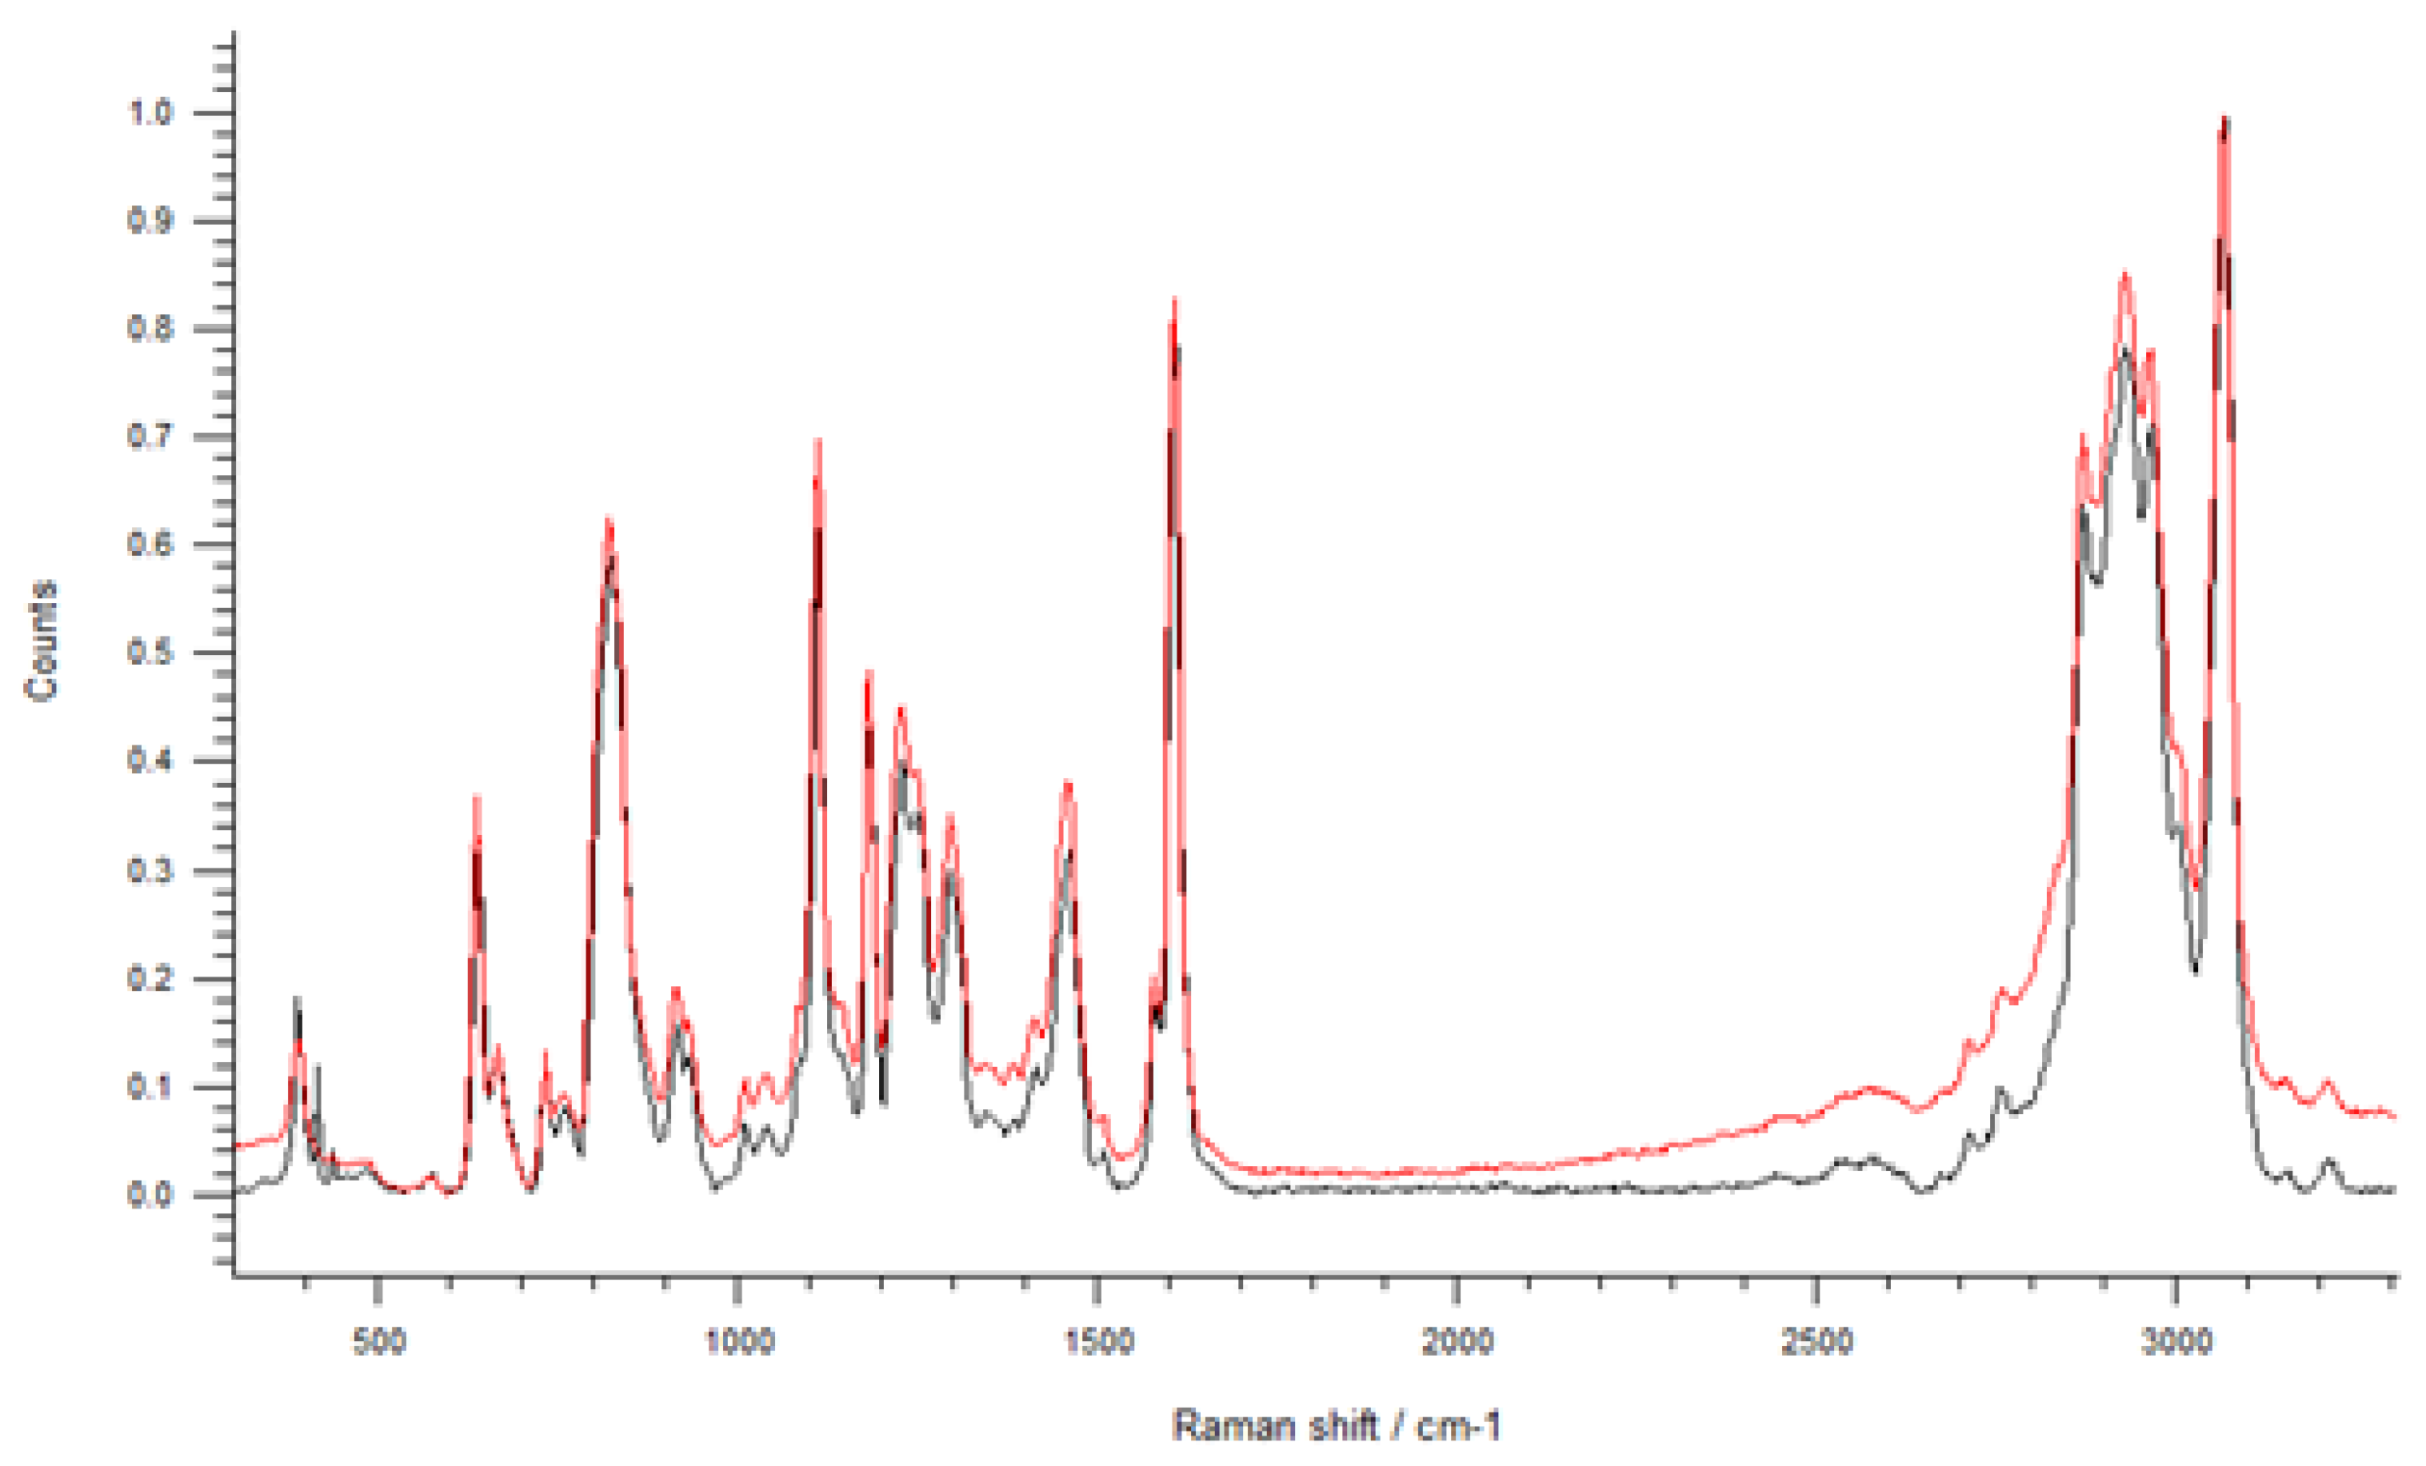
27], so analyses and discussions will only cover surface phenomena. Raman spectroscopy is used to study resin, but especially to visualize the presence of GNPs within the composite. Raman spectra of a pure resin sample and an Epoxy/GNP composite, not subjected to aging, are shown (see
Figure 4). These data will be compared with those accumulated during the aging period to study whether there are variations in the samples and of what nature.
3. Results and Discussion
Samples were exposed to 31 days in H
2SO
4 10% sulfuric acid assuming this time frame was sufficient to reach an equilibrium condition. The concentration was established with reference to the literature related to the use of composite materials against corrosive agents [
28,
29]. In fact, dilute sulfuric acid is one of the main components of acid rain in industrial areas and creates corrosion problems to metallic or plastic devices [
16]. A 10% H
2SO
4 solution was prepared by diluting the solution to 98%. Four Petri dishes were filled with 25 mL of such solution and then the composites with 0.25, 0.5, and 1% GNP concentration and pure resin samples were immersed. Each thin film is studied relative to three different thicknesses corresponding to spin speeds of 1000, 2000, and 5000 rpm.
When an acid solution comes into contact with a polymeric substance, several phenomena can occur which macroscopically are visualized as degradation. These processes are often complicated to understand and rationalize because they are difficult to predict. This work focuses primarily on two events, swelling and polymer degradation with material loss. We consider swelling as the first manifestation of macroscopically detectable aging, with weight measurements and spectroscopic analysis. At a later stage when the uptake of the solution is considerable, an attack by the acid to the polymer chains occur, causing modifications and/or breakage. Macroscopically this results in the loss of polymeric material in the solution and is mainly detected by decreasing sample weight, spectroscopic analysis, and microscopic investigations that provide a surface mapping. By increasing the contact time with the acid, the polymer tends to lose stiffness and resistance properties towards chemical attacks.
Epoxy resin is a material that resists attack by chemicals well, but in thin film form, after a few days in H
2SO
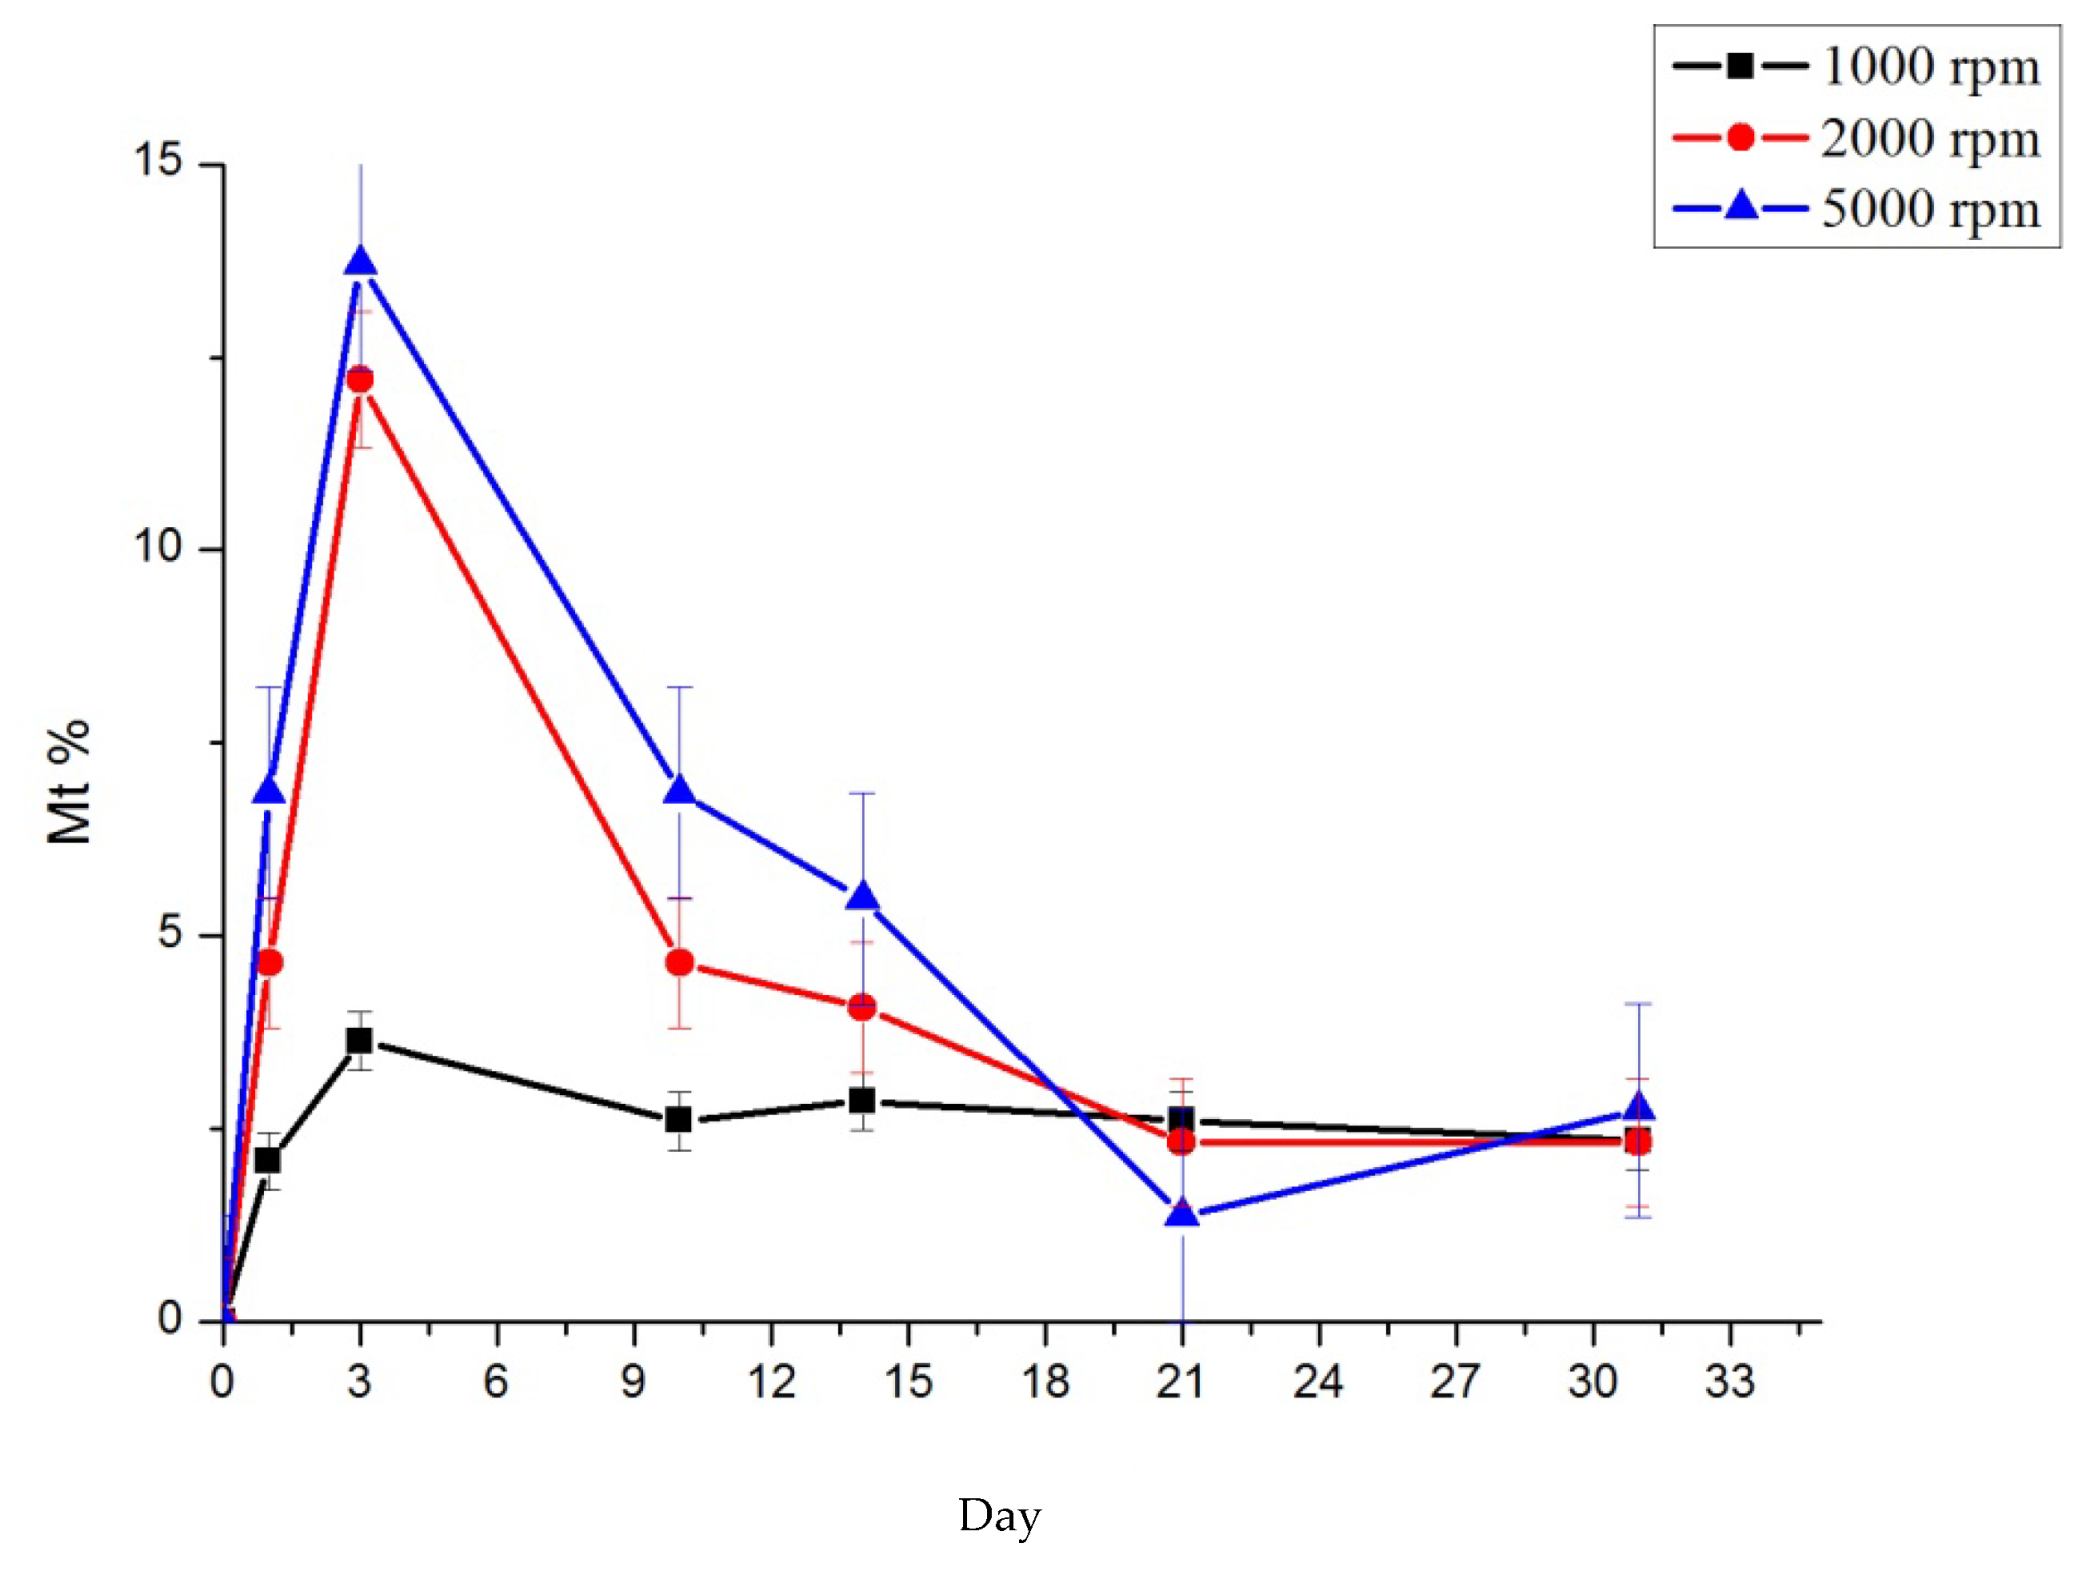
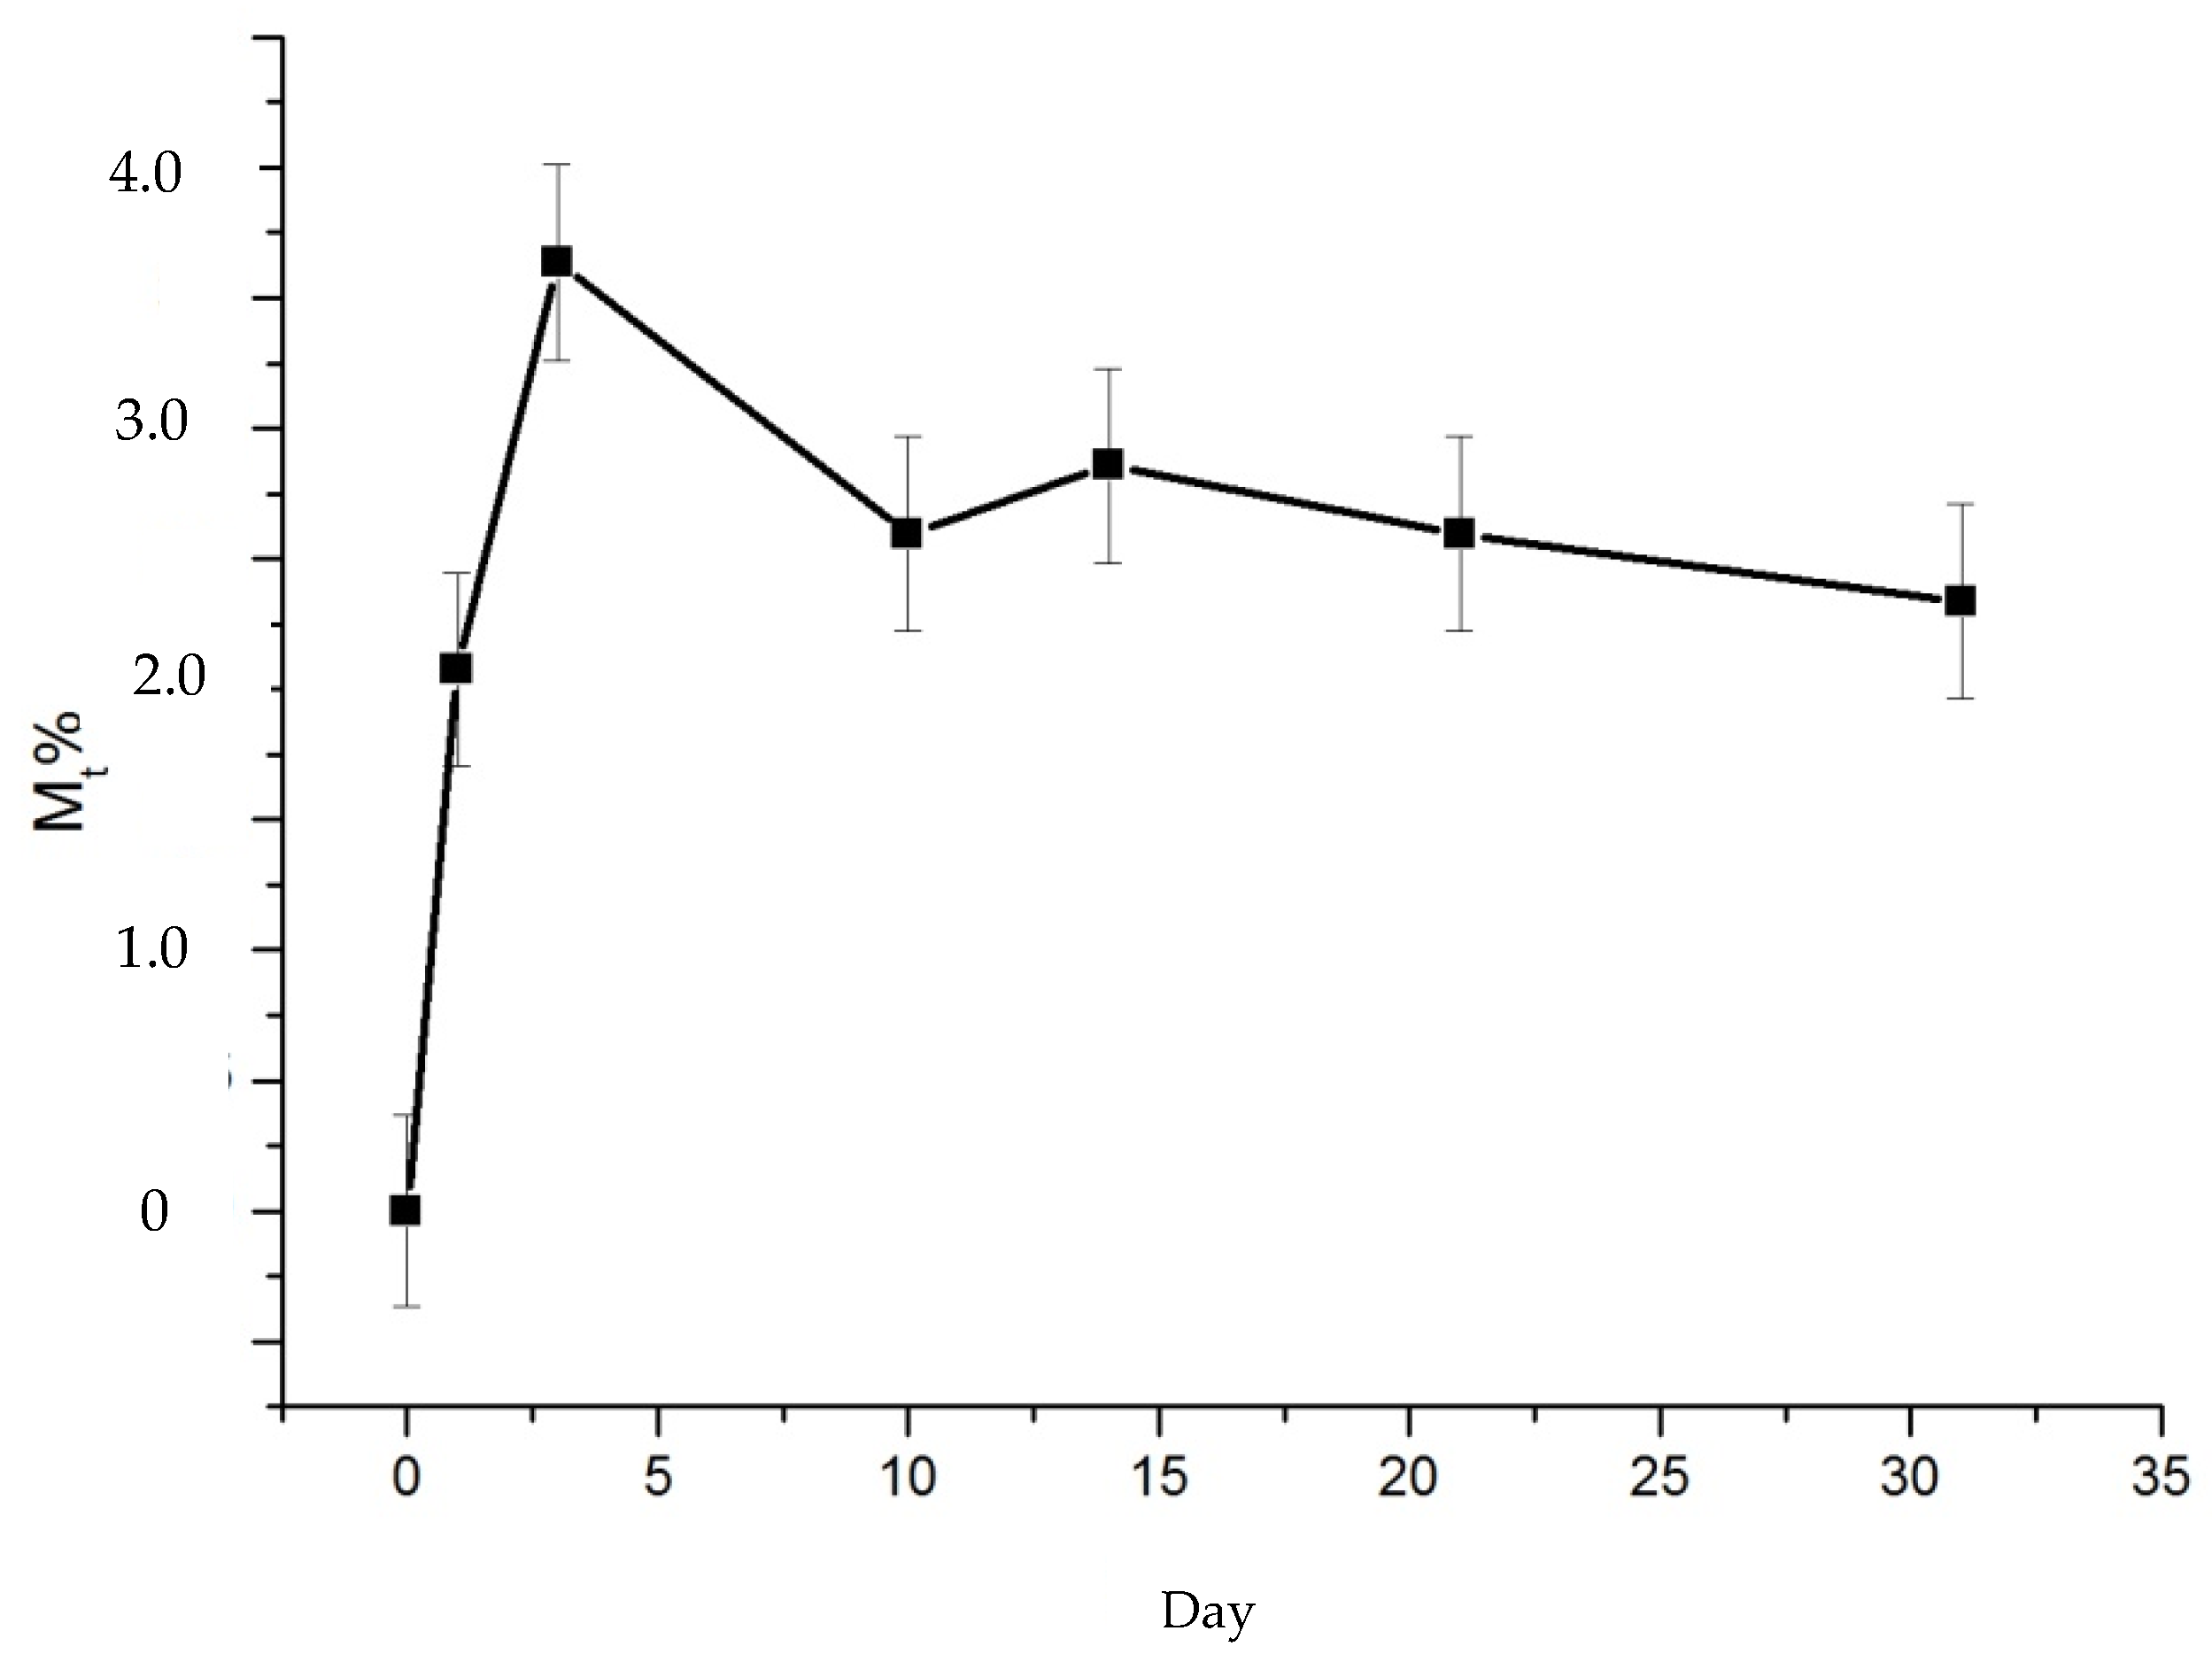
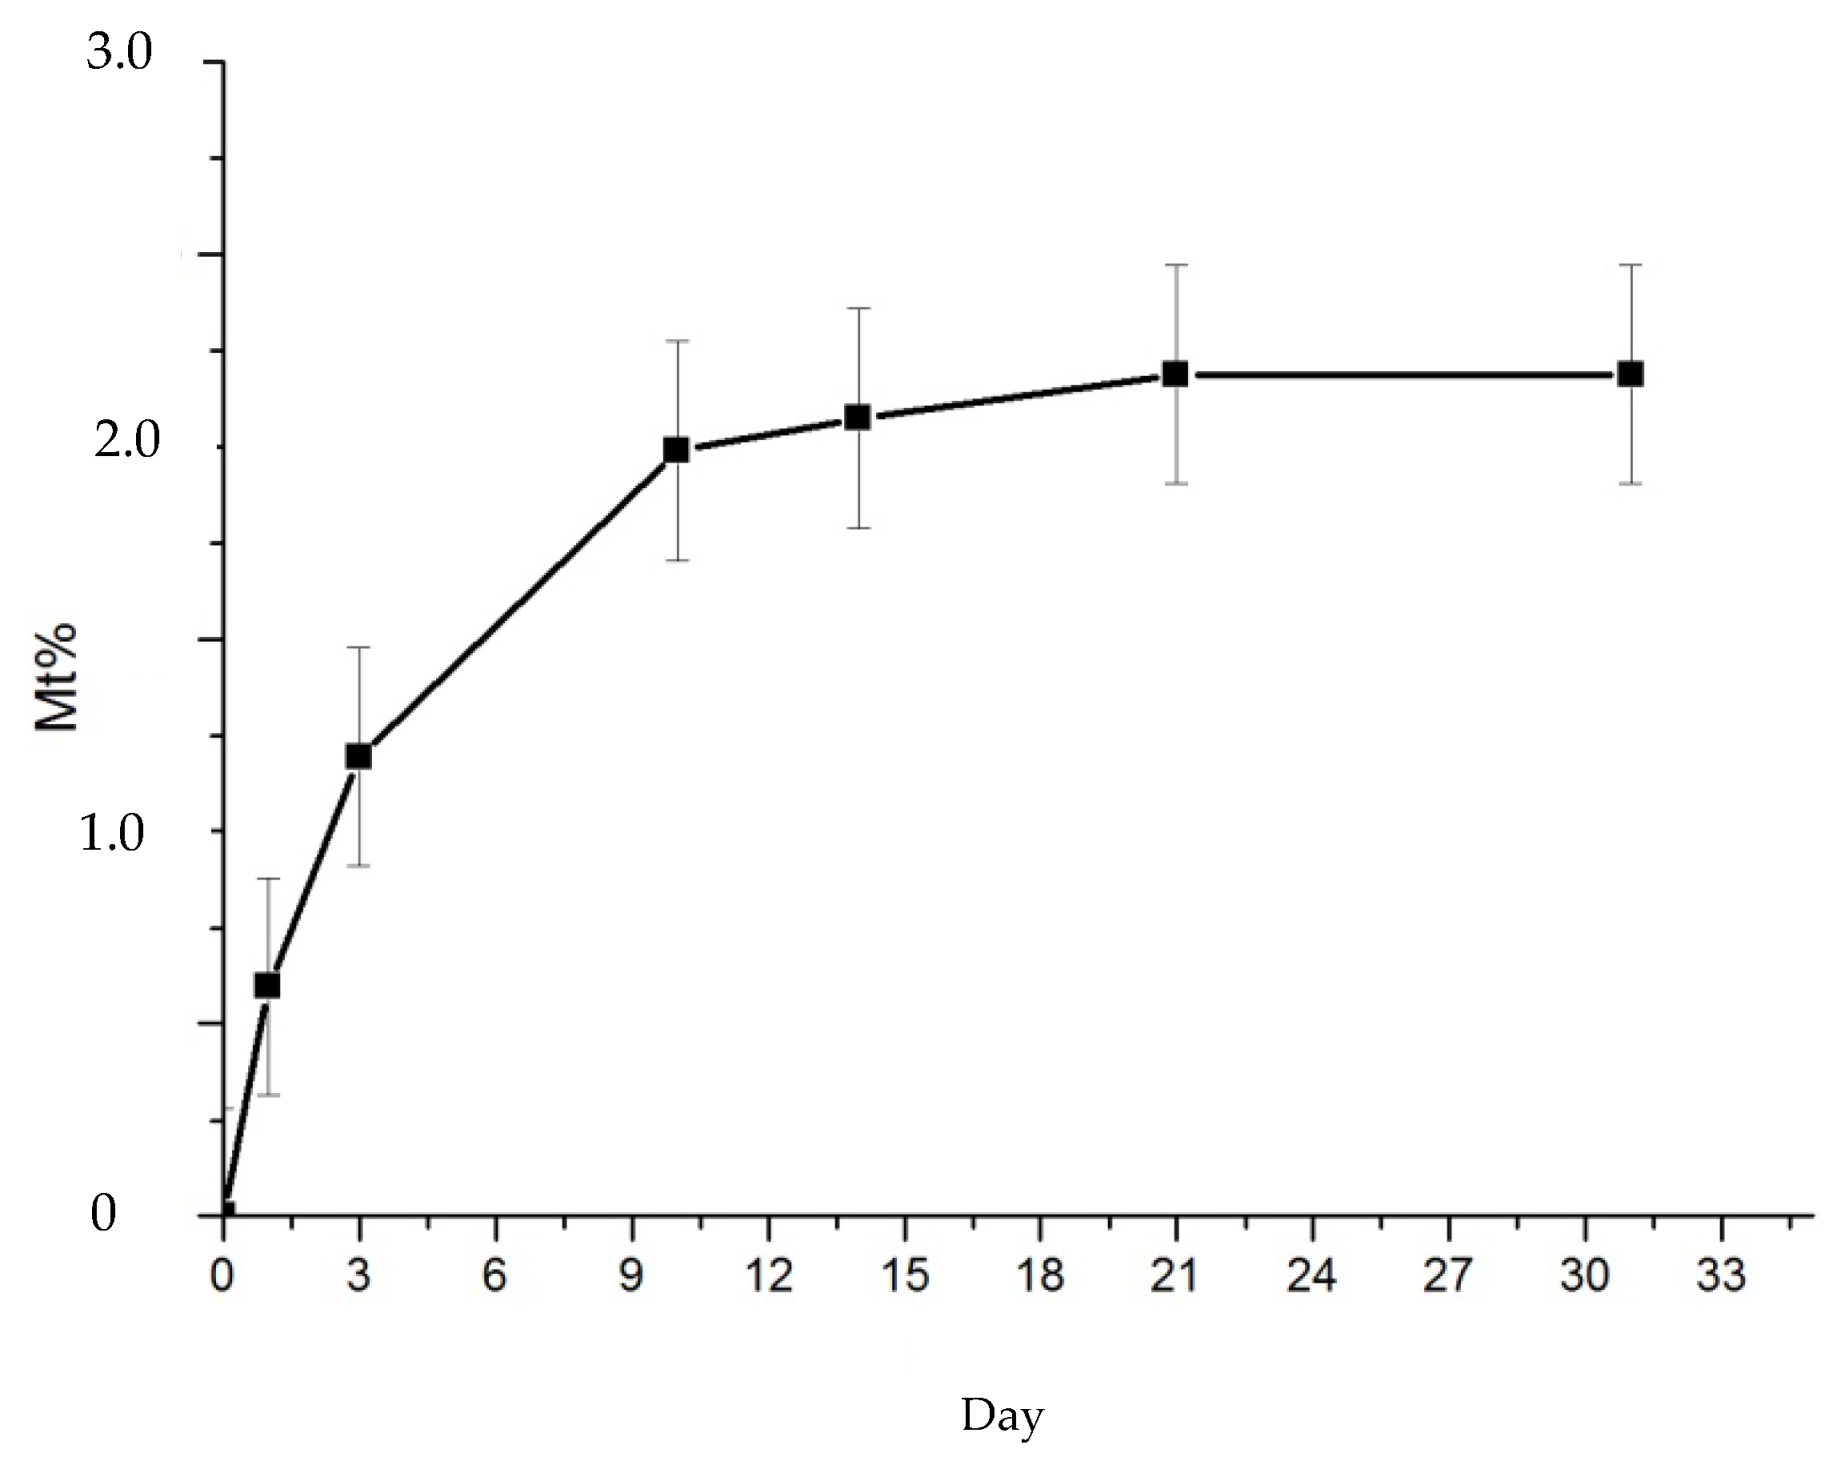
4 10%, it shows sensitivity to changes due to the corrosive environment. After three days of aging, the samples with pure resin arrive at the detachment from the glassy support. Before separation from the glass slide, the measured weight also indicates the mass of the latter. In order to conduct an analysis as accurate as possible, the slides were previously weighed with an analytical balance, assuming values up to the fourth decimal place. Their mass is subtracted from the total mass, which includes the polymer. Values related to the uptake of dilute sulfuric acid solution are studied with respect to different aging days. In particular, the behaviors of the samples at different thicknesses are compared. The weight variation is studied in relation to the initial weight of the slide, which is lower for thinner films. At day zero, the samples prepared at 1000 rpm have an average weight of 40 mg, those at 2000 rpm weigh about 16 mg, and those at 5000 rpm have a mass of about 8 mg. From the graph in
Figure 5, where Mt is the change in mass from the initial mass, it can be seen that all samples show rapid weight growth up to day three, after which there is a decrease.
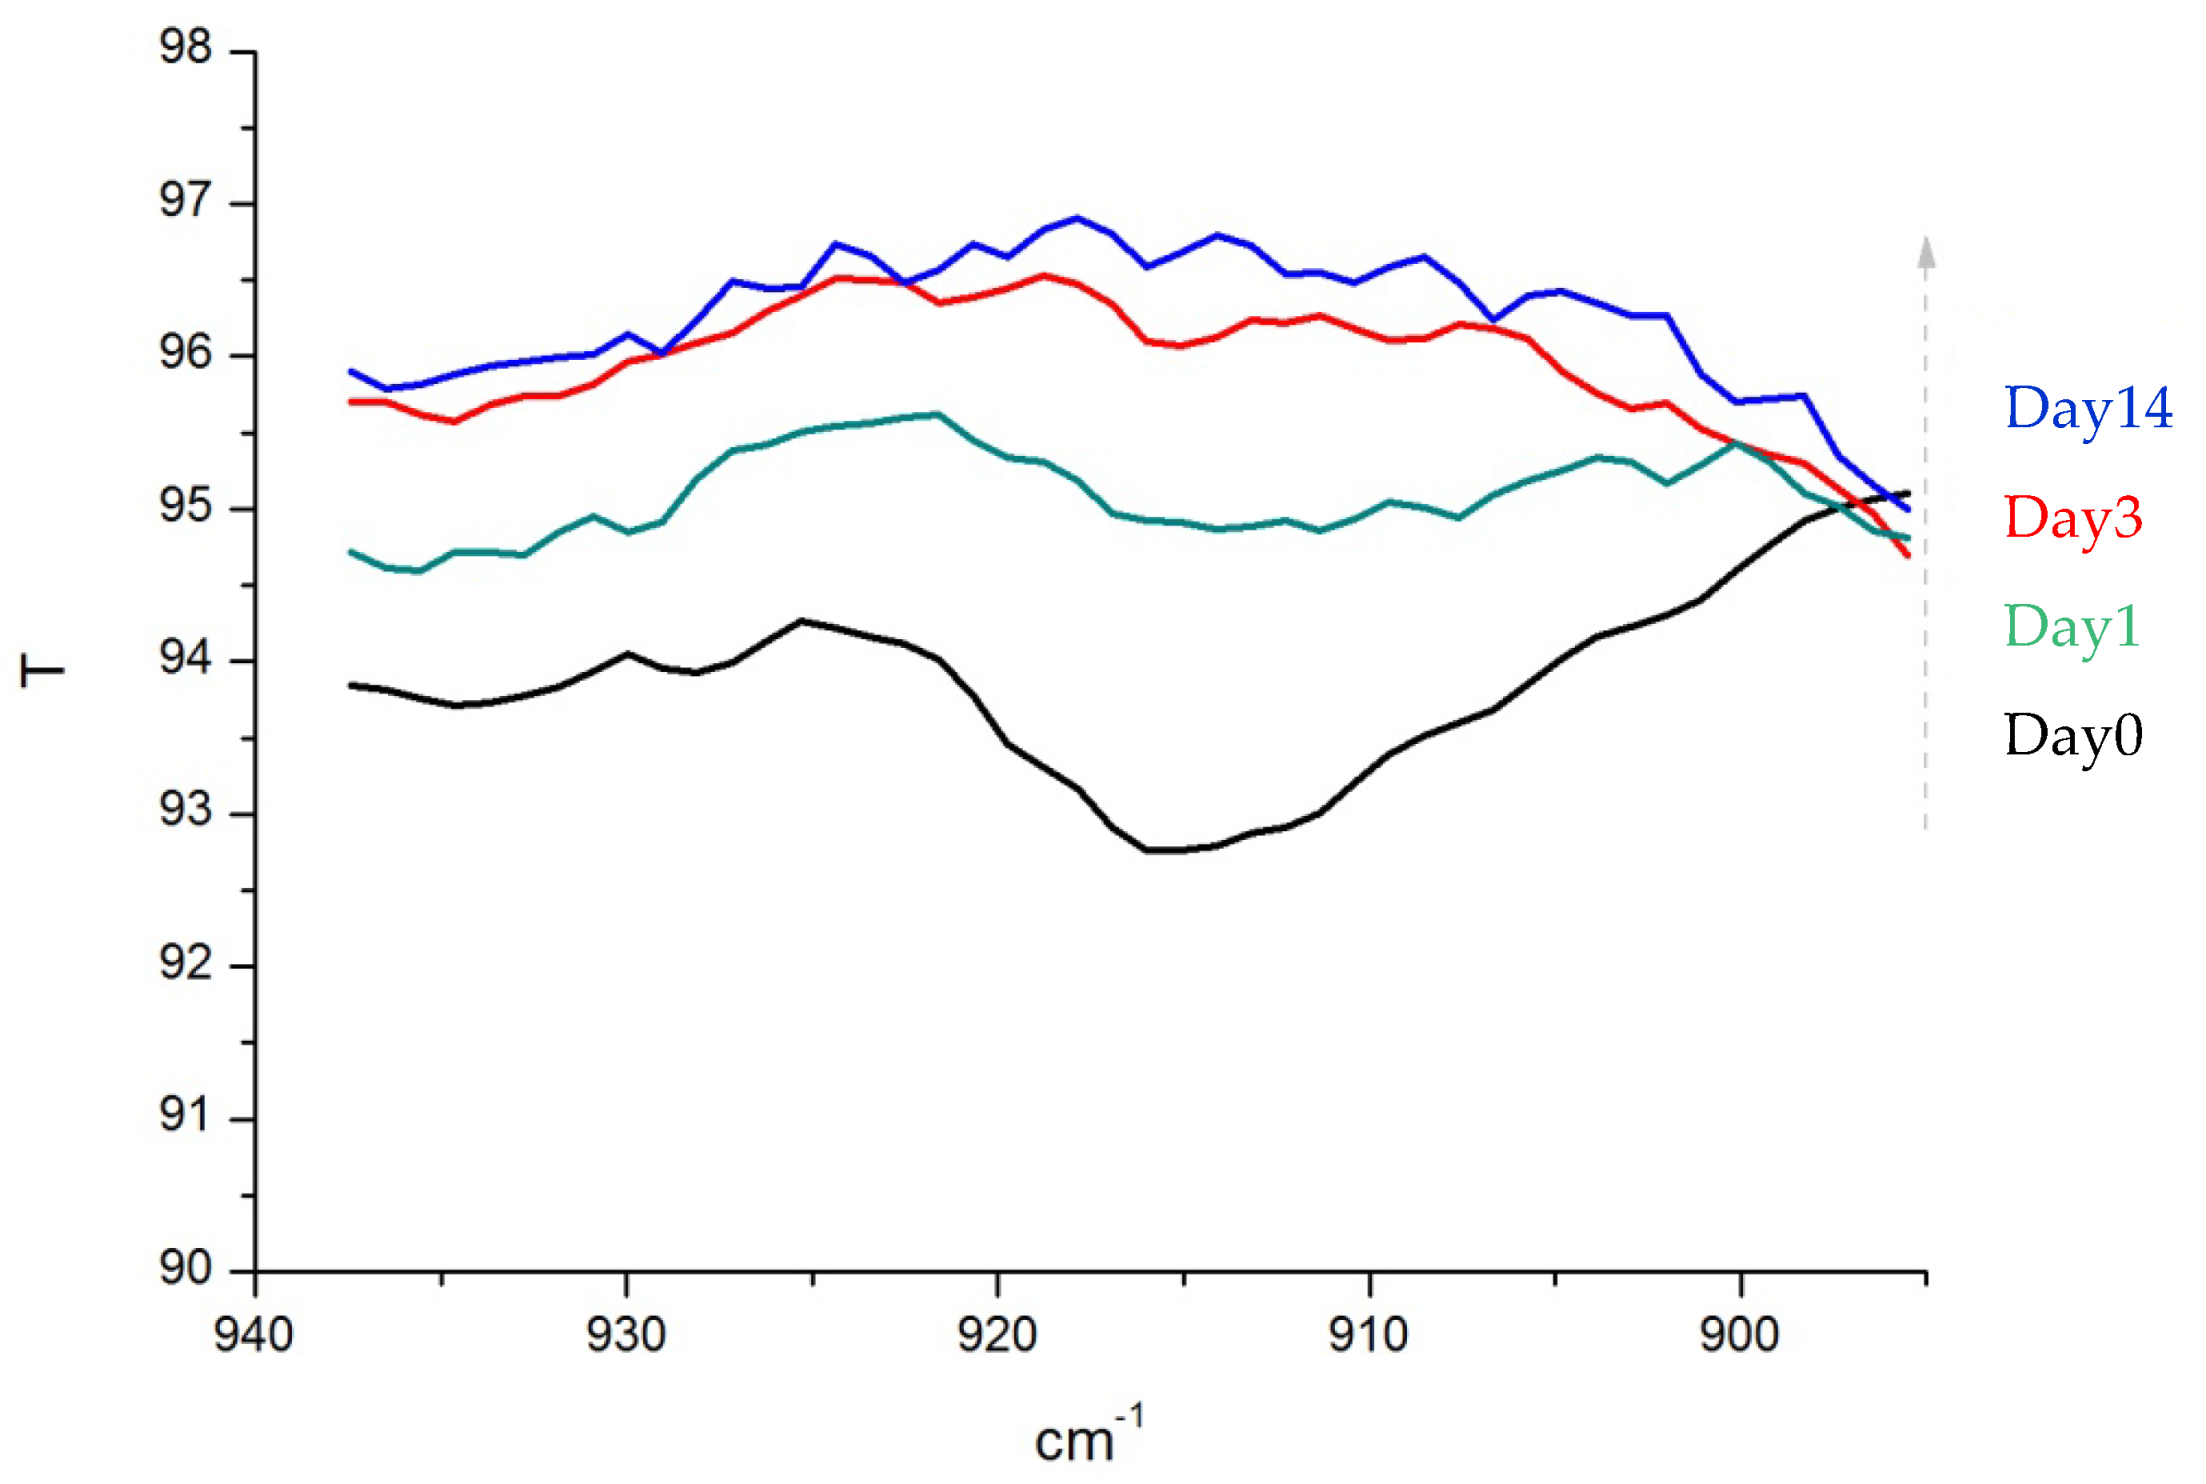
The two thinner samples are shown to be more sensitive to initial growth and the %Mt is higher. However, the absolute difference in uptake between thicknesses appears to be smaller due to the analysis model chosen to study the variation, i.e., with respect to initial weight. The difference is more evident when comparing a film that has a weight on the order of 10 mg with one that has a weight four times greater. This hypothesis is confirmed by the spectroscopic analysis of the samples. On the third day, in fact, the signal related to the stretching of the O-H bond of water presents a similar intensity for all three films at different thicknesses (
Figure 6).
On the third day of aging in sulfuric acid, for pure resin samples, we see the removal of the polymer from the glass substrate. It is assumed that the detachment starts from the edges of the sample due to the infiltration of the acid, which reduces the adhesiveness of the polymer towards the glass and continues as the immersion time increases until it reaches the center and causes the final removal. From the graph in
Figure 5, it can be seen that after the third day the mass undergoes a rapid decrease. This phenomenon is due both to the loss of solution, accumulated at the interface between the film and the support up to the third day, no longer detected after detachment, and to the degradation of the polymer. The latter effect becomes increasingly important as the aging time increases, causing the loss of polymeric material. The acid will attack the chains and presumably cause breaks and changes to the cross-linked structure of the resin. These changes may make some areas of the resin more soluble in water, thus aiding their detachment and passage into solution. In addition, there is the diffusion of the solution inside the polymeric material that continues, after detachment from the glassy support, on both sides.
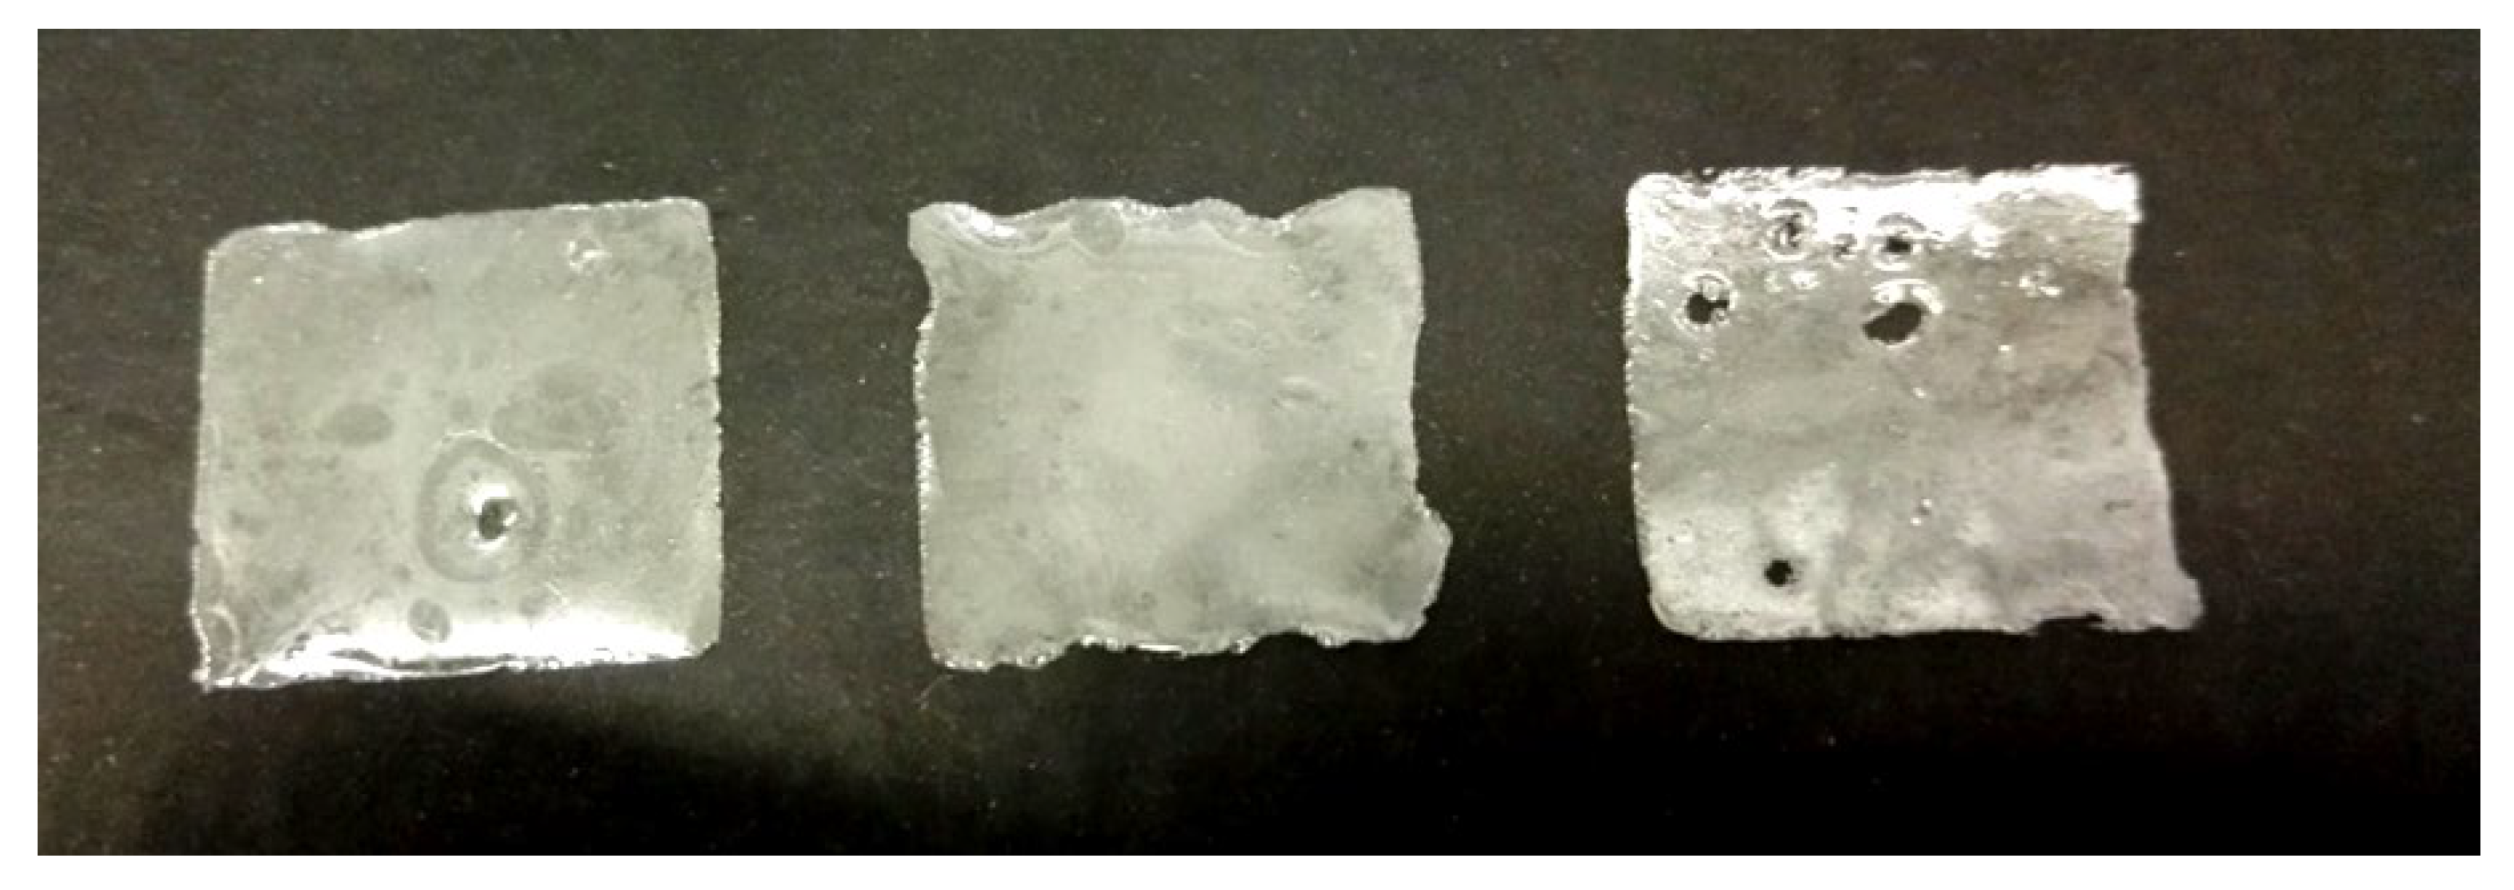
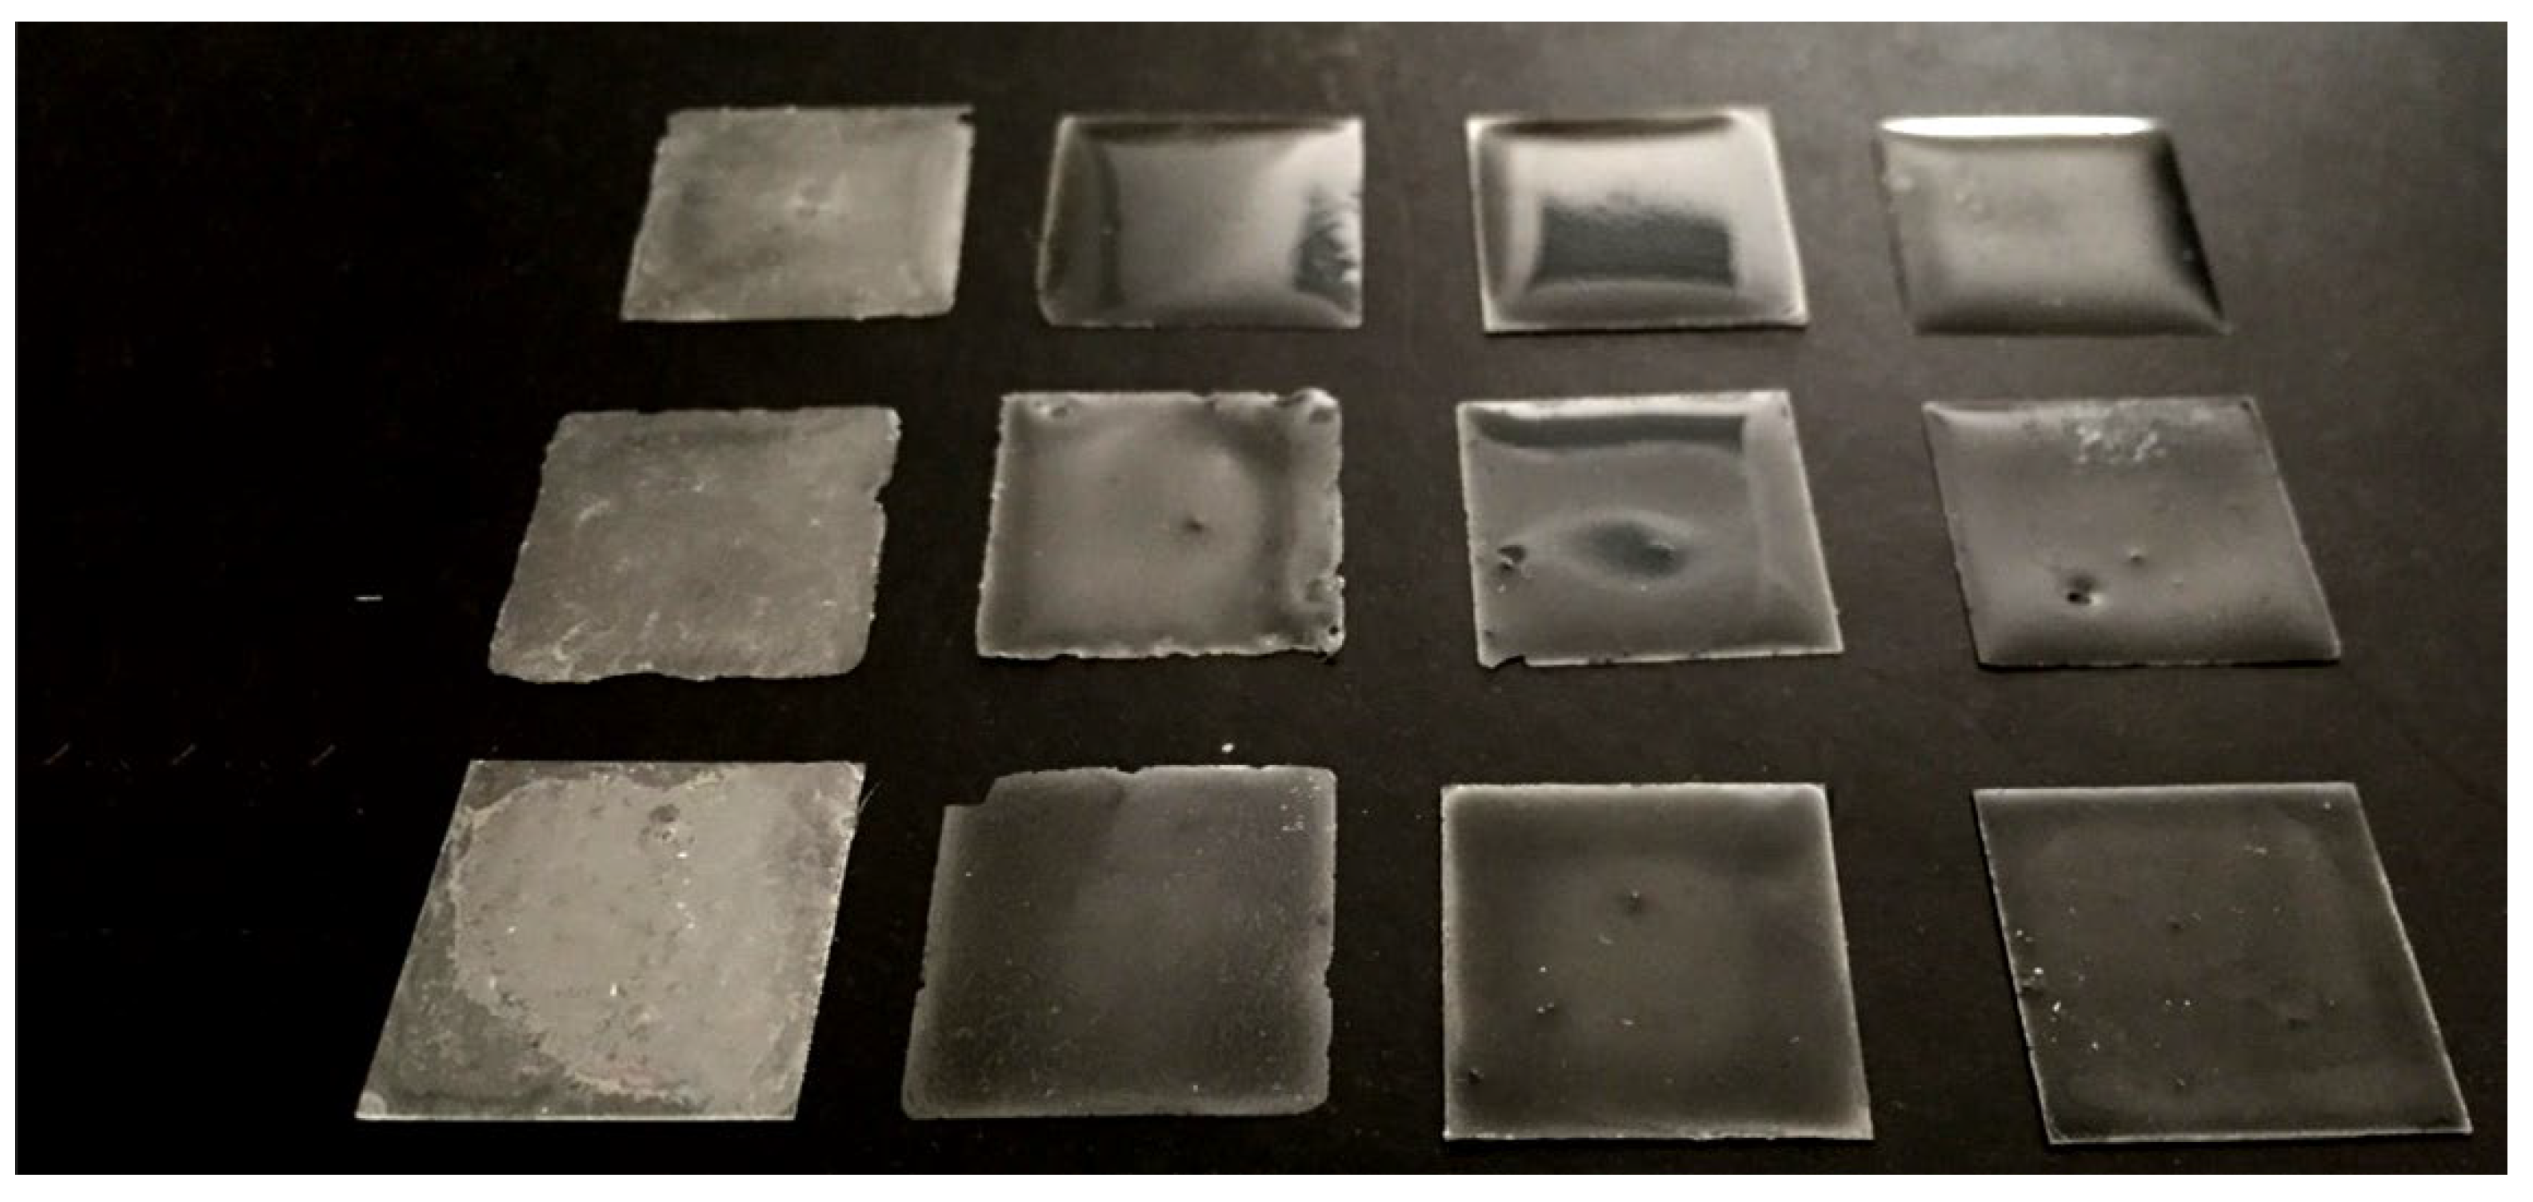
In particular, the path that the liquid molecules must cross is different in the three samples: in the sample of 5000 rpm, it will be shorter and therefore the composite will reach the saturation of the sulfuric acid solution sooner. Obviously, as the days go by, this phenomenon will be more and more relevant until you see, on day 31, the worn areas, which precisely because of the smaller amount of material exposed to the corrosive agent are more evident in the thinner samples. The images of the samples with pure epoxy resin, after 31 days of aging in H
2SO
4 10%, are shown in
Figure 7.
Figure 8 shows a 10× magnification made with a light microscope at day 31 of aging. The darker areas are signs of acid attack as they were absent prior to exposure to the corrosive environment.
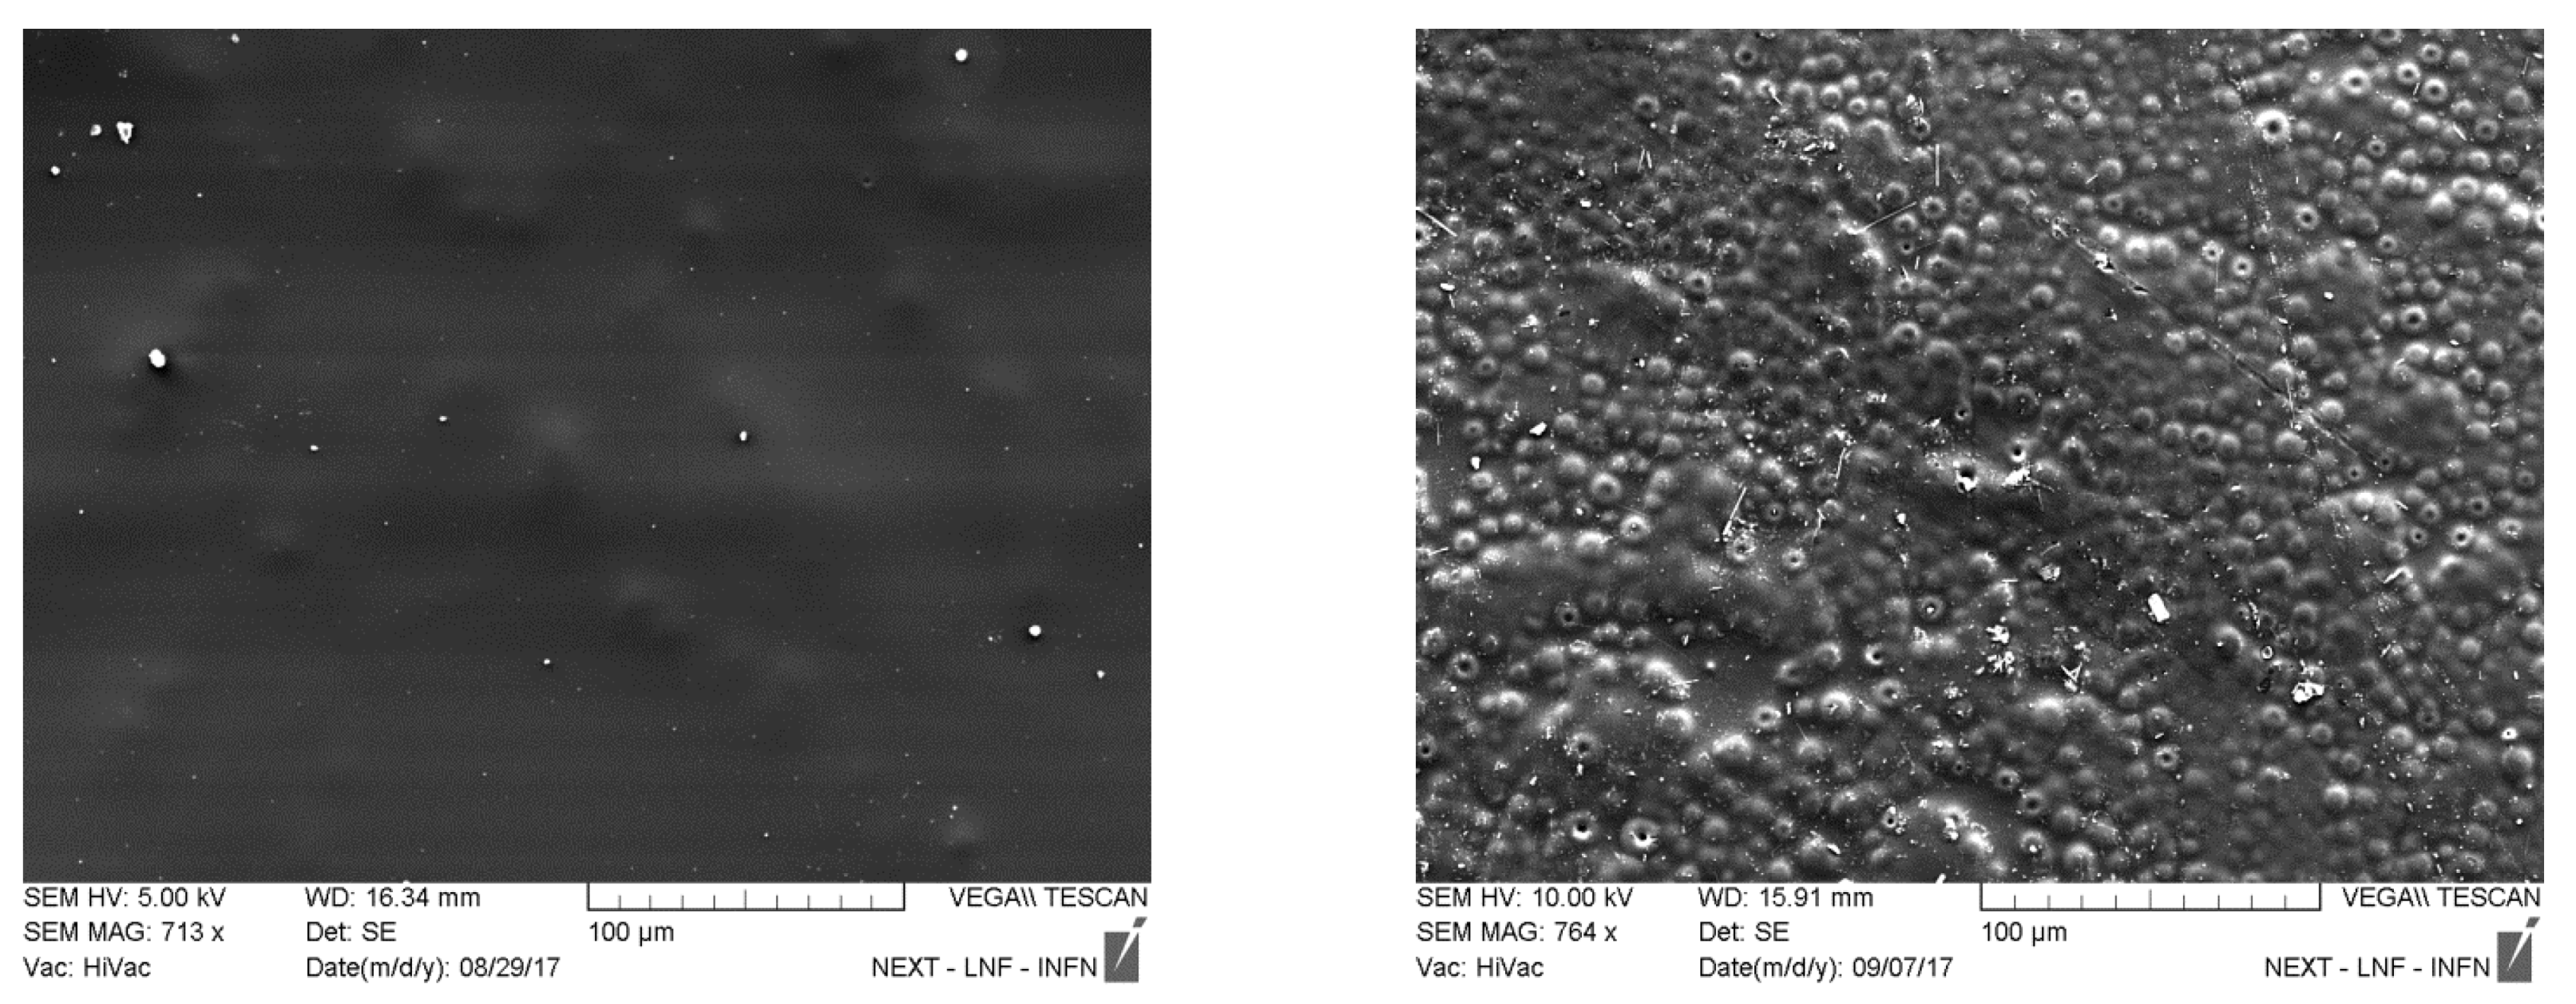
SEM investigations of resin samples show actual deterioration of the resin surface after 31 days of aging.
Figure 9 compares the resin surface before and after sulfuric acid treatment.
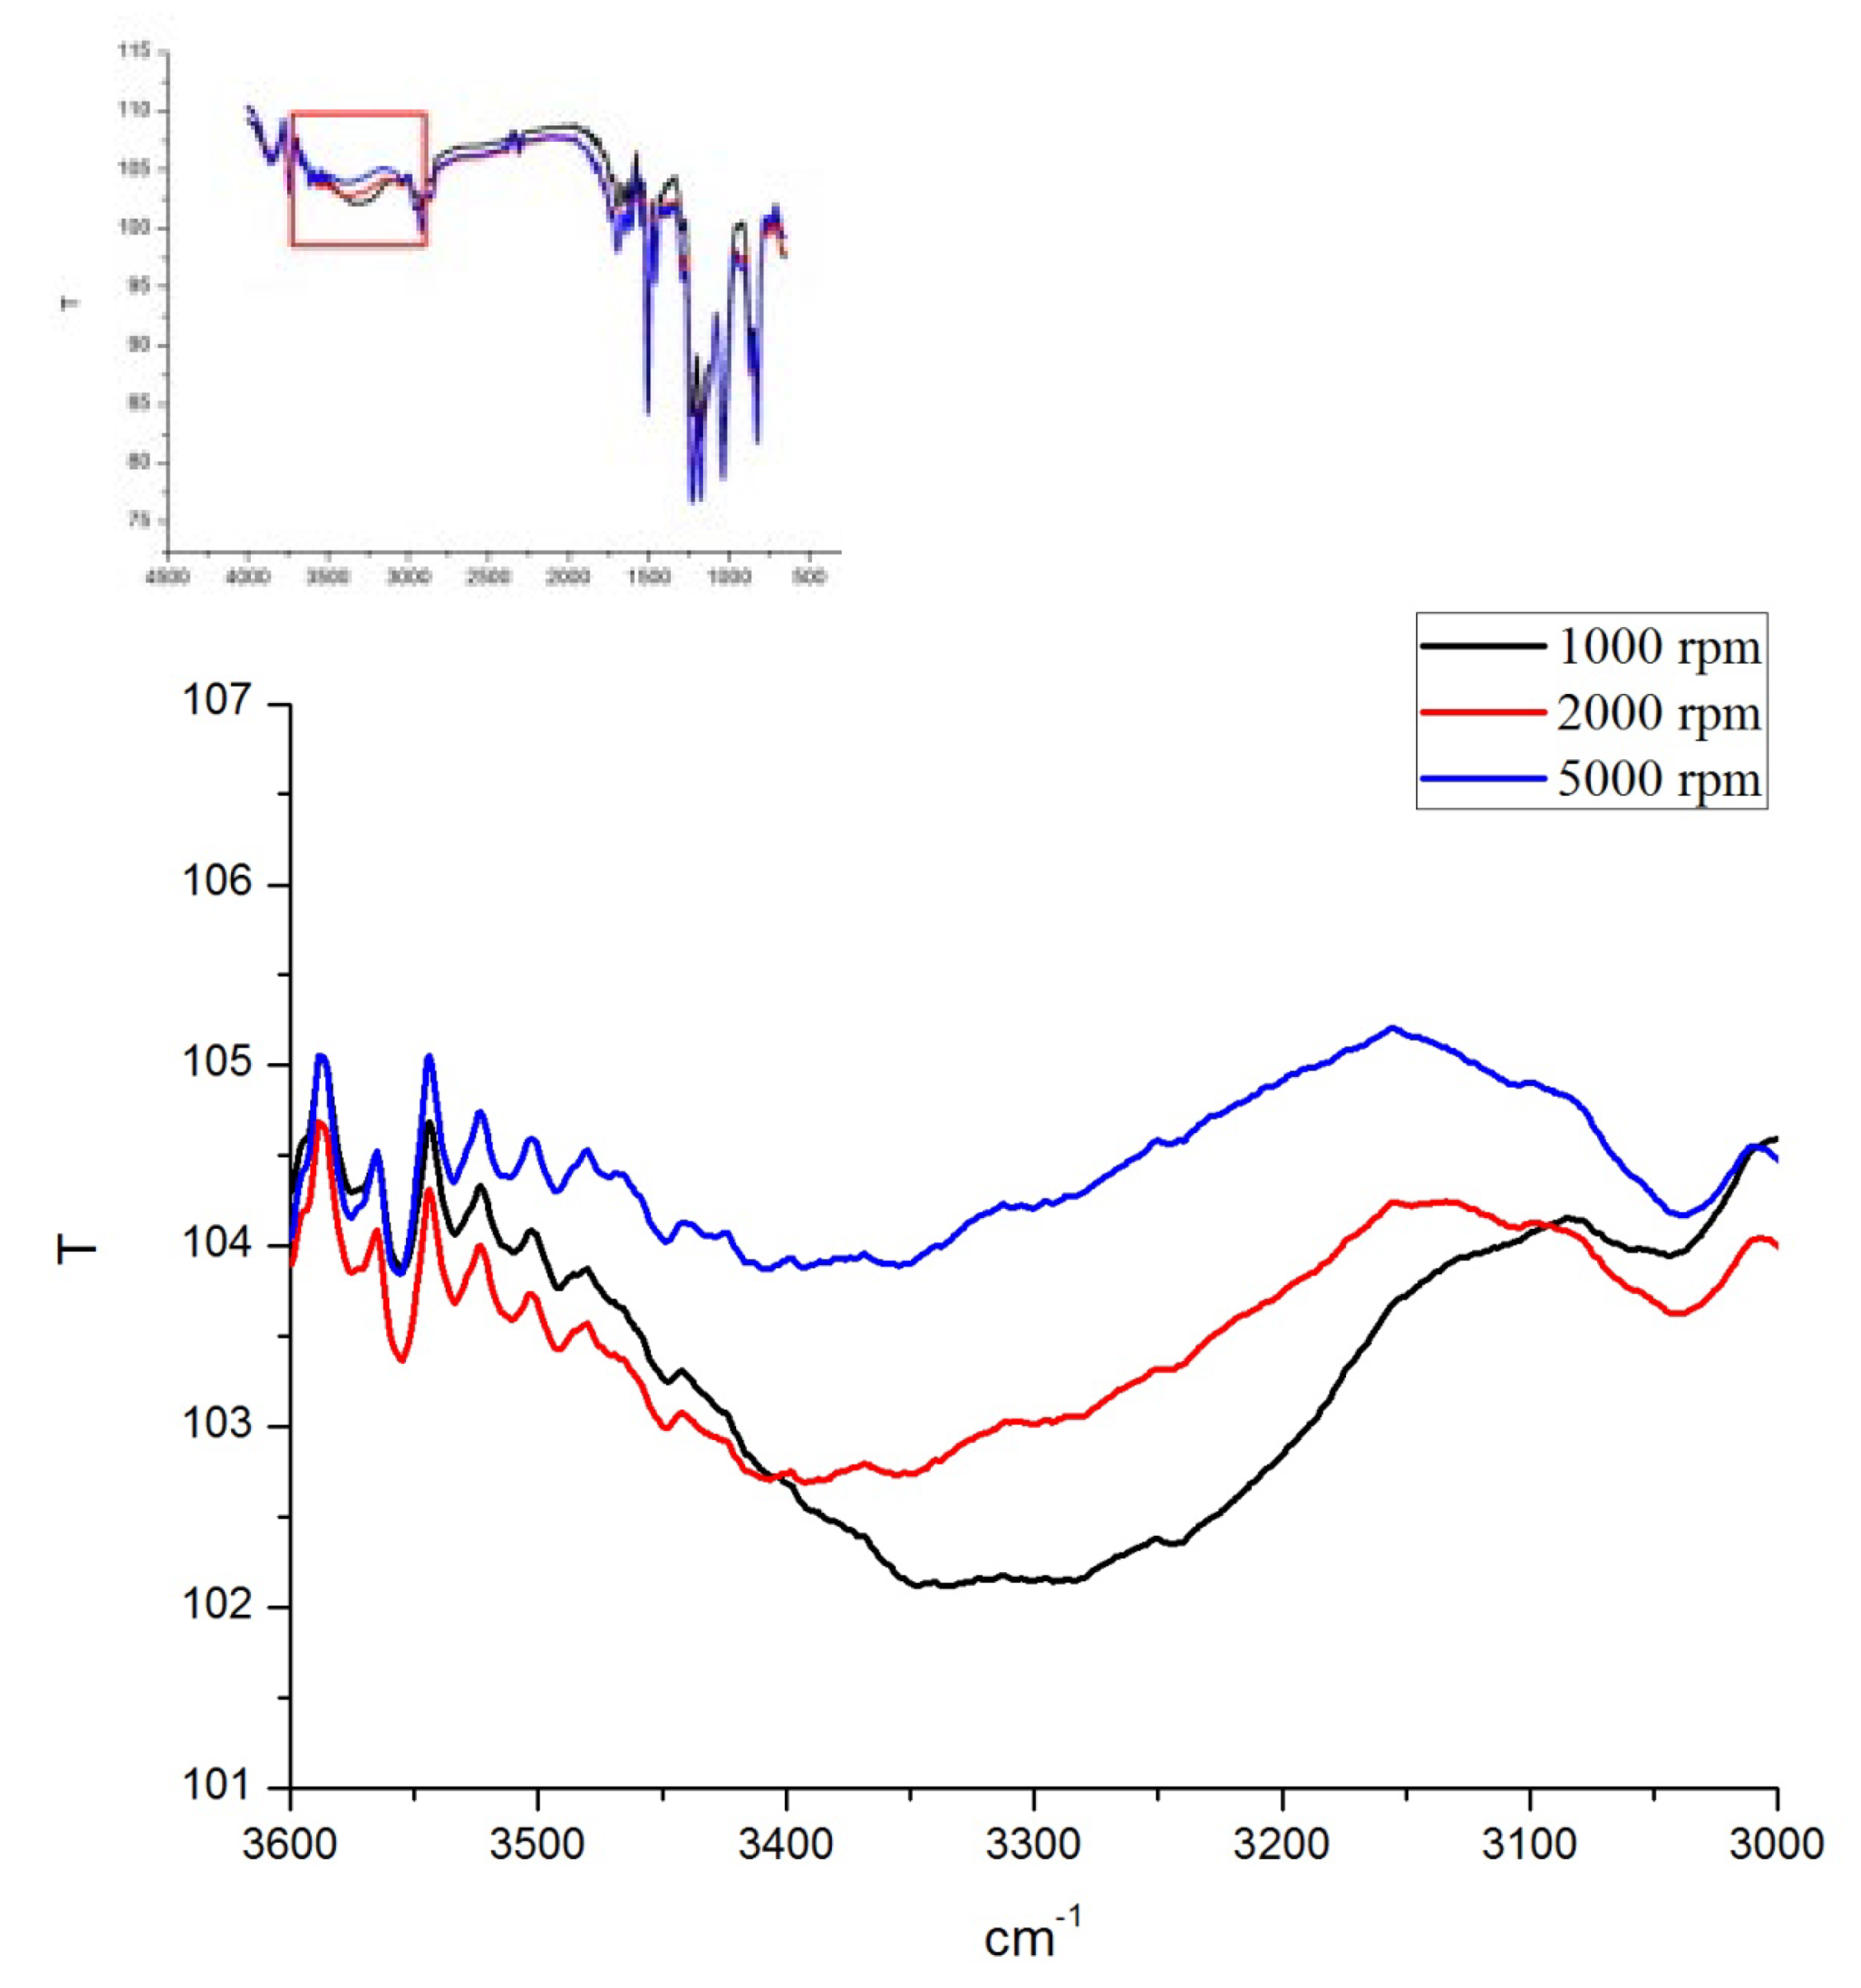
After 31 days of aging, if one compares the IR spectra of the resins at different thicknesses, one gets the spectrum in
Figure 10.
The pure resin sample prepared with a spin speed of 1000 rpm, therefore thicker than the other two, shows the peak relative to the water signal of greater intensity. It cannot be said that the solution uptake was greater for this thin film compared to the others because the diffusion of liquid in the sample is not the only phenomenon that occurs and degradation must also be considered. Assuming that the film at 5000 rpm (about 50 µm, thick) reaches a saturated state in a shorter time than the film at 1000 rpm (about 250 µm, thick), it can be assumed that for the thinner sample, the corrosion process will have considerable effects in less time than for the thicker sample. The difference in signal intensity of water is interpreted based on this assumption, considering that with corrosion, there is loss of material and therefore decreases the ability by the sample to accommodate liquid molecules. The film that has an initial thickness of 50 µm presents more this effect having less material that opposes the aggressive action of the acid. At the same time, the thicker sample will begin to degrade superficially before reaching effective saturation.
These assumptions are supported by mass measurements. The graph in
Figure 5 clearly demonstrates that there is a decrease in the mass of the samples. This decrease is considerable for the thinner samples, while it is only hinted at for the film at 1000 rpm. Thus the change in mass from initial weight is more significant for finer samples. Studying the change in mass of the thicker sample confirms the fact that the sample at 1000 rpm tends to reach a saturated condition while simultaneously undergoing degradation. The graph in
Figure 11 shows the trend in sample mass at 1000 rpm with initial thickness of about 250 µm.
The method and tools chosen to study the aging phenomenon in sulfuric acid led to these assumptions with respect to pure resins. As previously pointed out, the corrosive attack of an acid towards a polymer chain is a difficult phenomenon to predict and rationalize completely. For this reason, the following initial assumptions were made: consider mainly surface corrosion, limit the aging process to the diffusion of the solution into the samples and the attack of the acid to the polymer chain with subsequent loss of material, and finally reach a condition of equilibrium of the samples with the solution at day 31 of aging.
An analysis of the changes in film thickness during the aging process was not possible because the pure resin samples showed too much variability in thickness within the same sample. It should also be kept in mind that after detachment from the glass substrate on the third day, both surfaces of the films are exposed to the acid solution.
The study of the IR spectra at long wavelengths led to the identification of interesting modifications. The signal related to CH-O-CH
2 bending at 915 cm
−1, still present after tetraethylenpentamine treatment, disappears after aging. We compare the spectrum of an epoxy sample before aging, and after different immersion times (
Figure 12).
This modification is attributed to the opening of the epoxy ring, which is much more reactive than a linear ether. In particular, the literature on this subject confirms that the attack on the epoxy ring by H
2O is an acid-catalyzed reaction [
30]. This occurs in both resins and composites.
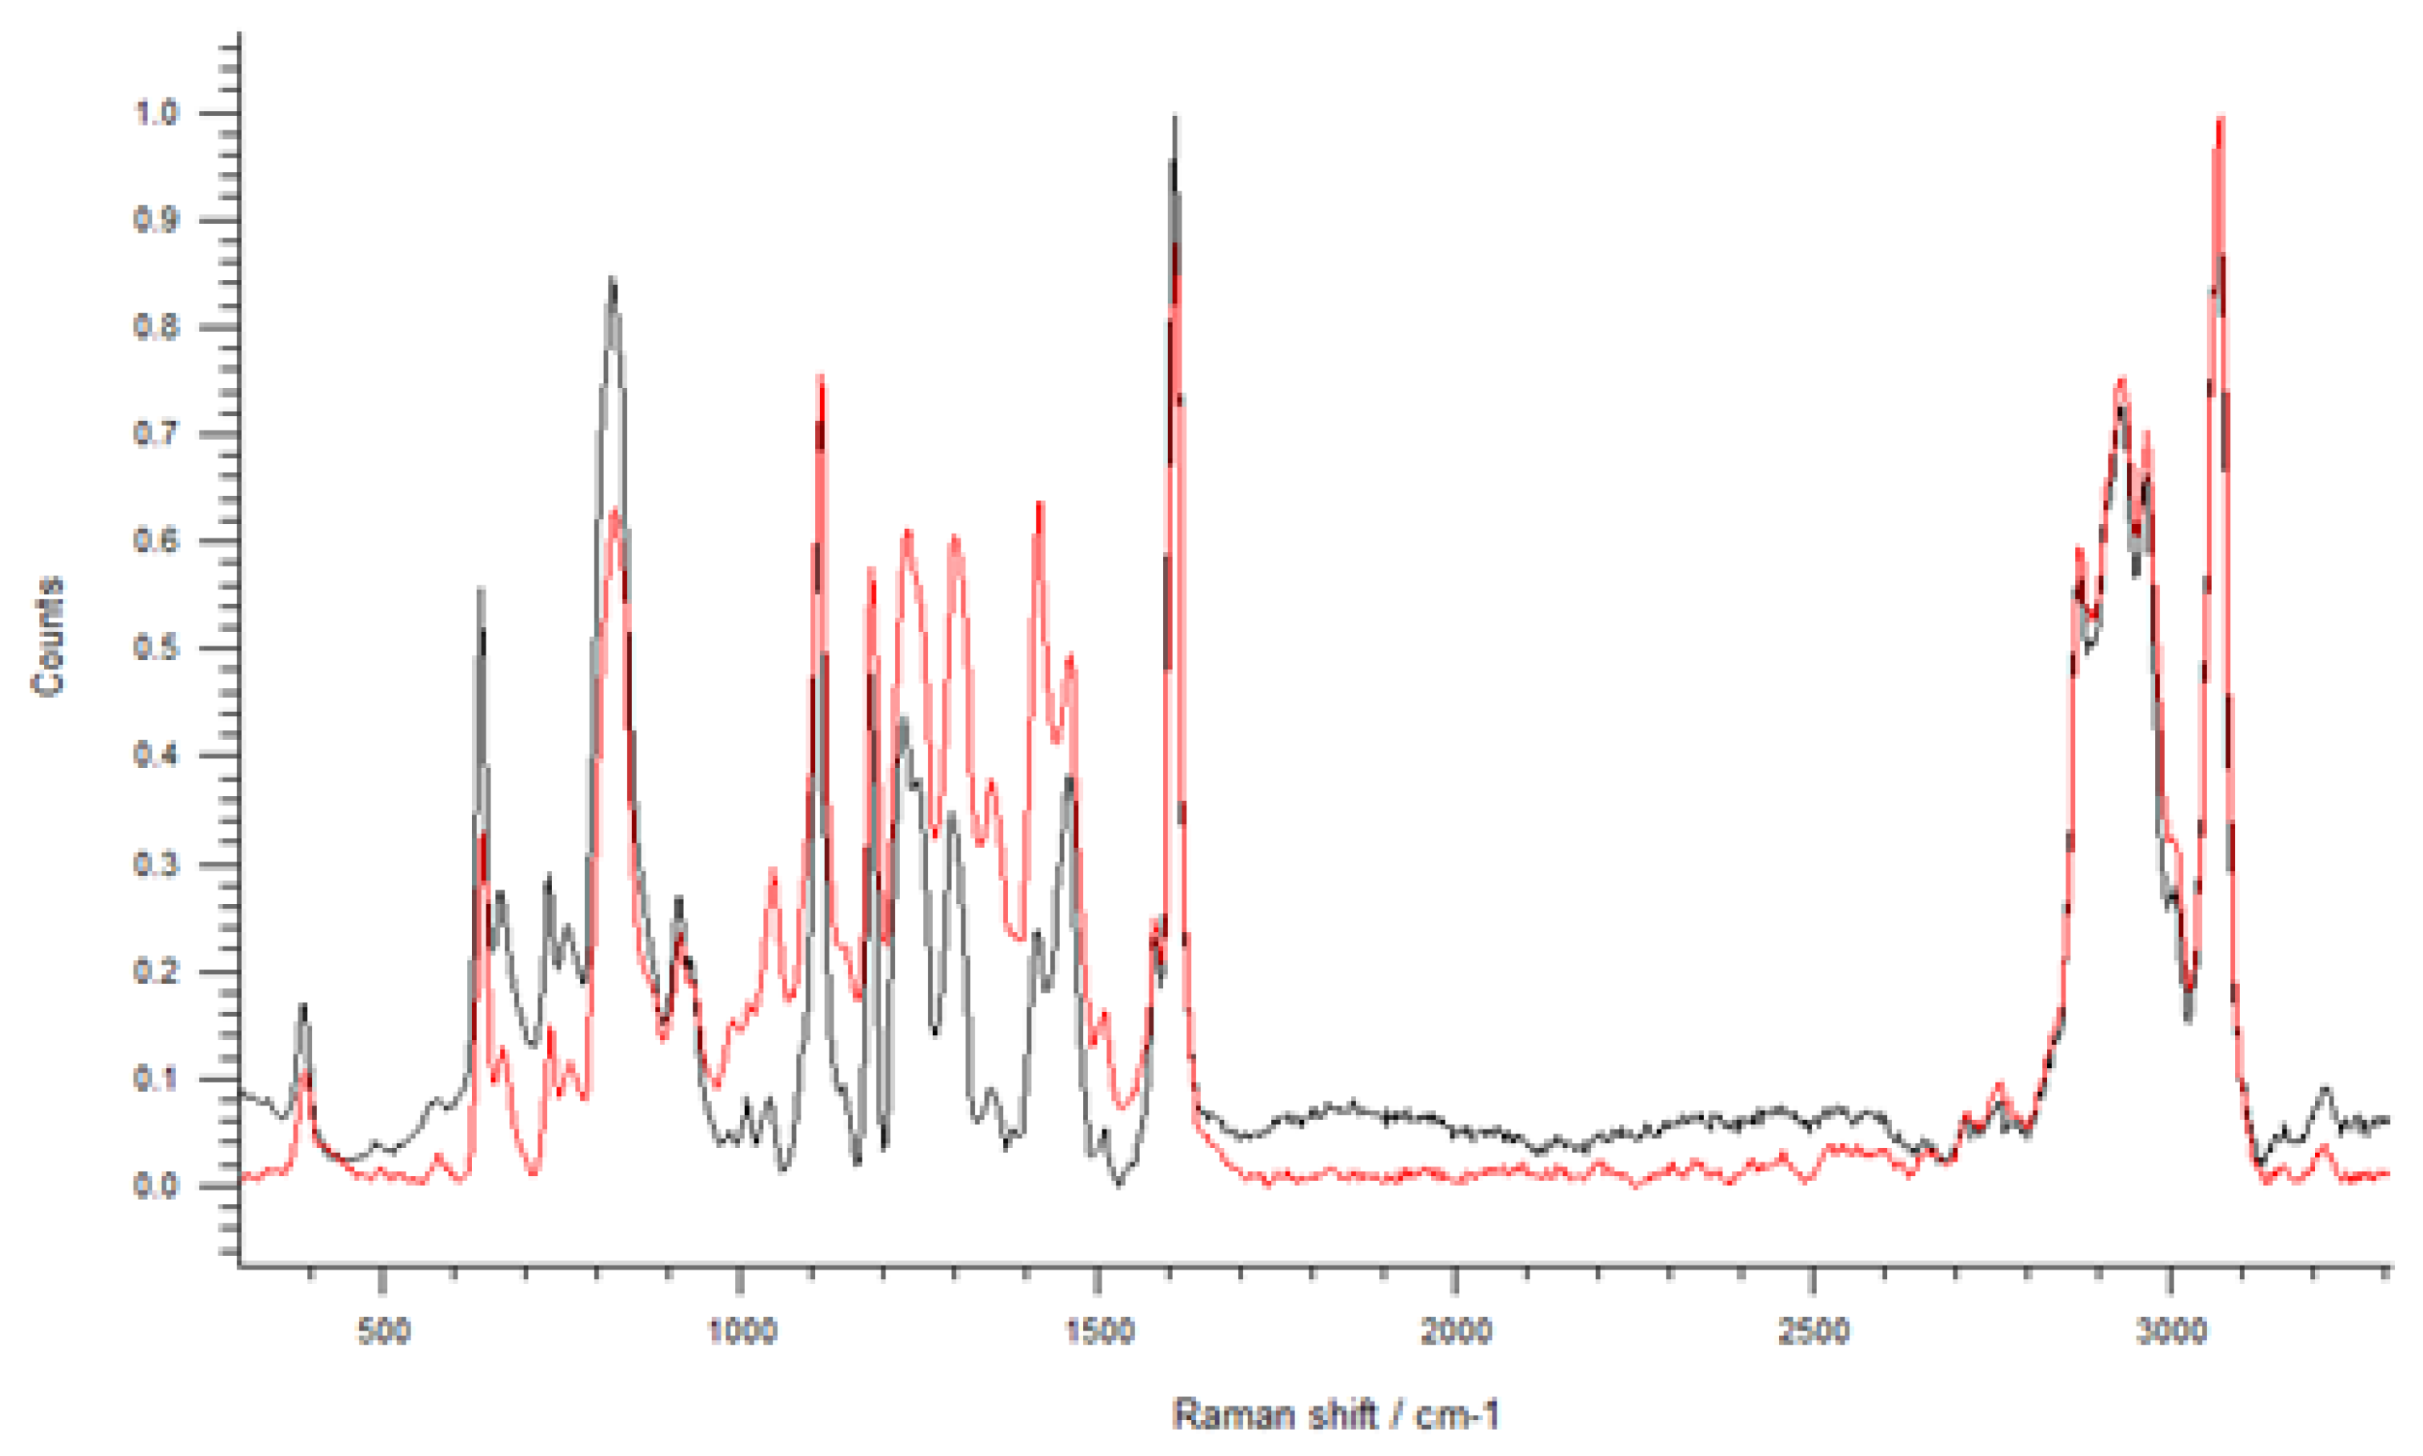
The study of Raman spectra has led to interesting evidence regarding the polymer chain of epoxy resin. With the confocal Raman microscope, it is possible to detect spectra in more internal areas of the composites compared to FTIR, to understand the phenomenon of corrosion and degradation of the resin and composites. The Raman spectrum of pure resin samples at day zero and at the end of aging are shown in
Figure 13.
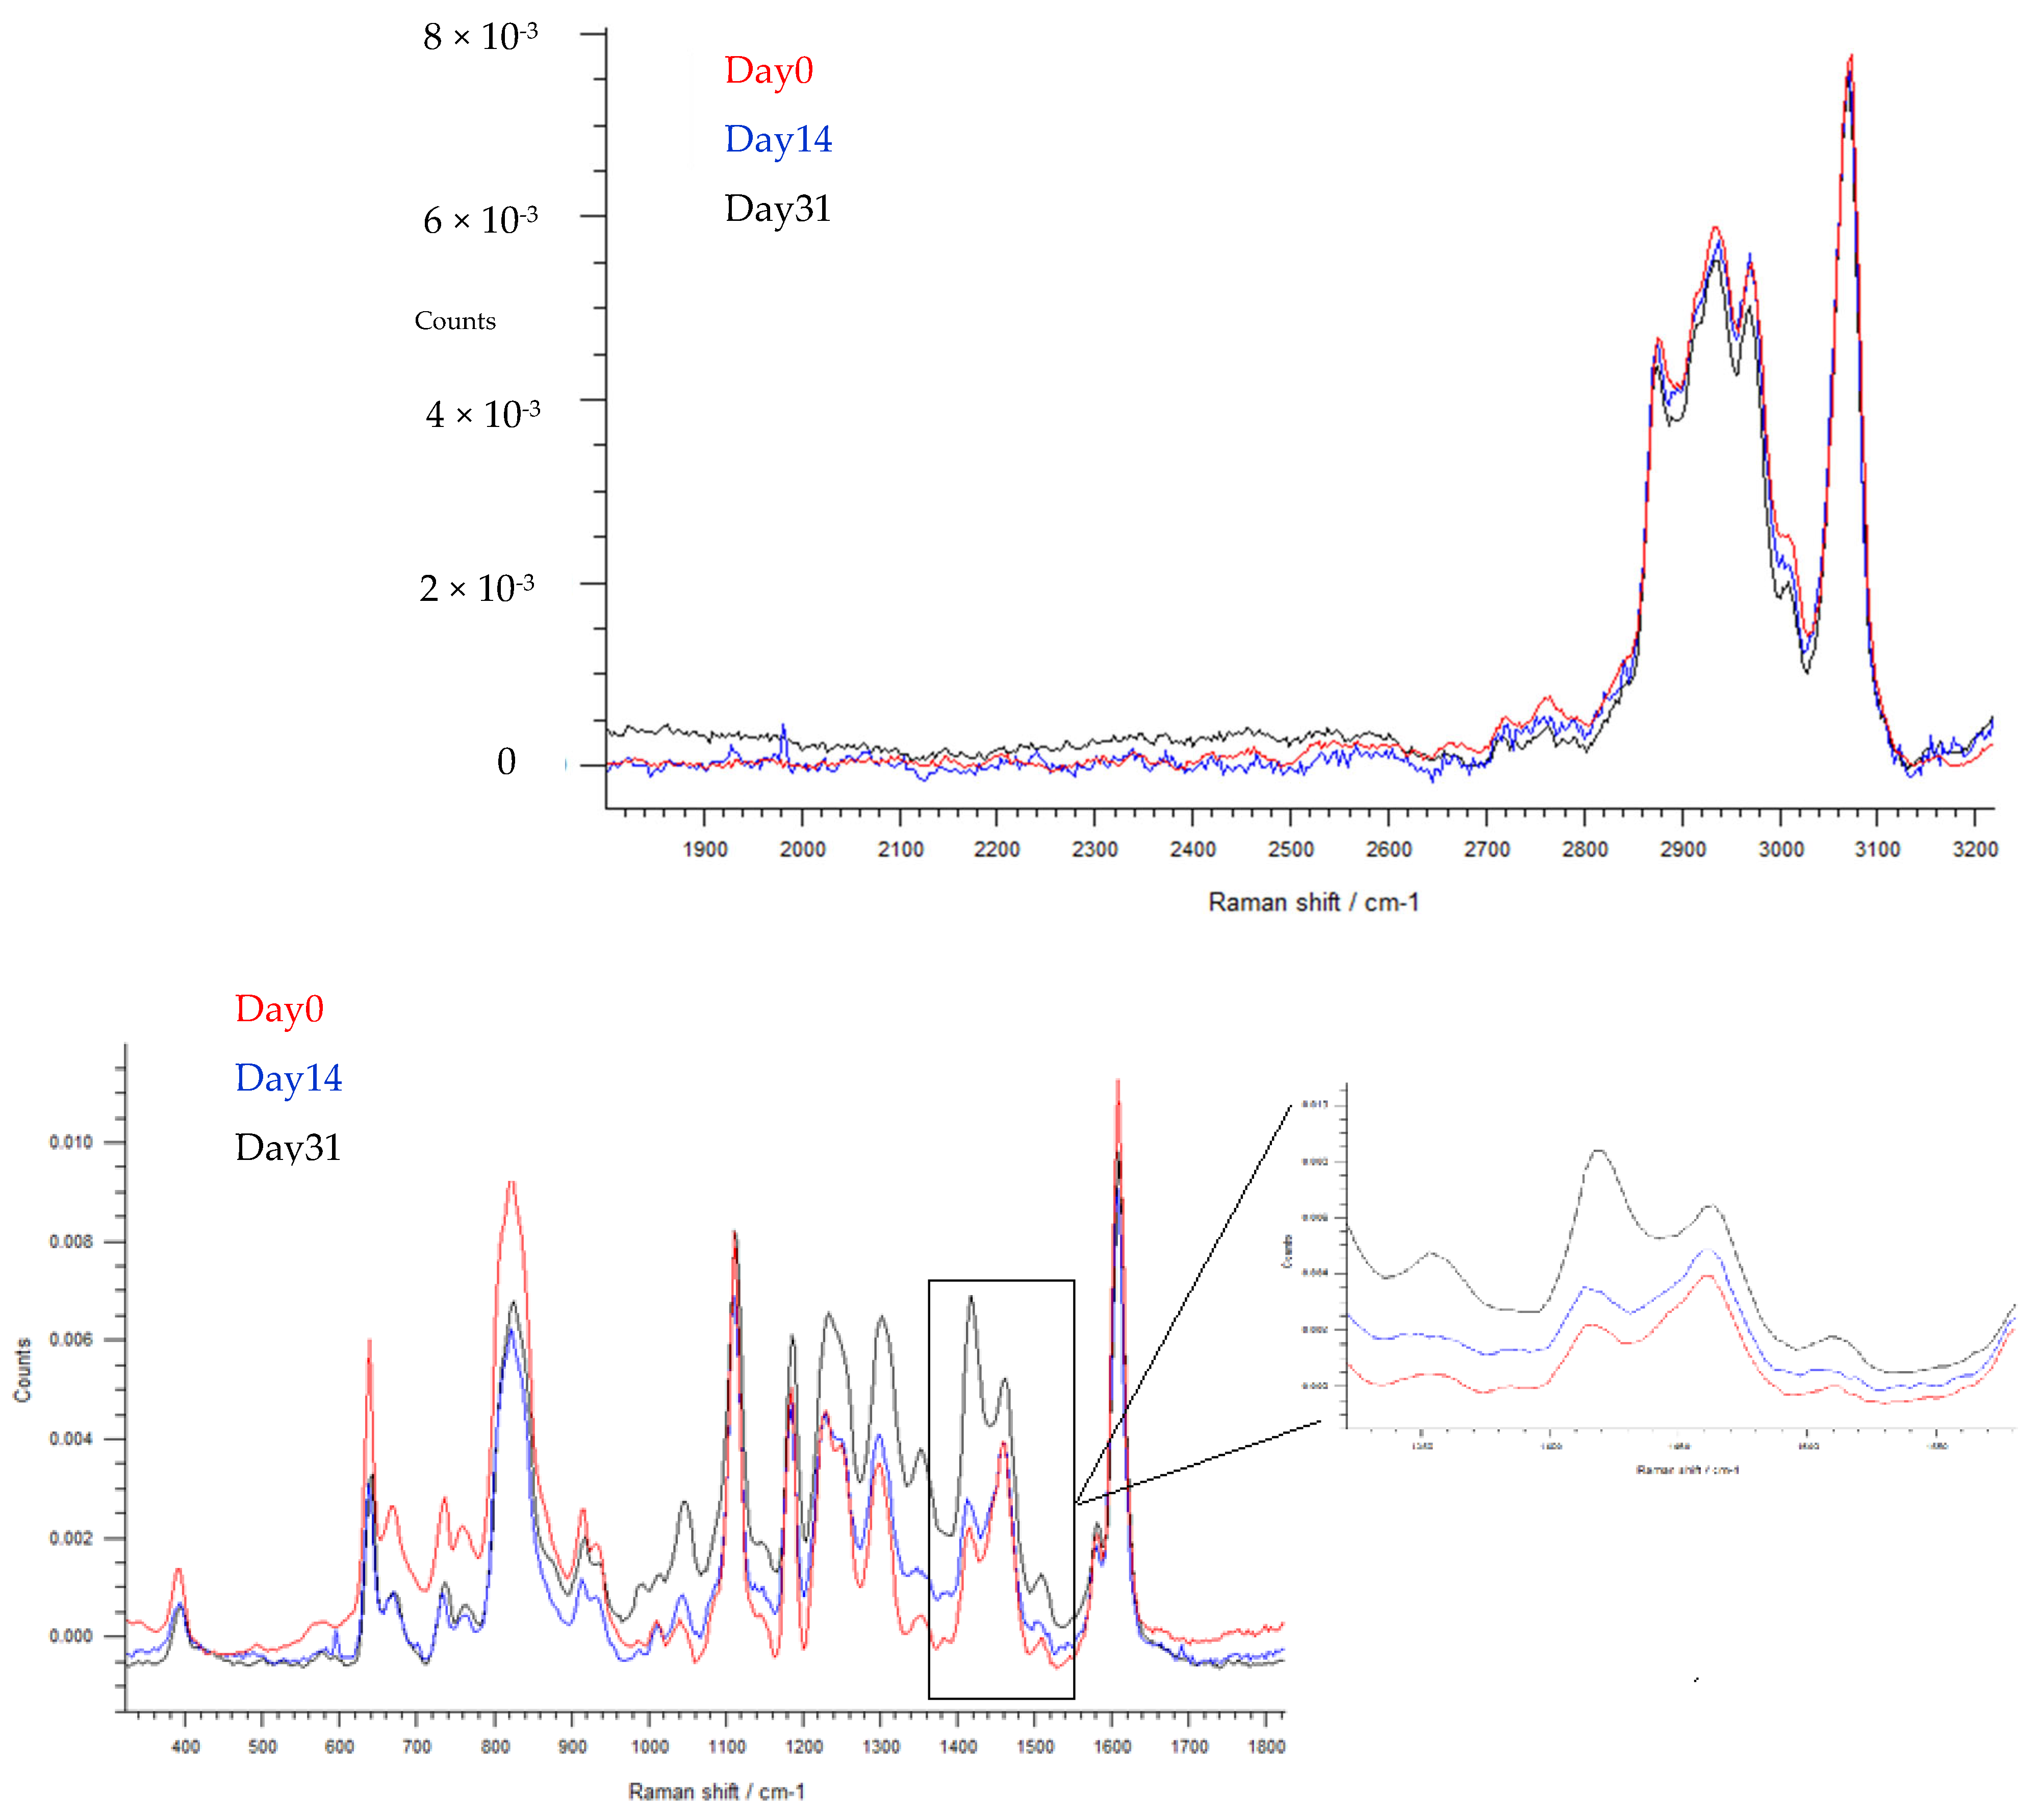
Studying the various areas of the spectrum in detail, we see that between 1800–3200 cm
−1 there is no change, while there is a change in the ratio between two signals in the area between 300–1800 cm
−1 (
Figure 14 shows enlargements of the areas of the spectrum in question for three aging times).
The bands that undergo a change in intensity are those at 1416 cm
−1, which increases and 1465 cm
−1, which decreases. Comparing these signals with the data in the literature, it is quite reasonable to attribute them to a modification of the aromatic groups, or their substituents, in the polymer chain by the action of the acid [
31]. In parallel, one could think of the development of a radical mechanism that would go on to modify the very structure of the benzene ring [
27]. This behavior occurs in pure resin samples prepared at 2000 rpm and 5000 rpm. Evidence from the analysis of the sample at 1000 rpm is interesting. This sample reports no change in the Raman spectrum after aging for 31 days in sulfuric acid. This result can be explained on the basis of what was observed with the FTIR. From the low wavelength infrared spectroscopy, a decrease in signal was detected at 915 cm
−1 until it disappeared. This behavior is due to the opening of the unreacted epoxy rings. When the acid arrives at the surface of the sample, it will be at first engaged in the reaction of opening of the epoxy ring that has a very high reactivity. As it ages, it will cause the changes observed in the Raman spectrum and attributed to changes in the polymer chain. This is true for the thinner samples.
The sample at 1000 rpm, shows the decrease and disappearance of the signal at 915 cm−1 in the IR spectrum, but shows no change in the Raman spectrum. The IR spectrum penetrates the sample and detects signals at an average depth of 1.5 microns. The confocal Raman laser can analyze the sample deeper and thus the inconsistency between the two signals can be explained by assuming that since the 1000 rpm sample is thicker than the others, it has more material exposed to attack; this is to say that the number of epoxides available to attack by the acid solution is also greater. Based on this, it can be thought that the acid is superficially engaged in the reaction with the epoxy ring and that this delays the degradation of the chain deeper. This, for an aging time of 31 days, leads to a decrease in the IR signal of the bending of the epoxide at the surface, but no change in the intensity of the two Raman signals.
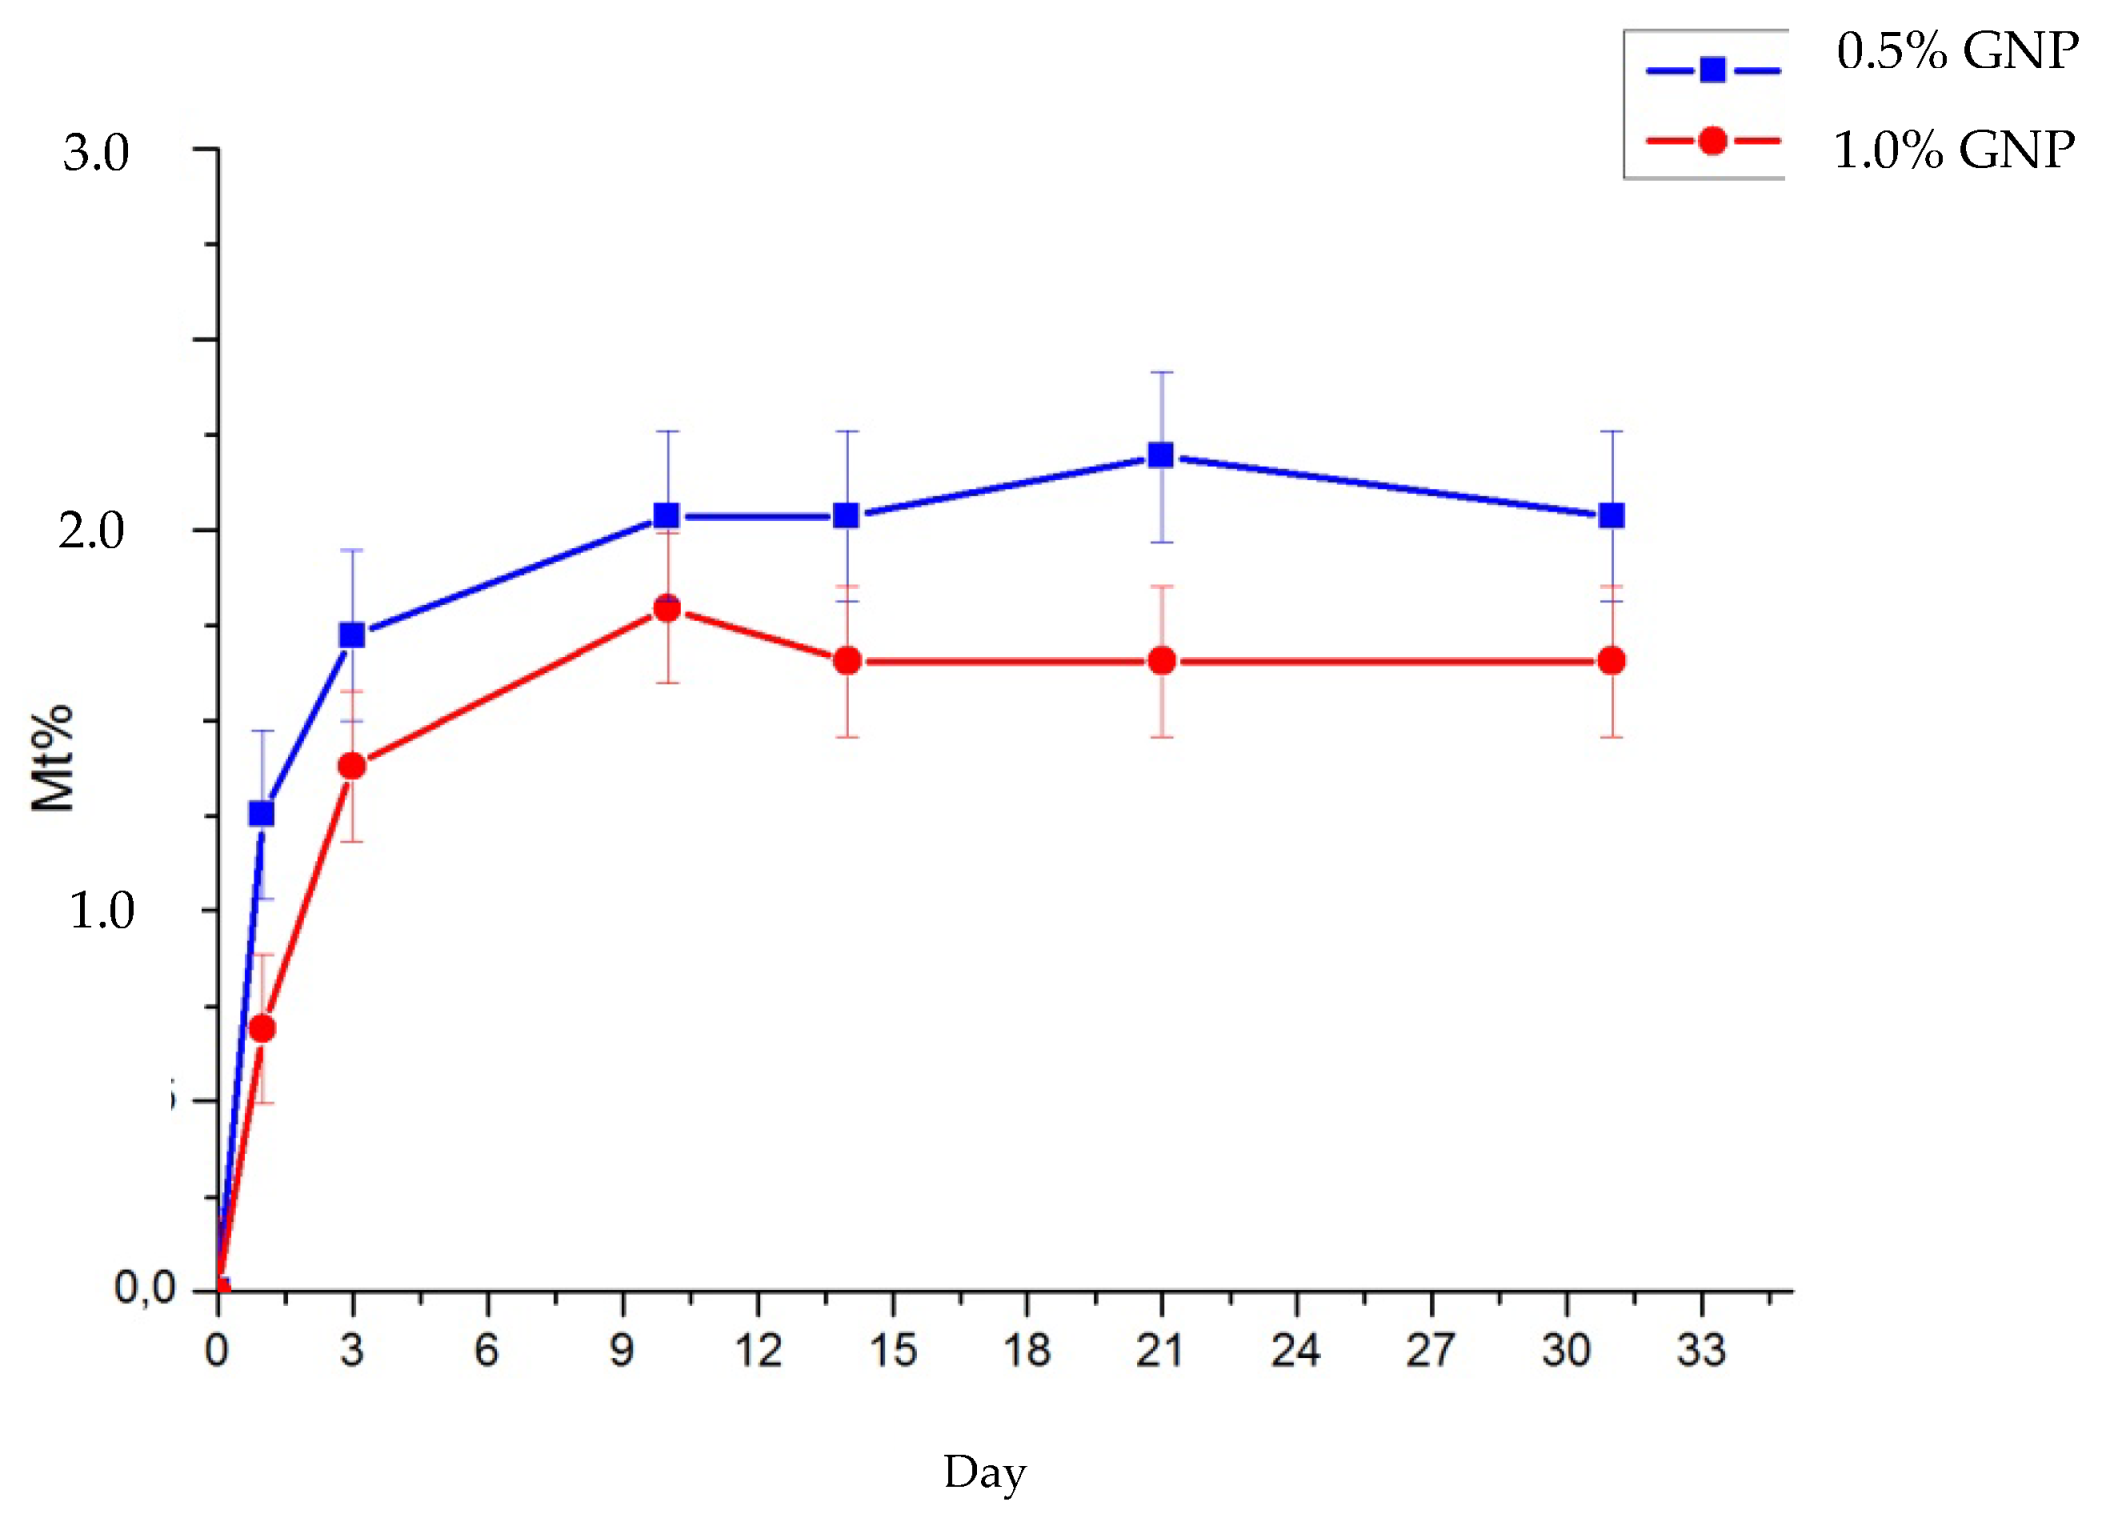
It is very interesting the variation of the behavior of the resin when graphene fillers are added to it and Epoxy/Nanoplate Graphene composites are subjected to sulfuric acid treatment. The concentrations of GNPs chosen are 0.25%, 0.5%, and 1%. The changes in these samples compared to those with pure resin are studied. The detachment of the composites occurred between the 10th and 14th day of aging, i.e., about 10 days after the detachment of the pure resins. In addition, the nanocomposites do not show macroscopic signs of corrosion due to degradation by acid like the samples with pure resin. The study of the mass of these samples detects an initial and rapid increase until the third day and then tends to an equilibrium condition. The initial uptake is due to solution diffusion in the sample as with pure resin, but when compared to it, it is much less noticeable. The three composites with 0.25% GNP exhibit good acid resistance. A study of the mass trend calculated using the same method as for the resins suggests that there is no noticeable degradation with associated loss of material as with the pure resins. Instead, an equilibrium condition is reached, indicated by the plateau that is established from about day 10 (
Figure 15).
The presence of GNPs delays the diffusion of solution in the thin film and therefore corrosion by the acid is to a greater extent superficial.
This phenomenon is even more appreciable for composites with 0.5% and 1% concentration of nanoplates. In these cases, the corrosion is assumed to be only superficial due to the mechanical impossibility of the solution molecules to penetrate inside the film volume because of the barrier formed by the nanoplates. The composites with 0.5% and 1% GNP, with the same thickness, reach an equilibrium condition in less time than the sample with 0.25% GNP and the uptake is lower. The mass trends of the samples at 0.5% and 1% prepared with spin speed of 1000 rpm are shown (
Figure 16).
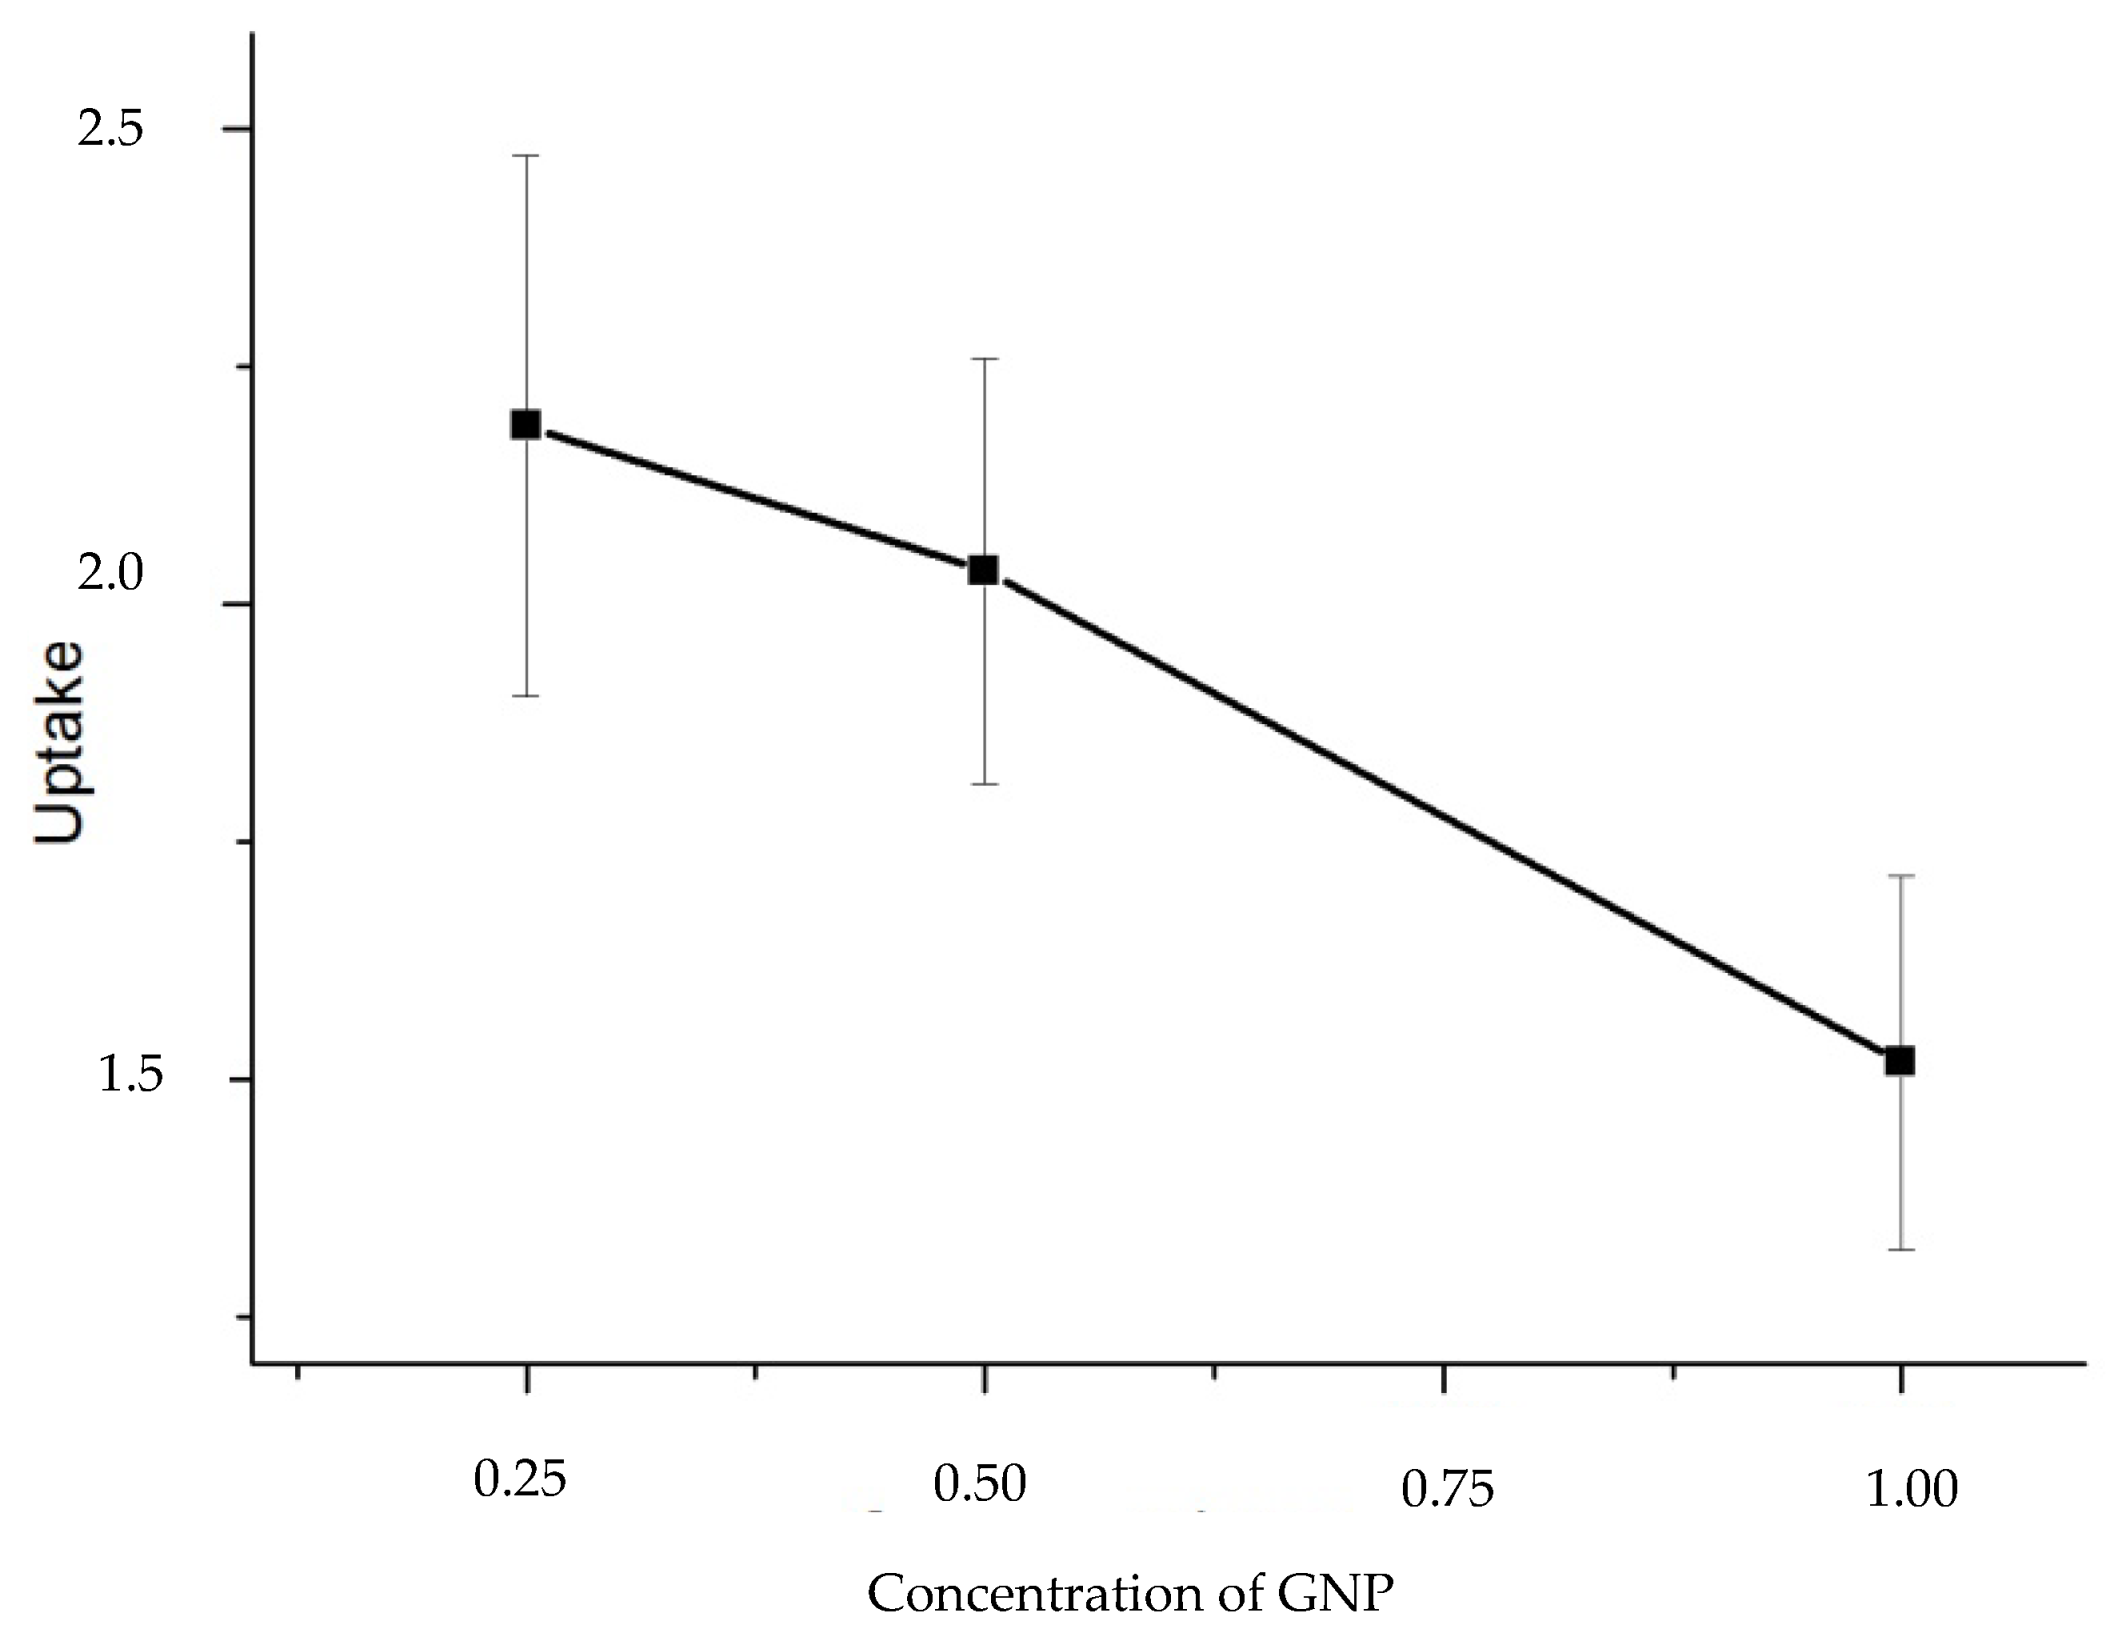
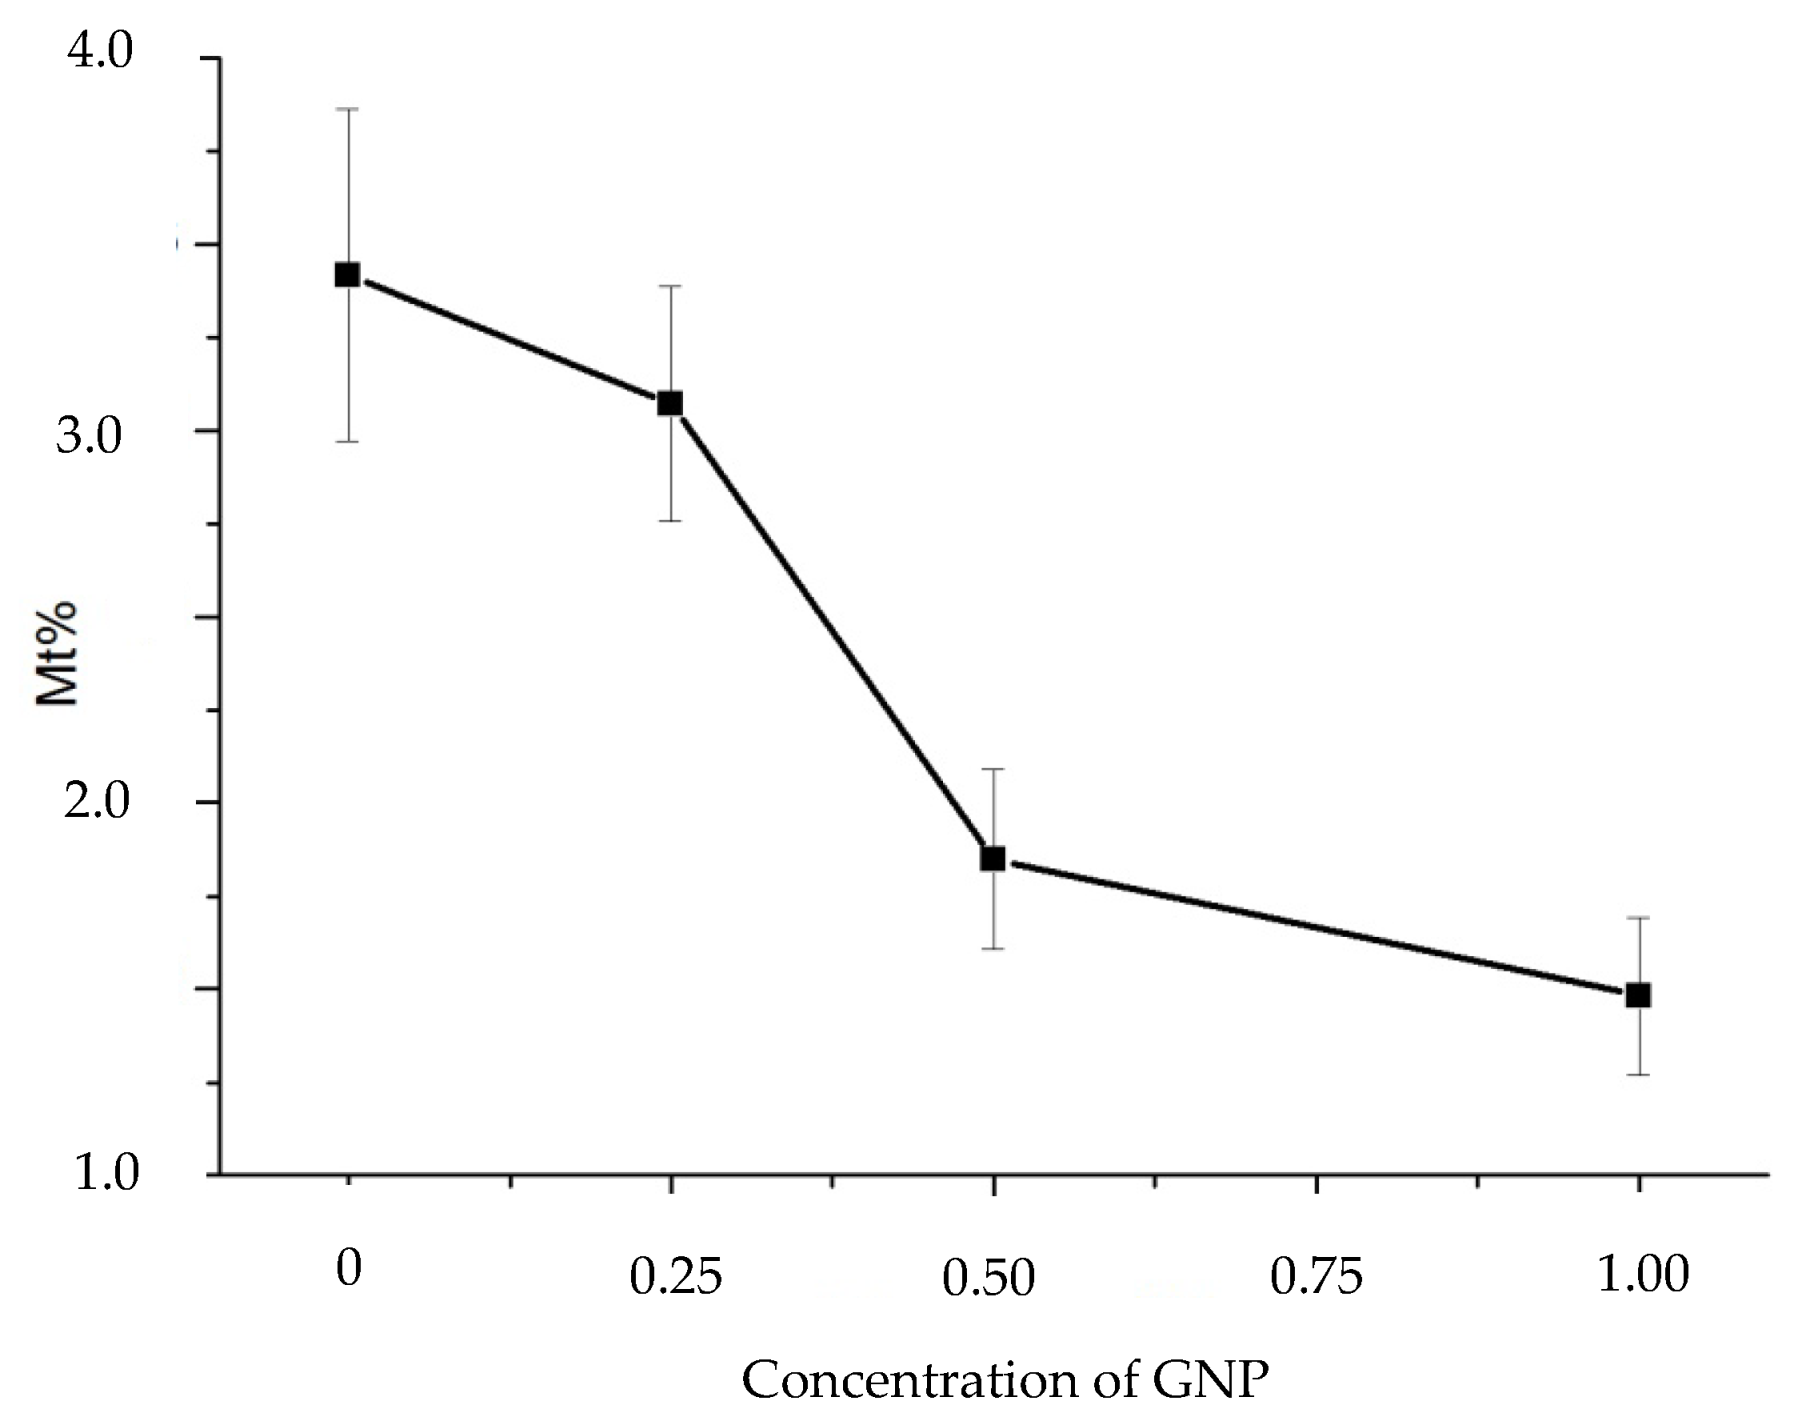
Graphene structures act as a barrier to aqueous solution. First of all, they represent a physical impediment to the passage of liquid molecules through the thin film. Added to this is the hydrophobicity of graphene, which repels water molecules and strengthens the resistance properties of the system. Based on these principles, it can be stated that as the percentage amount of GNP increases, the solution uptake decreases. This is demonstrated by comparing the mass of the three composites at different GNP concentrations, prepared at rpm of 1000, after thirty-one days of aging in 10% sulfuric acid. The final uptake of the samples as a function of the amount of nanoplates is shown in
Figure 17.
Samples prepared at 2000 rpm and 5000 rpm show similar uptake trends as a function of GNP concentration. By studying the infrared spectra of these samples, this result is corroborated. Comparing the H
2O signal area of the composite spectra with that of pure resin, it can be seen that for the latter, the peak is much more intense than for the sample with 1% GNP in which it is practically absent. The samples with nanoplate amounts of 0.25% and 0.5% have intermediate behavior. The IR spectrum of the affected area is shown in
Figure 18.
Infrared analysis of composites prepared at spin rates of 2000 rpm exhibits similar behavior to those at 1000 rpm (shown in
Figure 18), but the H
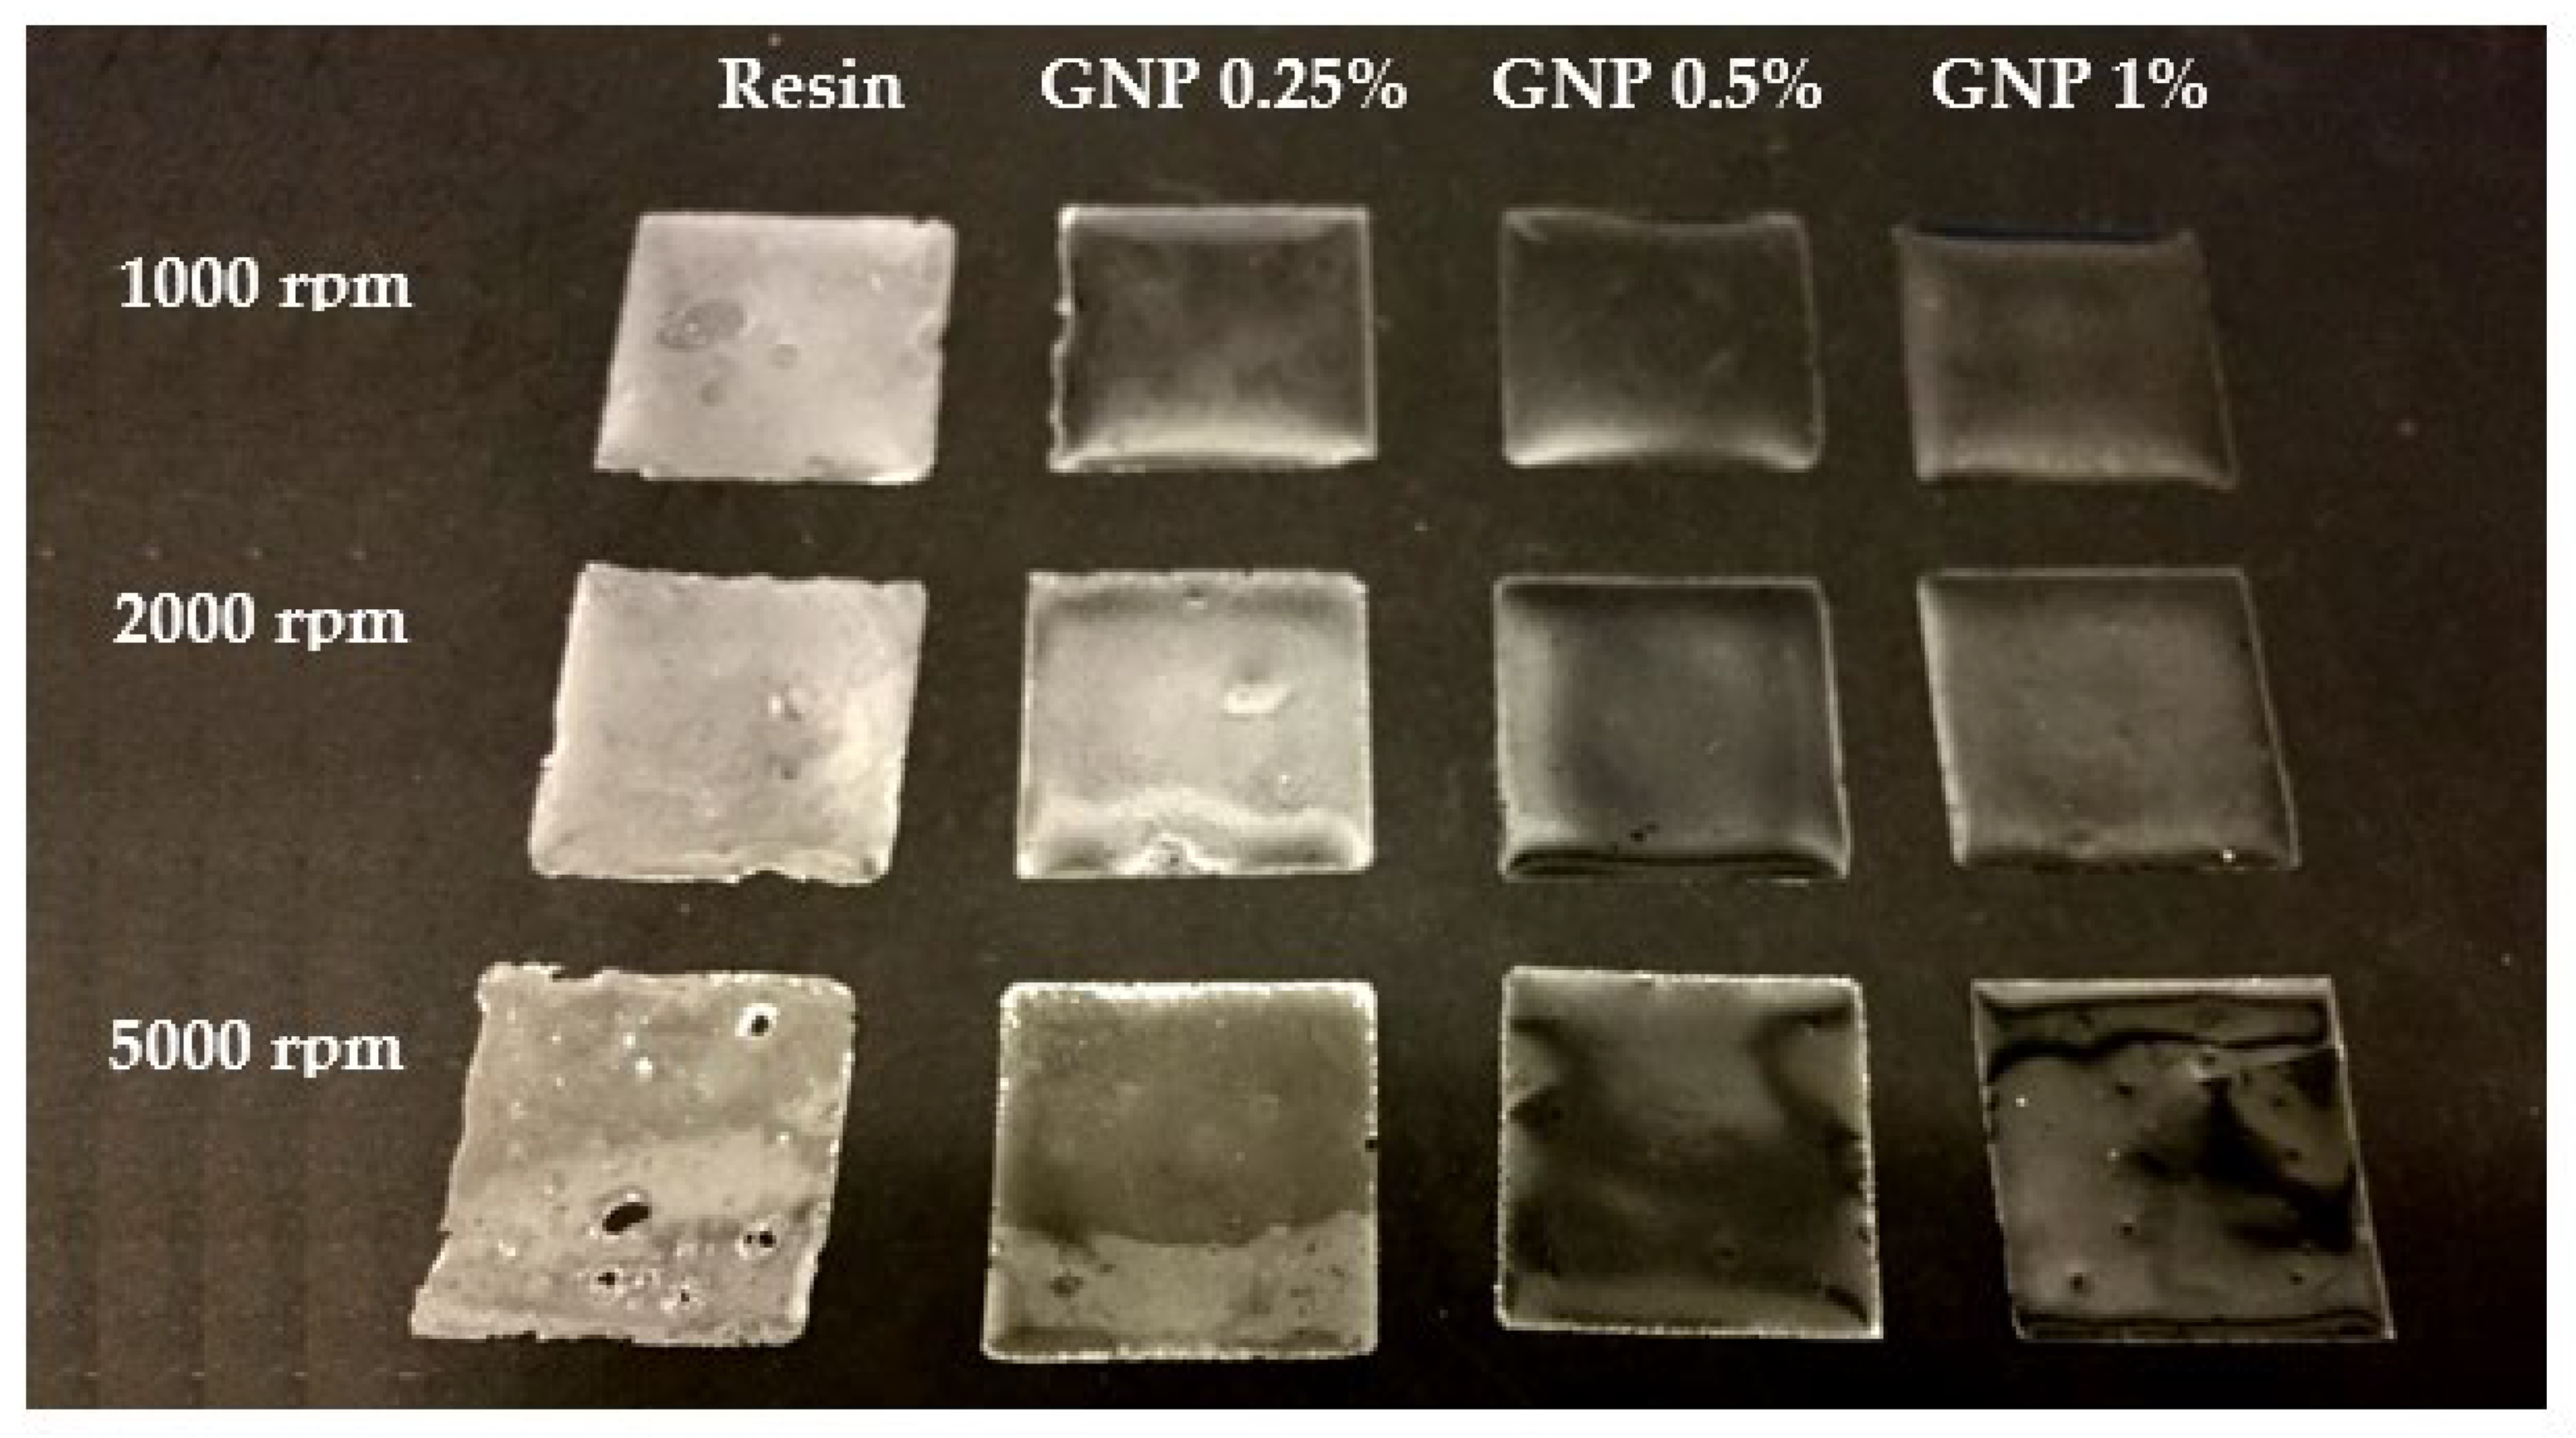
2O signal in pure resin is not fully comparable to that of the composites, as there are non-indifferent degradation effects that cause a decrease in the sites where the polymer can accommodate liquid molecules. This is all the truer for the sample prepared at 5000 rpm. Macroscopic images of the composite samples at different thicknesses compared with the resin-only samples are shown (
Figure 19).
Similarly to resin, it was not possible to selectively study thickness modifications because they are not uniform from the beginning. This is all the truer in the presence of fillers which, by forming clusters and agglomerates, participate in making the surface of the composite less uniform and linear, increasing its roughness. Studying the Raman spectra, it can be seen that the change in the ratio of the two signals at 1416 and 1465 cm
−1 does not occur in composites with 0.25%, 0.5%, and 1% of GNP, and this is true for all the different thicknesses. Thus, assuming that this variation is due to chain modification by acid attack, the presence of the graphene nanostructures really delays the diffusion of the solution within the material and thus the degradation of the polymer chains.
Figure 20 shows the spectra of the samples after 31 days of aging.
Next, the specimens were exposed to 31 days of aging in a 3.5% wt. potassium chloride solution, assuming this amount of time was sufficient for an equilibrium condition to be reached. The concentration was established with reference to the literature regarding the use of composite materials against corrosive agents [
32]. Sodium Chloride and Potassium Chloride are among the constituents of seawater and marine atmospheres. It is well known that when metals are exposed for long periods of time to these environments they undergo corrosion, so it is necessary to use paints or coatings that retard the process. For this purpose, we study the behavior of epoxy resin exposed to Potassium Chloride and if this behavior varies when using Epoxy/GNP composites.
A 3.5% wt KCl solution is prepared by dissolving 3.5000 g of Potassium Chloride, weighed with an analytical balance, in 100 mL of water. Four Petri dishes were filled with 25 mL of such solution and then composites with 0.25, 0.5, and 1% GNP concentration and pure resin samples were immersed. Each thin film is studied relative to three different thicknesses corresponding to spin speeds of 1000, 2000, and 5000 rpm. A polymer immersed in an electrolyte solution mainly swells due to the infiltration of water and electrolyte molecules into the material. This swelling will affect the properties of the polymer by changing the mechanical strength, hardness, and in some cases conductivity.
During the aging time chosen, no appreciable modifications of the samples were evidenced. The detachment from the glassy support occurred both for resins and composites between the twenty-first and thirty-first day of aging. It is not possible to state with certainty whether the detachment of the resins was earlier than that of the composites, since no analyses were performed for days intermediate to the indicated aging days. In a future study we could focus on that time window to better understand the phenomenon. The hypothesis that the presence of GNP delays sample detachment is credited by the mass data.
If we assume that the slide removal is caused by the infiltration of the aqueous solution at the interface between the compound and the substrate, which begins at the edges of the samples and advances toward the center, then comparing the weights determined prior to detachment (i.e., day 21 measurements) provides an estimate of the solution present at the interface. This comparison, at the same rpm, is shown in the graph in
Figure 21. Further evidence is provided by macroscopic images of the samples after 21 days of aging in a 3.5% aqueous solution of Potassium Chloride (
Figure 22).
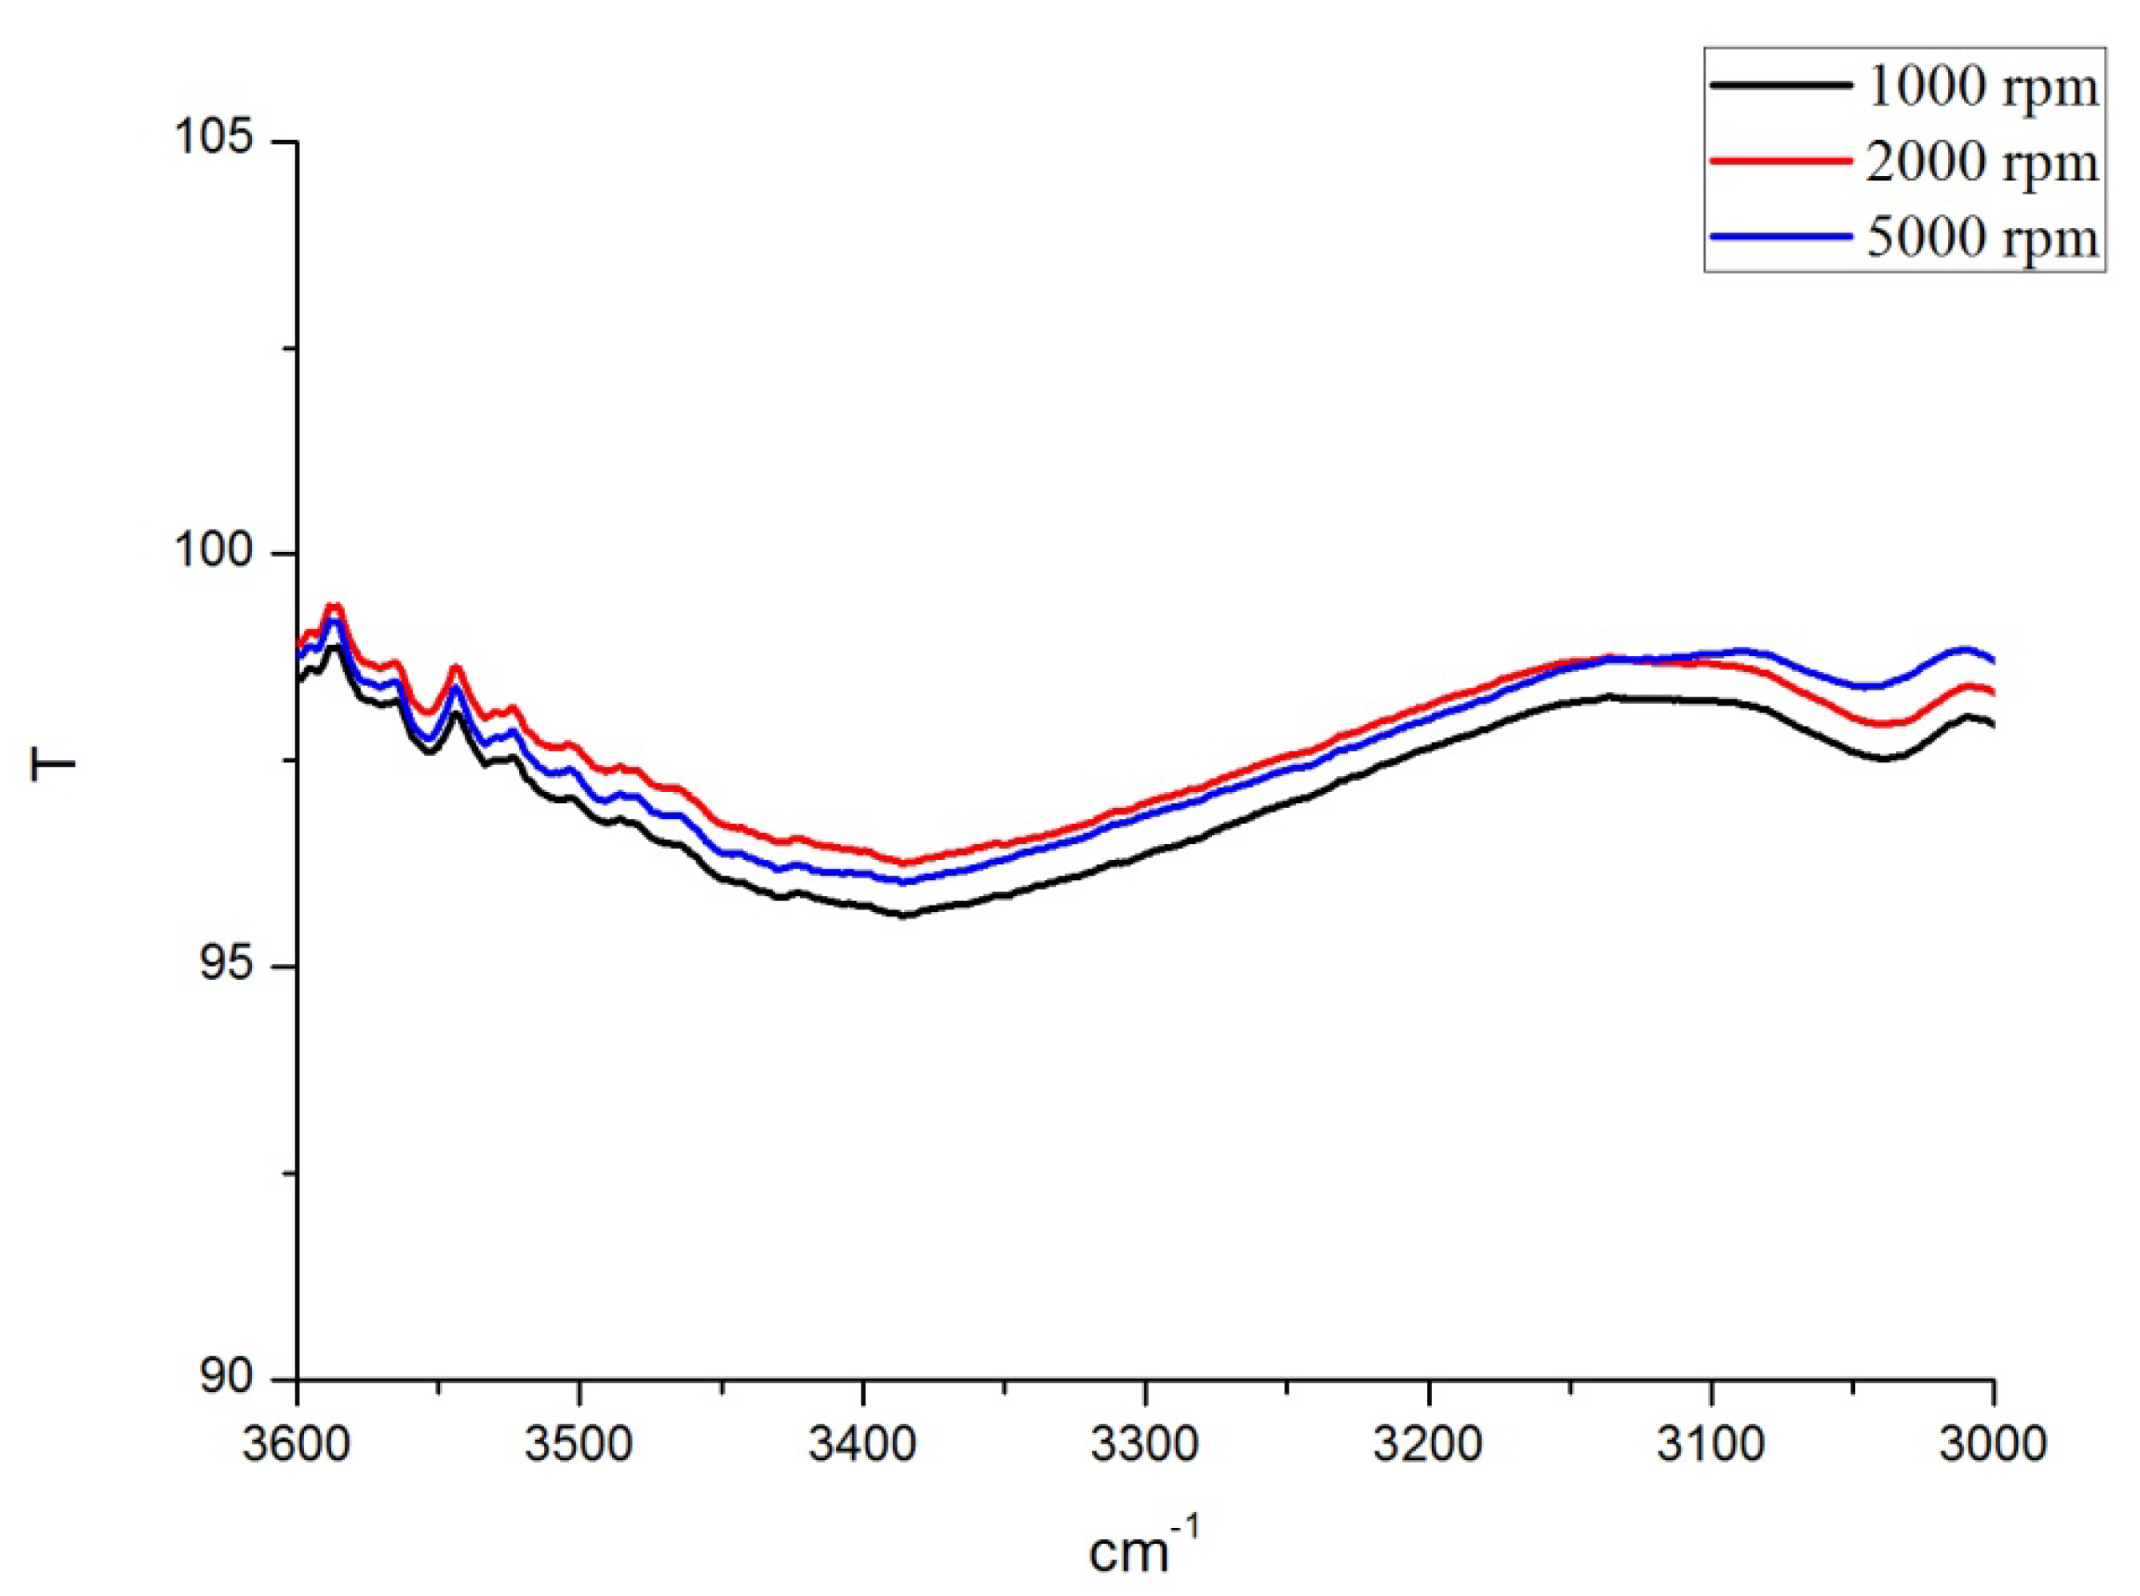
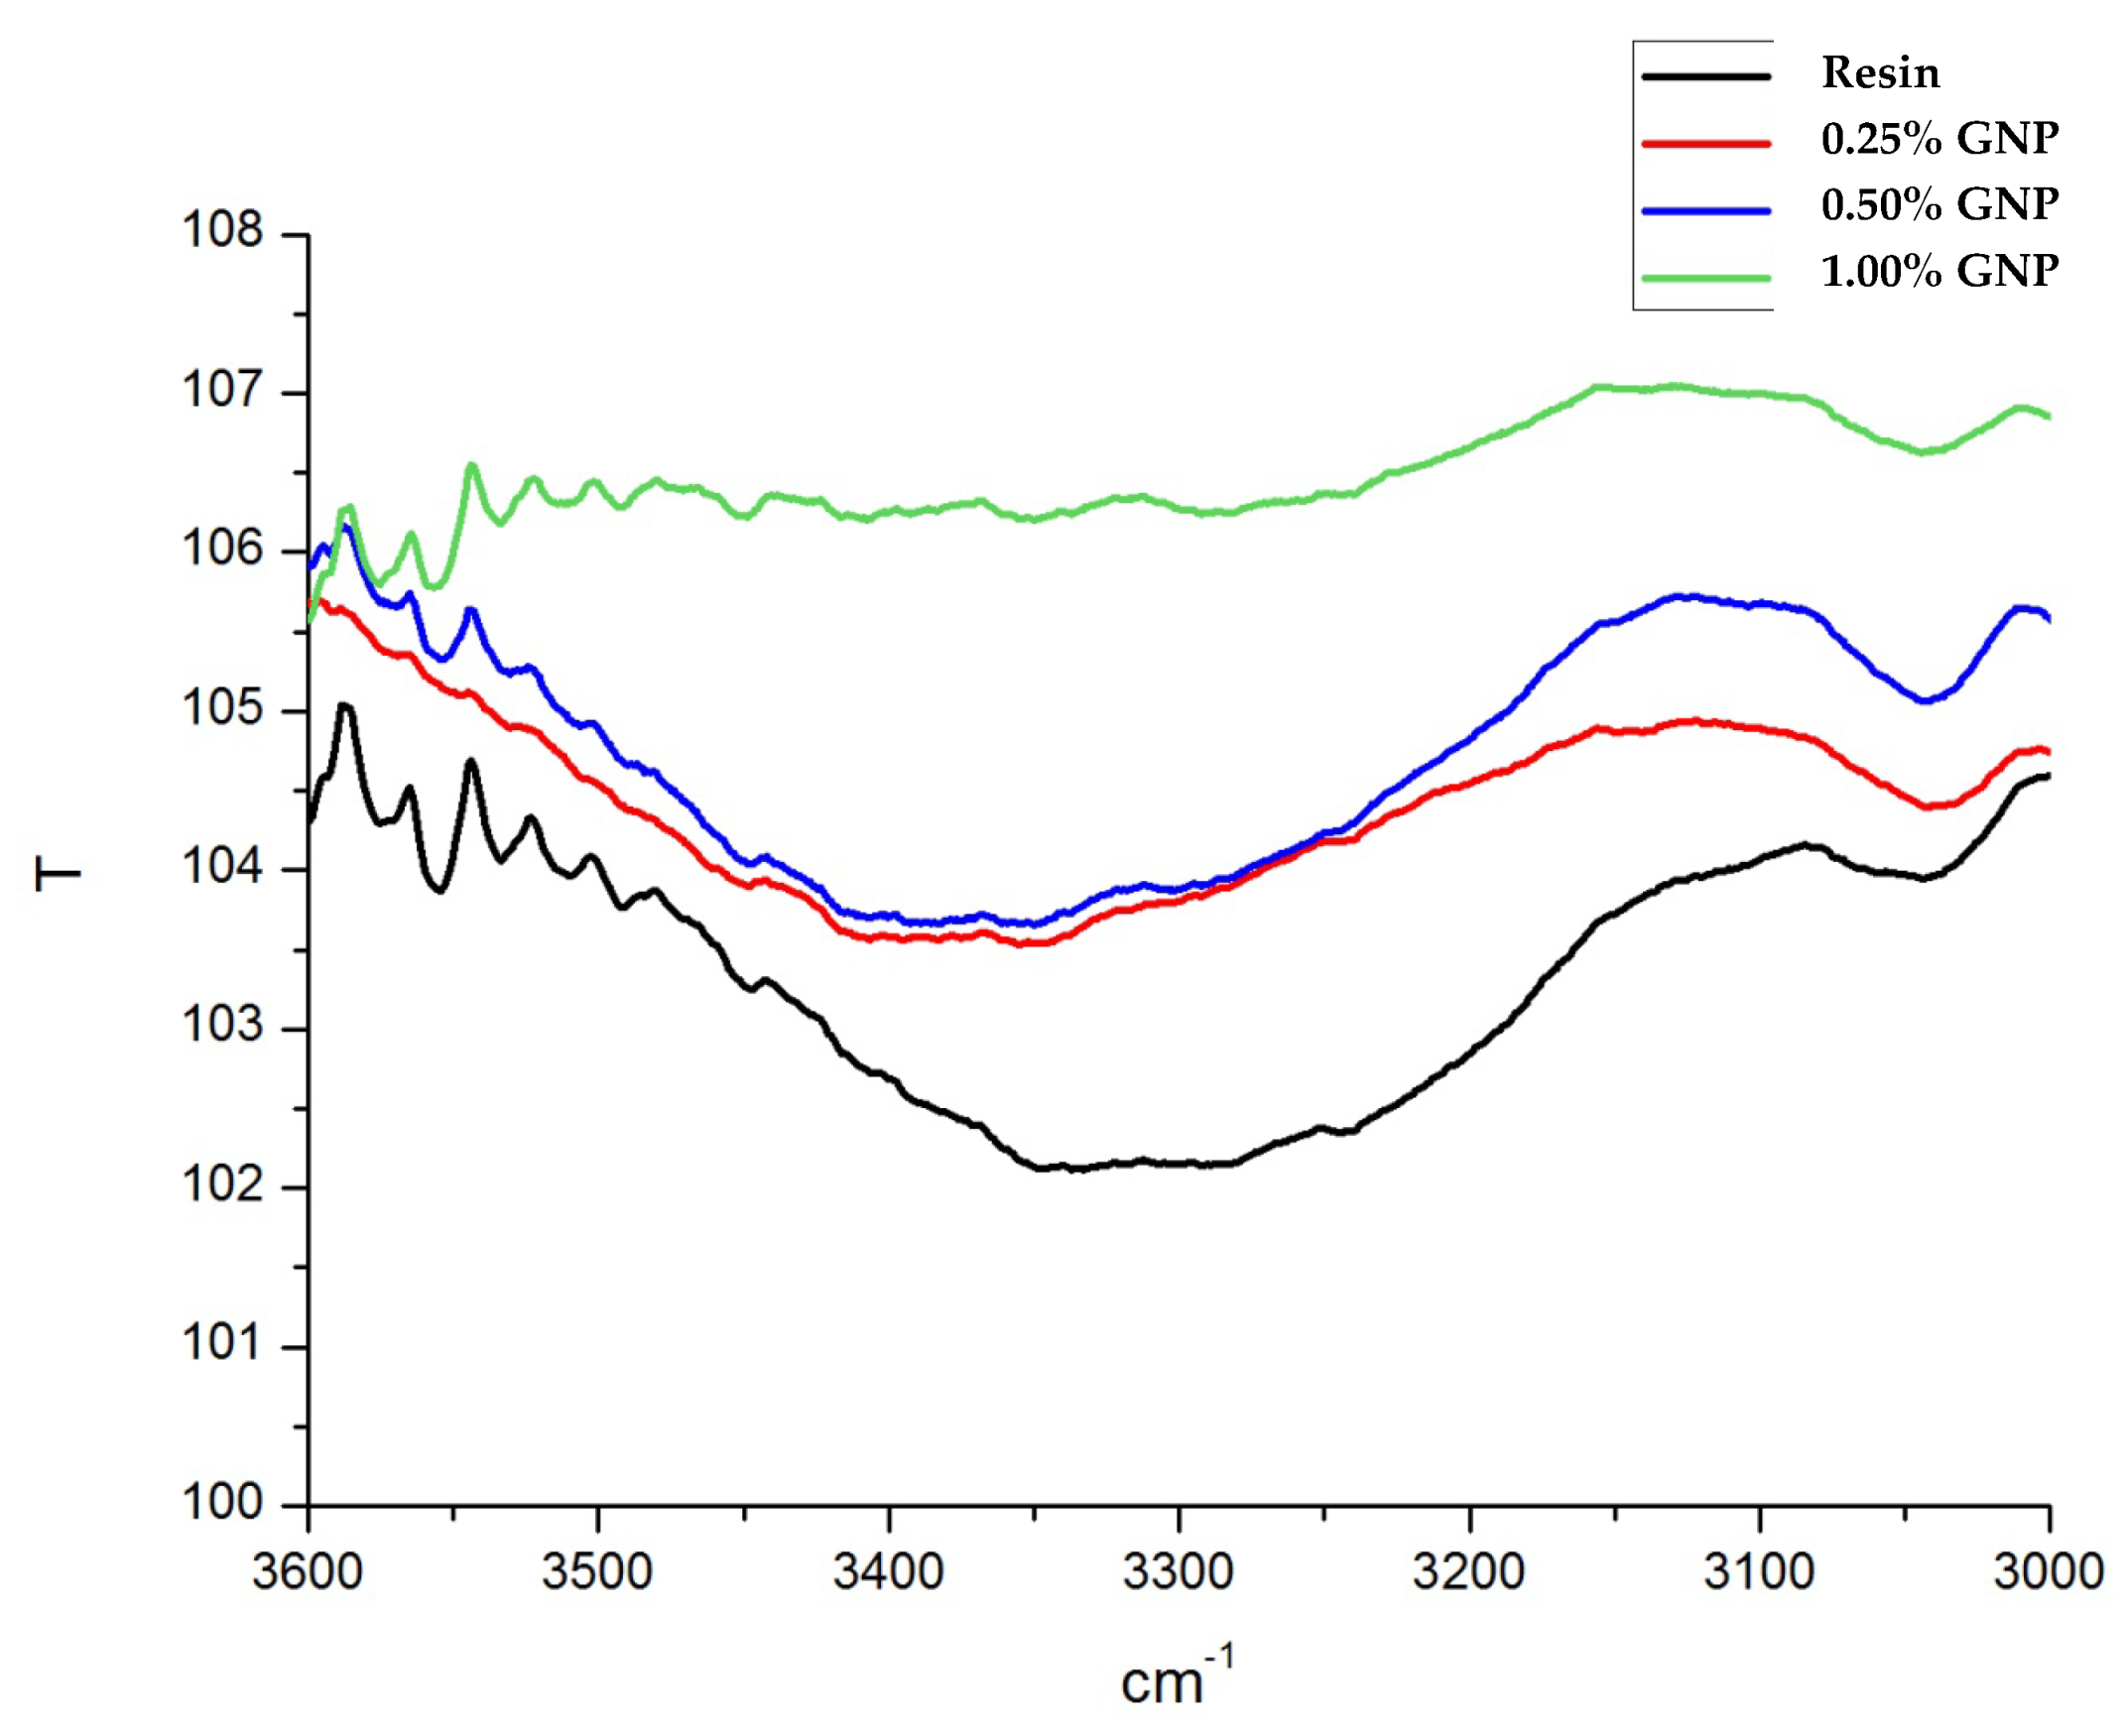
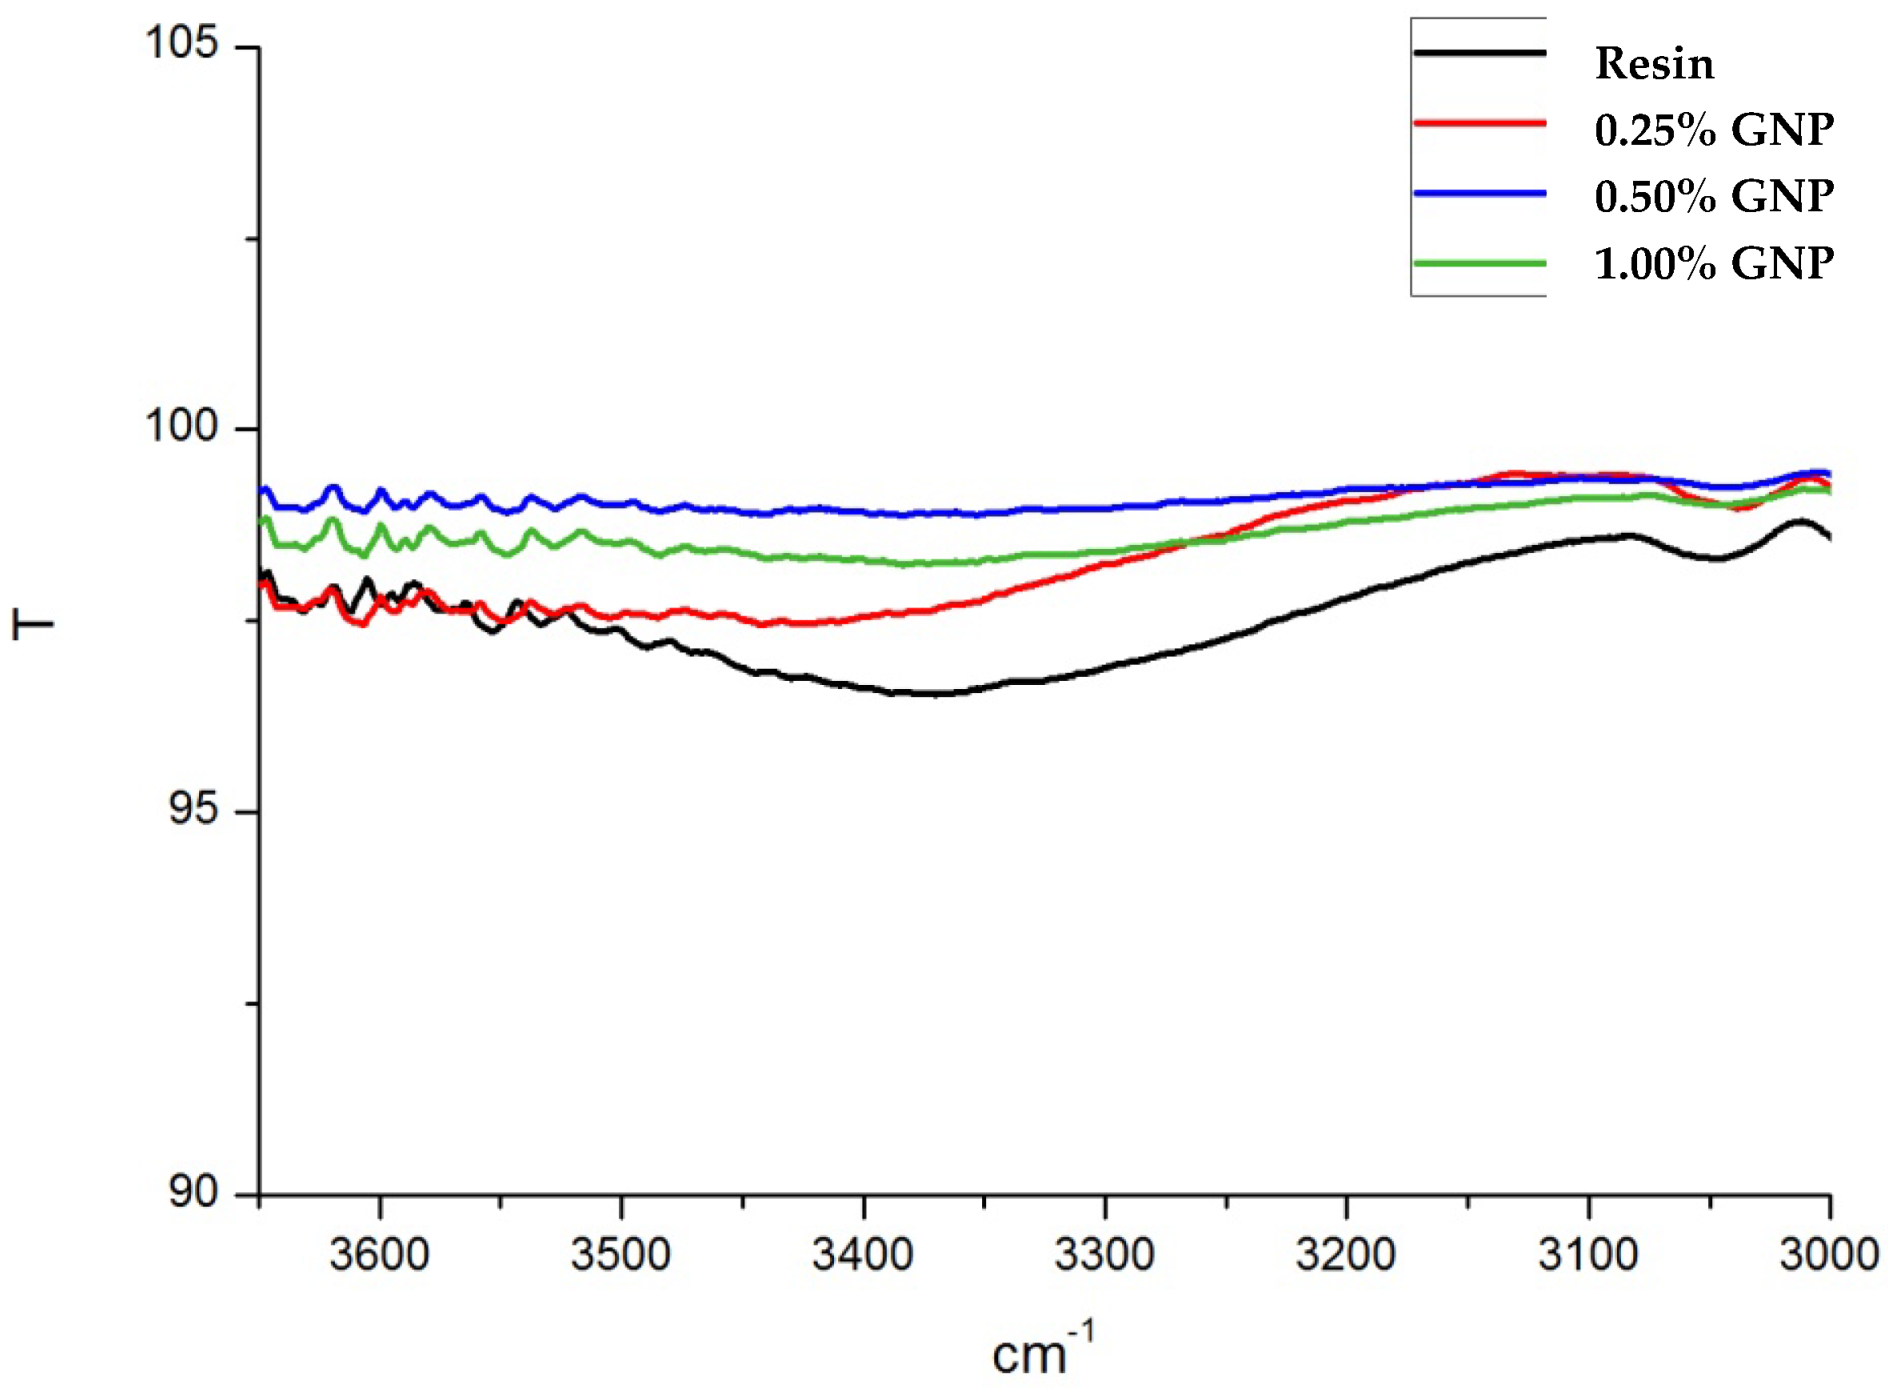
The change in mass with respect to the initial weight considered will also include the liquid that has diffused within the films giving rise to swelling. This phenomenon was verified by infrared spectroscopy. The spectra of the pure resin and those of the three composites with different GNP concentration after 31 days of aging in the aqueous solution of Potassium Chloride were compared, with respect to the region where the signal of the stretching of the O-H bond falls (
Figure 23).
It can be seen that the pure epoxy sample shows the peak relative to the water signal. In contrast, the composites with 0.5% and 1% GNP do not exhibit the peak. The 0.25% Epoxy/GNP thin film has an intermediate behavior between the resin and the two higher concentration composites. In general, the presence of GNP appears to delay detachment and hinder solution diffusion within the composites. Up to day 14 of aging, there was an increase in the mass of the composites (smaller as the GNP concentration increased) but no indication of the presence of H2O within the thin films. The change in weight is attributed to liquid infiltration at the sample/support interface.
Unfortunately, the measurement of the mass variation, calculated with the same methodology applied for acid, does not yield reliable results. This is because the detachment took place on the last day of aging and therefore at this time corresponds, in all samples, a weight loss relative to the thin layer of water accumulated at the sample/support interface and the error on the measurement is too high to draw valid conclusions.
Diffusion in the polymeric material and composites with 0.25% GNPs begins after about 2 weeks of aging, while in the 0.5% and 1% nanoplate composites, this phenomenon does not occur even after 31 days of exposure to the aqueous KCl solution. Images of the samples after 31 days of aging in potassium chloride are in
Figure 24. From the Raman spectra of the samples, no age-related changes are apparent in either the resins or the composites (
Figure 25).
Analysis of the infrared spectra at low wavelengths reports interesting evidence. The signal related to the bending of CH-O-CH
2 at 915 cm
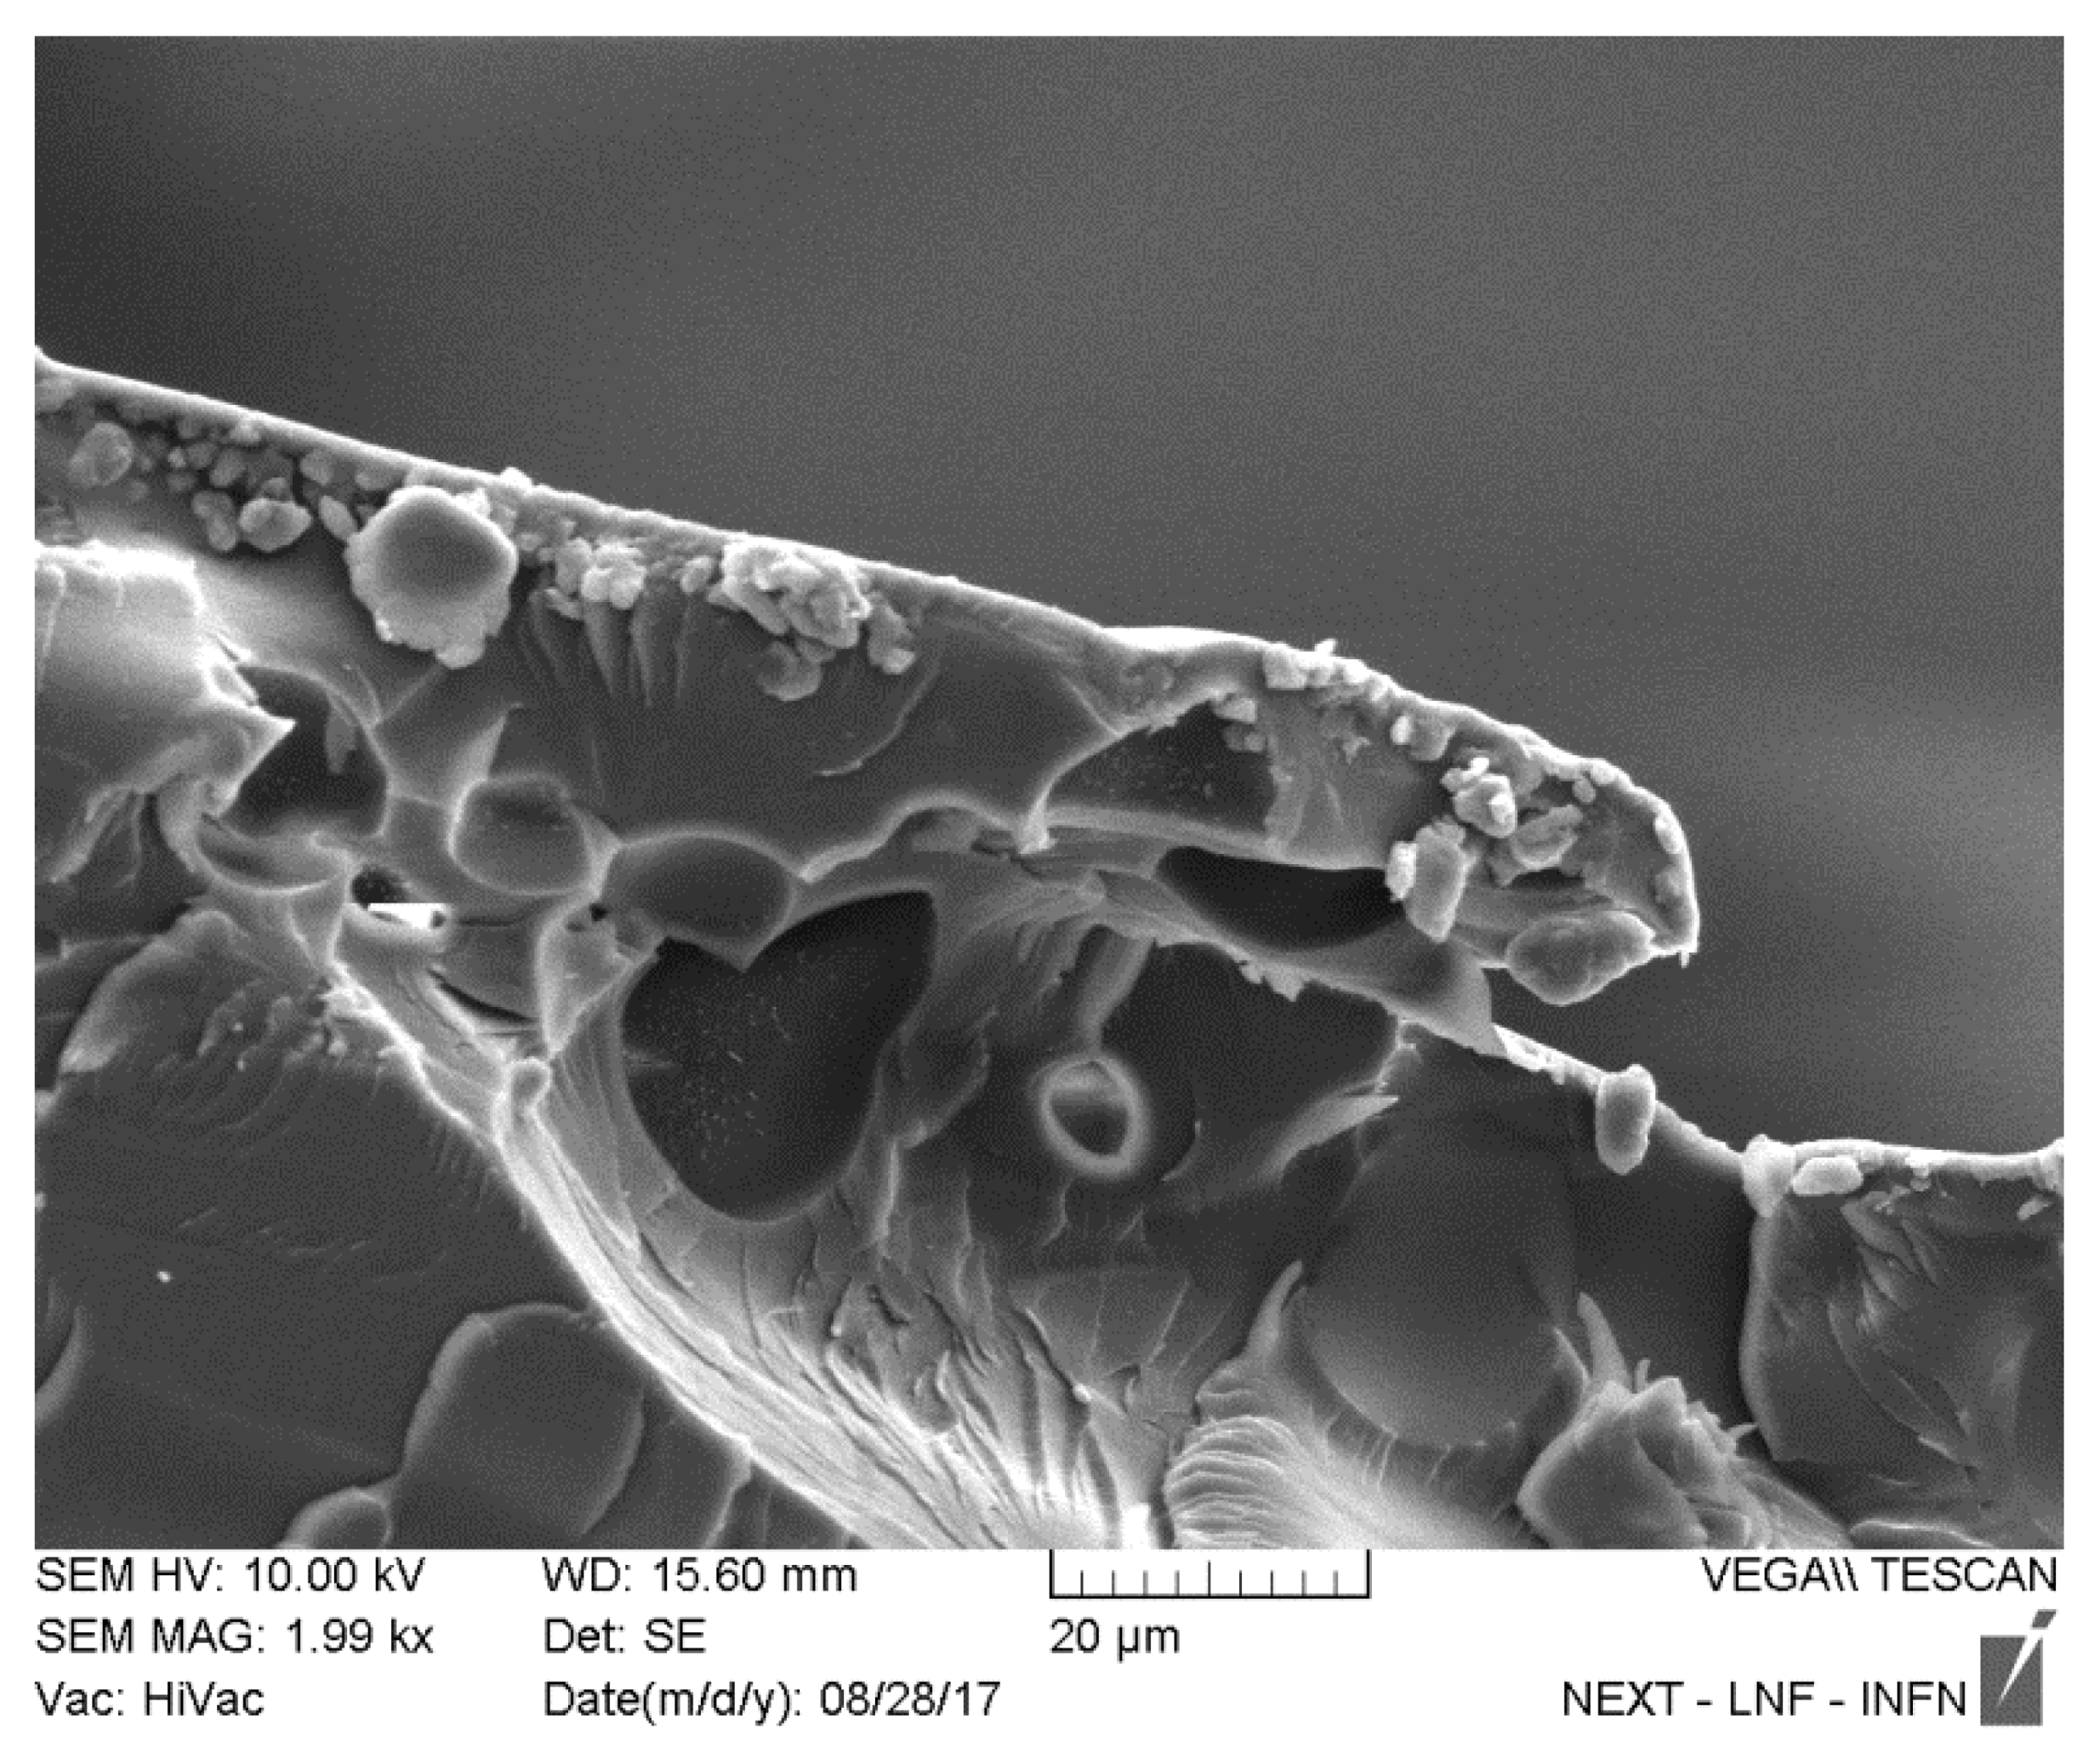
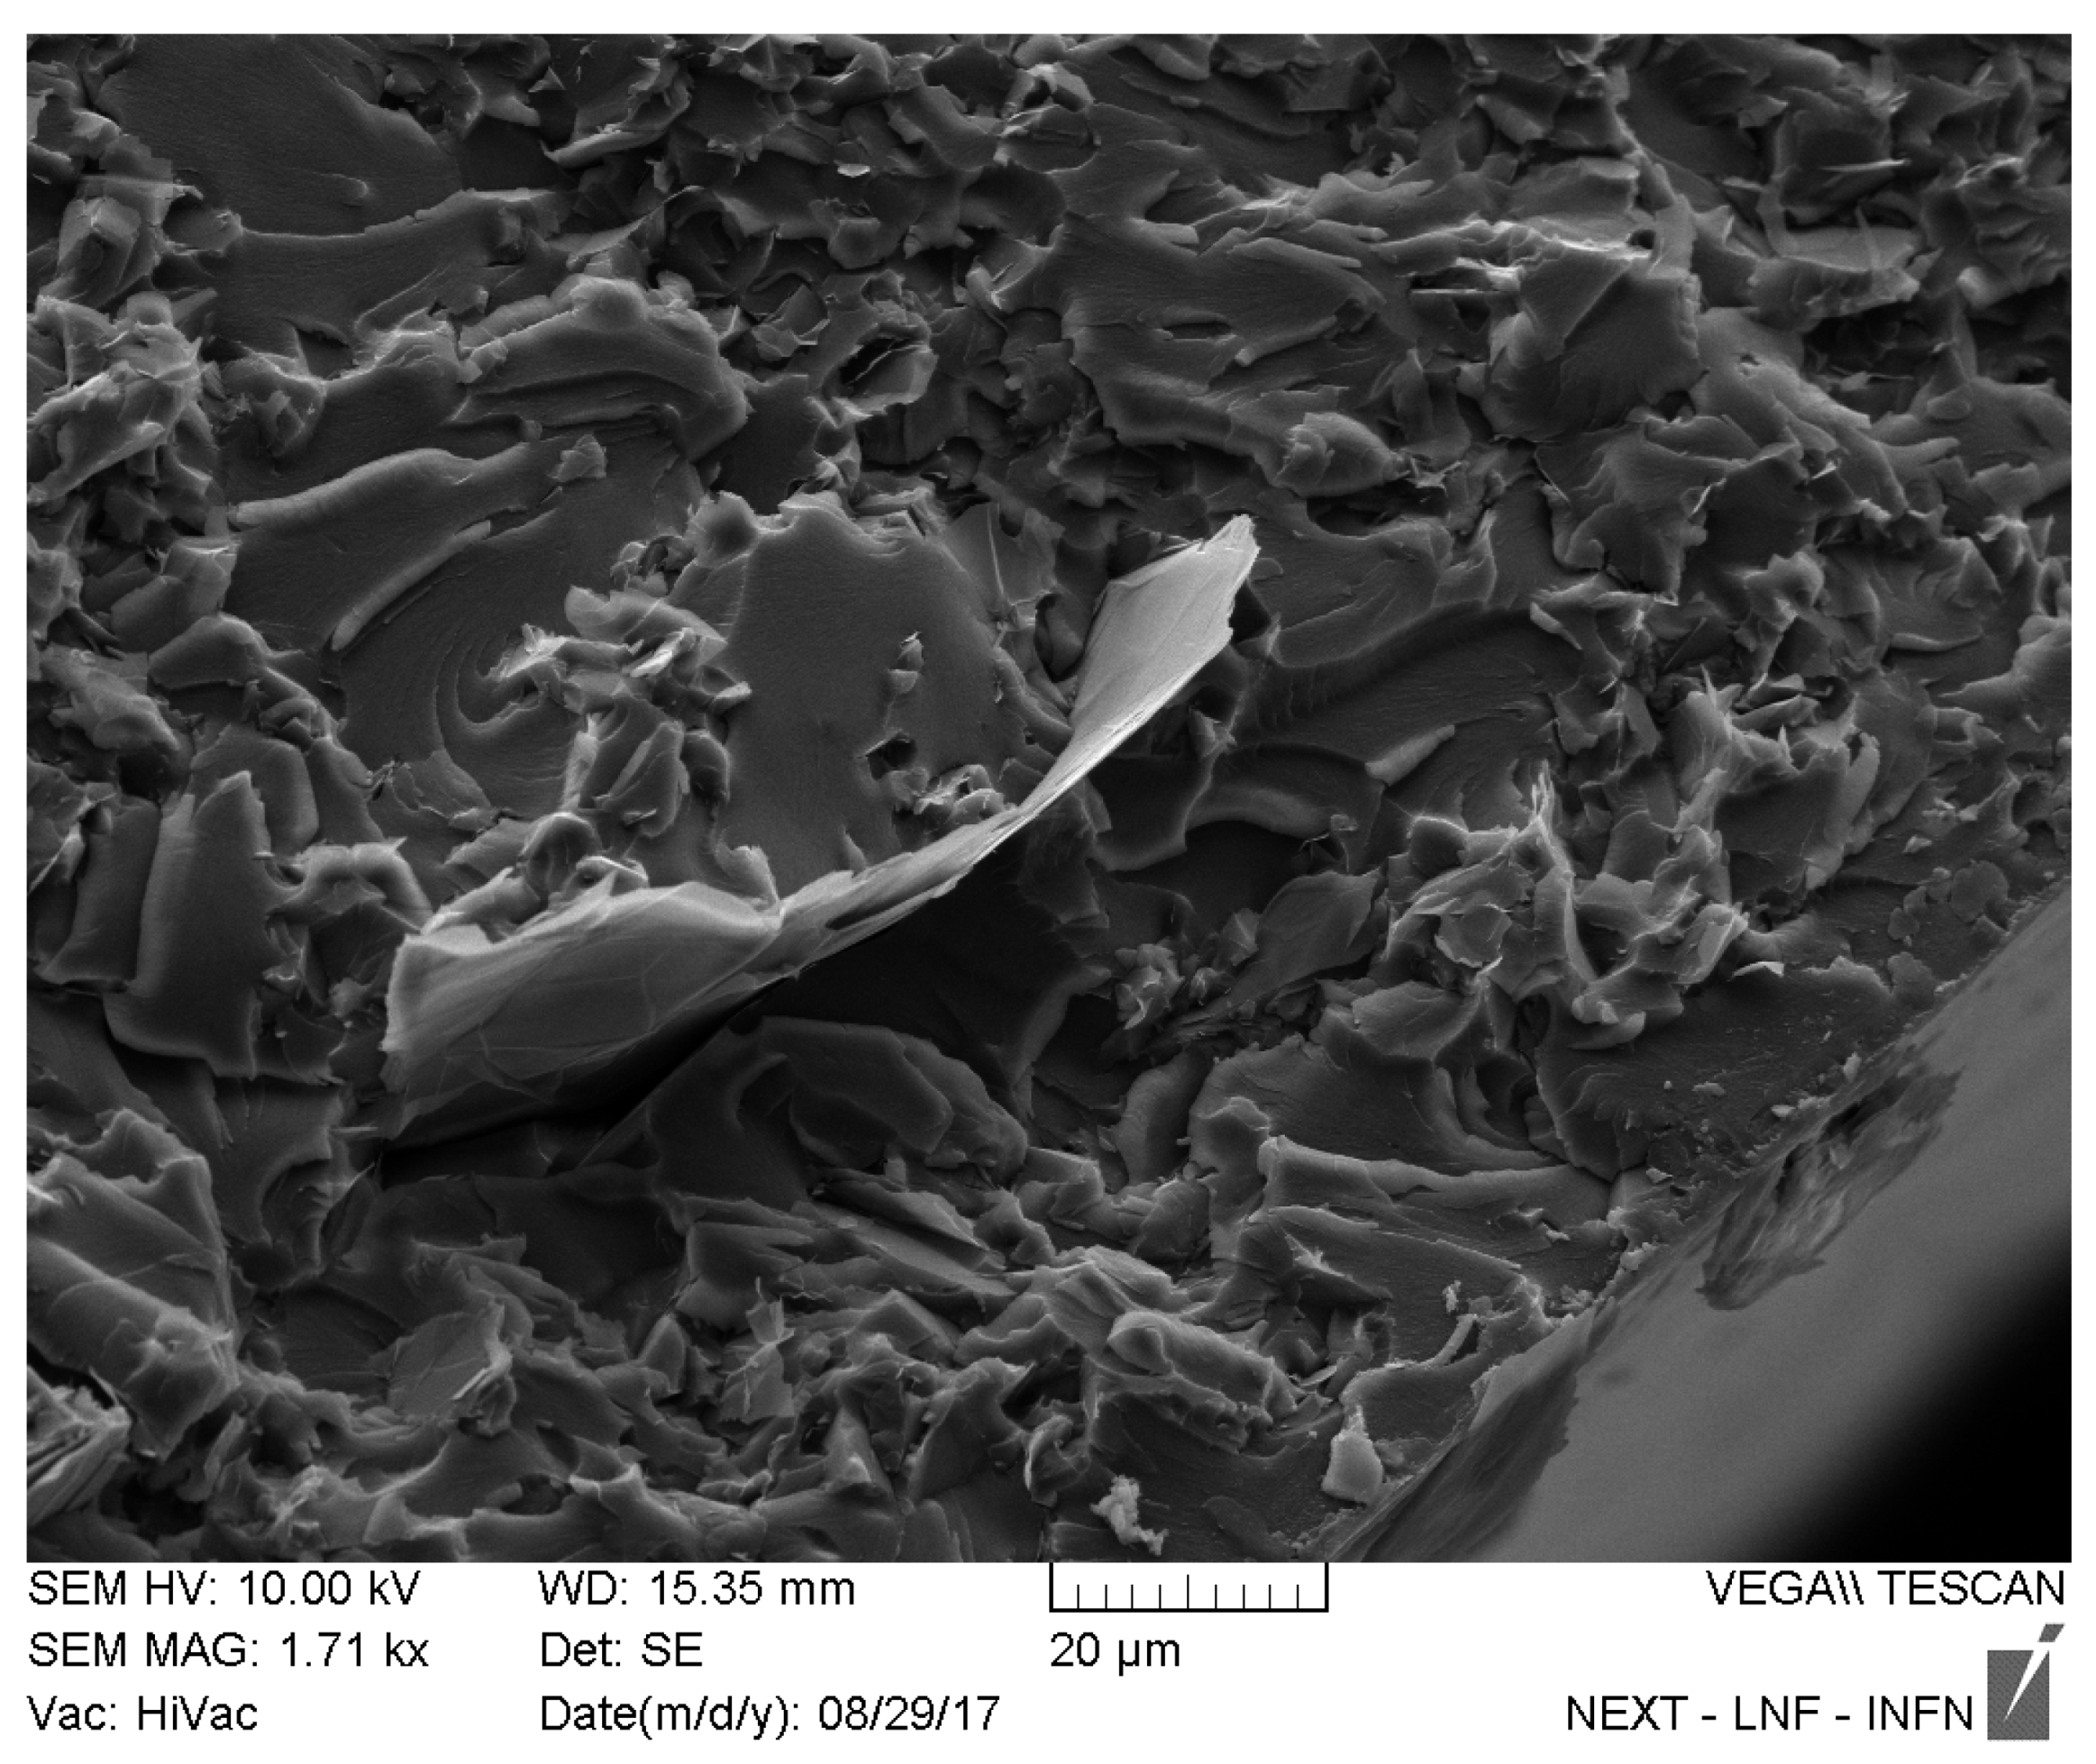
−1, found in resin samples even after the curing process, does not change. In the case of aging with sulfuric acid it has been shown that this signal decreases until it disappears and this trend has been motivated by assuming that the presence of acid catalyzes the opening of the ring. On the contrary, the samples immersed in KCl show no change in the signal. The epoxy ring remains in its initial form and therefore, according to all the data collected, the epoxy resin does not undergo obvious changes to the polymer chain in 31 days of immersion in a solution of 3.5% KCl. Probably to find changes in the polymer chain, the aging time in Potassium Chloride should have been extended. SEM images of the section of the samples do not show any signs of degradation on the resin; however, the presence of crystalline agglomerates can be seen (
Figure 26). On composites, the presence of these elements does not appear to be present (
Figure 27).
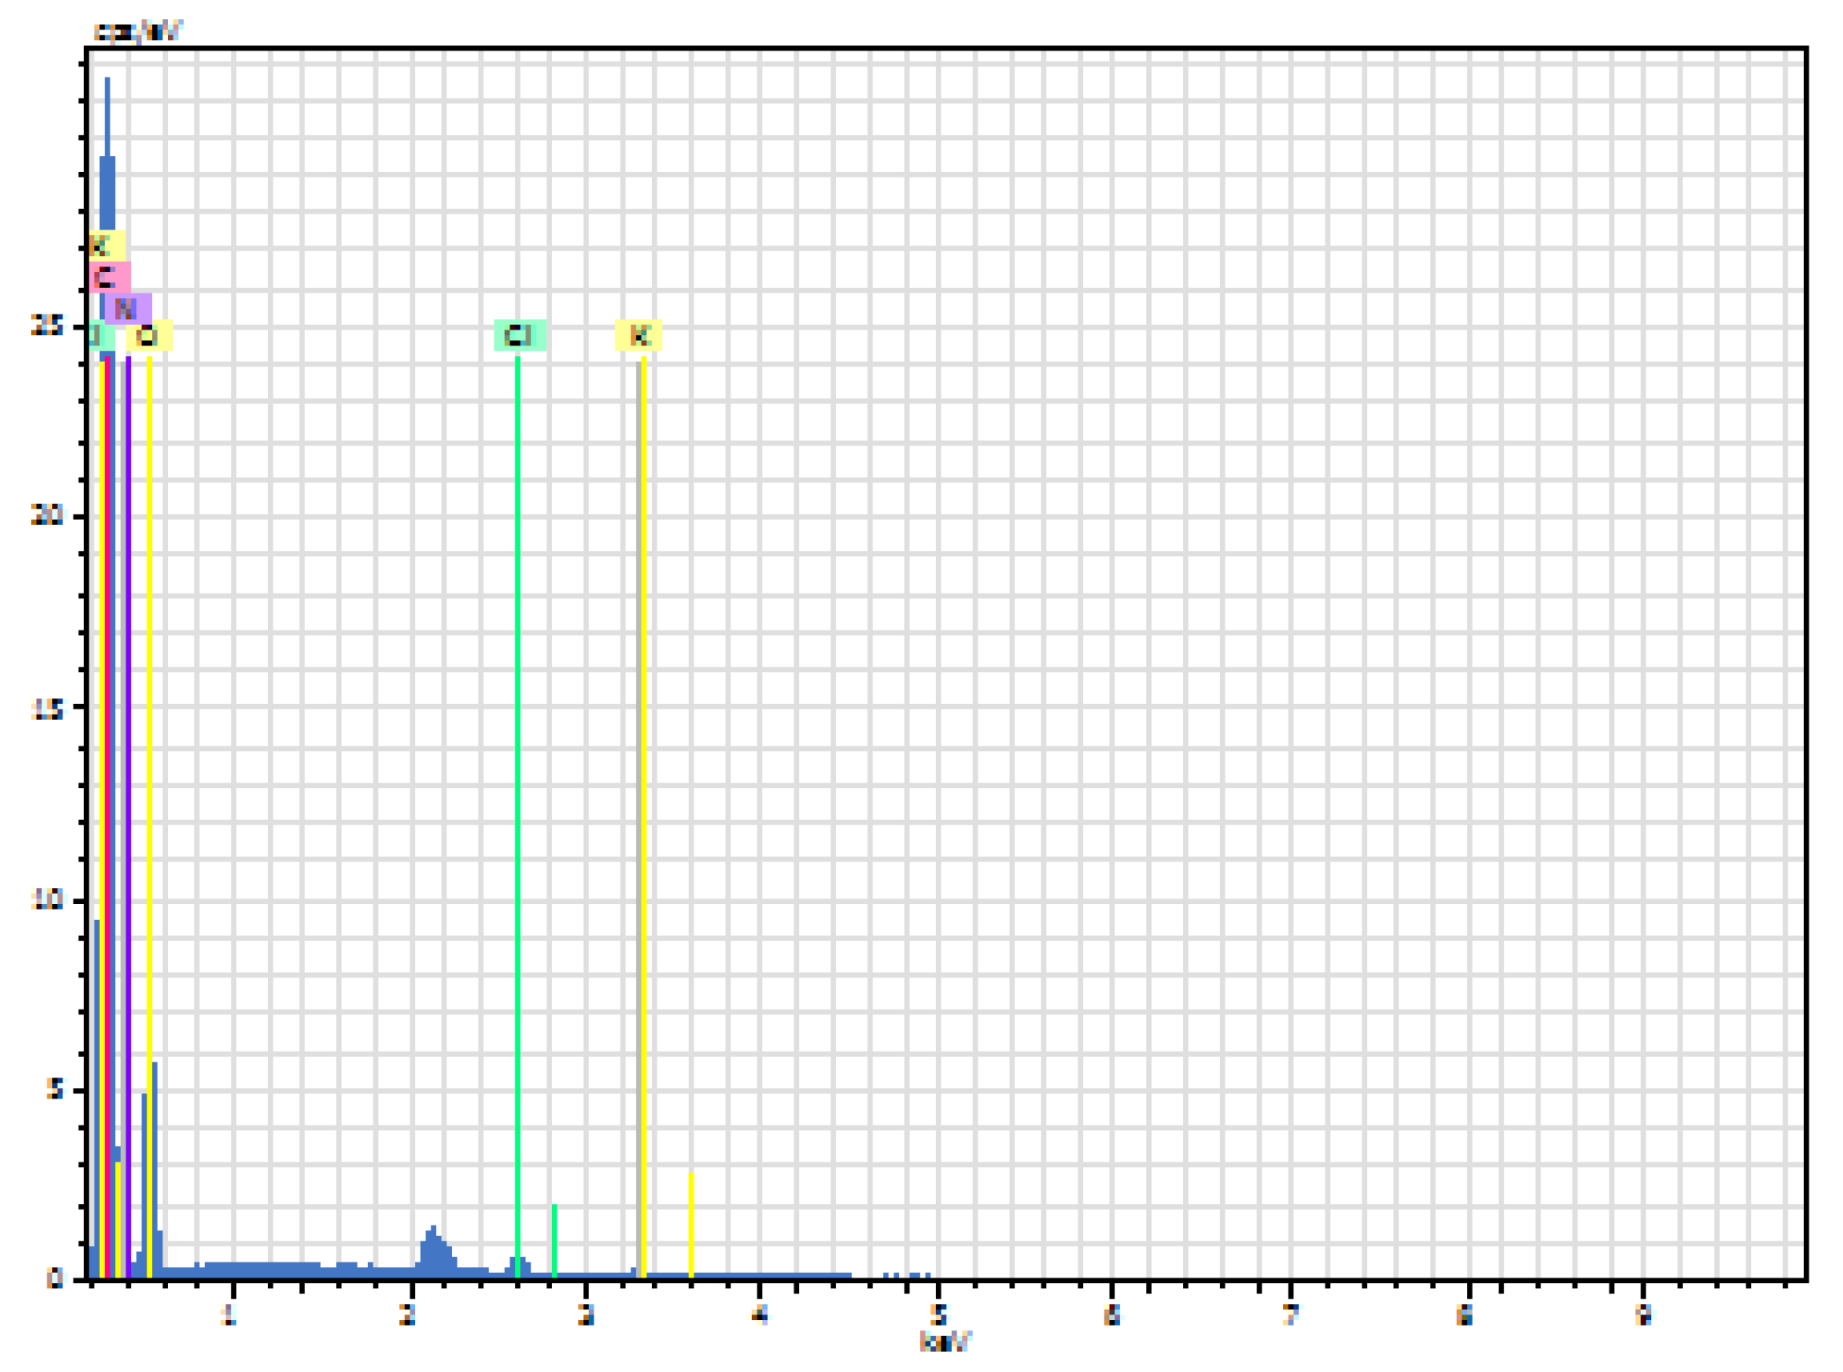
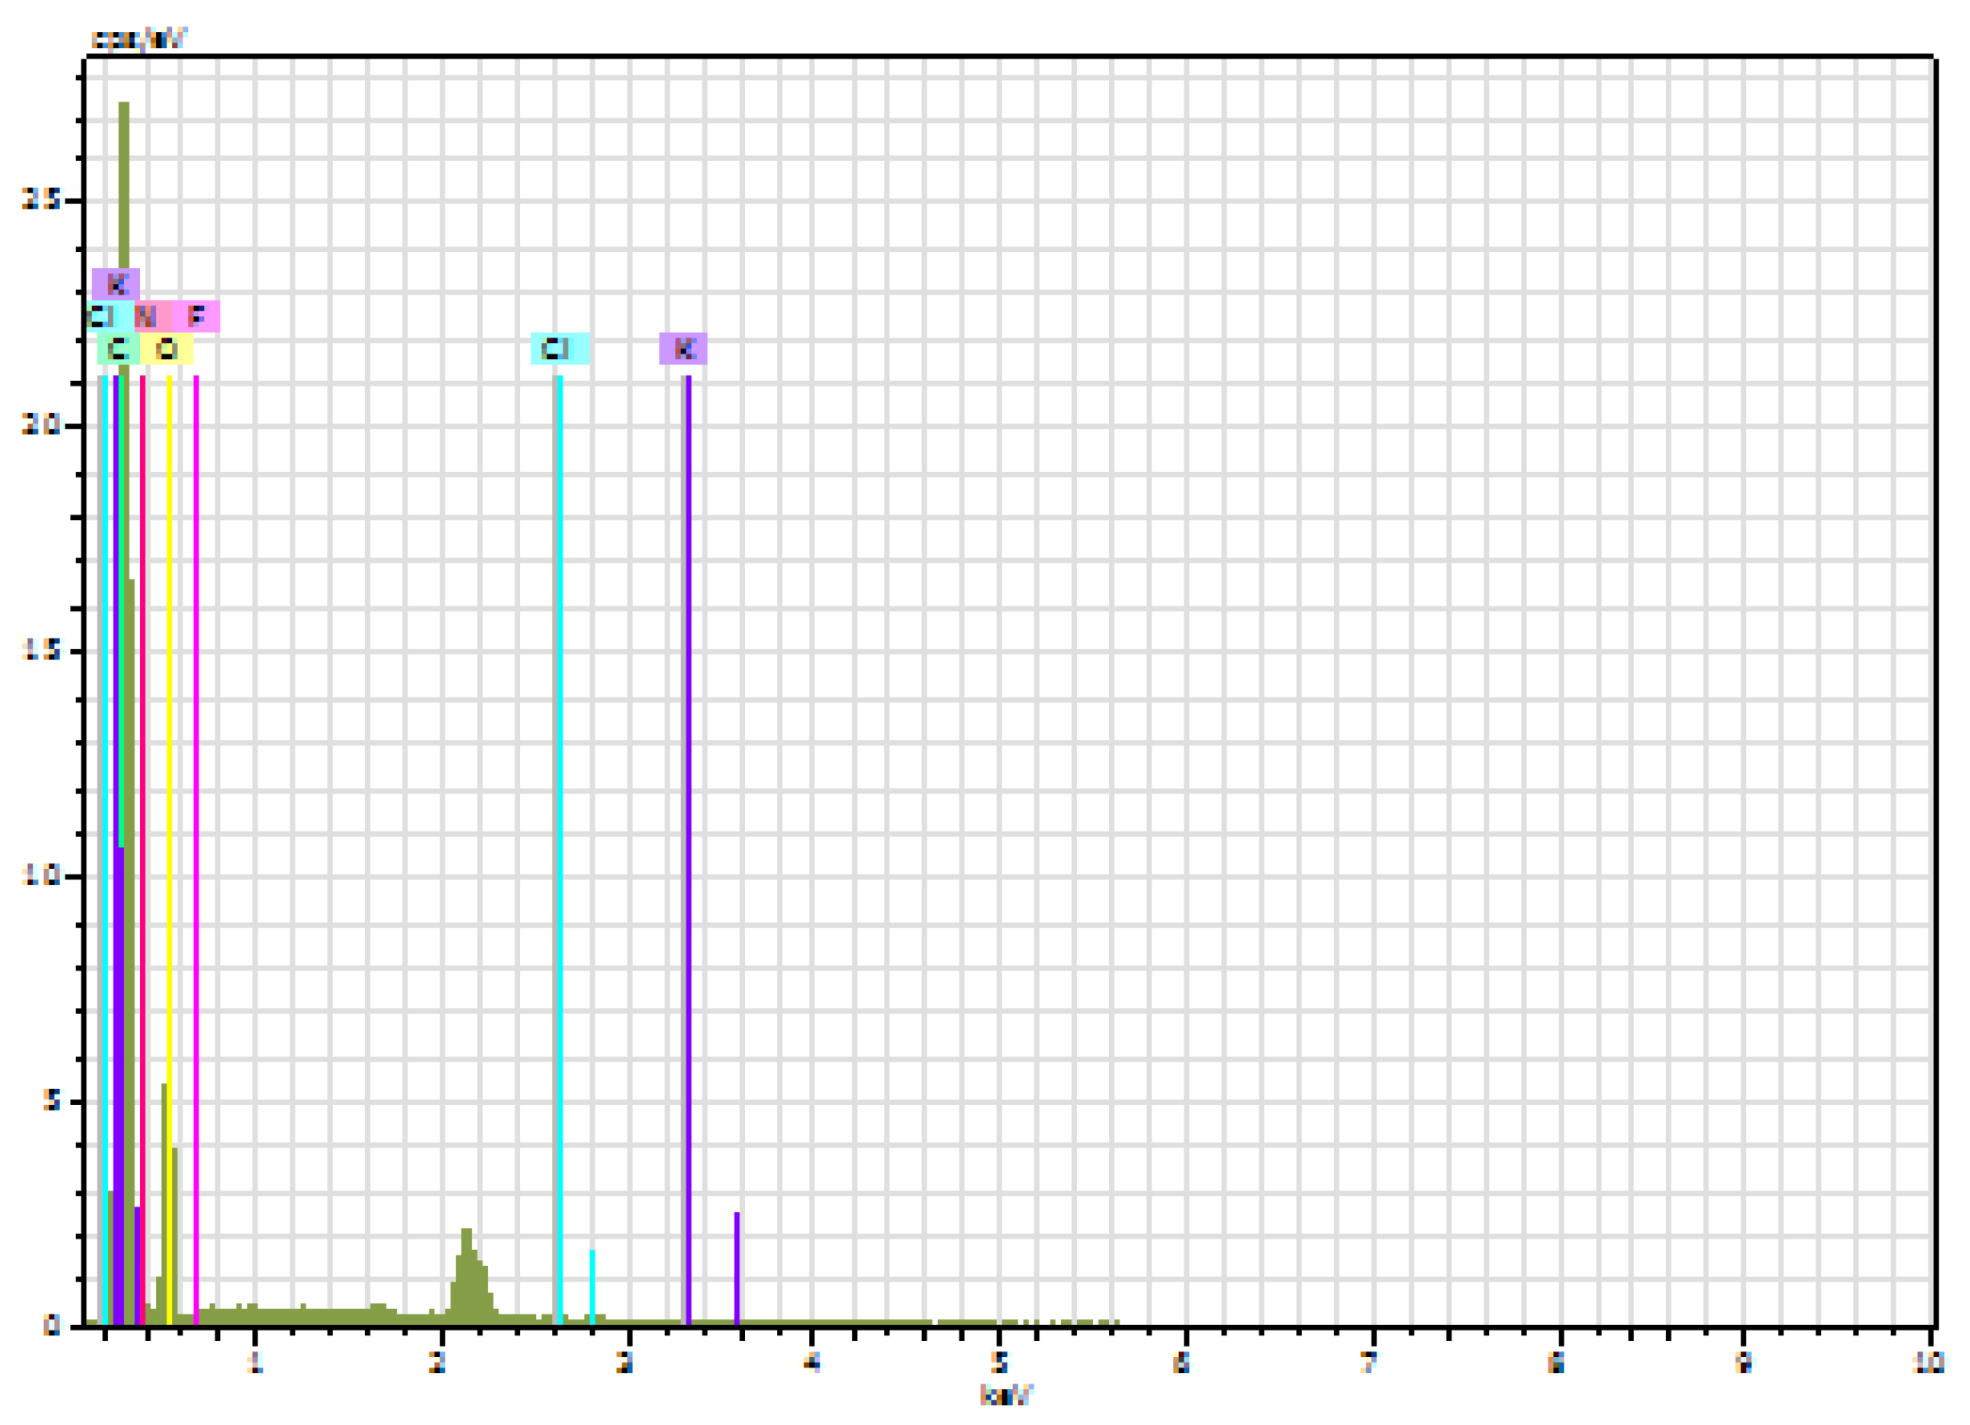
An elemental analysis was conducted using a scanning electron microscope to verify if the presence of these agglomerates corresponds to KCl. The spectrum reported in
Figure 28 was obtained from the resin sample. Performing the same analyses on the composites yields the spectrum in
Figure 29. Comparing the data obtained from the analysis on the epoxy sample, the composite sample shows a lower amount of potassium chloride. However, it is not possible to say that the amount of KCl detected by microanalysis depends completely on the diffusion of the aqueous solution in the thin film, as it could derive from the salt deposited on the surface of the sample, subsequently arranged in the inner zone under investigation, during the preparation for SEM analysis. In general, the time chosen for the treatment of samples in potassium chloride is too short to find evidence of corrosion.
4. Conclusions
The study of the aging of thin films of nanocomposites with inclusions of carbon nanostructured materials is followed considering the diffusion of solution inside the material and the modification to the polymer chains of the plastic matrix as parameters to evaluate the corrosive phenomenon.
The epoxy resin samples, exposed to sulfuric acid, present until the third day of aging a certain percentage growth of the mass, due to the diffusion of the liquid inside the material and the infiltration of the solution at the compound/glassy support interface. After the third day, detachment from the glass occurs and the samples begin to lose weight. This decrease has been associated with the degradation of polymer chains leading to material loss.
With a surface infrared analysis, liquid diffusion is confirmed as the O-H stretching signal of water appears. The different intensity of this signal for the samples at different thicknesses (less for thinner samples) is due to the degradation of the polymeric material that, in thinner samples, with the same aging time is more evident because the amount of exposed material is less and consequently decrease the sites where the polymer can accommodate the liquid molecules.
The degrading effect of the acid is instead found by IR spectra at low wavelength numbers and Raman spectra. In the infrared spectrum of the samples at zero days of aging is present at 915 cm−1 the signal of the bending of the epoxy ring. This signal disappears after about three days of exposure to acid, as opening of the epoxy ring occurs. From confocal Raman microscopy, which allows a more in-depth study of the samples, it is noted instead that from the twenty-first day in acid varies the ratio between the intensities of two signals, at 1416 and 1465 cm−1, attributable to a change in the polymer chain of the resin.
An interesting finding is in the study of Epoxy/GNP thin films in which detachment from the glassy support is delayed until about day 21 of treatment and the solution uptake is much less compared to resin alone. This is confirmed by mass measurements and the decrease in signal intensity of the O-H stretching in the IR spectra of the composites.
In addition, the presence of GNP delays corrosion since Raman analysis of the polymer chain reports no changes, unlike pure resin samples.
Resin samples exposed to an aqueous solution of potassium chloride show less uptake than samples treated with acid. This is established based on mass data and the study of the O-H bond signal in the infrared spectrum. In addition, these samples show no changes in the Raman spectrum or in the area of the IR spectrum where the polymer chain signals appear.
In contrast to the resin, the samples with 0.5% and 1% GNP concentration do not show any signs of aqueous solution uptake according to the mass and infrared water signal data. Like the resin, there are no signs of changes in the polymer chain of the epoxy matrix in the Raman and infrared spectra at low wave numbers.
According to the results obtained from the treatment of composites with the two corrosive agents, it is stated that the presence of graphene fillers delays the deterioration of the thin film, both considering the uptake and the degradation. In the first case, the GNPs make it difficult for the liquid molecules to diffuse in the film by placing themselves as a physical impediment. At the same time, the hydrophobic character of the carbonaceous structures counteracts the infiltration of the solution and prolongs the degradation time of the polymer chain in case of exposure to an acid environment.


