Article

Optical Detection of Void Formation Mechanisms during Impregnation of Composites by UV-Reactive Resin Systems

1
Plastics Technology Group, Department of Mechanical Engineering, Technische Universität Ilmenau, 98693 Ilmenau, Germany
2
Thüringisches Institut für Textil- und Kunststoff-Forschung e.V., 07407 Rudolstadt, Germany
*
Author to whom correspondence should be addressed.
J. Compos. Sci. 2022, 6(11), 351; https://doi.org/10.3390/jcs6110351
Submission received: 2 October 2022 / Revised: 24 October 2022 / Accepted: 11 November 2022 / Published: 15 November 2022
(This article belongs to the Special Issue Manufacturing of Fibrous Composites for Engineering Applications)

Abstract

:
During the impregnation of reinforcement fabrics in liquid composite molding processes, the flow within fiber bundles and the channels between the fiber bundles usually advances at different velocities. This so-called “dual-scale flow” results in void formation inside the composite material and has a negative effect on its mechanical properties. Semi-empirical models can be applied to calculate the extent of the dual-scale flow. In this study, a methodology is presented that stops the impregnation of reinforcement fabrics at different filling levels by using a photo-reactive resin system. By means of optical evaluation, the theoretical calculation models of the dual-scale flow are validated metrologically. The results show increasingly distinct dual-scale flow effects with increasing pressure gradients. The methodology enables the measurability of microscopic differences in flow front progression to validate renowned theoretical models and compare simulations to measurements of applied injection processes.

1. Introduction

Liquid composite molding (LCM) is an established industrial production technology for manufacturing thermoset fiber composites. Dry textile preforms are draped in a mold, which is subsequently closed, and the semi-finished fiber product is impregnated with a resin system by means of overpressure. During impregnation of the textile preforms, voids are formed, which result in a reduction of the mechanical properties of the molded component [1,2,3]. One cause of the formation of voids in fiber composite components is inhomogeneous flow processes at microscopic levels inside the textile preforms. Depending on the process parameters, the resin system flows at different rates within the tows of the reinforcement fabrics and channels between the tows, due to the different permeability of the two areas. As shown in Figure 1, a flow front is formed, which can be divided into a saturated, partially saturated, and unsaturated region of the tows [4,5].
This effect, known as dual-scale flow, is the focus of several studies since it is a major reason for the formation and transport of voids [6,7,8,9,10,11]. If the flow velocities within the tows and channels between the tows match, void-free components are produced [12,13,14,15] and the lightweight potential of the materials is optimally exploited.
The flow of the liquid resin system through the textile preform as a porous medium is described by Darcy’s law (Equation (1)).
v m = K η · p
where v m is the volume-averaged velocity, K the permeability tensor, η the resin viscosity, and p the pressure gradient from inlet to the flow front position.
Assuming that the resin system is an incompressible medium, the law of conservation of mass applies:
· v m = 0
The semi-empirical Kozeny-Carman equation can be used to determine the macroscopic permeability K of the textile preform [16]:
K = r f 2 4 k c ( 1 φ f ) 3 φ f 2
where r f is the fiber radius, φ f is the fiber volume fraction, and k c is the Kozeny constant. The Kozeny constant is highly dependent on the resin used, impregnation direction, and textile preform [17], and thus is not precisely determined [9,18]. Nevertheless, this model allows calculations on the progression of the flow front in the textile preform and the resulting process duration.
However, this model is not suitable for a more detailed consideration of the impregnation of textile preforms [9] since no information is obtained about the microscopic flow processes within and between the tows. The proportion of resin flowing into the individual fiber bundles of a textile preform during impregnation is described in the numerical simulations by means of an extension by a loss term q, which depends on pressure p and degree of saturation s [6]:
· ( K η · p ) = q ( p , s )
Analytically, the phenomenon of dual-scale flow can be represented by the modified capillary number Ca*. The modified capillary number forms the ratio of viscosity-dependent and capillary force-dependent flow [8,13] and thus allows conclusions about the proportions of the unsaturated region of the flow front [14].
C a * = μ · u ¯ γ · cos θ
where C a * is the modified capillary number, μ the dynamic resin viscosity, u ¯ the averaged macroscopic flow velocity, γ the surface tension, and θ the contact angle between the resin and fibers.
At high injection pressures, the proportion of viscosity-dependent flow predominates. The channels between the tows fill faster than the areas within the tows. This results in the inclusion of elongated micropores in the tows (Figure 2b). If capillary forces prevail, the flow front within the tows progresses faster. Spherical macropores are formed in the channels (Figure 2a).
With the help of the modified capillary number during injection, in conjunction with the geometric structure of the textile preforms, conclusions can be drawn about the void formation in the component [12,13,14,15,19].
Models for calculating the resulting void volume content are based on the ratio of the flow front progress within and between the tows. Gueroult et al. [15] contrast the two time scales of the flow time inside the fiber bundles Δ t t in relation to the flow time in the channels Δ t c .
Δ t t Δ t c = K c K t · ( 1 φ F T ) · [ 1 F S · K c · φ F T d F i · ( 1 φ F T ) · L t · C a * · l n ( C a * · d F i · ( 1 φ F T ) · L t ) F S · K c · φ F T + 1 ) ]
where K c is the permeability of the channel, K t the permeability of the tow, φ F T the fiber volume content in the tow, FS a shape factor depending on longitudinal or transversal flow direction, d F i the diameter of a single fiber, and L t the length of a tow.
A ratio of Δ t t Δ t c < 1 describes the advance of the resin within the fiber bundles and resulting emergence of macropores. Δ t t Δ t c > 1 implies a faster advance of resin within the channels and the formation of microvoids. At a ratio of Δ t t Δ t c = 1 , the resin flows at identical velocities in both sections, which means that no air can be entrapped, and no voids are formed due to the dual-scale flow [15].
Validation of such “dual-scale” computational models usually involves evaluating the resulting void volume contents and classifying them into microvoids and macrovoids [20,21]. An alternative is the optical detection of the different flow velocities. The dual-scale effect was investigated by several studies [10,22,23] using a microscope locally during injection. The challenge in this type of analysis is to find a compromise between maximizing the image section of the flow front while retaining locally high resolution. Another possibility to prove the phenomenon of dual-scale flow is numerical simulation. Godbole et al. [24] describe the differences in the flow velocity within and between the fiber bundles by determining the length of the partially saturated flow front L p s , by simulations (Figure 3):
Neglecting capillary forces, it is shown that the length of the partially saturated zone remains constant if the flow path is sufficiently long. This finding agrees with the results of Zhou et al. [25,26], who also calculate a constant length of the partially saturated zone. The resulting length depends on the permeability of the textile preforms and the preform geometry, as well as the volume fraction of the fiber bundles of a unidirectional (UD) unit cell:
L p s = 2 a K y y t o w [ h 3 3 ] · V t o w p l y
where a is half of the width of a tow, K y y t o w the transverse permeability of a tow, and h half of the width of the channel between the tows. V t o w p l y is the volume fraction of tows inside a UD unit cell and calculated from the proportion of fiber bundles as closed solids in the cross-section of the laminate:
V t o w p l y = a h + a
Detailed information about the microscopic dual-scale flow and associated pore formation becomes possible when the state of the impregnation can be imaged holistically in a cavity. The state of the art in investigating void formation and transport are optical methods [27,28,29]. Furthermore, ultrasonic measurements, as well as X-ray and micro-CT examinations, were conducted in several renowned studies [1].
However, all the mentioned techniques are currently not suited to analyze big areas of the partially saturated zone, because of their limited resolution or the requirement of additives to increase visibility. Due to the limited field of view, a “snapshot” approach to optical measurement of the void distribution is needed; however, a suitable method has not yet been presented for this issue [30].
The novel approach presented in this article is to freeze the complete impregnation process at different filling levels to investigate the flow front section by section. To obtain snapshots of the component impregnation, a methodology is developed below that uses spontaneous curing of a photopolymerizing resin. Unique to this method is the gathering of specimen with spontaneously cured partially saturated flow fronts, which can be holistically observed via microscopy.
The resin systems used for this purpose include photoreactive functional groups that crosslink when exposed to light [31]. Components of such resin systems are monomers, oligomers, and photo initiators. Upon absorption of high-energy light, mostly in the ultraviolet spectrum, the photo initiators form radicals or ions. These serve as initiators for the crosslinking reaction between oligomers and monomers [32,33].
Depending on the resin system used and film thickness, the time required for complete crosslinking can range from a fraction of a second to several minutes [32]. To minimize interferences caused by changing pressure gradients during crosslinking, it is advantageous to react as quickly as possible. Only in the case of spontaneous crosslinking of the complete molded part are the pore formation as well as the pore transport frozen in situ.
Based on the frozen filling samples produced with photopolymerizing resins, dual-scale flow in fiber bundles and channels is investigated sequentially along the complete flow front by means of microscopy. The images obtained are used to compare current computational models with the optical measurements. The evaluation of the flow conditions can be used to verify new calculation models and increase the accuracy of FEM calculations.

2. Materials and Methods

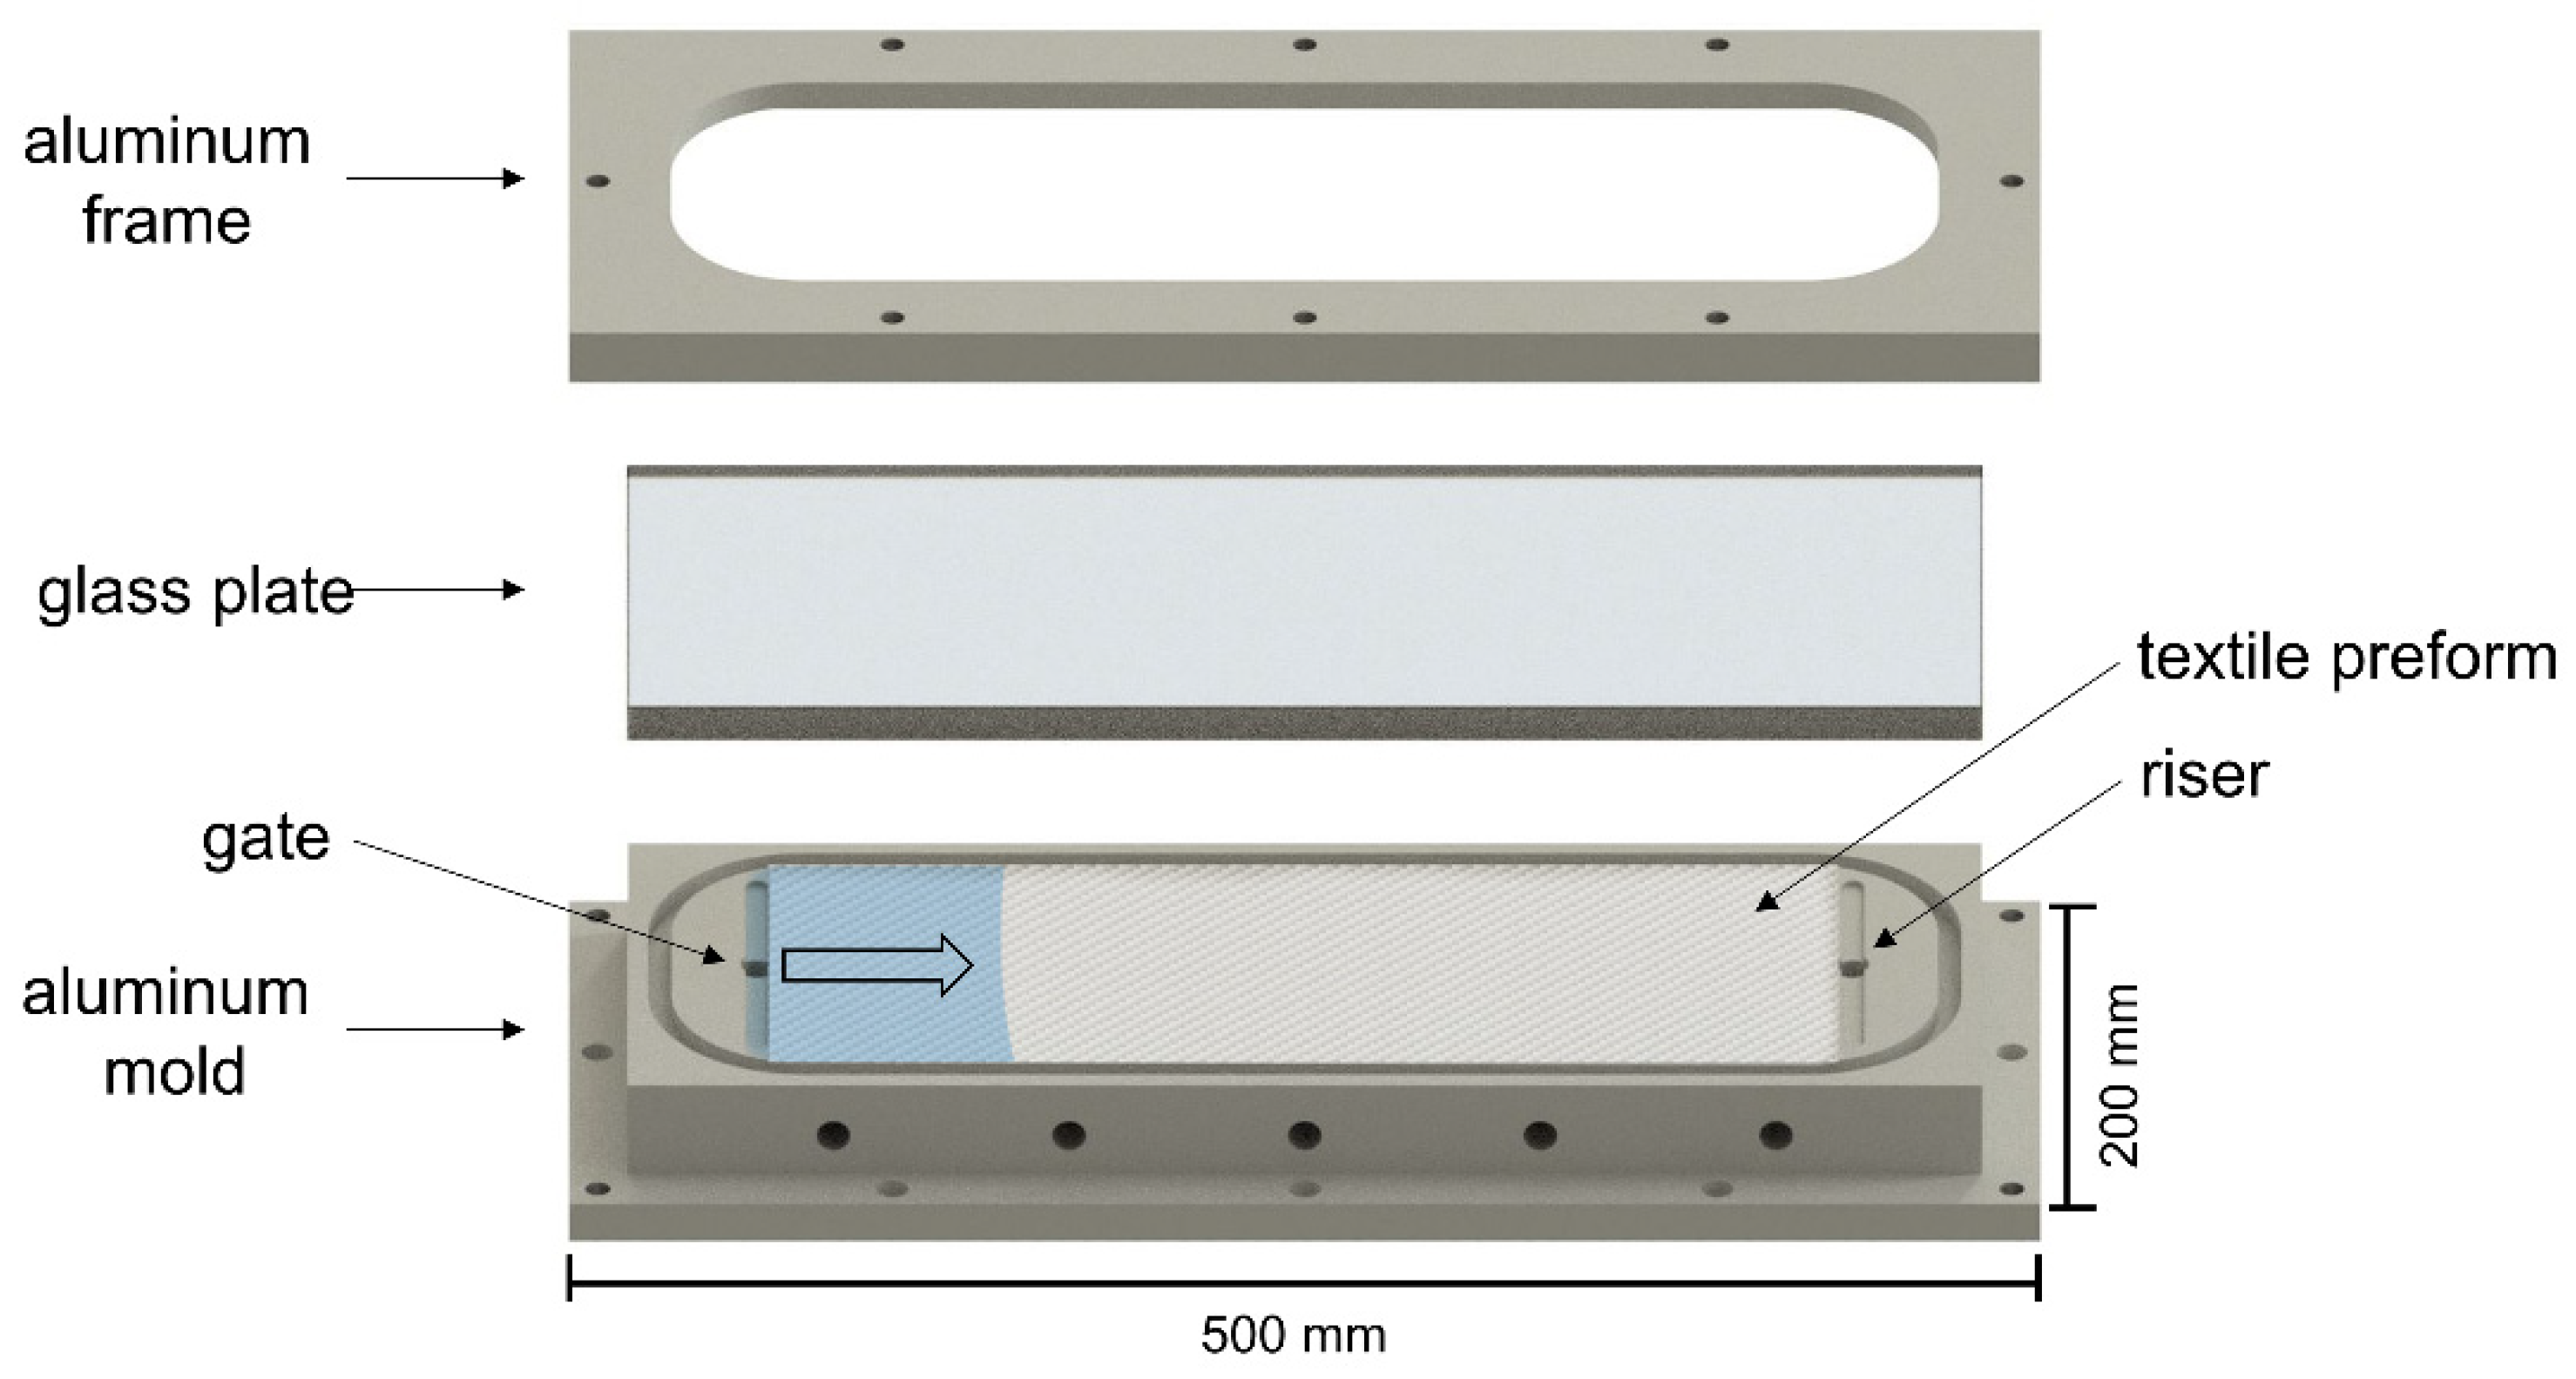
2.1. Experimental Setup

An injection mold for linear impregnation of textile preforms was designed. It consists of a bottom side made of aluminum with a linear gate and riser, on which a single-layer textile preform of 300 mm length and 130 mm width is draped. The opposite side of the mold consists of a glass plate fixed with an aluminum frame (Figure 4). By means of defined torque for the screws positioned circumferentially on the frame, a constant compression pressure of 4.4 MPa is set.
The glass plate is transparent to light in the ultraviolet (UV) range. UV spotlights are mounted above the mold, which completely and uniformly illuminate the cavity when switched on. A photoreactive resin system is used which, when irradiated with UV light, stops the flow process without any noticeable delay. Three YG-TGD20-405 LED emitters from Shenzhen Creality 3D Technology Co, Ltd., Shenzhen, China, with an emitted waveband of 400 nm to 405 nm, at an overall system power of 7.8 W each, are used at 100% intensity. The resin system is injected under constant injection pressure in various gradations.
The mold is divided into five sections and the flow front is stopped after every 60 mm by switching on the UV lamps. This is followed by an exposure time of 60 s, during which the resin system cures completely.
This methodology allows the examination of the entire flow front of the fabricated specimens after curing. Optical studies were performed using a Keyence VHX-7000 microscope at 100× magnification. The aim of the measurements is a quantified mapping of the dual-scale flow behavior for comparison with the calculation results of the theoretical models. For this purpose, the flow front progress within the tows lt and in the channels between the tows lc, as well as their flow path difference Δl, is measured (see Figure 5).
The process of impregnation is recorded by a camera to measure the mean flow velocity within the sections and calculate the modified capillary number according to Equation (5).
The resin system is injected with constant injection pressure. The examined parameter combinations are shown in Figure 6. Each combination is repeated three times so that a total of 60 test specimens is produced and evaluated. The last mold section with a flow path length of 300 mm is excluded, since the textile preforms could not be completely saturated over the entire length at pressure levels of 0.05 MPa and 0.1 MPa. The pressure levels were selected to show clearly distinct flow path differences; however, the pronounced dual-scale flow leads to a very high number of overlapping microvoids that cannot be thoroughly evaluated in this study.
For each parameter combination 20 flow path lengths in the fiber bundle lt and between the fiber bundles lc are determined, their ratio is calculated, and the values are compared with the models of Gueroult [15] (Equation (6)) and Godbole [24] (Equation (7)).

2.2. Materials

The resin system used is a photoreactive 3D Printing UV sensitive resin from the manufacturer Shenzhen Anycubic Technology Co., Ltd., Shenzhen, China. It is composed of 30% to 60% oligomers (polyurethane acrylate), 10% to 40% acrylate monomers and 2% to 5% photo initiator. All experiments were conducted with the same batch of the resin system to exclude variations in the components between the experiments.
The textile semi-finished product used is a glass fiber filament fabric type 92130 from Porcher Industries Germany GmbH, Erbach, Germany for which the following data was measured, as depicted in Table 1. A fabric with medium grammage and plain weave with a high number of crossovers was chosen to establish a homogeneous flow while producing samples with conventional thickness. Moreover, the fabric is resilient against fiber displacement in the manual preparation process, which can potentially cause local deviations in permeability.

3. Results and Discussion

3.1. Experimental Results

During the entire injection period of all specimens, the uniform, approximately linear progress of the flow front must be ensured in order to avoid volume flows in the transverse direction and comply with the boundary conditions of the continuity equation according to Darcy (Equation (1)). Specimens with irregular flow fronts are excluded from the evaluation and prepared again. Several individual images of the flow front are taken with a 100× magnification factor and assembled to form a complete image of the frozen flow front, Figure 7a,b.
The frozen flow front of the cured specimen shows a distinct edge between the impregnated and dry sections. These definite lines indicate a virtually instant pervasive curing throughout the complete thickness of the transparent composite material and exist at each applied pressure gradient.
As in the literature [24,25,26], there are no distinct changes in the flow path difference along the mold cavity at constant process parameters, as shown in the comparison in Figure 8. However, there is a clear dependence of the flow path difference on the injection pressure.
The existing scatter is mainly attributed to fluctuations in permeability caused by the manual insertion of the fabrics into the cavity, since the manual preparation of the preforms may result in local displacements of the tows, and thusly produce irregular gaps and fiber distributions.
The injection pressure has a considerable influence on the flow velocity and thus on the locally prevailing capillary number. Contrary to what was calculated by Godbole [24], the results averaged per experiment show the proportionality of the flow path difference and the capillary number to the injection pressure (Figure 9). This measurable effect supports the model of Gueroult [15], in which the flow time ratio is largely determined by the capillary number. According to Equations (1) and (5), the capillary number is also pressure dependent. The calculations of Godbole [24] imply that a stronger expression of the dual-scale flow is completely compensated for by increased crossflow effects. This assumption is not confirmed by the measurement of the flow path differences for the presented experimental setup.
Considering all local measurements of the flow path difference as a function of the modified capillary number, an increase in flow path difference with an increasing modified capillary number is observed (Figure 10). At capillary numbers above around 0.025, the increase in the flow path difference is less substantial. The flattened slope is in accordance with the natural logarithm of Equation (6), which determines the flow ratio inside tows and channels. Additional experiments must be conducted to verify the shape of the curve for higher capillary numbers.
The increase in the flow path difference with increasing capillary number supports the findings of renowned studies [12,13,14,19] for process conditions with predominantly pressure-induced flow in the dual-scale model. Each specimen is in the region of micropore formation ( Δ t t Δ t c > 1). With increasing injection pressure, this flow time ratio also increases.
The measurement results illustrate that this increase is also reflected in increasing flow path differences. The progression of the flow path difference towards a maximum value implies an increase in crossflow effects, which counteracts the further increase in the flow path difference.
The measurements show that the flow velocity in the fiber bundles is slower than in the channels between the bundles. Neglecting crossflow effects, the flow path difference can be inferred from the flow time ratio according to the model of Gueroult [15].
Δ l = v ¯ · Δ t
Since the flow state in the bundle and channel is stopped after the identical injection time ∆t when the UV illumination is activated, it follows:
Δ l c ( t ) = v c ¯ · Δ t
Δ l t ( t ) = v t ¯ · Δ t
Δ l c ( t ) Δ l t ( t ) = v c v t ¯ ¯ · Δ t = c v · Δ t
However, Gueroult’s model [15] is based on the ratio of the flow times of the resin system to saturation of the length ∆l of a single unit cell:
Δ t c ( l ) = Δ l v c ¯
Δ t t ( l ) = Δ l v t ¯
Δ t c ( l ) Δ t t ( l ) = v t v c ¯ ¯ · Δ l = 1 c v · Δ l
Equations (12) and (15) indicate inverse proportionality of length ratios and time ratios of impregnation of fiber bundles and channels.
Δ l c ( t ) Δ l t ( t ) ~ Δ t t ( l ) Δ t c ( l )
If the ratios are plotted on top of each other as a function of the injection pressure, a good agreement of the values is observed for the first mold section, see Figure 11.
Due to crossflow of the resin out of the channels into the fiber bundles in the transverse direction, as shown in Figure 12, the flow path difference Δl stagnates while the macroscopic flow path continues to increase.
As the flow path length progresses, the results of the successive mold sections (Figure 5) therefore show considerable deviations (Figure 13).
The deviations of the flow path ratios from the flow time ratios can be adjusted by correction factors. As Bodaghi et al. [9] describe, a loss term q (p, s) from Equation (4) contributes to the transverse impregnation of tows. The regression analysis of the measurement results confirms the assumption that both the injection pressure and degree of saturation of the macroscopic flow path influence the loss term, as shown in the comparison in Figure 14 While the slopes of the compensation lines are determined by the injection pressure, the intercept is related to the macroscopic flow path and is thus a measure of the degree of saturation of the textile preform. It follows:
Δ t t ( l ) Δ t c ( l ) = c c o r r · Δ l c ( t ) Δ l t ( t )
c c o r r = a · p i n j + b ( s )
where c c o r r is a correction factor, a is the slope factor, p i n j the injection pressure, and b ( s ) the saturation dependent offset.
This correction factor c k o r r and its dependence on pressure and saturation proves the occurrence of the loss term q (p, s) described by Bodaghi et al. and quantifies the effect of crossflow for the given material and process parameter combination.

3.2. Discussion

Two distinct aspects must be considered when analyzing the results. First is the applicability of the novel methodology, followed by the observations regarding dual-scale flow experiments.
The presented methodology allows taking snapshots of the flow processes during the impregnation of textile preforms using a photoreactive resin system. Evidence was provided that photoreactive resin systems crosslink sufficiently fast to freeze the microscopic saturation along the entire specimen. The curing occurred sufficiently rapidly for the given glass fiber fabric and applied pressure settings. Upper limitations of flow velocity and specimen thickness must be determined in prospective studies to eliminate the possibility of partial flow progression below the irradiated surface. In contrast to point-wise optical measurements, the complete unsaturated domain of the flow front can be analyzed. The holistic analysis of the flow front represents an improvement compared with the limited field of view of well-established methods [27,28,30]. It is more cost- and time-efficient than x-ray or micro-CT measurements [1]. Depending on the type of microscope, voids with diameters of 5 to 20 µm can be analyzed [1], whereas ultrasonic imaging is only suitable for single defects with a minimum size between 1 and 0.6 mm [34,35]. The simple mold setup and its similarity to live-microscopy makes the introduced method easily accessible. The glass cover allows the elimination of race tracking inside the entire mold during impregnation, which cannot be ruled out with single point-wise observations, as Siddig et al. [36] proved, at least three points of a rectangular shape need to be observed to detect race tracking. However, one downside of this method is that it is not suited to quantify void transport. Freezing the flow produces a single image that can be used to describe the dual flow effect and formation of voids at the very front of the flow, but it contains no information on the history of voids inside the specimen.
The result of the experimental setup provides a multitude of insights into the saturation process of fabrics. A clear dependence on the injection pressure was determined for the measured flow path difference. This effect can be explained by Equations (4)–(6), which show that the flow time ratios of Gueroult [15] depend on the flow velocity caused by the injection pressure gradient. A comparison of the results of the established relationship of the flow paths in the fiber bundle and channels between the bundles with the model of the flow time ratios of Gueroult [15] shows good agreement within the first mold section with a 60 mm flow path. With an increasing flow path, the deviations of the time and path ratios become larger, which is due to the increasing influence of crossflows in the transverse fiber direction. These crossflows are summarized by Bodaghi et al. [9] in a loss term, which depends on the injection pressure as well as the degree of saturation. The results of the measurements show that such a loss term can be described by a correction factor that was determined for each section of the mold and the corresponding injection pressure. Simulations of previous studies [24,25,26] showed that using constant tool and material parameters, the flow front difference remains unchanged with sufficient tool length. These results could only be partially confirmed. While the flow front difference remains constant along the different mold sections within the individual parameter combinations, in contrast to the studies of Godbole [24] and Zhou [25,26], the influence of injection pressure cannot be neglected. However, there are considerable differences in the experimental setup and simulation constraints. While the simulations [24,25,26] use perfectly unidirectional tows, the experimental setup was conducted with plain weave fabric and a different type of inlet. Furthermore, the simulated tow permeability Kyytow was higher than the determined permeability of the experiments. Both factors result in differences in longitudinal and transverse flow and have an influence on the impact of capillary forces. Further experiments should be conducted that replicate the constraints of the simulations of Godbole and Zhou to be able to compare results.

4. Conclusions

With the presented methodology, the flow front of the cross-linked specimens can be viewed completely and contiguously at high resolution, which is a significant improvement over locally confined in-situ measurements. The measurement methodology represents a good starting point for the creation and validation of calculation models for the impregnation of textile preforms. Optimization potential lies in the tool design and manual preparation of the textile preforms. The adjustment of the compression pressure of the textile preforms by means of a defined tightening torque of the screw connection is reproducible to a limited extent and leads to fluctuating permeability. This deviation can be eliminated by using a vertically loosely supported plate as the mold surface with pressure sensors underneath. To specify exact physically based models for the calculation of the correction factors, either a more precise adjustability of the compression pressure must be ensured, or the tow permeability must be evaluated individually for each experiment by cutting the cured specimen and determining the surface ratios of fiber bundles and resin of the cross section. Analytical models of the dual-scale flow were confirmed and an approach to quantify the loss term of transverse flow is given. The prevalent increase of flow path differences differs from simulations, which emphasizes the need of further investigations. Since only a limited number of experiments were conducted, additional experiments should be performed to validate the findings. In future experiments, a variety of textile preforms must be analyzed to verify the applicability of the method for diverse types of weaves. Furthermore, higher modified capillary numbers must be examined, by increasing the macroscopic resin velocity via increased injection pressure. After validation of the methodology, future experiments can be conducted to directly evaluate resulting void volume contents and the coherence with the now measurable flow path differences.

Author Contributions

Conceptualization, B.N.; methodology, B.N. and F.P.; validation, B.N.; formal analysis, F.P.; investigation, B.N.; resources, F.P.; data curation, B.N.; writing—original draft preparation, B.N.; writing—review and editing, F.P.; visualization, B.N.; supervision, F.P.; project administration, F.P. All authors have read and agreed to the published version of the manuscript.

Funding

This research received no external funding.

Institutional Review Board Statement

Not applicable.

Informed Consent Statement

Not applicable.

Acknowledgments

We acknowledge support for the publication costs from the Open Access Publication Fund of the Technische Universität Ilmenau and the infrastructural support of the Thüringer Innovationszentrum Mobilität (ThIMo).

Conflicts of Interest

The authors declare no conflict of interest.

References

  1. Mehdikhani, M.; Gorbatikh, L.; Verpoest, I.; Lomov, S.V. Voids in fiber-reinforced polymer composites: A review on their formation, characteristics, and effects on mechanical performance. J. Compos. Mater. 2019, 53, 1579–1669. [Google Scholar] [CrossRef]
  2. Hagstrand, P.-O.; Bonjour, F.; Månson, J.-A.E. The influence of void content on the structural flexural performance of unidirectional glass fibre reinforced polypropylene composites. Compos. Part A Appl. Sci. Manuf. 2005, 36, 705–714. [Google Scholar] [CrossRef]
  3. De Almeida, S.F.M.; Neto, Z.d.S.N. Effect of void content on the strength of composite laminates. Compos. Struct. 1994, 28, 139–148. [Google Scholar] [CrossRef]
  4. Kuentzer, N.; Simacek, P.; Advani, S.G.; Walsh, S. Permeability characterization of dual scale fibrous porous media. Compos. Part A Appl. Sci. Manuf. 2006, 37, 2057–2068. [Google Scholar] [CrossRef]
  5. Binétruy, C.; Hilaire, B.; Pabiot, J. The interactions between flows occurring inside and outside fabric tows during rtm. Compos. Sci. Technol. 1997, 57, 587–596. [Google Scholar] [CrossRef]
  6. Facciotto, S.; Simacek, P.; Advani, S.G.; Middendorf, P. Modeling of anisotropic dual scale flow in RTM using the finite elements method. Compos. Part B Eng. 2021, 214, 108735. [Google Scholar] [CrossRef]
  7. Carlone, P.; Rubino, F.; Paradiso, V.; Tucci, F. Multi-scale modeling and online monitoring of resin flow through dual-scale textiles in liquid composite molding processes. Int. J. Adv. Manuf. Technol. 2018, 96, 2215–2230. [Google Scholar] [CrossRef]
  8. Batyrshin, E.S.; Solnyshkina, O.A.; Pityuk, Y.A. Study of the Features of Double Porosity Media Impregnation. Technol. Phys. 2022, 24, 852. [Google Scholar] [CrossRef]
  9. Bodaghi, M.; Lomov, S.V.; Simacek, P.; Correia, N.C.; Advani, S.G. On the variability of permeability induced by reinforcement distortions and dual scale flow in liquid composite moulding: A review. Compos. Part A Appl. Sci. Manuf. 2019, 120, 188–210. [Google Scholar] [CrossRef]
  10. Yashiro, S.; Nakashima, D.; Oya, Y.; Okabe, T.; Matsuzaki, R. Particle simulation of dual-scale flow in resin transfer molding for process analysis. Compos. Part A Appl. Sci. Manuf. 2019, 121, 283–288. [Google Scholar] [CrossRef]
  11. Schell, J.S.U.; Deleglise, M.; Binetruy, C.; Krawczak, P.; Ermanni, P. Numerical prediction and experimental characterisation of meso-scale-voids in liquid composite moulding. Compos. Part A Appl. Sci. Manuf. 2007, 38, 2460–2470. [Google Scholar] [CrossRef]
  12. Ruiz, E.; Achim, V.; Soukane, S.; Trochu, F.; Breard, J. Optimization of injection flow rate to minimize micro/macro-voids formation in resin transfer molded composites. Compos. Sci. Technol. 2006, 66, 475–486. [Google Scholar] [CrossRef]
  13. Park, C.H.; Lebel, A.; Saouab, A.; Bréard, J.; Lee, W.I. Modeling and simulation of voids and saturation in liquid composite molding processes. Compos. Part A Appl. Sci. Manuf. 2011, 42, 658–668. [Google Scholar] [CrossRef]
  14. Teixidó, H.; Staal, J.; Caglar, B.; Michaud, V. Capillary Effects in Fiber Reinforced Polymer Composite Processing: A Review. Front. Mater. 2022, 9, 37. [Google Scholar] [CrossRef]
  15. Gueroult, S.; Lebel-Lavacry, A.; Park, C.H.; Bizet, L.; Saouab, A.; Bréard, J. Analytical modeling and in situ measurement of void formation in liquid composite molding processes. Adv. Compos. Mater. 2013, 23, 31–42. [Google Scholar] [CrossRef]
  16. Carman, P.C. Fluid flow through granular beds. Chem. Eng. Res. Des. 1997, 75, S32–S48. [Google Scholar] [CrossRef]
  17. Amico, S.; Lekakou, C. An experimental study of the permeability and capillary pressure in resin-transfer moulding. Compos. Sci. Technol. 2001, 61, 1945–1959. [Google Scholar] [CrossRef]
  18. Gutowski, T.G.; Morigaki, T.; Cai, Z. The Consolidation of Laminate Composites. J. Compos. Mater. 1987, 21, 172–188. [Google Scholar] [CrossRef]
  19. Lee, G.-W.; Lee, K.-J. Mechanism of Void Formation in Composite Processing with Woven Fabrics. Polym. Polym. Compos. 2003, 11, 563–572. [Google Scholar] [CrossRef]
  20. Oya, Y.; Matsumiya, T.; Ito, A.; Matsuzaki, R.; Okabe, T. Gate optimization for resin transfer molding in dual-scale porous media: Numerical simulation and experiment measurement. J. Compos. Mater. 2020, 54, 2131–2145. [Google Scholar] [CrossRef]
  21. Leclerc, J.S.; Ruiz, E. Porosity reduction using optimized flow velocity in Resin Transfer Molding. Compos. Part A Appl. Sci. Manuf. 2008, 39, 1859–1868. [Google Scholar] [CrossRef]
  22. LeBel, F.; Fanaei, A.E.; Ruiz, É.; Trochu, F. Prediction of optimal flow front velocity to minimize void formation in dual scale fibrous reinforcements. Int. J. Mater. Form. 2014, 7, 93–116. [Google Scholar] [CrossRef]
  23. Imbert, M.; Comas-Cardona, S.; Abisset-Chavanne, E.; Prono, D. Experimental investigation of intra-tow fluid storage mechanisms in dual-scale fiber reinforcements. Compos. Part A Appl. Sci. Manuf. 2018, 107, 70–82. [Google Scholar] [CrossRef]
  24. Godbole, M.G.; Gururaja, S.; Joshi, M.; Advani, S. Semi-analytical formulation of effective permeability of a dual scale unidirectional fabric. Compos. Part A Appl. Sci. Manuf. 2021, 150, 106630. [Google Scholar] [CrossRef]
  25. Zhou, F.; Kuentzer, N.; Simacek, P.; Advani, S.G.; Walsh, S. Analytic characterization of the permeability of dual-scale fibrous porous media. Compos. Sci. Technol. 2006, 66, 2795–2803. [Google Scholar] [CrossRef]
  26. Zhou, F.; Alms, J.; Advani, S.G. A closed form solution for flow in dual scale fibrous porous media under constant injection pressure conditions. Compos. Sci. Technol. 2008, 68, 699–708. [Google Scholar] [CrossRef]
  27. Patel, N.; Rohatgi, V.; Lee, L.J. Micro scale flow behavior and void formation mechanism during impregnation through a unidirectional stitched fiberglass mat. Polym. Eng. Sci. 1995, 35, 837–851. [Google Scholar] [CrossRef]
  28. Chen, Y.-T.; Davis, H.T.; Macosko, C.W. Wetting of fiber mats for composites manufacturing: I. Visualization experiments. AIChE J. 1995, 41, 2261–2273. [Google Scholar] [CrossRef]
  29. Lystrup, C.; George, A.; Zobell, B.; Boster, K.; Childs, C.; Girod, H.; Fullwood, D. Optical measurement of voids in situ during infusion of carbon reinforcements. J. Compos. Mater. 2021, 55, 775–786. [Google Scholar] [CrossRef]
  30. Pillai, K.M. Modeling the Unsaturated Flow in Liquid Composite Molding Processes: A Review and Some Thoughts. J. Compos. Mater. 2004, 38, 2097–2118. [Google Scholar] [CrossRef]
  31. Crivello, J.V.; Reichmanis, E. Photopolymer Materials and Processes for Advanced Technologies. Chem. Mater. 2014, 26, 533–548. [Google Scholar] [CrossRef]
  32. Ravve, A. Light-Associated Reactions of Synthetic Polymers; Springer Science + Business Media LLC.: New York, NY, USA, 2006; ISBN 0-387-31803-8. [Google Scholar]
  33. Pagac, M.; Hajnys, J.; Ma, Q.-P.; Jancar, L.; Jansa, J.; Stefek, P.; Mesicek, J. A Review of Vat Photopolymerization Technology: Materials, Applications, Challenges, and Future Trends of 3D Printing. Polymers 2021, 13, 598. [Google Scholar] [CrossRef] [PubMed]
  34. Tian, F.; Hao, Y.; Zou, Z.; Zheng, Y.; He, W.; Yang, L.; Li, L. An Ultrasonic Pulse-Echo Method to Detect Internal Defects in Epoxy Composite Insulation. Energies 2019, 12, 4804. [Google Scholar] [CrossRef] [Green Version]
  35. Taheri, H.; Hassen, A.A. Nondestructive Ultrasonic Inspection of Composite Materials: A Comparative Advantage of Phased Array Ultrasonic. Appl. Sci. 2019, 9, 1628. [Google Scholar] [CrossRef] [Green Version]
  36. Siddig, N.A.; Binetruy, C.; Syerko, E.; Simacek, P.; Advani, S. A new methodology for race-tracking detection and criticality in resin transfer molding process using pressure sensors. J. Compos. Mater. 2018, 52, 4087–4103. [Google Scholar] [CrossRef]
Figure 1. Saturated, partially saturated, and unsaturated regions of the flow front in a unidirectional preform.
Jcs 06 00351 g001
Figure 2. Formation of voids in the dual-scale model; (a) Formation of spherical macrovoids in the channels between the tows; (b) Formation of elongated microvoids inside the tows.
Jcs 06 00351 g002
Figure 3. Length of the partially saturated flow front Lps.
Jcs 06 00351 g003
Figure 4. Experimental setup to produce planar test specimens with a photoreactive resin system.
Jcs 06 00351 g004
Figure 5. Schematic course of the flow front and division of the flow path into mold sections denominated from inlet to outlet as one to five.
Jcs 06 00351 g005
Figure 6. Parameter combinations for injection experiments.
Jcs 06 00351 g006
Figure 7. (a) Frozen flow front in different mold sections and merged microscopy image; (b) single flow path difference Δl, shown magnified.
Jcs 06 00351 g007
Figure 8. Flow path difference along the mold sections.
Jcs 06 00351 g008
Figure 9. Dependence of the flow path difference and modified capillary number on the injection pressure.
Jcs 06 00351 g009
Figure 10. Trend of the flow path difference in coherence with the local modified capillary number.
Jcs 06 00351 g010
Figure 11. Comparison of the measured length ratios at 60 mm distance from the sprue with the calculated time ratios according to Equation (6).
Jcs 06 00351 g011
Figure 12. Division of the total volume flow into crossflow Q ˙ t into the tow and longitudinal flow Q ˙ c in the channel.
Jcs 06 00351 g012
Figure 13. Comparison of measured aspect ratios of all tool sections.
Jcs 06 00351 g013
Figure 14. Determined correction factors for the adjustment of the measured length ratios to the calculated time ratios according to Gueroult.
Jcs 06 00351 g014
Table 1. Measured and calculated parameters of the fabric.
ParameterAbbreviationValueUnit
Type of weave Plain weave[-]
Grammagemf395[g/m²]
Thread count warp 6[L/cm]
Thread count weft 6.5[L/cm]
Fiber diameterdf9[µm]
Width of tows2a1.38[mm]
Width of channels2h0.39[mm]
Transverse permeability of tows K y y t o w 5.32 × 10⁻⁷[mm2]
Volume fraction of tows in a unit cell V t o w p l y 77.99[%]
Publisher’s Note: MDPI stays neutral with regard to jurisdictional claims in published maps and institutional affiliations.

