Article

Thermal/Electrical Properties and Texture of Carbon Black PC Polymer Composites near the Electrical Percolation Threshold

by
Valentina Brunella
,
Beatrice Gaia Rossatto
,
Chiara Mastropasqua
,
Federico Cesano
* and
Domenica Scarano
Department of Chemistry and NIS (Nanostructured Interfaces and Surfaces) Interdepartmental Centre, University of Torino, Via P. Giuria 7, 10125 Torino, Italy
*
Author to whom correspondence should be addressed.
J. Compos. Sci. 2021, 5(8), 212; https://doi.org/10.3390/jcs5080212
Submission received: 3 July 2021 / Revised: 1 August 2021 / Accepted: 9 August 2021 / Published: 11 August 2021
(This article belongs to the Special Issue Carbon-Based Polymer Nanocomposites)

Abstract

:
Polycarbonate (PC), a thermoplastic polymer with excellent properties, is used in many advanced technological applications. When PC is blended with other polymers or additives, new properties, such as electrical properties, can be available. In this study, carbon black (CB) was melt-compounded with PC to produce polymer compounds with compositions (10–16 wt.% of CB), which are close to or above the electrical percolation threshold (13.5–14 wt.% of CB). Effects due to nanofiller dispersion/aggregation in the polymer matrix, together with phase composition, glass transition temperature, morphology and textural properties, were studied by using thermal analysis methods (thermogravimetry and differential scanning calorimetry) and scanning electron microscopy. The DC electrical properties of these materials were also investigated by means of electrical conductivity measurements and correlated with the “structure” of the CB, to better explain the behaviour of the composites close to the percolation threshold.

1. Introduction

Polycarbonate (PC) is a high-performance thermoplastic polymer, which combines a series of unique properties, including high impact strength, good dimensional stability, 100% protection from the UV radiation, excellent optical properties (i.e., transparent color, a refractive index of 1.58), and good chemical/heat/creep resistances in a wide temperature range [1,2]. Due to these properties, the demand for PC for electronic components, data storage devices, optics and lenses, materials for structural and medical applications, is increasing and the annual production reached 4.1 million tons in 2020. Most of the aforementioned properties rely on the amorphous nature of organic functional groups linked by carbonate groups (–O–(C=O)–O–), which are also responsible for the high mechanical resistance of polycarbonate. The high glass transition temperature (Tg) of bisphenol A-derived PC polymers (which is much higher than those of aliphatic PC counterparts), is mainly caused by the small molecular rotation of bonds, due to steric hindrance of p-phenylene rings along the main polymer chain [3].
Even though PC belongs to electrically insulating polymers, its limitation in electrical resistivity (c.a. 0.1–1 × 10⁻¹⁵ Ω·cm) can be exceeded by the addition of conductive fillers, such as metal particles [4,5] and carbon-based materials. If the composite material becomes electrically conductive, it can be used in new applications, in which electrical properties are required, such as antistatic or static dissipation, conductive and electromagnetic shielding materials [4]. Among the carbon fillers to be dispersed in polymers, CNTs and graphene have the most notable effect on electrical conductivity, with an electrical percolation threshold ranging between 1 and 4 wt.% [6,7,8,9,10,11,12], while a higher filler loading (c.a. 4–15 wt.%) is usually required to obtain an electrical percolated network with graphite-based materials (graphite flakes, graphite nanoplatelets, expanded graphite, nanographite) [13,14,15], carbon fibers [16], and carbon black [11,17,18]. Conversely, a lower filler content could be enough with a greater dispersion of the functionalized filler and with the use of solvents, additives and compatibilizers [19,20]. The doping of carbon materials with heteroelements [21], blending of the polymer matrix with immiscible polymers (i.e., double percolation of CB in immiscible polymers) [22,23,24,25], use of multiple fillers (e.g., CB + CNTs, graphite nanoplatelets + CNTs) [26], slow cooling [27] and other processing conditions (i.e., mold and injection temperatures, injection rate) [25,28], to achieve an electrical percolation threshold, are also reported in some papers [5,29,30]. However, some of these methods appear to be unsuitable for a production scale.
As far as carbon black is concerned, it is still one of the most used carbon fillers, in particular for imparting good thermal/electrical/mechanical properties, UV protection and pigmentation to the polymer compounds. The reason for this broad use is certainly attributed to the variety of CB that are available on the market, to the different natures of the CB, and to the so-called carbon black “structure”, which is largely used to describe particle aggregates of various sizes and shapes. Such aggregates, with or without branched chains, are obtained during the production step, due to the coalescence of primary particles, which merge together [18]. The CB structure degree can be easily quantified [31] by the small/high amount of dibutyl phthalate (DBP) that can be absorbed (i.e., the greater the absorption value, the higher the structure as scored with the Oil Absorption Number, OAN). In this regard, a high-structure black is usually shown for CB grades with primary particles of smaller sizes, while a low-structure black can be found from larger primary CB particles (>c.a. 100 nm), due to the tendency of small particles to form aggregates [32]. From this concept and due to the tendency to develop larger aggregates that are spaced by a smaller separation, higher conductivity at the same loading can be measured in high-structure blacks [32,33]. In the ultimate preparation step (i.e., the compounding process), the CB is then mixed with the melting polymer during compounding and the process parameters, including shear forces, may influence the filler dispersion with the formation of a network of agglomerated CB aggregates inside the polymer matrix.
In this work, PC was melt-compounded with different weight amounts of a high-structure CB close to the electrical percolation threshold, in order to examine the effect of filler content and dispersion on the thermal and electrical properties. These properties were then correlated with the dispersion of the filler and with the obtained texture.

2. Materials and Methods

2.1. Materials

Calibre Polycarbonate resin (PC, Trinseo, Berwyn, PA, USA) was used, due to its characteristics, including Melt Mass-Flow Rate (MFR) of 22 g/10 min (300 °C/1.2 kg), that are suitable for injection molding. Carbon black (CB, ENSACO® 250 G supplied by Imerys, Paris, France), with primary particle sizes of 40–50 nm, surface area of 65 m2/g and oil absorption number (OAN) of 190 mL/100 g, were added separately to the polymer. Compounds were then obtained by melt extrusion (Leistritz 27E co-rotating twin-screw extruder with screw diameter and length/diameter of 27 mm and of 40:1, respectively) and injection molding at 310–315 °C with mold temperature of 90 °C.

2.2. Methods

Thermogravimetric analyses (TGA) were performed by means of a Q500 TA Instruments, by increasing the temperature from RT to 700 °C under nitrogen (N2) gas flow, then to 950 °C in air (heating rate 10 °C/min in both steps). This method was adopted to determine the polymer and carbon content of the carbonaceous PC pyrolysis products and of the CB filler, after compounding.
Differential scanning calorimetry (DSC) measurements were performed by a Q200 TA Instruments in N2 gas flow, setting up a heat–cool–heat cycle method from 30 °C to 200 °C (heating rate of 30 °C/min), in order to erase the thermal history of the polymeric phase and then to characterize the material properties [34]. A quantity of c.a. 10 mg or of c.a. 3–8 mg were used for TGA or DSC experiments, respectively.
Morphology of melt-compounded samples was investigated by means of Zeiss Evo 50 SEM (scanning electron microscopy) instrument. Before SEM analyses specimens were cryo-fractured in liquid nitrogen [9].
DC through-plane electrical properties were obtained by using a conventional two-point probe method connected with a Keithley 2420 source meter. Compounds in the form of 2 mm thick plates were cut to obtain smaller specimens with dimensions of c.a. 20 × 14 × 2 mm. The opposite faces of the specimens were polished to eliminate the outermost surface. Ag paste was used on both sides of samples to make electrodes with sizes of c.a. 280–300 mm2, which were connected with Cu wires working as connecting leads. The electrical volume resistivity (ρ) was determined by using the equation: ρ = R × (A/l), where R is the measured resistance, A is the electrode surface and l is the distance between the two parallel electrodes. DC electrical conductivity was calculated by using the equation: σ = 1/ρ.
Measurements were obtained by placing the specimen in a homemade sample holder consisting of a fixed side and a spring-loaded electrode (Supplementary Data). The specimen in the sample holder was placed in an oven to evaluate the electrical conductivity dependence with temperatures from room temperature up to c.a. 200 °C.

3. Results and Discussion

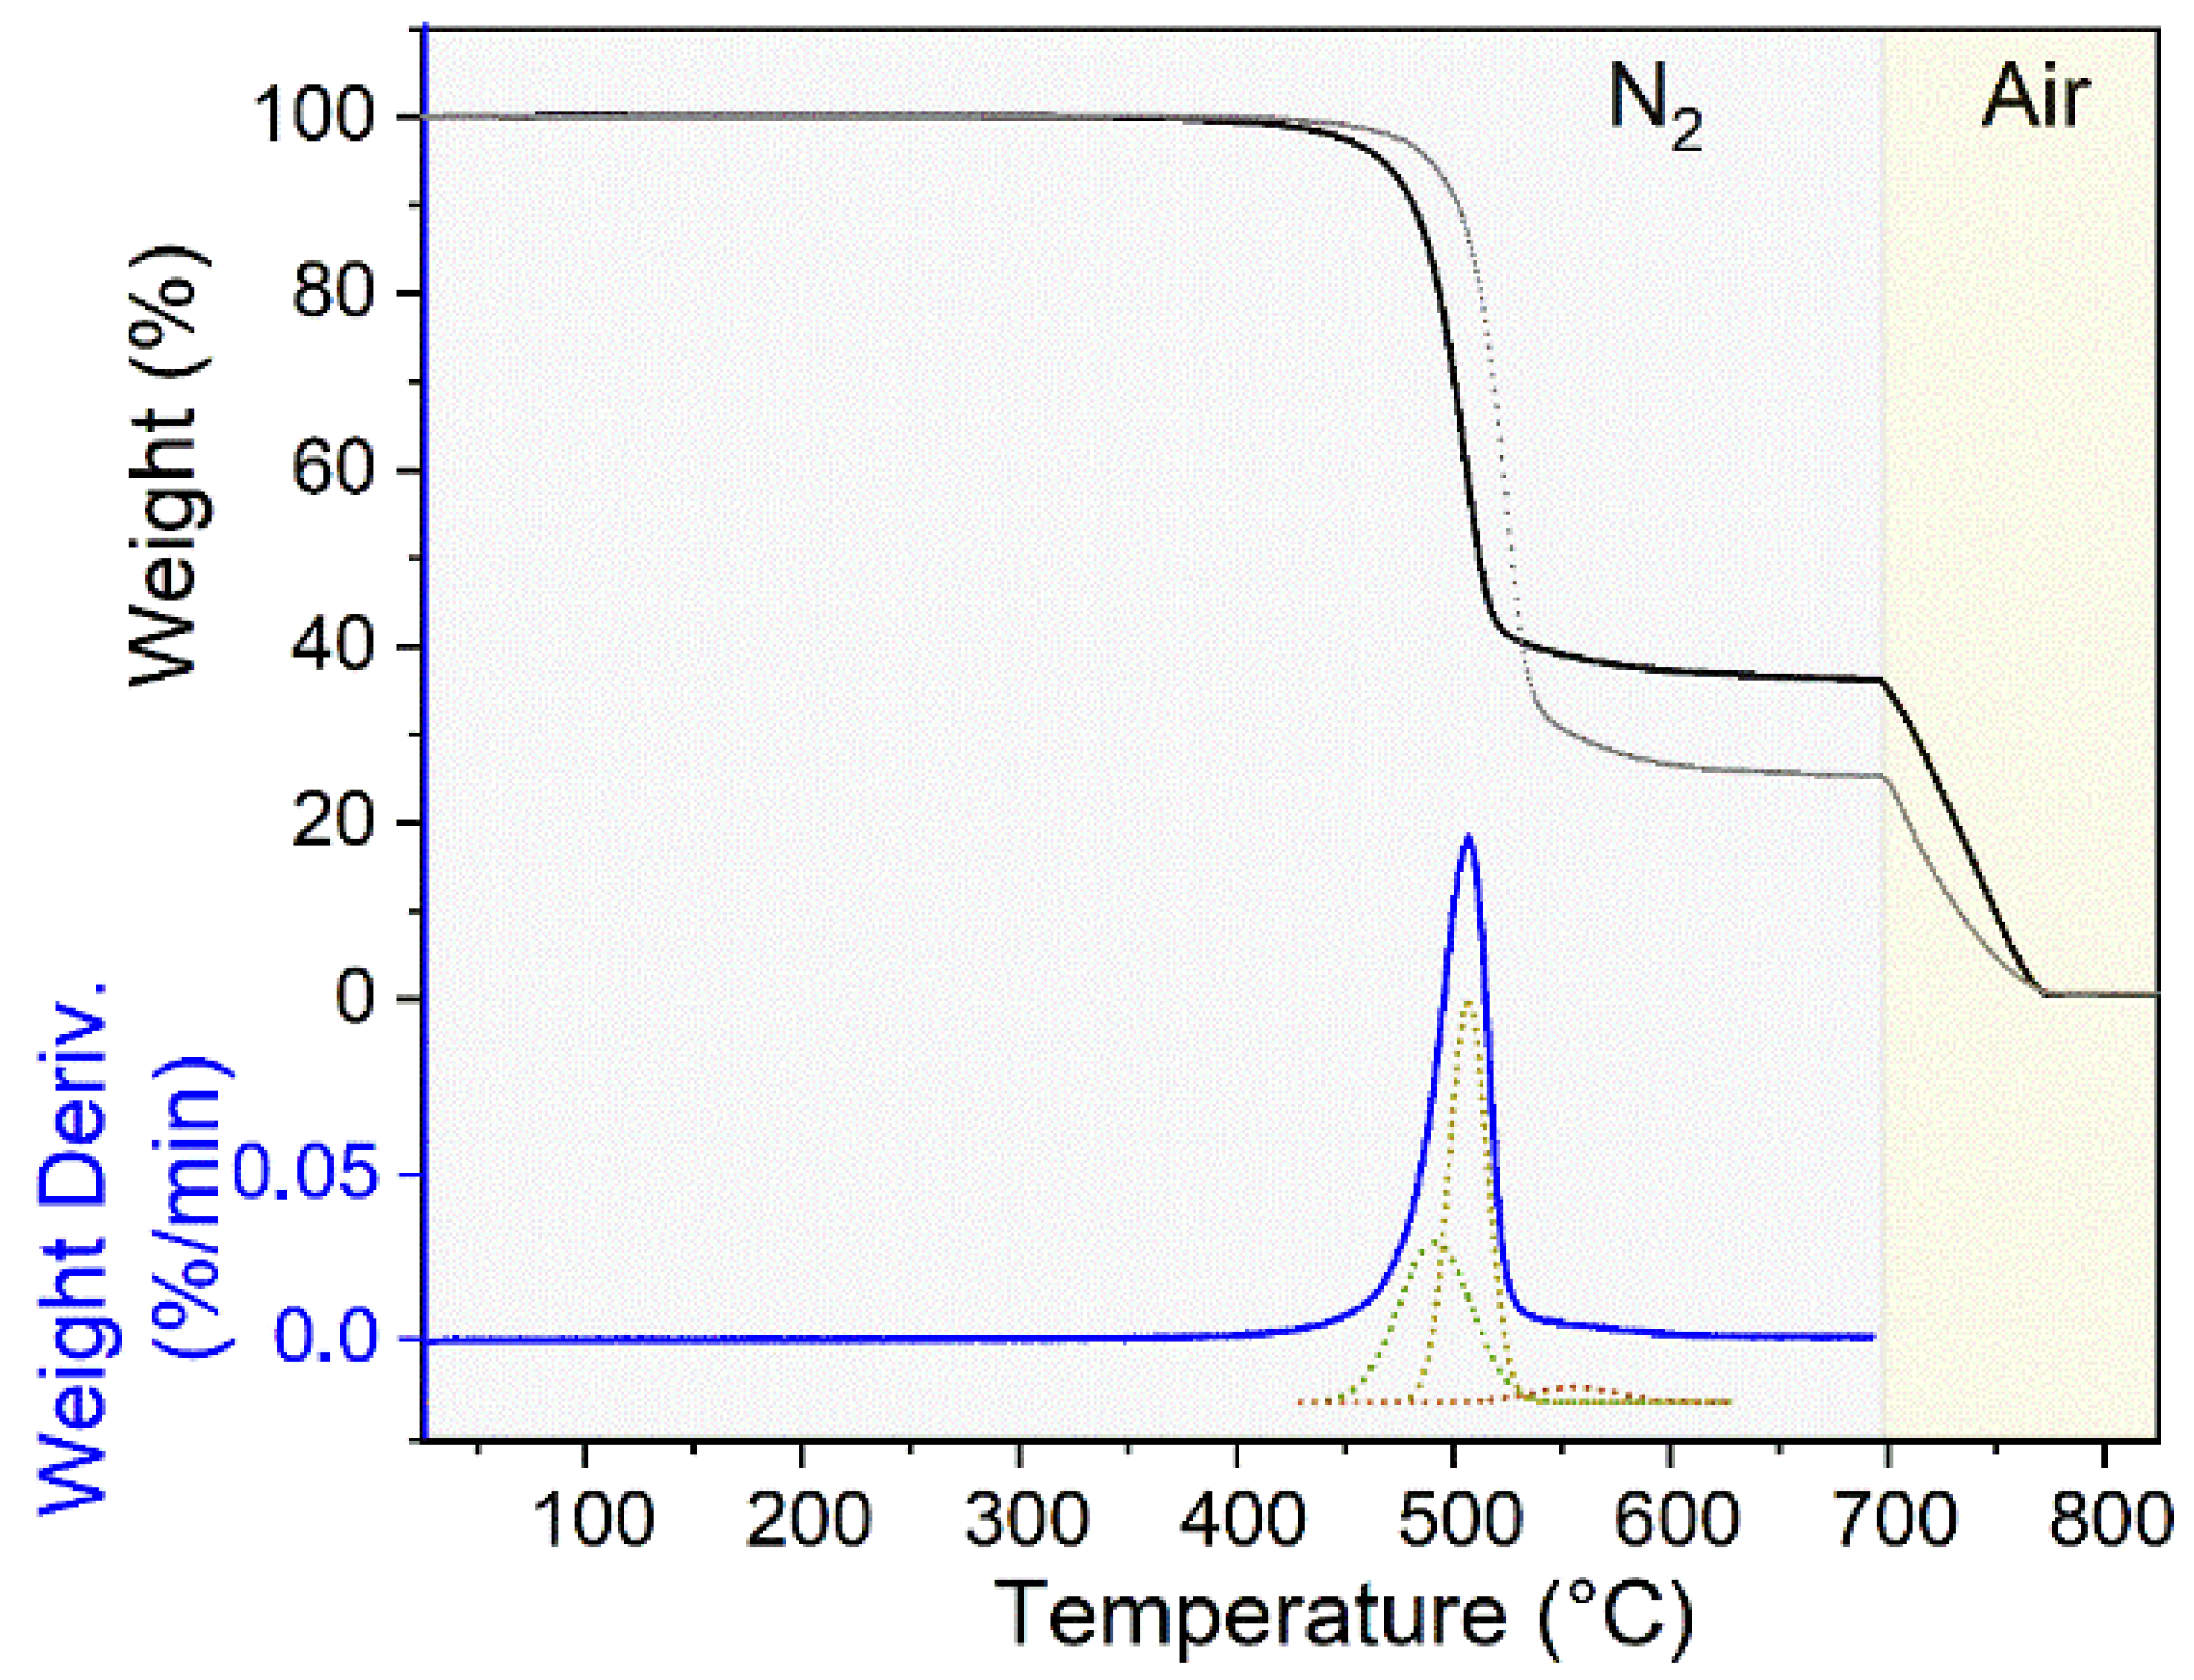
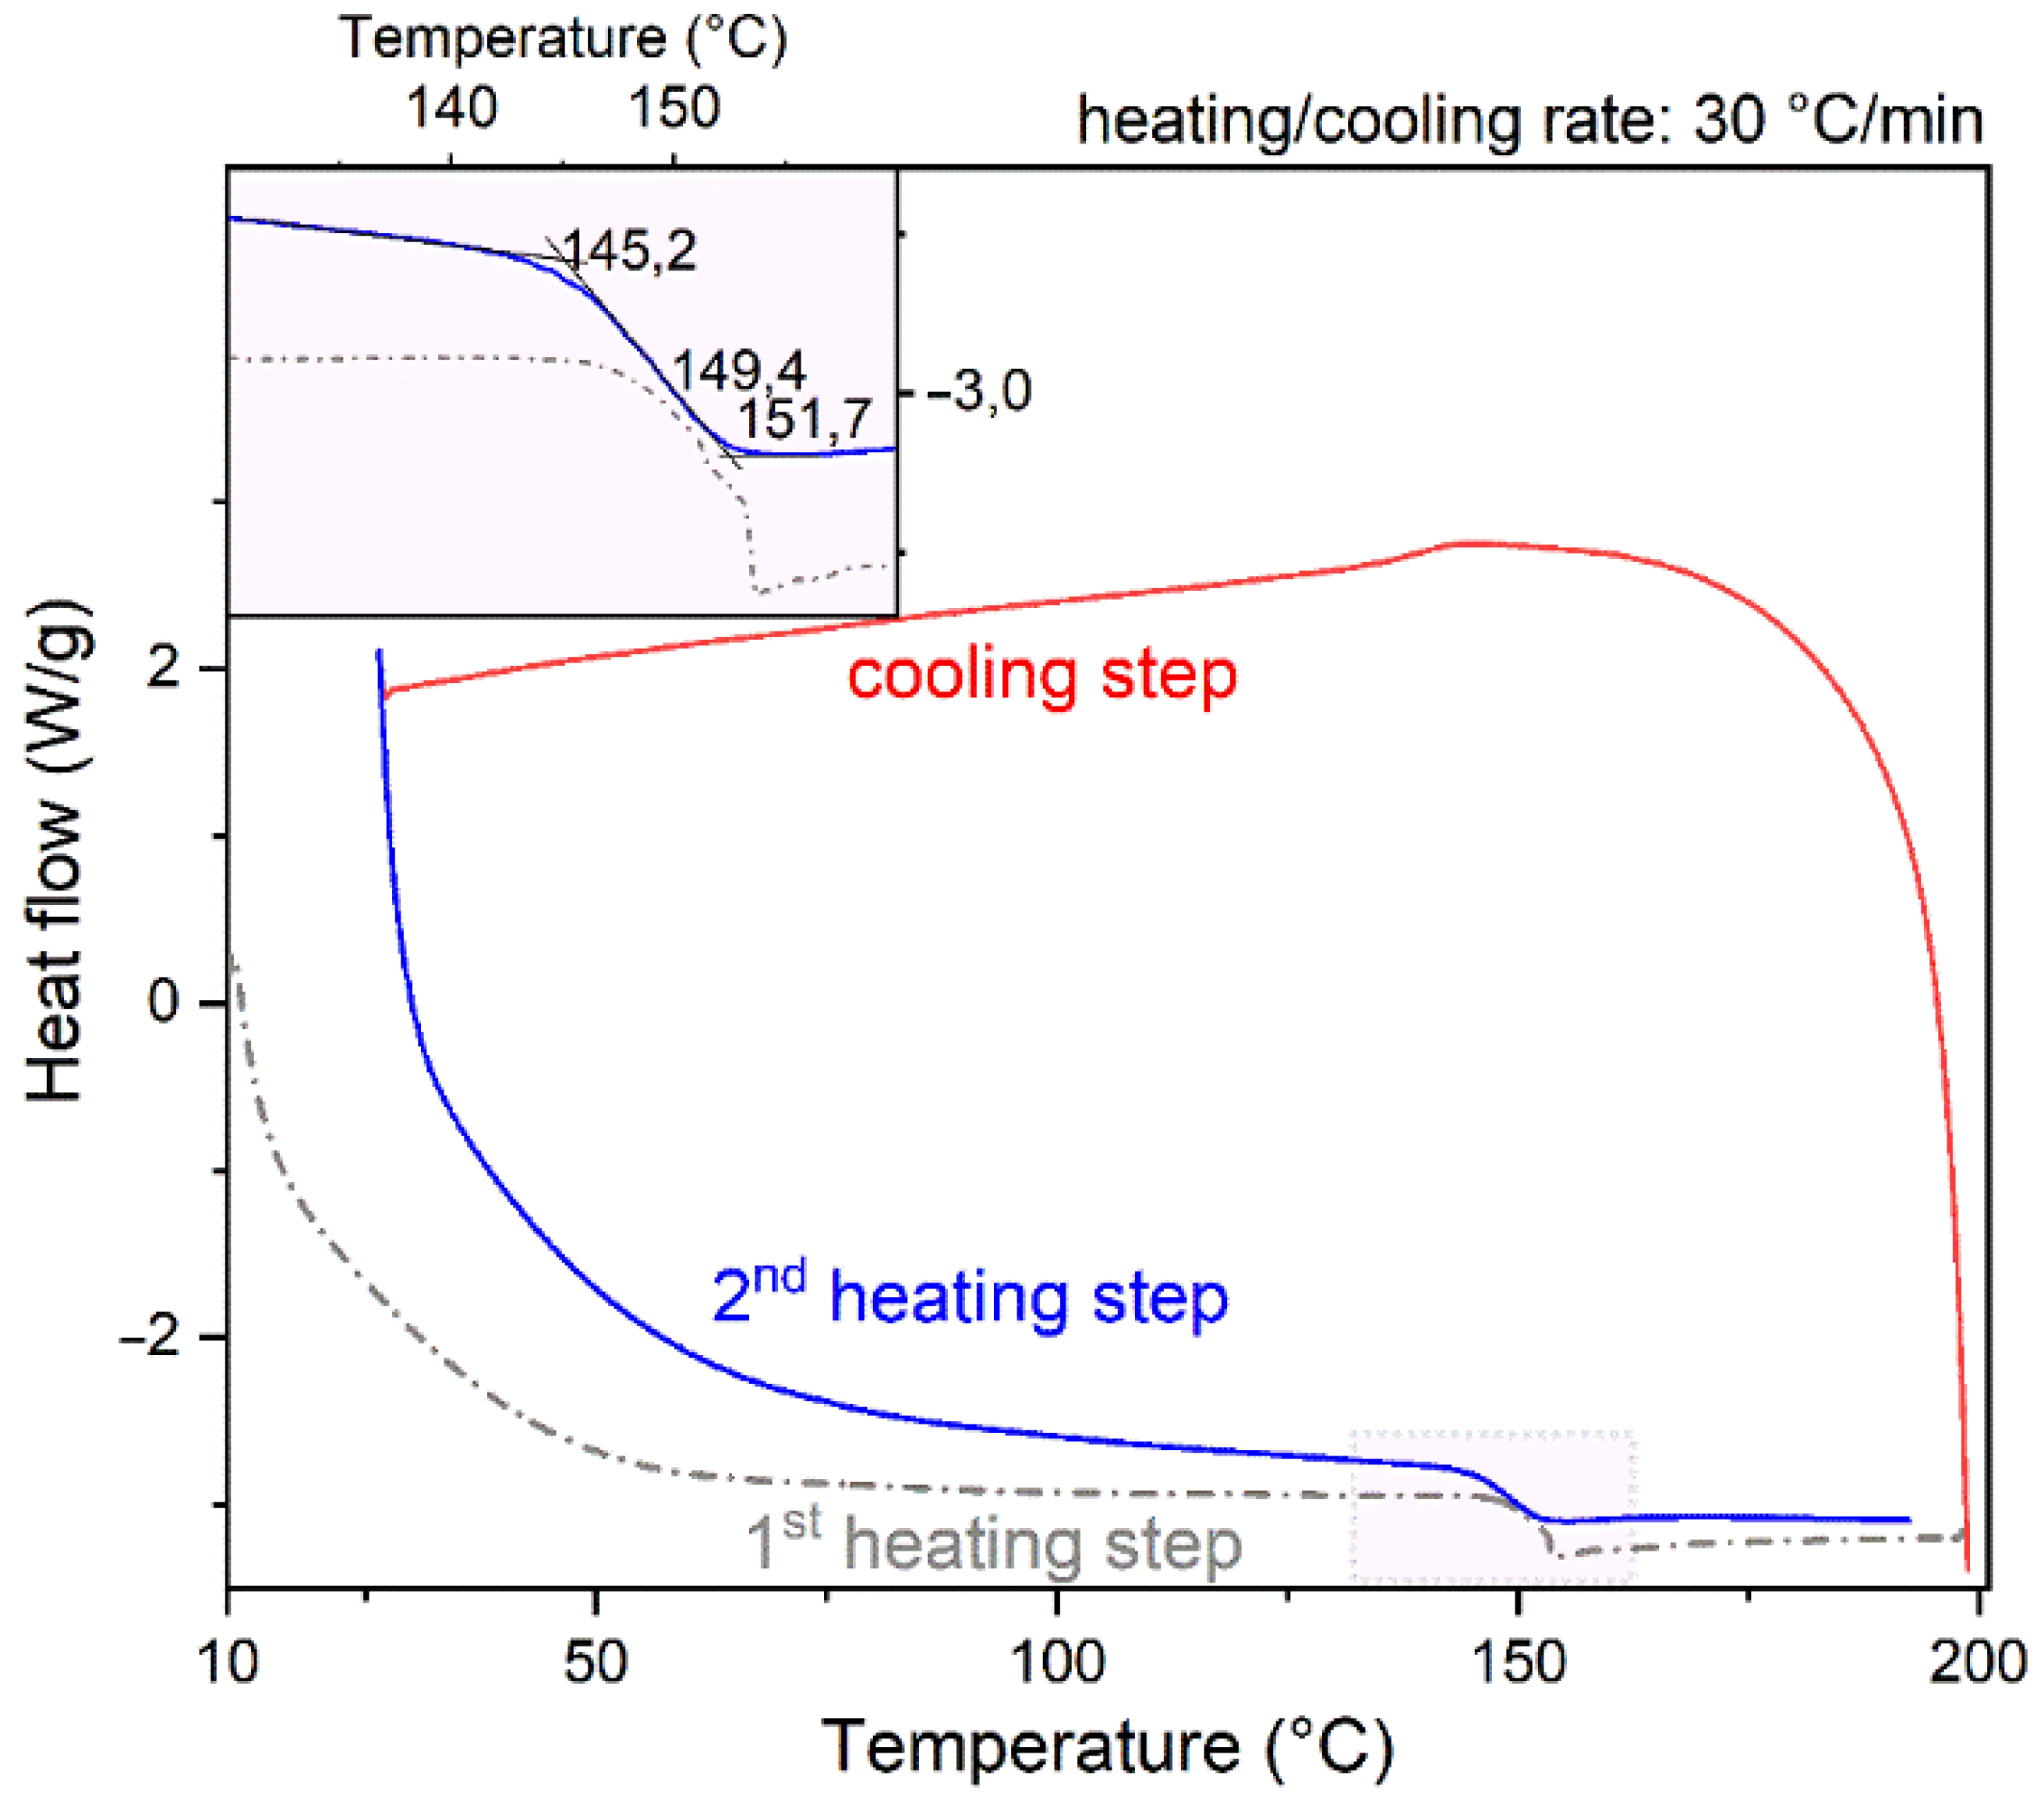
3.1. TGA and DSC Analyses

TGA was performed to quantify the polymer/filler percentages in the composite materials, while DSC analyses were performed to determine the values of the glass transition temperatures of the melt compounded samples.
TGA curves shown in Figure 1 are to be considered as representative of the whole series of measurements for CB-filled PC-composites, due to similarities of the thermograms. The neat polymer was analyzed for reference to quantify the percentage of filler in the composite materials. PC showed no weight loss until c.a. 420–430 °C, then the polymer decomposition took place in a single step with a maximum degradation rate at 525 °C. The char yield at 700 °C was 24.6 wt.%, while at higher temperatures (700–900 °C), after replacing the N2 gas flow with air, the complete combustion of char took place. The carbonaceous products come from chain scission mechanisms of the polymer, including isopropylidene linkage, hydrolysis/alcoholysis and rearrangement of carbonate linkages [35,36], occuring during well-defined temperature intervals of the pyrolysis step, as calculated from deconvolution of the DTGA signal (bottom dotted curves in Figure 1). The carbon yield obtained from TGA residue of melt-compounded PC is consistent with parental studies dedicated to the polymer degradation (24.5 wt.%) [35]. The TGA plot of PC-filled with 10 wt.% CB showed a decreased weight loss (68.2 wt.% at 700 °C), while the second weight loss, occurring in air in the 700–800 °C range, was increased. The relative percentage of char formed in the pyrolysis of PC should be taken into consideration for the quantification of the CB in the composite. The TGA profile of the PC + CB-16 sample (PC filled with 16 wt.% CB, black curve) is comparable to what was observed for the neat polymer, but the weight obtained at 700 °C was 37.8 wt.%.
The calculated quantities of CB in the polymer matrix and the Tg midpoints of the composites are summarized in Table 1.
Heat/cool/heat DSC runs of PC + CB-16 are shown in Figure 2. DSC curves are to be considered as representative of the whole series of measurements for CB-filled PC-composites, due to similarities of heat flow signals.
From these curves is clear that the first heating cycle contains effects of the process temperature (i.e., thermal history). Uncertain heat flow signal near Tg with a sort of an enthalpy relaxation peak is also present in the first heating run. Furthermore, a hysteresis loop between the cooling and the second heating run is illustrated. From the second heating run, Tg can be more precisely ascertained. However, as glass transition is a kinetic process and the calculated Tg values are determined also via the heating/cooling rates (the higher the heating/cooling rate, the higher the resulting Tg), the glass transition temperature cannot be precisely defined. Therefore, variations observed in the second heating curve of composite materials having different CB loadings are compared. From these results (Table 1) it is clear that Tg is not remarkably affected by the addition of carbon black to the polymer. Tg of the CB-filled samples was found to be close than that of the neat polymer and the small changes indicate that the carbon black structure in the composites does not inhibit the polymer chain mobility, even at the high CB content under the adopted process parameters and compositions. Furthermore, no evidence of a remarkable polymer nucleation or crystallinity induced by CB presence can be observed in the first and second heating runs. These results are in agreement with literature [6].

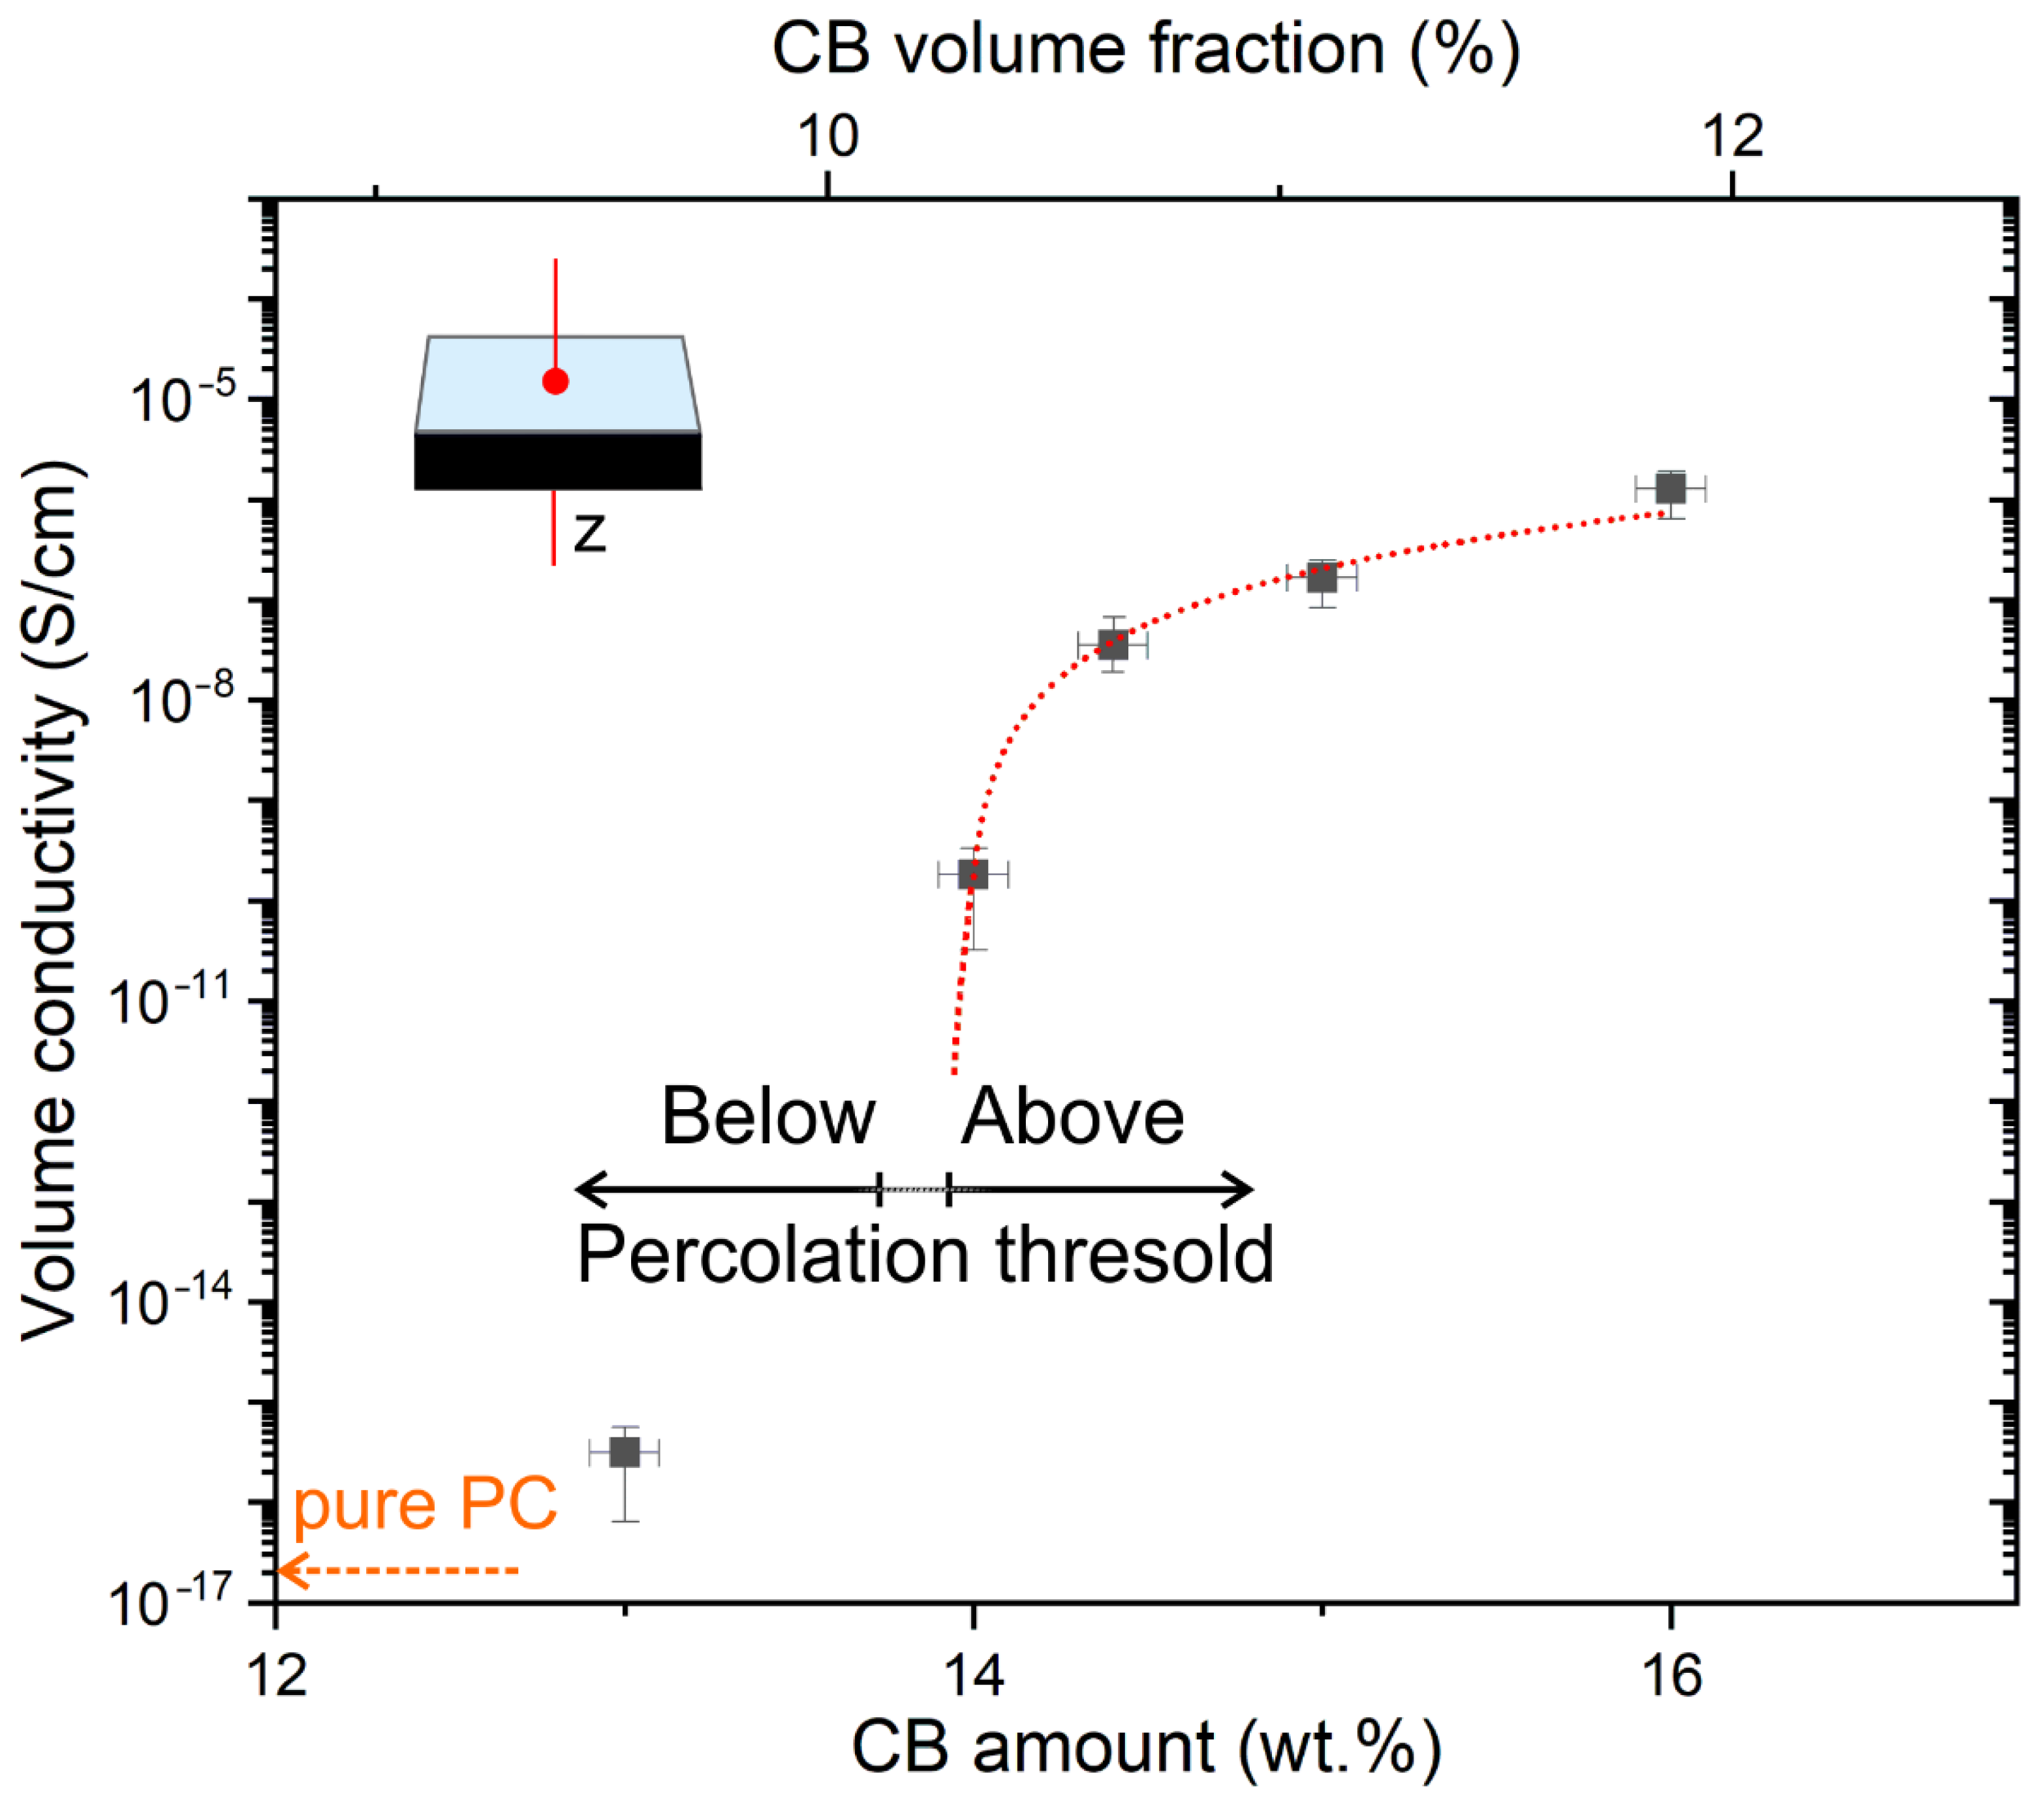
3.2. DC Electrical Measurements
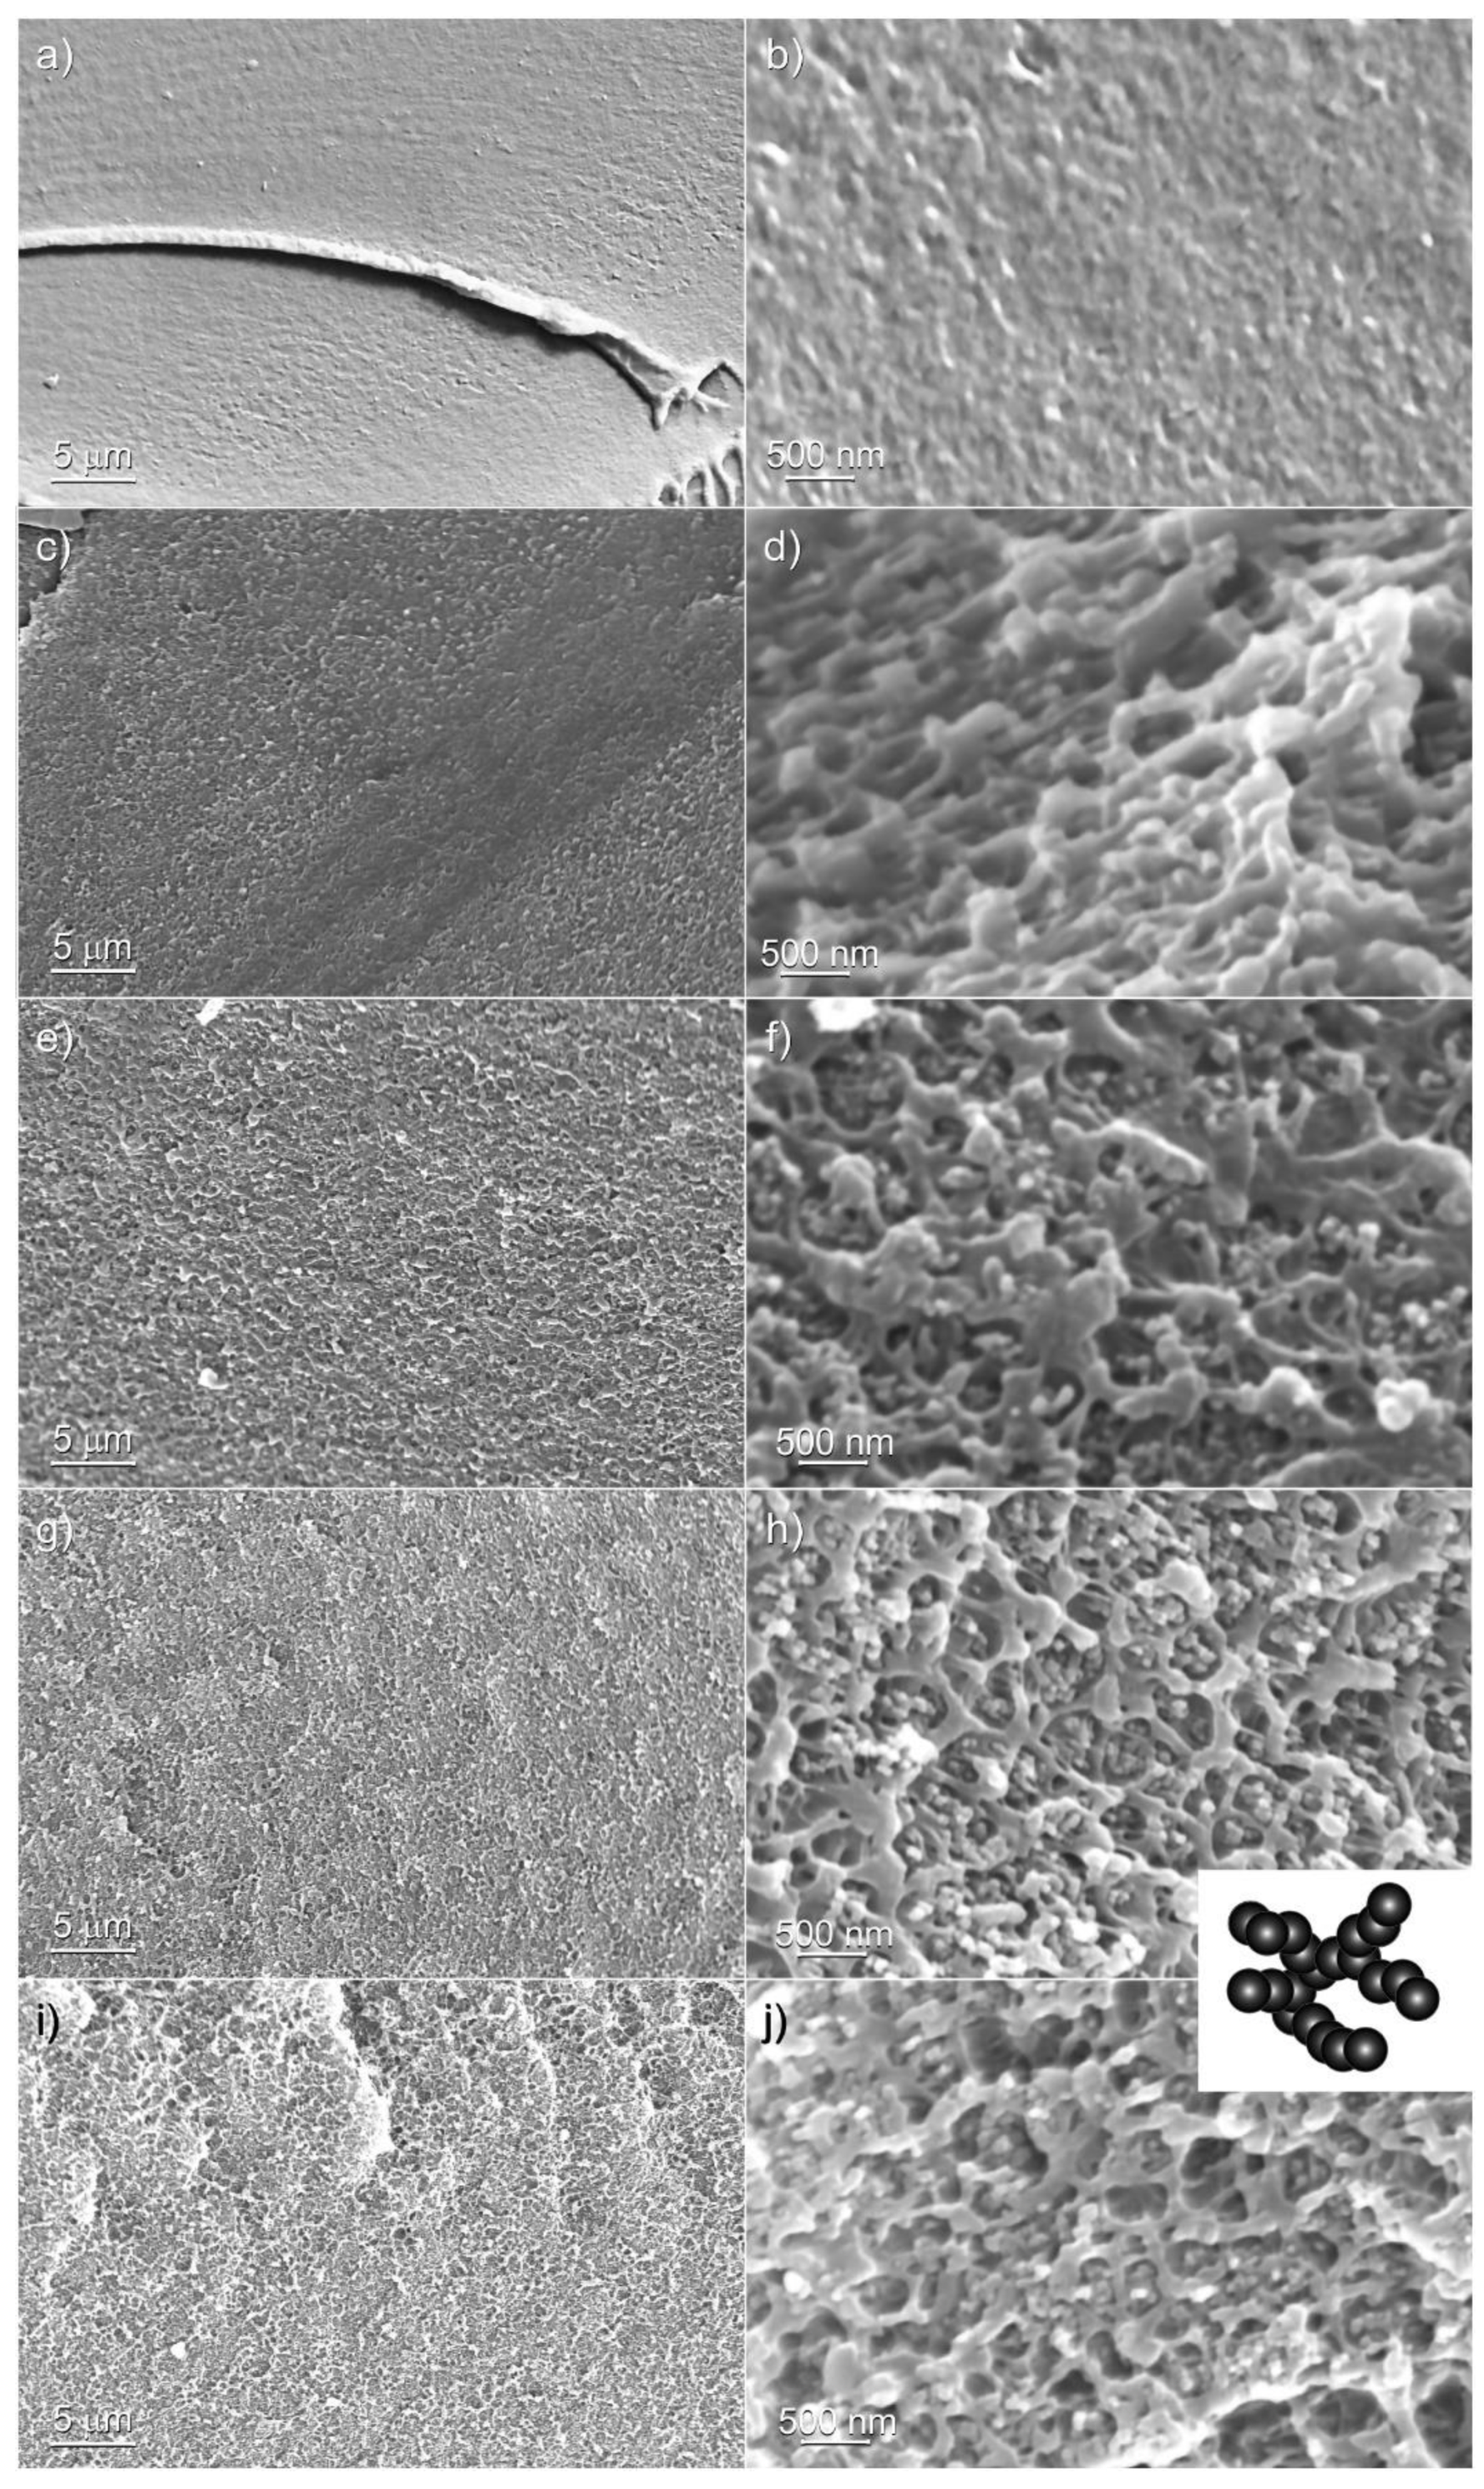
Figure 3 shows the DC electrical properties of the CB-filled PC compounds at 25 °C. In this figure the CB conducting filler gradually increases in the insulating PC matrix and an insulator-to-conductor transition is observed in the c.a. 13.5–14 wt.% filler range. Such an electrical percolation threshold position is consistent with the literature data of CB-filled compounds including PC or PS (12–13 wt.% CB), HDPE (16–17 wt.% CB or even higher), and PP-copolymer (c.a. 13–14 wt.% CB) [18,37]. Above these values, called critical filler concentrations [18], the electrical percolation threshold is exceeded and the measured DC electrical conductivity of the composite specimens abruptly jumps up of about 5–6 orders of magnitude, due to the formation of continuous conducting paths in the material. In more detail, the DC conductivity (σ) above the percolation threshold was estimated by the conventional power-law model: σ = σ0 (ффc)t [38], where σ0 is a scaling factor, ф is the filler fraction, фc is the filler percolation threshold, and t is the critical exponent. фc and t were determined via a least squares fitting of the log of conductivity plotted versus log (ффc) and the values were varied up to the best linear fit. The aforementioned equation fits the experimental data for ф > фc, giving a percolation threshold (фc) of c.a. 13.9 wt.% and a critical exponent t of 2.9 (Figure S1, Supplementary Data), which is an indication of a three-dimensionally organized conducting network [32].
Electrical properties near and beyond the percolation threshold (PC with 14 wt.% CB and with 16 wt.%, respectively) were also evaluated by increasing the temperature up to 180 °C (Figure S2, Supplementary Data).
By rising the temperature, the resistivity does not change considerably up to c.a. 120–130 °C, while the variation becomes more evident when approaching the Tg. The different electrical properties with the temperature could be explained with the connection degree in the percolation paths, resulting from the different thermal expansion coefficients of the polymer and of the filler, which results in it being interrupted at high temperatures [39] (i.e., dynamic non-ohmic/ohmic transition).
Based on the measured conductivity, applications as semi-conductive, static dissipative polymeric materials can be envisaged. However, it should be remarked that the electrical conductivity observed for the CB quantity in the 9–16 wt.% range is quite limited and far from the intrinsic electrical conductivity values measured for the pressed powders of ENSACO 250G carbon black (c.a. 10−1–102 S × cm−1) [18].

3.3. SEM Analysis

The electrical properties of polymer reinforced with CB can be explained with the shape and the sizes of the CB aggregates that can agglomerate in the polymer matrix [40]. For this reason, the dispersion of CB in the PC matrix was evaluated by means of SEM analysis. Cryo-fractured composites at the different CB loadings are SEM imaged in Figure 4. First of all, the relatively irregular and amorphous nature of the polycarbonates is shown in Figure 4a,b. Afterwards, the morphology of the composites at different CB contents is illustrated in Figure 4c–j. In these images, the CB aggregates blended together (secondary structure) forming spherically shaped or linear agglomerates [40,41], 50–100 nm and 100–500 nm in size are shown for CB content close to 10 wt.%. At higher CB amounts (12–13 wt.% and higher) the linear and 3D branched carbon black assemblies are present. This can be explained with the presence of Van der Waals forces between CB particles, causing branched agglomerates to form. This fact is clearly shown at both magnifications and the major agglomeration degree is depicted in the inset of Figure 4.
The interconnected structure of CB particles indicates that conductive networks are being formed, thus enhancing electrical conductivity. These images are consistent with the observed electrical percolation threshold (Figure 3) and suggest that, at a relatively low filler content, the retention of conductive networks can be obtained.
Some more, the observed void volume (Figure 4d,f,h,j) cannot be explained only with the interstices among the carbon black primary particles. Such free spaces could be the result of a very limited phase separation process coming from the formation of crystallized PC. The PC crystallization, which is usually a remarkably slow process, may be accelerated at the high process temperature and through the presence of CB, as also observed in the presence of carbon fillers (CB, vapor grown carbon fibers, carbon nanotubes, carbon fibers) [2,42]. Finally, the relatively high pressure of the extrusion in conjunction with the high shear stress of the injection molding process could stimulate, to some extent, the formation of a very small degree of crystallinity that under normal process conditions is nearly completely amorphous [43,44]. However, the observed crystallization effect does not result in noticeable changes in the DSC profiles.
Based on the above discussion, the thermal/electrical behavior near the percolation threshold of CB-filled PC composites can be rationalized. Both the amorphous nature of the polymer and the structure of the CB play both a key role in the invariance of the glass transition temperature and in the electrical characteristics (in particular, the electrical percolation threshold position) with the variation of the filler loading. Different from what is observed for semicrystalline polymers, where the filler particles would be ejected from the crystalline regions during crystallization (i.e., cooling) and the matrix resulted to be more localized in the amorphous domains [45], CB is more uniformly dispersed in the matrix of amorphous polymers.
As a result, the compounded polymers become conductive at higher carbon black concentrations compared to their semi-crystalline counterparts, due to the nearly continuous structure of the amorphous polymer domains. In this regard, the electrical percolation threshold is achieved with an abrupt increment of conductivity when a continuous network is obtained (Figure 5).
At the lower filler concentration and depending on the different structure of CB, the aggregates become isolated or agglomerated into segregated macroscopic agglomerates. However, a uniform dispersion of tangled CB aggregates is always desirable, and could be usually observed when the electrical resistivity is gradually reduced and reaches a minimum value during the mixing process. In such conditions the agglomerates become separated into uniformly dispersed aggregates developing a continuous polymer coated surface. This result is generally obtained without exceeding the mixing time, shear stresses, and without using highly viscous melts to avoid excessive breaking of the structure into discrete primary particles with the consequent irreversible increment of the electrical resistivity. On the other hand, even over the percolation threshold, the aggregates form larger networks and the electric conductivity will rise gradually with the filler content.

4. Conclusions

In this work, CB-reinforced high-performance PC composites were melt-compounded with compositions (10–16 wt.% of CB) near or above the electrical percolation threshold. TGA and DSC measurements were performed to determine the phase composition and the Tg characteristics. From the TGA curves, the CB quantities in the polymer matrix of compounds were calculated. Furthermore, the midpoint value of the glass transition temperature (Tg midpoint), selected for evaluating the effect of the CB loading, was not remarkably affected by the addition of carbon black, when compared to neat PC glass transition. The through-plane electrical percolation threshold of CB-filled PC compounds in the 13–14 wt.% of CB was calculated from the insulator-to-conductor transition. However, it should be remarked that the measured electrical conductivity is quite limited and envisages static dissipative applications. The CB “structure” in the PC matrix was evaluated from SEM images, by investigating in detail the shape and size of the carbon black agglomerates. Near the electrical percolation threshold, interconnected CB-based structures indicated that conductive networks had been formed, thus enhancing the electrical conductivity. These composites could find applications in the field of static dissipative polymer materials.

Supplementary Materials

The following are available online at https://www.mdpi.com/article/10.3390/jcs5080212/s1, Supplementary Figure S1: Log-log conductivity plot at 25 °C as a function of the (ффc) and the experimental setup to measure the resistance; Figure S2: Through-plane DC electrical conductivity as a function of temperature for CB-filled melt-compounded PC composites and the experimental setup to measure the resistance versus the temperature.

Author Contributions

B.G.R. performed experiments and characterizations, V.B. and F.C. supervised the experiments, F.C. wrote and organized the manuscript, C.M. and D.S. provided a substantial contribution to the work. All authors have read and agreed to the published version of the manuscript.

Funding

This research received no external funding.

Data Availability Statement

The data presented in this study are available on request from the corresponding author.

Acknowledgments

The research was supported by MIUR (Ministero dell’Istruzione, dell’Università e della Ricerca), and NIS (Nanostructured Interfaces and Surfaces) Interdepartmental Centre of University of Torino. The author thanks M. Monti and M. Zaccone (Proplast, Alessandria—Italy) for the melt-compounding of samples.

Conflicts of Interest

The authors declare no conflict of interest.

References

  1. Bendler, J.T. Handbook of Polycarbonate Science and Technology, 1st ed.; CRC Press: Boca Raton, FL, USA, 2000; Chapters 6–8. [Google Scholar]
  2. Larosa, C.; Patra, N.; Salerno, M.; Mikac, L.; Merijs Meri, R.; Ivanda, M. Preparation and characterization of polycarbonate/multiwalled carbon nanotube nanocomposites. Beilstein J. Nanotechnol. 2017, 8, 2026–2031. [Google Scholar] [CrossRef] [PubMed] [Green Version]
  3. Gilbert, M. (Ed.) Chapter 4—Relation of Structure to Thermal and Mechanical Properties. In Brydson’s Plastics Materials, 8th ed.; Butterworth-Heinemann: Oxford, UK, 2017; pp. 59–73. [Google Scholar]
  4. Sain, P.K.; Goyal, R.K.; Bhargava, A.K.; Prasad, Y.V.S.S. Thermal and electronic behaviour of polycarbonate–copper nanocomposite system. J. Phys. D Appl. Phys. 2013, 46, 455501. [Google Scholar] [CrossRef]
  5. Yoon, S.-H.; Jung, H.-T. Grafting polycarbonate onto graphene nanosheets: Synthesis and characterization of high performance polycarbonate–graphene nanocomposites for ESD/EMI applications. RSC Adv. 2017, 7, 45902–45910. [Google Scholar] [CrossRef] [Green Version]
  6. Müller, M.T.; Hilarius, K.; Liebscher, M.; Lellinger, D.; Alig, I.; Pötschke, P. Effect of Graphite Nanoplate Morphology on the Dispersion and Physical Properties of Polycarbonate Based Composites. Mater. Chem. Phys. 2017, 10, 545. [Google Scholar] [CrossRef] [Green Version]
  7. Cesano, F.; Uddin, M.J.; Damin, A.; Scarano, D. Multifuctional Conductive Paths Obtained by Laser Processing of Non-Conductive Carbon Nanotube/Polypropylene Composites. Nanomaterials 2021, 11, 604. [Google Scholar] [CrossRef] [PubMed]
  8. Cesano, F.; Rattalino, I.; Bardelli, F.; Sanginario, A.; Gianturco, A.; Veca, A.; Viazzi, C.; Castelli, P.; Scarano, D.; Zecchina, A. Structure and properties of metal-free conductive tracks on polyethylene/multiwalled carbon nanotube composites as obtained by laser stimulated percolation. Carbon 2013, 61, 63–71. [Google Scholar] [CrossRef]
  9. Cesano, F.; Zaccone, M.; Armentano, I.; Cravanzola, S.; Muscuso, L.; Torre, L.; Kenny, J.M.; Monti, M.; Scarano, D. Relationship between morphology and electrical properties in PP/MWCNT composites: Processing-induced anisotropic percolation threshold. Mater. Chem. Phys. 2016, 180, 284–290. [Google Scholar] [CrossRef]
  10. De Meo, E.; Agnelli, S.; Veca, A.; Brunella, V.; Zanetti, M. Piezoresistive and mechanical Behavior of CNT based polyurethane foam. J. Compos. Sci. 2020, 4, 131. [Google Scholar] [CrossRef]
  11. Hilarius, K.; Lellinger, D.; Alig, I.; Villmow, T.; Pegel, S.; Pötschke, P. Influence of shear deformation on the electrical and rheological properties of combined filler networks in polymer melts: Carbon nanotubes and carbon black in polycarbonate. Polymer 2013, 54, 5865–5874. [Google Scholar] [CrossRef]
  12. Chen, L.; Pang, X.-J.; Yu, Z.-L. Study on polycarbonate/multi-walled carbon nanotubes composite produced by melt processing. Mater. Sci. Eng. A 2007, 457, 287–291. [Google Scholar] [CrossRef]
  13. Mohd Radzuan, N.A.; Sulong, A.B.; Sahari, J. A review of electrical conductivity models for conductive polymer composite. Int. J. Hydrogen Energy 2017, 42, 9262–9273. [Google Scholar] [CrossRef]
  14. Haznedar, G.; Cravanzola, S.; Zanetti, M.; Scarano, D.; Zecchina, A.; Cesano, F. Graphite nanoplatelets and carbon nanotubes based polyethylene composites: Electrical conductivity and morphology. Mater. Chem. Phys. 2013, 143, 47–52. [Google Scholar] [CrossRef]
  15. Cesano, F.; Scarano, D. Dispersion of carbon-based materials (CNTs, Graphene) in polymer matrices. In Carbon for Sensing Devices; Demarchi, D., Tagliaferro, A., Eds.; Springer International Publishing: Cham, Switzerland, 2015; pp. 43–75. [Google Scholar]
  16. Ozkan, C.; Gamze Karsli, N.; Aytac, A.; Deniz, V. Short carbon fiber reinforced polycarbonate composites: Effects of different sizing materials. Compos. Part. B Eng. 2014, 62, 230–235. [Google Scholar] [CrossRef]
  17. Via, M.D.; King, J.A.; Keith, J.M.; Bogucki, G.R. Electrical conductivity modeling of carbon black/polycarbonate, carbon nanotube/polycarbonate, and exfoliated graphite nanoplatelet/polycarbonate composites. J. Appl. Polym. Sci. 2012, 124, 182–189. [Google Scholar] [CrossRef]
  18. Spahr, M.E.; Gilardi, R.; Bonacchi, D. Carbon Black for Electrically Conductive Polymer Applications. In Fillers for Polymer Applications; Rothon, R., Ed.; Polymers and Polymeric Composites: A Reference Series; Springer: Cham, Switzerland, 2017; pp. 375–400. [Google Scholar]
  19. Robertson, C.G.; Hardman, N.J. Nature of Carbon Black Reinforcement of Rubber: Perspective on the Original Polymer Nanocomposite. Polymers 2021, 13, 538. [Google Scholar] [CrossRef] [PubMed]
  20. Braga, N.F.; LaChance, A.M.; Liu, B.; Sun, L.; Passador, F.R. Influence of compatibilizer and carbon nanotubes on mechanical, electrical, and barrier properties of PTT/ABS blends. Adv. Ind. Eng. Polym. Res. 2019, 2, 121–125. [Google Scholar] [CrossRef]
  21. Cesano, F.; Uddin, M.J.; Lozano, K.; Zanetti, M.; Scarano, D. All-Carbon Conductors for Electronic and Electrical Wiring Applications. Front. Mater. 2020, 7, 219. [Google Scholar] [CrossRef]
  22. Feng, J.; Chan, C.-m.; Li, J.-x. A method to control the dispersion of carbon black in an immiscible polymer blend. Polym. Eng. Sci. 2003, 43, 1058–1063. [Google Scholar] [CrossRef]
  23. Gubbels, F.; Blacher, S.; Vanlathem, E.; Jerome, R.; Deltour, R.; Brouers, F.; Teyssie, P. Design of Electrical Composites: Determining the Role of the Morphology on the Electrical Properties of Carbon Black Filled Polymer Blends. Macromolecules 1995, 28, 1559–1566. [Google Scholar] [CrossRef]
  24. Gubbels, F.; Jerome, R.; Teyssie, P.; Vanlathem, E.; Deltour, R.; Calderone, A.; Parente, V.; Bredas, J.L. Selective Localization of Carbon Black in Immiscible Polymer Blends: A Useful Tool To Design Electrical Conductive Composites. Macromolecules 1994, 27, 1972–1974. [Google Scholar] [CrossRef]
  25. Wang, L.; Qiu, J.; Sakai, E.; Wei, X. Effects of multiwalled carbon nanotube mass fraction on microstructures and electrical resistivity of polycarbonate-based conductive composites. Sci. Eng. Compos. Mater. 2017, 24, 163–175. [Google Scholar] [CrossRef]
  26. Pötschke, P.; Arnaldo, M.H.; Radusch, H. Percolation behavior and mehanical properties of polycarbonate composites filled with carbon black/carbon nanotube systems. Polimery 2012, 57, 204–211. [Google Scholar] [CrossRef]
  27. Strugova, D.; Ferreira Junior, J.C.; David, É.; Demarquette, N.R. Ultra-Low Percolation Threshold Induced by Thermal Treatments in Co-Continuous Blend-Based PP/PS/MWCNTs Nanocomposites. Nanomaterials 2021, 11, 1620. [Google Scholar] [CrossRef] [PubMed]
  28. Zaccone, M.; Armentano, I.; Cesano, F.; Scarano, D.; Frache, A.; Torre, L.; Monti, M. Effect of Injection Molding Conditions on Crystalline Structure and Electrical Resistivity of PP/MWCNT Nanocomposites. Polymers 2020, 12, 1685. [Google Scholar] [CrossRef] [PubMed]
  29. Maiti, S.; Suin, S.; Shrivastava, N.K.; Khatua, B.B. Low percolation threshold in polycarbonate/multiwalled carbon nanotubes nanocomposites through melt blending with poly(butylene terephthalate). J. Appl. Polym. Sci. 2013, 130, 543–553. [Google Scholar] [CrossRef]
  30. Shrivastava, N.K.; Suin, S.; Maiti, S.; Khatua, B.B. An approach to reduce the percolation threshold of MWCNT in ABS/MWCNT nanocomposites through selective distribution of CNT in ABS matrix. RSC Adv. 2014, 4, 24584–24593. [Google Scholar] [CrossRef]
  31. ASTM D2414-19. Standard Test Method for Carbon Black—Oil Absorption Number (OAN); ASTM International: West Conshohocken, PA, USA, 2019. [Google Scholar]
  32. Huang, J.-C. Carbon black filled conducting polymers and polymer blends. Adv. Polym. Technol. 2002, 21, 299–313. [Google Scholar] [CrossRef]
  33. Balberg, I. A comprehensive picture of the electrical phenomena in carbon black–polymer composites. Carbon 2002, 40, 139–143. [Google Scholar] [CrossRef]
  34. Billingham, N. Physical phenomena in the oxidation and stabilisation of polymers. In Oxidation Inhibition in Organic Materials; Klemchuk, P., Pospisil, J., Eds.; CRC Press: Boca Raton, FL, USA, 1990; pp. 249–298. [Google Scholar]
  35. Antonakou, E.V.; Kalogiannis, K.G.; Stefanidis, S.D.; Karakoulia, S.A.; Triantafyllidis, K.S.; Lappas, A.A.; Achilias, D.S. Catalytic and thermal pyrolysis of polycarbonate in a fixed-bed reactor: The effect of catalysts on products yields and composition. Polym. Degrad. Stab. 2014, 110, 482–491. [Google Scholar] [CrossRef]
  36. Jang, B.N.; Wilkie, C.A. A TGA/FTIR and mass spectral study on the thermal degradation of bisphenol A polycarbonate. Polym. Degrad. Stab. 2004, 86, 419–430. [Google Scholar] [CrossRef] [Green Version]
  37. Molaire, M.F. Static Dissipative Polymeric Composition having Controlled Conductivity. U.S. Patent 8,246,862, 21 August 2012. [Google Scholar]
  38. Bauhofer, W.; Kovacs, J.Z. A review and analysis of electrical percolation in carbon nanotube polymer composites. Compos. Sci. Technol. 2009, 69, 1486–1498. [Google Scholar] [CrossRef]
  39. Zhang, J.; Zhang, S.; Feng, S.; Jiang, Z. The correlativity of positive temperature coefficient effects in conductive silicone rubber. Polym. Int. 2005, 54, 1175–1179. [Google Scholar] [CrossRef]
  40. Fernandez Martinez, R.; Iturrondobeitia, M.; Ibarretxe, J.; Guraya, T. Methodology to classify the shape of reinforcement fillers: Optimization, evaluation, comparison, and selection of models. J. Mater. Sci. 2017, 52, 569–580. [Google Scholar] [CrossRef]
  41. Nichols, G.; Byard, S.; Bloxham, M.J.; Botterill, J.; Dawson, N.J.; Dennis, A.; Diart, V.; North, N.C.; Sherwood, J.D. A review of the terms agglomerate and aggregate with a recommendation for nomenclature used in powder and particle characterization. J. Pharm. Sci. 2002, 91, 2103–2109. [Google Scholar] [CrossRef]
  42. Takahashi, T.; Higuchi, A.; Awano, H.; Yonetake, K.; Kikuchi, T. Oriented Crystallization of Polycarbonate by Vapor Grown Carbon Fiber and its Application. Polym. J. 2005, 37, 887–893. [Google Scholar] [CrossRef] [Green Version]
  43. Djurner, K.; Mȧnson, J.-A.; Rigdahl, M. Crystallization of polycarbonate during injection molding at high pressures. J. Polym. Sci. Polym. Lett. Ed. 1978, 16, 419–424. [Google Scholar] [CrossRef]
  44. Zhang, X.-X.; Yang, S.-G.; Zhong, G.-J.; Lei, J.; Liu, D.; Sun, G.-A.; Xu, J.-Z.; Li, Z.-M. Rapid Melt Crystallization of Bisphenol-A Polycarbonate Jointly Induced by Pressure and Flow. Macromolecules 2021, 54, 2383–2393. [Google Scholar] [CrossRef]
  45. Qu, Y.; Dai, K.; Zhao, J.; Zheng, G.; Liu, C.; Chen, J.; Shen, C. The strain-sensing behaviors of carbon black/polypropylene and carbon nanotubes/polypropylene conductive composites prepared by the vacuum-assisted hot compression. Colloid Polym. Sci. 2014, 292, 945–951. [Google Scholar] [CrossRef]
Figure 1. TGA curves of neat PC (gray dotted curve) and of PC + CB 16 wt.% (black line) during the thermal treatment in N2 (from room temperature to 700 °C) and in air (from 700 to 850 °C). The weight derivative of PC is also shown (blue curve) together with its deconvolution into three separated signals.
Jcs 05 00212 g001
Figure 2. DSC profile of PC + CB-16 in heat-cool-heat cycle analysis. In the inset: 1st and 2nd heating runs are shown in the 130–160 °C temperature range and midpoint Tg is determined in the last run.
Jcs 05 00212 g002
Figure 3. Room temperature conductivity as a function of the CB loading in CB-filled melt-compounded PC composites.
Jcs 05 00212 g003
Figure 4. SEM images of PC and CB-filled PC cryo-fractured surfaces at the different CB content: (a,b) 0%, (c,d) 10 wt.%, (e,f) 13 wt.%, (g,h) 14 wt.% and (i,j) 15 wt.%, respectively. In the inset of (h,j), the CB agglomeration in the polymer matrix is illustrated.
Jcs 05 00212 g004
Figure 5. Representation scheme of the CB dispersion effect in PC on the electrical conductivity properties. Lower structured CB grades contain a high weight fraction of spheroidal, ellipsoidal, and linear aggregates. With an increase in the carbon black structure, the fraction of branched aggregates increases.
Jcs 05 00212 g005
Table 1. Composition and Tg midpoint, as obtained from TGA and DSC measurements.
Sample NameCB Content 1
(wt.%)
Tg Midpoint 2
(°C)
PC0149.2
PC + CB-1010149.9
PC + CB-1313148.1
PC + CB-1414149.1
PC + CB-1616149.3
1 obtained from TGA measurements, 2 obtained from the second heating of the DSC run.
Publisher’s Note: MDPI stays neutral with regard to jurisdictional claims in published maps and institutional affiliations.

