
Mechanical and FEA-Assisted Characterization of 3D Printed Continuous Glass Fiber Reinforced Nylon Cellular Structures


 , and
, and 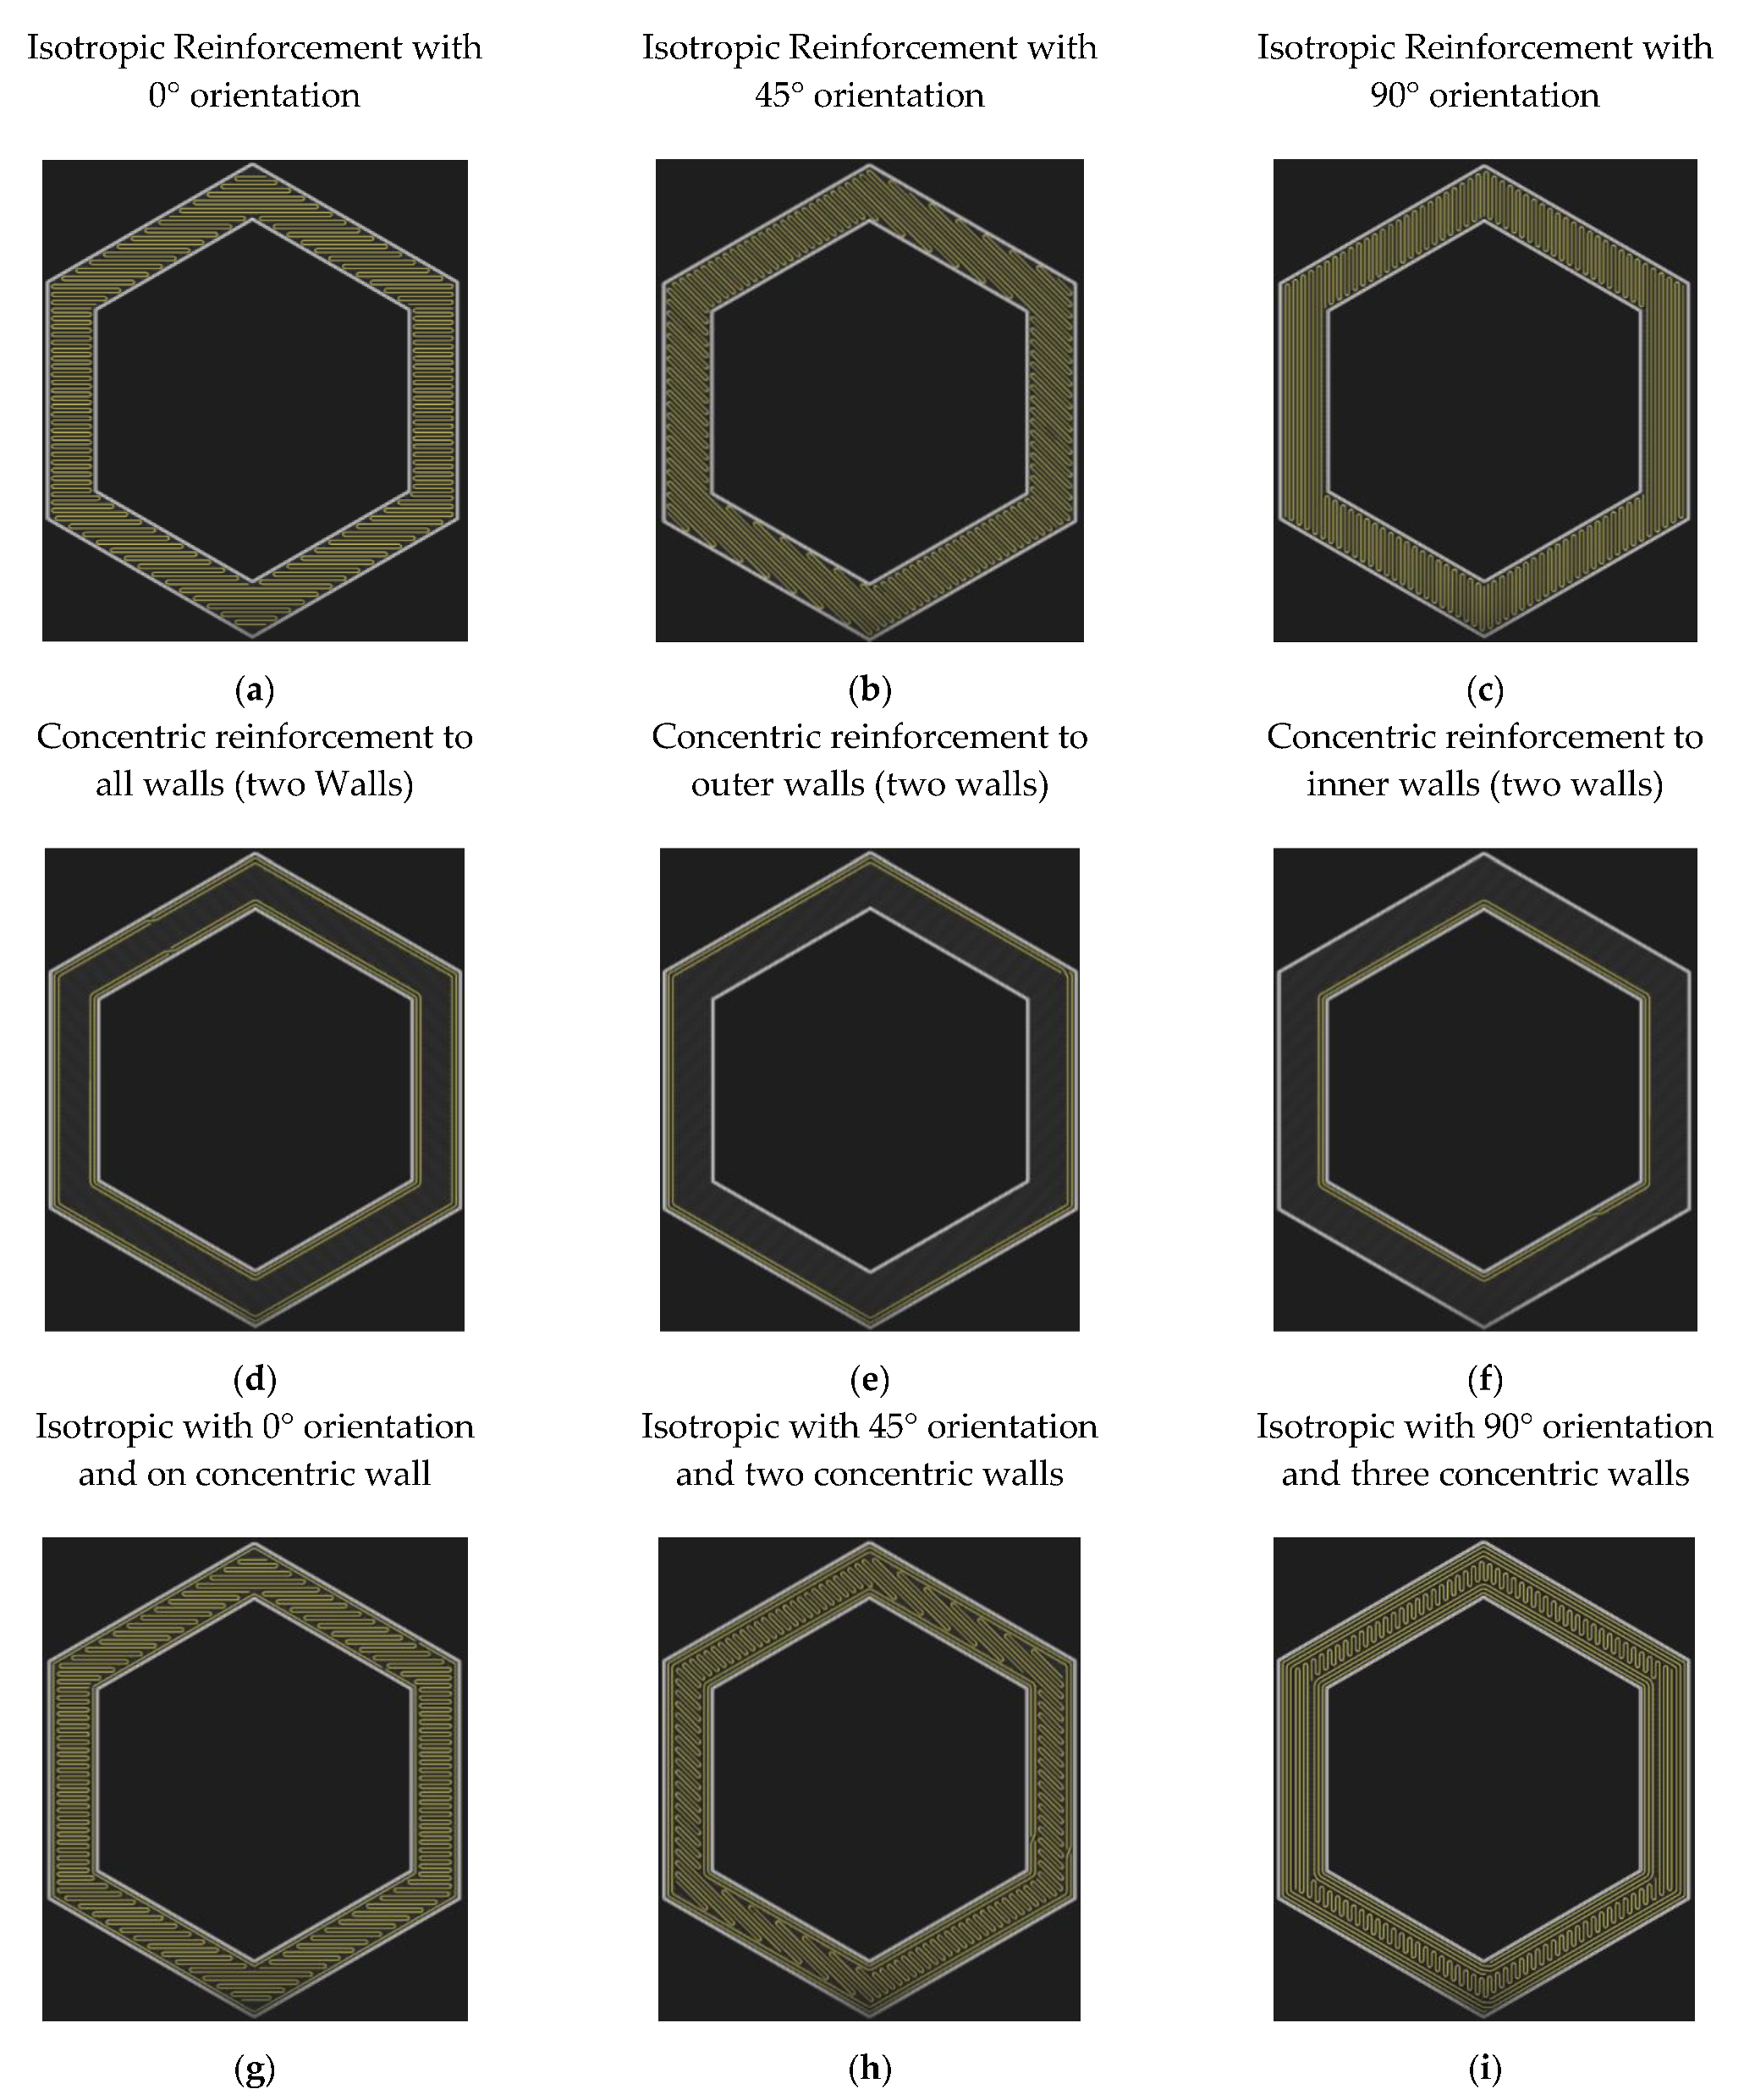
Abstract
:1. Introduction
2. Materials and Methods
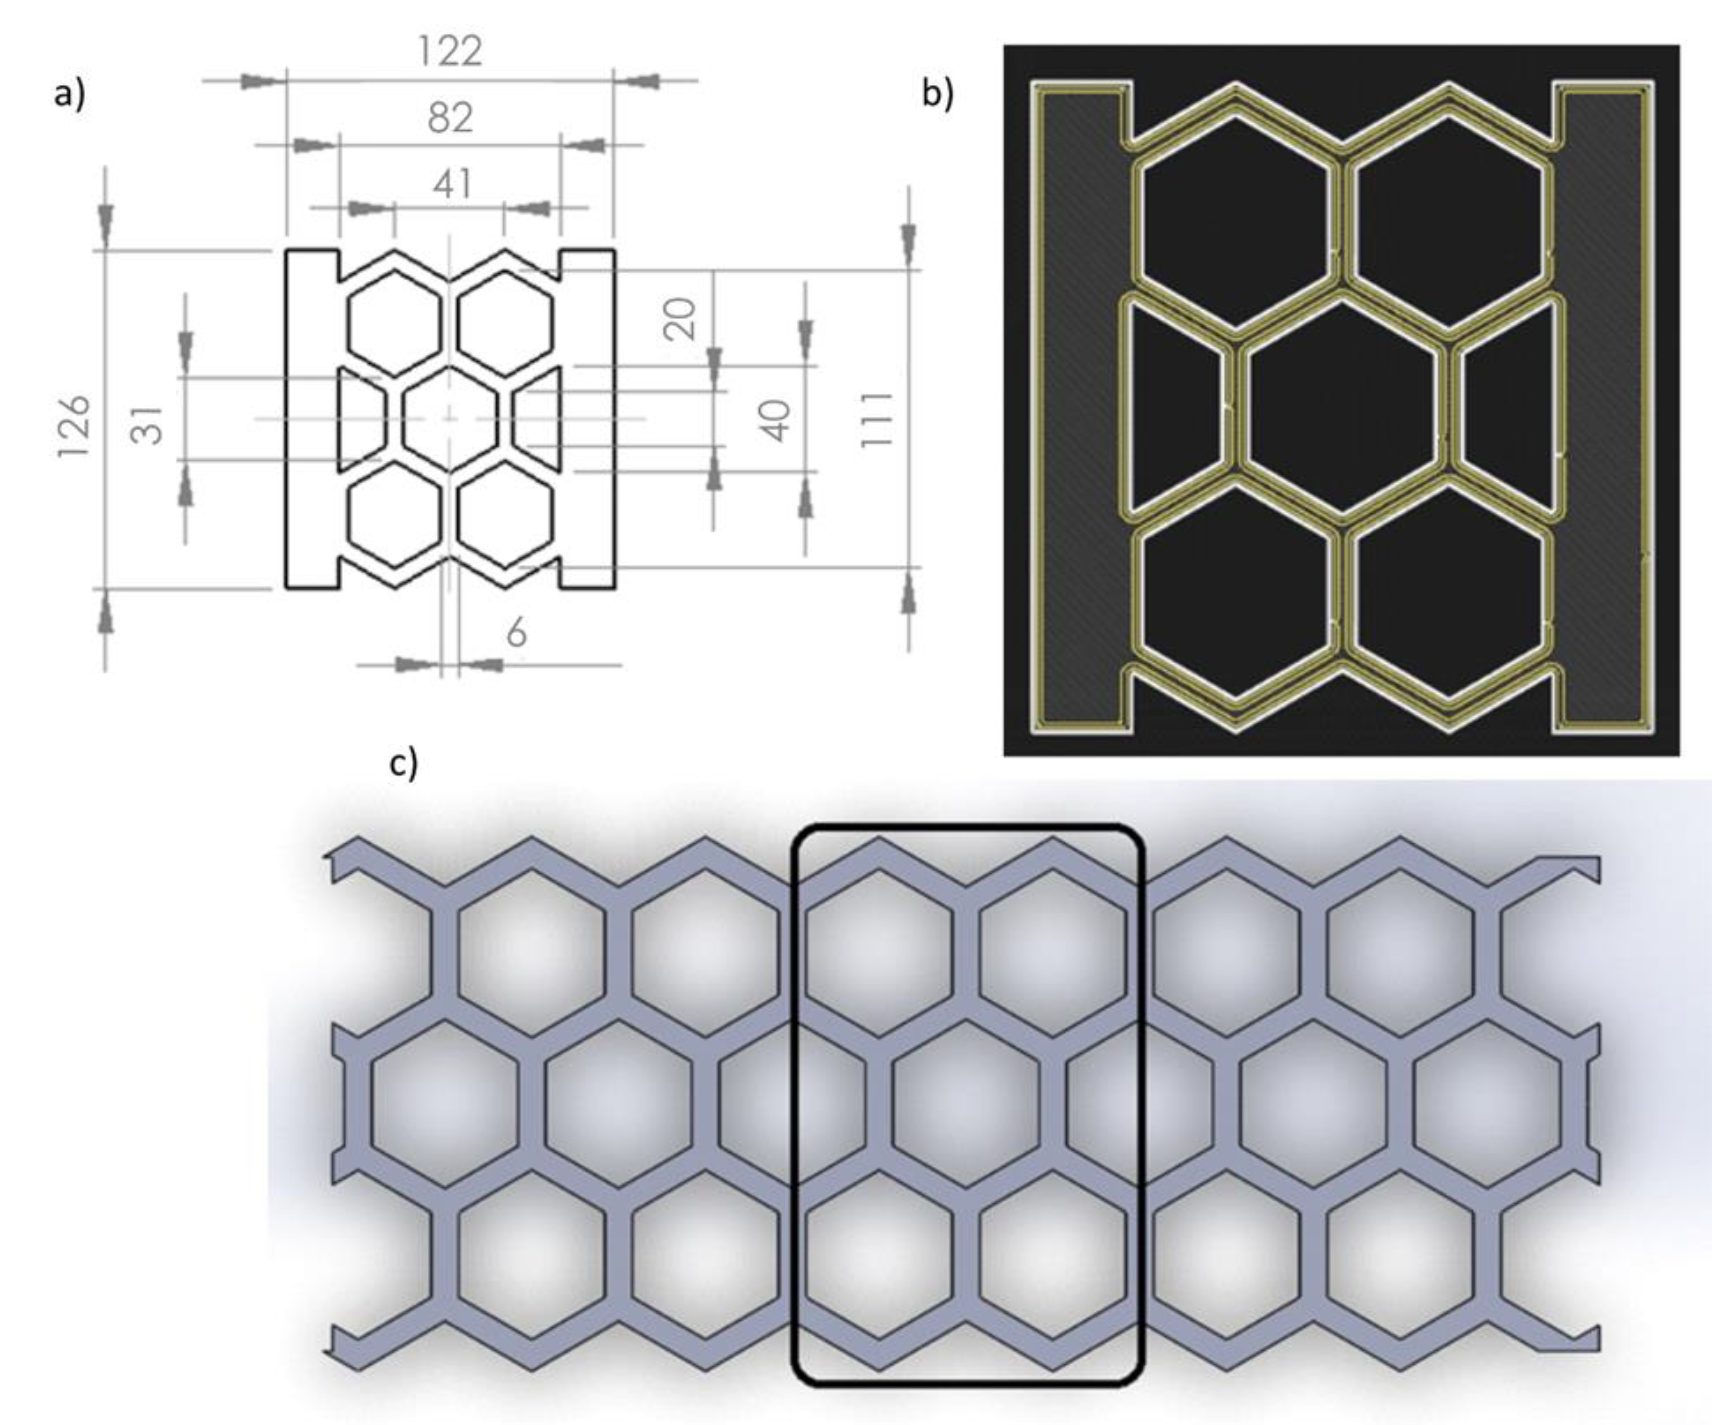
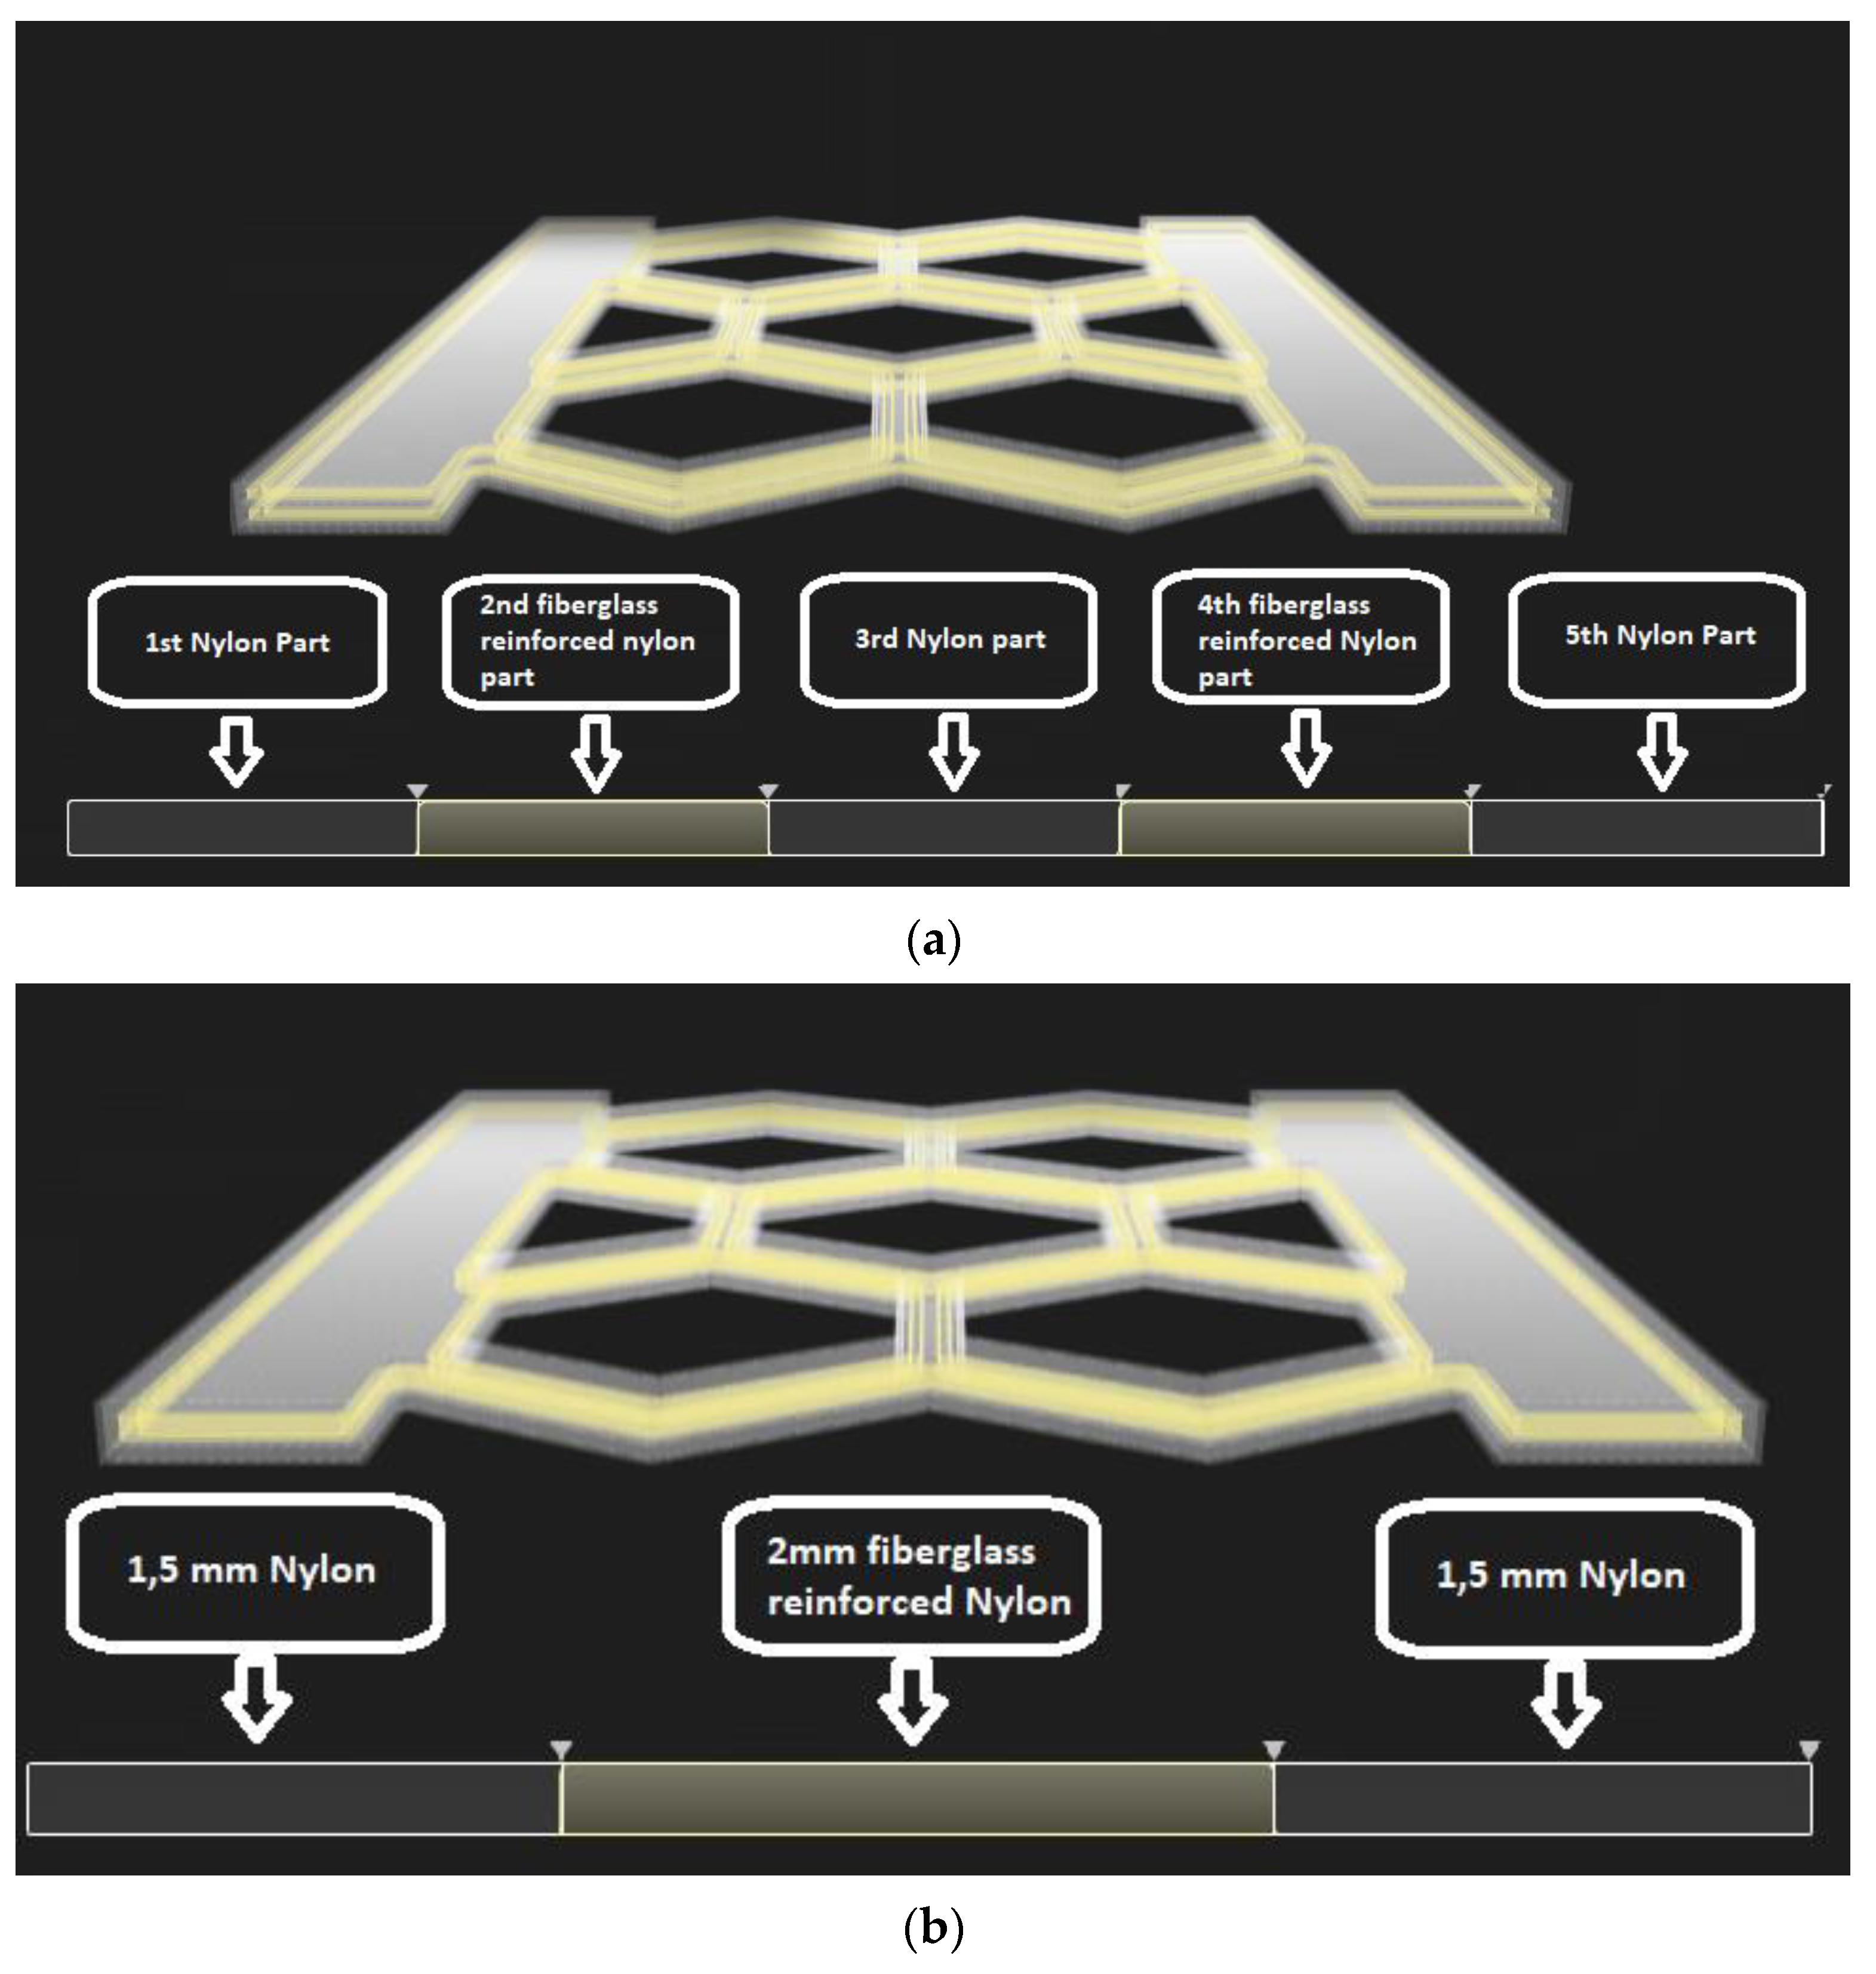
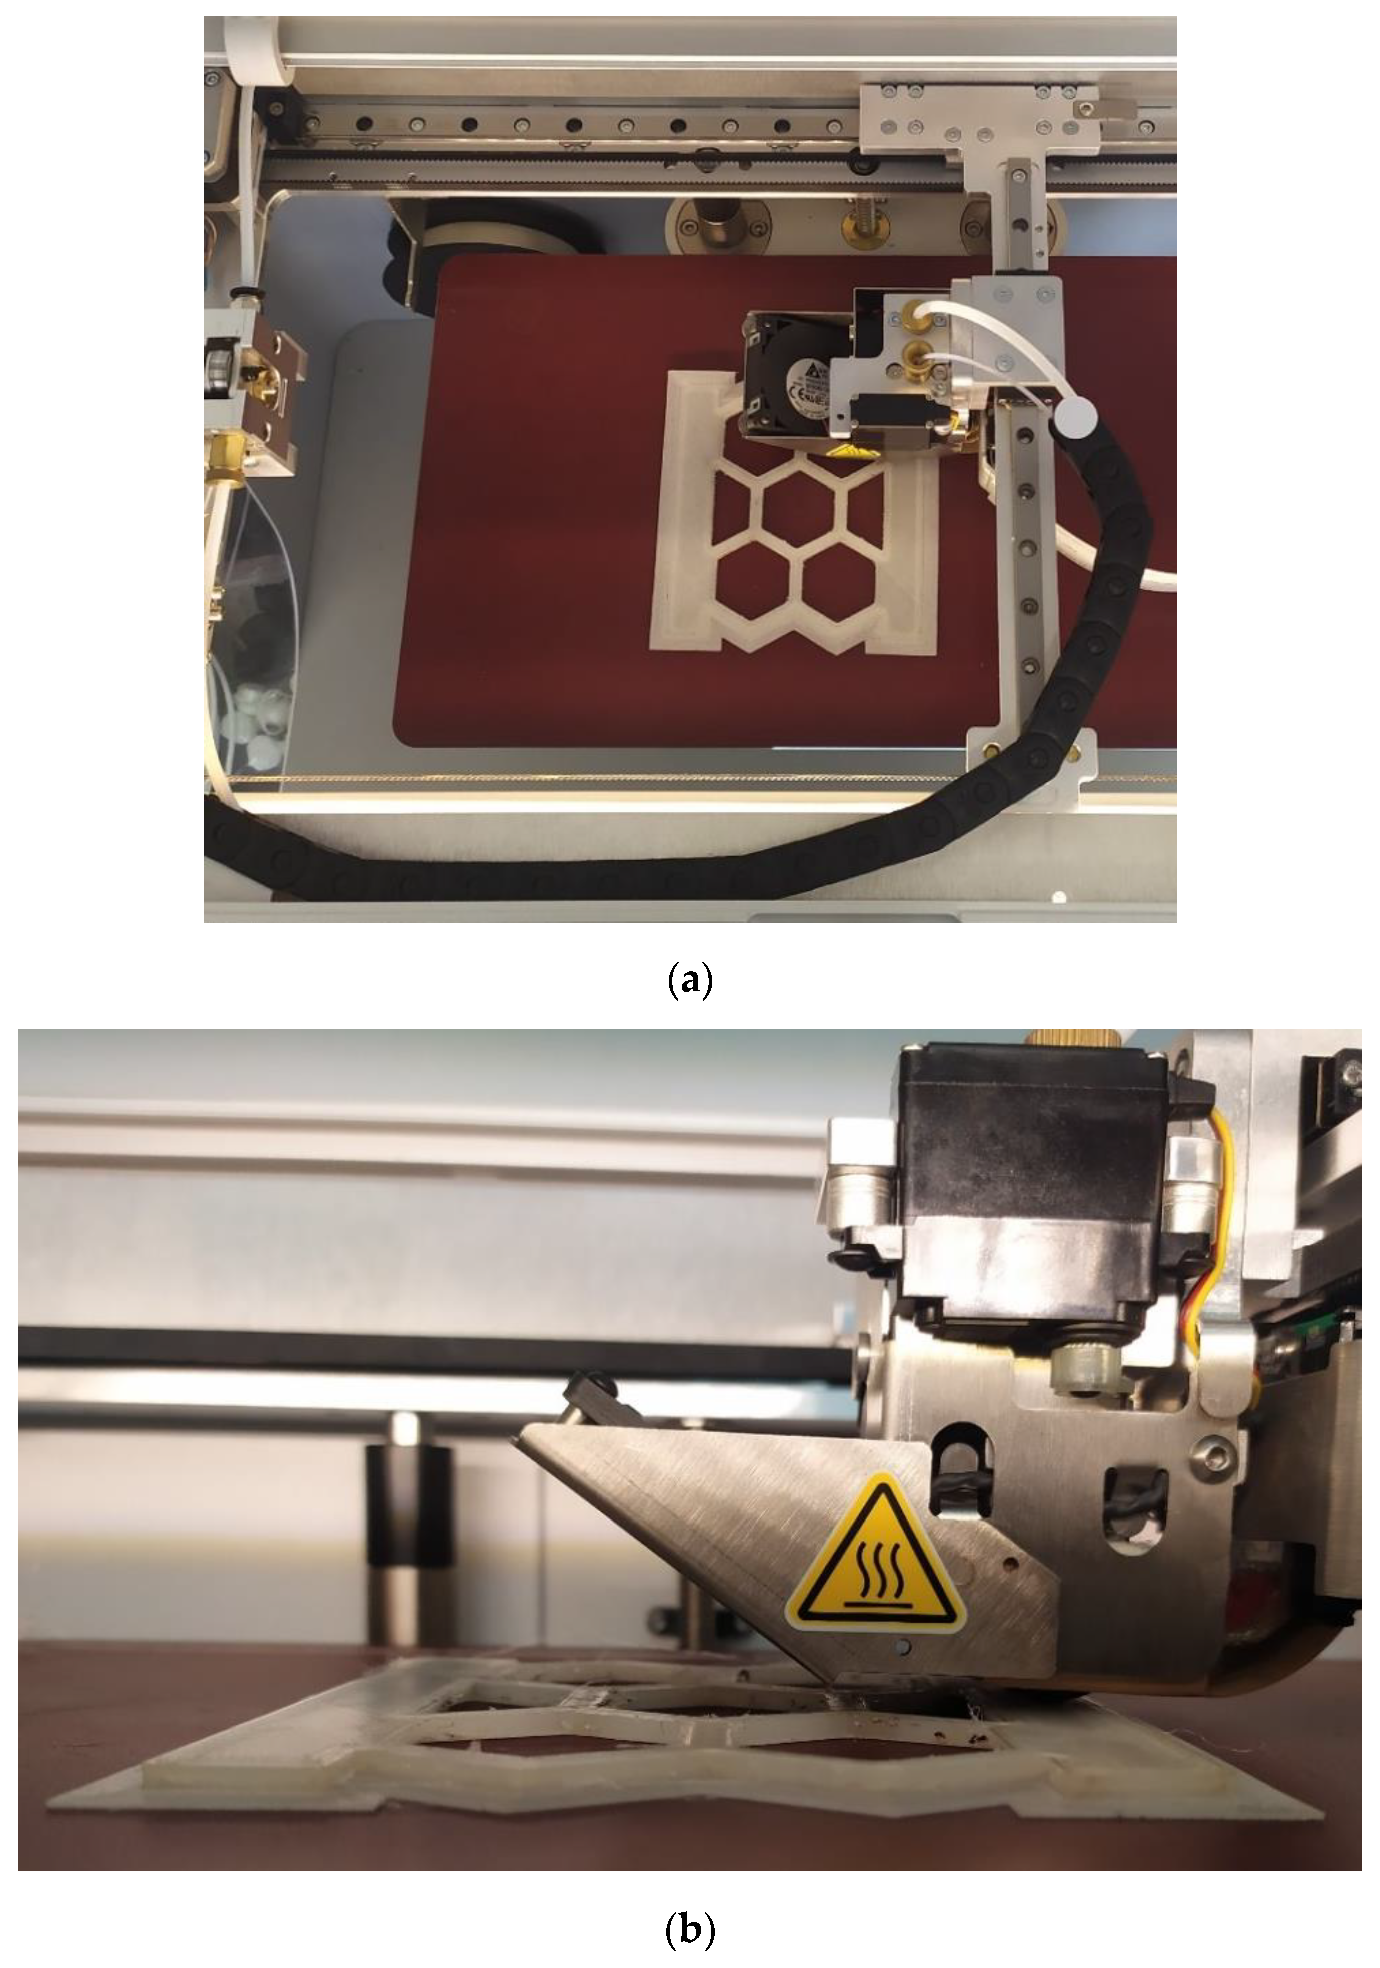
2.1. Manufacturing Process Using Continuous Fiber Fabrication
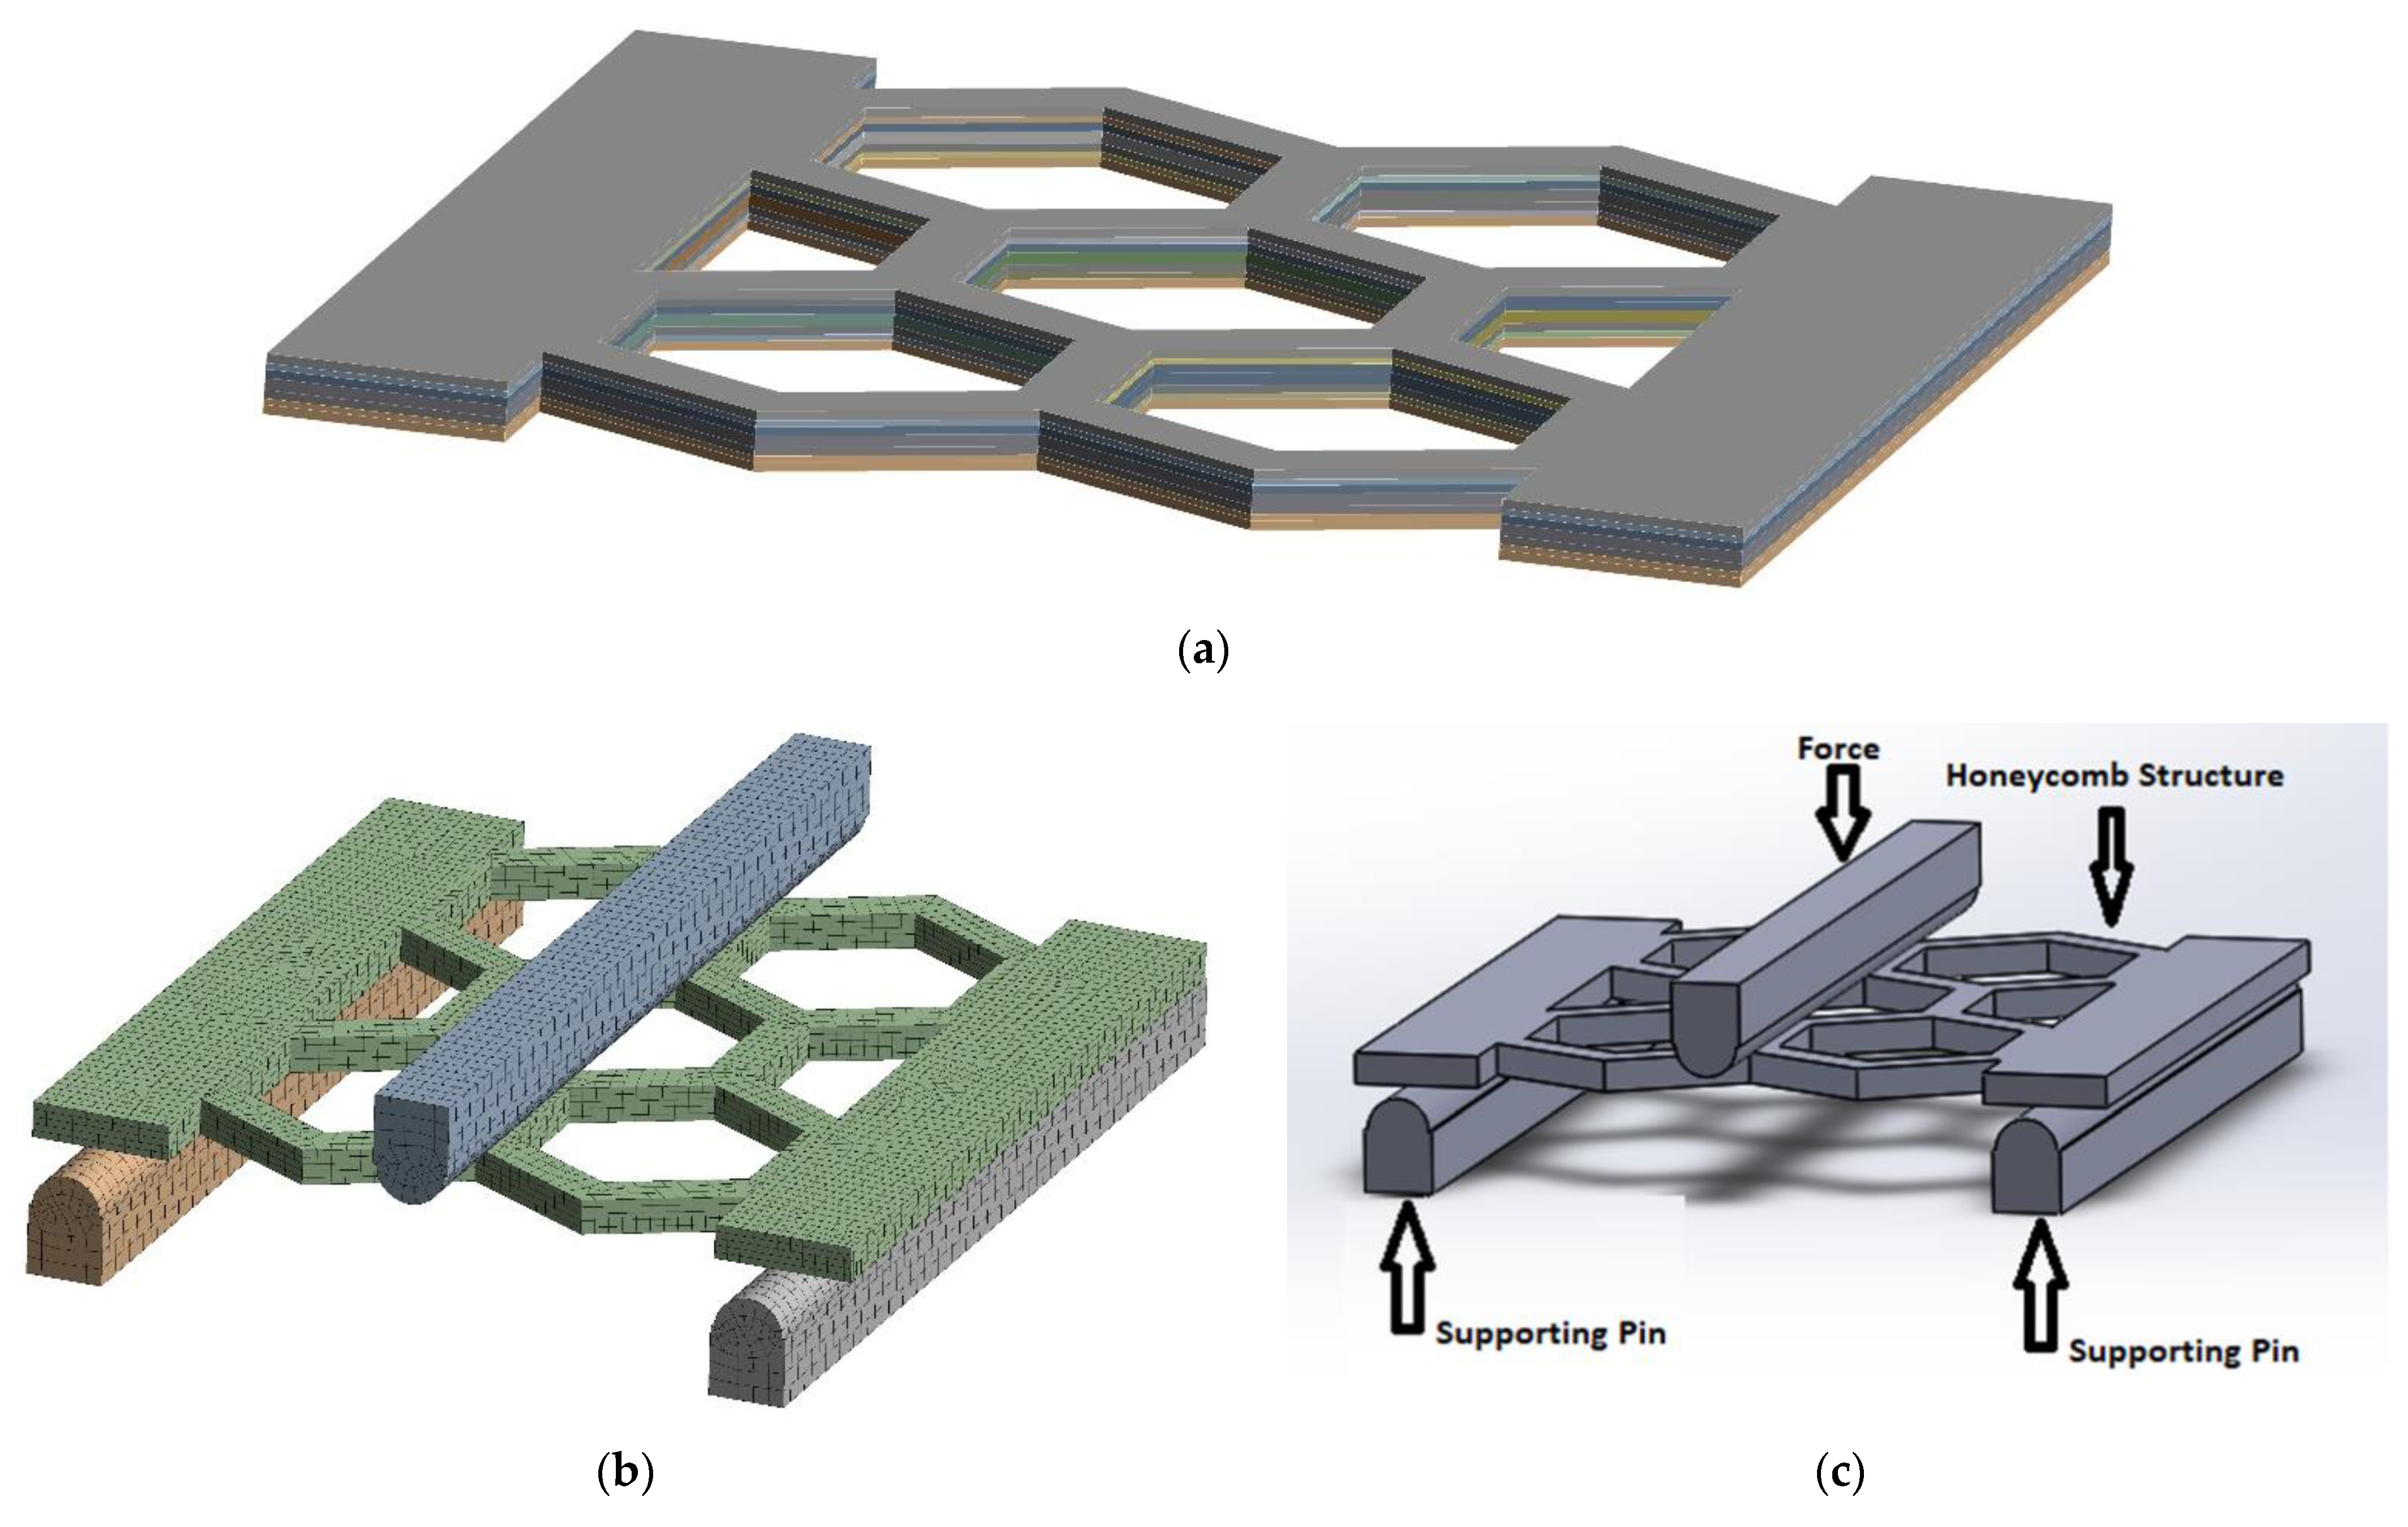
2.2. FEM of Continuous Fiber-Reinforced Cellular Structures
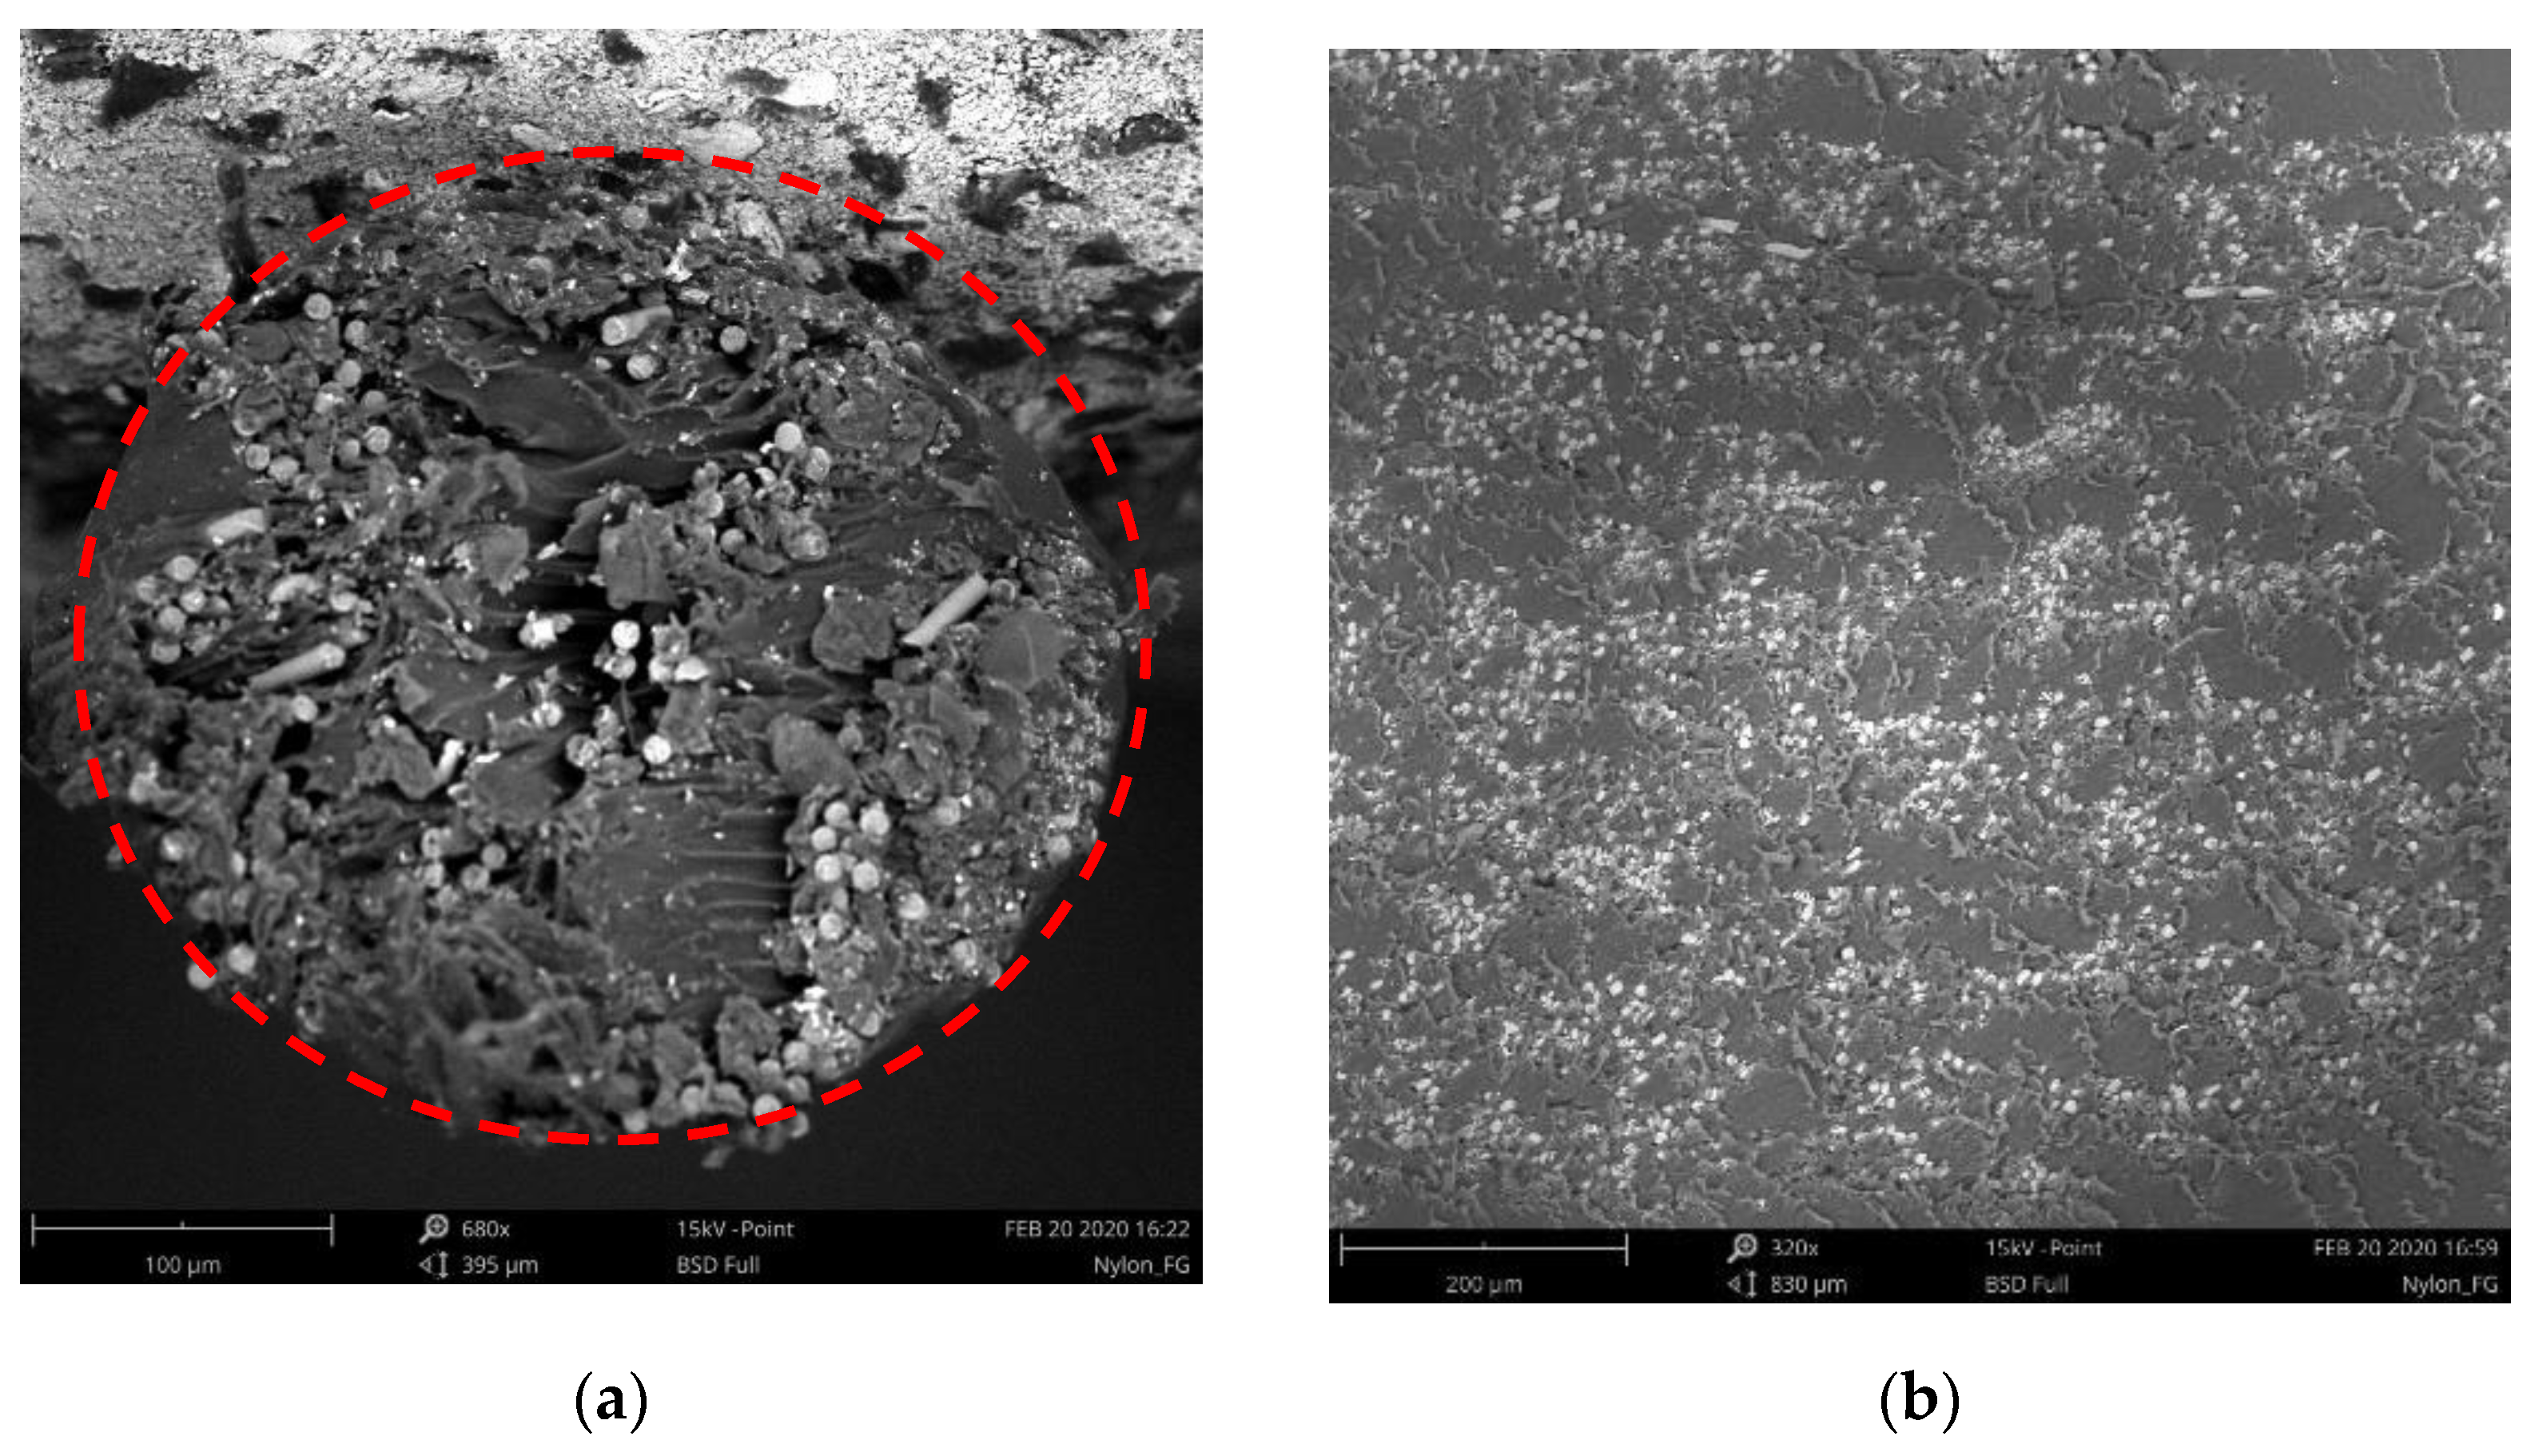
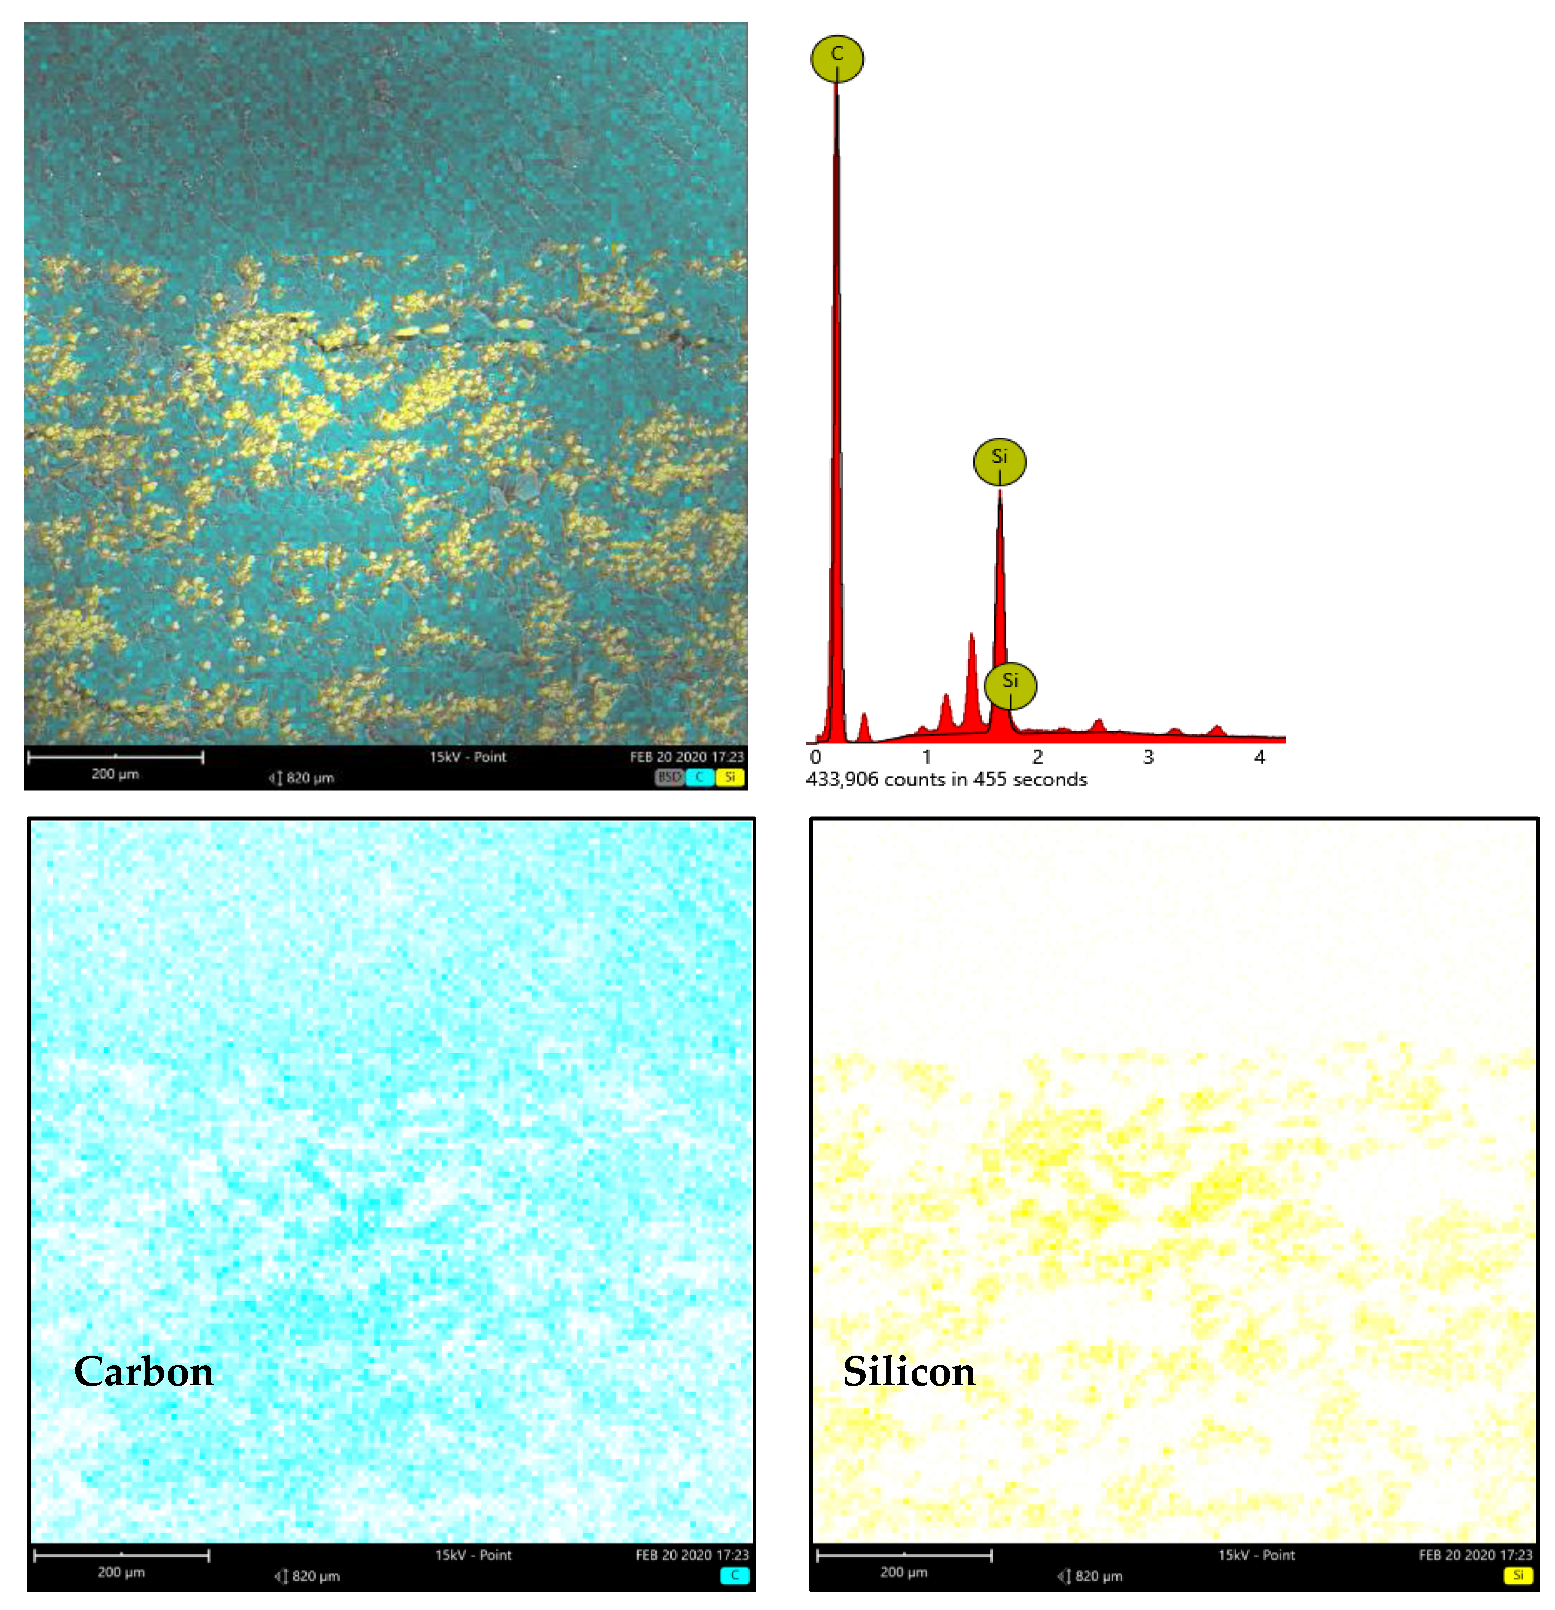
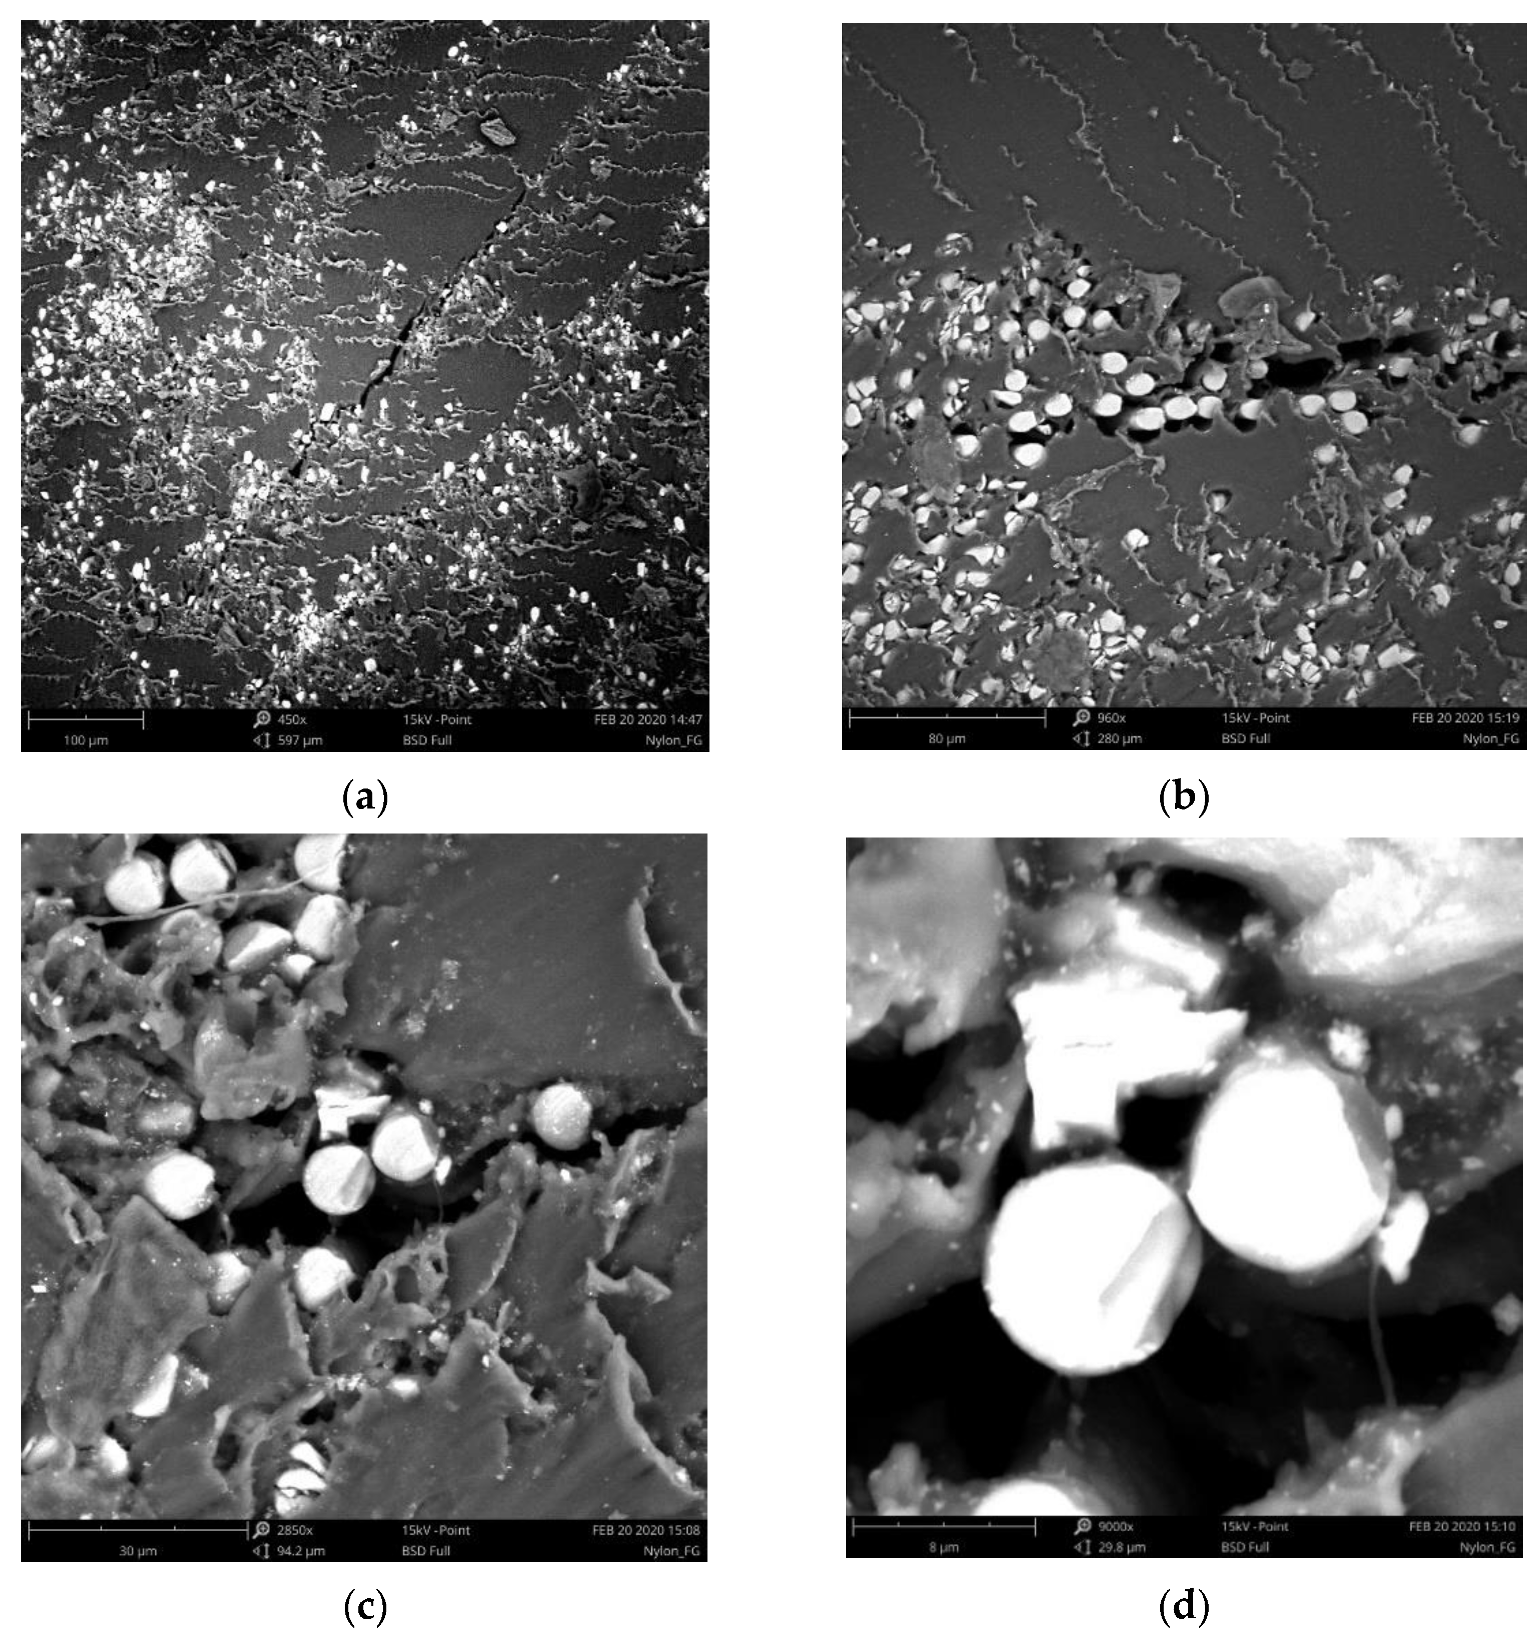
2.3. Microstructure Analysis
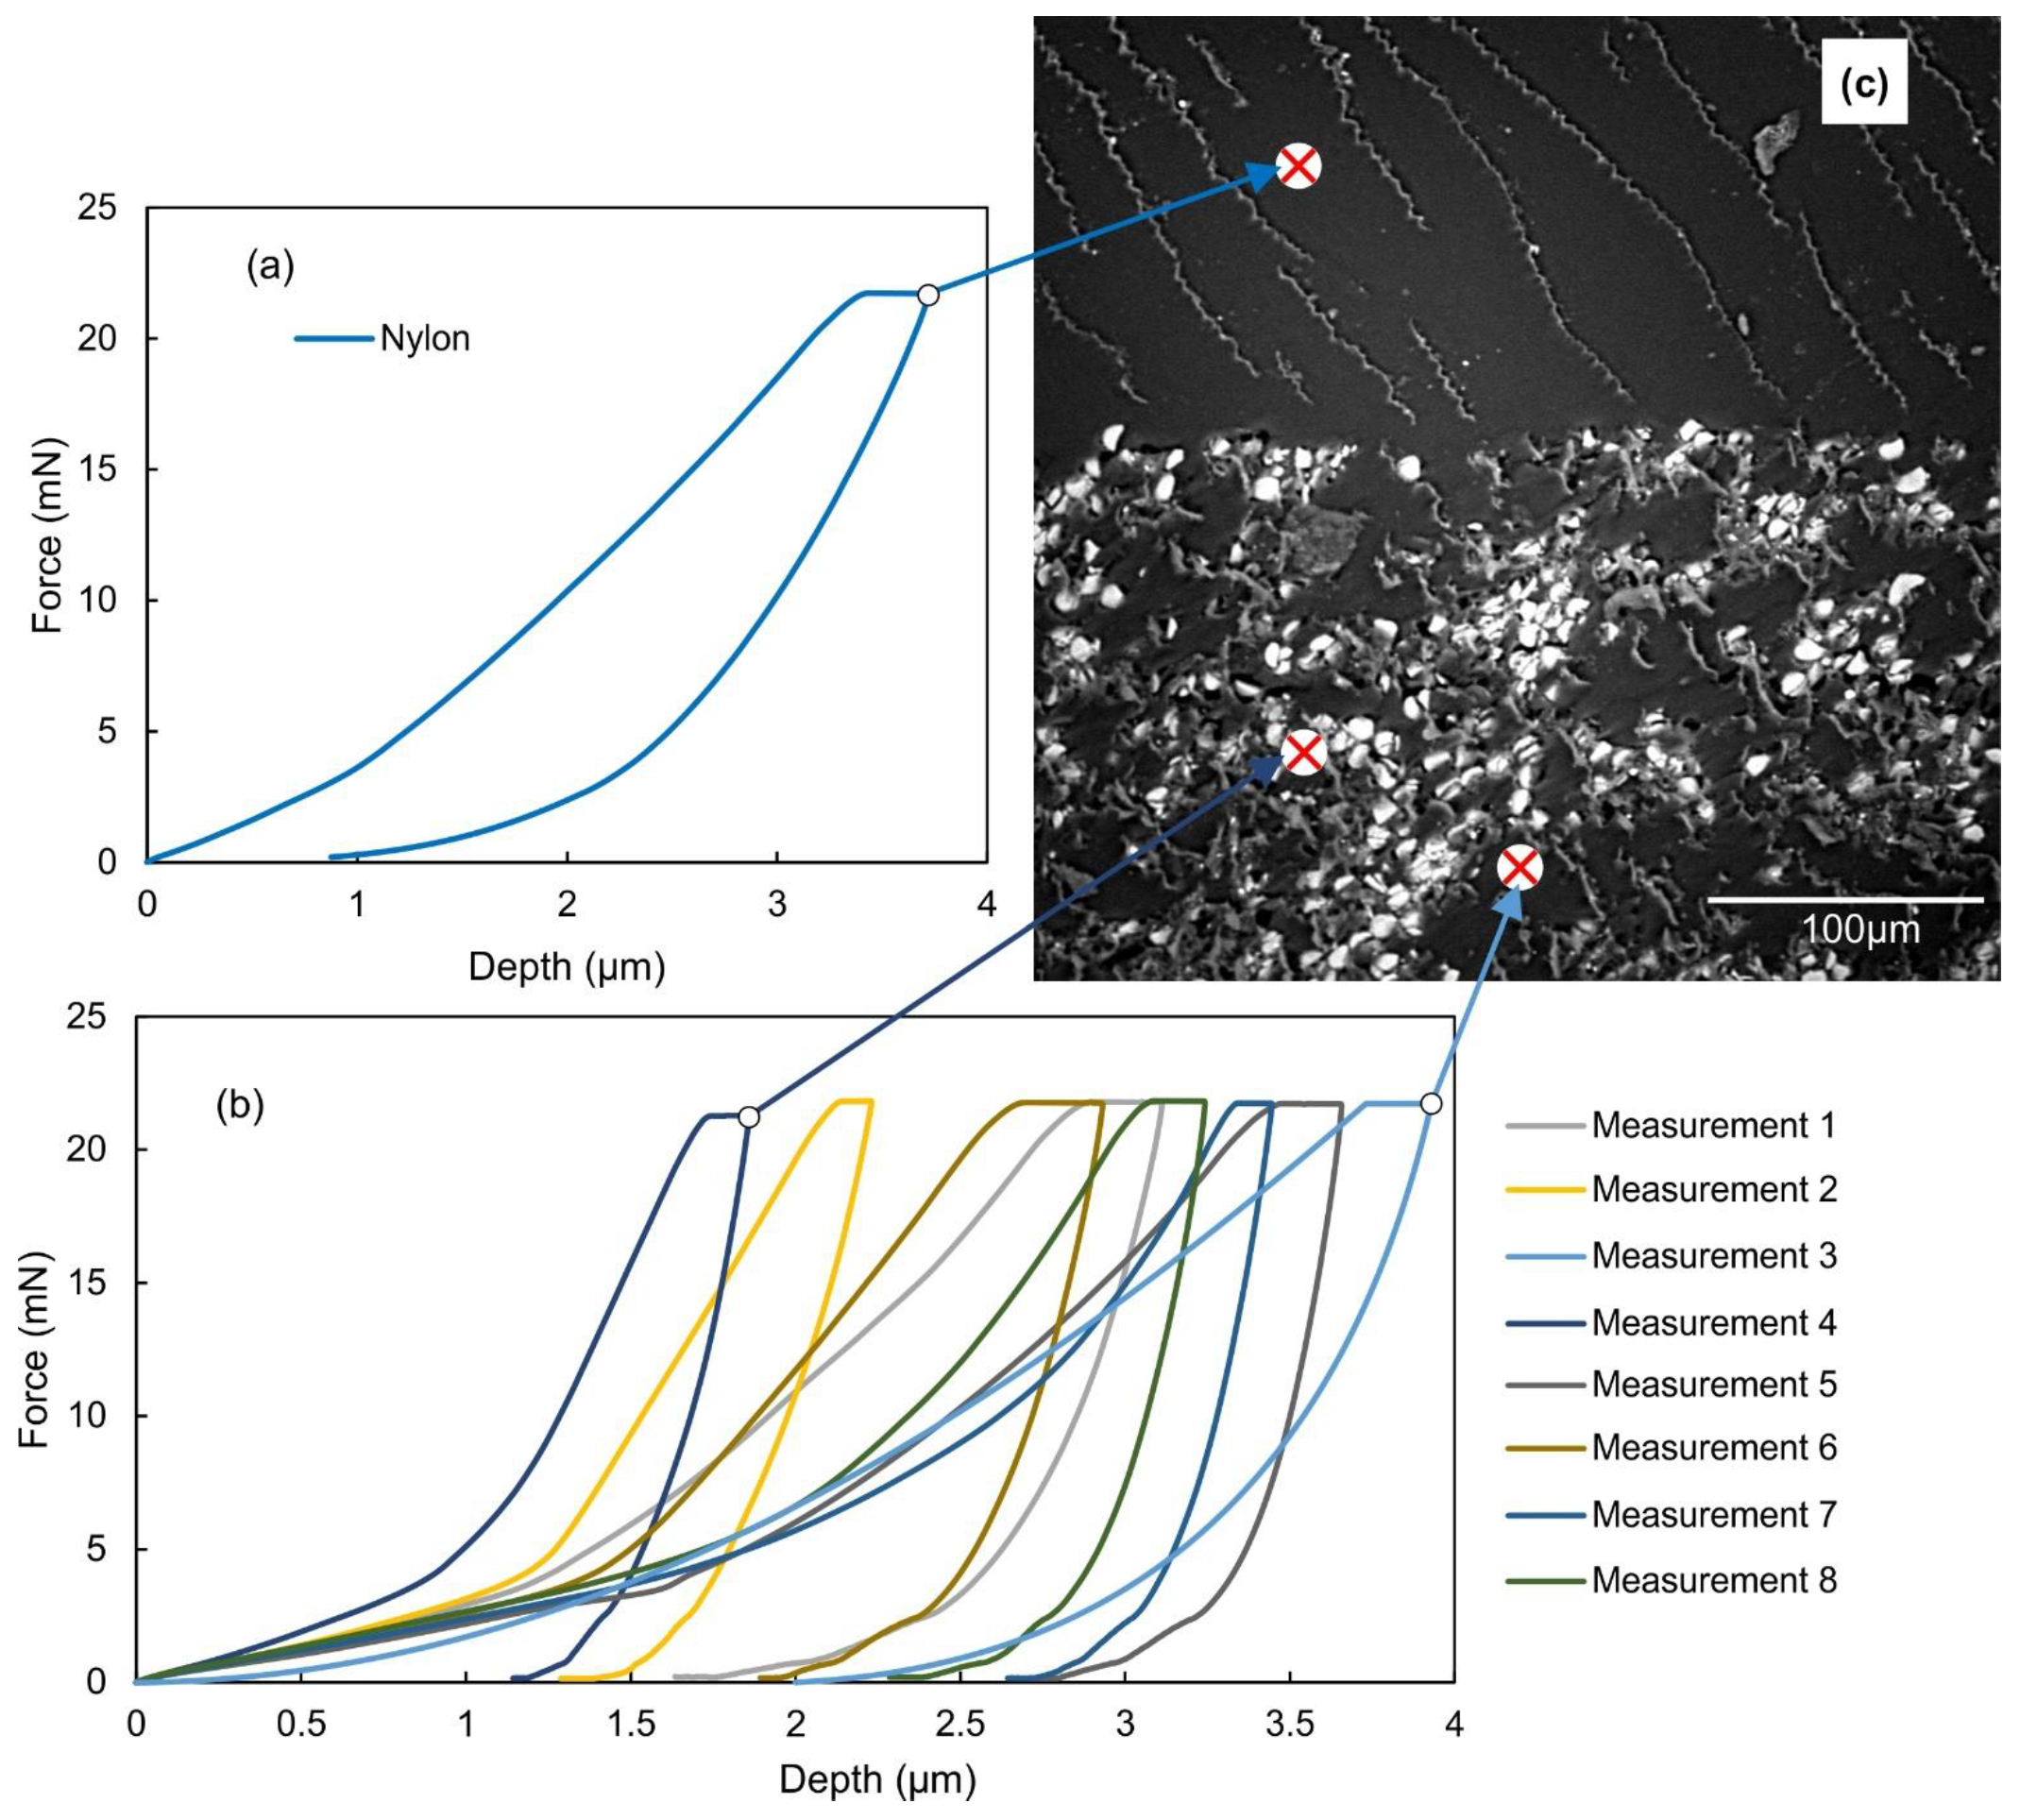
2.4. Nanoindentation Tests
2.5. Flexural Tests
3. Results and Discussion
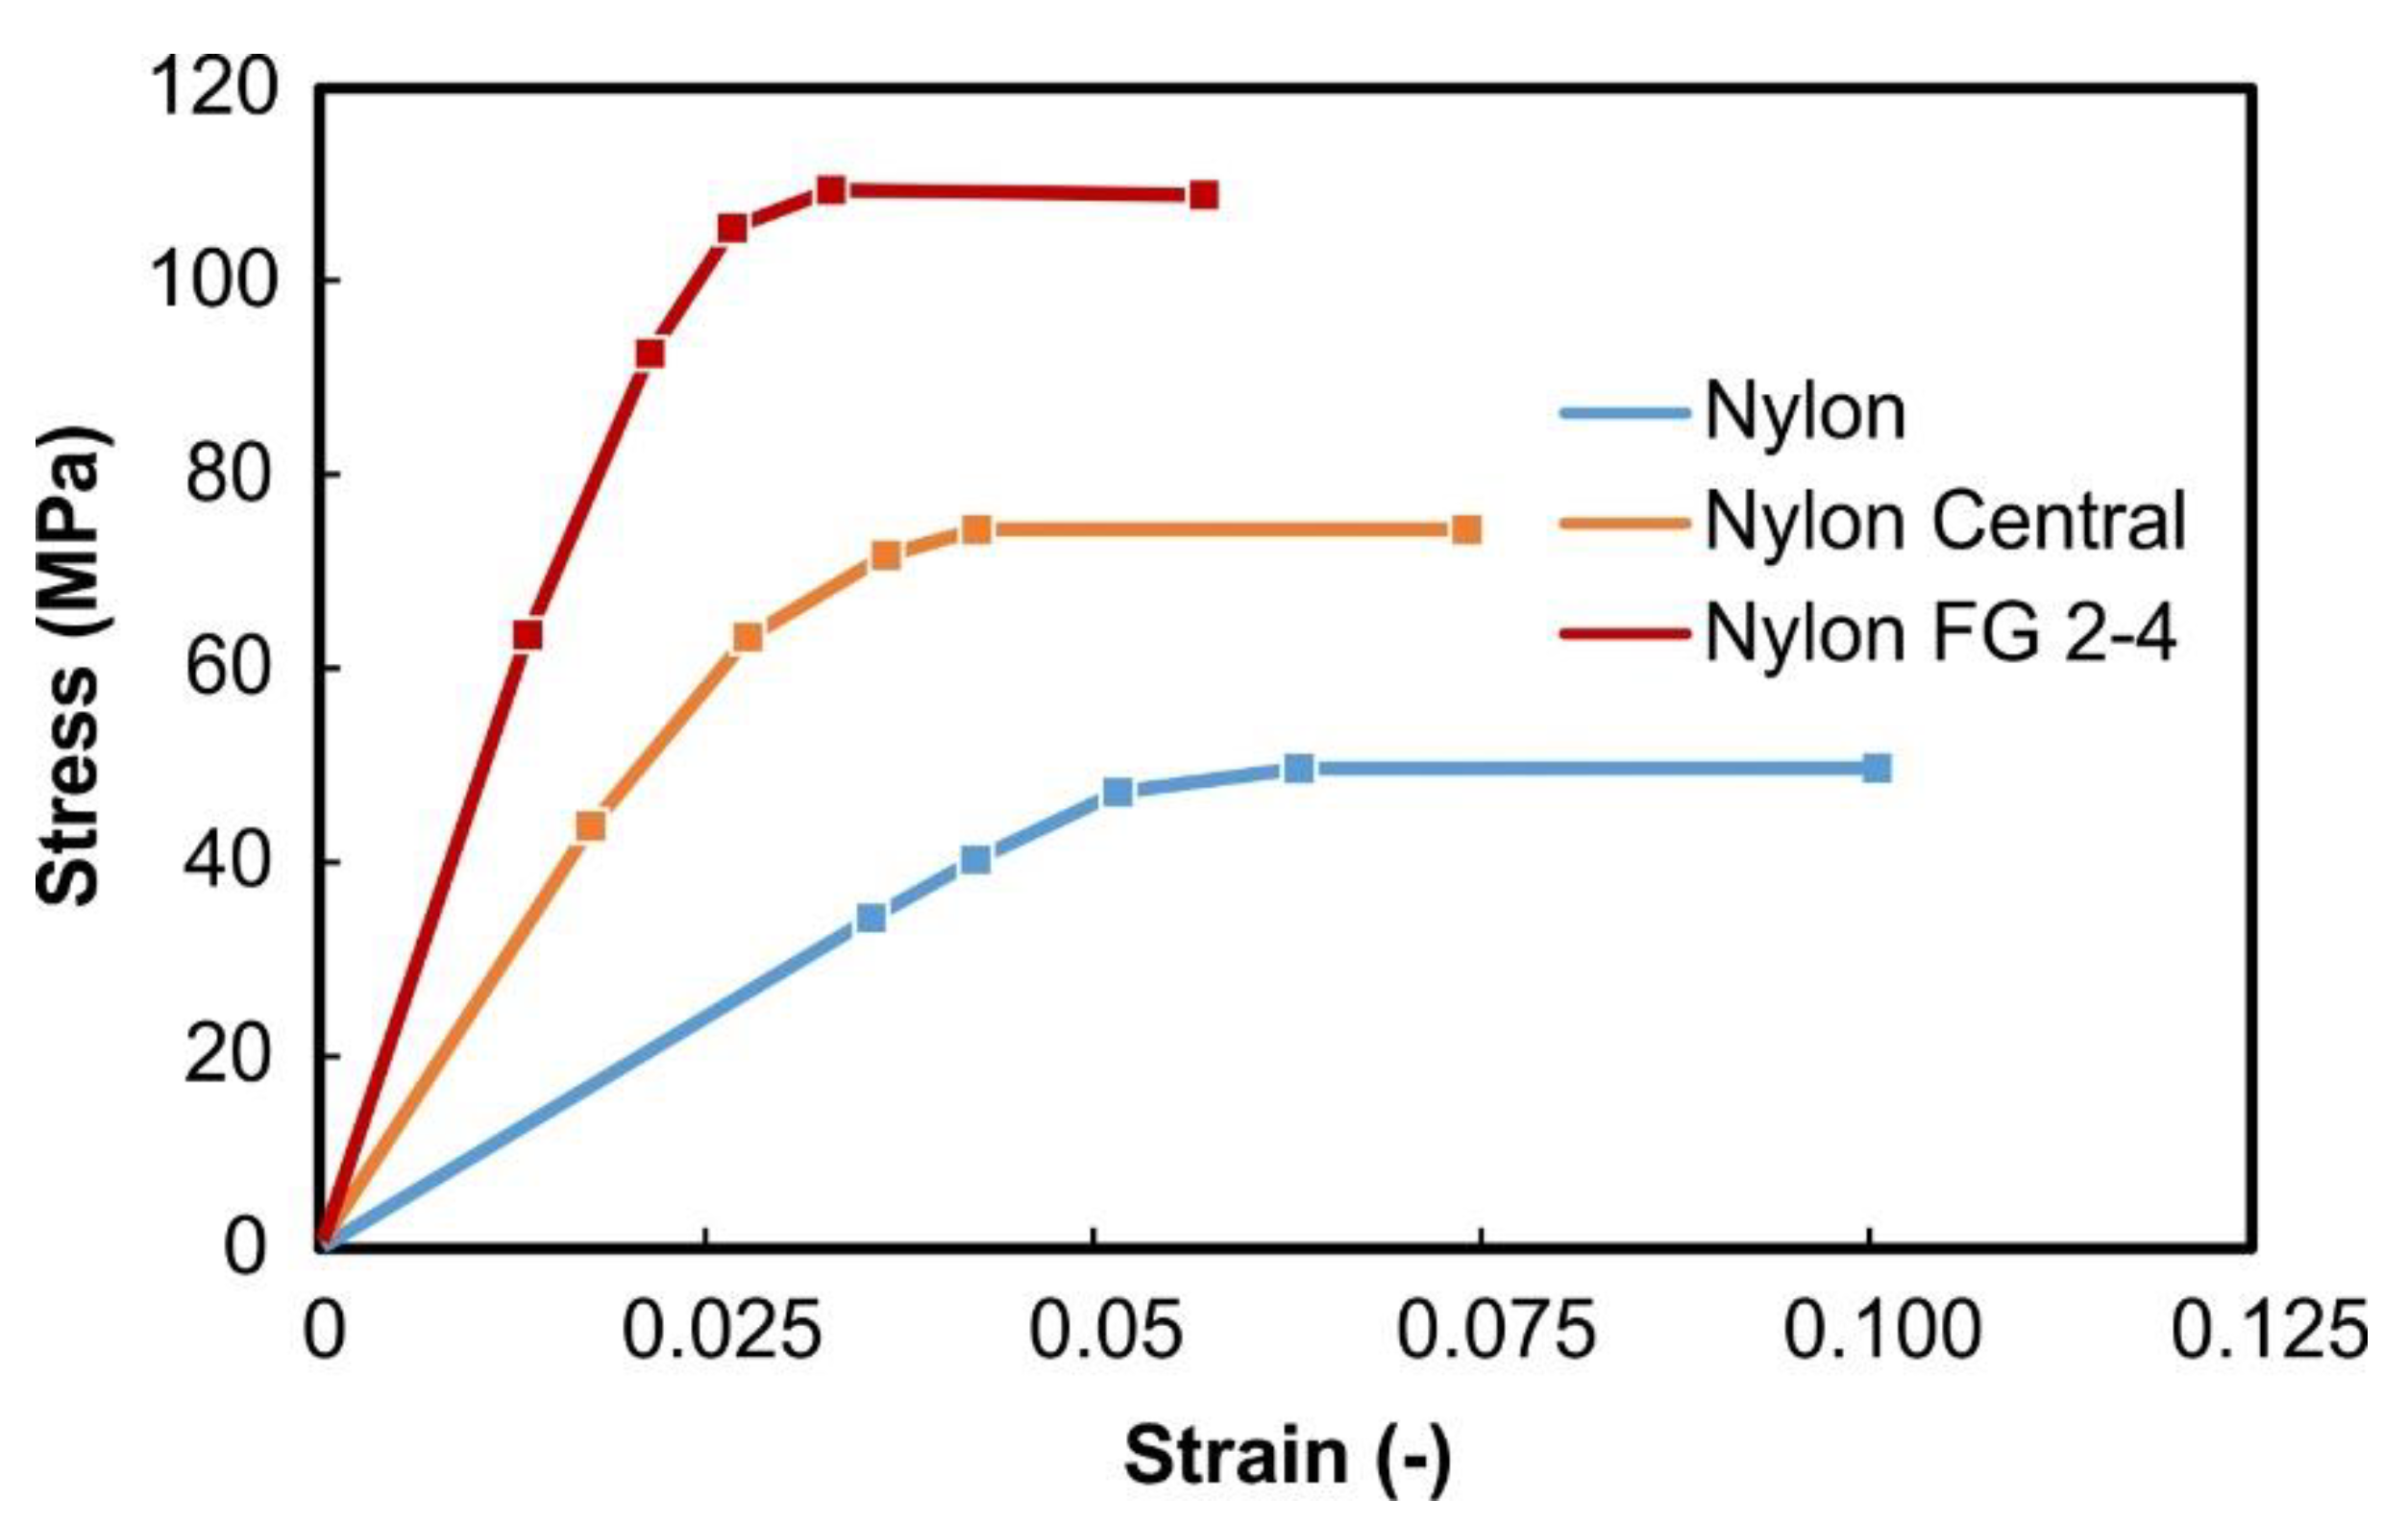
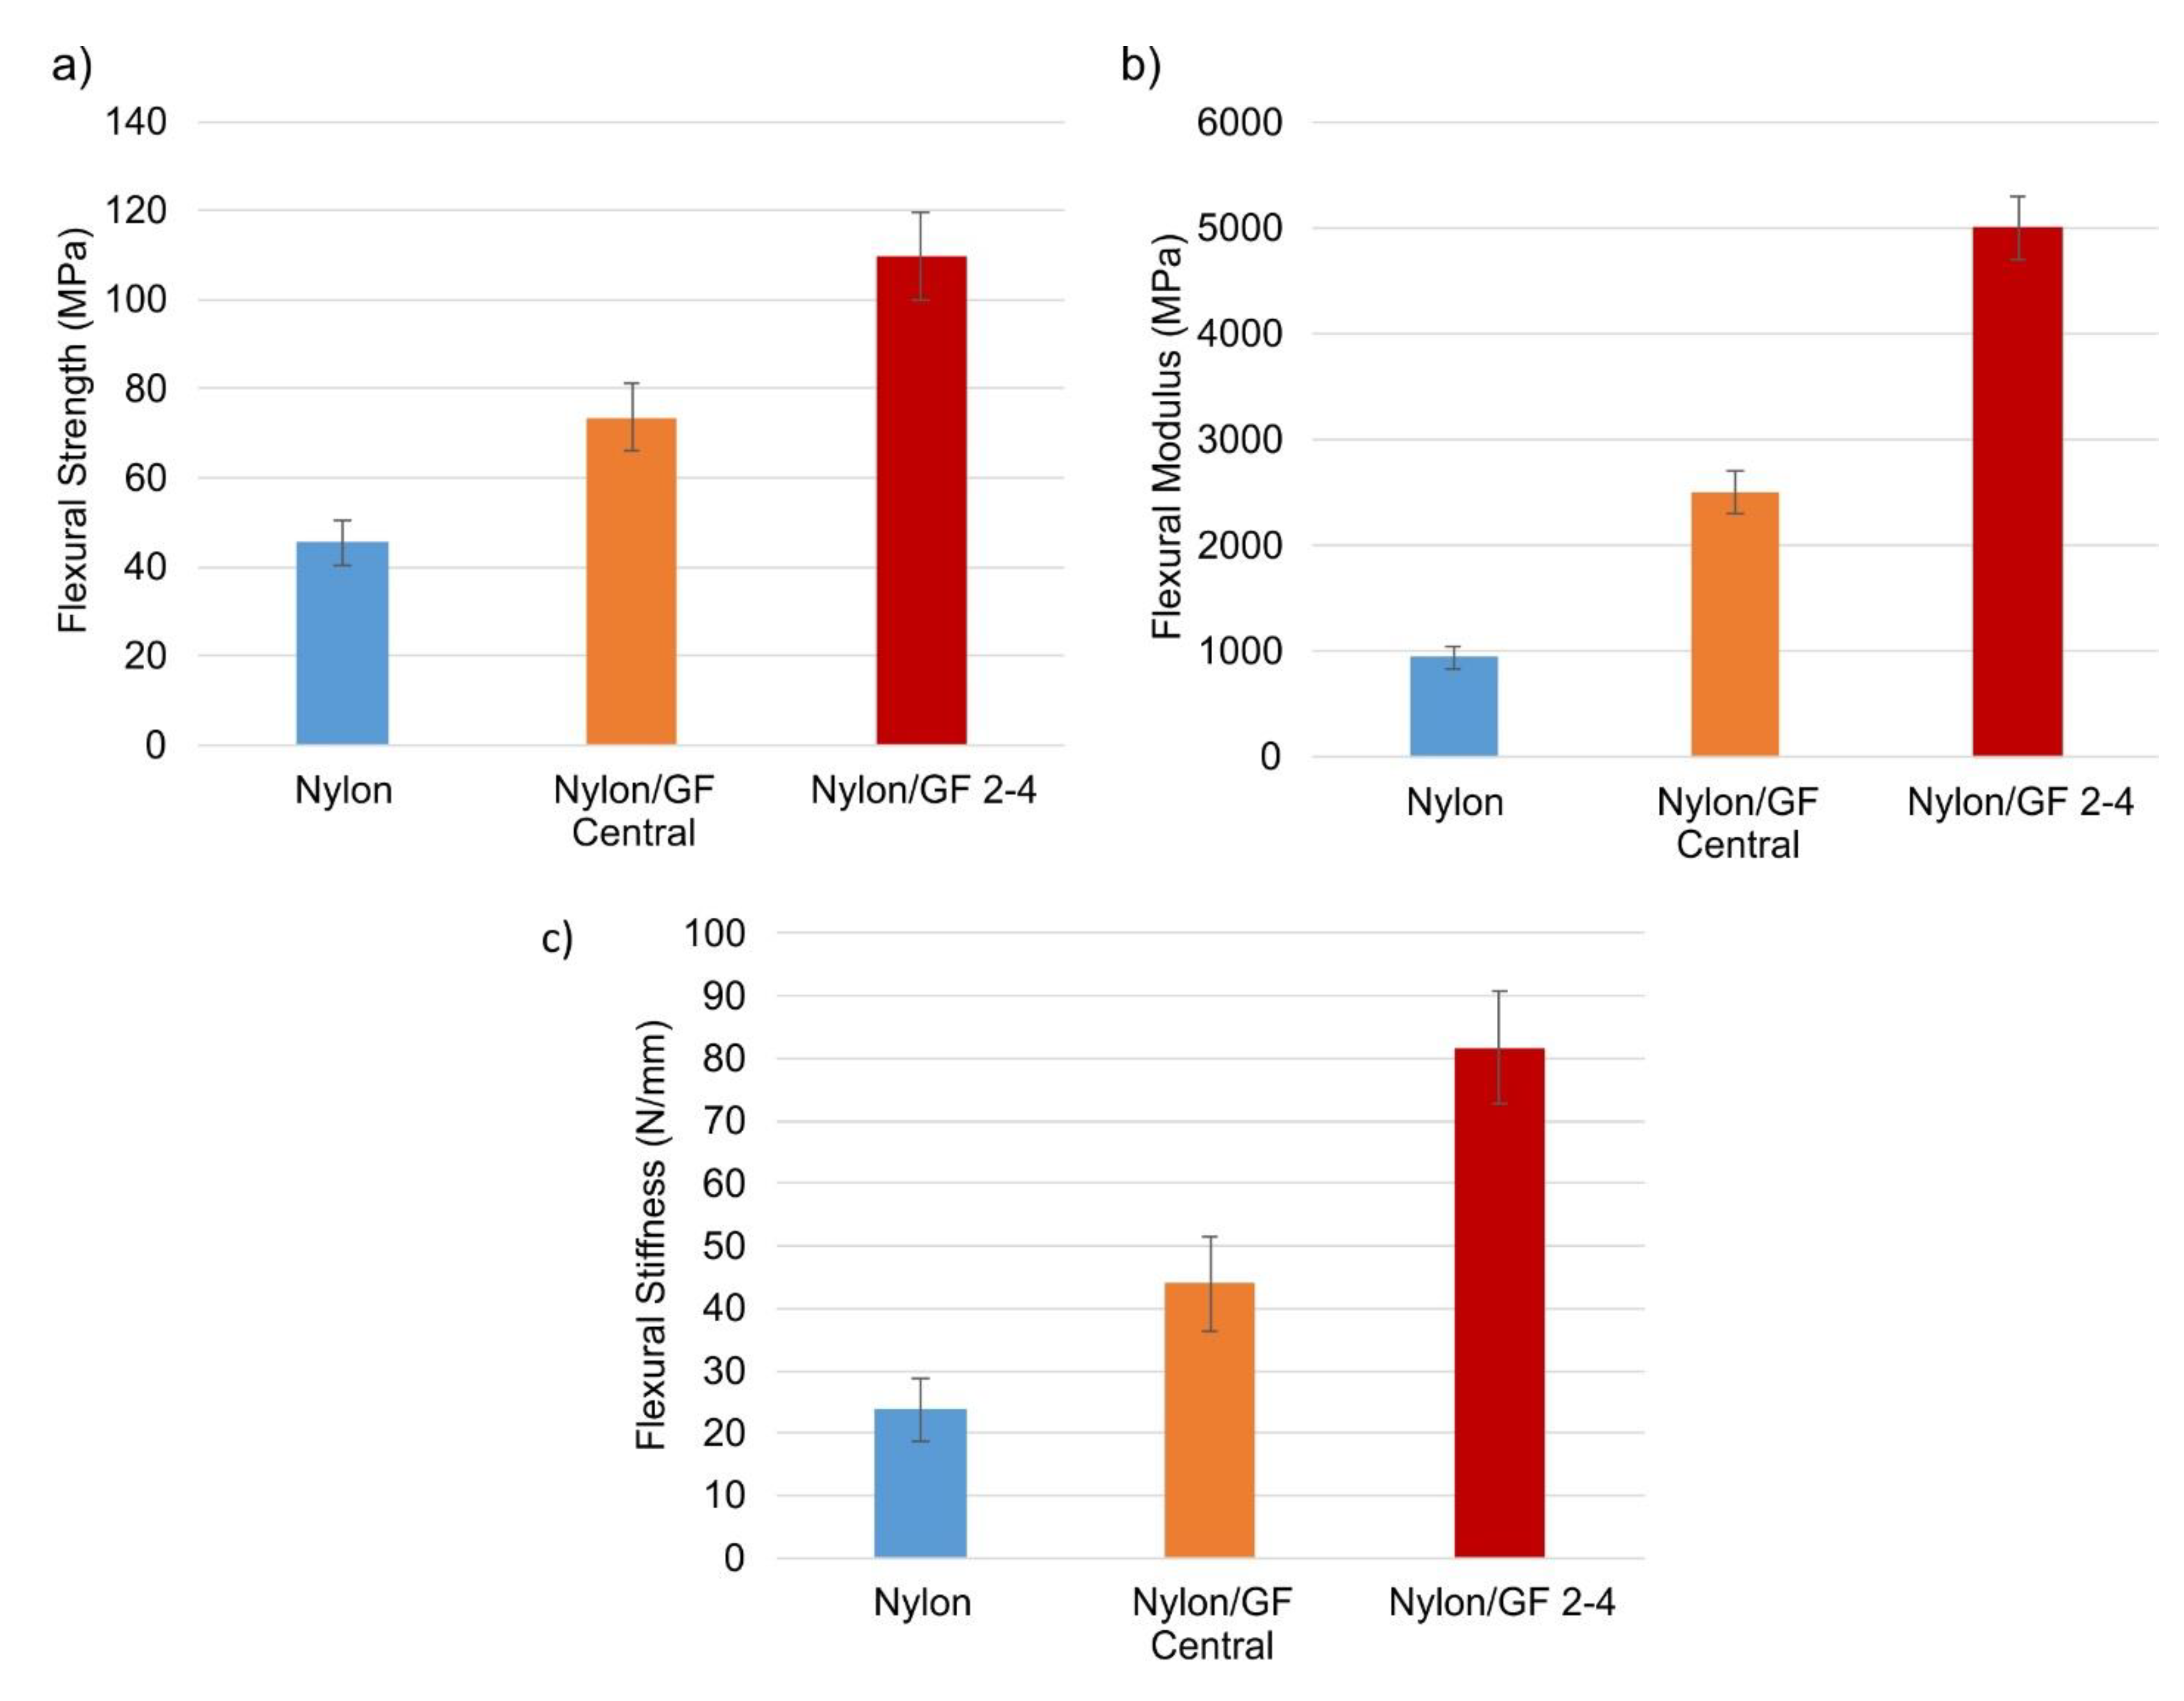
3.1. Material Characterization of Nylon- and Fiberglass-Reinforced Cellular Structures
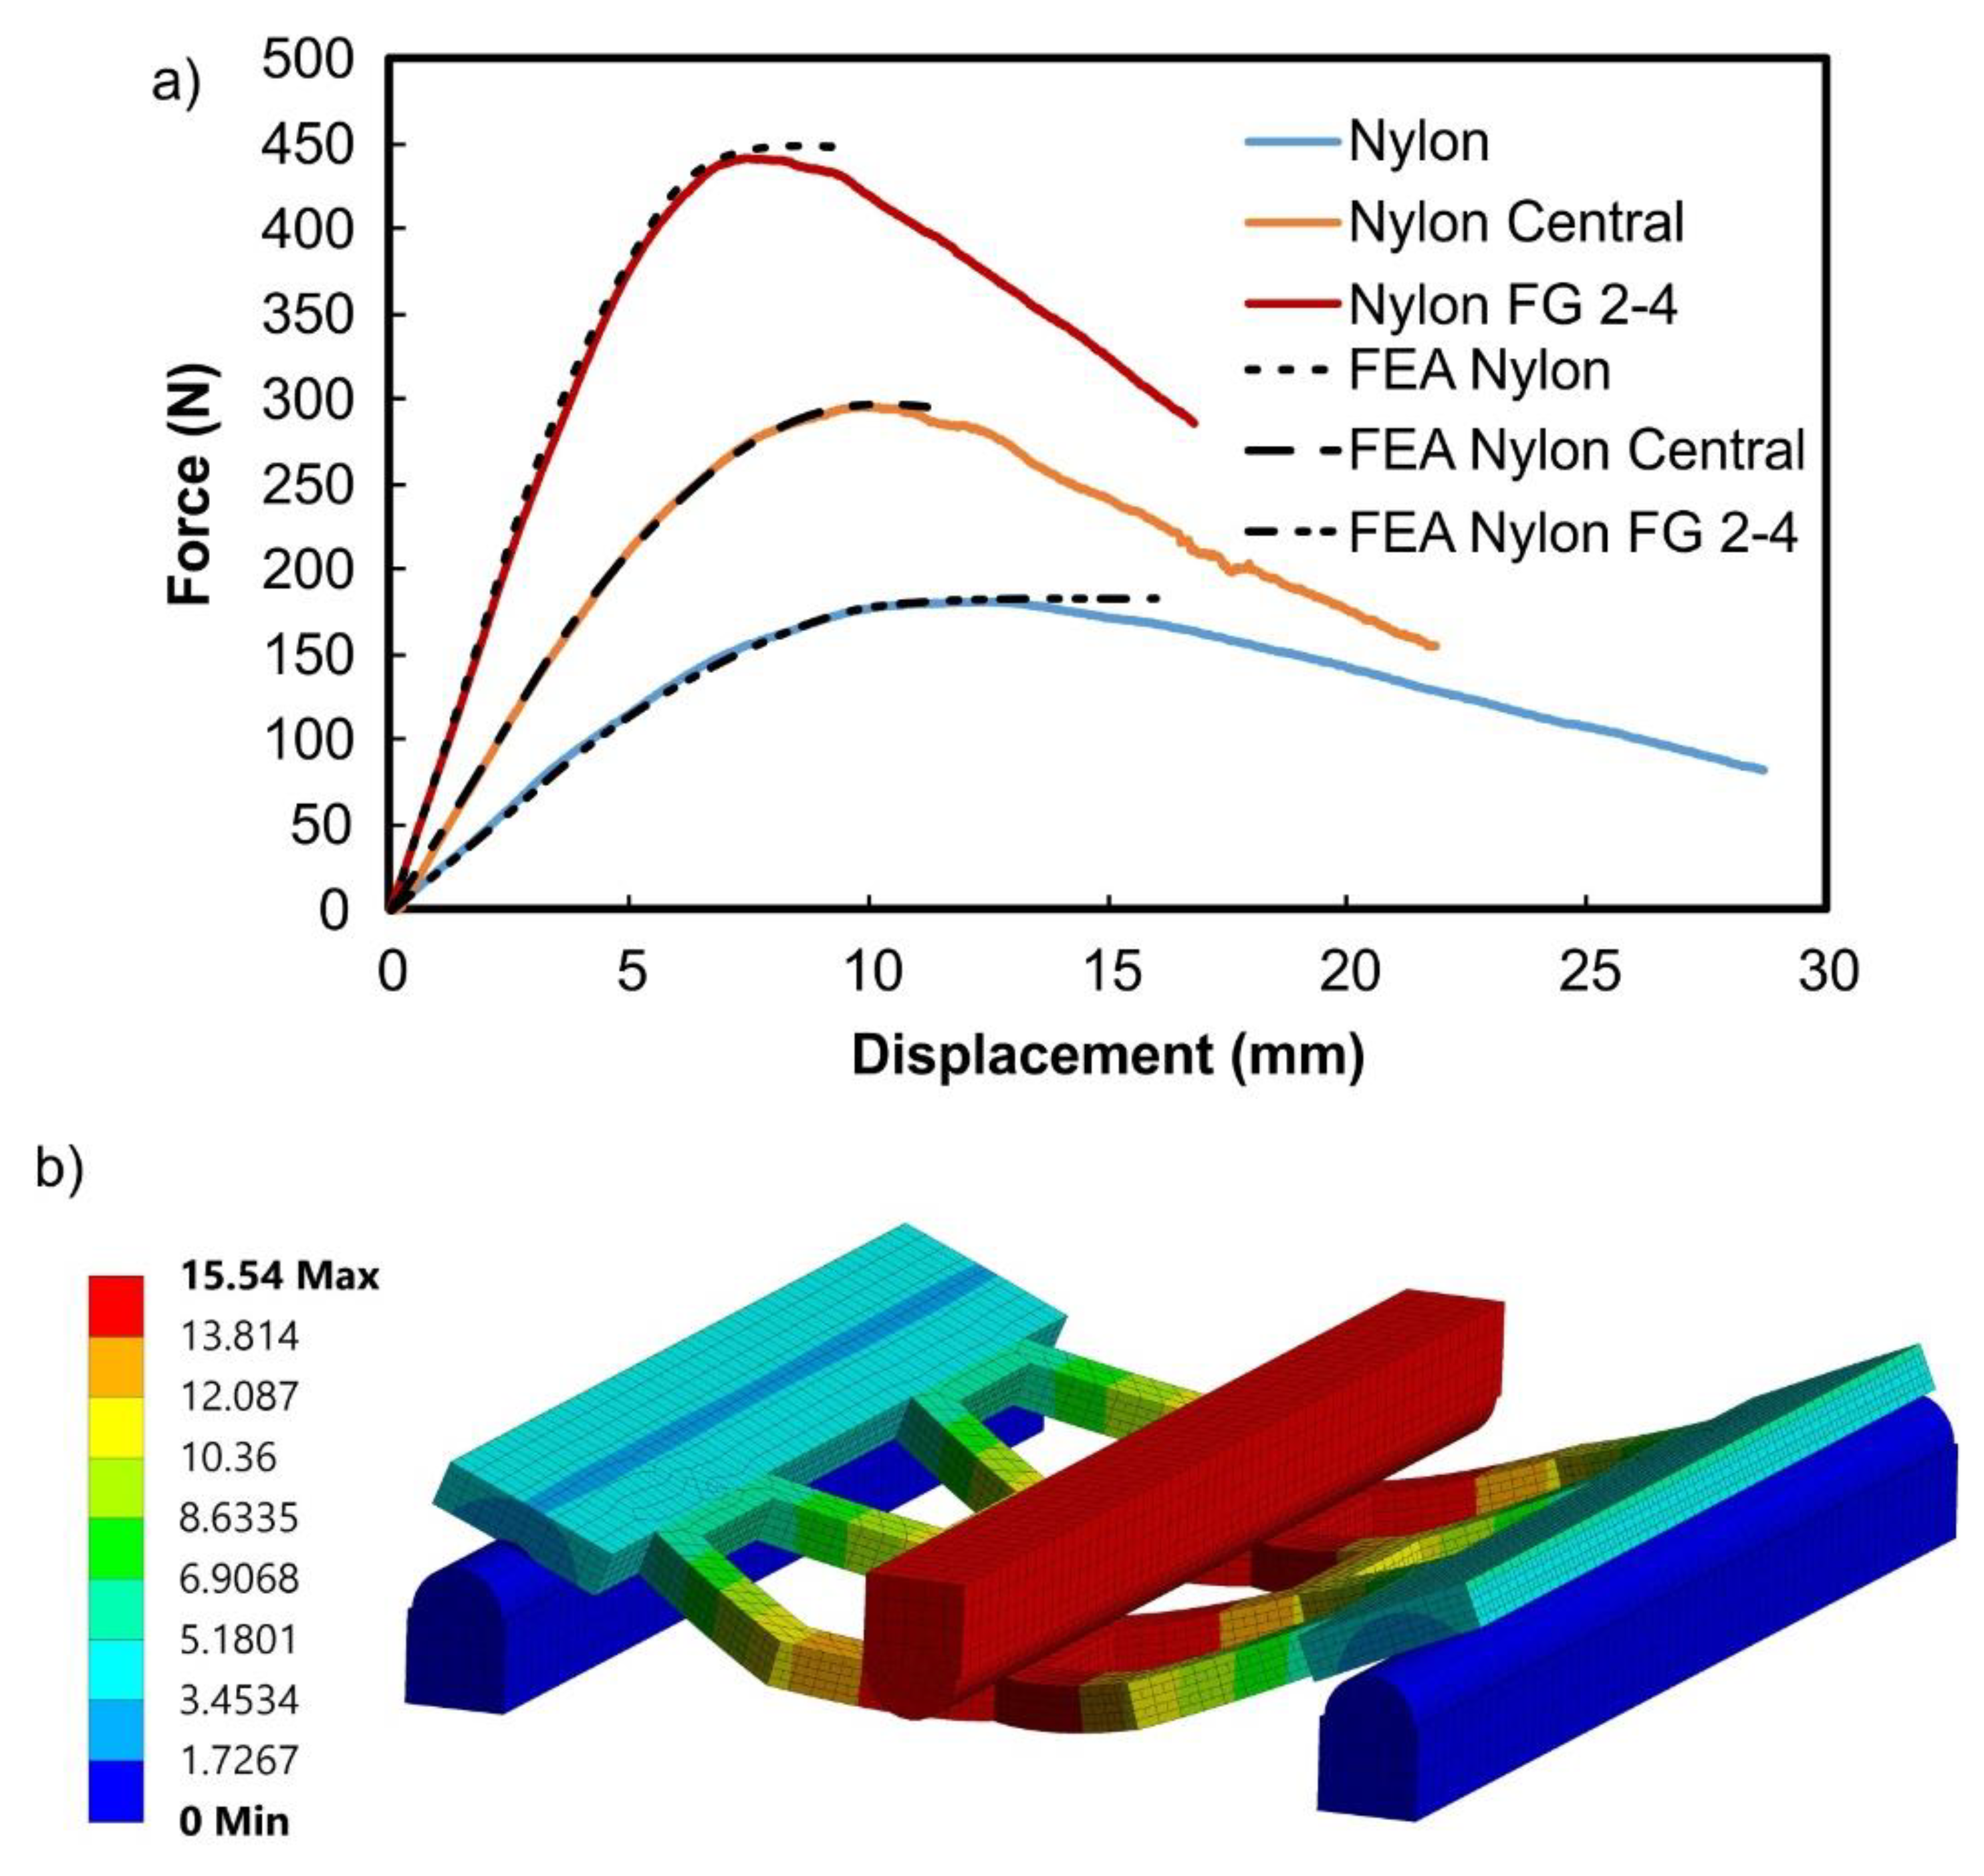
3.2. Experimental and FEA Bending Behavior of Nylon- and Fiberglass-Reinforced Cellular Structures
4. Conclusions
Author Contributions
Funding
Conflicts of Interest
References
- Dickson, A.N.; Barry, J.N.; McDonnell, K.A.; Dowling, D.P. Fabrication of continuous carbon, glass and Kevlar fibre reinforced polymer composites using additive manufacturing. Addit. Manuf. 2017, 16, 146–152. [Google Scholar]
- Liu, Z.; Wang, Y.; Wu, B.; Cui, C.; Guo, Y.; Yan, C. A critical review of fused deposition modeling 3D printing technology in manufacturing polylactic acid parts. Int. J. Adv. Manuf. Technol. 2019, 102, 2877–2889. [Google Scholar] [CrossRef]
- Kabir, S.M.F.; Mathur, K.; Seyam, A.-F.M. The Road to Improved Fiber-Reinforced 3D Printing Technology. Technologies 2020, 8, 51. [Google Scholar] [CrossRef]
- Fidan, I.; Imeri, A.; Gupta, A.; Hasanov, S.; Nasirov, A.; Elliott, A.; Alifui-Segbaya, F.; Nanami, N. The trends and challenges of fiber reinforced additive manufacturing. Int. J. Adv. Manuf. Technol. 2019, 102, 1801–1818. [Google Scholar] [CrossRef]
- Mansour, M.; Tsongas, K.; Tzetzis, D.; Antoniadis, A. Mechanical and dynamic behavior of fused filament fabrication 3D printed polyethylene terephthalate glycol reinforced with carbon fibers. Polym.-Plast. Technol. Eng. 2018, 57, 1715–1725. [Google Scholar] [CrossRef]
- Mansour, M.; Tsongas, K.; Tzetzis, D. Measurement of the mechanical and dynamic properties of 3D printed polylactic acid reinforced with graphene. Polym.-Plast. Technol. Eng. 2019, 58, 1234–1244. [Google Scholar] [CrossRef]
- Mansour, M.T.; Tsongas, K.; Tzetzis, D. 3D Printed Hierarchical Honeycombs with Carbon Fiber and Carbon Nanotube Reinforced Acrylonitrile Butadiene Styrene. J. Compos. Sci. 2021, 5, 62. [Google Scholar] [CrossRef]
- Kim, J.; Kang, B.S. Enhancing Structural Performance of Short Fiber Reinforced Objects through Customized Tool-Path. Appl. Sci. 2020, 10, 8168. [Google Scholar] [CrossRef]
- Sanei, S.H.R.; Popescu, D. 3D-Printed Carbon Fiber Reinforced Polymer Composites: A Systematic Review. J. Compos. Sci. 2020, 4, 98. [Google Scholar] [CrossRef]
- Kousiatza, C.; Tzetzis, D.; Karalekas, D. In-situ characterization of 3D printed continuous fiber reinforced composites: A methodological study using fiber Bragg grating sensors. Compos. Sci. Technol. 2019, 174, 134–141. [Google Scholar] [CrossRef]
- Mohammadizadeh, M.; Imeri, A.; Fidan, I.; Elkelany, M. 3D printed fiber reinforced polymer composites-Structural analysis. Compos. Part B Eng. 2019, 175, 107112. [Google Scholar] [CrossRef]
- Hu, C.; Sun, Z.; Xiao, Y.; Qin, Q. Recent Patents in Additive Manufacturing of Continuous Fiber Reinforced Composites. Recent Pat. Mech. Eng. 2019, 12, 25–36. [Google Scholar] [CrossRef]
- Pappas, J.M.; Thakur, A.R.; Leu, M.C.; Dong, X. A parametric study and characterization of additively manufactured continuous carbon fiber reinforced composites for high-speed 3D printing. Int. J. Adv. Manuf. Technol. 2021, 113, 2137–2151. [Google Scholar] [CrossRef]
- Kabir, S.M.F.; Mathur, K.; Seyam, A.-F.M. A critical review on 3D printed continuous fiber-reinforced composites: History, mechanism, materials and properties. Compos. Struct. 2020, 232, 111476. [Google Scholar] [CrossRef]
- Giannakis, E.; Koidis, C.; Tzetzis, D.; Kyratsis, P. Static and Fatigue Properties of 3D Printed Continuous Carbon Fiber Nylon Composites. Int. J. Modern Manuf. Technol. 2019, 11, 69–76. [Google Scholar]
- Blok, L.G.; Longana, M.L.; Yu, H.; Woods, B.K.S. An investigation into 3D printing of fibre reinforced thermoplastic composites. Addit. Manuf. 2018, 22, 176–186. [Google Scholar] [CrossRef]
- Melenka, G.W.; Cheung, B.K.O.; Schofield, J.S.; Dawson, M.R.; Carey, J.P. Evaluation and prediction of the tensile properties of continuous fiber-reinforced 3D printed structures. Compos. Struct. 2016, 153, 866–875. [Google Scholar] [CrossRef]
- Li, N.; Li, Y.; Liu, S. Rapid prototyping of continuous carbon fiber reinforced polylacticacid composites by 3D printing. J. Mater. Process. Technol. 2016, 238, 218–225. [Google Scholar] [CrossRef]
- Petrone, G.; Rao, S.; de Rosa, S.; Mace, B.R.; Franco, F.; Bhattacharyya, D. Behaviour of fibre-reinforced honeycomb core under low velocity impact loading. Compos. Struct. 2013, 100, 356–362. [Google Scholar] [CrossRef] [Green Version]
- López, G.I.; Chiné, J.L.B.; León, S. FEM Modeling of a 3D Printed Carbon Fiber Pylon. In Proceedings of the COMSOL Conference, Rotterdam, The Netherlands, 18–19 October 2017. [Google Scholar]
- Kim, H.; Park, E.; Kim, S.; Park, B.; Kim, N.; Lee, S. Experimental Study on Mechanical Properties of Single- and Dual-Material 3D Printed Products. Procedia Manuf. 2017, 10, 887–897. [Google Scholar] [CrossRef]
- Zhang, J.; Zhou, Z.; Zhang, F.; Tan, Y.; Tu, Y.; Yang, B. Performance of 3D-Printed Continuous-Carbon-Fiber-Reinforced Plastics with Pressure. Materials 2020, 13, 471. [Google Scholar] [CrossRef] [Green Version]
- Zhang, Q.; Yang, X.; Li, P.; Huang, G.; Feng, S.; Shen, C.; Han, B.; Zhang, X.; Jin, F.; Xu, F.; et al. Bioinspired engineering of honeycomb structure–Using nature to inspire human innovation. Prog. Mater. Sci. 2015, 74, 332–400. [Google Scholar] [CrossRef]
- Lam, Q.; Patil, D.; Le, T.; Eppley, T.; Salti, Z.; Goss, D.; Grishin, A.; Bhate, D. An Examination of the Low Strain Rate Sensitivity of Additively Manufactured Polymer, Composite and Metallic Honeycomb Structures. Materials 2019, 12, 3455. [Google Scholar] [CrossRef] [Green Version]
- Wang, Z.; Liu, J.; Lu, Z.; Hui, D. Mechanical behavior of composited structure filled with tandem honeycombs. Compos. Part B 2017, 114, 128–138. [Google Scholar] [CrossRef]
- Mansour, M.T.; Tsongas, K.; Tzetzis, D.; Antoniadis, A. The in-plane compression performance of hierarchical honeycomb additive manufactured structures. In Proceedings of the IOP Conference Series: Materials Science and Engineering, University of Pitesti, Pitesti, Romania, 22–24 May 2019. [Google Scholar] [CrossRef]
- Mansour, M.T.; Tsongas, K.; Tzetzis, D. The mechanical performance of 3D printed hierarchical honeycombs using carbon fiber and carbon nanotube reinforced acrylonitrile butadiene styrene filaments. MATEC Web of Conferences. In Proceedings of the 7th International Conference of Materials and Manufacturing Engineering (ICMMEN 2020), Thessaloniki, Greece, 2–3 July 2020. [Google Scholar] [CrossRef]
- Oliver, W.C.; Pharr, G.M. An Improved Technique for Determining Hardness and Elastic-Modulus using Load and Displacement Sensing Indentation Experiments. J. Mater. Res. 1992, 7, 1564–1583. [Google Scholar] [CrossRef]
- Tzetzis, D.; Mansour, G.; Tsiafis, I.; Pavlidou, E. Nanoindentation Measurements of Fumed Silica Epoxy Reinforced Nanocomposites. J. Reinf. Plast. Compos. 2013, 32, 163–173. [Google Scholar] [CrossRef]
- Tzetzis, D.; Tsongas, K.; Mansour, G. Determination of the Mechanical Properties of Epoxy Silica Nanocomposites through FEA-Supported Evaluation of Ball Indentation Test Results. Mater. Res. 2017, 20, 1571–1578. [Google Scholar] [CrossRef] [Green Version]
- Tsongas, K.; Tzetzis, D.; Karantzalis, A.; Banias, G.; Exarchos, D.; Ahmadkhaniha, D.; Zanella, C.; Matikas, T.; Bochtis, D. Microstructural, surface topology and nanomechanical characterization of electro-deposited Ni-P/SiC nanocomposite coatings. Appl. Sci. 2019, 9, 2901. [Google Scholar] [CrossRef] [Green Version]
- Mansour, G.; Zoumaki, Μ.; Tsongas, K.; Tzetzis, D. Microstructural and Finite Element Analysis-assisted Nanomechanical Characterization of Maize Starch Nanocomposite Films. Mater. Res. 2021, 24, e20200409. [Google Scholar] [CrossRef]
- Ning, F.; Cong, W.; Qiu, J.; Wei, J.; Wang, S. Additive manufacturing of carbon fiber reinforced thermoplastic composites using fused deposition modeling. Compos. Part B Eng. 2015, 80, 369–378. [Google Scholar] [CrossRef]
- Zhang, M.; Benítez, J.M.; Montáns, F.J. Cyclic plasticity using Prager’s translation rule and both nonlinear kinematic and isotropic hardening: Theory, validation and algorithmic implementation. Comput. Methods Appl. Mech. Engrg. 2018, 328, 565–593. [Google Scholar] [CrossRef]


Publisher’s Note: MDPI stays neutral with regard to jurisdictional claims in published maps and institutional affiliations. |
© 2021 by the authors. Licensee MDPI, Basel, Switzerland. This article is an open access article distributed under the terms and conditions of the Creative Commons Attribution (CC BY) license (https://creativecommons.org/licenses/by/4.0/).
Share and Cite
Giarmas, E.; Tsongas, K.; Tzimtzimis, E.K.; Korlos, A.; Tzetzis, D. Mechanical and FEA-Assisted Characterization of 3D Printed Continuous Glass Fiber Reinforced Nylon Cellular Structures. J. Compos. Sci. 2021, 5, 313. https://doi.org/10.3390/jcs5120313
Giarmas E, Tsongas K, Tzimtzimis EK, Korlos A, Tzetzis D. Mechanical and FEA-Assisted Characterization of 3D Printed Continuous Glass Fiber Reinforced Nylon Cellular Structures. Journal of Composites Science. 2021; 5(12):313. https://doi.org/10.3390/jcs5120313
Chicago/Turabian StyleGiarmas, Evangelos, Konstantinos Tsongas, Emmanouil K. Tzimtzimis, Apostolos Korlos, and Dimitrios Tzetzis. 2021. "Mechanical and FEA-Assisted Characterization of 3D Printed Continuous Glass Fiber Reinforced Nylon Cellular Structures" Journal of Composites Science 5, no. 12: 313. https://doi.org/10.3390/jcs5120313