
Random Forest Modeling for Fly Ash-Calcined Clay Geopolymer Composite Strength Detection


Abstract
:1. Introduction
2. Materials and Methods
2.1. Fly Ash
2.2. Calcined Clay
2.3. Sodium Silicate Solution
2.4. Sodium Hydroxide
2.5. Superplasticizer
2.6. Aggregate
2.6.1. Fine Aggregate/Crushed Stone Dust
2.6.2. Coarse Aggregate
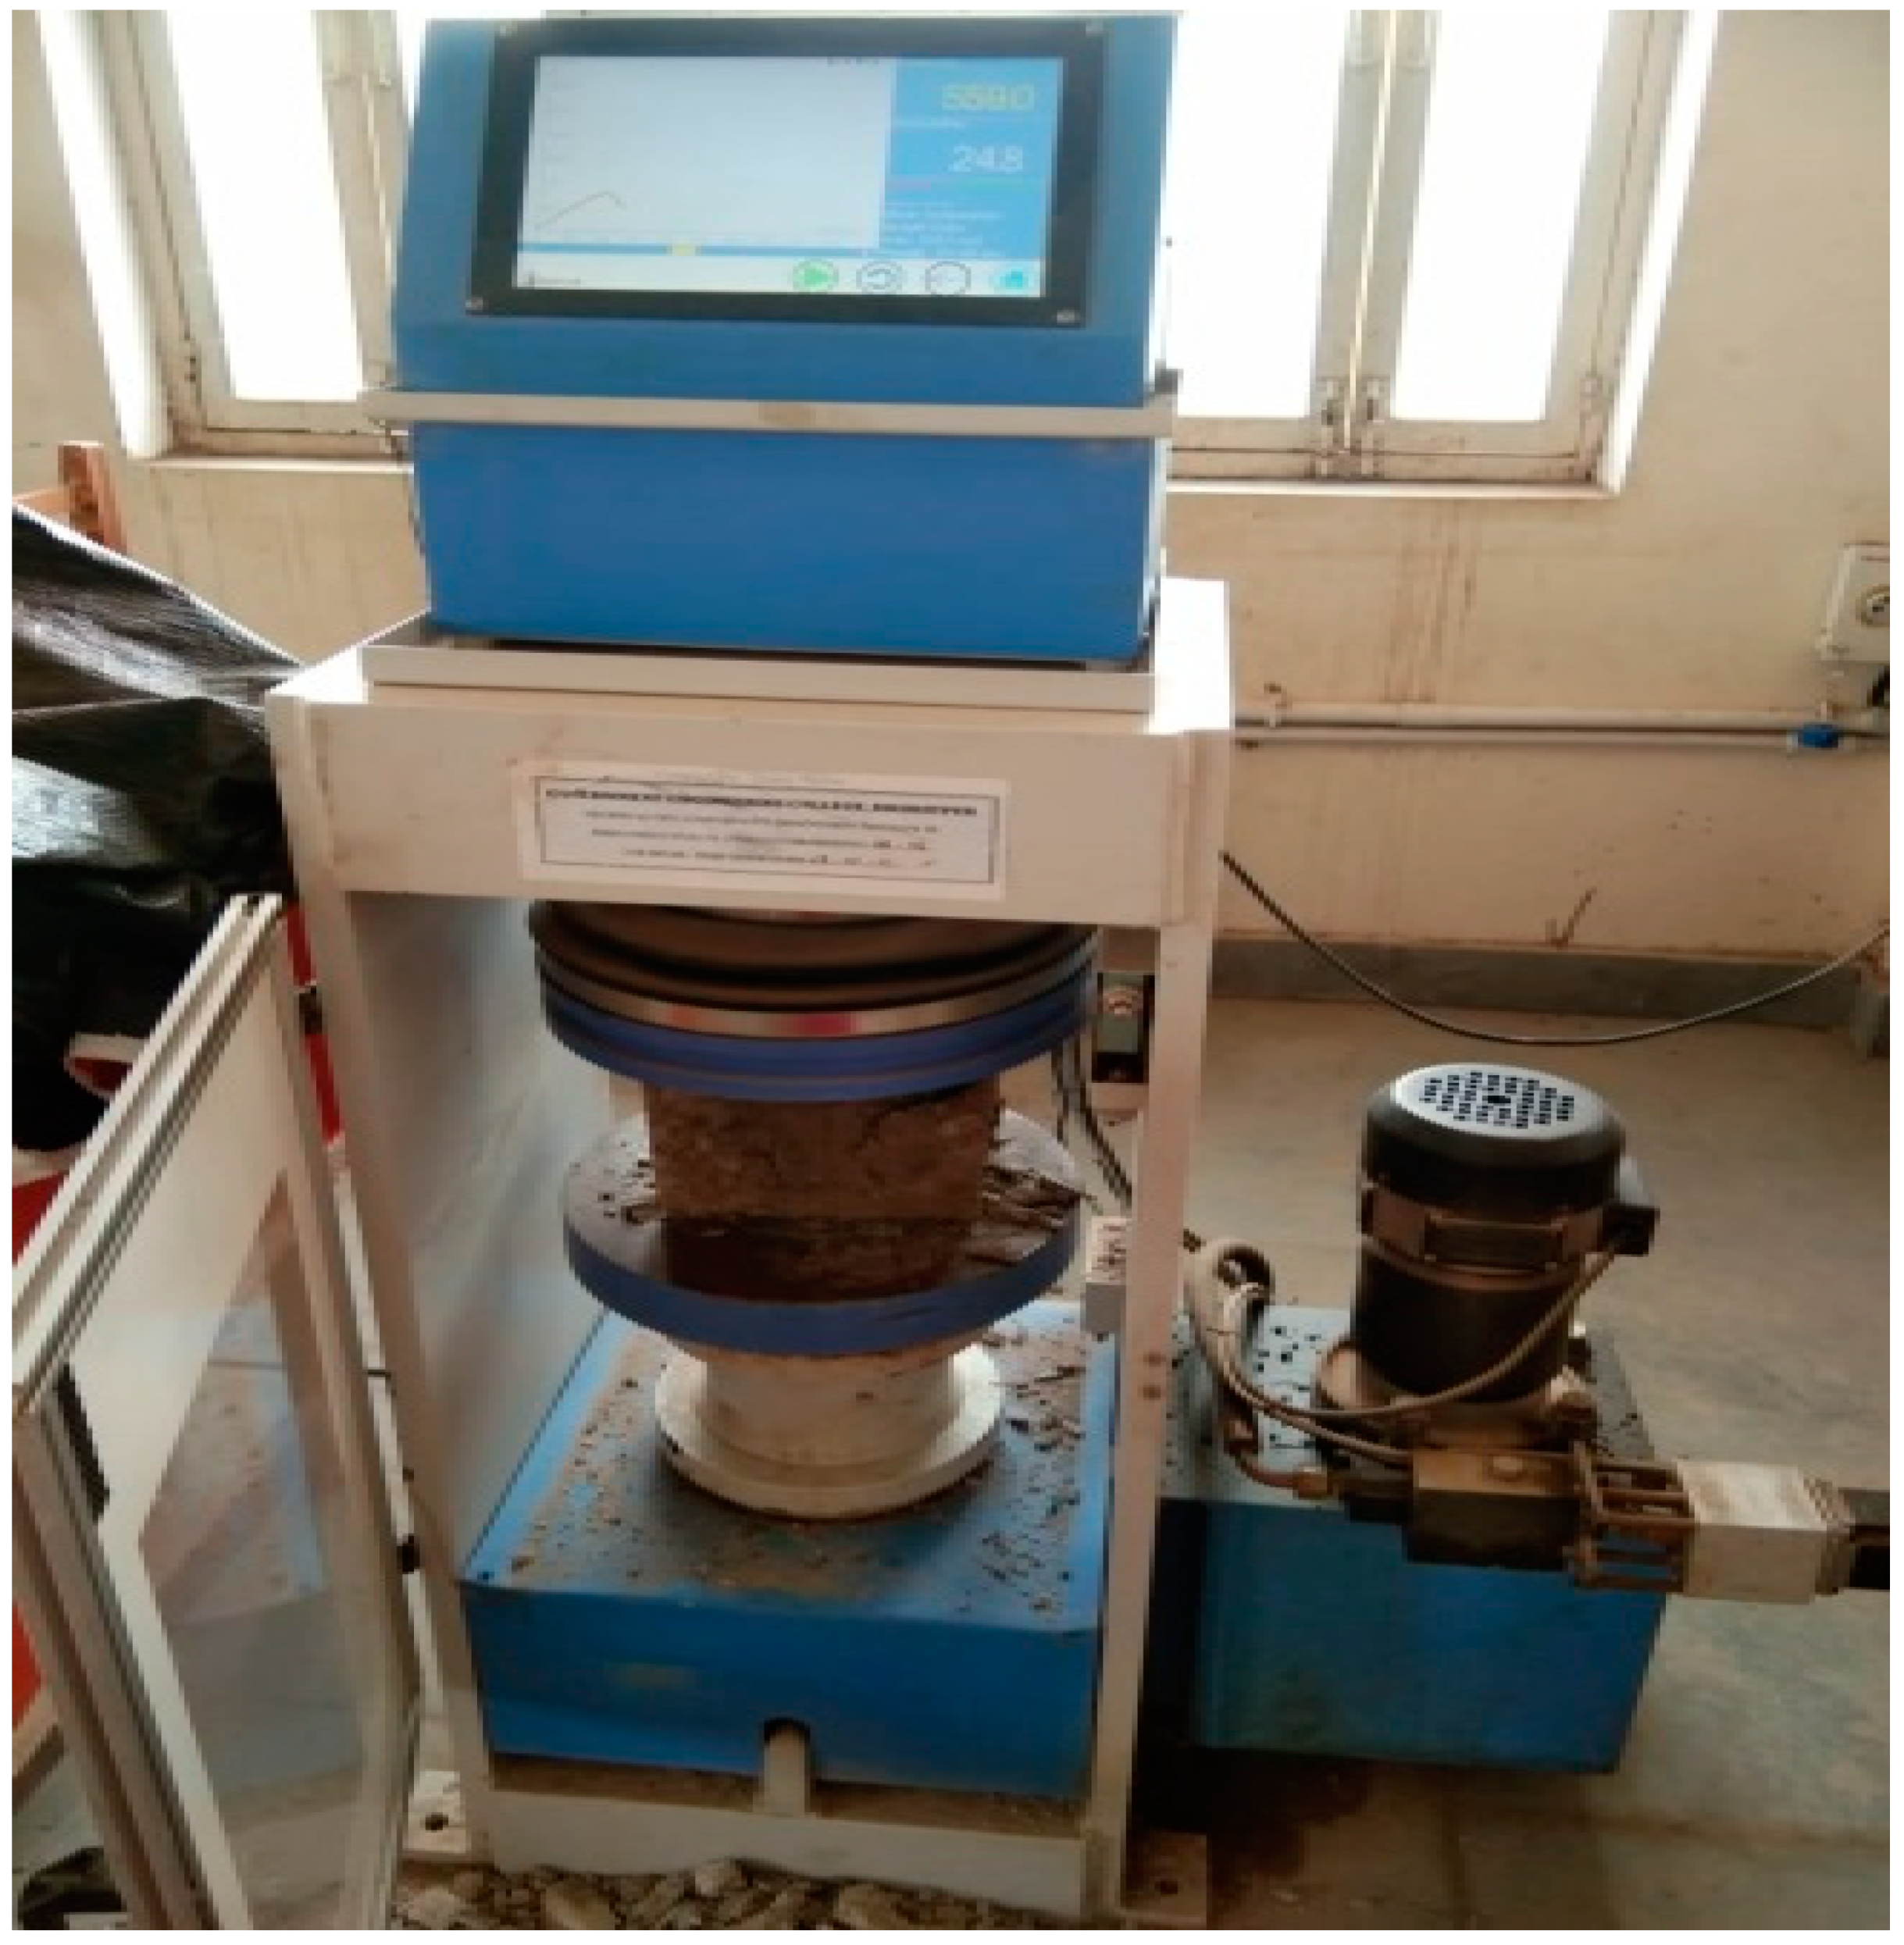
2.7. Sample Preparation and Testing Method
3. Modeling Technique
3.1. Random Forest Research (RFR)
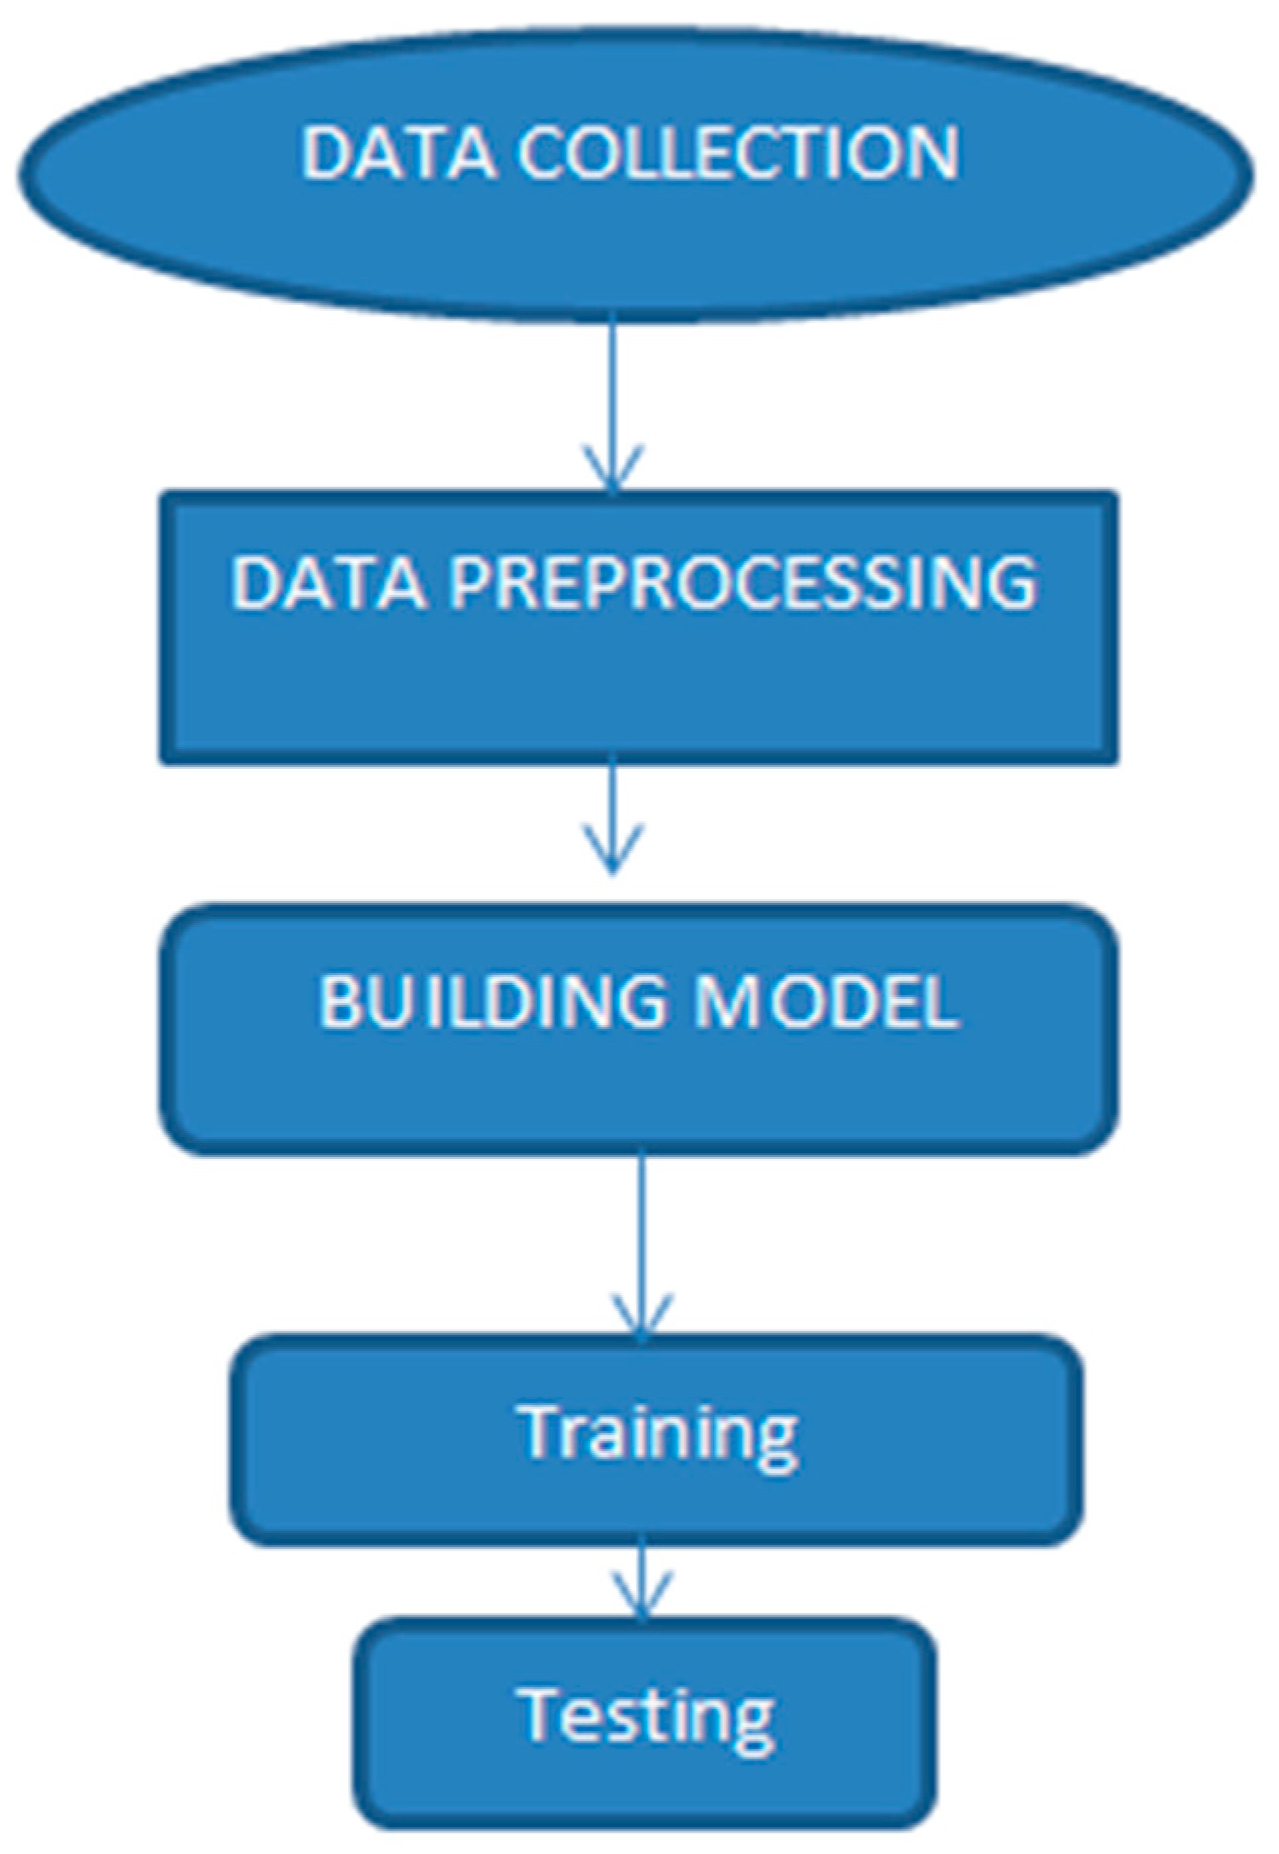
3.2. Projected Approach/Proposed Strategy
Data Collection
| Algorithm 1 Random forest modeling. |
| Input-Calcined clay, fly ash geopolymer concrete dataset. Output-Strength due to compression and tension of FACC based geopolymer composite. |
3.3. Analysis of Model Performance
4. Results and Discussion
- (1)
- (2)
- In the case of compressive strength RFR, the R2 was determined to be 0.93 in the training dataset. Similarly, the R2 was obtained as 0.58 in the testing phase. Furthermore, RFR was shown to have the best value among the statistical measures used in testing as (MSE = 10.41, RMSE = 3.22, MAE = 3.07). The RFR model excels at capturing the nonlinear interactions between geopolymer mix design proportions and temperatures with compressive strength, which could explain its supremacy. Consequently, since it relies on empirical analytical evaluations, it may be inferred that the RFR model produced the desired results [8,22].
- (3)
- The R2, MAE, and RMSE of the predicted values, using the RFR, were also calculated [23]. For split tensile strength the training dataset, MSE, RMSE, R2, and MAE values were 0.88, 0.25, 0.88, and 0.0256, respectively. Using the RFR technique, calculate the R2, MAE, and RMSE of the anticipated values [24]. This research could help engineers choose optimal supervised learning models and parameters for geopolymer concrete manufacturing. This graph suggests that employing the RFR model could be beneficial. To forecast the strength due to compression of geopolymer concrete at various temperatures, 12 input variables are sufficient and have reasonable precision. Using a set of 12 input variables could be justified and useful for practical and engineering applications, according to the findings. R2 is regarded as very weak, low, medium, or strong if ranges as >0.3, 0.3 < r < 0.5, 0.5 < r < 0.7, or r > 0.7, respectively [25].
- (4)
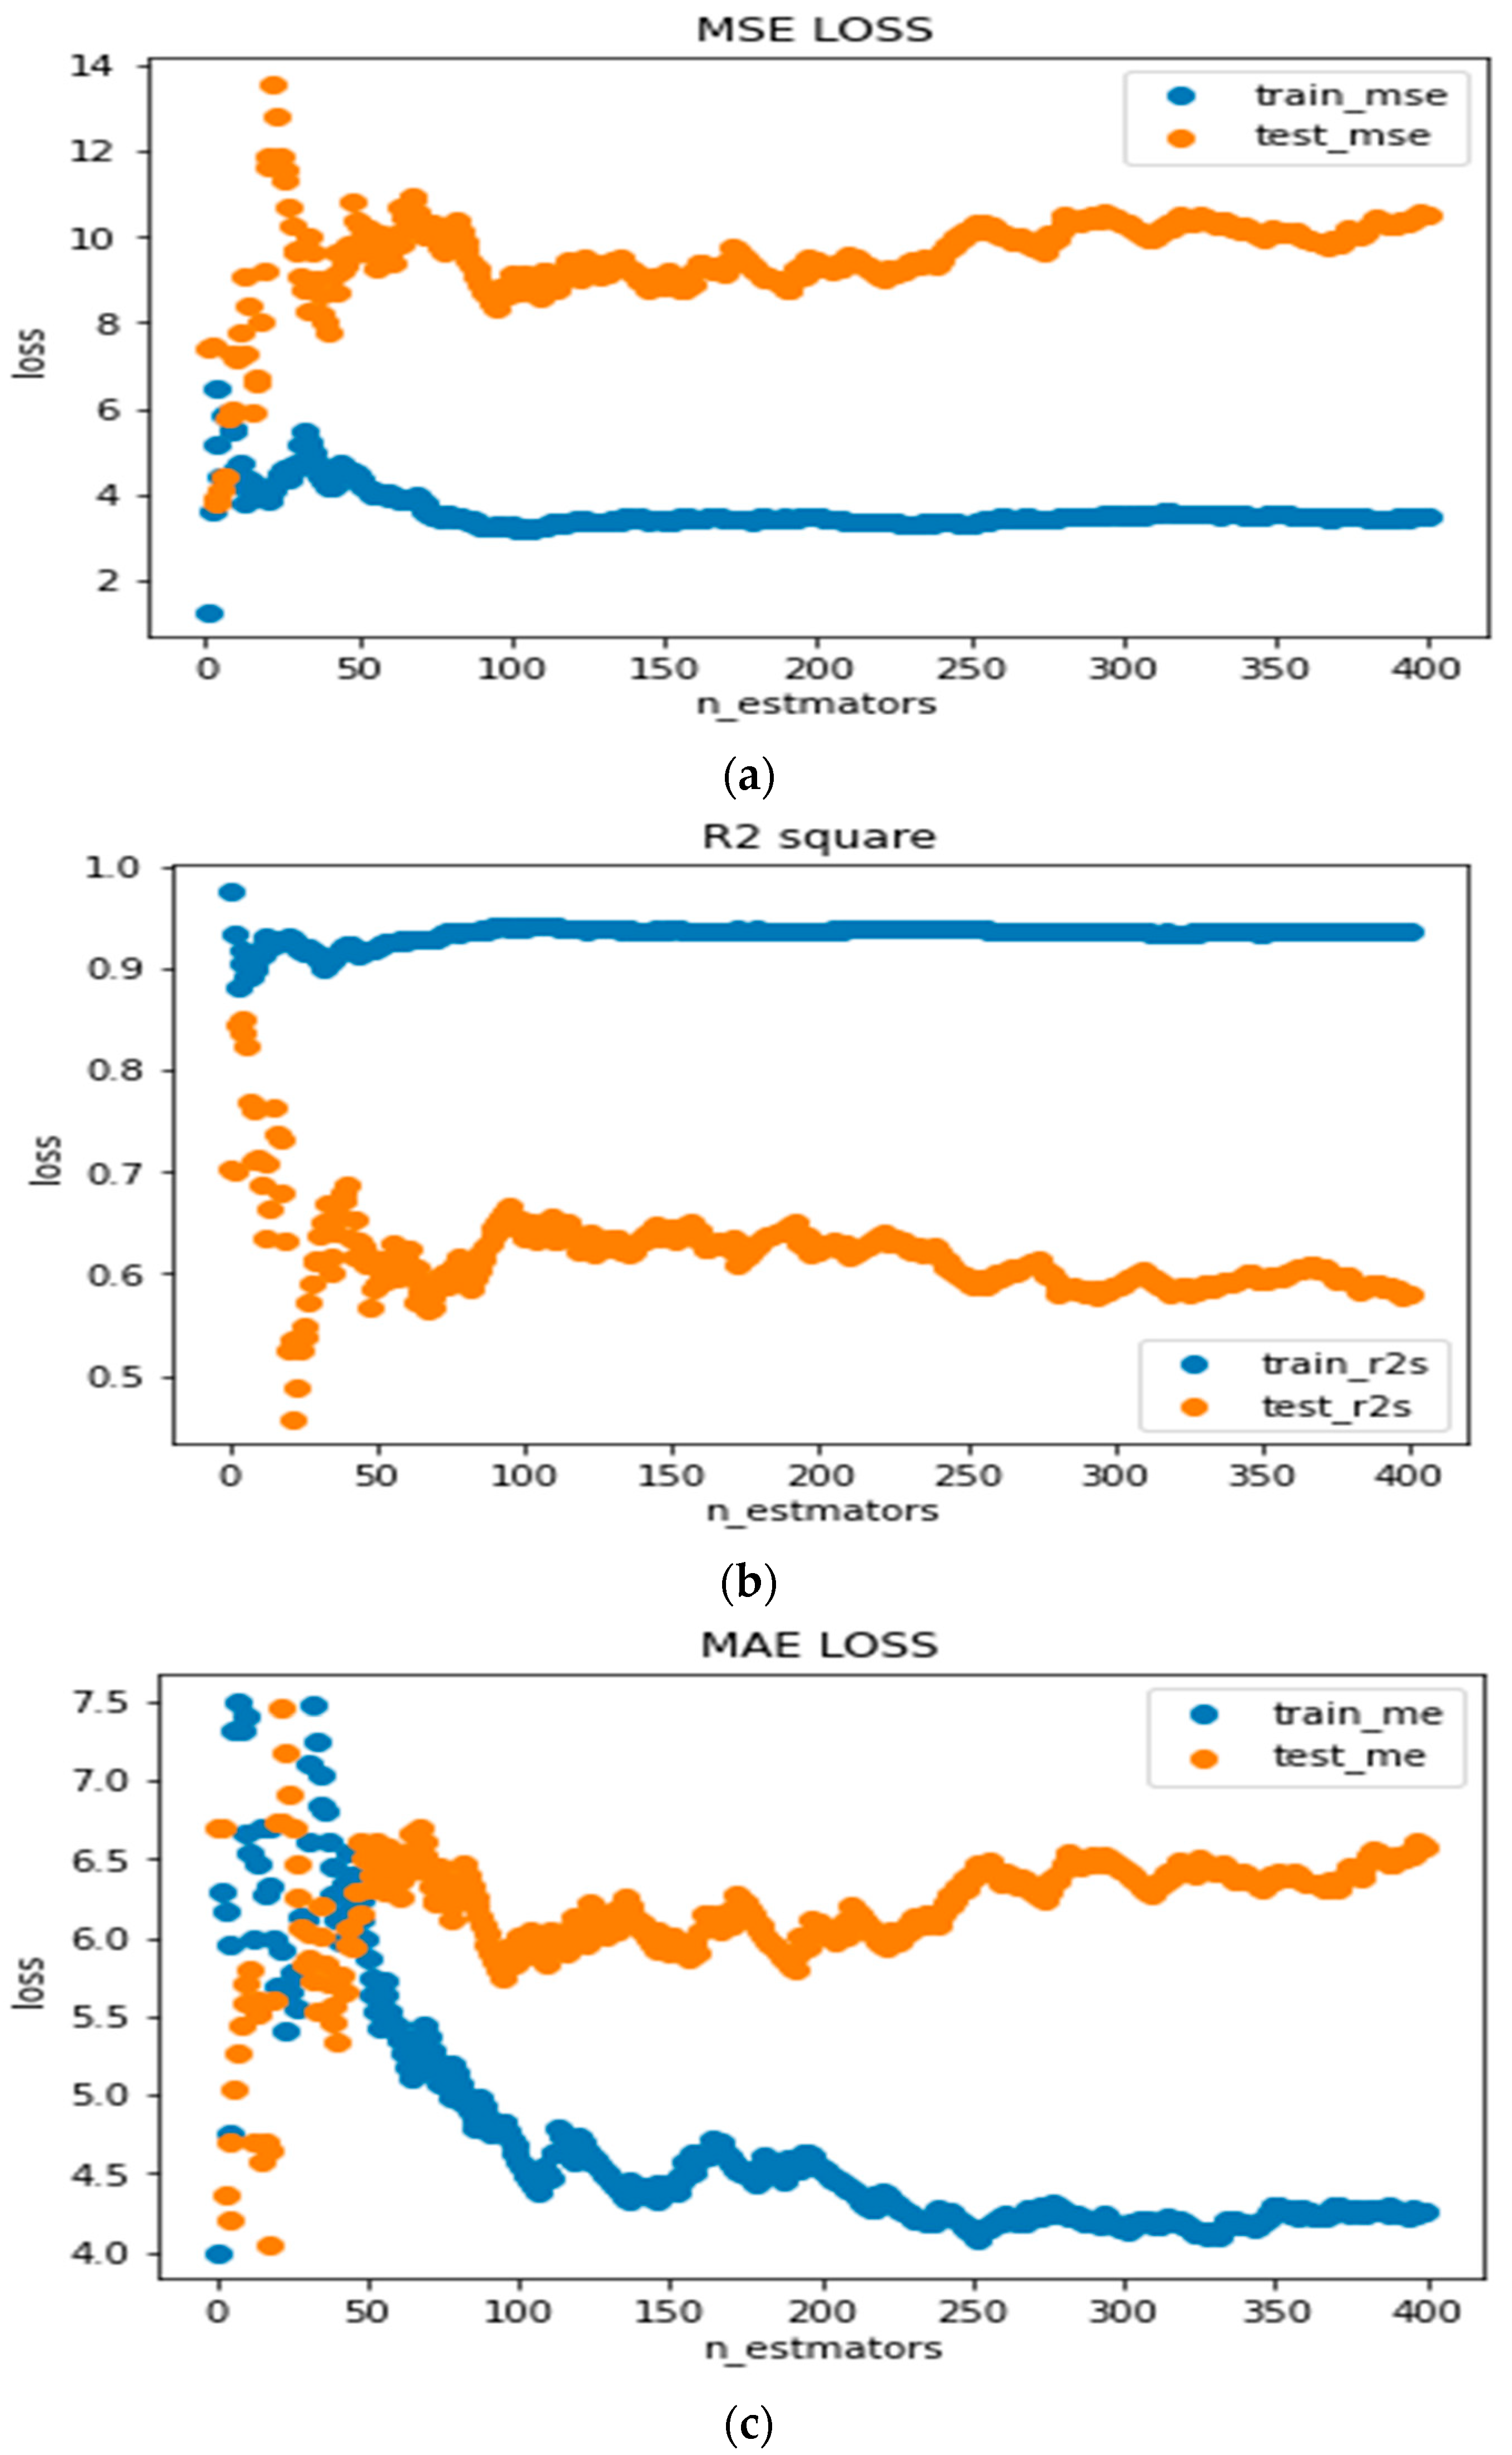
- The highest R2 score and the fewest other errors have shown some positive results with appropriate dimensions [26]. Figure 3, has an R2 score of 0.93, which show that model is highly trained.The mean MSE for RFR is 6.35 and 5.803 for training and testing data. The predictive precision and widespread potential of the RFR are high [11]. There is a loss of training and testing data that can be sorted when the model is taught from an enormous dataset. For MAE, the average MAE is 1.826 and 2.288 for training and testing. Losses are not so much in training as they are in testing data [27].Figure 3. Losses in RFR. (a) MSE Losses in RFR (b) R2 Losses in RFR (c) MAE losses in RFR.
![Jcs 05 00271 g003]()
- (5)
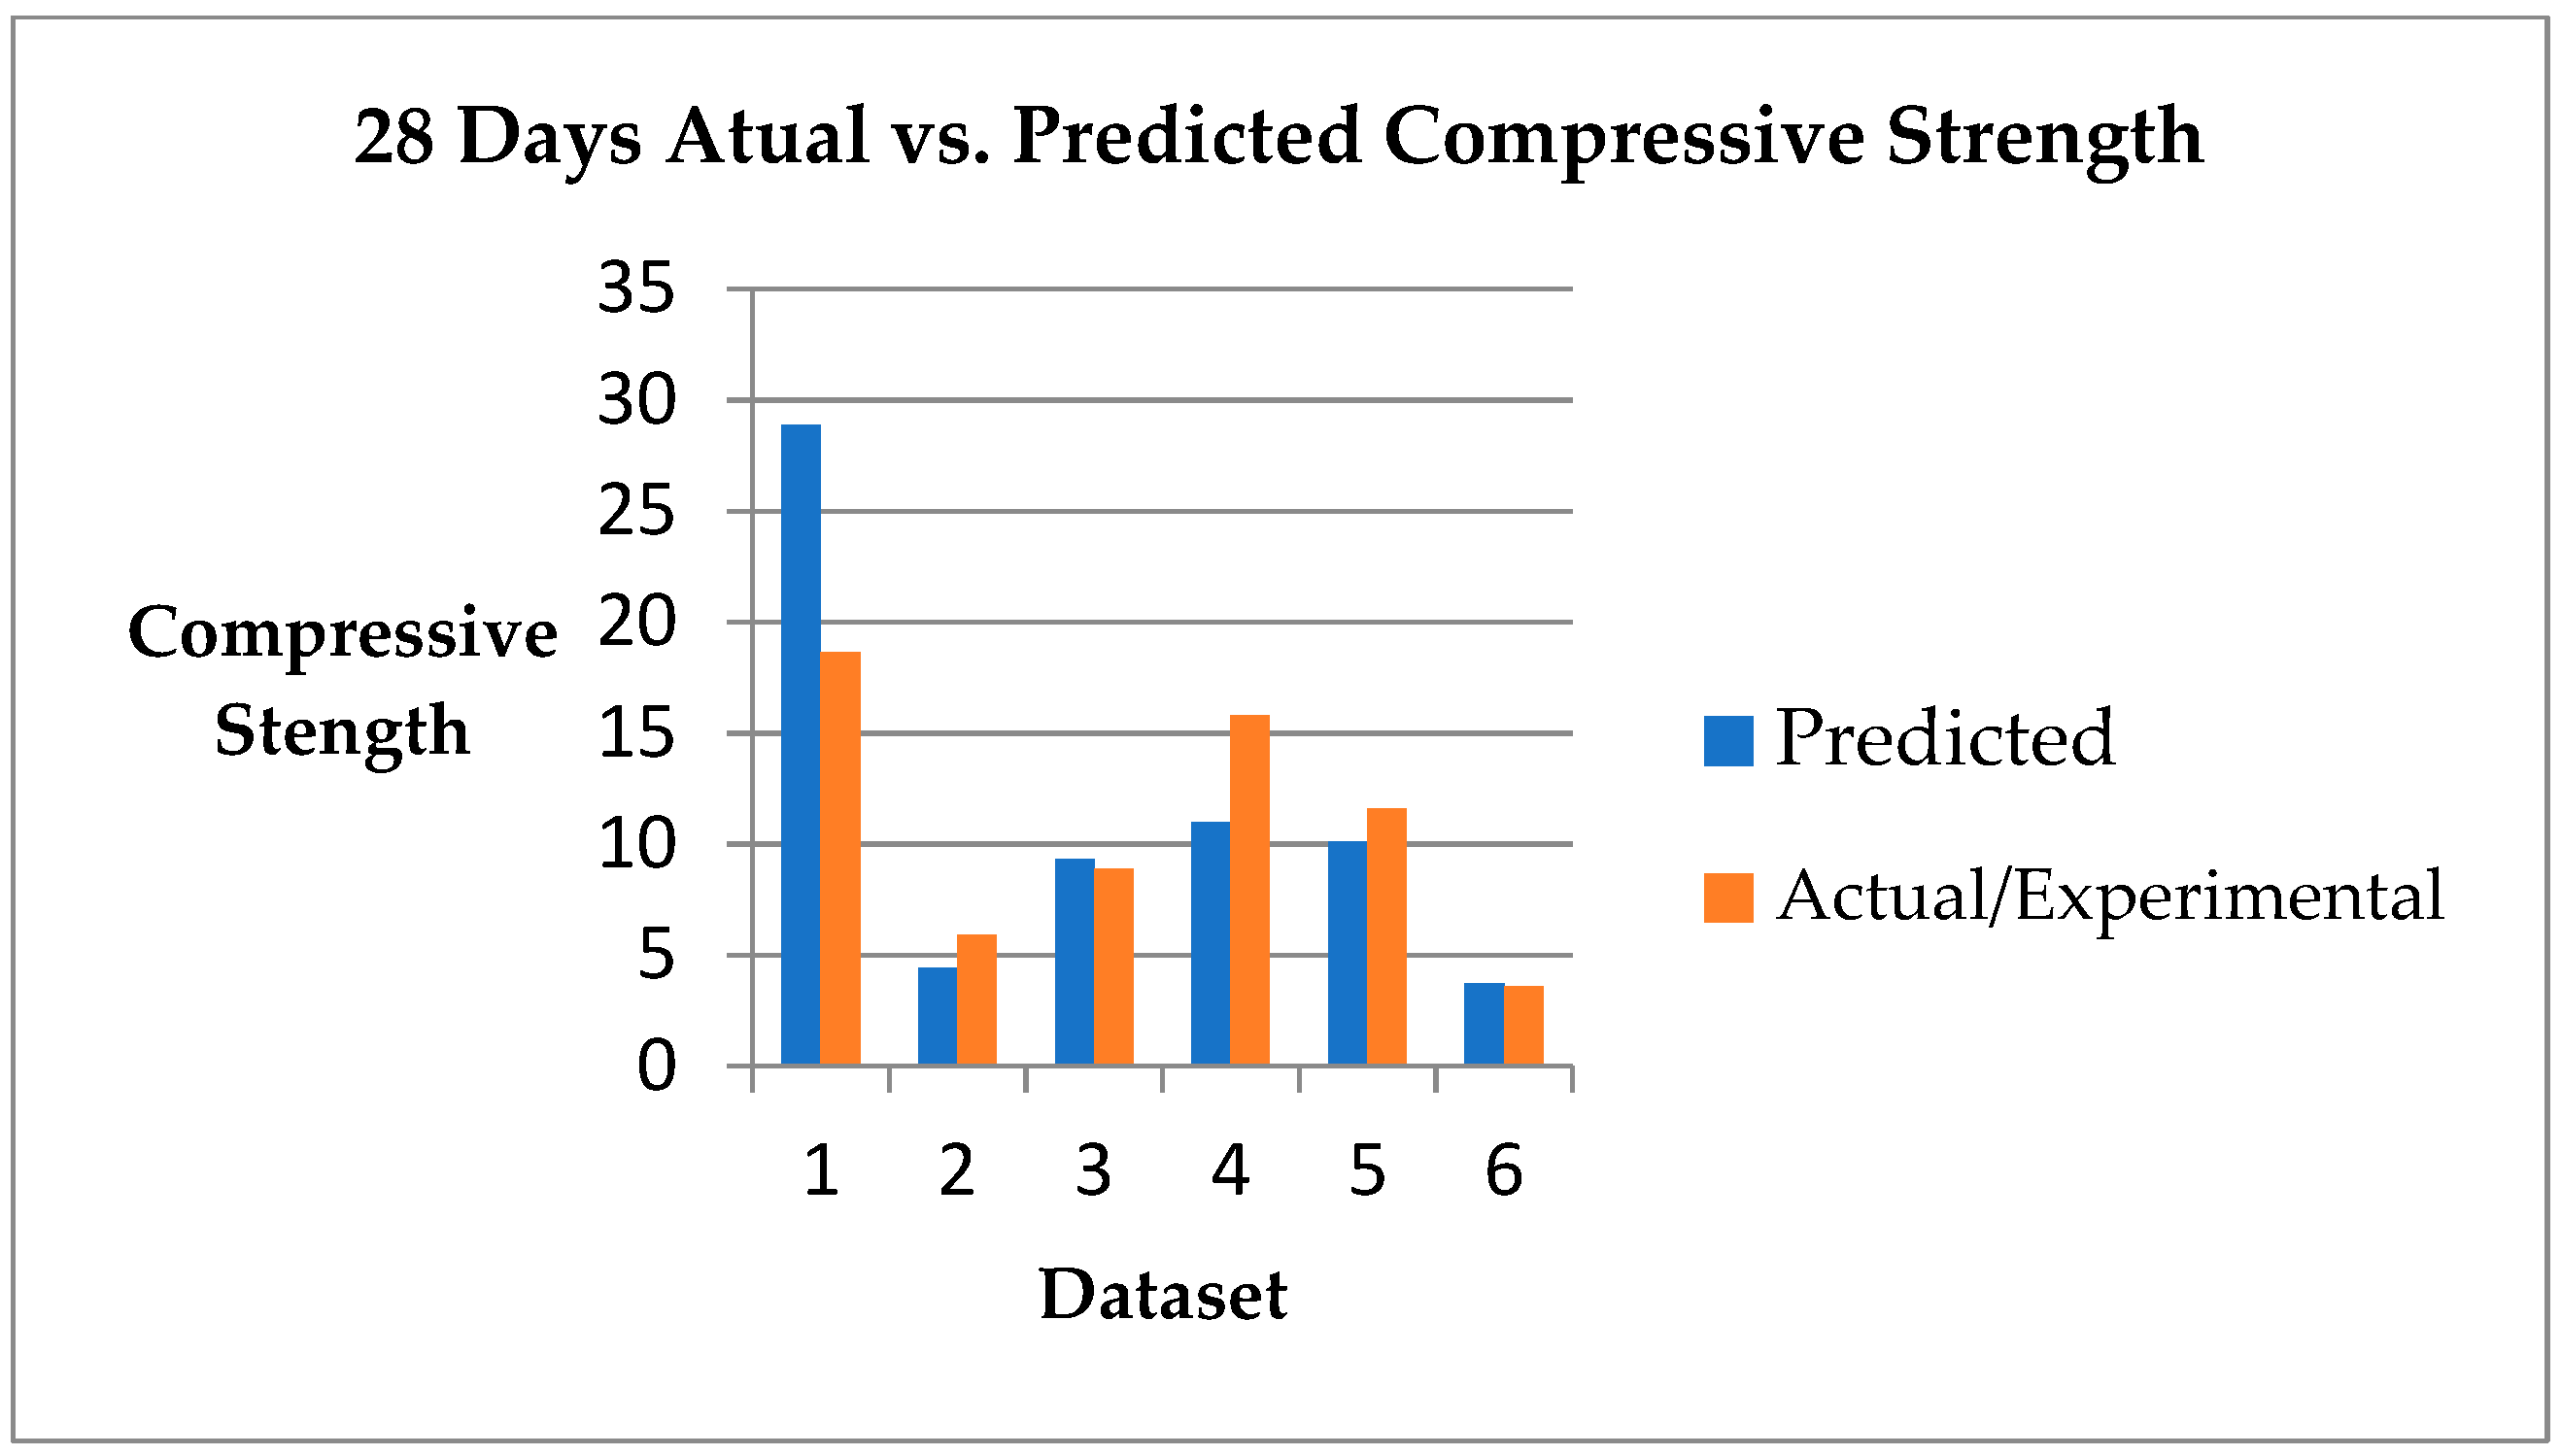
- Figure 4 and Figure 5 show a graphical representation of experiment value (actual) and projected strength due to compression of fly-ash, calcined-clay-based geopolymer concrete at various temperatures, using RFR supervised learning algorithms for the training and testing phases. These data show that RFR models performed as per training and testing in forecasting geopolymer concrete compressive strength at various temperatures in terms of statistical performance.Figure 4. Graphical representation of experimental value (actual) and projected strength due to compression of fly-ash, calcined -clay-based geopolymer concrete.Figure 4. Graphical representation of experimental value (actual) and projected strength due to compression of fly-ash, calcined -clay-based geopolymer concrete.
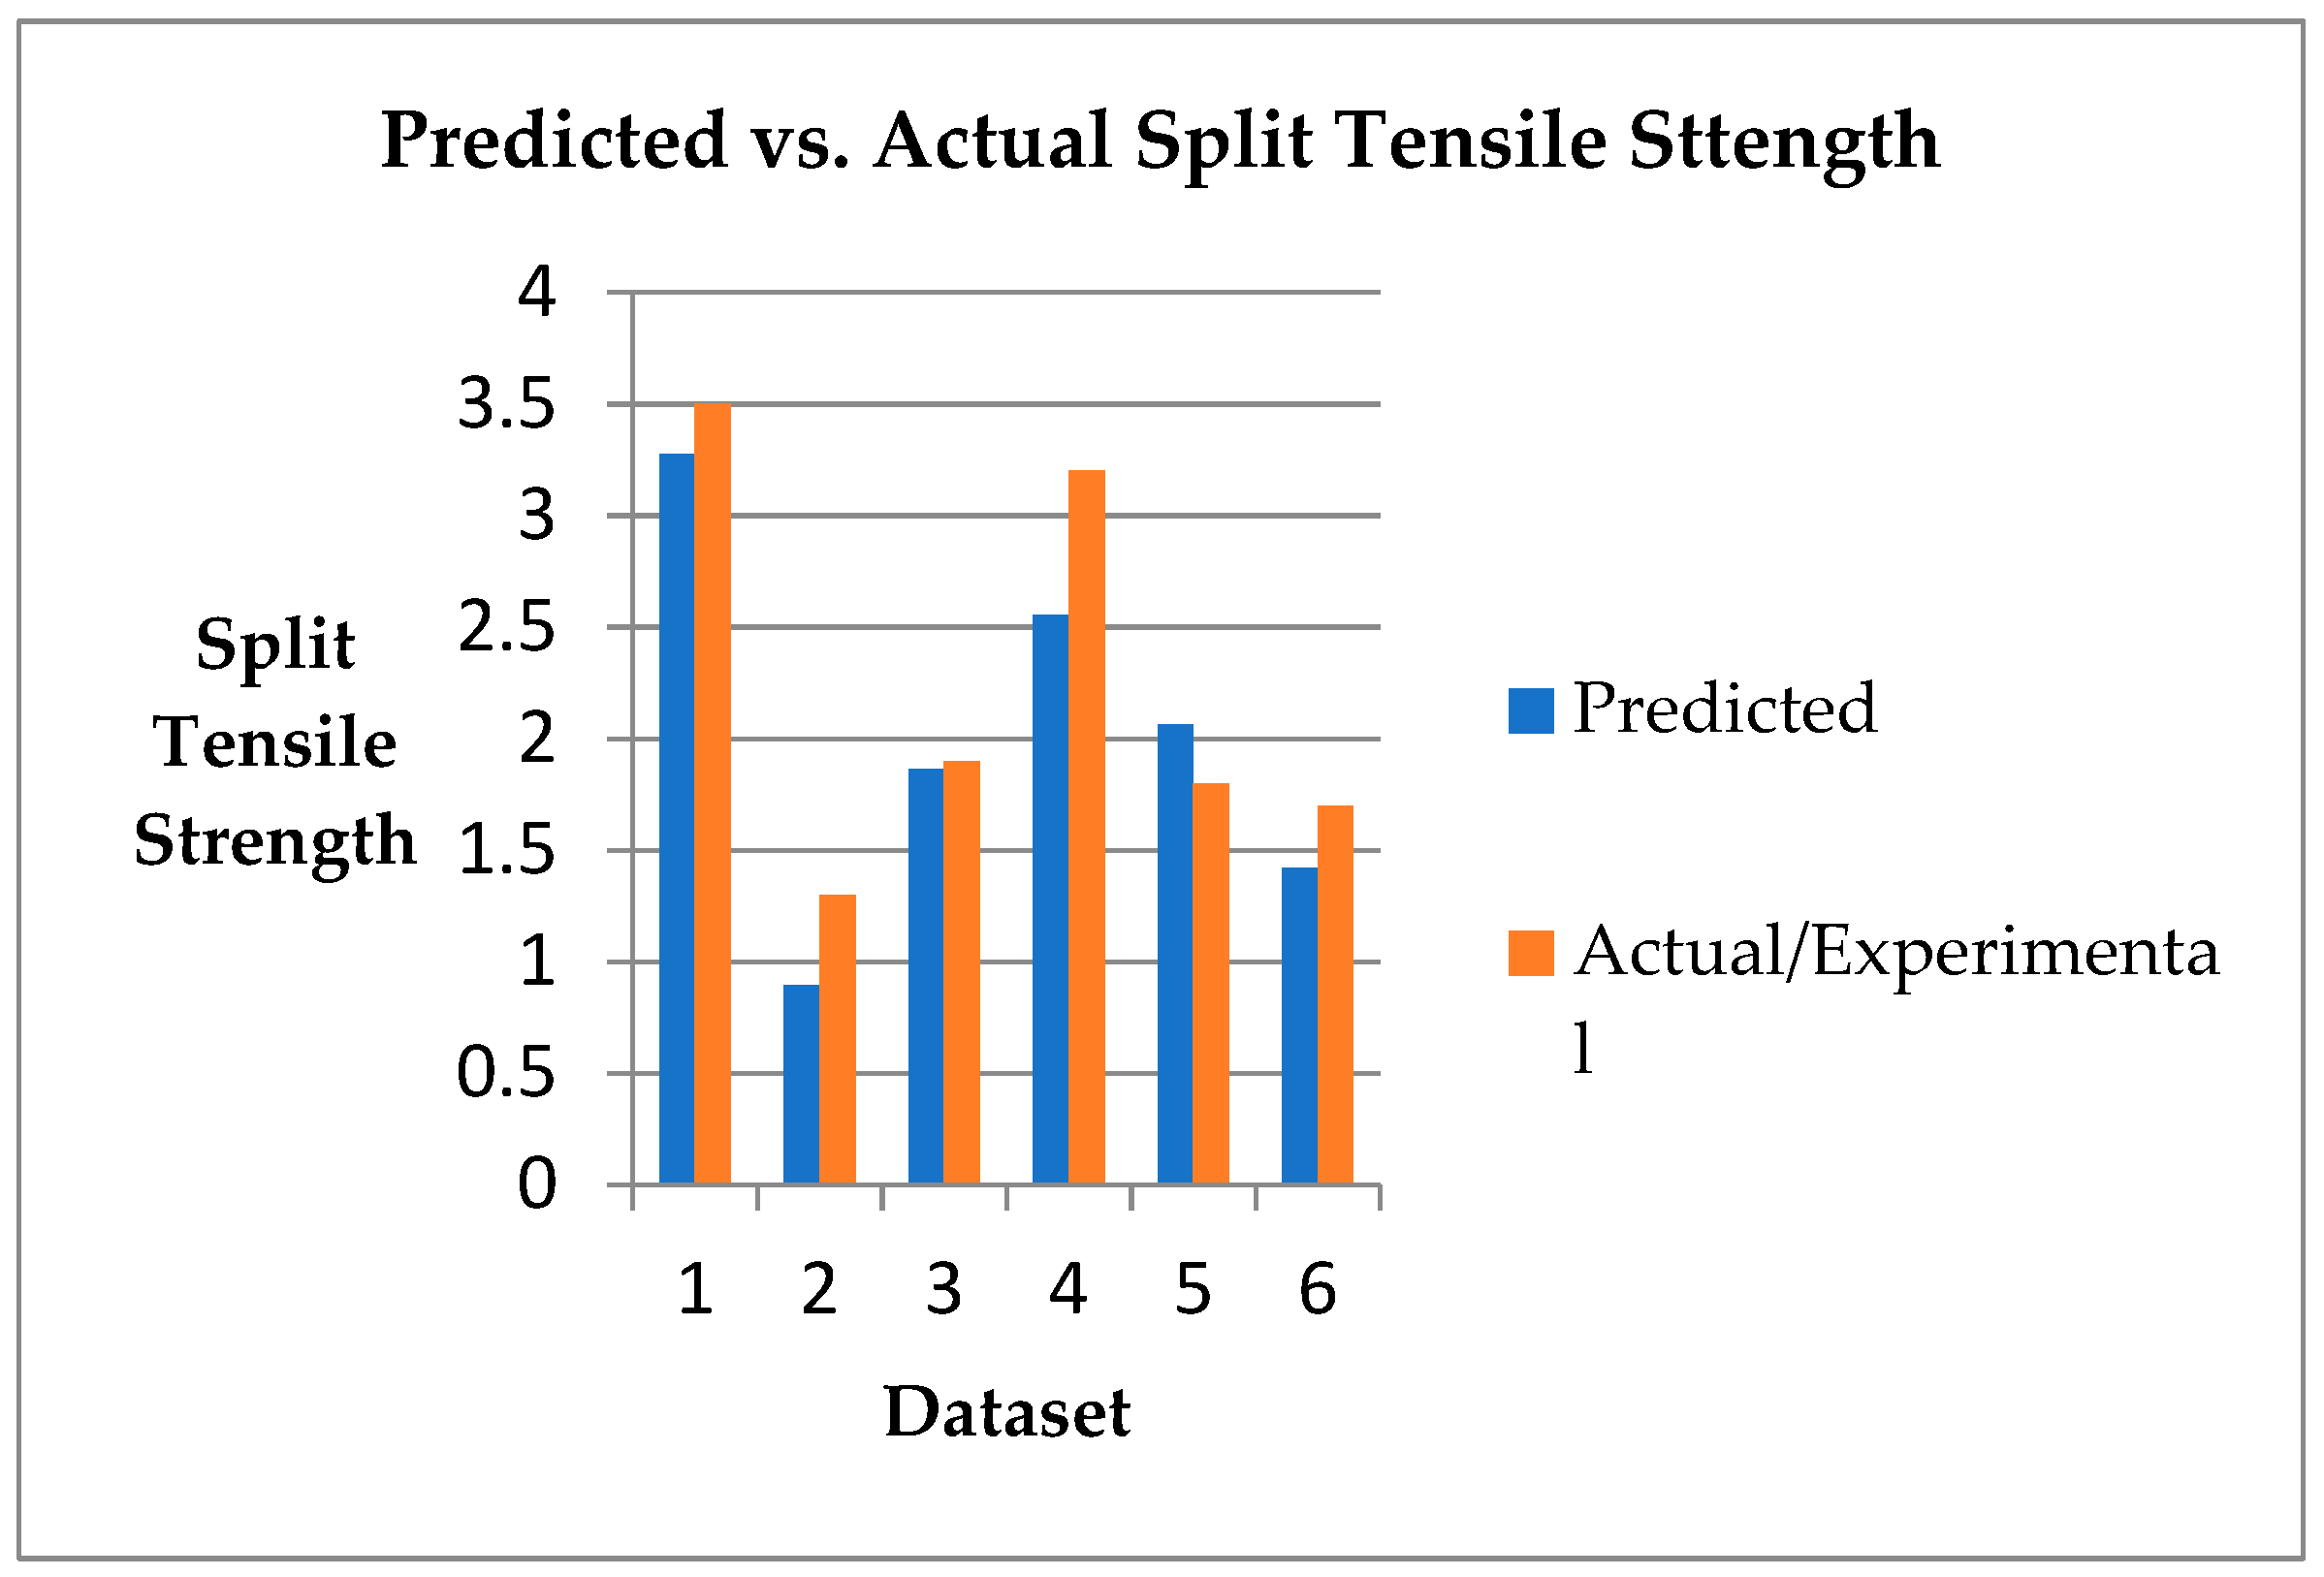
![Jcs 05 00271 g004]() Figure 5. Graphical representation of experimental value (actual) and projected split tensile strength of fly-ash, calcined-clay-based geopolymer concrete.Figure 5. Graphical representation of experimental value (actual) and projected split tensile strength of fly-ash, calcined-clay-based geopolymer concrete.
Figure 5. Graphical representation of experimental value (actual) and projected split tensile strength of fly-ash, calcined-clay-based geopolymer concrete.Figure 5. Graphical representation of experimental value (actual) and projected split tensile strength of fly-ash, calcined-clay-based geopolymer concrete.![Jcs 05 00271 g005]()
- (6)
- Supervised learning models, such as other artificial intelligence systems, have a limited range of scope and are heavily case-dependent. As a result, their generalizability is constrained, and therefore can only be used with a limited collection of trained data. Moreover, in contrast to other models, the created RFR model is capable of correctly and effectively predicting the compressive strength at varying temperatures. However, as the latest data arrive, this model can be adjusted to perform better.


5. Conclusions
- In this work, RFR was used to predict the compressive strength at ambient temperature, 80 °C, and 100 °C curing temperature for 24 and 48 h. The best result was shown by FACC geopolymer concrete for 5% calcined clay and 12 M NaOH solution at 100 °C for 48 h curing.
- The RFR model’s predictive skills were evaluated by using statistical measure criteria, such as R2, MAE, and RMSE. The R2 value comes out to be 0.58 for the testing phase of RFR, which is an acceptable value of the coefficient of correlation. The training results of R2 as 0.935 are also good for 28 days of compressive strength.
- The findings of the testing phase demonstrated that the supervised learning models developed in this work were successful in predicting geopolymer concrete compressive strength at various ranges of temperature. This paper predicted 28 days of compressive and tensile strength.
- Statistics research reveals that the RFR model is effective. Correctness is improved by reducing the erroneous gap between the actual and forecasted parameters. Various metrics, such as MAE, RMSE, R2, and MSE, were the deciding parameters.
- As a result, the use of RFR in the domain of forecasting compressive strength at various temperatures as an alternative to destructive testing methods is reasonable and can be considered as a viable option, and the same is applied to tensile strength.
- Due to the addition of weak classifiers (decision tree), random forest is an ensemble strategy that delivers a consistent performance between observed and forecasted values and gives the coefficient of determination R2 as 0.58.
Author Contributions
Funding
Institutional Review Board Statement
Informed Consent Statement
Data Availability Statement
Conflicts of Interest
Abbreviation
| Designation | Full Form |
| FACC | fly ash calcined clay |
| RFR | random forest regressor |
| NaOH | sodium hydroxide |
| Na2SiO3 | sodium silicate |
| GEP | genetic-algorithm-based |
| RMSE | root mean square error |
| MAE | mean absolute error |
| R2 | coefficient of correlation |
| MSE | mean squared error |
| GGBFs | ground granulated blast furnace slag |
References
- Aprianti, S.E. A Huge Number of Artificial Waste Material Can Be Supplementary Cementitious Material (SCM) for Concrete Production—A Review Part II. J. Clean. Prod. 2017, 142, 121515. [Google Scholar] [CrossRef]
- Akbar, A.; Farooq, F.; Shafique, M.; Aslam, F.; Alyousef, R.; Alabduljabbar, H. Sugarcane bagasse ash-based engineered geopolymer mortar incorporating propylene fibers. J. Build. Eng. 2021, 33, 101492. [Google Scholar] [CrossRef]
- Meesala, C.R.; Verma, N.K.; Kumar, S. Critical review on fly-ash based geopolymer concrete. Struct. Concr. 2020, 21, 1013–1028. [Google Scholar] [CrossRef]
- Nordin, N.; Abdullah, M.M.A.B.; Tahir, M.F.M.; Sandu, A.V.; Hussin, K. Utilization of Fly Ash Waste As Construction Material. Int. J. Conserv. Sci. 2016, 7, 161–166. [Google Scholar]
- Benny, J. Behavior of Geopolymer Concrete Exposed to Elevated Temperatures. Ph.D. Thesis, School of Engineering Cochin University of Science and Technology, Kochi, India, 2015; pp. 1–181. [Google Scholar]
- Chu, H.-H.; Khan, M.A.; Javed, M.; Zafar, A.; Ijaz Khan, M.; Alabduljabbar, H.; Qayyum, S. Sustainable use of fly-ash: Use of gene-expression programming (GEP) and multi-expression programming (MEP) for forecasting the compressive strength geopolymer concrete. Ain Shams Eng. J. 2021, in press. [Google Scholar] [CrossRef]
- Duxson, P.; Provis, J.L. Designing Precursors for Geopolymer Cements. J. Am. Ceram. Soc. 2008, 91, 3864–3869. [Google Scholar] [CrossRef]
- Farooq, F.; Amin, M.N.; Khan, K.; Sadiq, M.R.; Javed, M.F.; Aslam, F.; Alyousef, R. A comparative study of random forest and genetic engineering programming for the prediction of compressive strength of high strength concrete (HSC). Appl. Sci. 2020, 10, 7330. [Google Scholar] [CrossRef]
- Abubakar, A.; Tabra, M. Predictive Capabilities of Multilayer Perceptron (MLP) in WEKA Algorithm for High Strength Concrete with Steel Fiber Addition. Cem. Based Compos. 2020, 2, 13–18. [Google Scholar] [CrossRef]
- Shaqadan, A. Prediction of concrete mix strength using random forest model. Int. J. Appl. Eng. Res. 2016, 11, 11024–11029. [Google Scholar]
- Pengcheng, L.; Xianguo, W.; Hongyu, C.; Tiemei, Z. Prediction of compressive strength of High-Performance Concrete by Random Forest algorithm. IOP Conf. Ser. Earth Environ. Sci. 2020, 552, 12020. [Google Scholar] [CrossRef]
- Mai, H.V.T.; Nguyen, T.A.; Ly, H.B.; Tran, V.Q. Prediction Compressive Strength of Concrete Containing GGBFS using Random Forest Model. Adv. Civ. Eng. 2021, 2021, 6671448. [Google Scholar] [CrossRef]
- Sun, Y.; Li, G.; Zhang, J.; Qian, D. Prediction of the Strength of Rubberized Concrete by an Evolved Random Forest Model. Adv. Civ. Eng. 2019, 2019, 5198583. [Google Scholar] [CrossRef] [Green Version]
- Fernández-Jiménez, A.; Palomo, A. Characterisation of fly ashes. Potential reactivity as alkaline cements. Fuel 2003, 82, 2259–2265. [Google Scholar] [CrossRef]
- Ogundiran, M.B.; Kumar, S. Synthesis of fly ash-calcined clay geopolymers: Reactivity, mechanical strength, structural and microstructural characteristics. Constr. Build. Mater. 2016, 125, 450–457. [Google Scholar] [CrossRef]
- Ho, T.K. Random decision forests. In Proceedings of the 3rd International Conference on Document Analysis and Recognition, Montreal, QC, Canada, 14–16 August 1995; Volume 1, pp. 278–282. [Google Scholar] [CrossRef]
- Breiman, L. Random forests. Mach. Learn. 2001, 45, 5–32. [Google Scholar] [CrossRef] [Green Version]
- Farnaaz, N.; Jabbar, M.A. Random Forest Modeling for Network Intrusion Detection System. Procedia Comput. Sci. 2016, 89, 213–217. [Google Scholar] [CrossRef] [Green Version]
- Rodriguez-Galiano, V.; Castillo, M.S.; Chica-Olmo, M.; Rivas, M.C. Machine learning predictive models for mineral prospectivity: An evaluation of Neural Networks, Random Forest, Regression Trees and Support Vector machines. Ore Geol. Rev. 2015, 71, 804–818. [Google Scholar] [CrossRef]
- Kulkarni, V.Y.; Sinha, P.K. Pruning of Random Forest classifiers: A survey and future directions. In Proceedings of the 2012 International Conference on Data Science & Engineering (ICDSE), Cochin, India, 18–20 July 2012; pp. 64–68. [Google Scholar] [CrossRef]
- Farooq, F.; Ahmed, W.; Akbar, A.; Aslam, F.; Alyousef, R. Predictive modeling for sustainable high-performance concrete from industrial wastes: A comparison and optimization of models using ensemble learners. J. Clean. Prod. 2021, 292, 126032. [Google Scholar] [CrossRef]
- Singh, B.; Sihag, P.; Tomar, A. Estimation of compressive strength of high-strength concrete by random forest and M5P model tree approaches. J. Mater. Eng. Struct. 2019, 6, 583–592. [Google Scholar]
- Marani, A.; Nehdi, M.L. Machine learning prediction of compressive strength for phase change materials integrated cementitious composites. Constr. Build. Mater. 2020, 265, 120286. [Google Scholar] [CrossRef]
- Ali Khan, M.; Zafar, A.; Akbar, A.; Javed, M.F.; Mosavi, A. Application of Gene Expression Programming (GEP) for the Prediction of Compressive Strength of Geopolymer Concrete. Materials 2021, 14, 1106. [Google Scholar] [CrossRef] [PubMed]
- Moore, D.S.; Notz, W.; Fligner, M.A. The Basic Practice of Statistics; W.H. Freeman and Company: New York, NY, USA, 2013; Available online: https://books.google.co.in/books?id=aw61ygAACAAJ (accessed on 27 September 2021).
- Han, Q.; Gui, C.; Xu, J.; Lacidogna, G. A generalized method to predict the compressive strength of high-performance concrete by improved random forest algorithm. Constr. Build. Mater. 2019, 226, 734–742. [Google Scholar] [CrossRef]
- Young, B.A.; Hall, A.; Pilon, L.; Gupta, P.; Sant, G. Can the compressive strength of concrete be estimated from knowledge of the mixture proportions?: New insights from statistical analysis and machine learning methods. Cem. Concr. Res. 2019, 115, 379–388. [Google Scholar] [CrossRef]


| Reference | Model | Output Description |
|---|---|---|
| [7] | RFR | Compressive strength of cement |
| [8] | RFR and Backpropagation neural network | Strength due to compression of cement/fly-ash-based high-performance composite |
| [9] | RFR and GEP | Compressive strength of high strength composite |
| [10] | RFR | Strength due to compression of GGBFS composite. |
| [11] | RFR | Strength due to compression of GGBFS rubberized geopolymer composite compressive strength |
| Component | Composition |
|---|---|
| Silica | 50–52.5 |
| Alumina | 28.5–30.5 |
| Ferric oxide | 2–3 |
| Calcium oxide | 6–9.5 |
| Magnesium oxide | 2–2.5 |
| Potassium oxide | <1 |
| Na equivalent | <1.5 |
| Titanium dioxide | 1.5–2.0 |
| Component | SiO2 | Water | Na2O |
|---|---|---|---|
| Composition | 33 | 53.5 | 13.5 |
| Serial No. | Property | Natural Sand | Stone Dust | IS Codes |
|---|---|---|---|---|
| 1 | Specific Gravity | 2.6 | 2.53–2.68 | IS2386(Part III)-1963 |
| 2 | Bulk Density | 1460 | 1710–1850 | IS2386(Part III)-1963 |
| 3 | Absorption | nil | 1.2–1.5 | IS2386(Part III)-1963 |
| 4 | Moisture Content | 1.5 | nil | IS2386(Part III)-1963 |
| 5 | Sieve Analysis | Zone II | Zone II | IS 383-1970 |
| Samples | FA (%) | CC (%) | NaOH (M) | Temperature Curing (°C) | Duration of Curing (h) | Aging Time (days) | Added Water |
|---|---|---|---|---|---|---|---|
| 5C1FA | 95 | 5 | 12 | 30 | 24 | 28 | 56.92 |
| 5C2FA | 95 | 5 | 12 | 80 | 24 | 28 | 56.92 |
| 5C3FA | 95 | 5 | 12 | 80 | 48 | 28 | 56.92 |
| 5C4FA | 5 | 5 | 12 | 100 | 24 | 28 | 56.92 |
| 5C5FA | 95 | 5 | 12 | 100 | 48 | 28 | 56.92 |
| 5C6FA | 95 | 5 | 14 | 30 | 24 | 28 | 39.5 |
| 5C7FA | 95 | 5 | 14 | 80 | 24 | 28 | 39.5 |
| 5C8FA | 95 | 5 | 14 | 80 | 48 | 28 | 39.5 |
| 5C9FA | 95 | 5 | 14 | 100 | 24 | 28 | 39.5 |
| 5C10FA | 95 | 5 | 14 | 100 | 48 | 28 | 39.5 |
| 5C11FA | 95 | 5 | 16 | 30 | 24 | 28 | 47.36 |
| 5C12FA | 95 | 5 | 16 | 80 | 24 | 28 | 47.36 |
| 5C13FA | 95 | 5 | 16 | 80 | 48 | 28 | 47.36 |
| 5C14FA | 95 | 5 | 16 | 100 | 24 | 28 | 47.36 |
| 5C15FA | 95 | 5 | 16 | 100 | 48 | 28 | 47.36 |
| 10C1FA | 90 | 10 | 12 | 30 | 24 | 28 | 59.2 |
| 10C2FA | 90 | 10 | 12 | 80 | 24 | 28 | 59.2 |
| 10C3FA | 90 | 10 | 12 | 80 | 48 | 28 | 59.2 |
| 10C4FA | 90 | 10 | 12 | 100 | 24 | 28 | 59.2 |
| 10C5FA | 90 | 10 | 12 | 100 | 48 | 28 | 59.2 |
| 10C6FA | 90 | 10 | 14 | 30 | 24 | 28 | 49.3 |
| 10C7FA | 90 | 10 | 14 | 80 | 24 | 28 | 49.3 |
| 10C8FA | 90 | 10 | 14 | 80 | 48 | 28 | 49.3 |
| 10C9FA | 90 | 10 | 14 | 100 | 24 | 28 | 49.3 |
| 10C10FA | 90 | 10 | 14 | 100 | 48 | 28 | 49.3 |
| 15C1FA | 85 | 15 | 14 | 30 | 24 | 28 | 45.3 |
| 15C2FA | 85 | 15 | 14 | 80 | 24 | 28 | 45.3 |
| 15C3FA | 85 | 15 | 14 | 80 | 48 | 28 | 45.3 |
| 15C4FA | 85 | 15 | 14 | 100 | 24 | 28 | 45.3 |
| 15C5FA | 85 | 15 | 14 | 100 | 48 | 28 | 45.3 |
| 15C6FA | 85 | 15 | 16 | 30 | 24 | 28 | 51.3 |
| 15C7FA | 85 | 15 | 16 | 80 | 24 | 28 | 51.3 |
| 15C8FA | 85 | 15 | 16 | 80 | 48 | 28 | 51.3 |
| 15C9FA | 85 | 15 | 16 | 100 | 24 | 28 | 51.3 |
| 15C10FA | 85 | 15 | 16 | 100 | 48 | 28 | 51.3 |
| Model | Results of Training Performance | |||
|---|---|---|---|---|
| MSE | RMSE | R2 | MAE | |
| RFR | 6.83 | 2.61 | 0.93 | 1.85 |
| Model | Results of Testing Performance | |||
|---|---|---|---|---|
| MSE | RMSE | R2 | MAE | |
| RFR | 10.41 | 3.23 | 0.58 | 3.07 |
| Model | Results of Training Performance | |||
|---|---|---|---|---|
| MSE | RMSE | R2 | MAE | |
| RFR | 0.065 | 0.256 | 0.88 | 0.213 |
| Model | Results of Testing Performance | |||
|---|---|---|---|---|
| MSE | RMSE | R2 | MAE | |
| RFR | 0.28 | 0.53 | 0.57 | 0.36 |
Publisher’s Note: MDPI stays neutral with regard to jurisdictional claims in published maps and institutional affiliations. |
© 2021 by the authors. Licensee MDPI, Basel, Switzerland. This article is an open access article distributed under the terms and conditions of the Creative Commons Attribution (CC BY) license (https://creativecommons.org/licenses/by/4.0/).
Share and Cite
Gupta, P.; Gupta, N.; Saxena, K.K.; Goyal, S. Random Forest Modeling for Fly Ash-Calcined Clay Geopolymer Composite Strength Detection. J. Compos. Sci. 2021, 5, 271. https://doi.org/10.3390/jcs5100271
Gupta P, Gupta N, Saxena KK, Goyal S. Random Forest Modeling for Fly Ash-Calcined Clay Geopolymer Composite Strength Detection. Journal of Composites Science. 2021; 5(10):271. https://doi.org/10.3390/jcs5100271
Chicago/Turabian StyleGupta, Priyanka, Nakul Gupta, Kuldeep K. Saxena, and Sudhir Goyal. 2021. "Random Forest Modeling for Fly Ash-Calcined Clay Geopolymer Composite Strength Detection" Journal of Composites Science 5, no. 10: 271. https://doi.org/10.3390/jcs5100271