Article

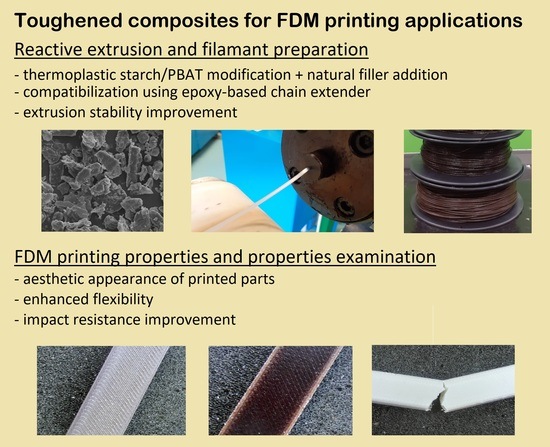
The Use of Agricultural Waste in the Modification of Poly(lactic acid)-Based Composites Intended for 3D Printing Applications. The Use of Toughened Blend Systems to Improve Mechanical Properties

1
Polymer Processing Division, Institute of Materials Technology, Faculty of Mechanical Engineering, Poznan University of Technology, Piotrowo 3 Street, 61-138 Poznan, Poland
2
Student Research Group MATRIX, Poznan University of Technology, Jan Pawel II Street, 61-138 Poznan, Poland
3
Faculty of Chemical Technology and Engineering, Bydgoszcz University of Science and Technology, Seminaryjna 3 Street, 85-326 Bydgoszcz, Poland
*
Author to whom correspondence should be addressed.
J. Compos. Sci. 2021, 5(10), 253; https://doi.org/10.3390/jcs5100253
Submission received: 11 August 2021 / Revised: 13 September 2021 / Accepted: 18 September 2021 / Published: 22 September 2021
(This article belongs to the Special Issue Polymer Composites: Fabrication and Applications)

Abstract

:
The presented research focused on improving the mechanical properties of PLA-based composites reinforced with buckwheat husks (BH) particles. The research work was carried out in two stages. Firstly, the blend was prepared with the addition of polybutylene adipate terephthalate (PBAT) and thermoplastic starch (TPS), manufactured by injection molding technique, then the selected materials were prepared with the addition of BH filler, and the samples were prepared using the fused deposition modeling method (FDM). All samples were subjected to the assessment of material properties. Thermal and thermomechanical properties were evaluated using differential scanning calorimetry analysis (DSC) and dynamic thermal mechanical analysis (DMTA). Mechanical characteristic was evaluated using static tensile and flexural measurements and Charpy impact resistance tests. The research was supplemented with scanning electron microscopy analysis (SEM). It was found that the addition of PBAT and TPS greatly improves impact strength and elongation, especially with the addition of reactive compatibilizer. As expected, TPS, PBAT, and BH reduced the stiffness of the composites during DMTA testing. The presence of BH particles in the polymer matrix was observed to improve the crystallization behavior of PLA. The optimal content of BH filler in the composite was found to be 10%, which allowed to preserve good mechanical properties.

Graphical Abstract

1. Introduction

Poly(lactic acid) (PLA) is known for its biobased origin and biodegradability [1], for which features turn out to be crucial in the case of the latest trends in sustainable development policies. The advantages of PLA are mainly used in the packaging industry, which is currently the largest field of application of biopolymers [2]. Despite numerous limitations concerning traditional packaging materials based on PE, PP, or PET, the use of biopolymers in this industry is mainly caused by accelerated degradation of these materials. The phenomenon of PLA degradation, similarly to other biopolymers, may have a different genesis. However, the most commonly used term is biodegradation. This term is often used for marketing purposes. At the same time, the degradation phenomenon is often more complex and related to the presence of several phenomena such as hydrolytic degradation, microbial degradation, enzymatic degradation, or photodegradation. Considering that most of the tests on PLA decomposition phenomena were carried out in composting conditions, at high humidity and temperature, the assessment of the influence of biological processes on PLA decomposition cannot be estimated.
The degradation phenomenon facilitates the utilization of PLA and other biopolymers and is only one of the positive aspects of applying this type of material. The application of sustainable polymers allows the manufacturer to reduce the carbon footprint not only during the afterlife of the product, but also at the stage of synthesis and production of biopolymers. According to the European Union guidelines, by 2050, all member states’ economics should achieve net-zero carbon emissions to avoid further negative impacts of climate change. Blends based entirely on sustainable, biodegradable polymers are broken down to simpler molecules such as CO2 and water [3,4], ensured that the proper composting environment is provided. Furthermore, captured carbon emission can be used in farming [5] or producing new polymers [4]. Thanks to that, the problem of landfilling or waste incineration is reduced to a minimum. Therefore, it is highly desirable, from the environmental standpoint, to develop future polymeric materials based entirely on renewable resources, which could replace their fossil fuel-derived counterparts. This is why one of the promising candidates is PLA blends.
Apart from the packaging and biomedical industry, PLA is not suitable for application areas where high plasticity and toughness are desired. In technical applications, the high brittleness of PLA turns out to be a particularly important restriction. Previous attempts to improve the impact properties of PLA have included the use of different types of physical method, such as mechanical rejuvenation [6,7], nanofibrillation [8,9], annealing treatment, or nanofiller addition [10,11,12]. However, most researchers [13,14,15,16,17,18,19] tried to improve the properties using rubbery polymers or plasticizers. In many studies, PLA toughness was improved by using standard type of impact modifiers, such as elastomeric core–shell-type copolymers [20,21,22,23]. Due to the typically petrochemical origin of most compounds used as impact modifiers, their use as additives to PLA is not an optimal solution. This is why other types of biopolymers, derived from naturally occurring substances in organisms such as plants or bacteria, seem to be more suitable for developing sustainable materials; for example, PBAT—polybutylene adipate terephthalate, TPS—thermoplastic starch, PBS—poly(butylene succinate) or PBSA—poly(butylene succinate-co-adipate).
The addition of PBAT and TPS was found to improve the elasticity/elongation of PLA-based compounds [4,24]; however, most studies indicate that using an effective compatibilizer is essential for obtaining the appropriate properties. Because of that, we decided to investigate the influence of chain extender (CE, styrene-acrylonitrile-glycidyl methacrylate, SAGM) on the properties of the PLA–PBAT and PLA–TPS blends. SAGM belongs to a group of reactive compatibilizers. Unlike plasticizers, which do not permanently combine with the polymer matrix, chain extenders are compounds that cause new chemical bond formation [25,26,27]. In addition to compounds such as SAGM, which are functionalized with oligomers, peroxides or isocyanates are also used. However, problems with the proper dosing of many compounds and the possibility of blend structure cross-linking [28] make chain extenders gain popularity as effective compatibilizers. Reactive CE compatibilizers significantly improve the toughness and elongation at the break of the PLA-based blends, which was already confirmed by many studies [18,29,30,31,32]. Interestingly, the addition of reactive compatibilizers also improves the fiber–matrix interface interactions for composites [33,34], especially for materials with the addition of the lignocellulosic fillers [35,36]. Our previous research on PLA/PBAT systems aimed to indicate the improvement of wettability of flax fibers with the addition of CE [37]. Due to hydroxyl groups presence on the surface of the natural fibers, it is possible to obtain a permanent connection with CE epoxy groups. Simultaneously, the high efficiency of bonding with hydroxyl and carboxyl groups in PLA causes the formation of chemical bonds between CE and matrix polymer, contributing to improving the composite interface adhesion. The high efficiency of CE compounds is also influenced by good miscibility with many matrix polymers. It is also possible that the CE compatibilizer is not miscible with any components of the blend but reacts with their functional groups. SAGM was found to compatibilize immiscible polymers, such as PLLA–ABS and PBAT–ABS systems [38,39].
It was noticed that biocomposites, especially reinforced with natural fillers, are prone to fast degradation during thermal processing [40,41,42]. Hence, the processing methods characterized by short processing time are best suited for biocomposites. A good example is 3D printing in FDM/FFF (fused deposition modeling/fused filament fabrication) technology. Fused filament fabrication is a method of additive manufacturing where a continuous filament of a thermoplastic material is extruded layer by layer and fused to create a three-dimensional object [43]. Filament is fed from a spool by an extruder, and later melted inside the heated nozzle. After leaving the nozzle, the polymer is deposited on the print bed [44]. The most common are Cartesian-style printers [45], where the print head usually moves in two dimensions and the print bed moves in one dimension. Other types of FDM printers are gaining popularity, such as delta and core XY styles, but they require more complex maintenance. In addition, the acquisition cost is usually higher in comparison to the Cartesian-style printers. Nevertheless, these types of printers can achieve higher printing speeds without the loss in print quality [45,46].
Process parameters such as print speed, extrusion rate, temperature, print head, bed movement, etc., are controlled by a computer interface or are preset before the procedure and saved on an SD card, which is later inserted into the printer. FDM/FFF printing is the most popular additive manufacturing method and is widely used in various industries such as automotive [47], medical [48], and film industry [49], to name a few. It is primarily to produce low-cost prototypes and even final products when the production run is short [50]. Due to the continuous drop in the prices of 3D printers, these machines are becoming more and more common, not only in academia and industry, but also in public schools and households.
Research has successfully obtained 3D printing composites filled with wood flour [51,52], spruce wood hemicellulose [53], or softwood biorefinery lignin [54]. These additives modified not only the mechanical and thermal properties of the composites but also their appearance, so that they can be used to produce objects resembling natural wood, for example, in architectural applications [55]. The introduction of biomass into polymer blends may lead to problems associated with the reinforcement’s hydrophilic character [56,57,58]. Unfortunately, prolonged drying of the plant matter or even the processing temperature may deteriorate its visual properties due to the Maillard reaction occurrence [59,60]. Because of that, the most promising candidates for modification of polymer blends are particles and fibers derived from plants or insects, which are relatively dry, for example, coconut [61], insect exoskeletons [62], or chitosan [63]. In this study, as a biodegradable reinforcing agent, buckwheat (BH) particles were used, a byproduct of the agricultural and food industry.
The research’s main goal was to develop a composite material intended for processing by FDM printing technique with the best possible mechanical properties, in particular, impact strength. Buckwheat husk (BH) particles used in our research are only a representative example of a wide range of lignocellulosic waste that could be used as an alternative filler. The main assumption of the work was to conduct a comprehensive comparative analysis of two types of toughened polymer systems. As the reference, we used the PLA/PBAT blend system, while the main research compositions were based on PLA/TPS blends. TPS-based compounds are currently the cheapest type of biodegradable plastics; therefore, the possibility of using them as impact modifiers in the 3D printing technique seems to have an application potential.
Initial tests conducted using the injection molding technique showed that TPS-modified materials’ toughening efficiency was similar to PLA/PBAT blends. This is why we decided to use the developed blends as matrix materials during the preparation of FDM-printed BH-filled composites. Since the expected materials features are related to elongation and impact resistance, all samples were subjected to detailed mechanical analysis, including static tensile and flexural measurements and notched Charpy tests. DSC thermal analysis was performed to evaluate the differences in PLA crystallization, while DMTA measurements were carried out to compare the differences in sample stiffness in a broad range of temperatures. The research study is supplemented with SEM structure observations.

2. Experimental Section

2.1. Materials

The poly(lactic acid) type used during the study was PLA Ingeo 3001D (from the company NatureWorks, Minnetonka, MI, USA), and the MFI = 22 g/10 min (210 °C, 2.16 kg). This type of PLA was designed for injection molding applications. Polybutylene adipate terephthalate resin was PBAT Ecoflex C1200 (manufactured by BASF, Ludwigshafen, Germany), MFI = 2.7–4.9 g/10 min (190 °C, 2.16 kg). The thermoplastic starch blend used for this study was TPS BioPLAST 106/02 (from the company Biotec, Emmerich am Rhein, Germany), MFI = 3.7 g/10 min (190 °C, 5.0 kg). Both PBAT resin and TPS blend are intended for the production of packaging foils. In order to conduct a reactive extrusion process, we used an epoxy functionalized chain extender (CE) in the form of random styrene-acrylonitrile-glycidyl methacrylate terpolymer. The materials were supplied in the form of transparent pellets under the trade name SAG-008 (Fine-blends, Shanghai, China).
In order to prepare the composite materials, we used the milled buckwheat husk particles. The raw husk was milled using the Retsch ZM200 centrifugal mill. After grinding, the particles were subjected to the screening procedure, and the smallest particle size fraction of <50 µm was selected for mixing with the polymer matrix. The filler’s particle size distribution was characterized using laser particle sizer Fritsch ANALYSETTE 22 apparatus (Fritsch GmbH, Idar-Oberstein, Germany) operated in the range of 0.08–2000 μm. The analysis was performed for as-received miller filler and sieved powder (<50 μm sieve).
The appearance of the final BH filler, after the milling/sieving procedure, is presented in Figure 1. The comparison of the size distribution for the milled BH particles and the sieved filler is illustrated in Figure 2. The analysis clearly shows that for the milled material, the fraction with the highest population was about 200 µm in size, while there was also a significant amount of particles larger than 500 µm. For the sample subjected to the sieving procedure, the largest fraction was about 20 µm in size, while the content of particles over 100 µm in size was negligible. The screening procedure was carried out to ensure the homogeneity of the material intended for printing. Since the standard size of the nozzles for FDM printing is 0.4 or 0.5 mm, the presence of larger particles could cause problems with the clogging of the nozzle channel.

2.2. Sample Preparation

In addition to the described milling and screening procedure, the remaining material samples were prepared during the melt mixing process on the extruder to prepare the granulate, which was then used to obtain injected or printed samples. Before processing, all materials were dried for 12 h at 70 °C for polymeric materials, and in a 100 °C for buckwheat particles (BH).
Corotating twin-screw extruder ZAMAK EH16D (Zamak-Mercator, Skawina, Poland) was used to prepare blends. The screw speed was set to 100 rpm. The temperature profile, from the hopper to the die for the PLA/PBAT blends and composites was as follows: 180 °C–175 °C–175 °C–170 °C–170 °C–165 °C–165 °C–160 °C–155 °C. The temperature profile was modified for the PLA/TPS-based materials to 170 °C–170 °C–165 °C–165 °C–165 °C–160 °C–160 °C–155 °C–155 °C. According to our preliminary tests, for TPS containing compounds, the processing at temperature of 175–180 °C may result in a rapid degradation of the material. Therefore, the operating temperature of the machine cylinder was reduced.
Injection molding was conducted on ENGEL ES 80/20 HLS machine (Engel GmbH, Schwertberg, Austria). Process parameters were as follows: injection pressure = 1050 bar, holding pressure 850 bar, injection temperature 190 °C, mold temperature = 25 °C, holding time = 8 s, cooling time = 60 s.
The filament intended for 3D printing was produced with the use of a single-screw extruder Metalchem W25-30D (IMPiB, Torun, Poland). The extrusion process was conducted at a temperature of 185 °C through a 3 mm die nozzle. The extruded strand was picked up by a conveyor belt and cooled by an array of fans. Throughout the cooling process, the filament was stretched to achieve its desired diameter of 1.75 mm. The filament was collected on a spool by the roller.
The 3D printed samples were prepared with the use of Prusa i3 MK3 (PrusaResearch, Prague, Czech Republic) and Slic3r PE software (1.41.2 version). The 0.8 mm brass nozzle was used to print specimens of each material with 100% infill density and layer height of 0.15 mm. A number of perimeters was kept at two and line width at 0.9 mm. Nozzle and bed temperature was set accordingly to 215 °C and 60 °C. The perimeters were printed with the speed of 50 mm/s, whereas solid infill was 80 mm/s.
In order to identify the material types, the sample names indicate the percentage of the soft polymer phase (PBAT or TPS) and the presence of a chain extender (CE). In the case of composite samples, the percentage of BH filler is given. The complete list of sample markings and their composition is shown in Table 1.
The appearance of the selected FDM-printed samples is presented in Figure 3 for PLA-based samples, Figure 4 for PLA/PBAT-based samples, and Figure 5 for PLA/TPS-based samples. In the case of the addition of natural fillers, there are considerable differences in the roughness of the surface, mainly of the extruded filament. Filament roughness does not have a direct impact on the surface quality of the manufactured part, because the material is extruded again through a nozzle with a relatively small diameter, in our case 0.8 mm. The increase in number of the surface defects is observed for all BH-filled samples, especially on the outer surface of the printed sample. The reason for the defects in the discussed case is the slightly too low height of a single print layer, 0.15 mm. However, taking into account that the high surface roughness for this type of material is one of the factors determining the aesthetic value of their application, we decided to focus mainly on other aspects of the material characteristics.

2.3. Properties Examination

2.3.1. Rotational Rheometer Measurements

An Anton Paar MCR 301 rheometer (Graz, Austria) was used to perform the rheological analysis. Small-amplitude oscillated shear tests (SAOS) were conducted using parallel plate geometry, the gap distance of 1 mm and a plate diameter of 25 mm. The frequency sweep measurements were conducted at 190 °C. The constant strain amplitude was set to 1%, while the frequency range varied from 0.05 to 500 rad/s. In order to determine the linear viscoelastic region (LVR), an initial strain sweep measurement was performed. The results of the viscoelastic properties were collected in the form of complex viscosity plots.

2.3.2. Thermal Properties Analysis

Differential scanning calorimetry (DSC) measurements were carried out on a Netzsch DSC 204 F1 Phoenix apparatus using pierced aluminum crucibles under nitrogen atmosphere. Each of the tested samples had a mass of around 5 mg. First heating was performed with the speed of 10 °C/min up to the temperature of 220 °C. Cooling was conducted at the same rate as heating, and reached the temperature of 20 °C. Second heating was analogous to the first one. During the test, the samples were continuously flushed with a nitrogen flow of 20 mL/min. Formula (1) was used to calculate the crystallinity degree χ c .
%   Crystallinity = χ c = 100 × Δ H m Δ H c c 1 φ   Δ H m 0
where Δ H m is the melting enthalpy of a sample, Δ H c c is the cold crystallization of a sample, Δ H m 0 is the theoretical melting enthalpy of the 100% crystalline PLA, and Δ H m 0 = 93.7 J/g [64,65].

2.3.3. Thermomechanical Measurements

Dynamic mechanical thermal analysis (DMTA) was conducted on an Anton Paar MCR 301 (Anton Paar GmbH, Graz, Austria) equipped with torsion clamps. Standard test samples were used with dimensions of 4 mm × 10 mm × 50 mm. The tests were carried out in a temperature range of 25–150 °C, with a deformation frequency of 1 Hz and strain amplitude of 0.01%. The heating rate was set to 2 °C/min.

2.3.4. Mechanical Properties Measurements

Tensile and bending tests were carried out with the use of a Zwick/Roell Z010 universal testing machine (Zwick Roell, Ulm, Germany). The measurements were conducted according to ISO 527 standard for the tensile test, using a 1A type test specimen. The ISO 178 standard was used to perform flexural tests. Test samples were 80 mm long, 4 mm high, and 10 mm wide. Tensile tests were performed with the crosshead speed of 10 mm/s. For the flexural tests, the rate was set to 2 mm/min.
Notched Charpy impact tests were performed according to the ISO 179 standard on a Zwick/Roell HIT25P machine; all samples were V notched. Sample dimensions were the same as the flexural samples (80 mm × 10 mm × 2 mm), while the notch depth was 2 mm.

2.3.5. Microscopic Observations

In order to evaluate the materials’ structure, the fractured samples obtained from the Charpy impact test were subjected to scanning electron microscope observations (SEM). The use apparatus was an EVO 40 SEM microscope (Carl Zeiss, Jena, Germany) at an accelerating voltage of 10 kV. Before analysis, the fractured surfaces prepared for observations were sputtered with a thin layer of gold for 10 s using a Cressington Sputter Coater (Watford, UK).

3. Results and Discussion

3.1. Rheological Characteristic—Rotational Rheometer Test

The rheological measurements were conducted using plate–plate geometry. In the presented research, the attention was focused on the mechanical performance of the obtained materials, which is why we decided to limit the processability analysis to the viscosity of the modified samples. The results of the performed analysis were collected in the form of complex viscosity plots (see Figure 6), since the PLA-based materials are relatively sensitive to thermal degradation. The results for the pure PLA sample indicate the presence of this type of behavior. At low-range angular frequency, the complex viscosity tends to decrease slightly. However, in practice, this kind of behavior cannot be considered as crucial since the residence time for FDM printing process is limited to few seconds, while the complex viscosity test time was around 10 min.
Interestingly, the trends in viscosity changes for the PBAT and TPS-based material are different. For PLA/PBAT-based samples, the addition of the soft polymer phase led to the gradual increase in viscosity, while the highest viscosity was recorded for chain extender-modified sample PLA/PBAT30/CE. More complex correlations were observed for TPS-based systems. The 10% content of the TPS blend resulted in a visible decrease in complex viscosity values. The largest decrease was noticed at low angular frequencies, which suggests that the viscosity changes are related to the PLA degradation phenomena. The potential reason for this phenomenon, despite the drying procedure, is the hydrophilic nature of starch, which makes it difficult to remove moisture from the process. Even a small amount of the TPS leads to large decrease in PLA viscosity. Interestingly, the addition of larger amounts of the TPS-based blend slightly changes the character of the viscosity curve. In the range of high deformation frequencies, the decrease in viscosity is still visible, while at a lower rate of deformation, the viscosity increases due to the deformation of the dispersed phase.
In summary, the results of the viscosity measurements indicate a rather typical nature of rheological changes. As confirmed by practical FDM printing tests, they do not affect the processability of the produced materials.

3.2. Thermal Properties—DSC Measurements

The results of the DSC analysis are presented in the form of signal plots, separately for injection-molded samples (see Figure 7) and FDM-printed materials (see Figure 8 and Figure 9). The calculation of the crystallinity level obtained from the first heating stage is shown in Table 2. The DSC plots present the results of first heating and cooling stage. For comparison purposes, the reference samples’ thermograms for the raw materials (PLA, PBAT, and TPS) are shown in Figure S1 in Supplementary Materials.
As shown in Figure 7, the introduction of the PBAT phase to the virgin PLA led to the shift of cold crystallization temperature (Tcc) to the lower range of temperatures. However, the scale of this change cannot be connected with the increasing content of the PBAT in the blend, since the lowest Tcc was recorded for PLA/PBAT20 sample (88 °C), compared to the reference 112 °C for pure PLA. For the other types of materials, the Tcc reaches around 90 °C, which also refers to blends with additional TPS compound. The addition of CE to the blends structure did not change the Tcc range. The observed phenomenon is related to the nucleation of the PLA crystalline phase by the second polymer [30,66]. The presence of finely dispersed inclusions increases the active area of the nucleating surface. The change in the position of the cold crystallization peak does not directly indicate a higher crystalline phase content; however, it suggests changes in the formation of the polymer structure.
The influence of the soft polymer component addition is also visible during the cooling stage of the measurement, where for PLA/PBAT blends the growing content of the PBAT leads to the formation of the small exothermic peak at around 75 °C. Since the PLA crystallization peak usually appears at around 100–110 °C [67,68], the observed behavior must be related to the crystallization of the PBAT phase or simultaneous crystallization of PLA and PBAT chains [69]. Since a similar peak was observed for PLA/TPS blends, the results could indicate the crystallization of the PLA phase or the presence of the PBAT phase in the used TPS-based compound.
The DSC plot analysis is complemented by the results of the crystallinity level calculations for the PLA phase (Table 2). Since the crystallinity of the pure PLA sample was relatively low (≈7%), the results at the level of around 23–30% for the modified samples clearly show the nucleating effect of the PBAT and TPS inclusions. Interestingly, the addition of CE decreases the crystallinity slightly below 20%, which might be related to the chemical bonding of parts of the PLA chains on the blends interface surface [70].
The DSC plots for FDM-printed samples are shown in Figure 8 and Figure 9, where the results for modified blends and BH-filled samples are presented separately. As can be predicted, the apparency of the DSC plots for pure PLA samples is very similar to those obtained for injection-molded samples. The calculated crystallinity of 7.5% was also close to the value for molded PLA (7.1%). The appearance of thermograms for PBAT and TPS-modified materials indicates the presence of such phenomena again with the shifting of the Tcc peak to lower temperatures and the occurrence of a small exothermic peak during the cooling stage. The content of the crystalline phase still exceeds 20%, which confirms the nucleation effect for the discussed materials.
The results presented in Figure 9 refer to the BH-filled samples. It can be seen that the growing content of the BH particles for PLA-based composites leads to an increasing shift of the Tcc. Interestingly, BH particles’ presence leads to the formation of exothermic peaks during the cooling stage. The peak position at around 95 °C suggests the formation of the PLA crystalline phase, which is confirmed by the χc calculations, where the highest crystallinity level of 19% was obtained for PLA/BH15 samples. The analysis of the thermograms for the most complex formulations containing BH and soft polymer phase revealed that the thermal behavior of the composite composition did not change compared to pure blends. For both PBAT- and TPS-modified materials, the Tcc was shifted to around 90 °C, while the crystallinity level reach about 25%. The cooling thermograms revealed the lack of exothermic peak, which can be considered as the only difference comparing to unfilled blends.
Summarizing the DSC analysis results, it can be noted that the presence of the soft polymer phase increases the crystallinity of the PLA phase. The appearance of the thermograms also reveals a shift in the temperature of cold crystallization, which partly proves the nucleation effect. Due to the generally low crystallization tendency for the used PLA variant, these properties can be considered a predictor of a larger change in the crystallinity level for samples prepared using PLA with a higher crystallization tendency. Consequently, the use of husk particles and the PBAT/TPS modification can improve the thermomechanical properties of the printed models.

3.3. Thermomechanical Properties—DMTA Analysis

The results of the DMTA analysis are presented in the form of storage modulus and tan δ thermograms. The results for initial injection-molded samples are shown in Figure 10, separately, for PBAT- and TPS-based samples. Similar types of plots for FDM-printed samples are presented in Figure 11; this time, the selected BH-reinforced samples are also included in the comparison.
For all samples, the values of storage modulus and tan δ decrease with the addition of TPS and PBAT. A sharp drop in storage modulus at approximately 60 °C confirms the glass transition region’s presence, while the subsequent slight increase in modulus is due to the cold crystallization phenomenon. For most of the samples, the increase was detected at around 85 °C. The pure PLA has the highest storage modulus, while the lowest values were recorded for samples with 30% PBAT content and CE addition. The improved compatibility of CE-modified systems has been confirmed in many studies [30,71,72]. However, the obtained results are not so unambiguous. Interestingly, the Tg peak temperatures were not shifted after the addition of the soft PBAT phase, which confirmed the lack of miscibility for the developed blends system. Even the addition of CE compatibilizer did not change the glass transition range. For TPS-modified samples, the changes in viscoelastic properties of molded samples were almost similar; since the addition of soft compound decrease the storage modulus values, the lowest stiffness was again observed for CE-modified samples, while the glass transition temperature was not affected by the addition of TPS phase. It is worth mentioning that the storage modulus values for PLA/TPS30/CE samples are visibly higher than the analogous samples with the addition of PBAT, suggesting a less efficient toughening mechanism for the TPS blend.
DMTA analysis performed for FDM-printed materials reveals some apparent differences from injection-molded materials, visible even for pure PLA samples. The initial values of the storage modulus values were reduced from around 2.15 GPa for molded samples to approximately 1.8 GPa for the printed ones. Interestingly, the stiffness of the PBAT-modified samples was only slightly reduced, while the storage modulus of TPS-based blends was at the same level as injection-molded samples. Since part of the FDM-printed samples were reinforced with the use of BH particles, the thermogram comparison includes the plots for PLA-BH10 and both types of filled blends. Additional plots for all types of BH-reinforced samples are presented in Figure S2 in Supplementary Materials. The decrease of the storage modulus for all BH-filled samples confirms that the use of natural fillers does not lead to the improvement in materials stiffness, especially for spherical types of particles [73,74]. Usually, the reinforcing factors are more favorable for fibrous kinds of fillers, such as wood particles, flax, or hemp fibers. In the case of the prepared blend, the addition of BH particles does not indicate clear trends. For samples containing PBAT, the stiffness for composites turned out to be the highest, while for composites based on the PLA/TPS30 system, the results were close to the values characteristic for pure blends. Considering the stiffness obtained for the PBAT- or TPS-based samples, it is worth mentioning that, compared to injection-molded specimens, the storage modulus for reactive blended materials was not the lowest, which suggests a more complex structure-property correlation.
Summarizing the thermomechanical properties investigation results, the test results indicate no significant changes of PLA phase transitions caused by the addition of PBAT or TPS. Similar conclusions concern the addition of BH particles for printed samples. The observed differences mainly concern changes in the value of the storage modulus, which confirms that the stiffness was strongly affected by the addition of soft type of polymers.

3.4. Mechanical Properties—Static Tensile Test, Charpy Impact Resistance

The mechanical properties of the prepared samples were tested during the static tensile and flexural test and notched Charpy impact measurements. The complete list of the obtained mechanical characteristics is presented in Table S1 in Supplementary Materials, while the selected results are highlighted in the form of plots. The results are shown in the form of comparison, separately, for tensile strength and modulus, and elongation at break and impact strength. Figure 12 presents the results for injection molding samples, while the plots from Figure 13 show the results for FDM-printed materials. The appearance of the impact test specimens is presented in Figure 14, while the tensile test plots of the selected specimens are shown in Figure S3 in Supplementary Materials.
The tensile strength and modulus of PBAT samples decrease with the increasing quantity of PBAT (see Figure 12A). The samples modified with CE reached lower values of tensile strength and tensile modulus compared to the samples without CE. Similar relationships repeat for TPS samples (Figure 12C). The addition of CE did not change the results of modulus and strength evaluation. As can be predicted, the addition of PBAT and TPS into the PLA matrix resulted in a significant increment in elongation at break and Charpy impact strength. In this case, the addition of PBAT is clearly more effective (Figure 12B,C). The highest values of elongation at break, over 200%, were noted for the PLA/PBAT20 sample, while the for PLA/PBAT30 material, maximum strain was reduced to around 140%, while the addition of CE caused another drop to 50%. Similar changes were observed for TPS-modified samples; however, in this case, the highest elongation of 72% was recorded for the PLA/TPS30 sample, while the values for CE-modified materials were close to 50%. Similar to the results of tensile tests, the impact strength properties are strongly influenced by the content of the soft polymer phase. For PBAT-rich samples, the impact resistance was highest. Since the impact strength for the PLA/PBAT30/CE sample was around 11 kJ/m2, the increase over the unmodified PLA (2.5 kJ/m2) was more than four-fold (≈440%). For TPS-based samples, the improvement was not so high, since the highest values of impact strength were noted for PLA/TPS30 materials (5.1 kJ/m2). The results of preliminary tests carried out on injection-molded samples clearly show that the most expected results are obtained for samples with the highest content of PBAT and TPS; therefore, blends of this type, with and without the addition of CE, were used in further research on 3D printing.
The results for 3D printed samples are presented separately for blend materials (Figure 13A,B) and BH-reinforced samples (Figure 13C,D). As usual in the case of samples obtained with the FDM technique, the mechanical characteristics are always lower than the values obtained for the injection or compression molding methods. However, despite these apparent differences, the results of measurements for samples made of PLA/PBAT and PLA/TPS blends confirm most of the previously observed mechanical characteristics changes. Comparing to TPS-based blends, the addition of PBAT leads to a more visible decrease of the tensile strength and modulus. This fact partly confirms the higher toughening efficiency for PLA/PBAT materials, which is confirmed by the results of elongation at break and impact strength comparison. The highest impact resistance was obtained for PLA/PBAT30 samples (9.8 kJ/m2), which is close to the best results for injection-molded samples. The reference value for pure PLA samples was only 2.1 kJ/m2. The improvement for TPS-based blends is not that high, but still significant, around 5.1 kJ/m2 for the PLA/TPS30 material. For the comparison purposes, the sample appearance is presented in Figure 14.
The addition of BH particles to the PLA matrix decreases most of the tested parameters, including tensile modulus. This trend was already observed for storage modulus values recorded during the DMTA analysis. The lowest stiffness was observed for materials with PBAT and TPS addition. More favorable changes were observed for elongation at break and impact resistance results. Surprisingly, for unmodified PLA/BH composites, the maximum strain was very similar to the reference values obtained for pure PLA (≈2.6%). The observed decrease for PLA/BH10 and PLA/BH15 can be considered as small, since the worse result was 2.1%. Similar conclusions refer to the results of the impact strength for PLA/BH composites. From all of the BH-filled materials, the highest impact resistance of 4.8 kJ/m2 was observed for the PLA/TPS30/CE-BH10 sample, while the elongation at break was also the highest. The results for PBAT-based samples were also promising since the impact strength reached 4.2 kJ/m2, which is still two times higher than the result for pure PLA.
Considering the measurement results obtained for the printed samples and the results of preliminary tests for injection-molded materials, the addition of soft polymers as an impact modifier for FDM-printed models can be treated as an effective strategy for improving the toughness of PLA-based composites. It is also worth adding that the results for TPS-based blends turned out to be comparable to those obtained for PBAT-modified materials. This indicates that even the low-cost materials with undefined composition turn out to be as effective as toughening compounds.
Due to the possible commercial applications, we decided to compare our results with the properties of market-available materials. Since our study concerns the preparation of PLA-based blends and composites, the comparison includes the pure PLA filament (Devil Design—PLA Transparent), PLA/PHA blend (colorFabb—PLA/PHA natural), and the wood fiber-reinforced PLA/PHA composites (colorFabb—PLA/PHA Woodfill). Since the full composition of these materials are part of the company know-how, we were focused on the comparison of the mechanical properties. Standard samples were manufactured using previously described conditions. Table 3 presents the results of the static tensile/flexural tests and notched Charpy measurements. The results for market-type materials are compared with the results for developed compositions.
Since the material composition of the market type of filaments is unknown, the deep analysis of particular mechanical characteristics is difficult. Even for pure PLA samples, the differences between the self-made filaments and market-type materials are recorded. For example, tensile strength values reached 52.2 MPa and 39.4 MPa, respectively, for PLA and PLA (Com) samples. Since the main expected feature for polymer blends was the improved impact resistance, the results of the Charpy test are considered as the most important. The results for commercial-type PLA/PHA blends are very close to the properties of pure PLA samples. With the impact strength of 2.6 kJ/m2, the result for the PLA/PHA (Com) blend is significantly lower than that for the developed PLA/PBAT30/CE blends (11.2 kJ/m2). Interestingly, the addition of the filler in PLA/PHA/wood (Com) results in only a slight decrease in impact strength (2.2 kJ/m2), while this result is still lower than the impact resistance for our developed composites, where impact strength reached 4.2 kJ/m2 and 4.8 kJ/m2, respectively, for PBAT- and TPS-modified materials.

3.5. Structure Appearance—SEM Observations

The structural analysis of the printed materials was carried out by taking SEM images of the fracture surface obtained during the impact tests. The pictures presenting the structure of the pure PLA and PLA/BH10 samples are shown in Figure 15. The detailed analysis presenting the differences between the structure of PBAT- and TPS-modified samples is presented in Figure 16.
The cross-section for the PLA sample shows high homogeneity of the structure and strong adhesion between the individual layers of the model, which is mainly caused by 100% model infill density. The characteristic triangular holes are the only visible confirmation of the sample printing process. The fracture itself is brittle, with a flat surface with slight roughness.
Since the BH filler size was quite large compared to other types of popular fillers, such as talc or chalk, the homogeneity of the PLA/BH10 composite was relatively poor. The structure of the layers was uneven; visible, large BH inclusions give rise to numerous structural cracks, and the leading pores are also a consequence of using the filler. The presence of such a heterogeneous structure, despite the use of a reinforcing filler, must lead to a reduction in material properties, which was confirmed by mechanical tests.
The set of SEM photos shown in Figure 16 shows a direct comparison of materials with the addition of PBAT and TPS and analogous composite samples containing 10% BH. The appearance of the structure indicates a significant change in the deformation mechanism of the samples. Unlike the materials based on unmodified PLA, where the fracture surface was smooth, for samples with PBAT addition (Figure 16A), a significant increase in roughness is observed, which is visible at low magnification. Higher magnification reveals a large number of longitudinal fibrils on the surface, which suggests plastic deformation of the material; these fibrils are also visible for composite samples (Figure 16B), which confirms the effectiveness of the used toughening strategy. The surface of the PLA/TPS30/CE sample is also very rough; higher magnification indicates that the fibrillization process also took place, which confirmed the favorable plastic deformation phenomenon.
For composite samples, surface phenomena indicate good adhesion of the matrix to the surface of the husk particles. This is characterized by the lack of clearly distinguished filler structures in the matrix; therefore, the surface of the filler is covered by the matrix polymer. Only in the places where filler agglomerates are present can the porous structure of the filler be clearly distinguished from the matrix. Similar to the pictures presenting the structure of the unmodified PLA/BH10 composite, the structure of the developed materials is also porous, which indicates a tendency to filler particle agglomeration, and hence the heterogeneity of the composite structure. However, such phenomena occur always for materials with the addition of natural fillers. Unfortunately, in the FDM technique, the presence of agglomerates and structure porosity has a significant impact on the decrease in mechanical properties, a fact which was confirmed by a few other studies [75,76,77].

4. Conclusions

Based on the conducted research, it can be said that the addition of PBAT and TPS indeed improved impact strength and elongation at break of the PLA-based blends. The initial results obtained for the injection-molded samples reveal that the PBAT phase was more effective as the toughening agent than TPS. Most of the results indicate the effectiveness of the CE as a blend compatibilizer, which is why we used this component for the preparation of the final blends and composites. The results for FDM-printed materials, especially the BH-filled samples, indicate that the effectiveness was almost similar for both types of modifiers. The performed DSC tests confirmed that the presence of the soft polymer phase and the addition of BH particles increase the crystallinity of the PLA phase. Although the material crystallinity was visibly improved, the results of the DMTA analysis revealed that the thermomechanical properties are still unsatisfactory. The rapid drop of the storage modulus values close to the Tg confirmed the amorphous phase properties’ domination. Since in most of the prepared materials, the filler content was around 10%, our current research activity is focused on preparing highly filled composite materials with at least 20–30% of natural filler content. For this purpose, we plan to conduct a detailed analysis of the rheological characteristics of the materials being developed and to modify them with lubricants.

Supplementary Materials

The following are available online at www.mdpi.com/article/10.3390/jcs5100253/s1, Figure S1: The DSC thermograms of the raw materials: pure PLA, pure PBAT, and TPS blend. (A) 1st heating, and (B) cooling plots, Figure S2: The results of the DMTA analysis for unmodified PLA/BH composites. (A) storage modulus thermograms, and (B) tan δ. Figure S3: The tensile test plots for (A, B) injection molded samples and (C, D) FDM printed materials. Table S1: The full table presenting the results of tensile and flexural tests results and notched Charpy impact test results.

Author Contributions

Conceptualization, J.A.; methodology, J.A.; formal analysis, J.A.; investigation, J.A., K.G., W.W., and J.S.; resources, J.A.; writing—original draft preparation, J.A., and W.W.; writing—review and editing, J.A. and W.W.; visualization, J.A.; supervision, J.A.; project administration, J.A.; funding acquisition, J.A. All authors have read and agreed to the published version of the manuscript.

Funding

This research was carried out thanks to the support of the National Centre for Research and Development (NCBR) under Project LIDER (0148/L-8/2016), as well as the Ministry of Science and Higher Education in Poland under project no. 513/SBAD/4741.

Institutional Review Board Statement

Not applicable.

Informed Consent Statement

Not applicable.

Acknowledgments

The authors express their gratitude to Paweł Magnuszewski from the company DKSH GmbH for providing the chain extender compound necessary for this research study. We would also like to acknowledge Tomasz Sterzynski for his contribution as a promoter of Karolina Grad’s diploma work.

Conflicts of Interest

The authors declare no conflict of interest.

References

  1. Farah, S.; Anderson, D.G.; Langer, R. Physical and mechanical properties of PLA, and their functions in widespread applications—A comprehensive review. Adv. Drug Deliv. Rev. 2016, 107, 367–392. [Google Scholar] [CrossRef] [Green Version]
  2. Muthuraj, R.; Misra, M.; Mohanty, A.K. Biodegradable compatibilized polymer blends for packaging applications: A literature review. J. Appl. Polym. Sci. 2018, 135, 45726. [Google Scholar] [CrossRef] [Green Version]
  3. Auras, R.; Harte, B.; Selke, S. An Overview of Polylactides as Packaging Materials. Macromol. Biosci. 2004, 4, 835–864. [Google Scholar] [CrossRef]
  4. Jiang, L.; Wolcott, M.P.; Zhang, J. Study of biodegradable polylactide/poly(butylene adipate-co-terephthalate) blends. Biomacromolecules 2006, 7, 199–207. [Google Scholar] [CrossRef]
  5. Al-Ansari, T.; Govindan, R.; Korre, A.; Nie, Z.; Shah, N. An Energy, Water and Food Nexus Approach Aiming to Enhance Food Production Systems Through CO2 Fertilization; Elsevier Masson SAS: Amsterdam, The Netherlands, 2018; Volume 43, ISBN 9780444642356. [Google Scholar]
  6. Ghazaryan, G.; Schaller, R.; Feldman, K.; Tervoort, T.A. Rejuvenation of PLLA: Effect of plastic deformation and orientation on physical ageing in poly(l-lactic acid) films. J. Polym. Sci. Part B Polym. Phys. 2016, 54, 2233–2244. [Google Scholar] [CrossRef]
  7. Van Melick, H.G.H.; Govaert, L.E.; Meijer, H.E.H. Localisation phenomena in glassy polymers: Influence of thermal and mechanical history. Polymer 2003, 44, 3579–3591. [Google Scholar] [CrossRef]
  8. Xie, L.; Xu, H.; Niu, B.; Ji, X.; Chen, J.; Li, Z.M.; Hsiao, B.S.; Zhong, G.J. Unprecedented access to strong and ductile poly(lactic acid) by introducing in situ nanofibrillar poly(butylene succinate) for green packaging. Biomacromolecules 2014, 15, 4054–4064. [Google Scholar] [CrossRef]
  9. Voznyak, Y.; Morawiec, J.; Galeski, A. Ductility of polylactide composites reinforced with poly(butylene succinate) nanofibers. Compos. Part A Appl. Sci. Manuf. 2016, 90, 218–224. [Google Scholar] [CrossRef]
  10. Benwood, C.; Anstey, A.; Andrzejewski, J.; Misra, M.; Mohanty, A.K. Improving the Impact Strength and Heat Resistance of 3D Printed Models: Structure, Property, and Processing Correlationships during Fused Deposition Modeling (FDM) of Poly(Lactic Acid). ACS Omega 2018, 3, 4400–4411. [Google Scholar] [CrossRef]
  11. Murariu, M.; Dechief, A.L.; Paint, Y.; Peeterbroeck, S.; Bonnaud, L.; Dubois, P. Polylactide (PLA)-Halloysite Nanocomposites: Production, Morphology and Key-Properties. J. Polym. Environ. 2012, 20, 932–943. [Google Scholar] [CrossRef]
  12. Salehiyan, R.; Nofar, M.; Malkappa, K.; Ray, S.S. Effect of nanofillers characteristics and their selective localization on morphology development and rheological properties of melt-processed polylactide/poly(butylene adipate-co-terephthalate) blend composites. Polym. Eng. Sci. 2020, 60, 2749–2760. [Google Scholar] [CrossRef]
  13. He, H.; Liu, B.; Xue, B.; Zhang, H. Study on structure and properties of biodegradable PLA/PBAT/organic-modified MMT nanocomposites. J. Thermoplast. Compos. Mater. 2019, 0892705719890907. [Google Scholar] [CrossRef]
  14. Zaaba, N.F.; Ismail, H. A review on tensile and morphological properties of poly (lactic acid) (PLA)/thermoplastic starch (TPS) blends. Polym. Technol. Mater. 2019, 58, 1945–1964. [Google Scholar] [CrossRef]
  15. Saeidlou, S.; Huneault, M.A.; Li, H.; Park, C.B. Poly(lactic acid) crystallization. Prog. Polym. Sci. 2012, 37, 1657–1677. [Google Scholar] [CrossRef]
  16. Liu, H.; Zhang, J. Research progress in toughening modification of poly(lactic acid). J. Polym. Sci. Part B Polym. Phys. 2011, 49, 1051–1083. [Google Scholar] [CrossRef]
  17. Nagarajan, V.; Mohanty, A.K.; Misra, M. Perspective on Polylactic Acid (PLA) based Sustainable Materials for Durable Applications: Focus on Toughness and Heat Resistance. ACS Sustain. Chem. Eng. 2016, 4, 2899–2916. [Google Scholar] [CrossRef]
  18. Koning, C.; Van Duin, M.; Pagnoulle, C.; Jerome, R. Strategies for compatibilization of polymer blends. Prog. Polym. Sci. 1998, 23, 707–757. [Google Scholar] [CrossRef]
  19. Grignard, B.; Gennen, S.; Jérôme, C.; Kleij, A.W.; Detrembleur, C. Advances in the use of CO2 as a renewable feedstock for the synthesis of polymers. Chem. Soc. Rev. 2019, 48, 4466–4514. [Google Scholar] [CrossRef] [PubMed]
  20. Zhang, K.; Nagarajan, V.; Misra, M.; Mohanty, A.K. Supertoughened Renewable PLA Reactive Multiphase Blends System: Phase Morphology and Performance. ASC Appl. Mater. Interfaces 2014, 6, 12436–12448. [Google Scholar] [CrossRef] [PubMed]
  21. Zolali, A.M.; Favis, B.D. Toughening of Cocontinuous Polylactide/Polyethylene Blends via an Interfacially Percolated Intermediate Phase. Macromolecules 2018, 51, 3572–3581. [Google Scholar] [CrossRef]
  22. Chen, Q.; Shan, P.; Tong, C.; Yan, D.; Zhang, Y.; Liu, H.; Hao, C. Influence of reactive blending temperature on impact toughness and phase morphologies of PLA ternary blend system containing magnesium ionomer. J. Appl. Polym. Sci. 2019, 136, 47682. [Google Scholar] [CrossRef]
  23. Yuryev, Y.; Mohanty, A.K.; Misra, M. A New Approach to Supertough Poly(lactic acid): A High Temperature Reactive Blending. Macromol. Mater. Eng. 2016, 301, 1443–1453. [Google Scholar] [CrossRef]
  24. Jin, F.L.; Hu, R.R.; Park, S.J. Improvement of thermal behaviors of biodegradable poly(lactic acid) polymer: A review. Compos. Part B Eng. 2019, 164, 287–296. [Google Scholar] [CrossRef]
  25. Formela, K.; Zedler, L.; Hejna, A.; Tercjak, A. Reactive extrusion of bio-based polymer blends and composites–current trends and future developments. Express Polym. Lett. 2018, 12, 24–57. [Google Scholar] [CrossRef]
  26. Przybysz-Romatowska, M.; Haponiuk, J.; Formela, K. Poly(ε-caprolactone)/poly(lactic acid) blends compatibilized by peroxide initiators: Comparison of two strategies. Polymers 2020, 12, 228. [Google Scholar] [CrossRef] [Green Version]
  27. Pan, H.; Li, Z.; Yang, J.; Li, X.; Ai, X.; Hao, Y.; Zhang, H.; Dong, L. The effect of MDI on the structure and mechanical properties of poly(lactic acid) and poly(butylene adipate- co -butylene terephthalate) blends. RSC Adv. 2018, 8, 4610–4623. [Google Scholar] [CrossRef] [Green Version]
  28. Wu, F.; Misra, M.; Mohanty, A.K. Studies on why the heat deflection temperature of polylactide bioplastic cannot be improved by overcrosslinking. Polym. Cryst. 2019, 2, e10088. [Google Scholar] [CrossRef]
  29. Imre, B.; Pukánszky, B. Compatibilization in bio-based and biodegradable polymer blends. Eur. Polym. J. 2013, 49, 1215–1233. [Google Scholar] [CrossRef] [Green Version]
  30. Andrzejewski, J.; Cheng, J.; Anstey, A.; Mohanty, A.K.; Misra, M. Development of Toughened Blends of Poly(lactic acid) (PLA) and Poly(butylene adipate-co-terephthalate) (PBAT) for 3D Printing Applications: Compatibilization Methods and Material Performance Evaluation. ASC Sustain. Chem. Eng. 2020, 8, 6576–6589. [Google Scholar] [CrossRef]
  31. Andrzejewski, J.; Skórczewska, K.; Klozinski, A. Improving the toughness and thermal resistance of polyoxymethylene/poly(lactic acid) blends: Evaluation of structure-properties correlation for reactive processing. Polymers 2020, 12, 307. [Google Scholar] [CrossRef] [Green Version]
  32. Qahtani, M.; Wu, F.; Misra, M.; Gregori, S.; Mielewski, D.F.; Mohanty, A.K. Experimental Design of Sustainable 3D Printed Poly(Lactic Acid) (PLA)/Biobased Poly(Butylene Succinate) (BioPBS) Blends via Fused Deposition Modelling. ACS Sustain. Chem. Eng. 2019, 7, 14460–14470. [Google Scholar] [CrossRef] [Green Version]
  33. Li, Y.; Luo, Z.; Yang, L.; Li, X.; Xiang, K. Study on surface properties of aramid fiber modified in supercritical carbon dioxide by glycidyl-POSS. Polymers 2019, 11, 700. [Google Scholar] [CrossRef] [Green Version]
  34. Hu, C.; Ruan, R.; Wang, W.; Gao, A.; Xu, L. Electrochemical grafting of poly(glycidyl methacrylate) on a carbon-fibre surface. RSC Adv. 2020, 10, 10599–10605. [Google Scholar] [CrossRef]
  35. Wu, H.; Hao, M. Strengthening and toughening of polylactide/sisal fiber biocomposites via in-situ reaction with epoxy-functionalized oligomer and poly (butylene-adipate-terephthalate). Polymers 2019, 11, 1747. [Google Scholar] [CrossRef] [PubMed] [Green Version]
  36. Hao, M.; Wu, H.; Zhu, Z. In situ reactive interfacial compatibilization of polylactide/sisal fiber biocomposites via melt-blending with an epoxy-functionalized terpolymer elastomer. RSC Adv. 2017, 7, 32399–32412. [Google Scholar] [CrossRef] [Green Version]
  37. Andrzejewski, J.; Nowakowski, M. Development of Toughened Flax Fiber Reinforced Composites. Modification of Poly(lactic acid)/Poly(butylene adipate-co-terephthalate) Blends by Reactive Extrusion Process. Materials 2021, 14, 1523. [Google Scholar] [CrossRef] [PubMed]
  38. Lee, P.-C.; Kuo, W.-F.; Chang, F.-C. In situ compatibilization of PBT/ABS blends through reactive copolymers. Polymer 1994, 35, 5641–5650. [Google Scholar] [CrossRef]
  39. Li, Y.; Shimizu, H. Improvement in toughness of poly(l-lactide) (PLLA) through reactive blending with acrylonitrile-butadiene-styrene copolymer (ABS): Morphology and properties. Eur. Polym. J. 2009, 45, 738–746. [Google Scholar] [CrossRef]
  40. Le Duigou, A.; Castro, M.; Bevan, R.; Martin, N. 3D printing of wood fibre biocomposites: From mechanical to actuation functionality. Mater. Des. 2016, 96, 106–114. [Google Scholar] [CrossRef]
  41. Bourmaud, A.; Baley, C. Effects of thermo mechanical processing on the mechanical properties of biocomposite flax fibers evaluated by nanoindentation. Polym. Degrad. Stab. 2010, 95, 1488–1494. [Google Scholar] [CrossRef]
  42. Carruthers, J.; Quarshie, R. Technology Overview Biocomposites, Executive Summary; Knowledge Transfer Network: Edinburgh, UK, 2014; Volume 70. [Google Scholar]
  43. Wendel, B.; Rietzel, D.; Kühnlein, F.; Feulner, R.; Hülder, G.; Schmachtenberg, E. Additive processing of polymers. Macromol. Mater. Eng. 2008, 293, 799–809. [Google Scholar] [CrossRef]
  44. Seppala, J.E.; Hoon Han, S.; Hillgartner, K.E.; Davis, C.S.; Migler, K.B. Weld formation during material extrusion additive manufacturing. Soft Matter 2017, 13, 6761–6769. [Google Scholar] [CrossRef]
  45. Bell, C. 3D Printing with Delta Printers; Apress: New York, NY, USA, 2015; pp. 1–333. [Google Scholar] [CrossRef]
  46. Shah, J.; Snider, B.; Clarke, T.; Kozutsky, S.; Lacki, M.; Hosseini, A. Large-scale 3D printers for additive manufacturing: Design considerations and challenges. Int. J. Adv. Manuf. Technol. 2019, 104, 3679–3693. [Google Scholar] [CrossRef]
  47. Lim, C.W.J.; Le, K.Q.; Lu, Q.; Wong, C.H. An Overview of 3D Printing in Manufacturing, Aerospace, and Automotive Industries. IEEE Potentials 2016, 35, 18–22. [Google Scholar] [CrossRef]
  48. Clifton, W.; Nottmeier, E.; Damon, A.; Dove, C.; Pichelmann, M. The Future of Biomechanical Spine Research: Conception and Design of a Dynamic 3D Printed Cervical Myelography Phantom. Cureus 2019, 11, e4591. [Google Scholar] [CrossRef] [Green Version]
  49. Gaget, L. How Does the Film Industry Use 3D Printing? Available online: https://www.sculpteo.com/blog/2018/05/25/how-does-the-film-industry-use-3d-printing/ (accessed on 8 March 2021).
  50. Berman, B. 3D printing: The new industrial revolution. Bus. Horiz. 2012, 55, 155–162. [Google Scholar] [CrossRef]
  51. Tao, Y.; Wang, H.; Li, Z.; Li, P.; Shi, S.Q. Development and application ofwood flour-filled polylactic acid composite filament for 3D printing. Materials 2017, 10, 339. [Google Scholar] [CrossRef] [PubMed] [Green Version]
  52. Bi, H.; Ren, Z.; Guo, R.; Xu, M.; Song, Y. Fabrication of flexible wood flour/thermoplastic polyurethane elastomer composites using fused deposition molding. Ind. Crop. Prod. 2018, 122, 76–84. [Google Scholar] [CrossRef]
  53. Xu, W.; Pranovich, A.; Uppstu, P.; Wang, X.; Kronlund, D.; Hemming, J.; Öblom, H.; Moritz, N.; Preis, M.; Sandler, N.; et al. Novel biorenewable composite of wood polysaccharide and polylactic acid for three dimensional printing. Carbohydr. Polym. 2018, 187, 51–58. [Google Scholar] [CrossRef] [PubMed]
  54. Vaidya, A.A.; Collet, C.; Gaugler, M.; Lloyd-Jones, G. Integrating softwood biorefinery lignin into polyhydroxybutyrate composites and application in 3D printing. Mater. Today Commun. 2019, 19, 286–296. [Google Scholar] [CrossRef]
  55. Mathur, R. 3D printing in architecture. Int. J. Innov. Sci. Eng. Technol. 2016, 3, 583–591. [Google Scholar]
  56. Wang, F.Y.; Dai, L.; Ge, T.T.; Yue, C.B.; Song, Y.M. A-Methylstyrene-Assisted Maleic Anhydride Grafted Poly(Lactic Acid) As an Effective Compatibilizer Affecting Properties of Microcrystalline Cellulose/Poly(Lactic Acid) Composites. Express Polym. Lett. 2020, 14, 530–541. [Google Scholar] [CrossRef]
  57. Dan-Mallam, Y.; Abdullah, M.Z.; Yusoff, P.S.M.M. The effect of hybridization on mechanical properties of woven kenaf fiber reinforced polyoxymethylene composite. Polym. Compos. 2014, 35, 1900–1910. [Google Scholar] [CrossRef]
  58. Suchaiya, V.; Aht-Ong, D. Effect of microcrystalline cellulose from banana stem fiber on mechanical properties and cystallinity of PLA composite films. Mater. Sci. Forum 2011, 695, 170–173. [Google Scholar] [CrossRef]
  59. Anese, M.; Nicoli, M.C.; Massini, R.; Lerici, C.R. Effects of drying processing on the Maillard reaction in pasta. Food Res. Int. 1999, 32, 193–199. [Google Scholar] [CrossRef]
  60. Latos-Brozio, M.; Masek, A. The application of natural food colorants as indicator substances in intelligent biodegradable packaging materials. Food Chem. Toxicol. 2020, 135, 110975. [Google Scholar] [CrossRef]
  61. Chun, K.S.; Husseinsyah, S.; Osman, H. Mechanical and thermal properties of coconut shell powder filled polylactic acid biocomposites: Effects of the filler content and silane coupling agent. J. Polym. Res. 2012, 19, 9859. [Google Scholar] [CrossRef]
  62. Ibitoye, E.B.; Lokman, I.H.; Hezmee, M.N.M.; Goh, Y.M.; Zuki, A.B.Z.; Jimoh, A.A. Extraction and physicochemical characterization of chitin and chitosan isolated from house cricket. Biomed. Mater. 2018, 13, 025009. [Google Scholar] [CrossRef] [Green Version]
  63. Singh, S.; Singh, G.; Prakash, C.; Ramakrishna, S.; Lamberti, L.; Pruncu, C.I. 3D printed biodegradable composites: An insight into mechanical properties of PLA/chitosan scaffold. Polym. Test. 2020, 89, 106722. [Google Scholar] [CrossRef]
  64. Garlotta, D. A Literature Review of Poly(Lactic Acid). J. Polym. Environ. 2001, 9, 63–84. [Google Scholar] [CrossRef]
  65. Fischer, E.W.; Sterzel, H.J.; Wegner, G. Investigation of the structure of solution grown crystals of lactide copolymers by means of chemical reactions. Kolloid-Z. Und Z. Für Polym. 1973, 251, 980–990. [Google Scholar] [CrossRef]
  66. Zhou, S.Y.; Huang, H.D.; Ji, X.; Yan, D.X.; Zhong, G.J.; Hsiao, B.S.; Li, Z.M. Super-Robust Polylactide Barrier Films by Building Densely Oriented Lamellae Incorporated with Ductile in Situ Nanofibrils of Poly(butylene adipate- co -terephthalate). ACS Appl. Mater. Interfaces 2016, 8, 8096–8109. [Google Scholar] [CrossRef]
  67. Sangeetha, V.H.; Valapa, R.B.; Nayak, S.K.; Varghese, T.O. Investigation on the Influence of EVA Content on the Mechanical and Thermal Characteristics of Poly(lactic acid) Blends. J. Polym. Environ. 2018, 26, 1–14. [Google Scholar] [CrossRef]
  68. Jia, S.; Yu, D.; Zhu, Y.; Wang, Z.; Chen, L.; Fu, L. Morphology, crystallization and thermal behaviors of PLA-based composites: Wonderful effects of hybrid GO/PEG via dynamic impregnating. Polymers 2017, 9, 528. [Google Scholar] [CrossRef] [Green Version]
  69. Nakayama, D.; Wu, F.; Mohanty, A.K.; Hirai, S.; Misra, M. Biodegradable Composites Developed from PBAT/PLA Binary Blends and Silk Powder: Compatibilization and Performance Evaluation. ACS Omega 2018, 3, 12412–12421. [Google Scholar] [CrossRef] [Green Version]
  70. Nunes, E.d.C.D.; de Souza, A.G.; Rosa, D.d.S. Effect of the Joncryl® ADR Compatibilizing Agent in Blends of Poly(butylene adipate-co-terephthalate)/Poly(lactic acid). Macromol. Symp. 2019, 383, 1800035. [Google Scholar] [CrossRef] [Green Version]
  71. Abdelwahab, M.A.; Taylor, S.; Misra, M.; Mohanty, A.K. Thermo-mechanical characterization of bioblends from polylactide and poly(butylene adipate-co-terephthalate) and lignin. Macromol. Mater. Eng. 2015, 300, 299–311. [Google Scholar] [CrossRef]
  72. Wang, X.; Peng, S.; Chen, H.; Yu, X.; Zhao, X. Mechanical properties, rheological behaviors, and phase morphologies of high-toughness PLA/PBAT blends by in-situ reactive compatibilization. Compos. Part B Eng. 2019, 173, 107028. [Google Scholar] [CrossRef]
  73. Andrzejewski, J.; Krawczak, A.; Wesoły, K.; Szostak, M. Rotational molding of biocomposites with addition of buckwheat husk filler. Structure-property correlation assessment for materials based on polyethylene (PE) and poly(lactic acid) PLA. Compos. Part B Eng. 2020, 202, 108410. [Google Scholar] [CrossRef]
  74. Andrzejewski, J.; Barczewski, M.; Szostak, M. Injection Molding of Highly Filled Polypropylene-based Biocomposites. Buckwheat Husk and Wood Flour Filler: A Comparison of Agricultural and Wood Industry Waste Utilization. Polymers 2019, 11, 1881. [Google Scholar] [CrossRef] [Green Version]
  75. Yang, T.-C.; Yeh, C.-H. Morphology and Mechanical Properties of 3D Printed Wood Fiber/Polylactic Acid Composite Parts Using. Polymers 2020, 12, 1334. [Google Scholar] [CrossRef]
  76. Liu, Z.; Lei, Q.; Xing, S. Mechanical characteristics of wood, ceramic, metal and carbon fiber-based PLA composites fabricated by FDM. J. Mater. Res. Technol. 2019, 8, 3743–3753. [Google Scholar] [CrossRef]
  77. Stoof, D.; Pickering, K.; Zhang, Y. Fused Deposition Modelling of Natural Fibre/Polylactic Acid Composites. J. Compos. Sci. 2017, 1, 8. [Google Scholar] [CrossRef] [Green Version]
Figure 1. The appearance of the buckwheat husk particles after the sieving process, where the sieve size was <50 µm.
Jcs 05 00253 g001
Figure 2. The particle size distribution obtained for (A) milled BH particles, and (B) sieved BH particles (<50 µm).
Jcs 05 00253 g002
Figure 3. The appearance of the prepared pure PLA and PLA/BH10 samples. Pictures present the filament material, and side and top view of the printed sample.
Jcs 05 00253 g003
Figure 4. The appearance of the prepared unfilled PLA/PBAT30/CE blend and reinforced PLA/PBAT30/CE-BH10 samples. Pictures present the filament material, and side and top view of the printed sample.
Jcs 05 00253 g004
Figure 5. The appearance of the prepared unfilled PLA/TPS30/CE and PLA/TPS30/CE-BH10 samples. Pictures present the filament material, and side and top view of the printed sample.
Jcs 05 00253 g005
Figure 6. The results of the small amplitude oscillation shear tests for (A) PLA/PBAT-based blends and (B) PLA/TPS blends.
Jcs 05 00253 g006
Figure 7. The DSC signal of injection-molded samples. (A,B) First heating and cooling thermogram for PLA/PBAT-based materials. (C,D) First heating and cooling thermograms for PLA/TPS materials.
Jcs 05 00253 g007
Figure 8. The DSC signal of FDM-printed samples. (A,B) First heating and cooling thermogram for PLA/PBAT-based materials. (C,D) First heating and cooling thermograms for PLA/TPS materials.
Jcs 05 00253 g008
Figure 9. The DSC signal of FDM-printed BH composites. (A) First heating thermograms, (B) cooling thermograms.
Jcs 05 00253 g009
Figure 10. The DMTA thermograms obtained for the injection-molded samples: (A,B) storage modulus and tan δ plots for PLA/PBAT-based samples, and (C,D) results for the PLA/TPS-based materials.
Jcs 05 00253 g010
Figure 11. The DMTA thermograms obtained for the FDM-printed samples: (A,B) storage modulus and tan δ plots for PLA/PBAT-based samples, and (C,D) results for the PLA/TPS-based materials.
Jcs 05 00253 g011
Figure 12. The results of the mechanical tests for injection-molded samples. Plots present the results of the static tensile test and impact resistance measurements in the form of tensile modulus, tensile strength, elongation at break, and Charpy impact strength. (A,B) PLA/PBAT-based samples and (C,D) PLA/TPS-based samples.
Jcs 05 00253 g012
Figure 13. The results of the mechanical tests for FDM-printed samples. Plots present the results of the static tensile test and impact resistance measurements in the form of tensile modulus, tensile strength, elongation at break, and Charpy impact strength. (A,B) PLA/PBAT-based samples and (C,D) PLA/TPS-based samples.
Jcs 05 00253 g013
Figure 14. The macroscopic appearance of the 3D printed samples, pictures present the impact test specimens after the fracture.
Jcs 05 00253 g014
Figure 15. SEM pictures presenting the structure of (A) pure PLA printed sample and (B) PLA-BH10 printed sample.
Jcs 05 00253 g015
Figure 16. The SEM pictures presenting the structure of FDM-printed samples: (A) PLA/PBAT30/CE, (B) PLA/PBAT30/CE-BH10, (C) PLA/TPS30/CE, and (D) PLA/TPS30/CE-BH10.
Jcs 05 00253 g016
Table 1. The list of samples prepared by injection molding and FDM printing.
SamplePLAPBATTPS BlendChain ExtenderBH Particles
%%%pph%
Injection-molded samples
PLA pure100----
PLA/PBAT109010---
PLA/PBAT208020---
PLA/PBAT307030---
PLA/PBAT30/CE7030-0.5-
PLA/TPS090-10--
PLA/TPS2080-20--
PLA/TPS3070-30--
PLA/TPS30/CE70-300.5-
FDM-printed samples
PLA pure100----
PLA/PBAT307030---
PLA/PBAT30/CE7030-0.5-
PLA/TPS3070-30--
PLA/TPS30/CE70-300.5-
PLA-BH595---5
PLA-BH1090---10
PLA-BH1585---15
PLA/PBAT30/CE-BH100.560.24-0.510
PLA/TPS30/CE-BH100.56-0.240.510
Table 2. The results of the DSC thermograms analysis, cold crystallization and melting enthalpy, and PLA crystalline phase content.
SampleΔHcc
[J/g]
ΔHm
[J/g]
χc
[%]
Injection molding
PLA pure37.544.17.1
PLA/PBAT1021.242.925.7
PLA/PBAT2019.439.026.2
PLA/PBAT3017.032.423.5
PLA/PBAT30/CE16.633.319.8
PLA/TPS1024.243.322.7
PLA/TPS2018.837.725.3
PLA/TPS3013.133.230.7
PLA/TPS30/CE16.032.018.9
FDM printing
PLA pure41.348.47.5
PLA/BH537.347.211.1
PLA/BH1032.546.616.8
PLA/BH1530.444.818.1
PLA/PBAT3019.936.725.7
PLA/PBAT30/CE20.334.721.9
PLA/PBAT30/CE-BH1018.332.324.8
PLA/TPS3017.635.727.6
PLA/TPS30/CE18.934.023.1
PLA/TPS30/CE-BH19.533.925.6
Table 3. The comparison of the mechanical performance for developed materials and commercially available filaments.
Tensile TestFlexural TestCharpy Test
ModulusStrengthElongation at BreakModulusStrengthImpact Strength
[MPa][MPa][%][MPa][MPa][kJ/m2]
Unfilled samples
PLA3100 (±14)52.2 (±0.1)2.6 (±0.1)2920 (±37)77.2 (±1.7)2.1 (±0.3)
PLA (Com) *2750 (±30)39.4 (±0.8)1.9 (±0.1)2730 (±115)77.0 (±3.9)2.3 (±0.3)
PLA/PHA (Com)3140 (±49)54.6 (±0.9)4.4. (±0.4)2940 (±160)84.7 (±0.6)2.6 (±0.2)
PLA/PBAT30/CE2190 (±11)41.3 (±0.1)51.3 (±18.4)2160 (±63)67.1 (±2.0)11.2 (±0.9)
PLA/TPS30/CE2510 (±28)45.7 (±0.4)53.0 (±21.0)2580 (±59)76.7 (±1.0)5.1 (±0.6)
Composite samples
PLA/PHA/wood (Com)2980 (±51)29.7 (±1.3)2.6 (±0.1)2650 (±56)72.1 (±3.2)2.2 (±0.5)
PLA/PBAT30/CE-BH102390 (±33)38.0 (±0.7)3.4 (±0.2)2250 (±449)65.3 (±7.5)4.2 (±0.3)
PLA/TPS30/CE-BH101810 (±49)30.0 (±0.7)5.2 (±0.7)2170 (±39)60.8 (±0.6)4.8 (±0.6)
* (Com)—commercial type of material.
Publisher’s Note: MDPI stays neutral with regard to jurisdictional claims in published maps and institutional affiliations.

