Article

Mechanical and Electrical Properties of Injection-Molded MWCNT-Reinforced Polyamide 66 Hybrid Composites

by
Ross Zameroski
1,
Chadwick J. Kypta
1,
Brian A. Young
2,
Seyed Hamid Reza Sanei
1,* and
Adam S. Hollinger
1,*
1
Department of Mechanical Engineering, Penn State Behrend, Erie, PA 16563, USA
2
Department of Plastics Engineering, Penn State Behrend, Erie, PA 16563, USA
*
Authors to whom correspondence should be addressed.
J. Compos. Sci. 2020, 4(4), 177; https://doi.org/10.3390/jcs4040177
Submission received: 21 October 2020 / Revised: 4 November 2020 / Accepted: 18 November 2020 / Published: 25 November 2020
(This article belongs to the Special Issue Carbon-Based Polymer Nanocomposites)

Abstract

:
The addition of fillers or reinforcements has a direct influence on the mechanical and electrical properties of polymers. Such properties are a function of the morphology and the distribution of fillers in the polymer base. Each feature may have contrasting effects on mechanical and electrical properties. In this study, chopped carbon fiber of different lengths and multiwalled carbon nanotubes (MWCNTs) were added to nylon 6,6. Specimens were manufactured by injection molding of a polyamide/MWCNT masterbatch with the addition of loose chopped carbon fiber. Tensile testing of dogbone specimens was conducted to obtain Young’s modulus, ultimate tensile strength, and elongation. Electrical conductivity testing was conducted on the same specimens prior to mechanical testing. To evaluate the morphology of fillers, scanning electron micrographs were evaluated. Micrographs show the presence of a skin layer close to the surface of the specimens. For this reason, core and surface conductivities were compared. The results show that while promising electrical properties can be achieved by the addition of fillers, the improvement in mechanical properties is minimal.

1. Introduction

Due to the relatively poor mechanical and electrical properties of polymers, fillers are commonly added to improve their mechanical [1,2,3], thermal [4,5,6], and electrical [7] performance. The resulting composite properties are driven by their microstructural features [8,9]. Features such as agglomeration, orientation (aligned vs. random), geometry (straight vs. wavy), and size influence the mechanical properties [10,11]. Most studies focus on one set of material properties without considering its corresponding effect on another set. However, experimental results show that the addition of fillers can degrade one material property while improving another. For instance, the presence of an agglomerated region of fillers is detrimental to mechanical properties [10], but it could improve electrical conductivity. Therefore, a simultaneous evaluation of mechanical and electrical properties of composite specimens was addressed in this study.
Nylon 6,6-reinforced specimens were manufactured via injection molding. Nylon is widely used in different applications due to its light weight, manufacturability, and high wear resistance. Injection molding is the most common type of manufacturing process for thermoset and thermoplastic polymers. Manufacturing injection-molded specimens with desirable mechanical properties has vast potential. The strain rate effect [3] as well as tensile [12] and dynamic properties [13] of injection-molded nanocomposites have been studied; however, limited research has been dedicated to the electrical and mechanical properties of hybrid composites [14,15].
Several factors impact the ability of a polymer composite to conduct electricity. The geometry, filler weight percent, dispersion, and the physical properties of the fillers are crucial to forming an electrical pathway through the composite. Graphite particles, carbon black, carbon fiber, and carbon nanotubes (CNTs) are several of the most commonly used conductive fillers. Prior efforts have investigated the use of these fillers individually and in combination. Wu et al. studied the effect of adding carbon nanotubes to four different polymer blends, namely polyethylene terephthalate (PET)/polyvinylidene fluoride, PET/nylon 6,6, PET/polypropylene, and PET/high-density polyethylene. The addition of carbon nanotubes to these polymer blends improved their mechanical properties; however, the conductivities of these composites were less than 1 S/cm [16,17]. Liang et al. investigated the impact of the length-to-diameter ratio of carbon fibers on the electrical conductivity of high-density polyethylene composites. Results showed that larger length-to-diameter ratios led to lower percolation thresholds. The conductivity of these composites was also less than 1 S/cm [18]. Dweiri et al. used a blend of polypropylene and carbon black to produce polymer composites with conductivities up to 35 S/cm [19].
Previous research has shown that adding multiple types of fillers can have a synergistic effect on the electrical conductivity of a polymer composite [20,21,22]. Heiser et al. investigated the synergistic effects of adding multiple fillers, i.e., carbon fiber, carbon black, and synthetic graphite particles, to nylon 6,6. These nylon composites reached conductivities up to 10.75 S/cm [20]. Mighri et al. injection molded carbon-filled polypropylene and polyphenylene sulfide. Loadings up to 60 wt% in the form of graphite, carbon black, and carbon fibers were investigated, en route to achieving conductivities up to 15 S/cm [21]. Zhao et al. studied the synergistic effect of carbon fiber and carbon black in polypropylene, demonstrating that carbon fibers function as bridges between the segregated carbon black particles [22]. Other efforts have investigated polymer composites filled with carbon black and carbon nanotubes [23], and carbon fiber and carbon nanotubes [24]. For polymer composites, analytical and numerical models have been developed for electrical conductivity [25,26,27] as well as mechanical properties [10,11]. These models consider volume fraction, shape, size, aspect ratio, and orientation of fillers. Controlling the filler orientation in the polymer composite can improve electrical conductivity while also enhancing the mechanical performance of the composite.
In this study, injection-molded nylon 6,6 composites were filled with carbon fibers and multiwalled carbon nanotubes (MWCNTs). A carbon nanotube masterbatch was used in addition to adding carbon fibers during the injection process to create direct injection-molded specimens. In contrast to compounded specimens, conductivity increases considerably when directly injecting the carbon fibers [28]. Compounding the filler via a twin-screw extruder helps to disperse the fibers within the polymer but decreases conductivity due to shearing of the conductive carbon fibers. Carbon fibers and carbon nanotubes were added to nylon at various weight percentages to determine the fillers’ content effect on electrical conductivity as well as mechanical properties. The main objective of this study was to concurrently evaluate the change in the mechanical properties of these hybrid composites as fillers were added to increase their electrical conductivity. The experimental and testing procedure are summarized in Figure 1 for the convenience of the reader.

2. Experimental Section

2.1. Materials

The base material for the polymer matrix was VYDYNE 21SPC Nylon 6,6 referred to as N6/6 with filler materials consisting of carbon fibers and carbon nanotubes. The carbon fibers were Toho Tenax chopped carbon fibers at 6 mm length, referred to as CF6, and at 3 mm length, referred to as CF3, hereafter. The carbon nanotubes were added to the matrix through a masterbatch consisting of 20 wt% MWCNT and 80 wt% N6/6, manufactured by Hyperion Catalysis (Cambridge, MA, USA). The carbon nanotubes in the masterbatch had diameters ranging from 10 to 12 nm with an aspect ratio of 1000:1.

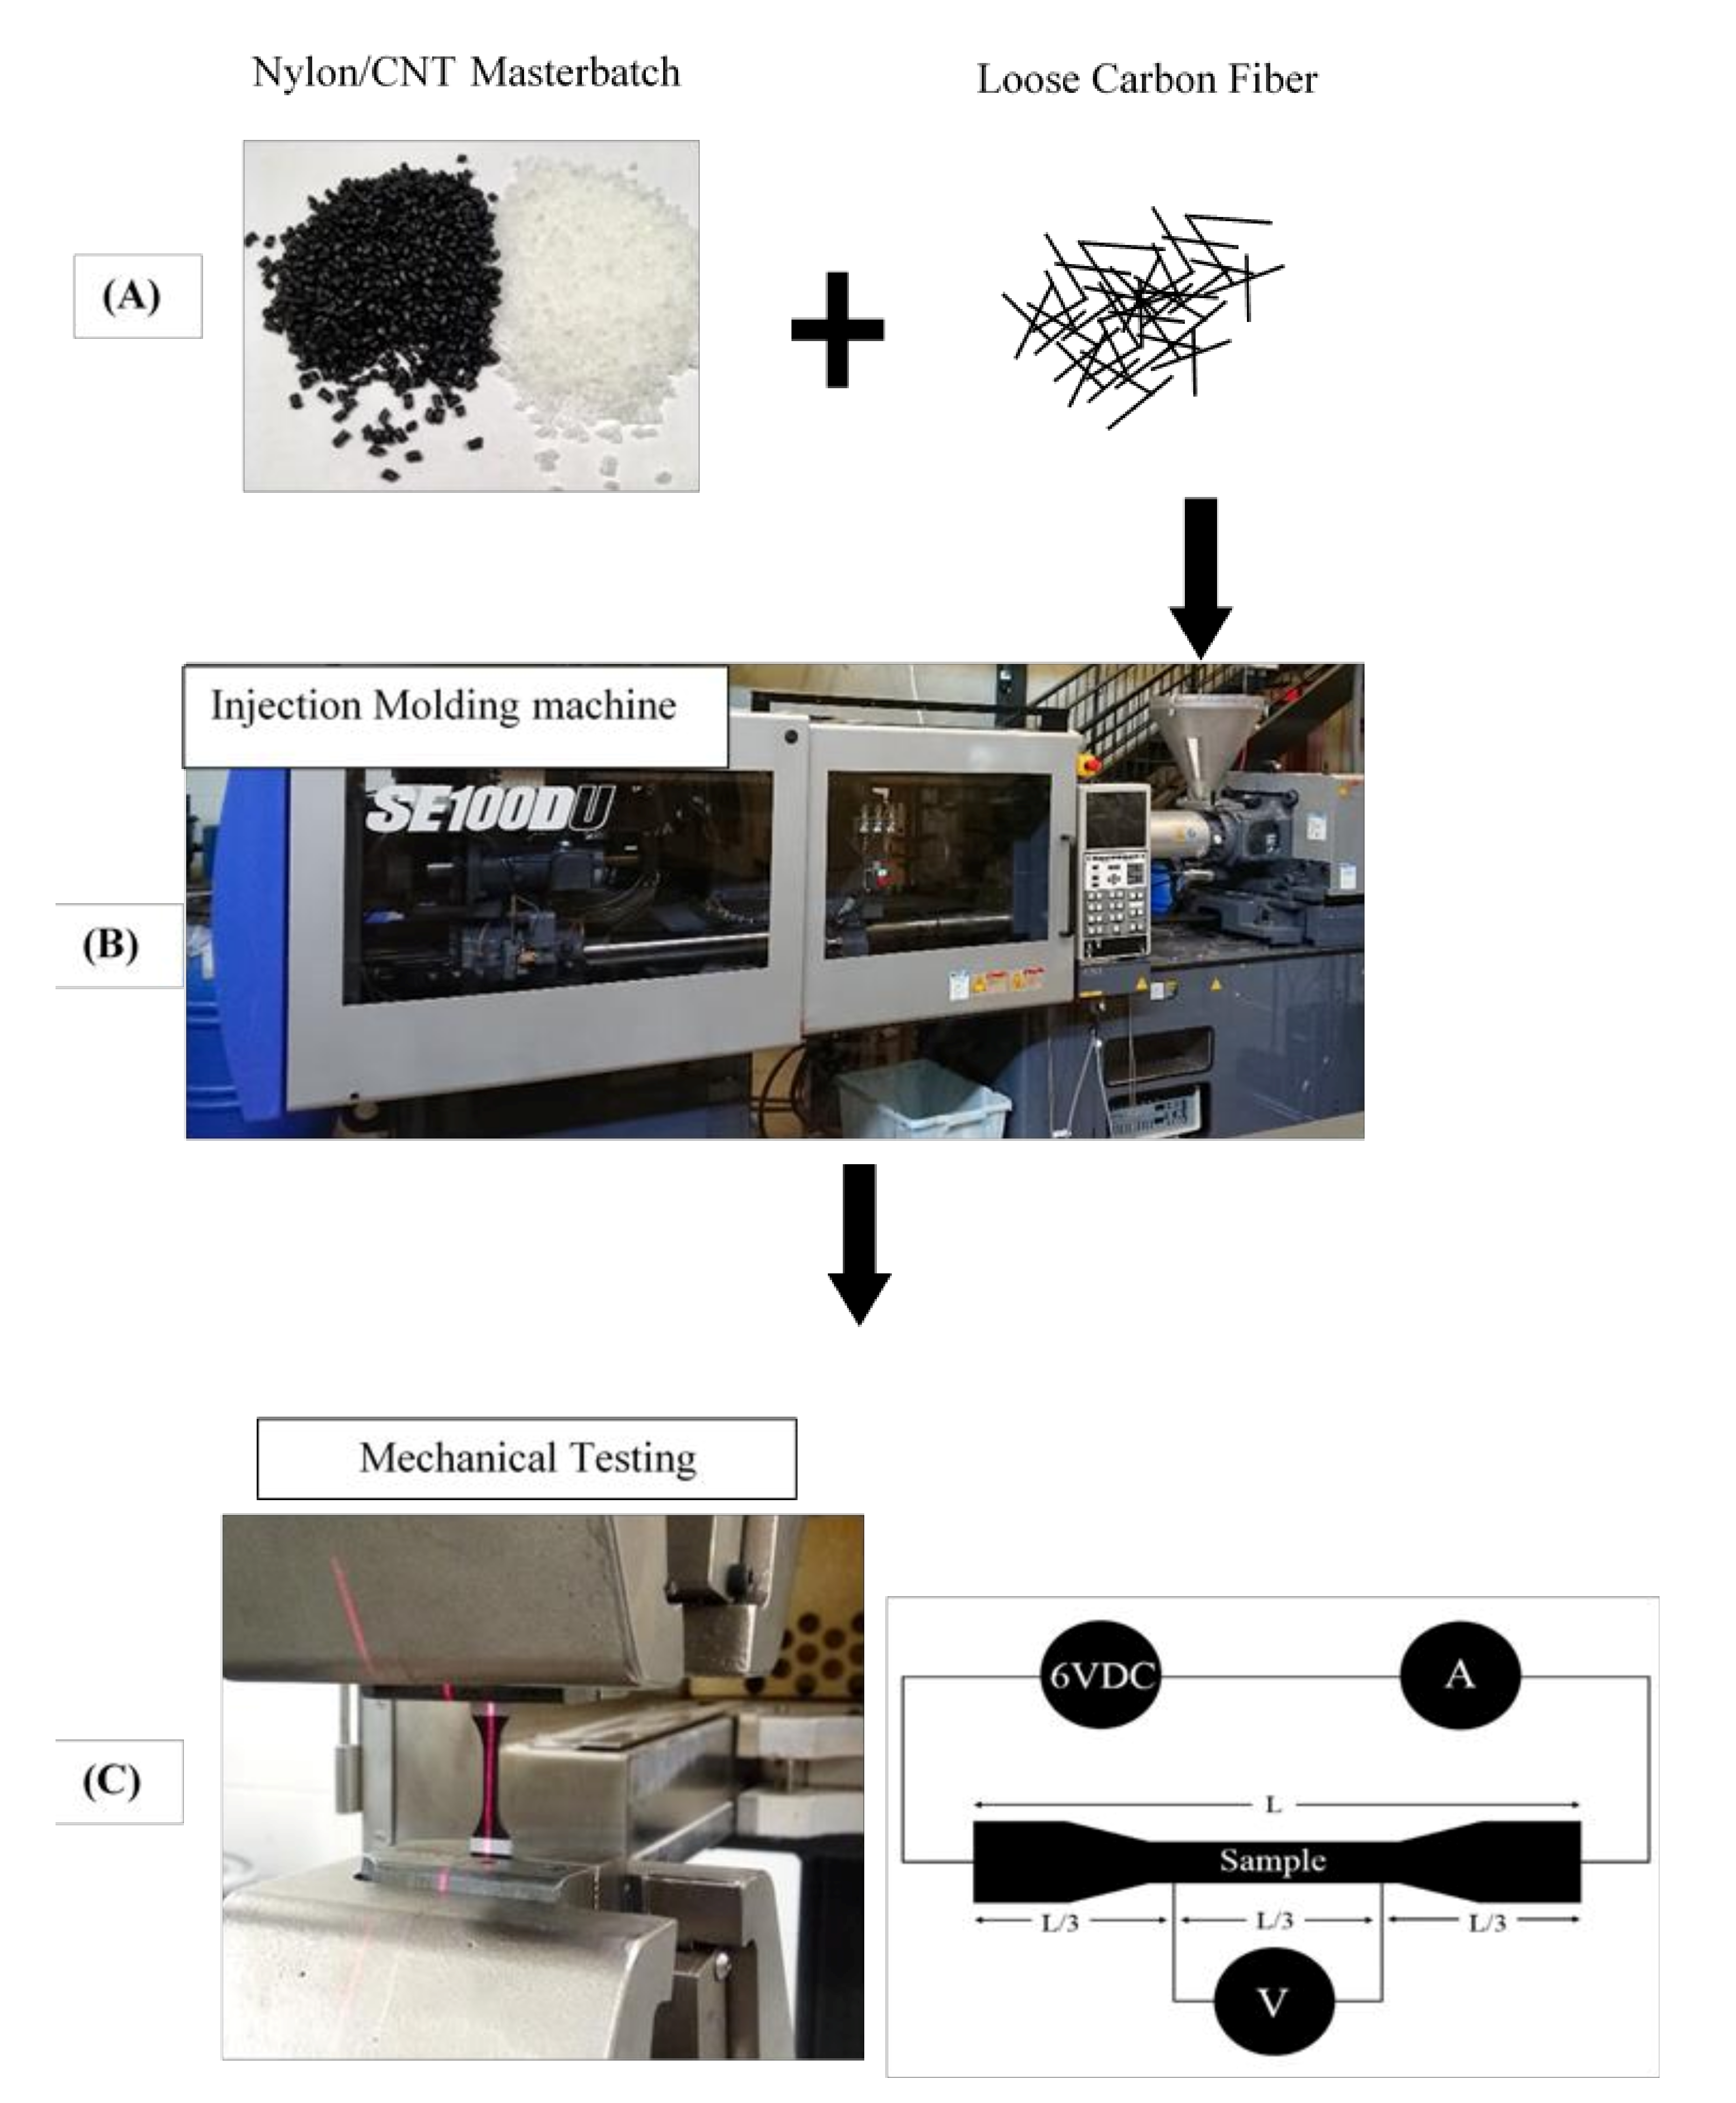
2.2. Manufacturing Process

2.2.1. Material Preparation

Before fabrication, the nylon 6,6 and the CNT masterbatch were placed in a Novatech MD-15 (Absolutemachinery, Worchester, MA, USA) dryer at 74 °C and dried until the moisture content was below 0.1%. After drying, the materials were taken directly from the dryer to the injection molding machine.

2.2.2. Injection Molding Process

It has been shown that the use of nylon 6,6 and a carbon fiber masterbatch, compounded in a twin-screw extruder, results in significantly lower conductivity as fillers are dispersed into the nylon phase and do not form bridges to create a conductive network. However, specimens manufactured with the direct addition of carbon fiber to the masterbatch at the injection molding feeder displayed higher conductivities [28]. Therefore, in this study, the carbon fibers were directly added to the mix during injection molding (Sumitomo SE100DU, Sumitomo Shi Demag, Cleveland, OH, USA). The materials, directly from the dryer, were weighed for correct filler ratios, mixed, and then poured into the injection molding machine feed throat. During fabrication, the material flow path was parallel to the length of the composite specimen. As the weight percentage of carbon fiber increased, the specimens became more difficult to process. For this reason, the carbon fiber weight percentage was limited to 50%. Specimen compositions are listed in Table 1.

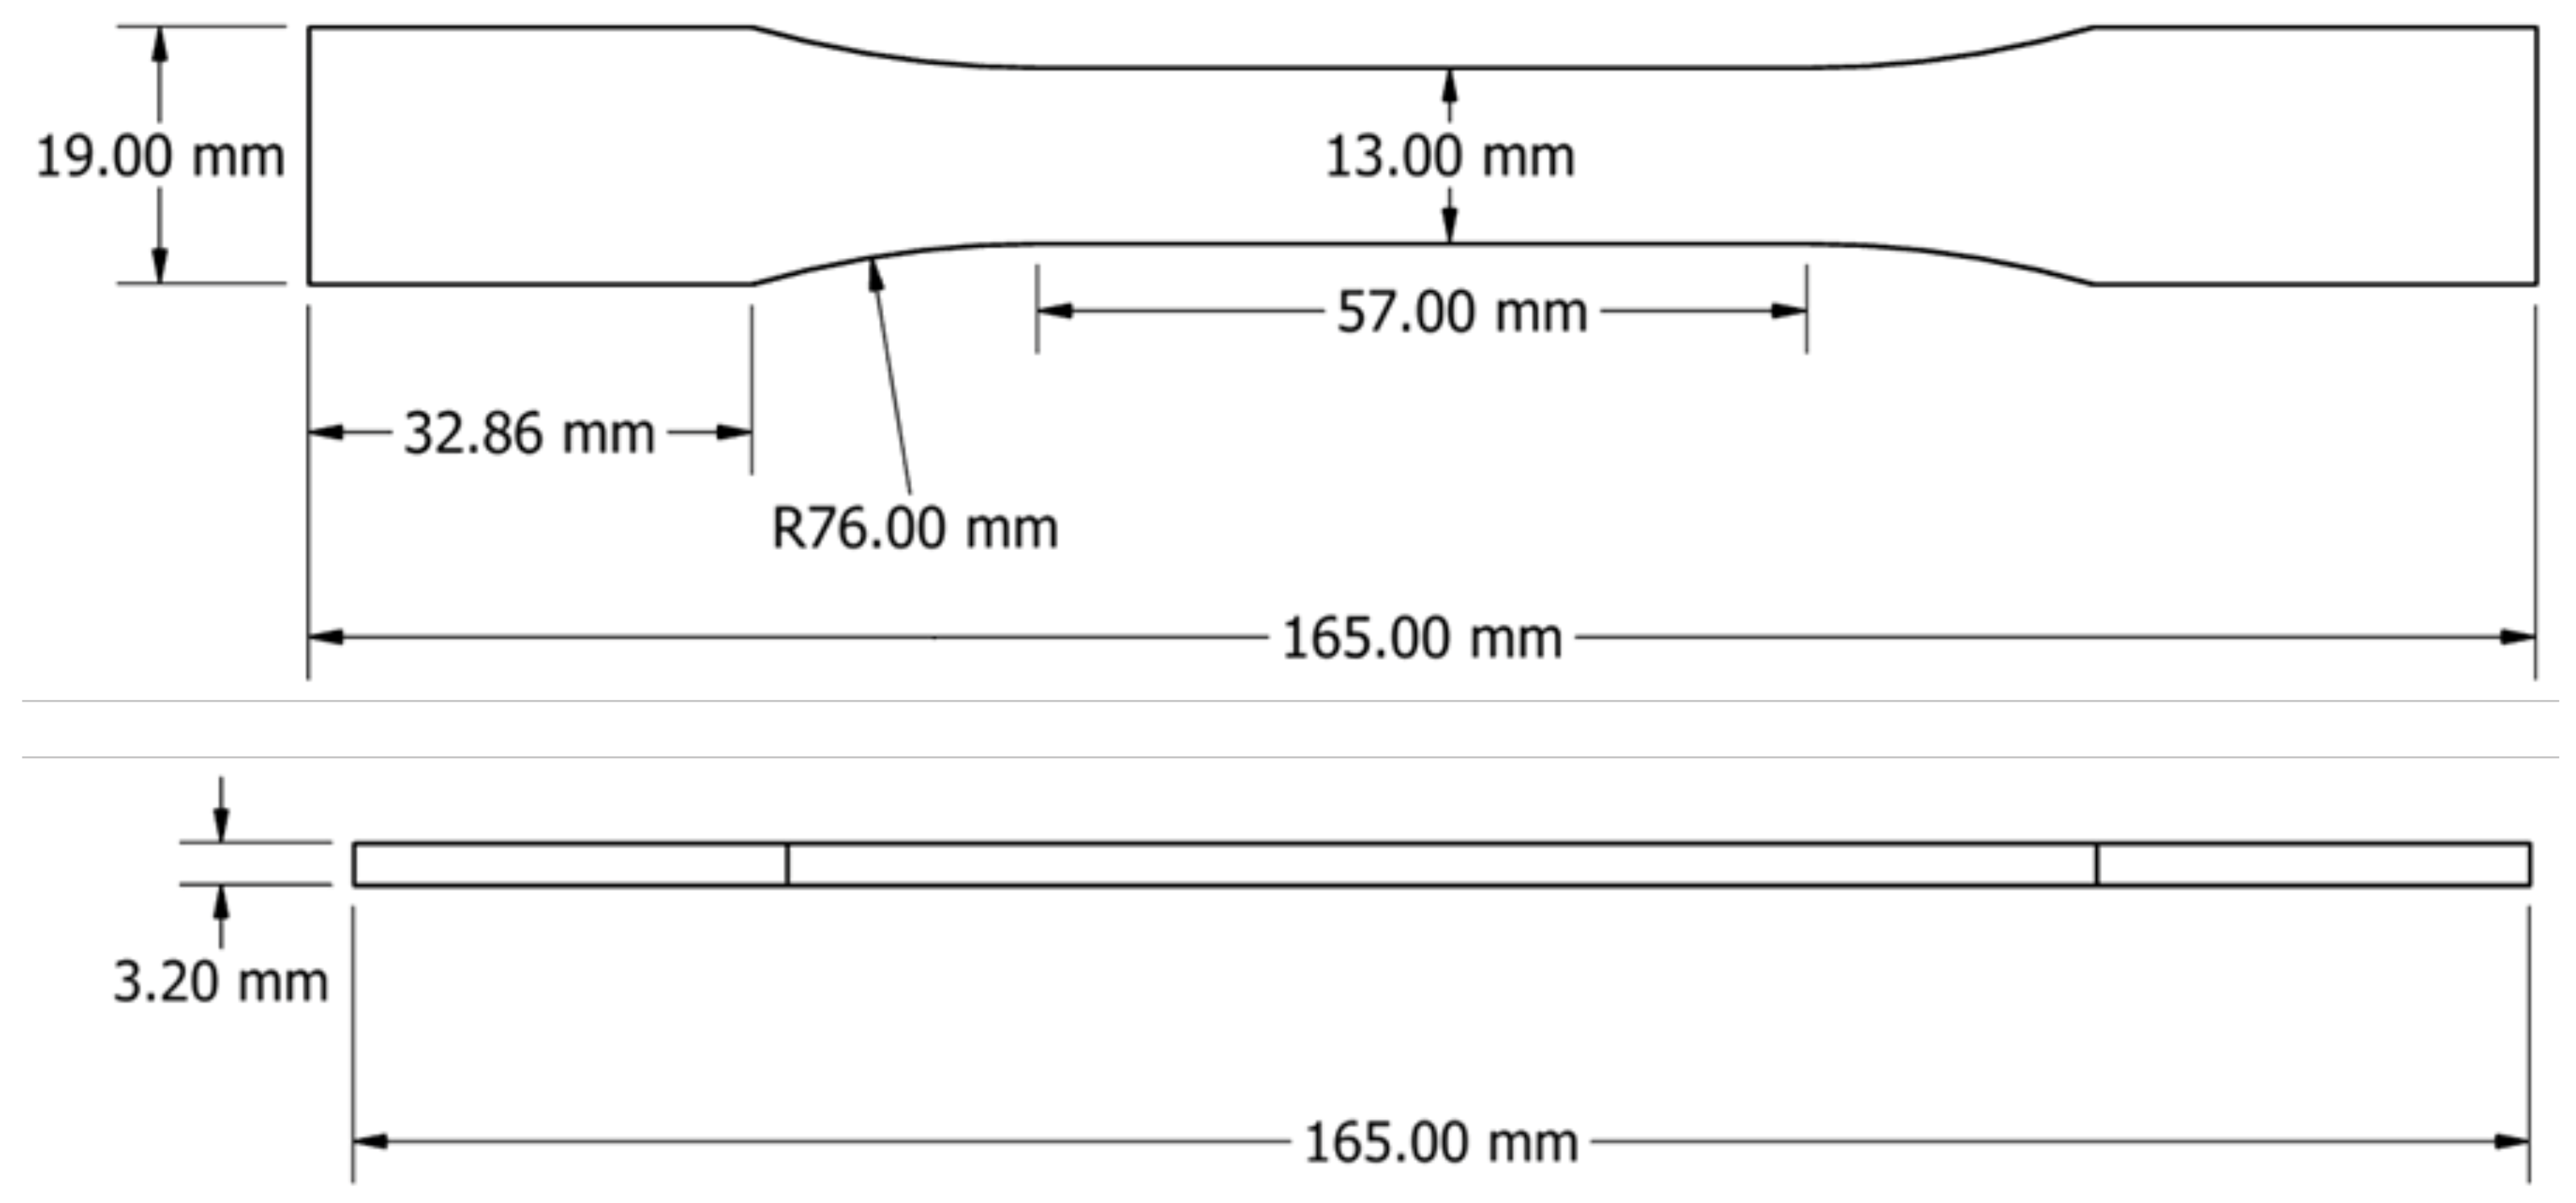
2.3. Specimen Geometry

The dimensions of the tensile specimens were adopted from ASTM D638 TYPE 1 as shown in Figure 2. Prior to mechanical testing, electrical conductivity testing was performed on each specimen.

2.4. Mechanical Testing

An MTS 810 (MTS, Eden Prairie, MN, USA) with manual grips, using a 97.87 kN load cell, was used for mechanical testing. strain rate of 0.01 1/min was used following the guidelines set in D3039/D3039M–08. Specimens were measured at three locations for width and thickness in the gauge length, and the average initial cross section and gauge length were used to obtain stress–strain curves. Several key mechanical properties were extracted from stress–strain curves to evaluate the mechanical performance of specimens. These data sets were used to obtain the ultimate tensile strength, tensile modulus of elasticity, and elongation for each composition. Four specimens of each composition were tested to evaluate the coefficient of variation in addition to the average value. The coefficient of variation was reported to give insight into the consistency of the obtained results; however, further statistical analysis would require a larger data set.

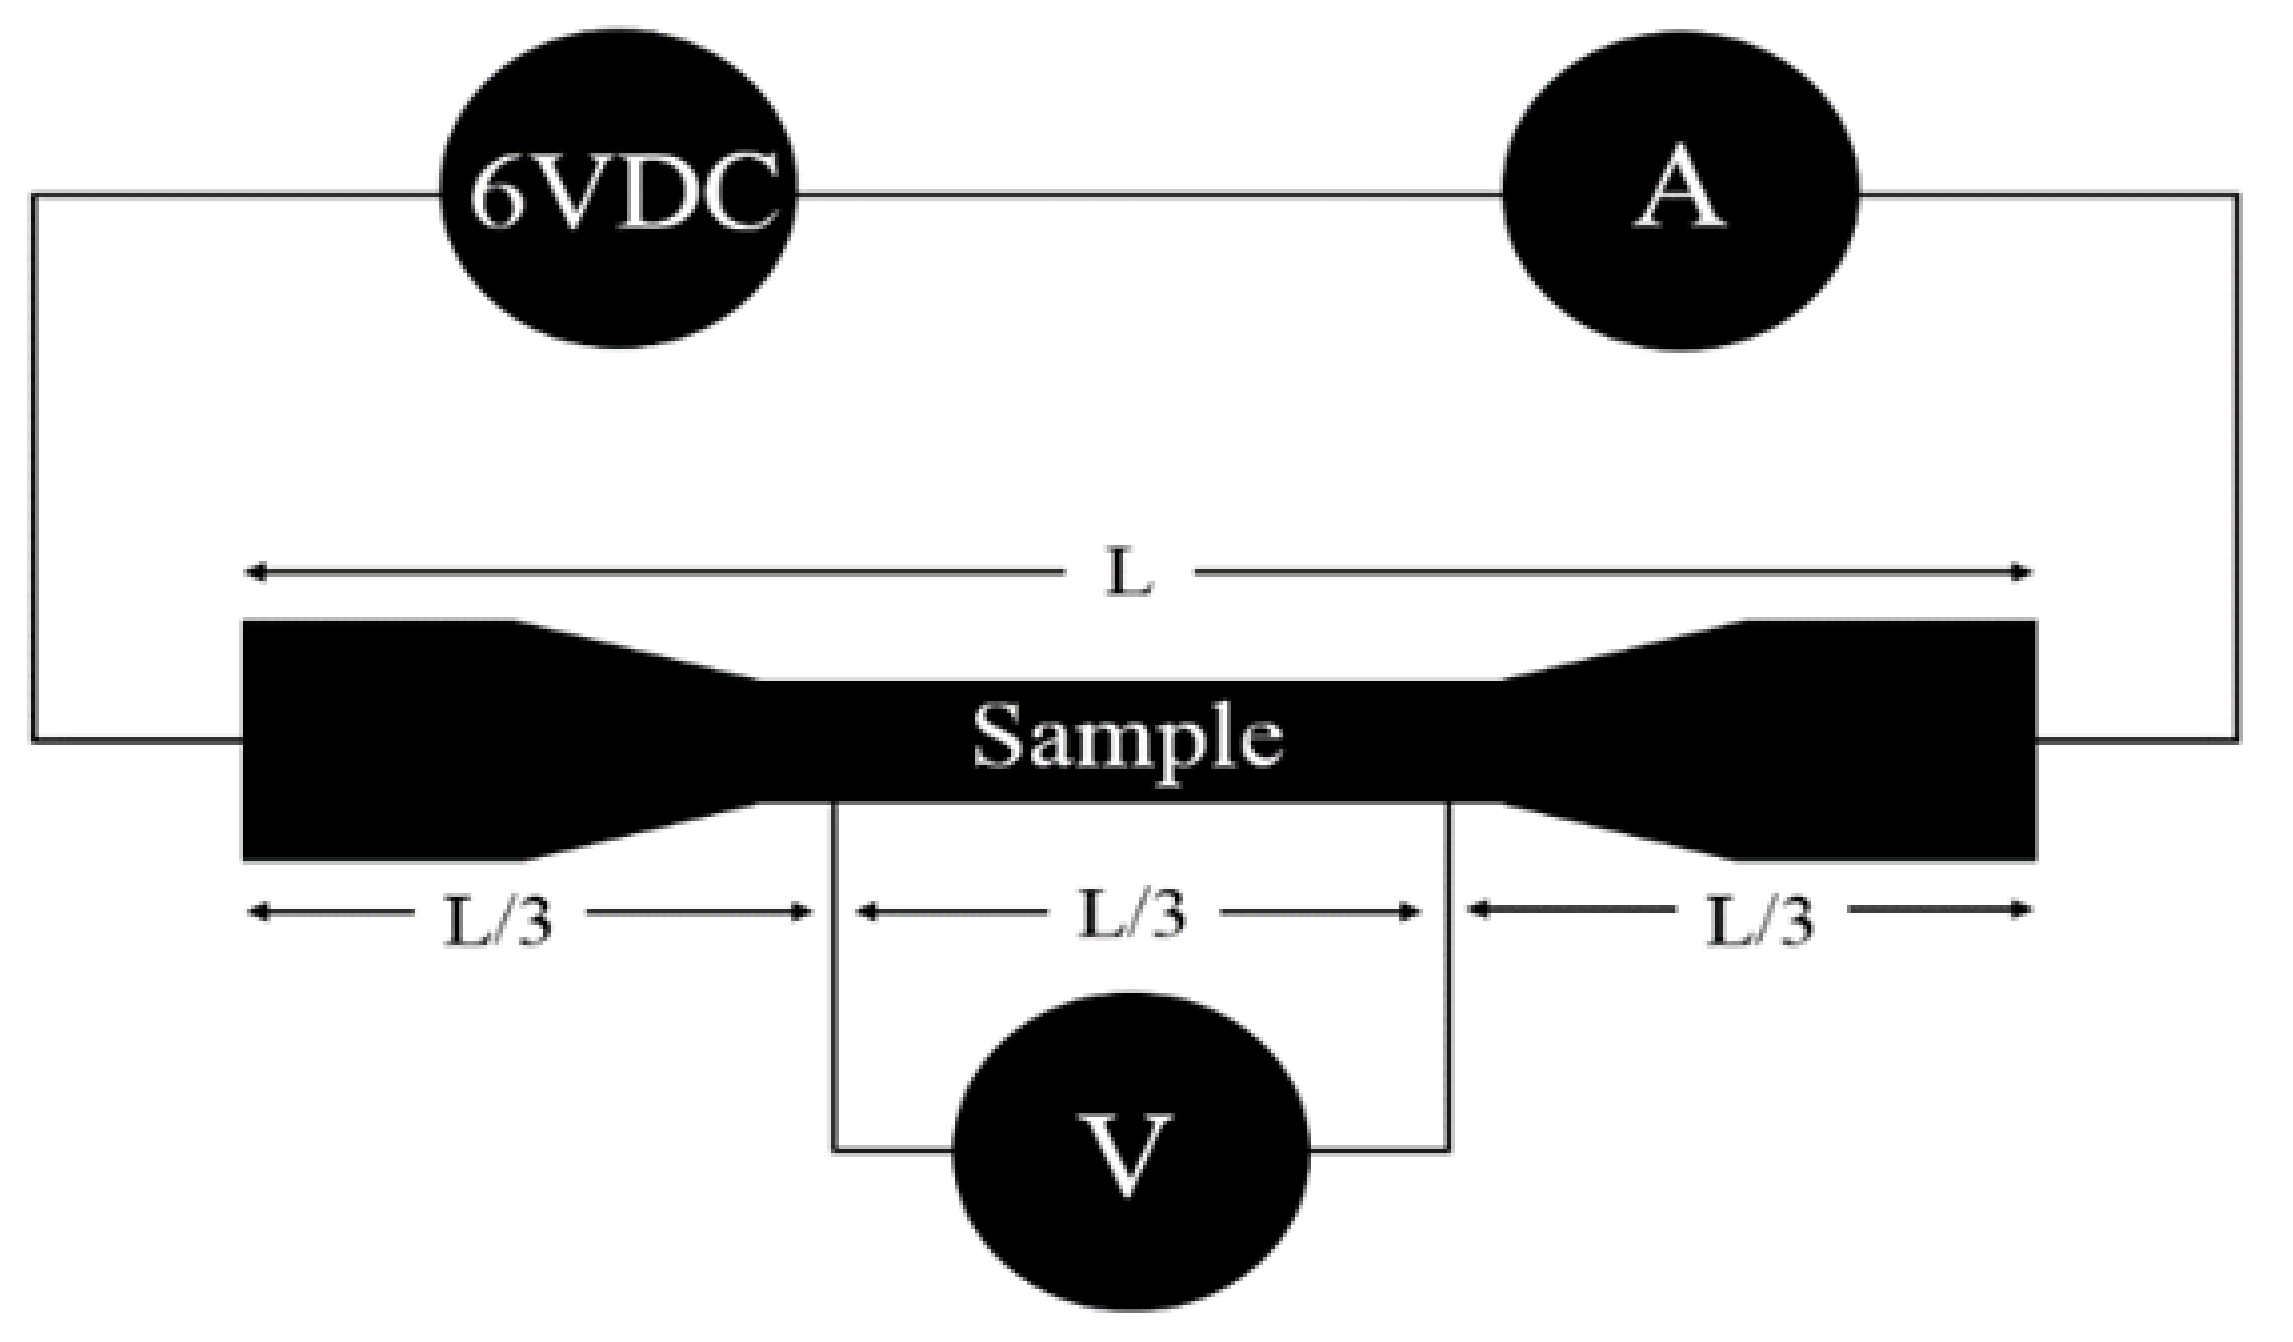
2.5. Electrical Conductivity Testing

Electrical conductivity testing was performed using a four-point probe method, depicted in Figure 3. In this method, the four contact points are evenly separated by a distance of L/3, where L is the total length of the specimen. At the two outer points of contact, a DC power supply (Agilent E3631A, Agilent, Santa Clara, CA, USA), providing 6 V, was connected in series to the specimen, as well as a multimeter to measure the current. A 100 Ω resistor was also connected in series with the specimen to stabilize the current passing through it. The inner points of contact were connected in parallel to a second multimeter to measure the voltage across a length of L/3 of the specimen.
Electrical conductivity was calculated using the following equation:
σ = I     l V w t
where I denotes current (A), V is the voltage drop across the specimen (V), and l , w , and t represent the specimen length, width, and thickness (m), respectively. For core conductivity testing, at the same points of contact as surface testing, a nickel nail was inserted into the specimen approximately halfway through its total thickness and the probes were attached to the nails.

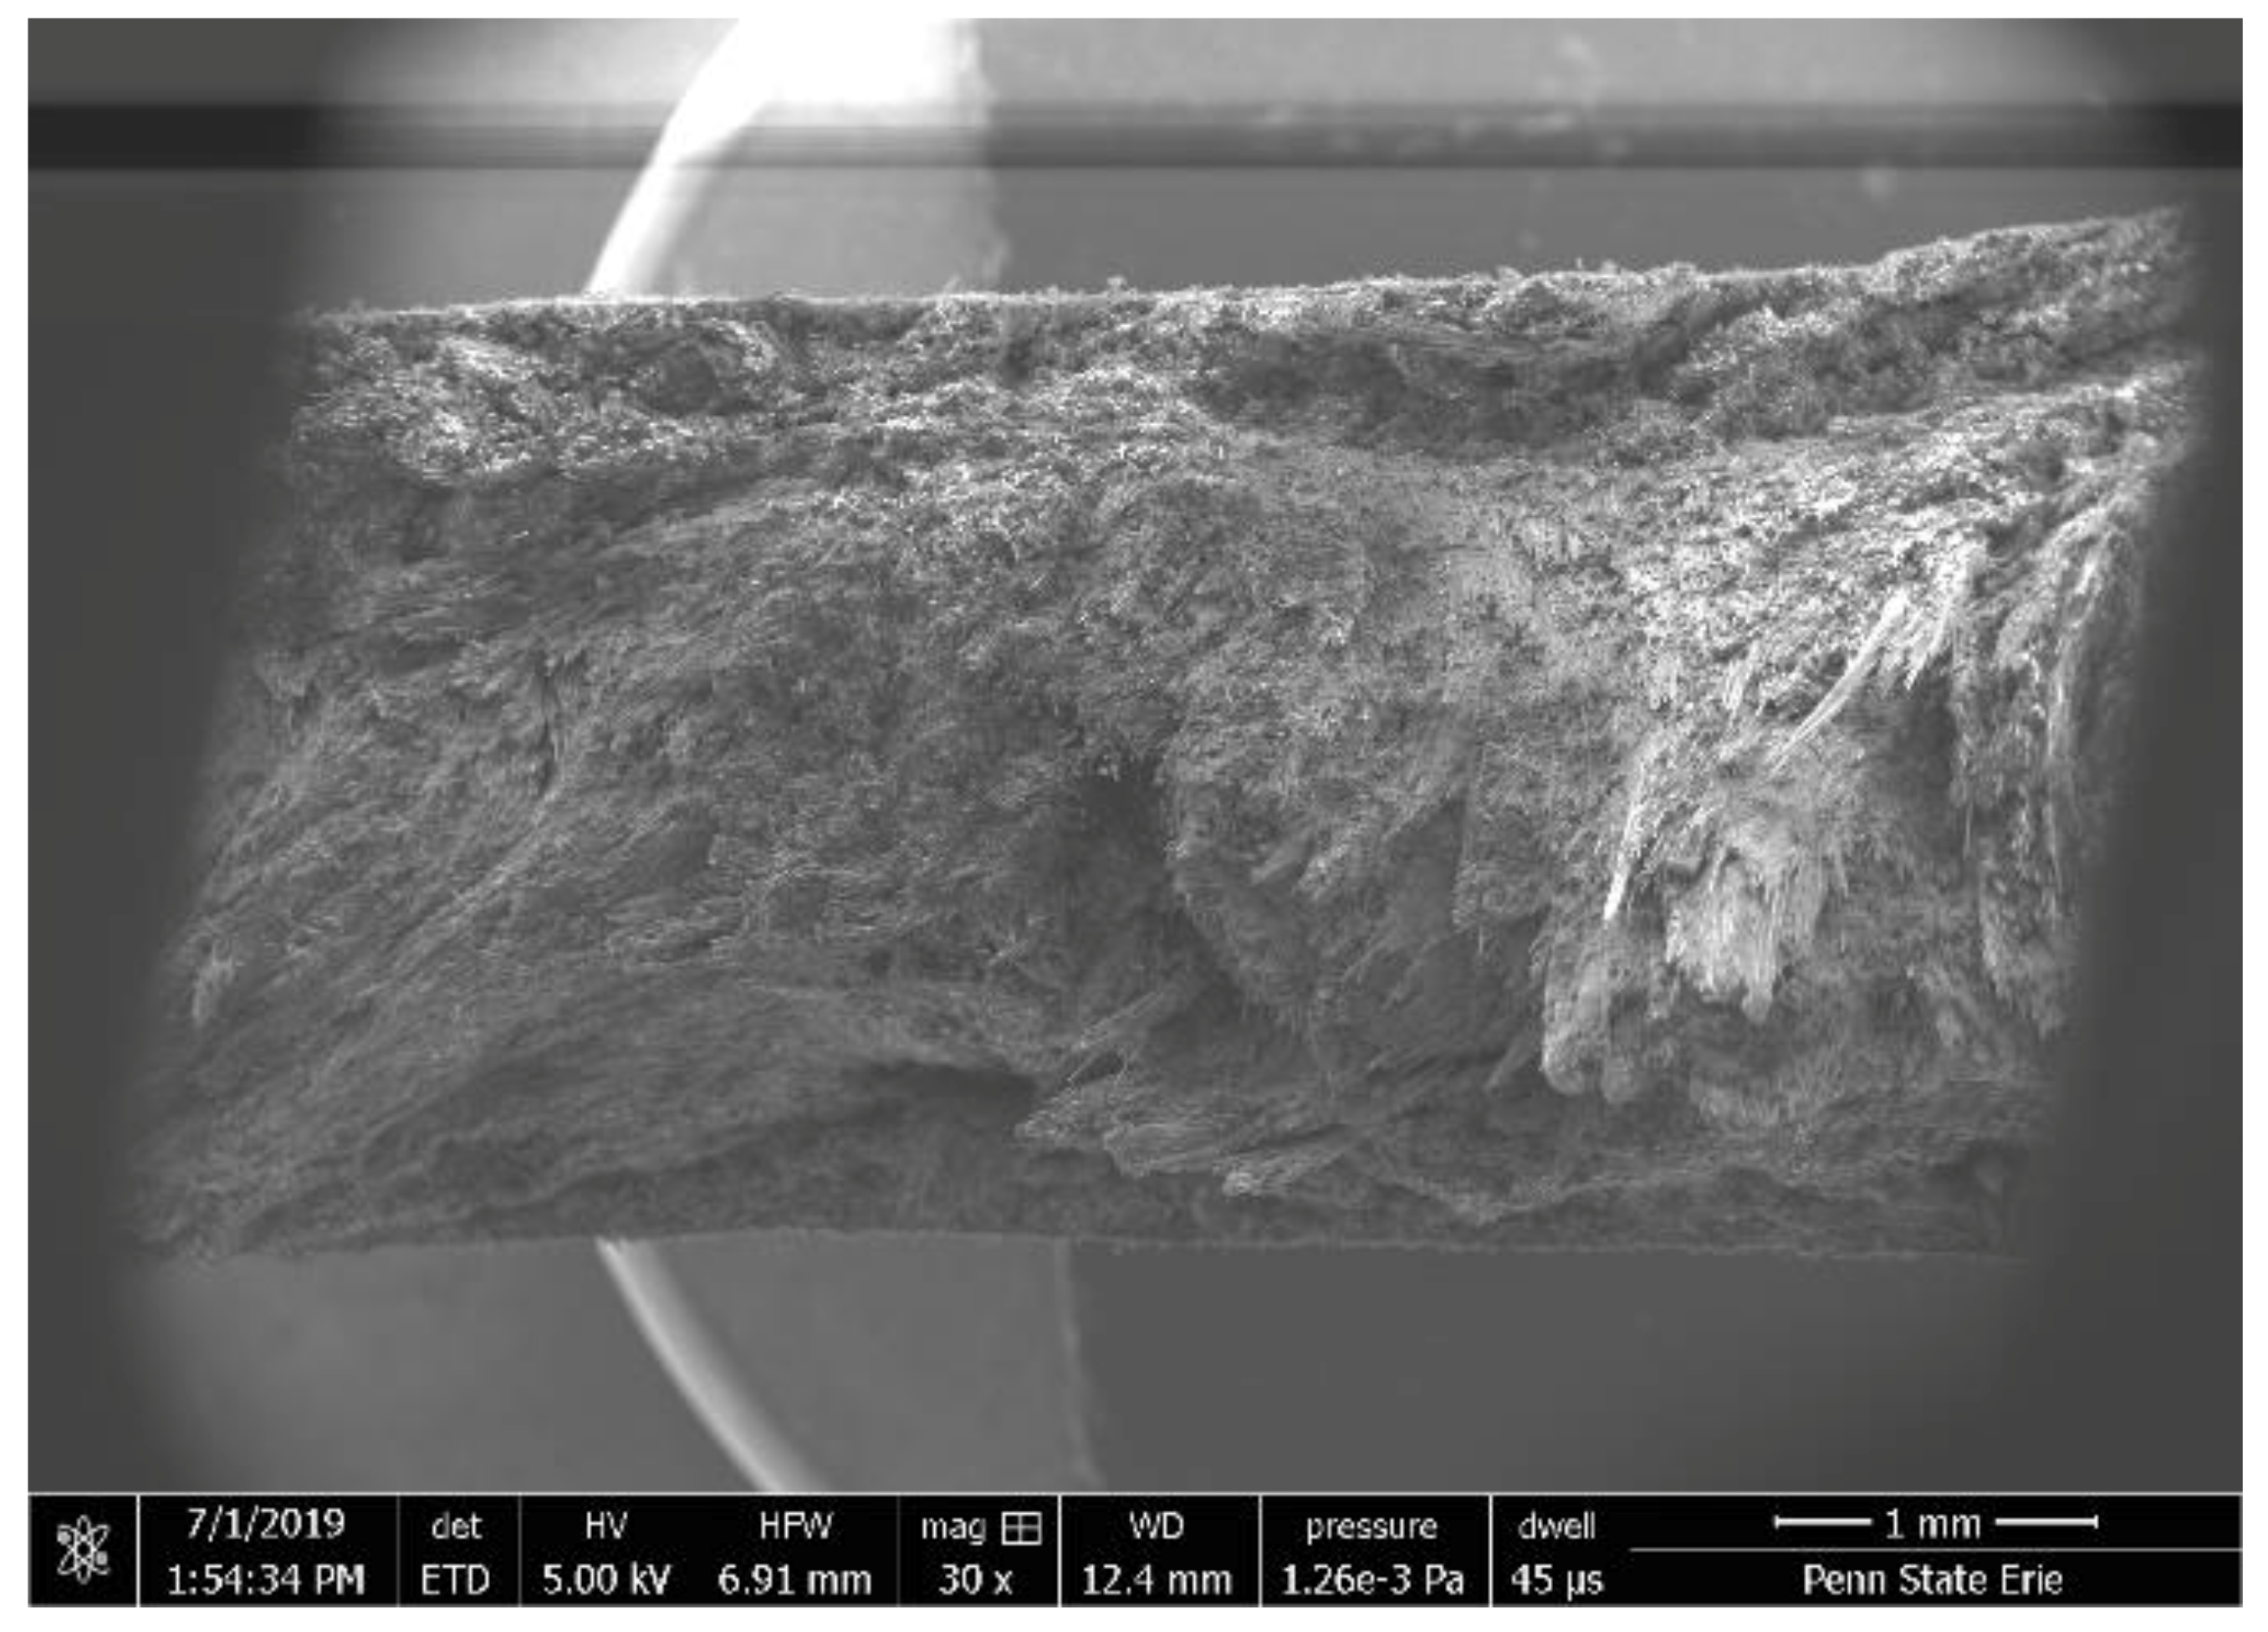
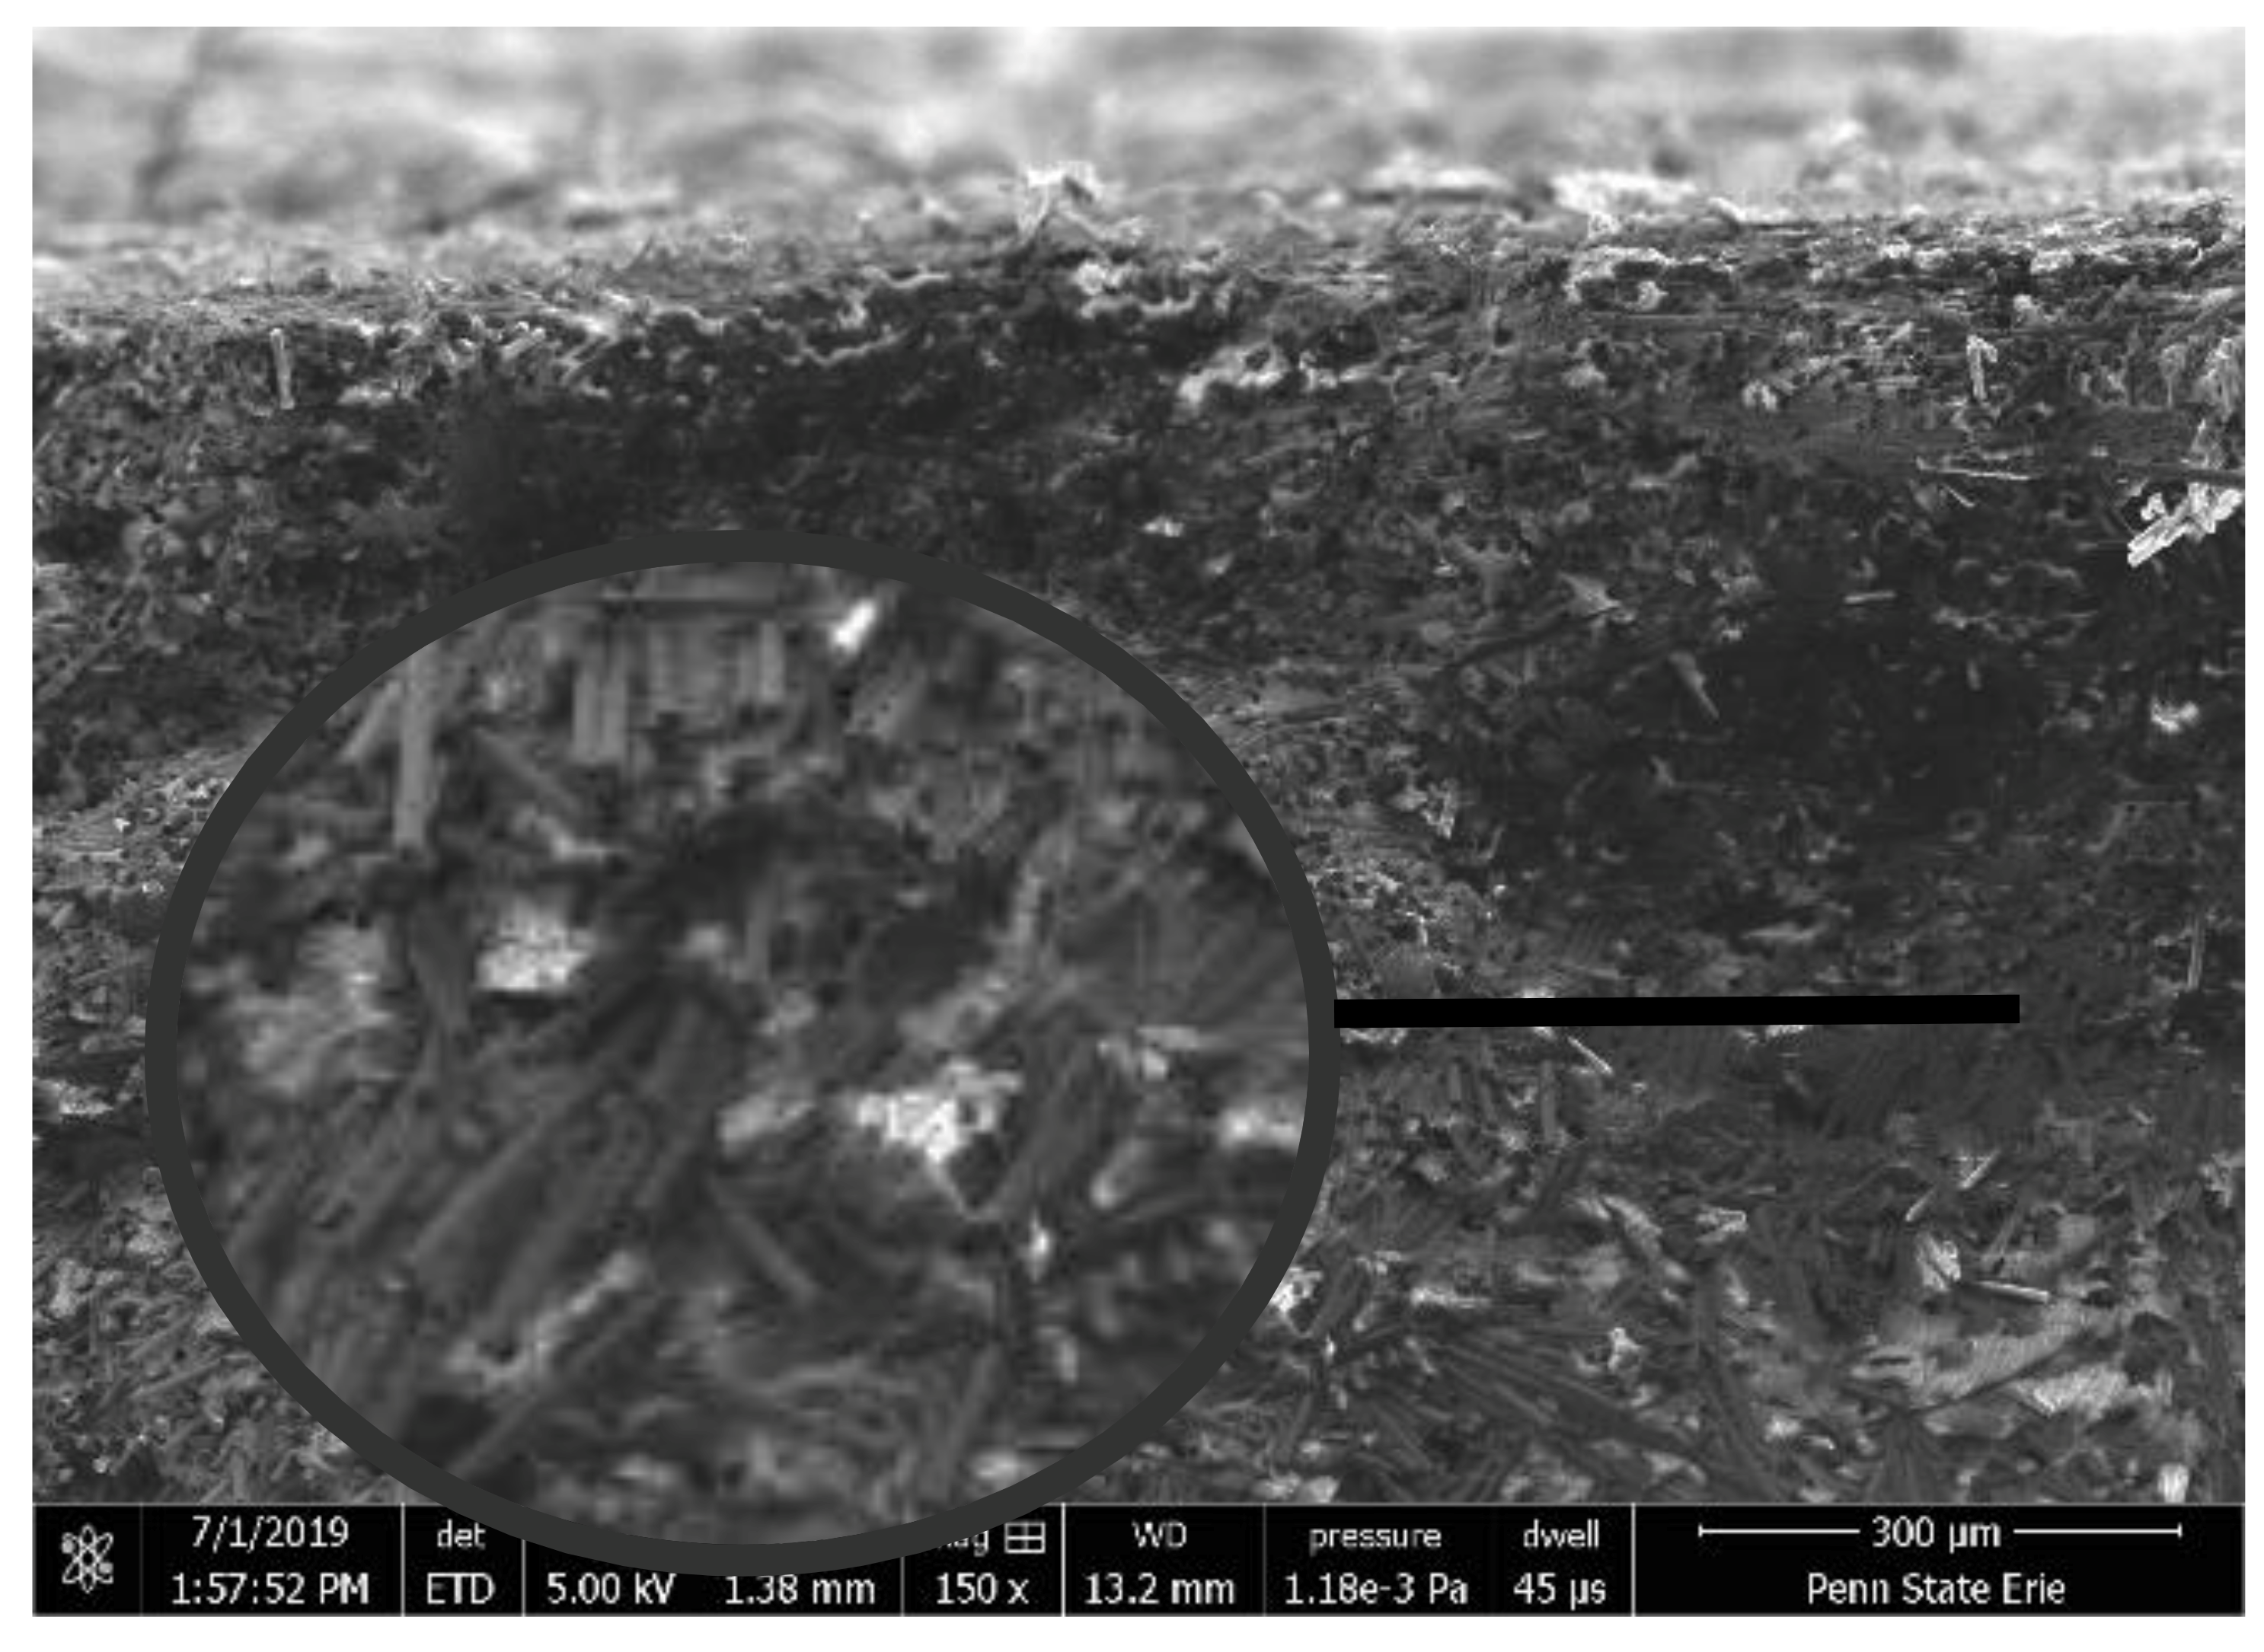
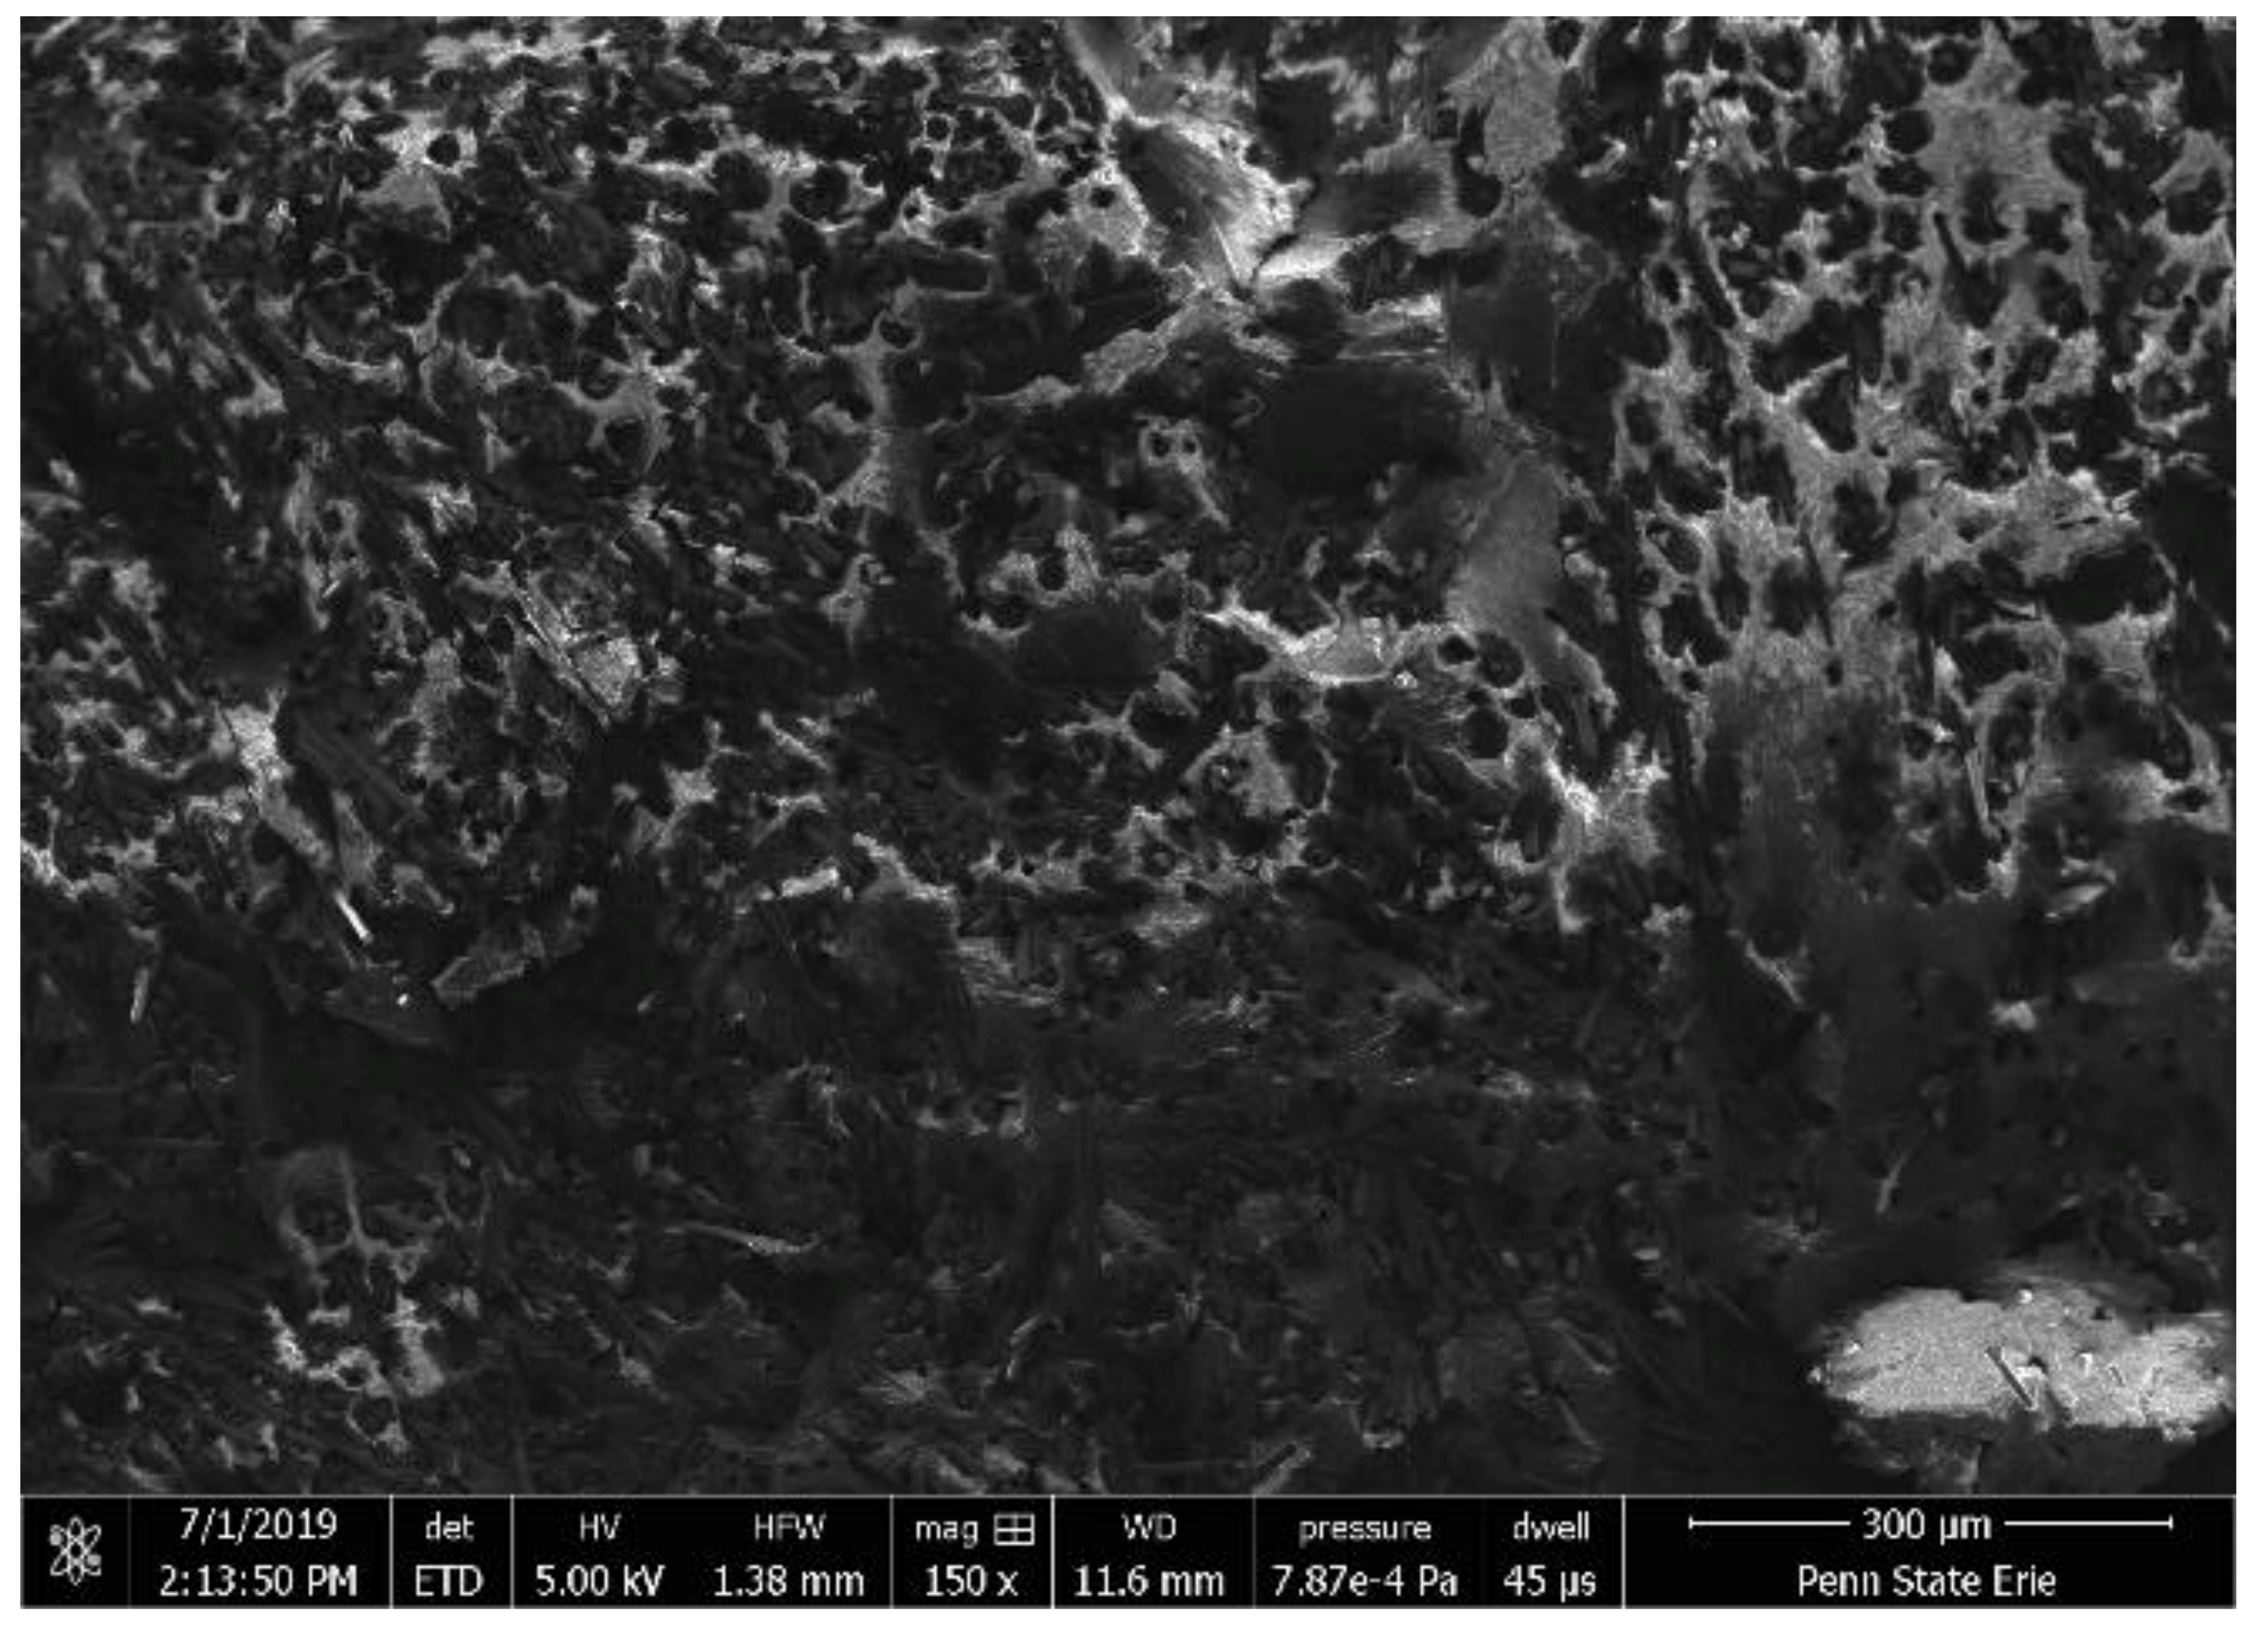
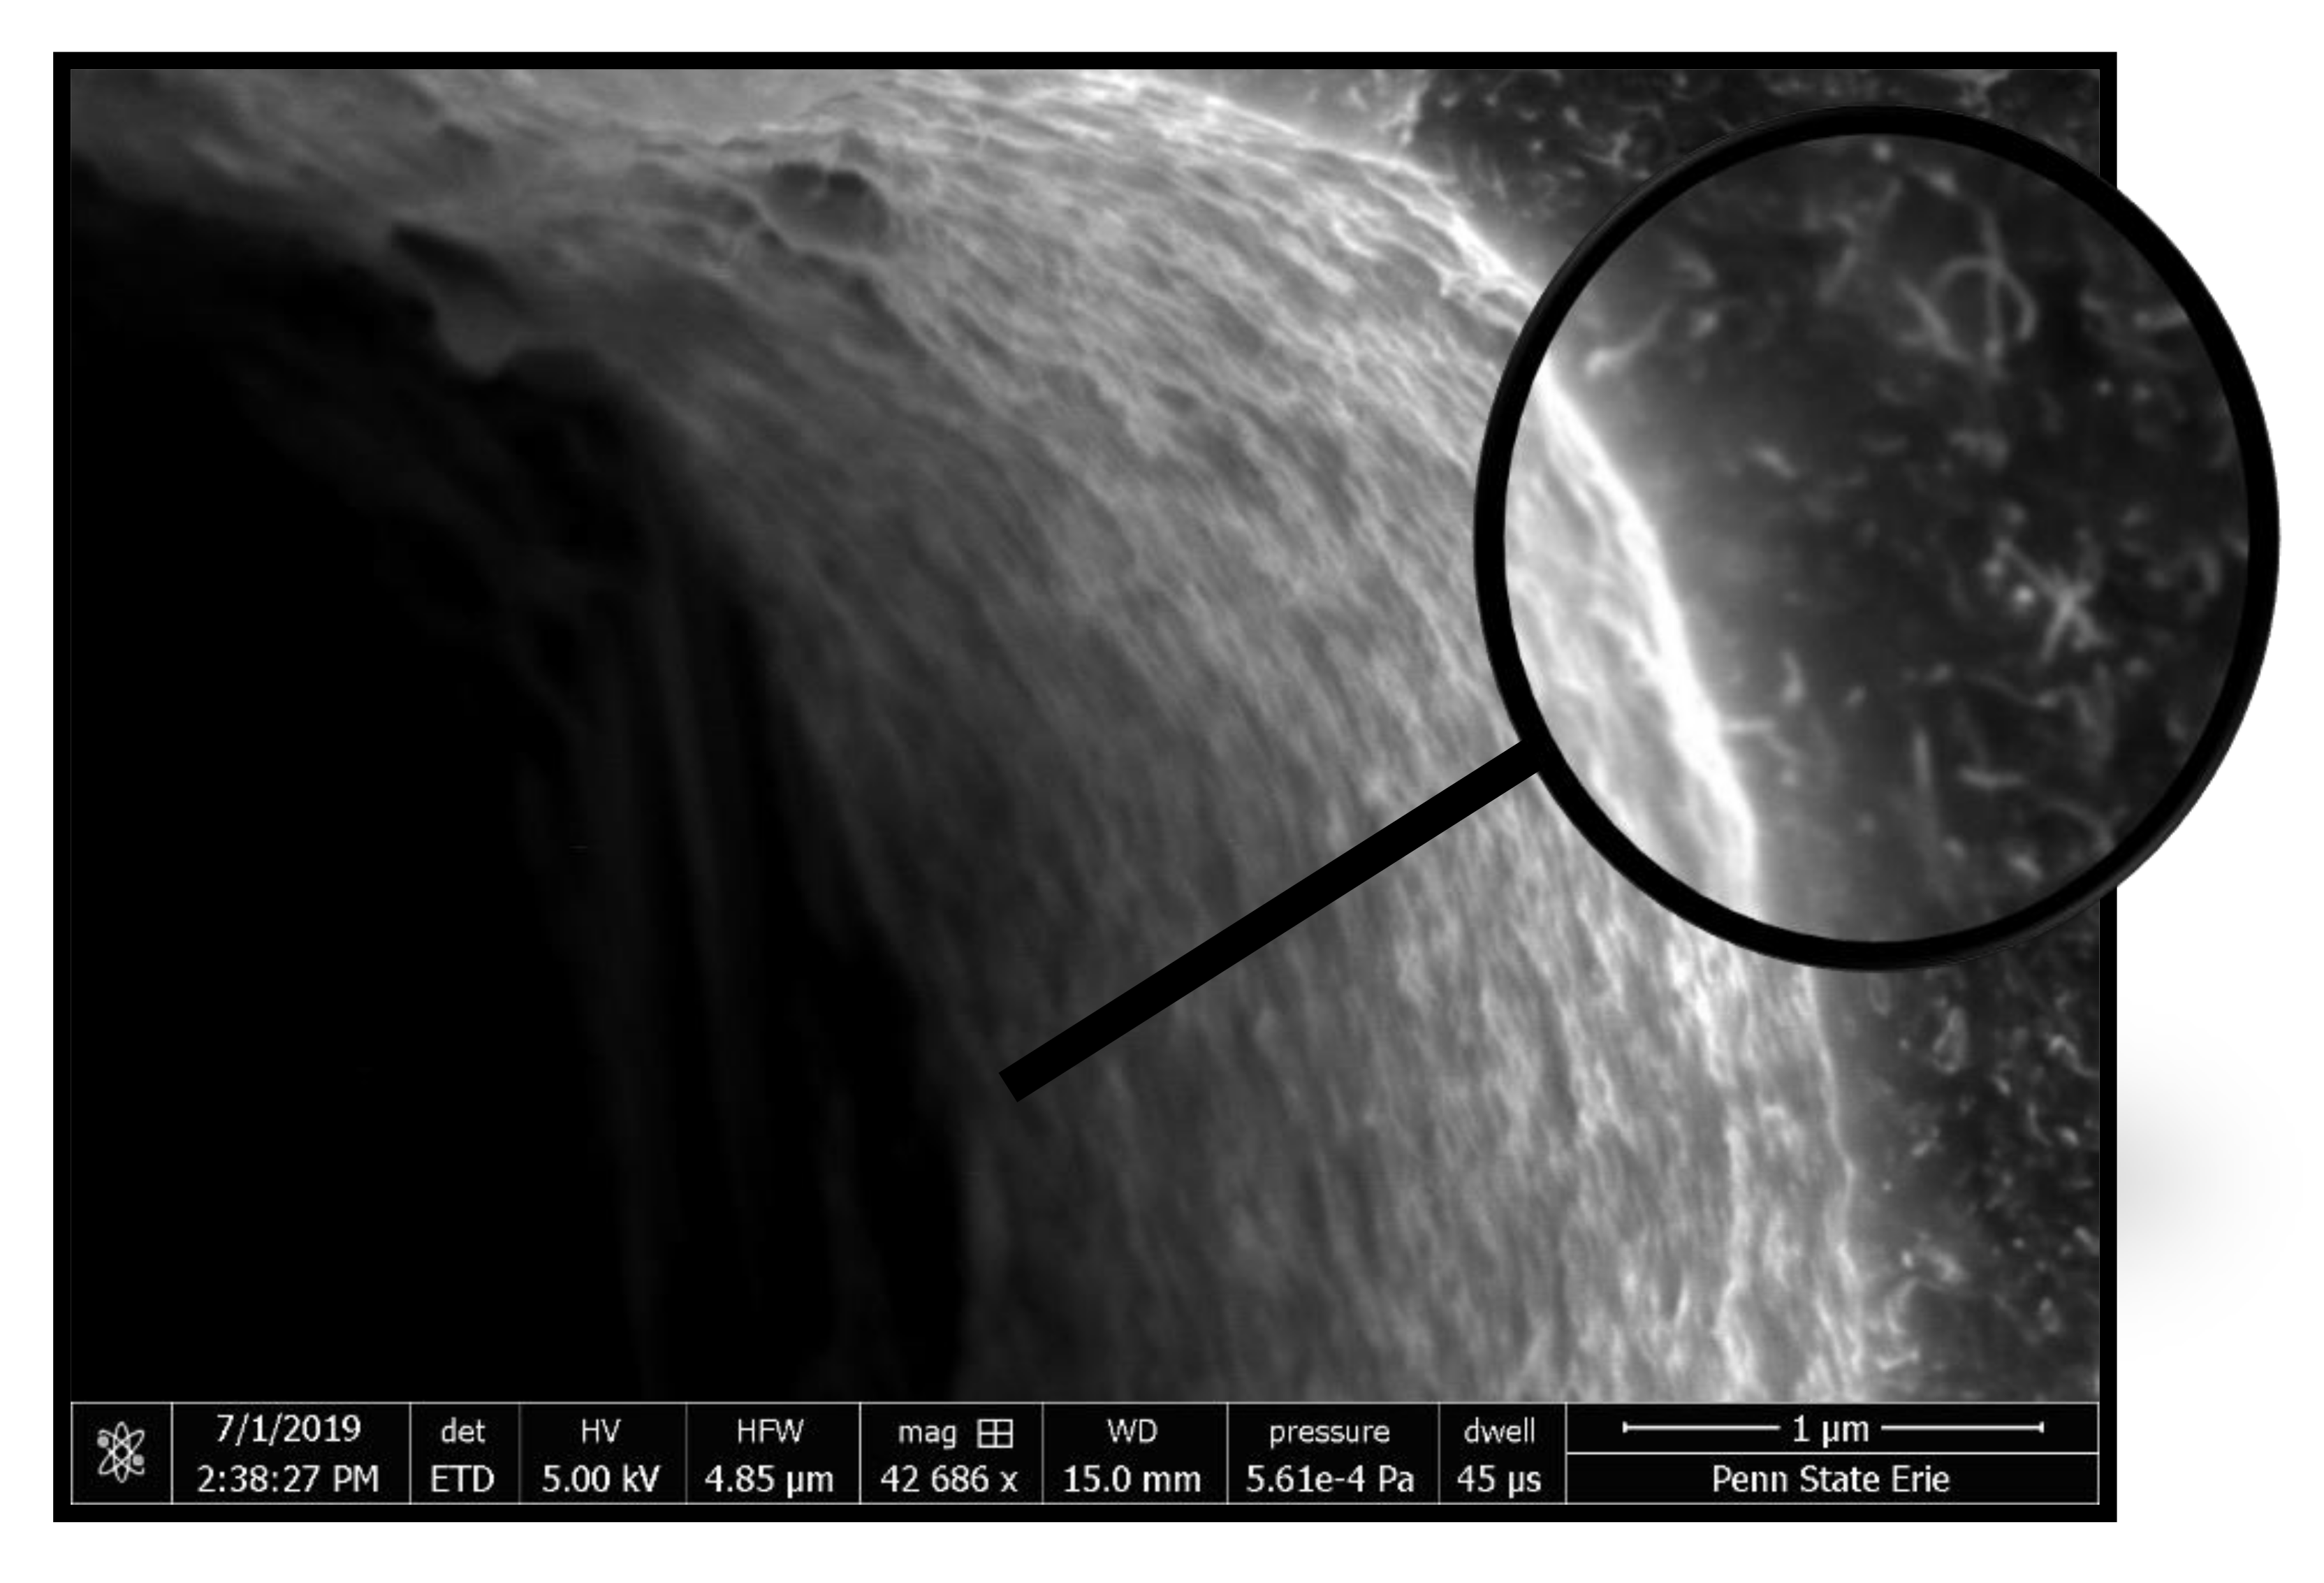
3. Microstructural Analysis

Mechanical properties [10] and electrical conductivity [28] are highly dependent upon the dispersion of the reinforcement phase. To evaluate the specimen microstructure, scanning electron microscopy (SEM) images were acquired. Prior to SEM imaging, specimens were placed in liquid nitrogen and then broken to create a clean surface for imaging. SEM images show a distinct layer of nylon 6,6 on the surfaces of the specimens (Figure 4). Due to the lower viscosity of nylon, the polymer follows the central flow path of the mold and then fills along the mold surface due to fountain flow. When the nylon comes into contact with the mold surface, it freezes into an amorphous state. Closer to the center of the mold, the nylon stays warmer longer and can form crystals. Figure 5 and Figure 6 show that there exists a difference in carbon fiber content as well as their orientation at varying distances from the specimen surface.
As the distance from the surface increases, the fibers have greater alignment. Figure 5 depicts part of the specimen closer to the surface where the carbon fibers are greatly misaligned. Figure 6, taken at the middle of the specimen core, shows that the carbon fibers at the center of the composite are aligned parallel to the direction of flow during fabrication (along the length of the specimen) and are parallel with each other.
Figure 7 shows the carbon nanotubes surrounding a hole in the composite where a carbon fiber was present before the fracture. This image shows that the addition of CNTs fills the voids of non-conductive nylon 6,6 between carbon fibers within the composite matrix, thereby forming more electrical pathways within each specimen.

4. Results and Discussion

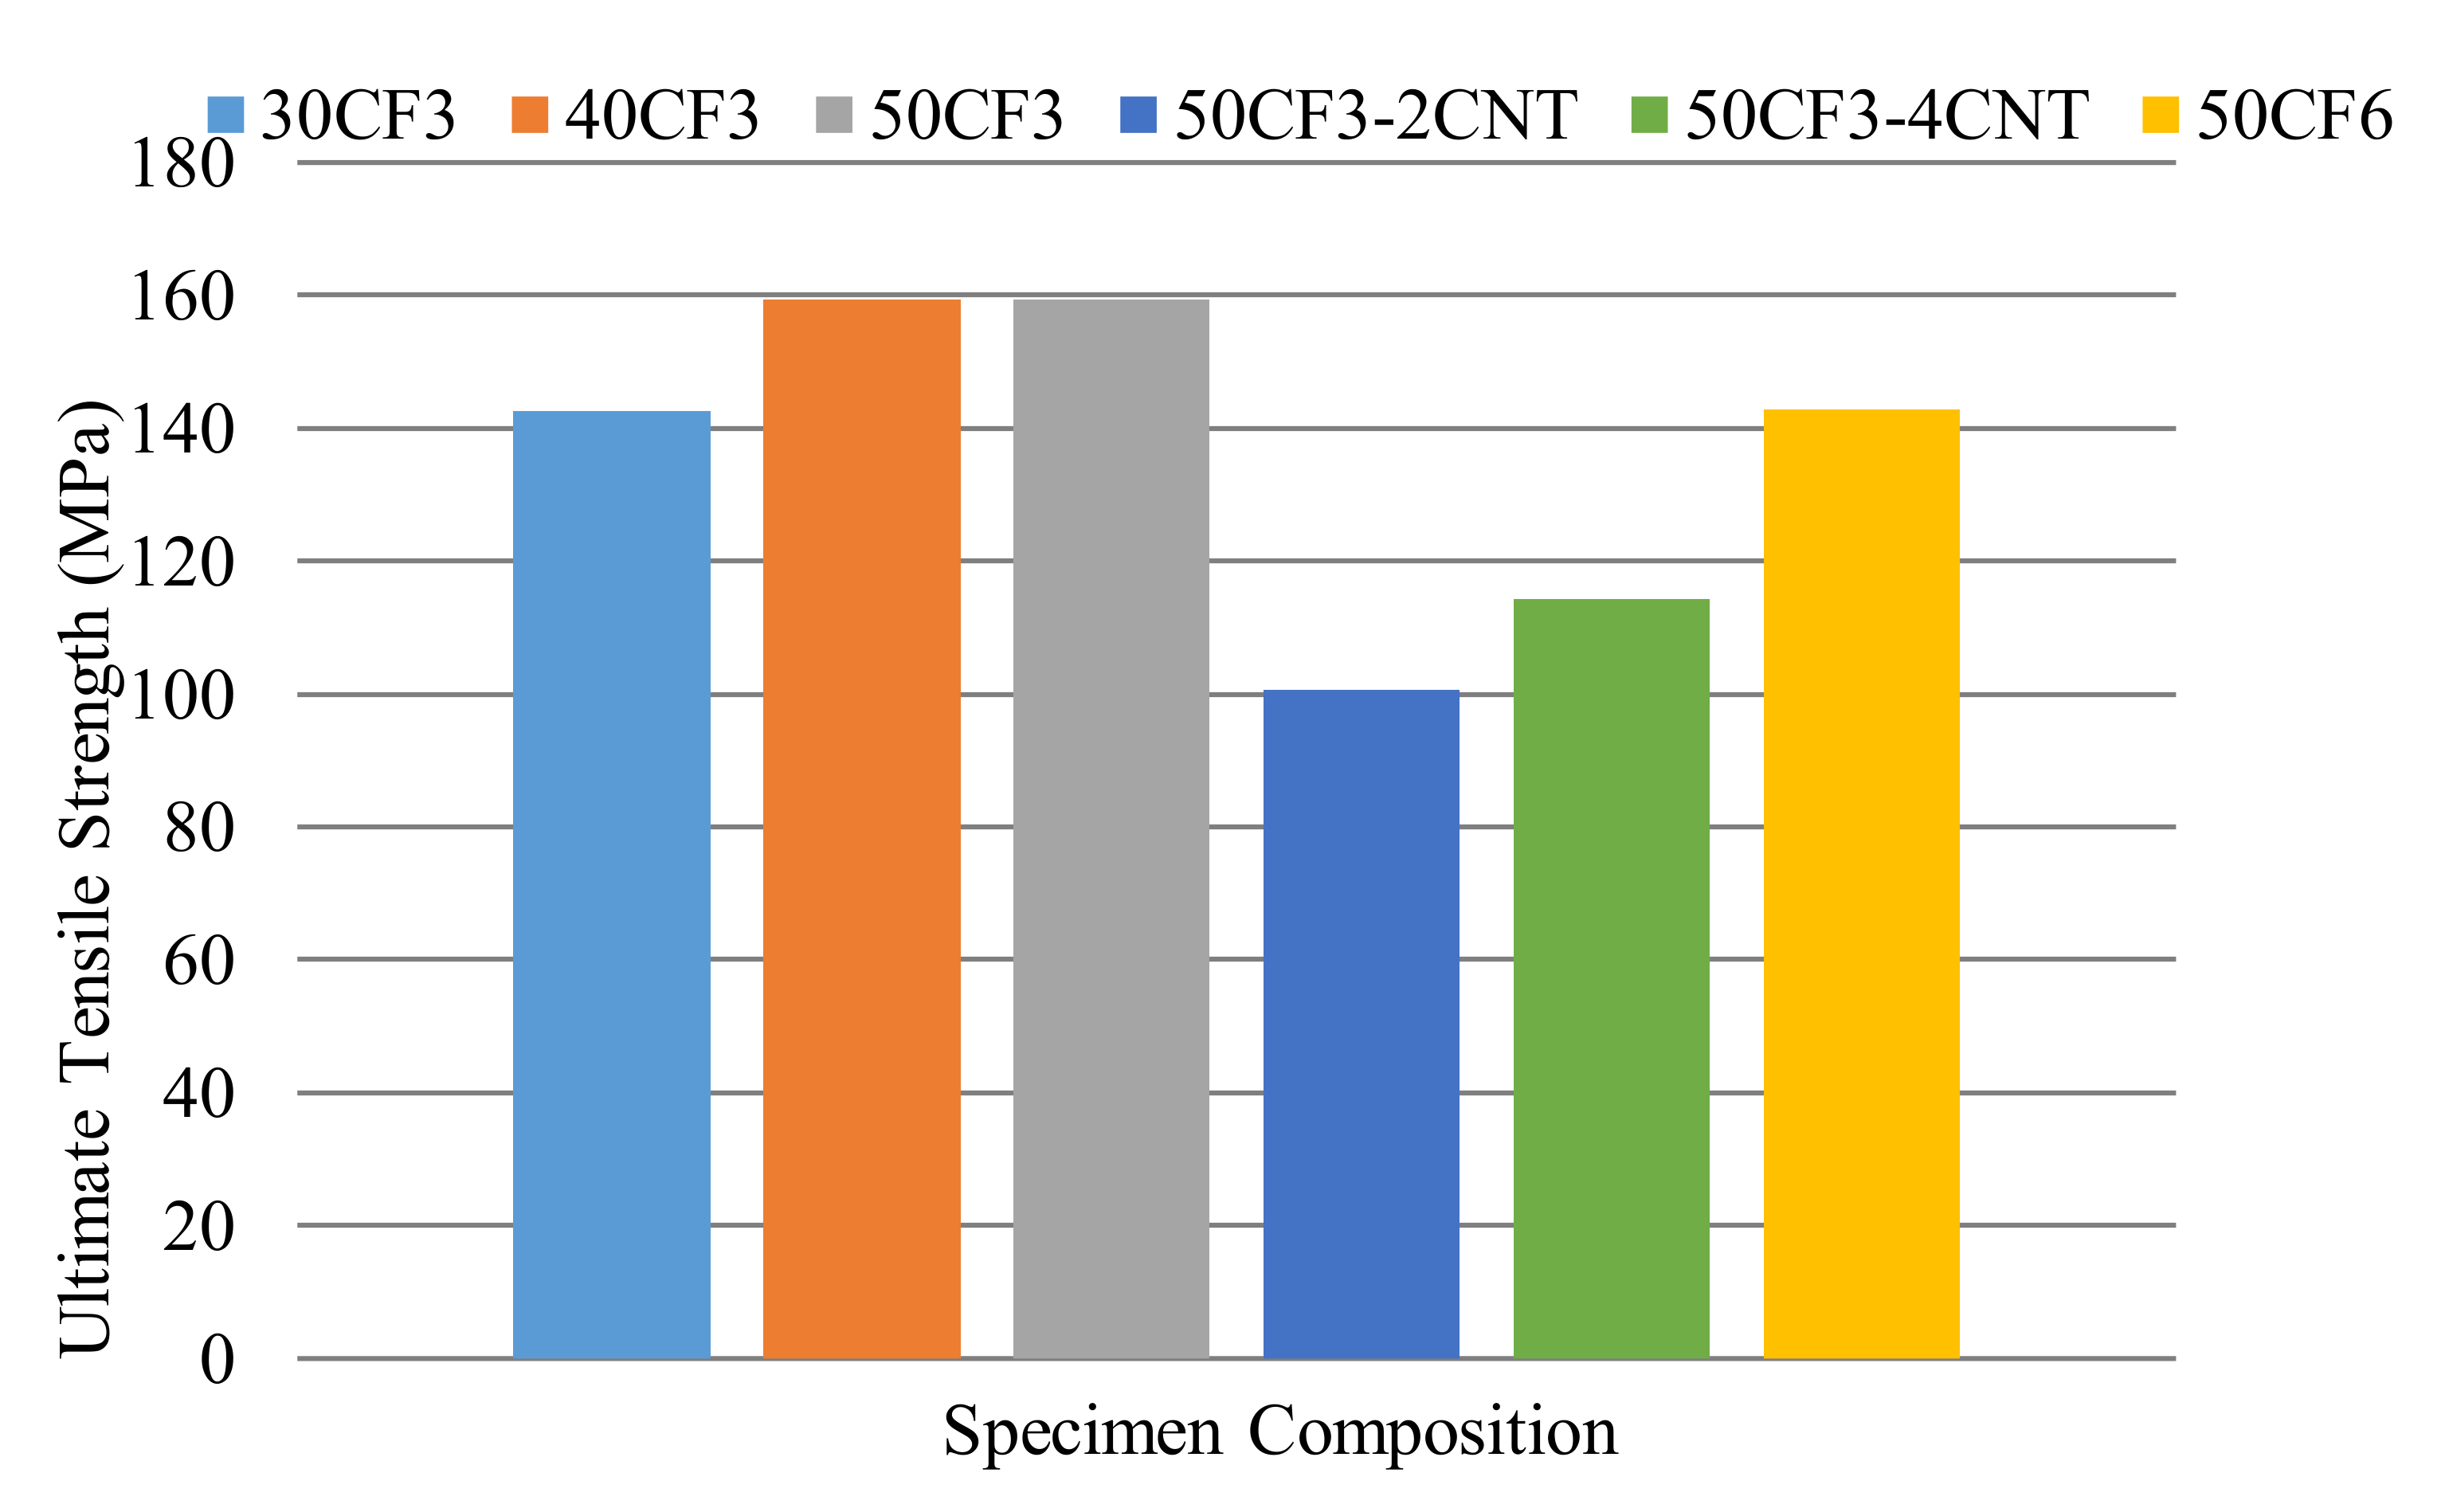
4.1. Ultimate Tensile Strength

The ultimate tensile stress was determined through tensile testing. Figure 8 shows the average value for ultimate tensile strength for each composition.
As shown in Figure 8, the addition of carbon nanotubes lowers the ultimate tensile strength of a specimen. Adding carbon nanotubes creates stress concentrations, a known hot zone for failure. Increasing the carbon fiber content and carbon fiber length had minimal effect on ultimate tensile strength. The composition of 50% CF6 had a slightly lower ultimate tensile strength compared to the 50% CF3 composition, but it was still higher than both carbon nanotube compositions.
Table 2 shows the variability in the data. Both specimen compositions that contained carbon nanotubes yielded the highest variability. The next highest coefficient of variation was the composition of 30% CF3. The compositions of 40% CF3 and 50% CF6 gave the lowest results for the coefficient of variation, indicating consistent results.

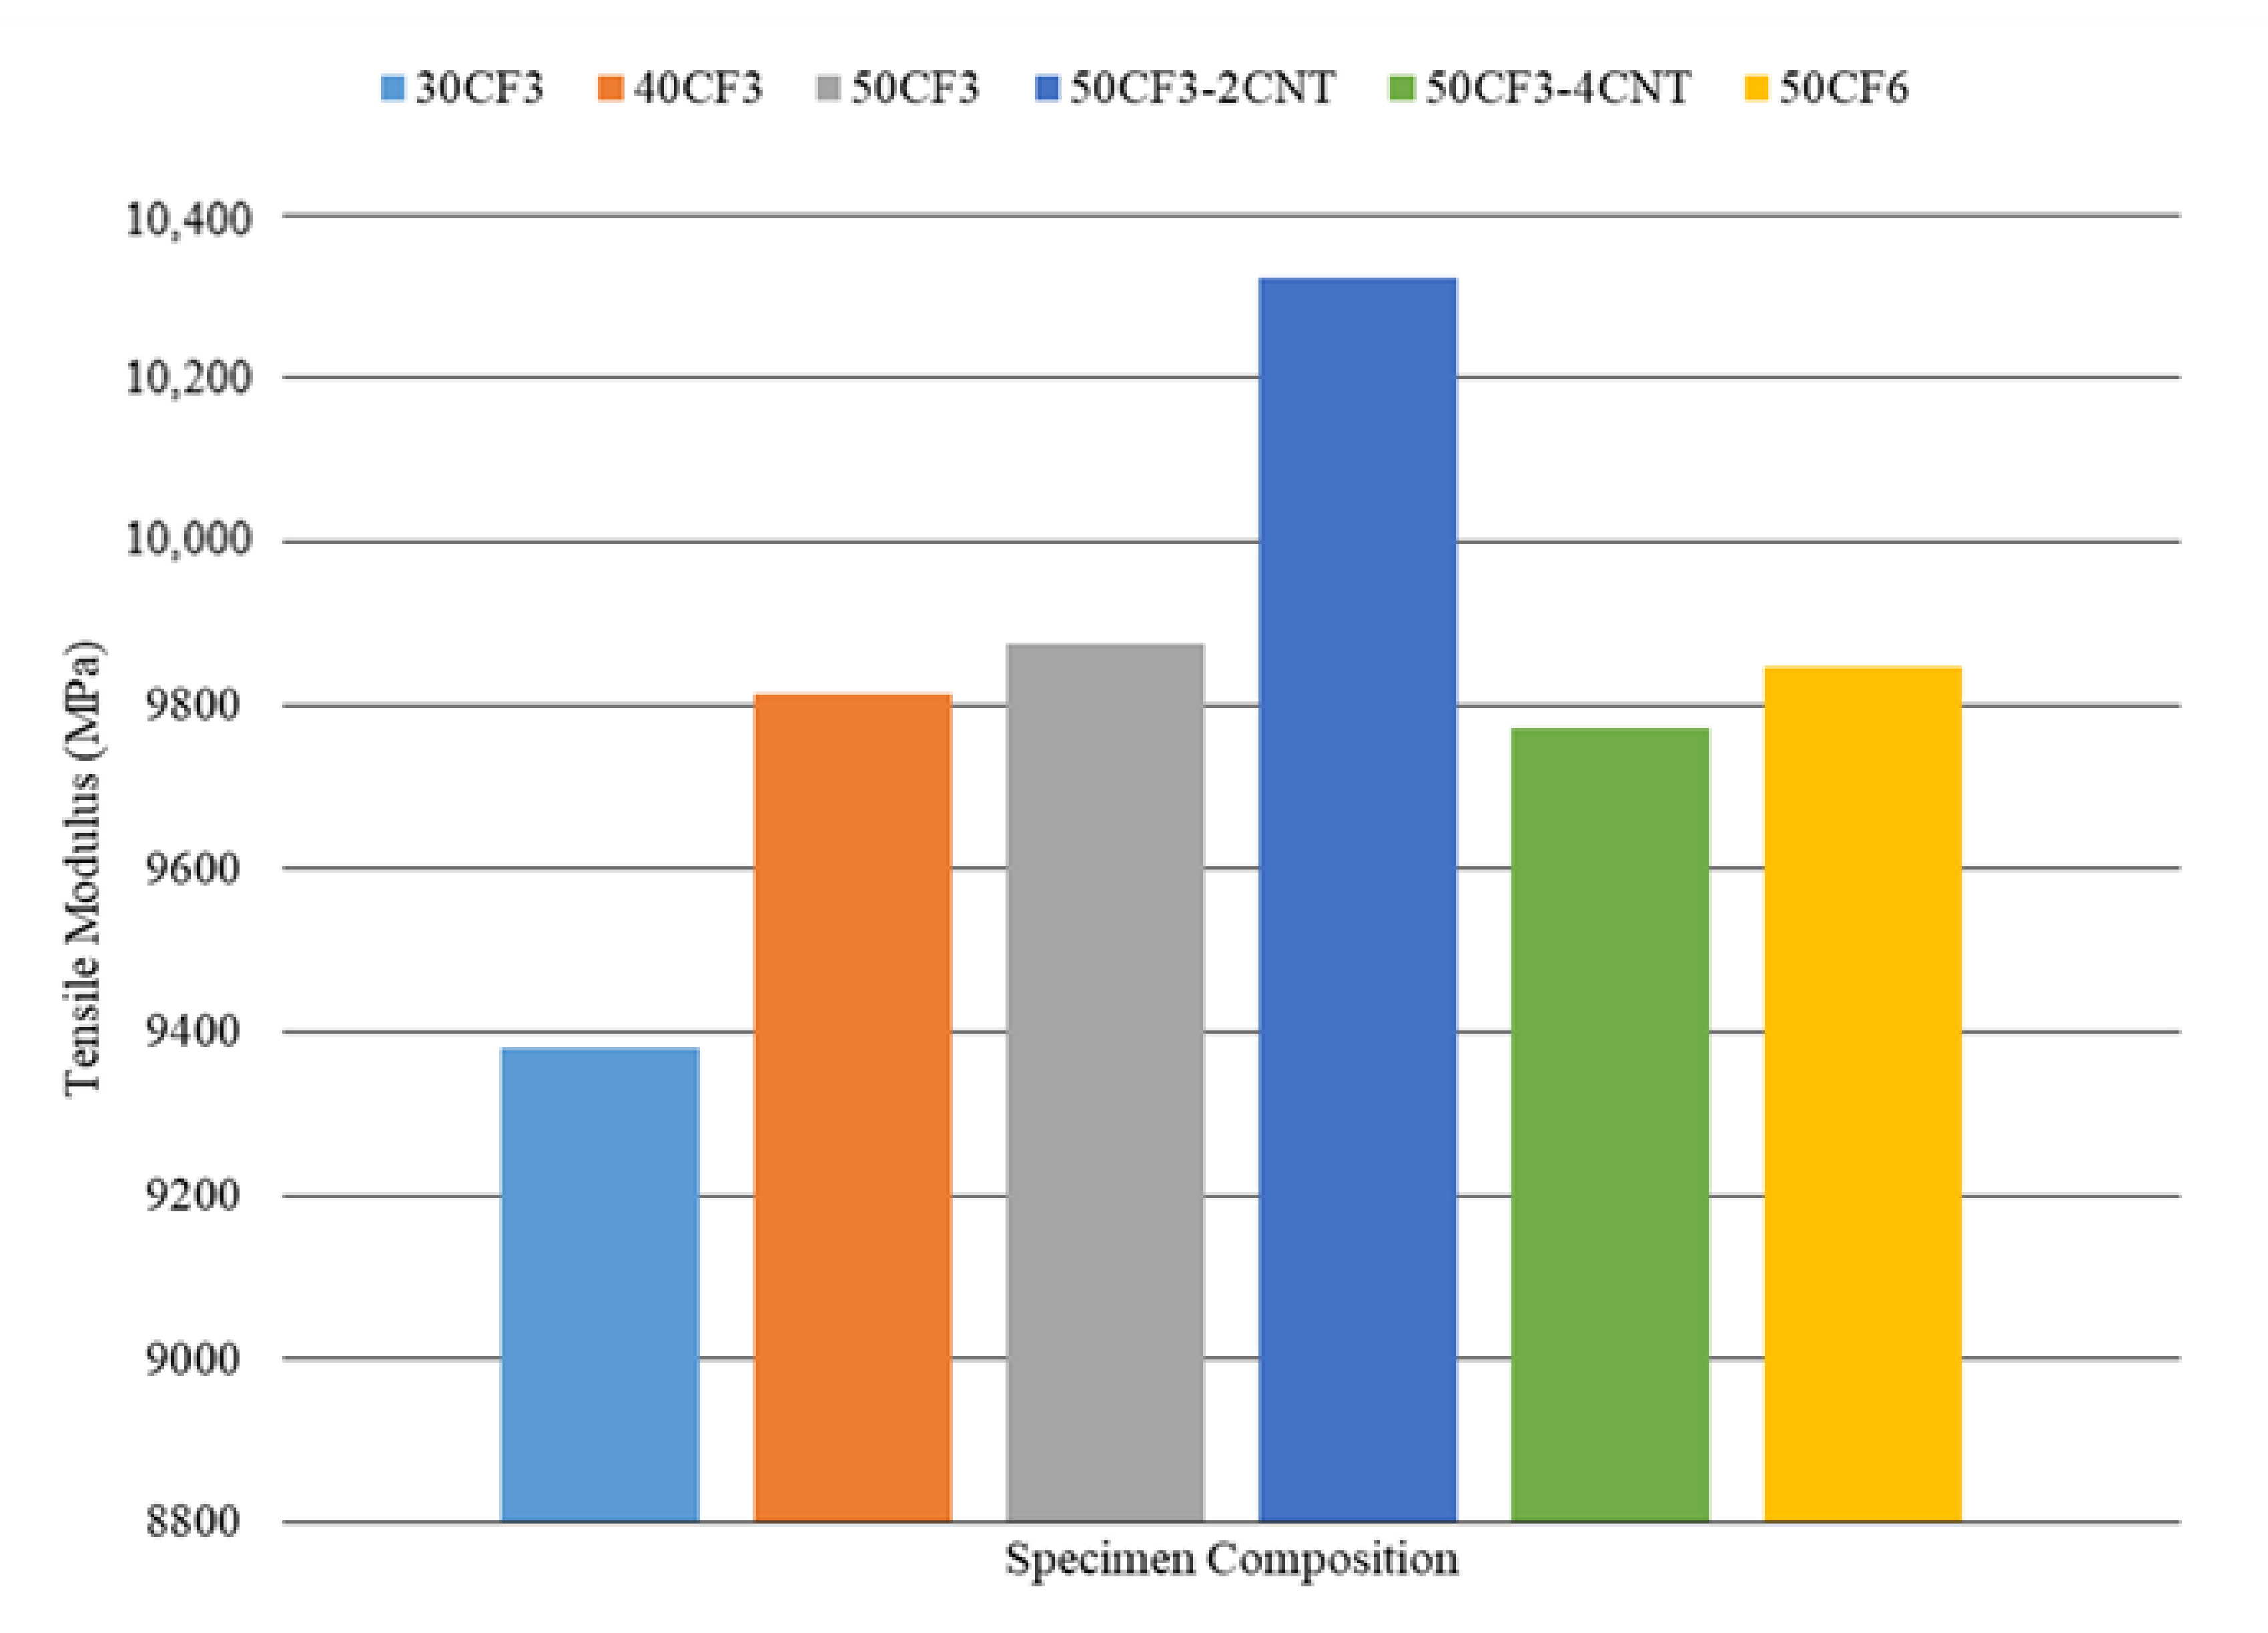
4.2. Tensile Modulus of Elasticity
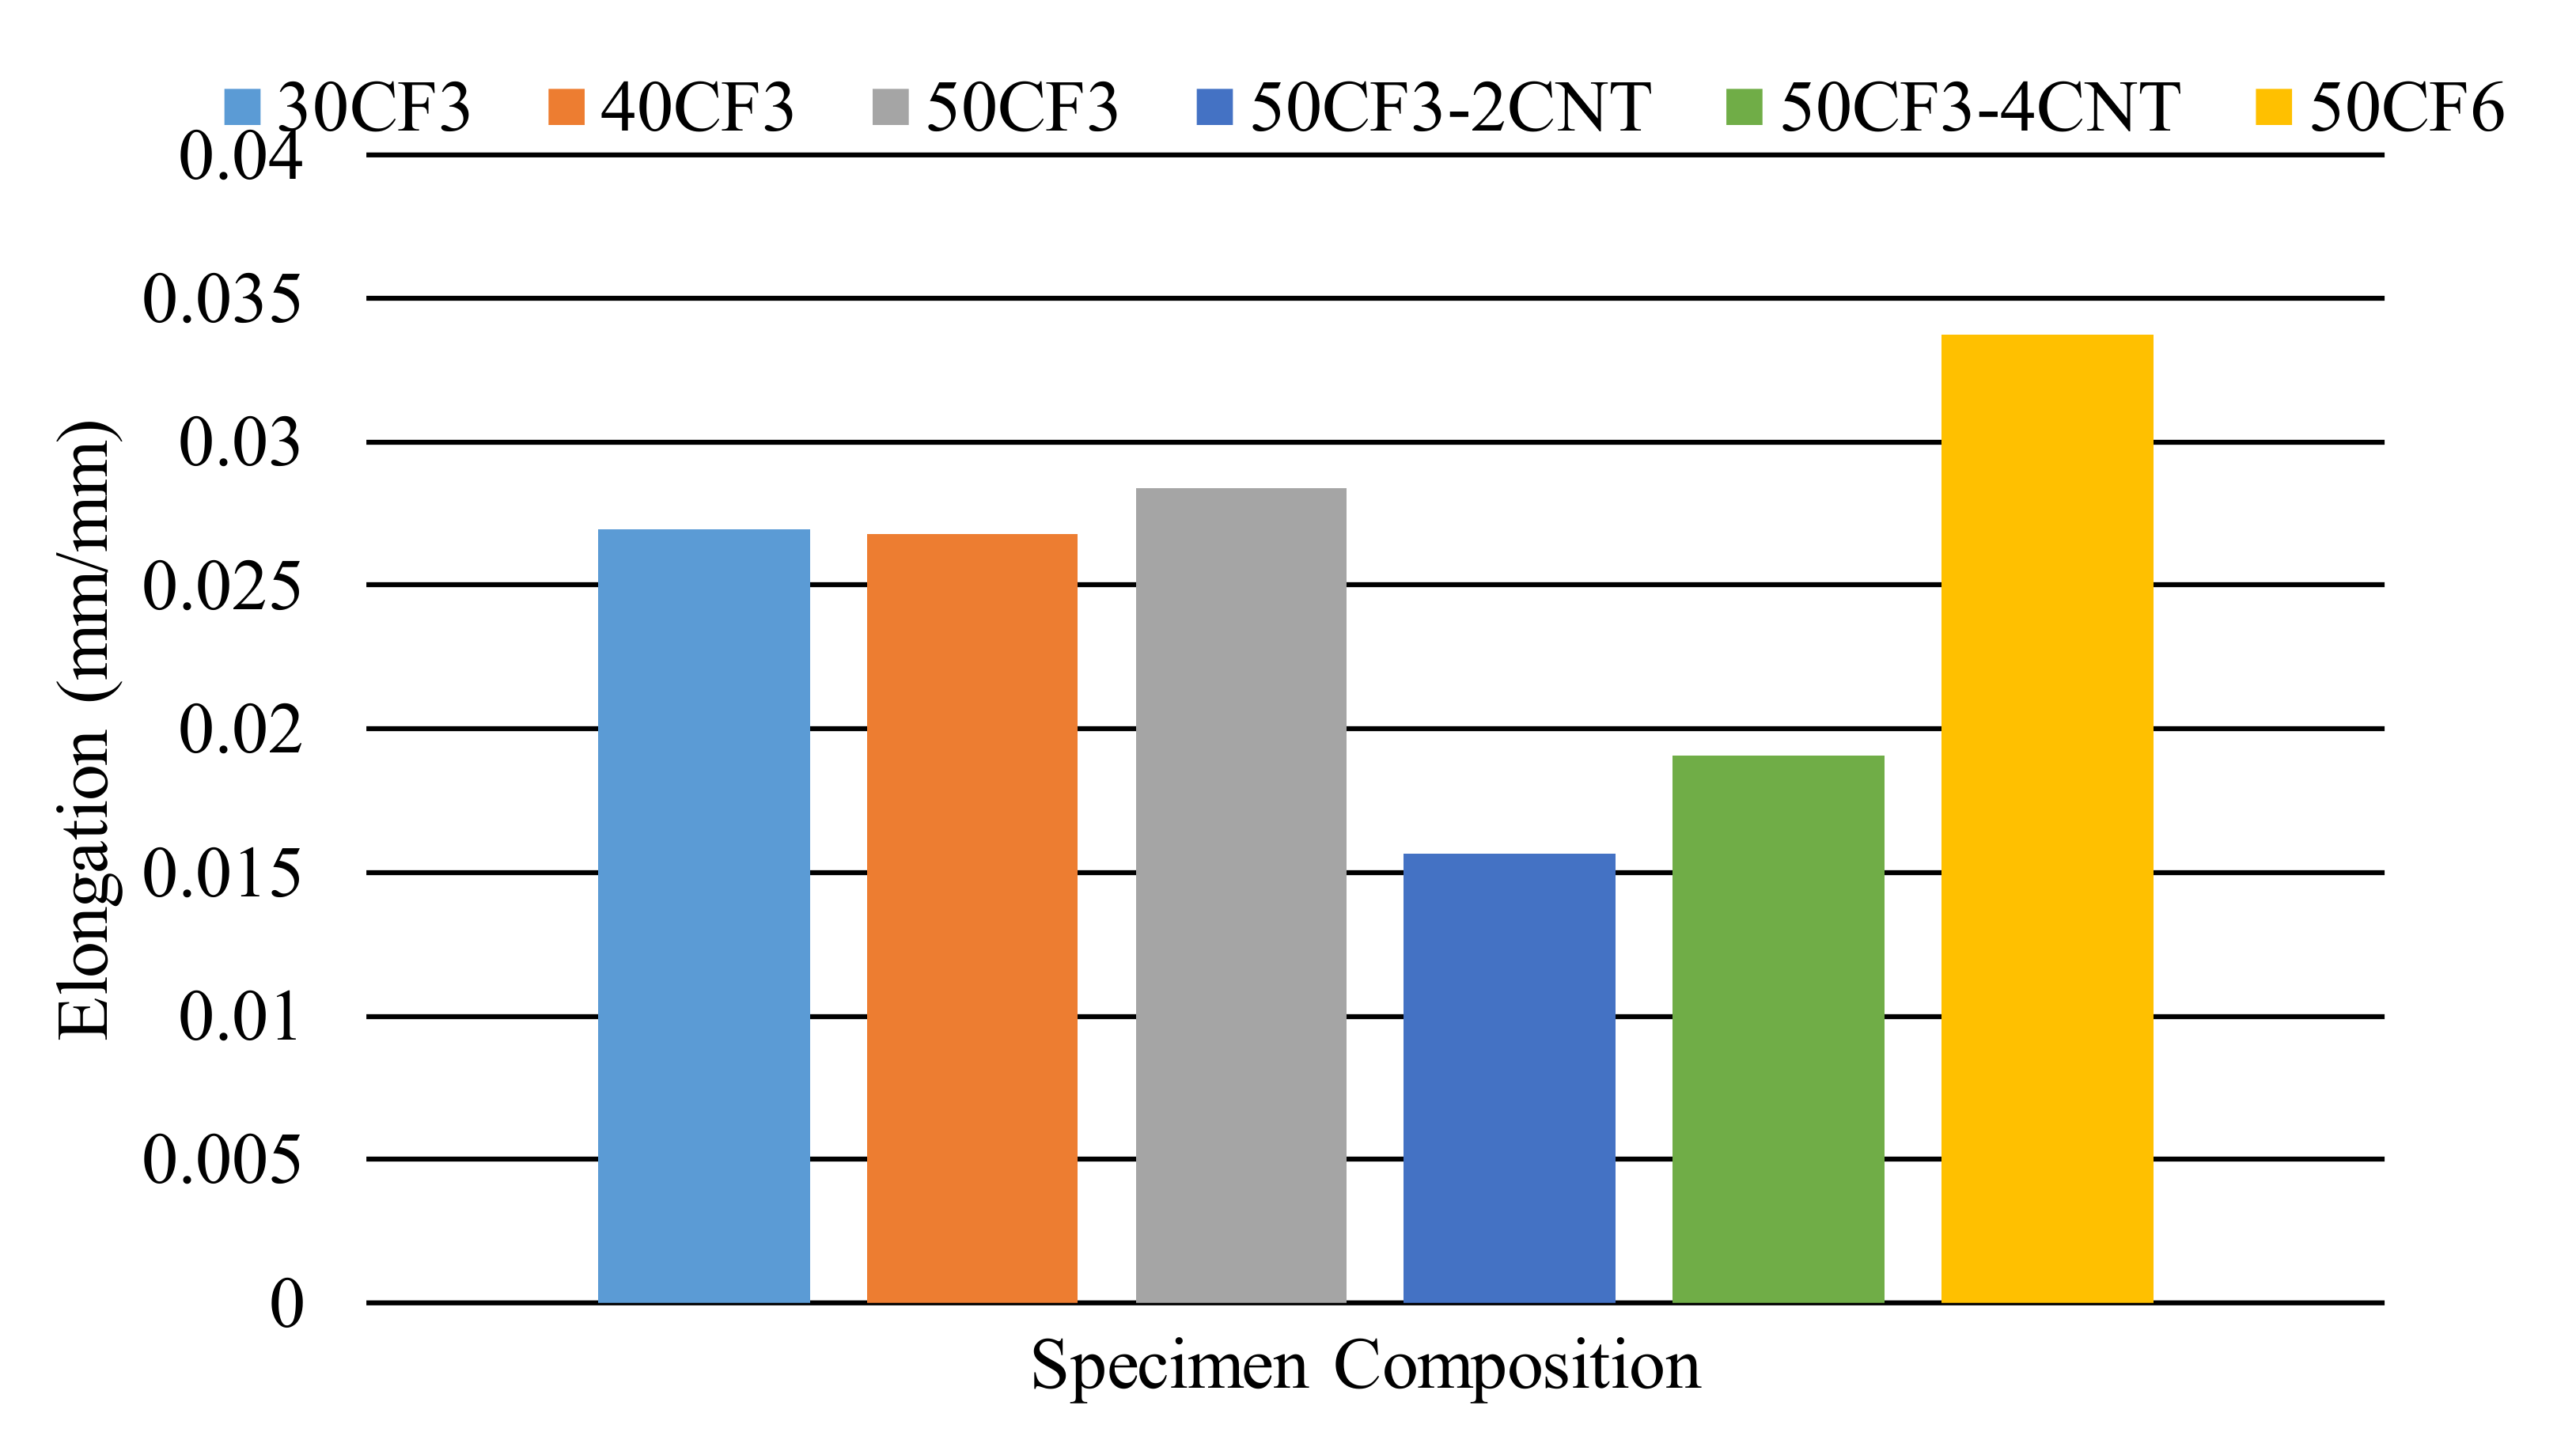
The tensile modulus of elasticity is determined from stress–strain curves. Elastic modulus is the slope of the stress–strain curve between 0.001 and 0.003 strain. The results are presented in Figure 9 and Table 3. Similar to conventional composites, the tensile modulus increased as the carbon fiber content increased. The results also indicate that the transition from CF3 to CF6 has little effect on the tensile modulus; this same trend was observed with the ultimate tensile strength. The addition of CNTs initially improved the modulus; however, higher CNT content decreased the properties due to the formation of agglomeration regions.
Compared with the ultimate tensile strength data, the coefficients of variation for Young’s modulus are lower. The increase of carbon fiber from 30% to 40% had an incremental effect on the modulus within the margin of standard error.

4.3. Elongation

The elongation of the material is an allowable deformation prior to failure, indicating the material’s ductility or brittleness. Elongation needs to be considered when designing components for energy absorption applications such as impacts. In manufacturing, elongation determines the extent of bending and shaping a material can undergo before failure.
As shown in Figure 10 and Table 4, elongation is a function of the reinforcement size. As the reinforcement size increases, the specimens show higher ductility. The highest ductility is observed for specimens with CF6. Increasing the CF3 content from 30% to 50% had minimal effect on ductility. The addition of CNTs decreased specimen elongation significantly. Specimens with CNTs also had higher variability.
Table 4 shows the coefficient of variation for each specimen composition. For compositions that contained carbon nanotubes, the coefficient of variation is above 20%; however, for the specimens without CNTs, the coefficient of variation was less than 3%.

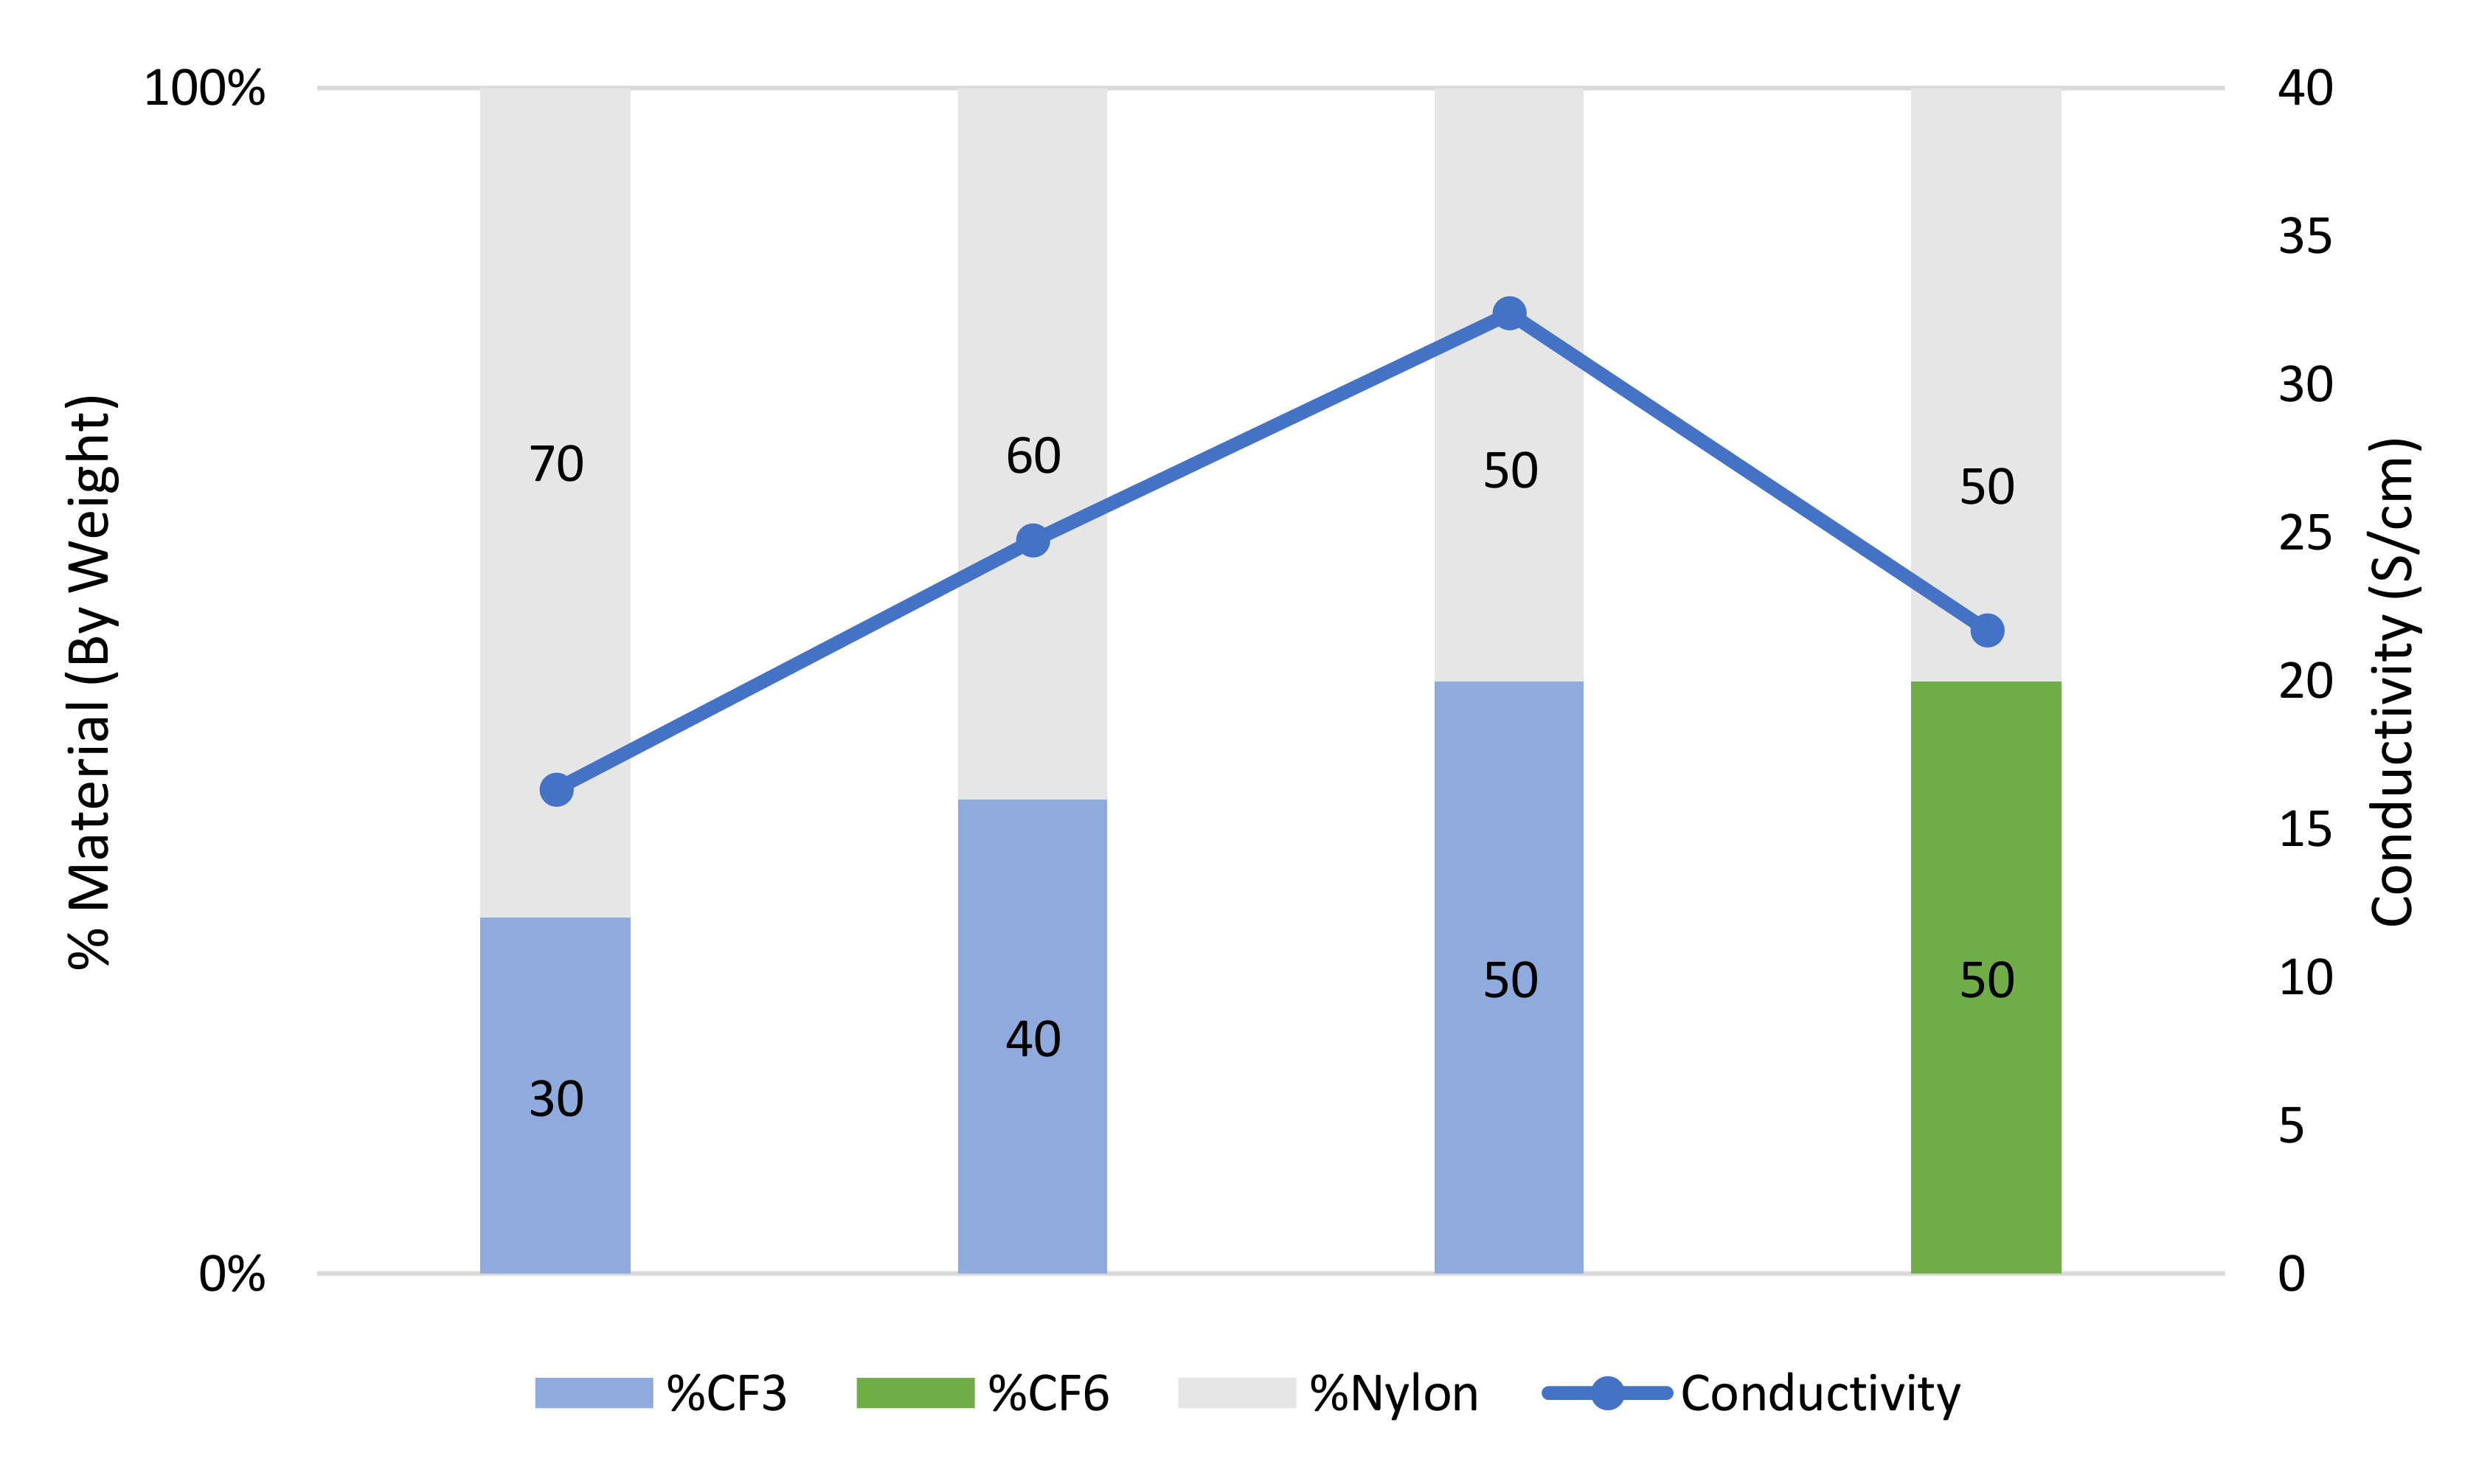
4.4. Electrical Conductivity: Carbon Fibers

Nylon composites were injection molded with three different weight percentages of 3 mm carbon fiber. As shown in Figure 11, conductivity increased in an approximately linear fashion as the weight percentage of carbon fiber was increased. CF6 composite samples were also compared to CF3 samples. At 50 wt% loading, CF3 had a higher electrical conductivity than CF6. Due to CF3 having smaller fiber lengths (3 mm) than the CF6 (6 mm), it is suspected that there is greater dispersion of CF3 within the composite specimen during fabrication. This increased dispersion creates additional electrical pathways within the specimen, thereby increasing the electrical conductivity.

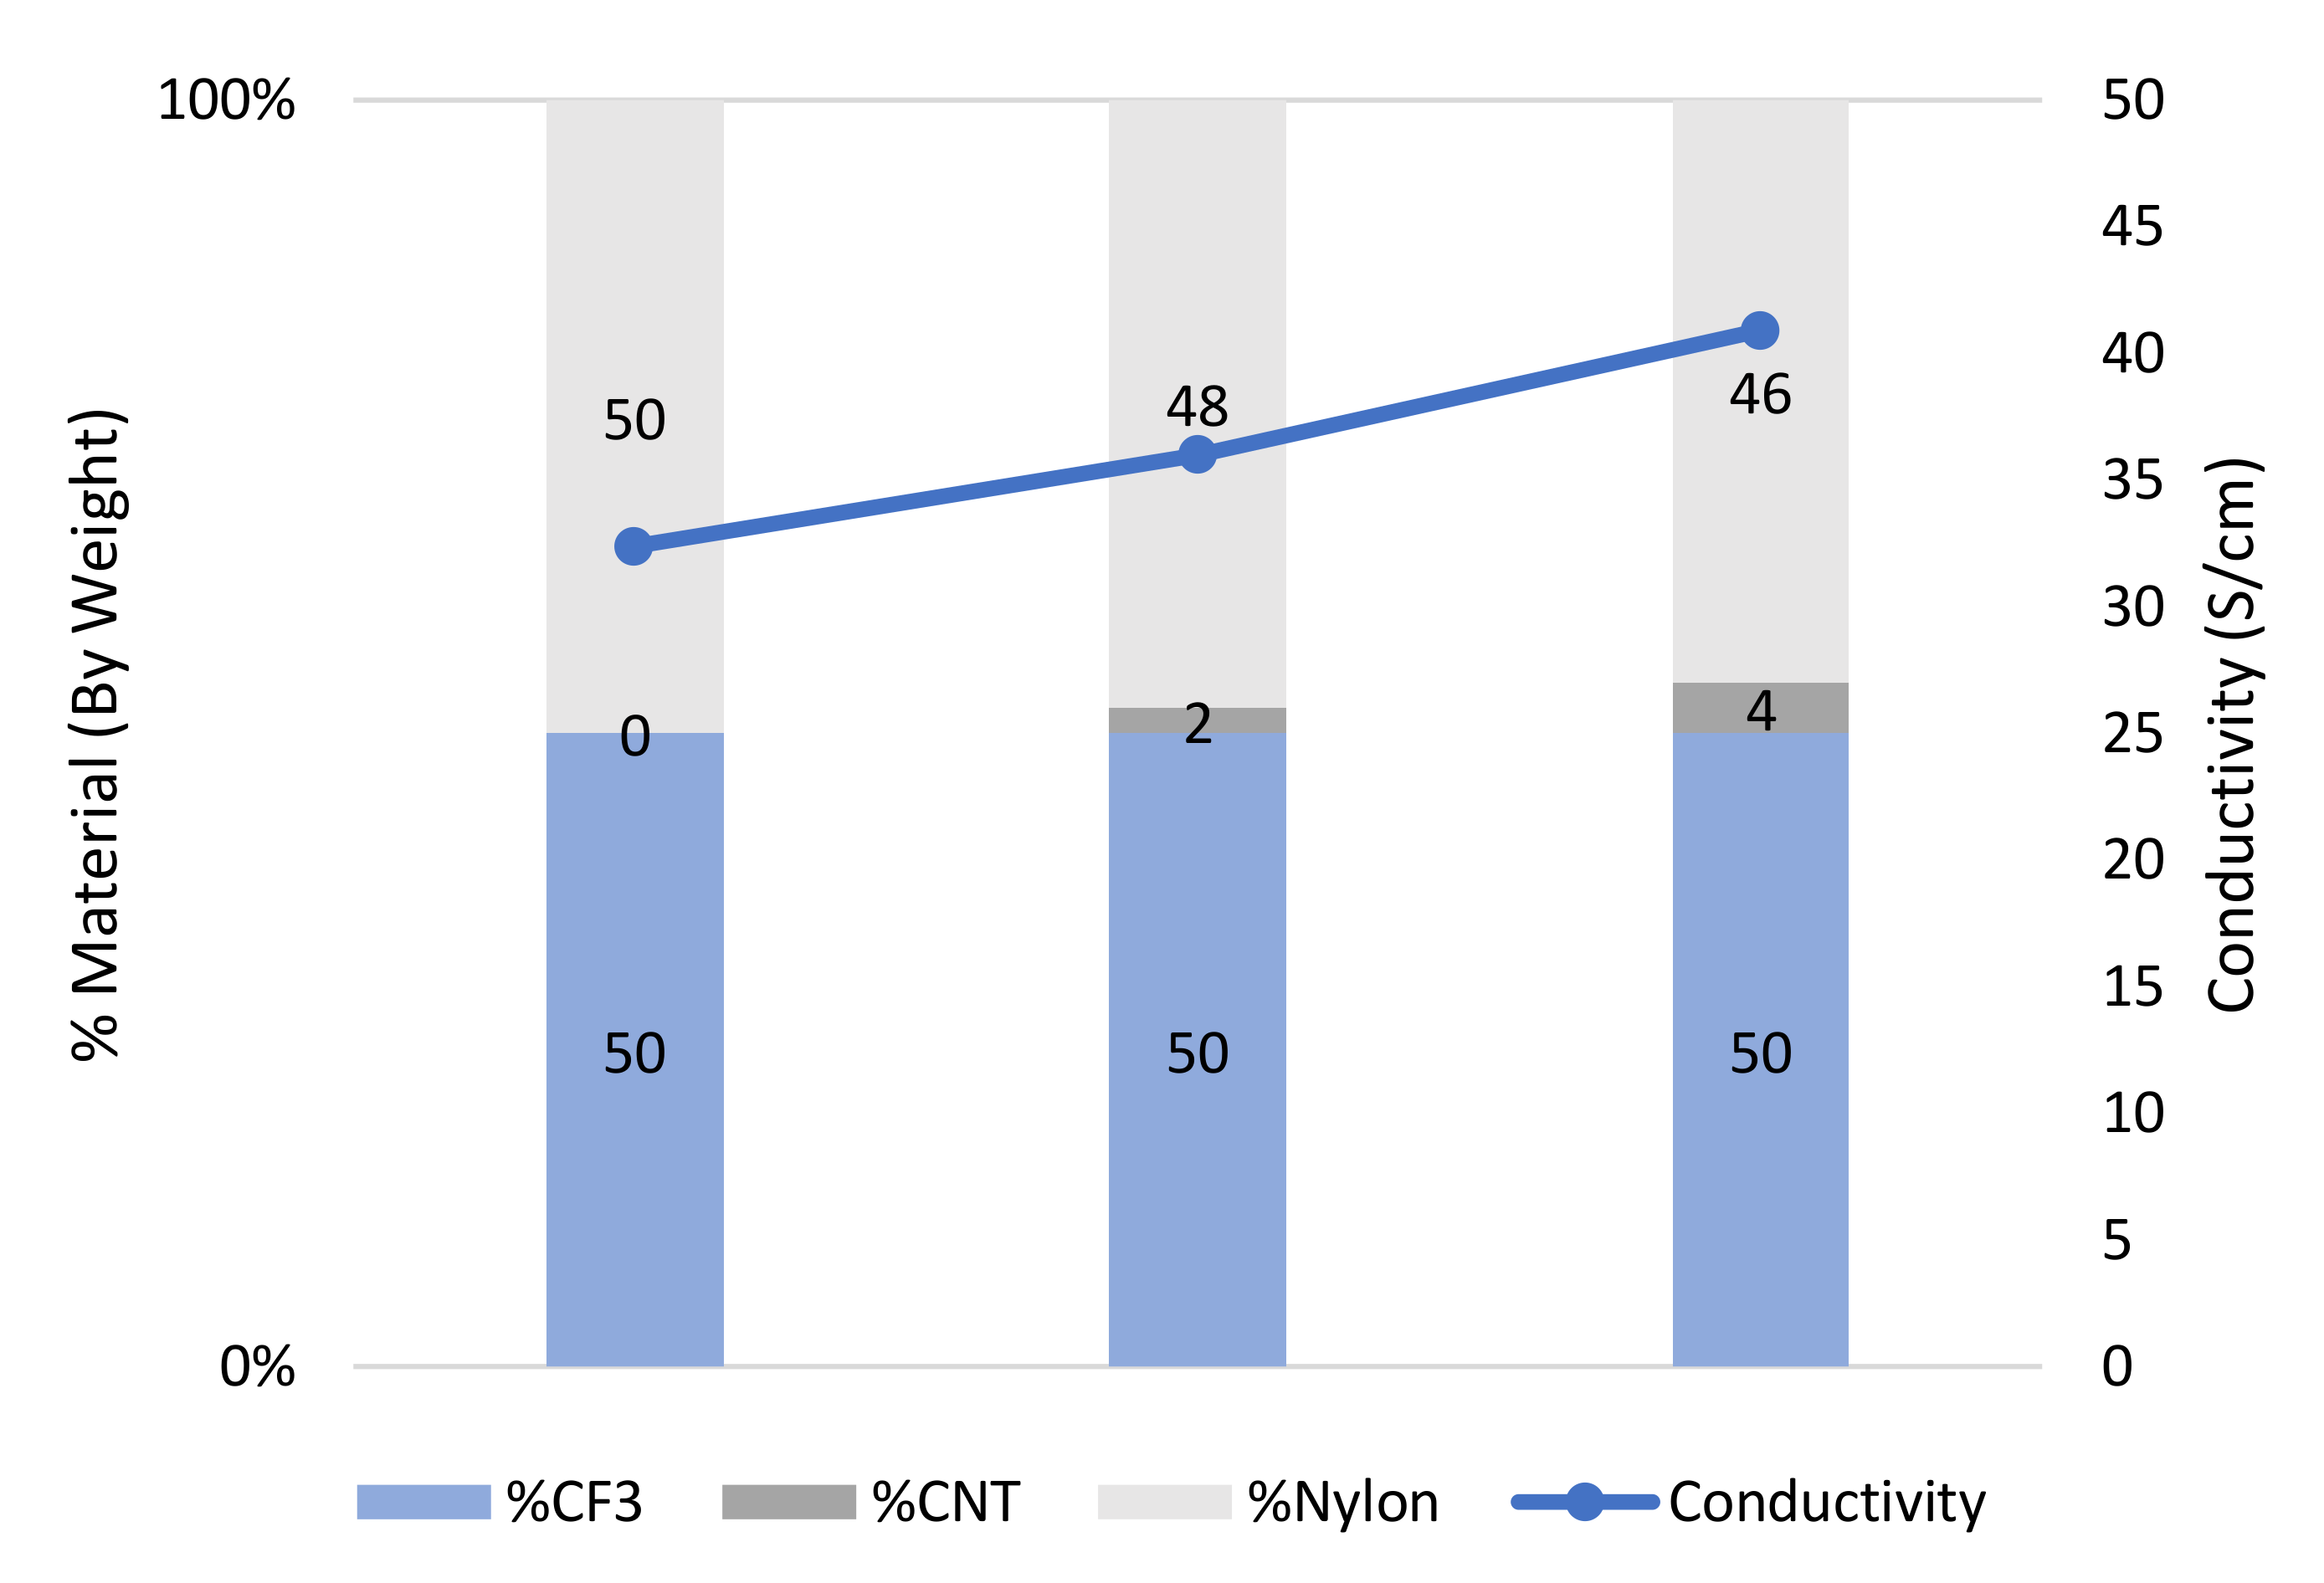
4.5. Electrical Conductivity: Carbon Fibers and Carbon Nanotubes

Multiwalled carbon nanotubes were also added to the samples to further disperse conductive material throughout the nylon composite. CNTs were added to the 50% weight CF3 composite at 2 and 4 wt%. As shown in Figure 12, the addition of CNTs resulted in higher electrical conductivity. Conductivity increased linearly with CNT weight percentage. By adding 4 wt% CNT to 50 wt% CF3 samples, the conductivity of the nylon composite increased from 32 to 41 S/cm, a 28% increase. By introducing CNT into the polymer matrix, the CNT acts as bridge between the carbon fibers filling the void between each fiber due to its smaller size and ease of dispersion. This bridging creates more conductive pathways within the composite, thereby increasing electrical conductivity. A study conducted by Zhao et al. found similar findings with a carbon black/carbon fiber/polypropylene matrix, where the smaller carbon black particles filled the void between carbon fiber strands [22].

4.6. Core Conductivity

During the fabrication of composite specimens, the filler material has a tendency to agglomerate in the center of the specimen with less filler reaching the surface. For this reason, core conductivity was evaluated and compared to surface conductivity for the CF3 composite specimens at three different weight percentages, as shown in Figure 13. Results show that there is less than 3% difference in electrical conductivity between the surface and core of the composite specimen. Consequently, the presence of the nylon skin layer did not have a significant impact on the conductivity of the specimen throughout its thickness.

5. Conclusions

To concurrently evaluate the mechanical and electrical properties of reinforced composites, carbon fibers and carbon nanotubes were added to nylon 6,6 using an injection molding process. Six different sets of specimens were manufactured and tested. Results show that while the addition of fillers improves electrical properties, mechanical properties may decline due to the formation of stress concentration regions. The findings of the paper are summarized here:
  • The addition of carbon nanotubes to the CF3 composite specimen decreases the ultimate tensile strength by 20% or more.
  • The addition of carbon nanotubes to the CF3 composite specimen decreases elongation by 30% or more.
  • Longer carbon fibers at the same loading content have higher elongation.
  • The addition of carbon nanotubes increases the variability in testing, indicating an increase in uncertainty in microstructure.
  • Composites with 3 mm carbon fiber fillers showed higher conductivity compared to composites with 6 mm carbon fiber, as shorter fibers are more likely to form agglomerated regions, thereby creating a high conductive pathway. Such agglomeration regions may decrease mechanical properties while enhancing electrical conductivity.
  • Adding CNTs to the composite matrix further increases electrical conductivity by bridging carbon fibers to form a stronger conductive network.
  • Despite the presence of a nylon frozen layer, the conductivity does not change across the thickness and results show that the surface and core of the composite specimen have less than a 3% difference in electrical conductivity.
  • Increasing the filler content can have conflicting effects on mechanical and electrical properties; a study on the optimization of filler content is an important future study.
  • Evaluating the effect of CNTs with different lengths can be studied in the future to evaluate their effect on both electrical and mechanical properties.

Author Contributions

Conceptualization, S.H.R.S. and A.S.H.; methodology, B.A.Y., S.H.R.S. and A.S.H.; software, R.Z., C.J.K.; formal analysis, R.Z., C.J.K.; writing—original draft preparation, R.Z., C.J.K.; writing—review and editing, B.A.Y., S.H.R.S. and A.S.H.; supervision, S.H.R.S. and A.S.H.; project administration, S.H.R.S. and A.S.H. All authors have read and agreed to the published version of the manuscript.

Funding

This research received no external funding

Conflicts of Interest

The authors declare no conflict of interest.

References

  1. Thostenson, E.T.; Chou, T.-W. Aligned multi-walled carbon nanotube-reinforced composites: Processing and mechanical characterization. J. Phys. D Appl. Phys. 2002, 35, L77–L80. [Google Scholar] [CrossRef]
  2. Rafii-Tabar, H. Computational modelling of thermo-mechanical and transport properties of carbon nanotubes. Phys. Rep. 2004, 390, 235–452. [Google Scholar] [CrossRef]
  3. Sanei, S.H.R.; Drozynski, H.; Hetrick, D. Effect of strain rate on tensile properties of injection molded multiwall carbon nanotube reinforced PA6/6 nanocomposites. In Proceedings of the ASME 2020 International Mechanical Engineering Congress and Exposition, London, UK, 16–19 November 2020; pp. 1–6. [Google Scholar]
  4. Moisala, A.; Li, Q.; Kinloch, I.A.; Windle, A.H. Thermal and electrical conductivity of single- and multi-walled carbon nanotube-epoxy composites. Compos. Sci. Technol. 2006, 66, 1285–1288. [Google Scholar] [CrossRef]
  5. Biercuk, M.J.; Llaguno, M.C.; Radosavljevic, M.; Hyun, J.K.; Johnson, A.T.; Fischer, J.E. Carbon nanotube composites for thermal management. Appl. Phys. Lett. 2002, 80, 2767–2769. [Google Scholar] [CrossRef]
  6. Yang, K.; Gu, M.; Guo, Y.; Pan, X.; Mu, G. Effects of carbon nanotube functionalization on the mechanical and thermal properties of epoxy composites. Carbon 2009, 47, 1723–1737. [Google Scholar] [CrossRef]
  7. Zeng, Y.; Liu, P.; Du, J.; Zhao, L.; Ajayan, P.M.; Cheng, H.-M. Increasing the electrical conductivity of carbon nanotube/polymer composites by using weak nanotube–polymer interactions. Carbon 2010, 48, 3551–3558. [Google Scholar] [CrossRef]
  8. Sanei, S.H.R.; Barsotti, E.J.; Leonhardt, D.; Fertig, R.S. Characterization, synthetic generation, and statistical equivalence of composite microstructures. J. Compos. Mater. 2016, 51, 1817–1829. [Google Scholar] [CrossRef]
  9. Sanei, S.H.R.; Fertig, R.S. Uncorrelated volume element for stochastic modeling of microstructures based on local fiber volume fraction variation. Compos. Sci. Technol. 2015, 117, 191–198. [Google Scholar] [CrossRef]
  10. Sanei, S.H.; Doles, R.; Ekaitis, T.; Sanei, S.H.R. Effect of Nanocomposite Microstructure on Stochastic Elastic Properties: An Finite Element Analysis Study. ASCE-ASME J. Risk Uncertain. Eng. Syst. Part B Mech. Eng. 2019, 5, 1–6. [Google Scholar] [CrossRef]
  11. Park, J.P.; Mohanty, S.; Bahn, C.B.; Majumdar, S.; Natesan, K. Weibull and Bootstrap Based Data-Analytics Framework for Fatigue Life Prognosis of Pressurized Water Nuclear Reactor Component under Harsh Reactor Coolant Environment. J. Nondestruct. Eval. Diagn. Progn. Eng. Syst. 2019, 142, 1–14. [Google Scholar] [CrossRef] [Green Version]
  12. Dotchev, P.; Sanei, S.H.R.; Steinmetz, E.; Williams, J. Nanocomposites: Manufacturing, Microstructural Characterization and Mechanical Testing. Am. Soc. Compos. 2018. [Google Scholar] [CrossRef]
  13. Xu, X.; Sanei, S.H.R.; Steinmetz, E.; Gohn, A.; Williams, J. Effect of microstructure uncertainty and testing frequency on storage and loss moduli of injection molded MWCNT reinforced polyamide 66 nanocomposites. Polym. Test. 2020, 85, 106455. [Google Scholar] [CrossRef]
  14. Thongruang, W.; Spontak, R.J.; Balik, C.M. Correlated electrical conductivity and mechanical property analysis of high-density polyethylene filled with graphite and carbon fiber. Polymer 2002, 43, 2279–2286. [Google Scholar] [CrossRef]
  15. Xu, J.; Donohoe, J.P.; Pittman, C.U. Preparation, electrical and mechanical properties of vapor grown carbon fiber (VGCF)/vinyl ester composites. Compos. Part A Appl. Sci. Manuf. 2004, 35, 693–701. [Google Scholar] [CrossRef]
  16. Wu, M.; Shaw, L.L. On the improved properties of injection-molded, carbon nanotube-filled PET/PVDF blends. J. Power Sources 2004, 136, 37–44. [Google Scholar] [CrossRef]
  17. Wu, M.; Shaw, L. Electrical and mechanical behaviors of carbon nanotube-filled polymer blends. J. Appl. Polym. Sci. 2005, 99, 477–488. [Google Scholar] [CrossRef]
  18. Liang, J.-Z.; Yang, Q.-Q. Effects of carbon fiber content and size on electric conductive properties of reinforced high density polyethylene composites. Compos. Part B Eng. 2017, 114, 457–466. [Google Scholar] [CrossRef]
  19. Dweiri, R.; Sahari, J. Electrical properties of carbon-based polypropylene composites for bipolar plates in polymer electrolyte membrane fuel cell (PEMFC). J. Power Sources 2007, 171, 424–432. [Google Scholar] [CrossRef]
  20. Heiser, J.A.; King, J.A.; Konell, J.P.; Sutter, L.L. Electrical conductivity of carbon filled nylon 6,6. Adv. Polym. Technol. 2004, 23, 135–146. [Google Scholar] [CrossRef]
  21. Mighri, F.; Huneault, M.A.; Champagne, M.F. Electrically conductive thermoplastic blends for injection and compression molding of bipolar plates in the fuel cell application. Polym. Eng. Sci. 2004, 44, 1755–1765. [Google Scholar] [CrossRef]
  22. Zhao, S.; Zhao, H.; Li, G.; Dai, K.; Zheng, G.; Liu, C.; Shen, C. Synergistic effect of carbon fibers on the conductive properties of a segregated carbon black/polypropylene composite. Mater. Lett. 2014, 129, 72–75. [Google Scholar] [CrossRef]
  23. Wen, M.; Sun, X.; Su, L.; Shen, J.; Li, J.; Guo, S. The electrical conductivity of carbon nanotube/carbon black/polypropylene composites prepared through multistage stretching extrusion. Polymer 2012, 53, 1602–1610. [Google Scholar] [CrossRef]
  24. Zhu, X.-D.; Zang, C.-G.; Jiao, Q.-J. High electrical conductivity of nylon 6 composites obtained with hybrid multiwalled carbon nanotube/carbon fiber fillers. J. Appl. Polym. Sci. 2014, 131. [Google Scholar] [CrossRef]
  25. Radzuan, N.A.M.; Sulong, A.B.; Sahari, J. A review of electrical conductivity models for conductive polymer composite. Int. J. Hydrog. Energy 2017, 42, 9262–9273. [Google Scholar] [CrossRef]
  26. Zare, Y.; Rhee, K.Y. Simplification and development of McLachlan model for electrical conductivity of polymer carbon nanotubes nanocomposites assuming the networking of interphase regions. Compos. Part B Eng. 2019, 156, 64–71. [Google Scholar] [CrossRef]
  27. Zare, Y.; Rhee, K.Y.; Park, S.-J. A developed equation for electrical conductivity of polymer carbon nanotubes (CNT) nanocomposites based on Halpin-Tsai model. Results Phys. 2019, 14, 102406. [Google Scholar] [CrossRef]
  28. Sander, M.L.; Pritts, J.T.; Young, B.A.; Santamaria, A.D.; Hollinger, A.S. Electrically Conductive Polymer Composites for Injection-Molded Bipolar Plates. Eur. Fuel Cell Technol. Appl. Conf. 2017, 361–362. [Google Scholar] [CrossRef]
Figure 1. Manufacturing and testing process flowchart; (A) composition, (B) manufacturing, (C) testing.
Jcs 04 00177 g001
Figure 2. Tensile testing coupon dimensions designed based on ASTM D638 TYPE 1.
Jcs 04 00177 g002
Figure 3. Schematic image of the four-point probe setup for the electrical conductivity analysis.
Jcs 04 00177 g003
Figure 4. SEM image of the sample with 50% CF3, showing the frozen layer at the top and bottom of the sample.
Jcs 04 00177 g004
Figure 5. SEM image of the specimen with 50% CF3, showing fiber alignment near the surface of the specimen.
Jcs 04 00177 g005
Figure 6. SEM image of the specimen with 50% CF3 showing fiber alignment near the core of the specimen.
Jcs 04 00177 g006
Figure 7. SEM image of the specimen with 50% CF3, 4% carbon nanotube (CNT) content. The zoomed image shows CNT presence around the carbon fibers.
Jcs 04 00177 g007
Figure 8. Average ultimate tensile strength for different specimen compositions.
Jcs 04 00177 g008
Figure 9. Average tensile modulus of elasticity for different specimen compositions.
Jcs 04 00177 g009
Figure 10. Average elongation for different specimen compositions.
Jcs 04 00177 g010
Figure 11. Electrical conductivity of the CF3 and CF6 composite samples.
Jcs 04 00177 g011
Figure 12. Electrical conductivity of the CF3 and CNT composites.
Jcs 04 00177 g012
Figure 13. Comparison of core and surface conductivity of the CF3 composites.
Jcs 04 00177 g013
Table 1. Specimen composition of hybrid composites.
Specimen NameReinforcementMatrix (Nylon 6,6) Content
MWCNT ContentCarbon Fiber ContentCarbon Fiber Length
30CF30%30%3 mm70%
40CF30%40%3 mm60%
50CF30%50%3 mm50%
50CF3-2CNT2%50%3 mm48%
50CF3-4CNT4%50%3 mm46%
50CF60%50%6 mm50%
Table 2. Average and coefficient of variation of ultimate tensile strength for different specimen compositions.
Composition30% CF340% CF350% CF350% CF3 + 2% CNT50% CF3 + 4% CNT50% CF6
Average (MPa)142.67159.50159.27100.70114.23142.78
Coeff. of Variation (%)20.14.115.523.327.78.8
Table 3. Average and coefficient of variation of tensile modulus for different specimen compositions.
Composition30% CF340% CF350% CF350% CF3 + 2% CNT50% CF3 + 4% CNT50% CF6
Mean (MPa)9379.59812.99875.410,3229771.19845.9
Coeff. of Variation (%)19.28.39.52.918.68.7
Table 4. Average and coefficient of variation of elongation for different specimen compositions.
Composition30% CF340% CF350% CF350% CF3 + 2% CNT50% CF3 + 4% CNT50% CF6
Mean (mm/mm)0.0269570.026770.0284070.015670.0190680.033723
Coeff. of Variation (%)1.21.21.527.820.13.0
Publisher’s Note: MDPI stays neutral with regard to jurisdictional claims in published maps and institutional affiliations.

