
Optimization of Surface Roughness of Aluminium RSA 443 in Diamond Tool Turning †

Abstract
:1. Introduction
2. Literature on Diamond Machining Generally and RSA Specifically
2.1. Diamond Turning
2.1.1. Tool Wear
2.1.2. Tool Path Considerations
2.1.3. Hybrid Methods
2.2. Machining of RSA Materials
2.3. Optimization of Turning Parameters
3. Materials and Methods
3.1. Research Objectives
3.2. Approach
3.2.1. Experimental Design and Data Collection
3.2.2. Response Surface Methodology Model
3.2.3. Optimization Techniques
3.2.4. Genetic Algorithm (GA)
- A population of n individuals was created. The individuals were initialized with values on the interval of 15 individuals.
- The fitness of the population was evaluated. The fitness of the fittest chromosome was stored in the hall of fame.
- The fittest two chromosomes were carried over to the next generation (elitism).
- Eighty percent of the new generation was created by means of sexual reproduction with tournament selection as follows:
- Ten random individuals (tournament size) were selected from the population.
- Two of the fittest chromosomes were used in the crossover with a randomly generated mask to produce one child chromosome.
- Mutations applied at a probability of pm were applied to the genes of the chromosome.
- The fittest parent and child were carried over to the next generation.
- The remainder of the new generation was created by mutating the least fit chromosomes as follows:
- A random mask was created to determine which genes were to be mutated.
- These genes were mutated by a value on the interval of 15 individuals.
3.2.5. Particle Swarm Algorithm (PSO)
- A swarm of n particles was created, representing the cutting parameters. The position of the particles was initialized with random values on the interval of 15 particles. The initial velocity of the particles was set to 0.
- The fitness of the particles was evaluated.
- For each particle, if the fitness calculated was better than its previous personal best, the personal best () along with its position was updated.
- For each particle, if its personal best was better than the global best (), the global best along with its position was updated.
- The velocity () of each particle () was updated (for j dimensions) using the following equation:
- where w is the inertia weight, & are acceleration constants and and are random values on the interval (0; 1).
3.2.6. Differential Evolution (DE)
- The fitness of the population was evaluated. The fitness of the fittest chromosome was stored in the hall of fame.
- The same reproduction operator was used for each individual (target vector) of the population by carrying out the following:
- A trial vector was created from the parent vector and two randomly selected unique individuals and :
- , where is the scale factor which amplifies the differential variation.
- A binomial crossover was performed between the parent vector and trial vector to produce offspring .
- A randomly selected gene from the trial vector was transferred to the child vector.
- For the rest of the genes, genes from the trial vector were included at a crossover point at a probability, otherwise genes from the parent were included.
- The fitness of the offspring was then evaluated.
- The fitter individual between the parent and offspring was carried over to the next generation.
- Steps 2–5 were repeated for a fixed number of iterations.
4. Results for RSA 443
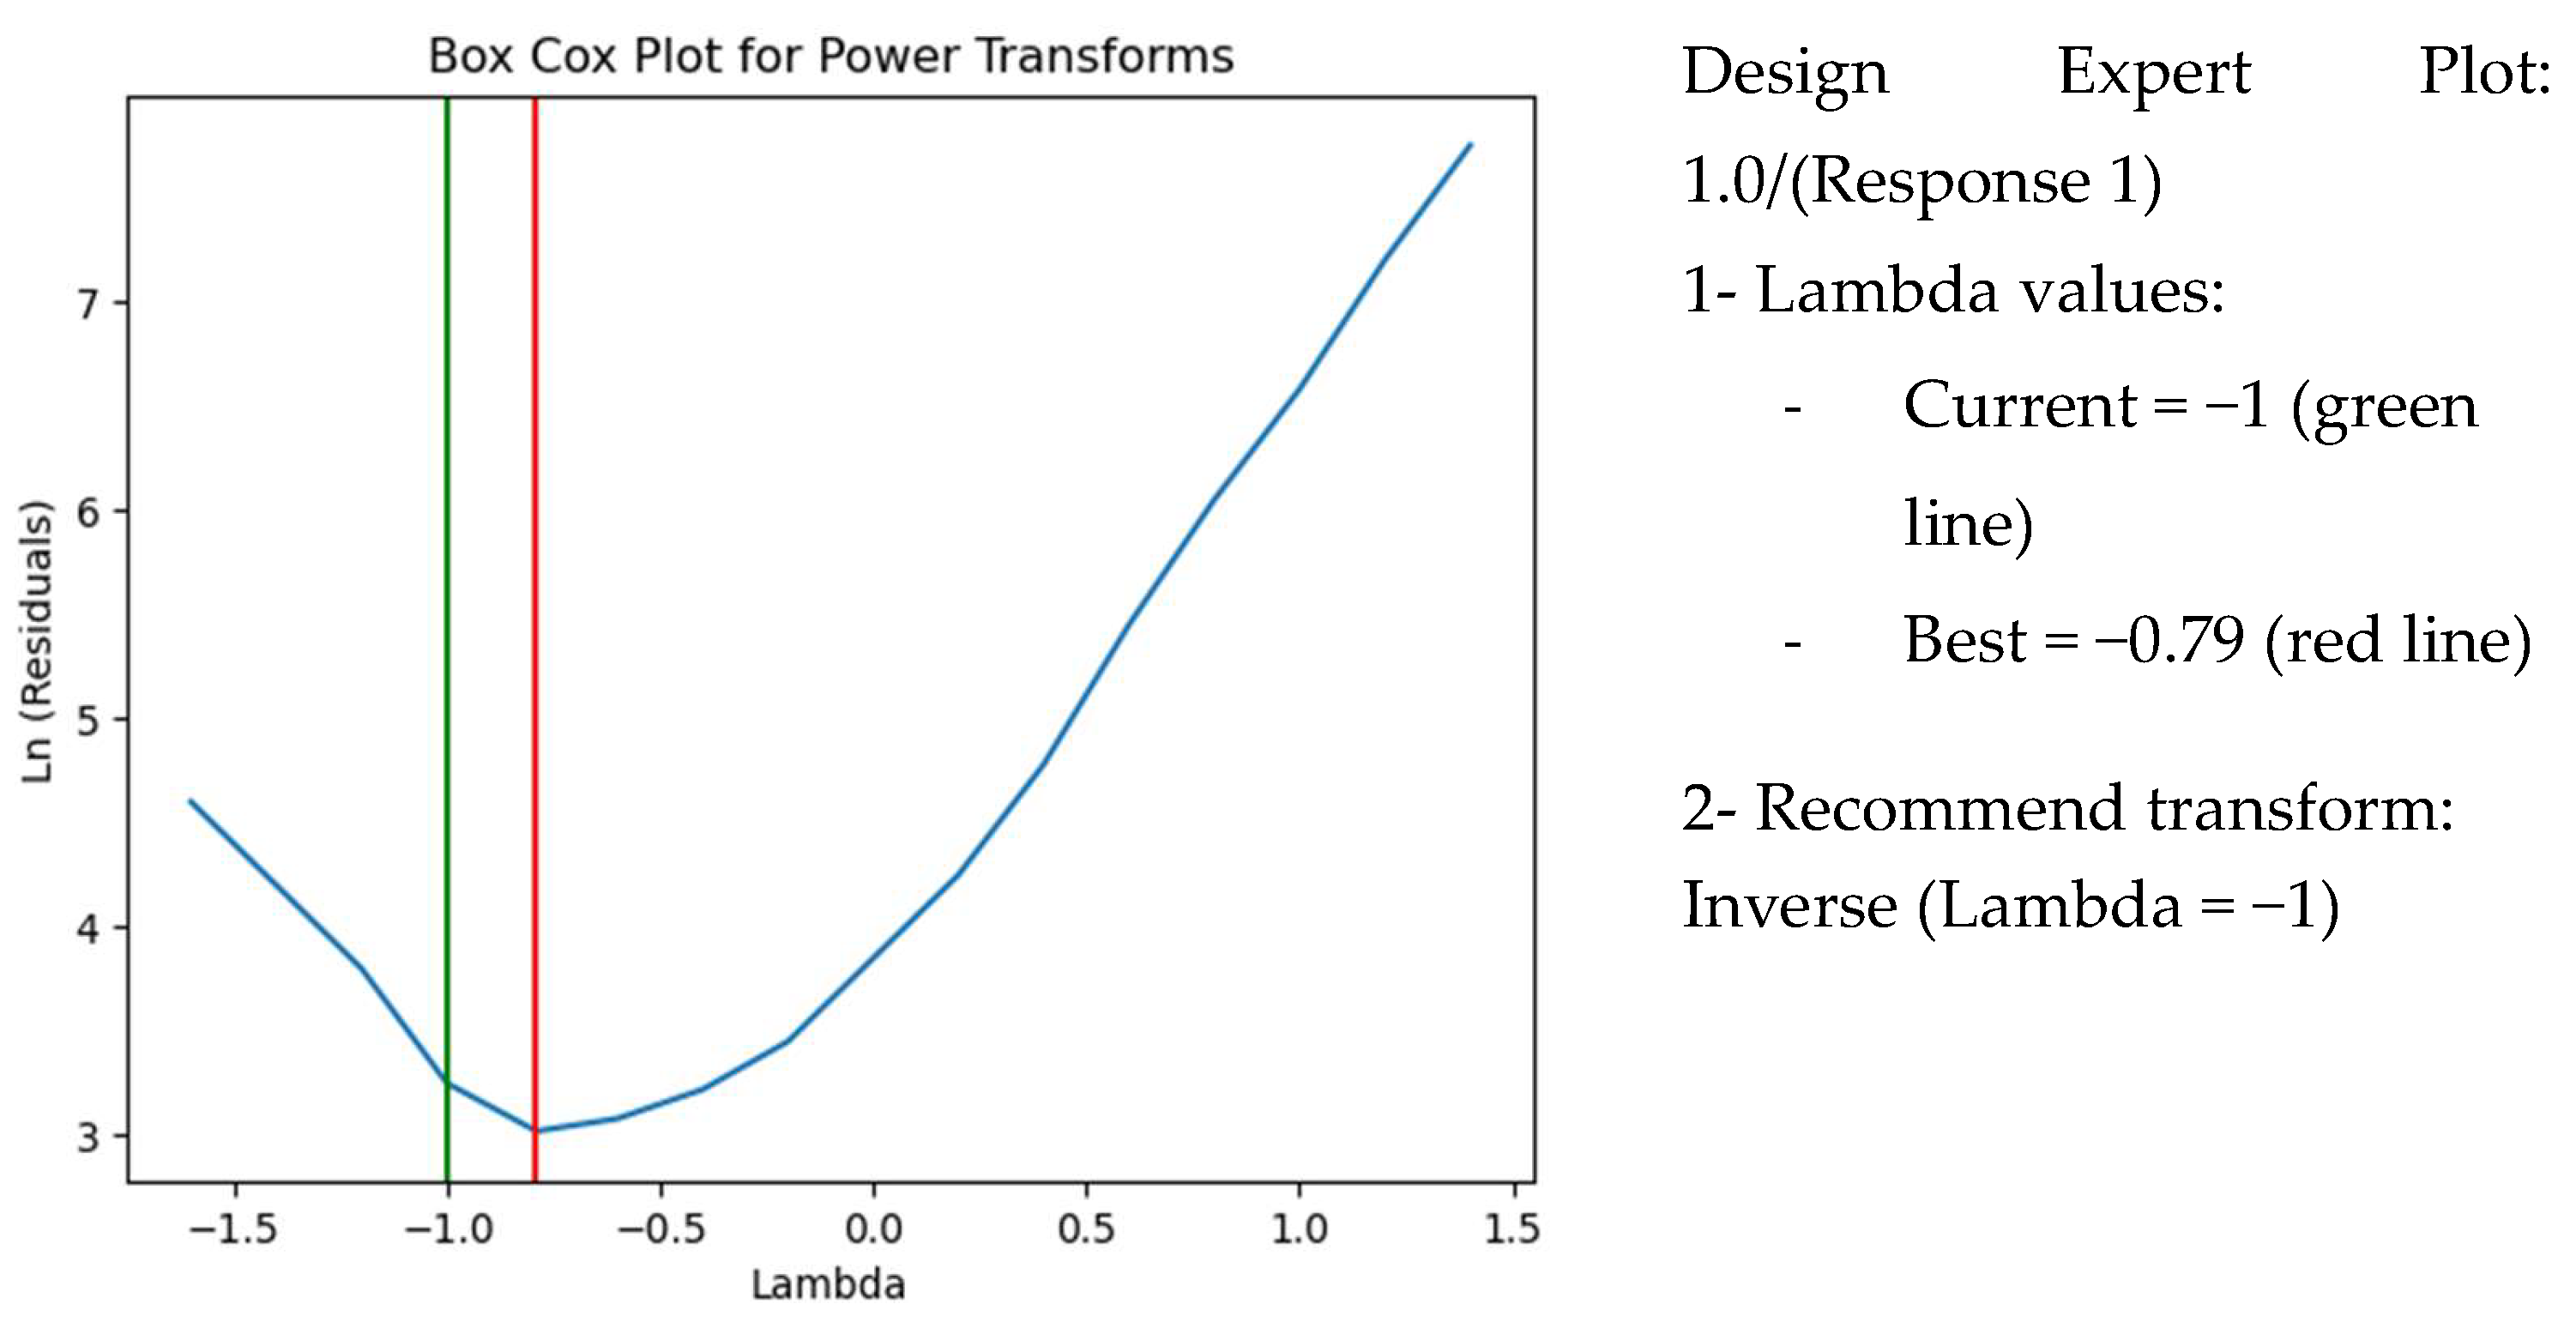
4.1. Response Transformation Check
4.2. Fit Summary
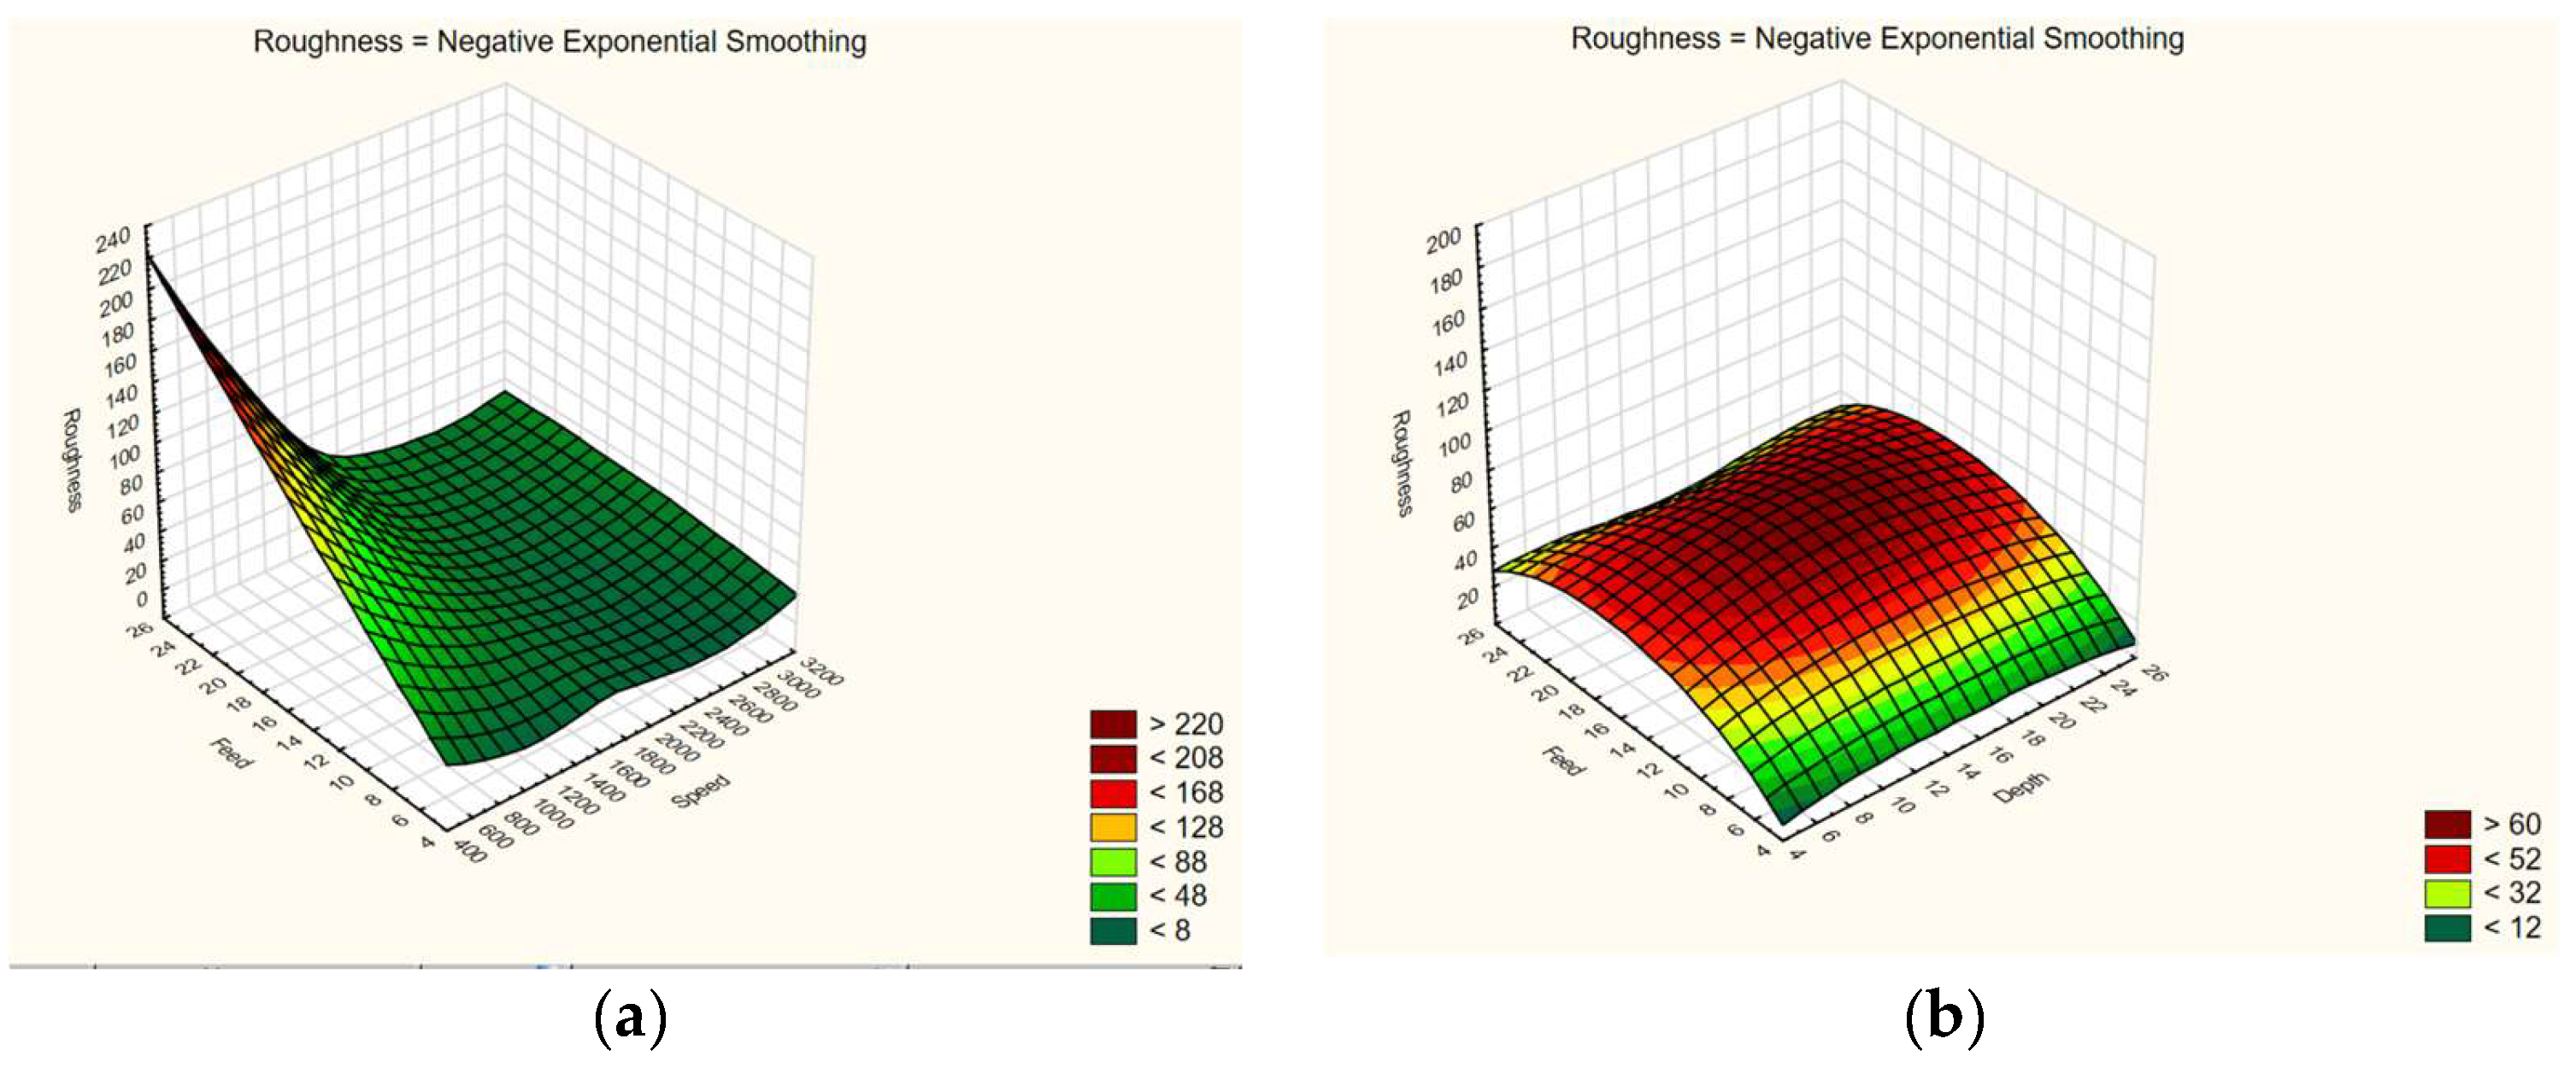
4.3. Development of a Model for Surface Roughness
4.4. Optimization
5. Discussion
5.1. Findings
5.2. Implications for Industry Practitioners
5.3. Limitations of the Study
5.4. Implications for Further Research
6. Conclusions
Author Contributions
Funding
Data Availability Statement
Conflicts of Interest
Appendix A. Code Statement (MATLAB)
- Fitness functions
- -
- SurfaceRoughness_s500
- -
- SurfaceRoughness_s1750
- -
- SurfaceRoughness_s3000
- GA code
- PSO code:
- DE code:
Appendix B. Convergence Results


References
- Sanger, G.M. Optical fabrication technology, the present and future. In Contemporary Methods of Optical Manufacturing and Testing; International Society for Optics and Photonics: Washington, DC, USA, 1983. [Google Scholar]
- Al-Homoud, M.S. Performance characteristics and practical applications of common building thermal insulation materials. Build. Environ. 2005, 40, 353–366. [Google Scholar] [CrossRef]
- Routara, B.; Bandyopadhyay, A.; Sahoo, P. Roughness modeling and optimization in CNC end milling using response surface method: Effect of workpiece material variation. Int. J. Adv. Manuf. Technol. 2009, 40, 1166–1180. [Google Scholar] [CrossRef]
- Abbas, A.T.; Pimenov, D.Y.; Erdakov, I.N.; Taha, M.A.; El Rayes, M.M.; Soliman, M.S. Artificial intelligence monitoring of hardening methods and cutting conditions and their effects on surface roughness, performance, and finish turning costs of solid-state recycled Aluminum alloy 6061 chips. Metals 2018, 8, 394. [Google Scholar] [CrossRef]
- Otieno, T.; Abou-El-Hossein, K.; Hsu, W.Y.; Cheng, Y.C.; Mkoko, Z. Surface roughness when diamond turning RSA 905 optical aluminium. In Proceedings of the SPIE Optical Engineering + Applications, San Diego, CA, USA, 9–13 August 2015; Volume 9575. [Google Scholar]
- Gregoire, M.T. Optimization of Surface Roughness of Alumimium Grade (RSA 443) in Diamond Tool Turning. Master’s Thesis, Nelson Mandela University, George, South Africa, 2021. [Google Scholar]
- Gao, B.; Zhao, H.; Peng, L.; Sun, Z. A review of research progress in selective laser melting (SLM). Micromachines 2022, 14, 57. [Google Scholar] [CrossRef]
- Zhang, L.; Sato, Y.; Yan, J. Optimization of fast tool servo diamond turning for enhancing geometrical accuracy and surface quality of freeform optics. J. Adv. Mech. Des. Syst. Manuf. 2023, 17, JAMDSM0012. [Google Scholar] [CrossRef]
- Hatefi, S.; Abou-El-Hossein, K. Review of magnetic-assisted single-point diamond turning for ultra-high-precision optical component manufacturing. Int. J. Adv. Manuf. Technol. 2022, 120, 1591–1607. [Google Scholar] [CrossRef]
- Aditi, G.; Daren, D.; Isabel, K.; Andrew, S.; Renate, K.; Deno, S.; Pavl, Z.; Nick, M.; Michael, G. Optics testing for SCALES. In Proceedings of the SPIE Optical Engineering + Applications, San Diego, CA, USA, 20–25 August 2023. [Google Scholar] [CrossRef]
- Qiu, J. Fundamental research on machining performance of diamond wire sawing and diamond wire electrical discharge sawing quartz glass. Ceram. Int. 2022, 48, 24332–24345. [Google Scholar] [CrossRef]
- Wang, J.; Wen, Y.; Han, J.; Ma, S.; Zhang, G. A novel tool wear suppression method for polycrystalline diamond by applying magnetic field in turning of ferrous materials. Proc. Inst. Mech. Eng. Part B J. Eng. Manuf. 2022, 236, 1772–1781. [Google Scholar] [CrossRef]
- Gupta, A.; Saini, A.; Khatri, N.; Juyal, A. Review of single-point diamond turning process on IR optical materials. Mater. Today Proc. 2022, 69, 435–440. [Google Scholar] [CrossRef]
- La Monaca, A.; Murray, J.W.; Liao, Z.; Speidel, A.; Robles-Linares, J.A.; Axinte, D.A.; Hardy, M.C.; Clare, A.T. Surface integrity in metal machining-Part II: Functional performance. Int. J. Mach. Tools Manuf. 2021, 164, 103718. [Google Scholar] [CrossRef]
- Wang, L.; Ge, S.; Si, H.; Yuan, X.; Duan, F. Roughness control method for five-axis flank milling based on the analysis of surface topography. Int. J. Mech. Sci. 2020, 169, 105337. [Google Scholar] [CrossRef]
- Ning, P.; Zhao, J.; Ji, S.; Li, J.; Dai, H. Simulation and experiment on surface topography of complex surface in single point diamond turning based on determined tool path. Int. J. Adv. Manuf. Technol. 2021, 113, 2555–2562. [Google Scholar] [CrossRef]
- Li, D.; Qiao, Z.; Walton, K.; Liu, Y.; Xue, J.; Wang, B.; Jiang, X. Theoretical and experimental investigation of surface topography generation in slow tool servo ultra-precision machining of freeform surfaces. Materials 2018, 11, 2566. [Google Scholar] [CrossRef] [PubMed]
- Hatefi, S.; Abou-El-Hossein, K. Review of hybrid methods and advanced technologies for in-process metrology in ultra-high-precision single-point diamond turning. Int. J. Adv. Manuf. Technol. 2020, 111, 427–447. [Google Scholar] [CrossRef]
- Chen, Z.; Chen, G.; Yu, Z.; Huang, J.; Wei, H. Status of research on non-conventional technology assisted single-point diamond turning. Nanotechnol. Precis. Eng. NPE 2023, 6, 035002. [Google Scholar] [CrossRef]
- Nair, A.; Kumanan, S.; Prakash, C.; Mohan, D.G.; Sxena, K.K.; Kumar, S.; Kumar, G. Research developments and technological advancements in conventional and non-conventional machining of superalloys—A review. J. Adhes. Sci. Technol. 2023, 37, 3053–3124. [Google Scholar] [CrossRef]
- Chopade, S.R.; Barve, S.B. A single point diamond turning and integrated sensory system in nano machining: A survey, research issues and challenges. Mater. Today Proc. 2023, 2214–7853. [Google Scholar] [CrossRef]
- Czerwinski, F.J.M. Thermal stability of aluminum alloys. Materials 2020, 13, 3441. [Google Scholar] [CrossRef]
- Kareem, A.; Qudeiri, J.A.; Abdudeen, A.; Ahammed, T.; Ziout, A. A review on AA 6061 metal matrix composites produced by stir casting. Materials 2021, 14, 175. [Google Scholar] [CrossRef]
- Zhang, P.; Tan, J.; Tian, Y.; Yan, H.; Yu, Z. Research progress on selective laser melting (SLM) of bulk metallic glasses (BMGs): A review. Int. J. Adv. Manuf. Technol. 2021, 118, 2017–2057. [Google Scholar] [CrossRef]
- Nikanorov, S.; Osipov, V.; Regel, L. Structural and mechanical properties of directionally solidified Al-Si Alloys. J. Mater. Eng. Perform. 2019, 28, 7302–7323. [Google Scholar] [CrossRef]
- Chaieb, O.; Olufayo, O.A.; Songmene, V.; Jahazi, M. Investigation on surface quality of a rapidly solidified Al–50% Si alloy component for deep-space applications. Materials 2020, 13, 3412. [Google Scholar] [CrossRef] [PubMed]
- Hweju, Z.; Abou-El-Hossein, K. Surface roughness prediction based on acoustic emission signals in high-precision diamond turning of rapidly solidified optical aluminum grade (RSA443). Key Eng. Mater. 2020, 841, 363–368. [Google Scholar] [CrossRef]
- Zhao, L.; Zhang, J.; Zhang, J.; Dai, H.; Hartmaier, A.; Sun, T. Numerical simulation of materials-oriented ultra-precision diamond cutting: Review and outlook. Int. J. Extrem. Manuf. 2023, 5, 022001. [Google Scholar] [CrossRef]
- Abou-El-Hossein, K.; Olufayo, O.; Mkoko, Z. Diamond tool wear during ultra-high precision machining of rapidly solidified aluminium RSA 905. Wear 2013, 302, 1105–1112. [Google Scholar] [CrossRef]
- Mkoko, Z.; Abou-El-Hossein, K. Aspects of ultra-high-precision diamond machining of RSA 443 optical aluminium. In Proceedings of the SPIE Optical Engineering + Applications, San Diego, CA, USA, 9–13 August 2015; Volume 9575. [Google Scholar]
- Musavi, S.H.; Davoodi, B.; Eskandari, B. Evaluation of surface roughness and optimization of cutting parameters in turning of AA2024 alloy under different cooling-lubrication conditions using RSM method. J. Cent. South Univ. 2020, 27, 1714–1728. [Google Scholar] [CrossRef]
- Guo, J.; Zhang, J.; Wang, H.; Liu, K.; Kumar, A.S. Surface quality characterisation of diamond cut V-groove structures made of rapidly solidified aluminium RSA-905. Precis. Eng. 2018, 53, 120–133. [Google Scholar] [CrossRef]
- Saini, V.; Sharma, D.; Kalla, S.; Chouhan, T. Optimisation of process parameter in ultra-precision diamond turning of polycarbonate material. In Proceedings of the International Conference on Manufacturing Excellence MANFEX, Noida, India, 29–30 March 2012. [Google Scholar]
- Cheung, C.F.; Lee, W.B. A theoretical and experimental investigation of surface roughness formation in ultra-precision diamond turning. Int. J. Mach. Tools Manuf. 2000, 40, 979–1002. [Google Scholar] [CrossRef]
- Wu, D.; Zhang, P.; Wang, H.; Qiao, Z.; Wang, B. Effect of cutting parameters on surface quality during diamond turning of micro-prism array. Proc. Inst. Mech. Eng. Part B J. Eng. Manuf. 2017, 231, 555–561. [Google Scholar] [CrossRef]
- He, C.; Zong, W.; Cao, Z.; Sun, T. Theoretical and empirical coupled modeling on the surface roughness in diamond turning. Mater. Des. 2015, 82, 216–222. [Google Scholar] [CrossRef]
- Baş, D.; Boyacı, I.H. Modeling and optimization I: Usability of response surface methodology. J. Food Eng. 2007, 78, 836–845. [Google Scholar] [CrossRef]
- Morshedi, A.; Akbarian, M. Application of response surface methodology: Design of experiments and optimization: A mini review. J. Fundam. Appl. Life Sci. 2014, 54, 2434–2439. [Google Scholar]
- Azam, M.; Jahanzaib, M.; Wasim, A. Surface roughness modeling using RSM for HSLA steel by coated carbide tools. Int. J. Adv. Manuf. Technol. 2015, 78, 1031–1041. [Google Scholar] [CrossRef]
- Asiltürk, I.; Neşeli, S.; Ince, M.A. Optimisation of parameters affecting surface roughness of Co28Cr6Mo medical material during CNC lathe machining by using the Taguchi and RSM methods. Measurement 2016, 78, 120–128. [Google Scholar] [CrossRef]
- Xiao, M.; Shen, X.; Ma, Y.; Yang, F.; Gao, N.; Wei, W.; Wu, D. Prediction of surface roughness and optimization of cutting parameters of stainless steel turning based on RSM. Math. Probl. Eng. 2018, 2018, 9051084. [Google Scholar] [CrossRef]
- Kumar, R.; Channi, A.S.; Kaur, R.; Sharma, S.; Grewal, J.S.; Singh, S.; Verma, A.; Haber, R. Exploring the intricacies of machine learning-based optimization of electric discharge machining on squeeze cast TiB2/AA6061 composites: Insights from morphological, and microstructural aspects in the surface structure analysis of recast layer formation and worn-out analysis. J. Mater. Res. Technol. 2023, 26, 8569–8603. [Google Scholar] [CrossRef]
- Venkata Rao, K.; Murthy, P. Modeling and optimization of tool vibration and surface roughness in boring of steel using RSM, ANN and SVM. J. Intell. Manuf. 2018, 29, 1533–1543. [Google Scholar] [CrossRef]
- Sims, K. Evolving 3D morphology and behavior by competition. Artif. Life 1994, 1, 353–372. [Google Scholar] [CrossRef]
- Forrest, S. Genetic algorithms: Principles of natural selection applied to computation. Science 1993, 261, 872–878. [Google Scholar] [CrossRef]
- Suresh, P.; Rao, P.V.; Deshmukh, S. A genetic algorithmic approach for optimization of surface roughness prediction model. Int. J. Mach. Tools Manuf. 2002, 42, 675–680. [Google Scholar] [CrossRef]
- Gill, D.S.K.; Gupta, M.; Gupta, M.; Satsangi, P.S. A genetic algorithmic approach for optimization of surface roughness prediction model in turning using UD-GFRP composite. Indian J. Eng. Mater. Sci. 2012, 19, 386–396. [Google Scholar]
- Sardinas, R.Q.; Santana, M.R.; Brindis, E.A. Genetic algorithm-based multi-objective optimization of cutting parameters in turning processes. Eng. Appl. Artif. Intell. 2006, 19, 127–133. [Google Scholar] [CrossRef]
- Seeman, M.; Kanagarajan, D.; Sivaraj, P.; Seetharaman, R.; Devaraju, A. Optimization through NSGA-II during machining of A356Al/20% SiCp metal matrix composites using PCD Tool. In Proceedings of the IOP Conference Series: Materials Science and Engineering, Kanchipuram, India, 8–10 May 2019; IOP Publishing: Bristol, UK, 2019. [Google Scholar] [CrossRef]
- Lu, Z.S.; Wang, M.H. Optimization of cutting conditions in ultra-precision turning based on mixed genetic-simulated annealing algorithm. Key Eng. Mater. 2006, 315, 617–622. [Google Scholar] [CrossRef]
- Xie, N.; Zhou, J.; Zheng, B. An energy-based modeling and prediction approach for surface roughness in turning. Int. J. Adv. Manuf. Technol. 2018, 96, 2293–2306. [Google Scholar] [CrossRef]
- Klancnik, S.; Brezocnik, M.; Balic, J.; Karabegovic, I. Programming of CNC milling machines using particle swarm optimization. Mater. Manuf. Process. 2013, 28, 811–815. [Google Scholar] [CrossRef]
- Rath, D.; Panda, S.; Mishra, A.; Pal, K. Particle Swarm Optimization and Machinability Aspects during Turning of Hardened D3 Steel. J. Adv. Manuf. Syst. 2020, 19, 641–662. [Google Scholar] [CrossRef]
- Van, A.-L.; Nguyen, T.-T.; Dang, X.-B. Optimization of Rough Self-Propelled Rotary Turning Parameters in terms of Total Energy Consumption and Surface Roughness. Teh. Vjesn. 2023, 30, 1728–1736. [Google Scholar] [CrossRef]
- Hanafi, I.; Cabrera, F.M.; Dimane, F.; Manzanares, J.T. Application of particle swarm optimization for optimizing the process parameters in turning of PEEK CF30 Composites. Procdia Technol. 2016, 22, 195–202. [Google Scholar] [CrossRef]
- Vázquez, E.; Ciurana, J.; Rodríguez, C.A.; Thepsonthi, T.; Özel, T. Swarm intelligent selection and optimization of machining system parameters for microchannel fabrication in medical devices. Mater. Manuf. Process. 2011, 26, 403–414. [Google Scholar] [CrossRef]
- Englebrecht, A.P. Computational Intelligence: An Introduction; Wiley: West Sussex, UK, 2007. [Google Scholar]
- Chen, H.; Heidari, A.A.; Chen, H.; Wang, M.; Pan, Z.; Gandomi, A.H. Multi-population differential evolution-assisted Harris hawks optimization: Framework and case studies. Future Gener. Comput. Syst. 2020, 111, 175–198. [Google Scholar] [CrossRef]
- Liang, J.; Qiao, K.; Yu, K.; Ge, S.; Qu, B.; Xu, R.; Li, K. Parameters estimation of solar photovoltaic models via a self-adaptive ensemble-based differential evolution. Sol. Energy 2020, 207, 336–346. [Google Scholar] [CrossRef]
- Mkoko, Z.A. Ultra-High Precision Machining of Optical Aluminium (RSA-443). Ph.D. Thesis, Nelson Mandela University, Port Elizabeth, South Africa, 2019. [Google Scholar]
- Piotrowski, A.P.; Napiorkowski, J.J.; Piotrowska, A.E. Particle Swarm Optimization or Differential Evolution—A comparison. Eng. Appl. Artif. Intell. 2023, 121, 106008. [Google Scholar] [CrossRef]
- Ejiofor, V.E.; Abou-El-Hossein, K. Optimization Strategy for Molecular Dynamics Simulations of Nanometric Cutting of Aluminium Alloy Using Molecular Modelling. Mater. Sci. Forum 2023, 1084, 79–84. [Google Scholar] [CrossRef]
- Kim, W.T.; Zhang, D.L.; Cantor, B. Microstructure of rapidly solidified aluminium-based immiscible alloys. Mater. Sci. Eng. A 1991, 134, 1133–1138. [Google Scholar] [CrossRef]


| Run | Cutting Speed (s) (rpm) | Cutting Feed Rate (f) (mm/min) | Cutting Depth (d) (μm) | Surface Roughness Ra (nm) |
|---|---|---|---|---|
| 1 | 1750 | 25 | 25 | 39.33 |
| 2 | 1750 | 25 | 5 | 35.55 |
| 3 | 3000 | 5 | 15 | 14.48 |
| 4 | 1750 | 15 | 15 | 23.94 |
| 5 | 1750 | 15 | 15 | 24.0 |
| 6 | 1750 | 5 | 25 | 17.45 |
| 7 | 500 | 15 | 25 | 76.82 |
| 8 | 3000 | 25 | 15 | 26.22 |
| 9 | 3000 | 15 | 25 | 22.05 |
| 10 | 500 | 15 | 15 | 187.18 |
| 11 | 3000 | 15 | 5 | 26.20 |
| 12 | 500 | 5 | 15 | 28.42 |
| 13 | 1750 | 5 | 5 | 17.35 |
| 14 | 1750 | 15 | 15 | 23.8 |
| 15 | 500 | 15 | 5 | 66.81 |
| Type of Fit | F-Value | p-Value, Prob > F | Lack of Fit, Sum of Squares | Df for Lack of Fit | R-Squared | Evaluation |
|---|---|---|---|---|---|---|
| Linear | 24.70 | <0.0001 | 5.541 × 10⁻⁴ | 9 | 0.8707 | |
| 2FI | 0.11 | 0.9499 | 5.316 × 10⁻⁴ | 6 | 0.8760 | |
| Quadratic | 35.01 | 0.0009 | 2.409 × 10⁻⁵ | 3 | 0.9944 | Suggested |
| Cubic | 248.55 | 0.0040 | 0.000 | 0 | 1.0000 | Aliased |
| Source | Sum of Squares | Degree of Freedom | Mean Square | F-Value | p-Value Prob > F | Characteristics |
|---|---|---|---|---|---|---|
| Model | 4.265 × 10⁻³ | 9 | 4.736 × 10⁻⁴ | 98.02 | <0.0001 | Significant |
| A-Speed | 1.867 × 10⁻³ | 1 | 1.867 × 10⁻³ | 386.35 | <0.0001 | Significant |
| B-Feed | 1.865 × 10⁻³ | 1 | 1.865 × 10⁻³ | 386.03 | <0.0001 | Significant |
| C-Depth | 6.046 × 10⁻⁷ | 1 | 6.046 × 10⁻⁷ | 0.13 | 0.7380 | |
| A2 | 3.380 × 10⁻⁴ | 1 | 3.380 × 10⁻⁴ | 69.95 | 0.0004 | Significant |
| B2 | 8.091 × 10⁻⁵ | 1 | 8.091 × 10⁻⁵ | 16.75 | 0.0094 | Significant |
| C2 | 7.066 × 10⁻⁵ | 1 | 7.066 × 10⁻⁵ | 14.63 | 0.0123 | Significant |
| AB | 2.905 × 10⁻⁷ | 1 | 2.905 × 10⁻⁷ | 0.060 | 0.8161 | |
| AC | 2.086 × 10⁻⁵ | 1 | 2.086 × 10⁻⁶ | 4.32 | 0.0923 | |
| BC | 1.408 × 10⁻⁶ | 1 | 1.408 × 10⁻⁶ | 0.29 | 0.6125 | |
| Residuals | 2.416 × 10⁻⁵ | 5 | 4.832 × 10⁻⁶ | |||
| Lack of fit | 2.409 × 10⁻⁵ | 3 | 8.031 × 10⁻⁶ | 248.55 | 0.0040 | Significant |
| Pure Error | 6.463 × 10⁻⁸ | 2 | 3.231 × 10⁻⁸ | |||
| Corr. Total | 4.287 × 10⁻³ | 14 |
| Std. Dev. | 2.198 × 10⁻³ | R-Squared | 0.9944 |
| Mean | 0.037 | Adj R-Squared | 0.9842 |
| C.V | 5.96 | Pred R-Squared | 0.9100 |
| PRESS | 3.856 × 10⁻⁴ | Adeq Precision | 34.038 |
| Source | Sum of Squares | Degree of Freedom | Mean Square | F-Value | p-Value Prob > F | Characteristics |
|---|---|---|---|---|---|---|
| Model | 4.265 × 10⁻³ | 9 | 4.736 × 10⁻⁴ | 98.02 | <0.0001 | Significant |
| A-Speed | 1.867 × 10⁻³ | 1 | 1.867 × 10⁻³ | 386.35 | <0.0001 | Significant |
| B-Feed | 1.865 × 10⁻³ | 1 | 1.865 × 10⁻³ | 386.03 | <0.0001 | Significant |
| A2 | 3.380 × 10⁻⁴ | 1 | 3.380 × 10⁻⁴ | 69.95 | 0.0004 | Significant |
| B2 | 8.091 × 10⁻⁵ | 1 | 8.091 × 10⁻⁵ | 16.75 | 0.0094 | Significant |
| C2 | 7.066 × 10⁻⁵ | 1 | 7.066 × 10⁻⁵ | 14.63 | 0.0123 | Significant |
| Residuals | 2.416 × 10⁻⁵ | 5 | 4.832 × 10⁻⁶ | |||
| Lack of fit | 2.409 × 10⁻⁵ | 3 | 8.031 × 10⁻⁶ | 248.55 | 0.0040 | |
| Pure Error | 6.463 × 10⁻⁸ | 2 | 3.231 × 10⁻⁸ | |||
| Corr. Total | 4.287 × 10⁻³ | 14 |
| Function | Cutting Speed (rpm) | Iterations or Generations | |||
|---|---|---|---|---|---|
| 150 | 500 | 1500 | |||
| GA | Ra_s500 | 500 | - | - | - |
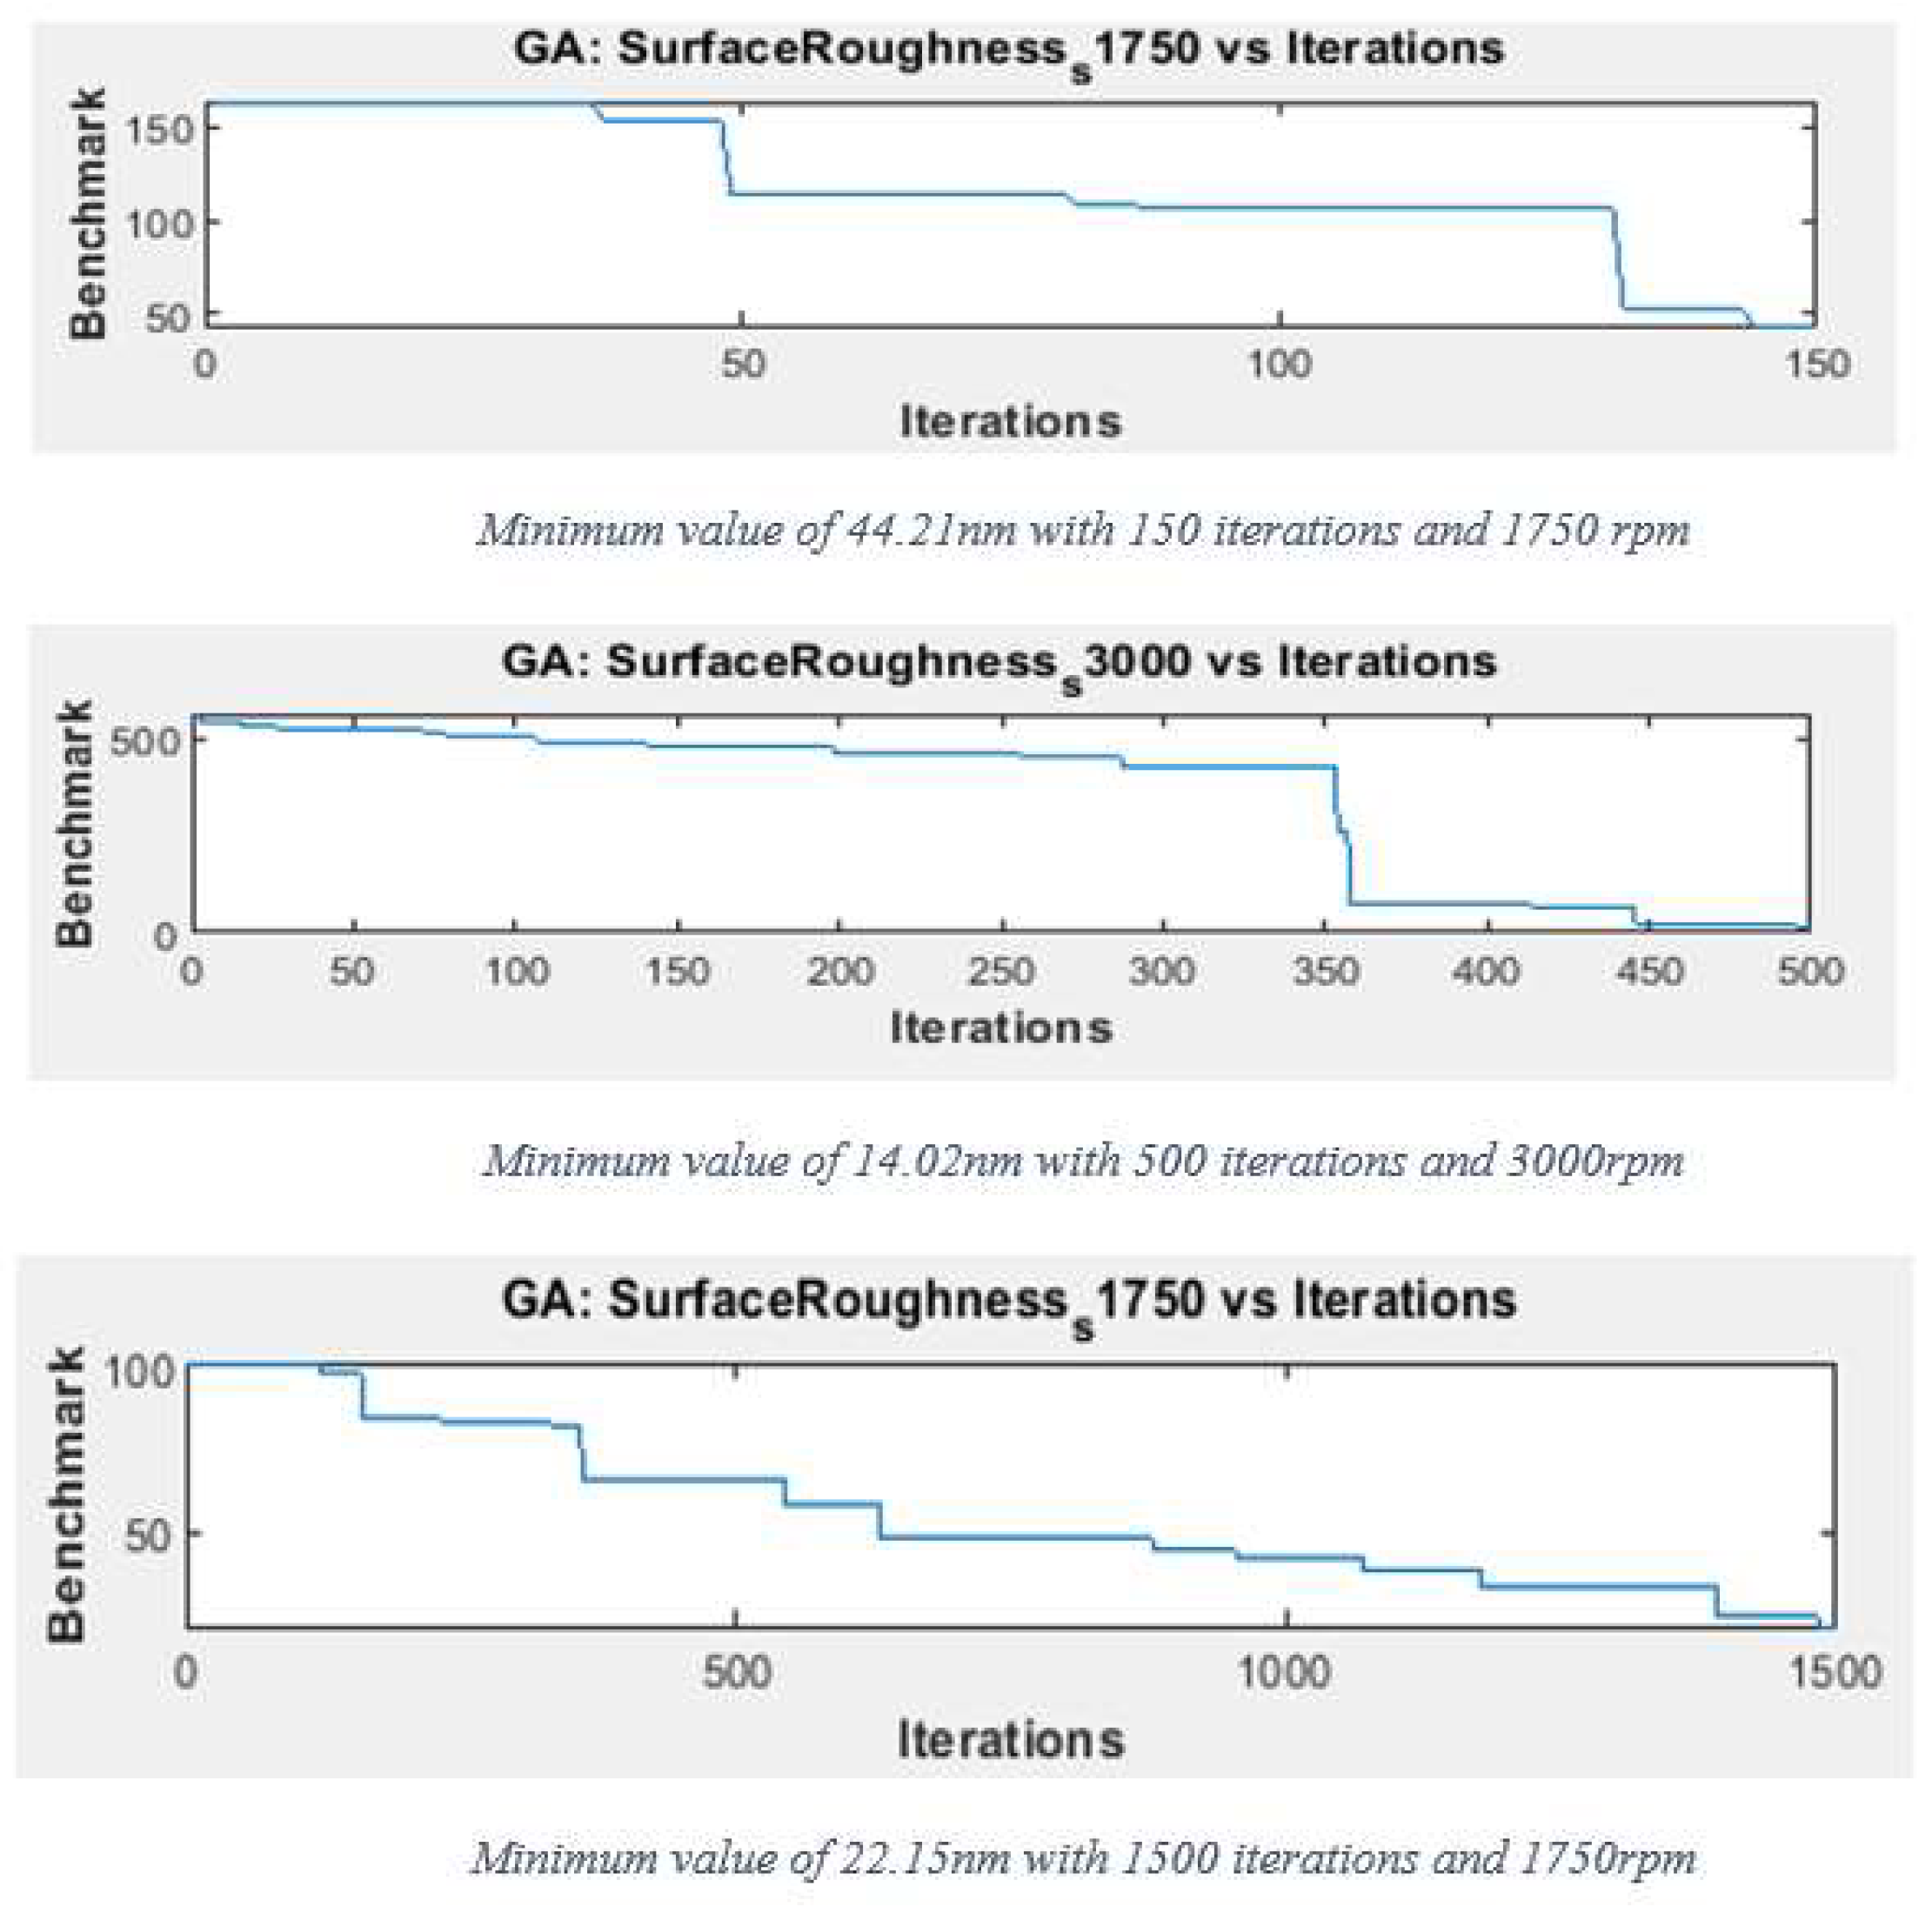
| Ra_s1500 | 1500 | 44.21 nm | - | 22.15 nm | |
| Ra_s3000 | 3000 | - | 14.02 nm | - | |
| PSO | Ra_s500 | 500 | - | - | - |
| Ra_s1500 | 1500 | - | - | - | |
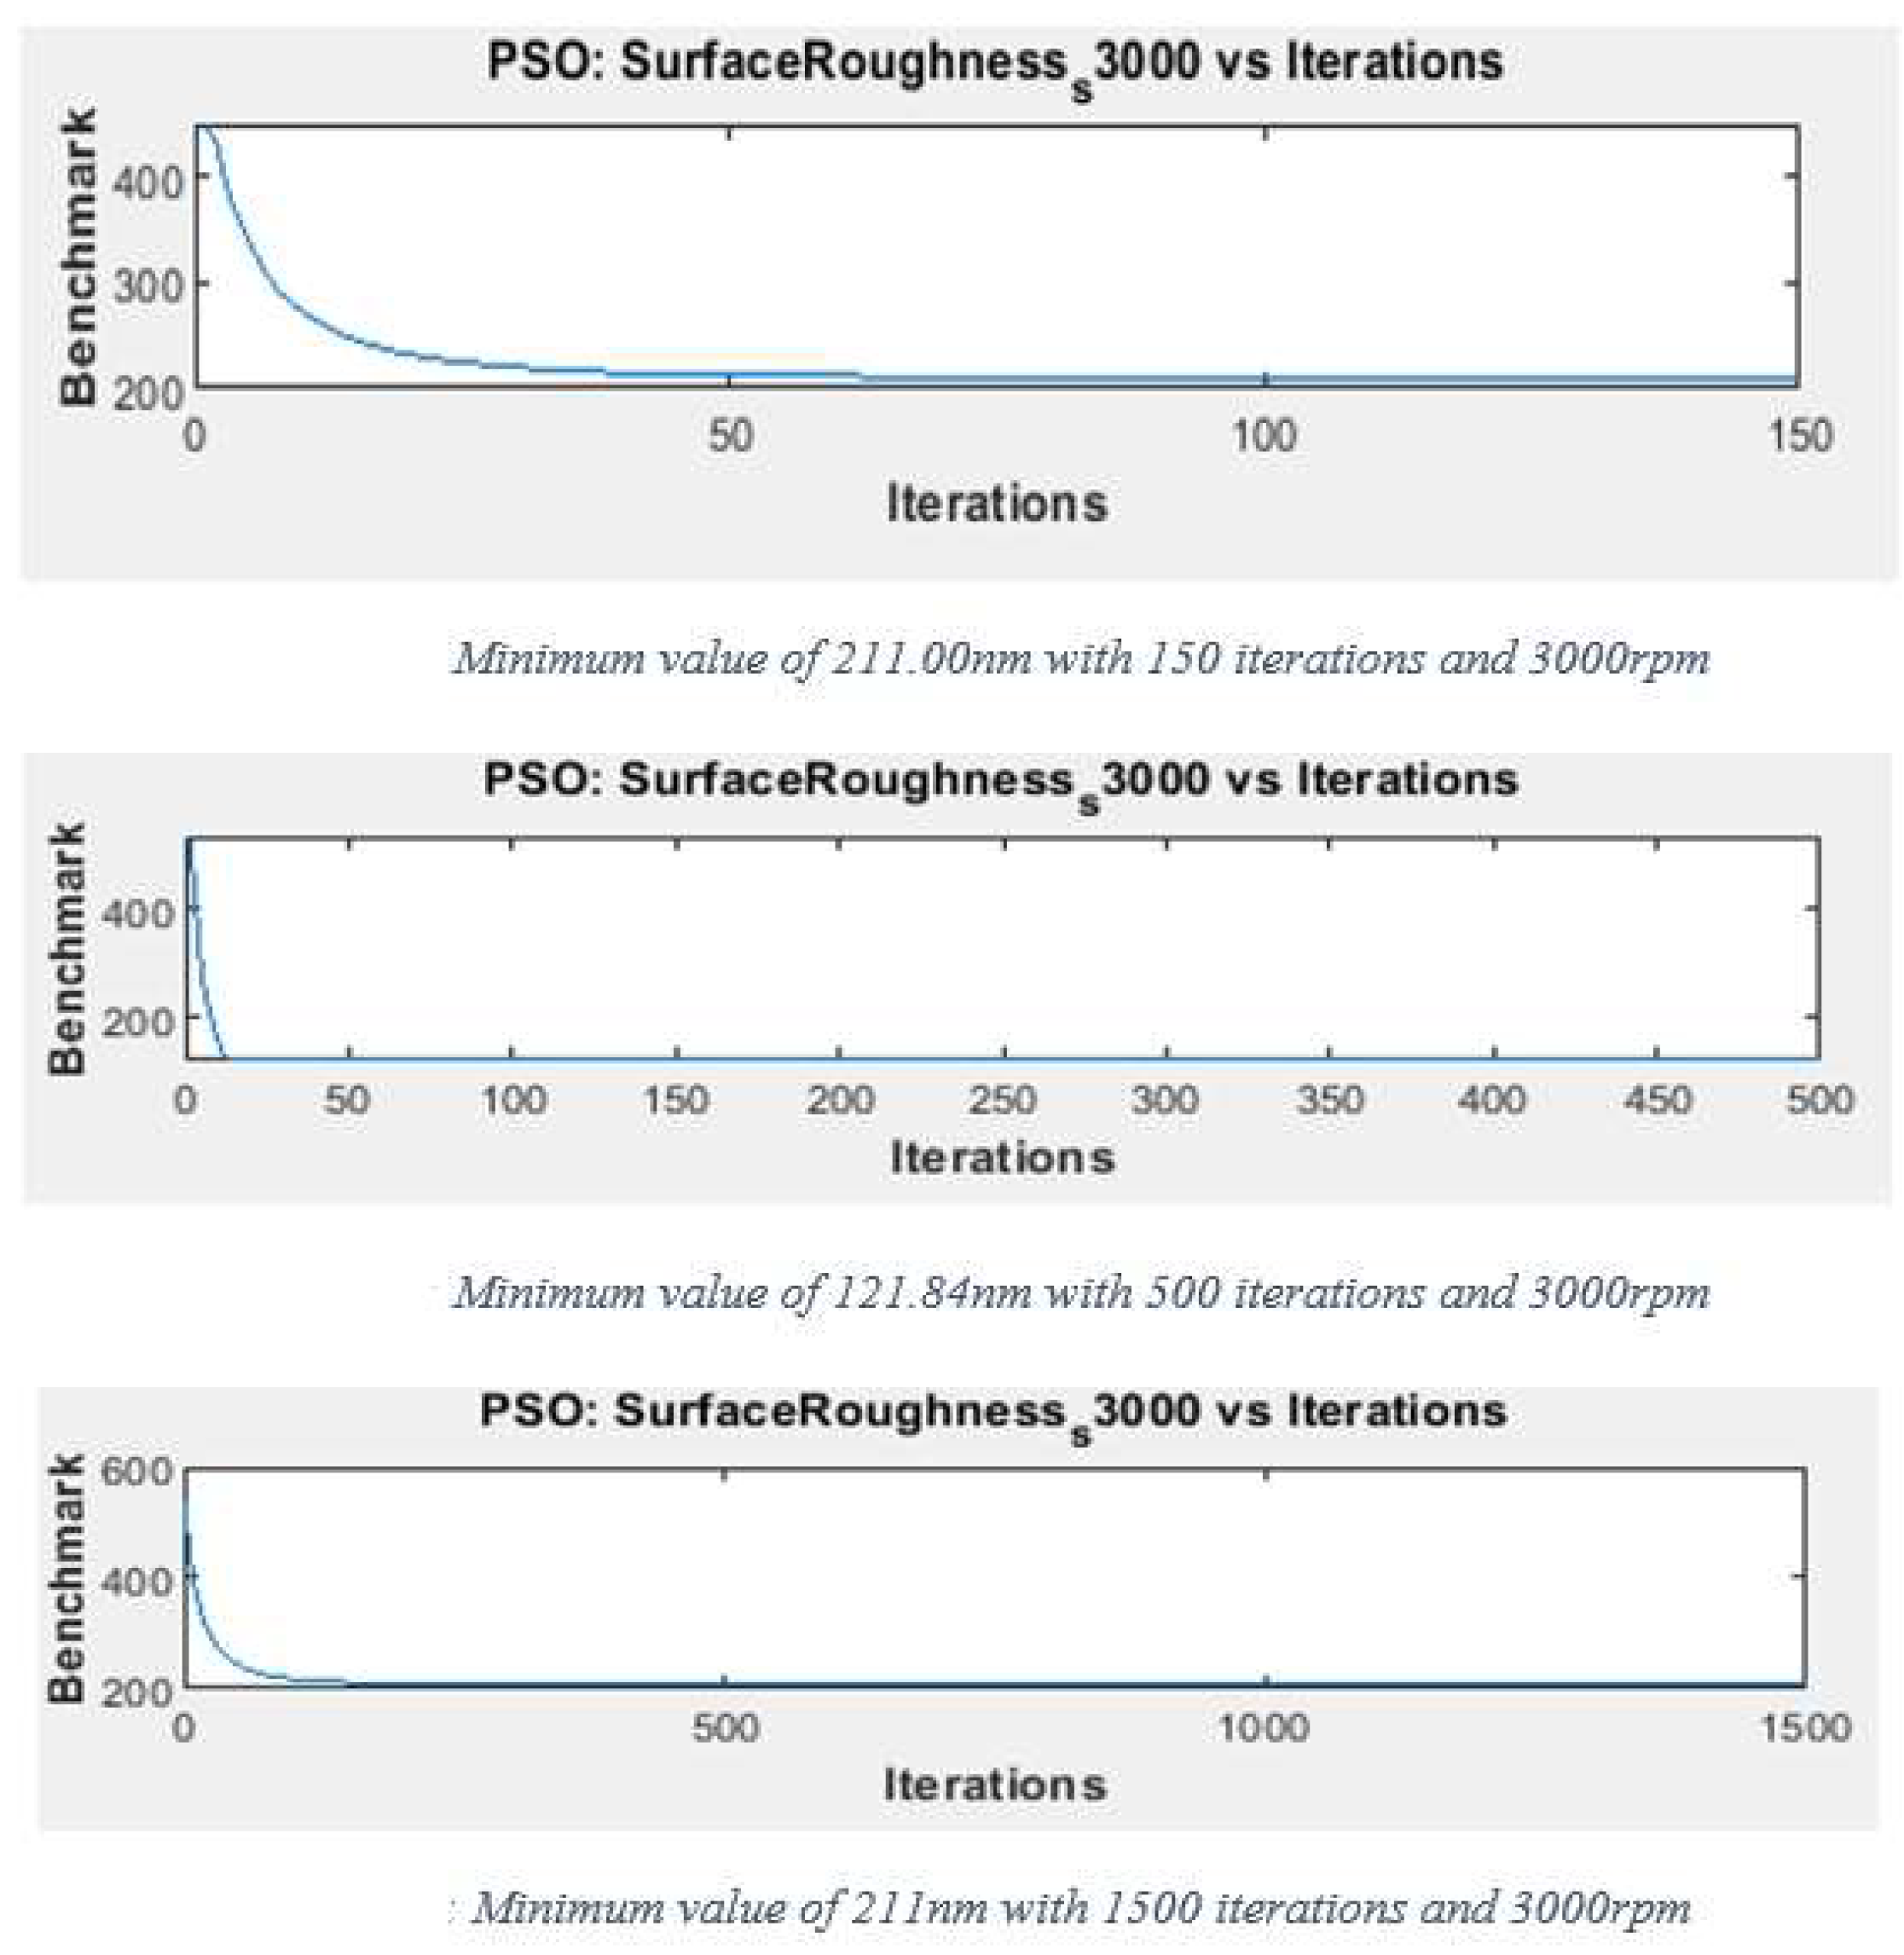
| Ra_s3000 | 3000 | 211.0 nm | 121.84 nm | 211.0 nm | |
| DE | Ra_s500 | 500 | - | - | - |
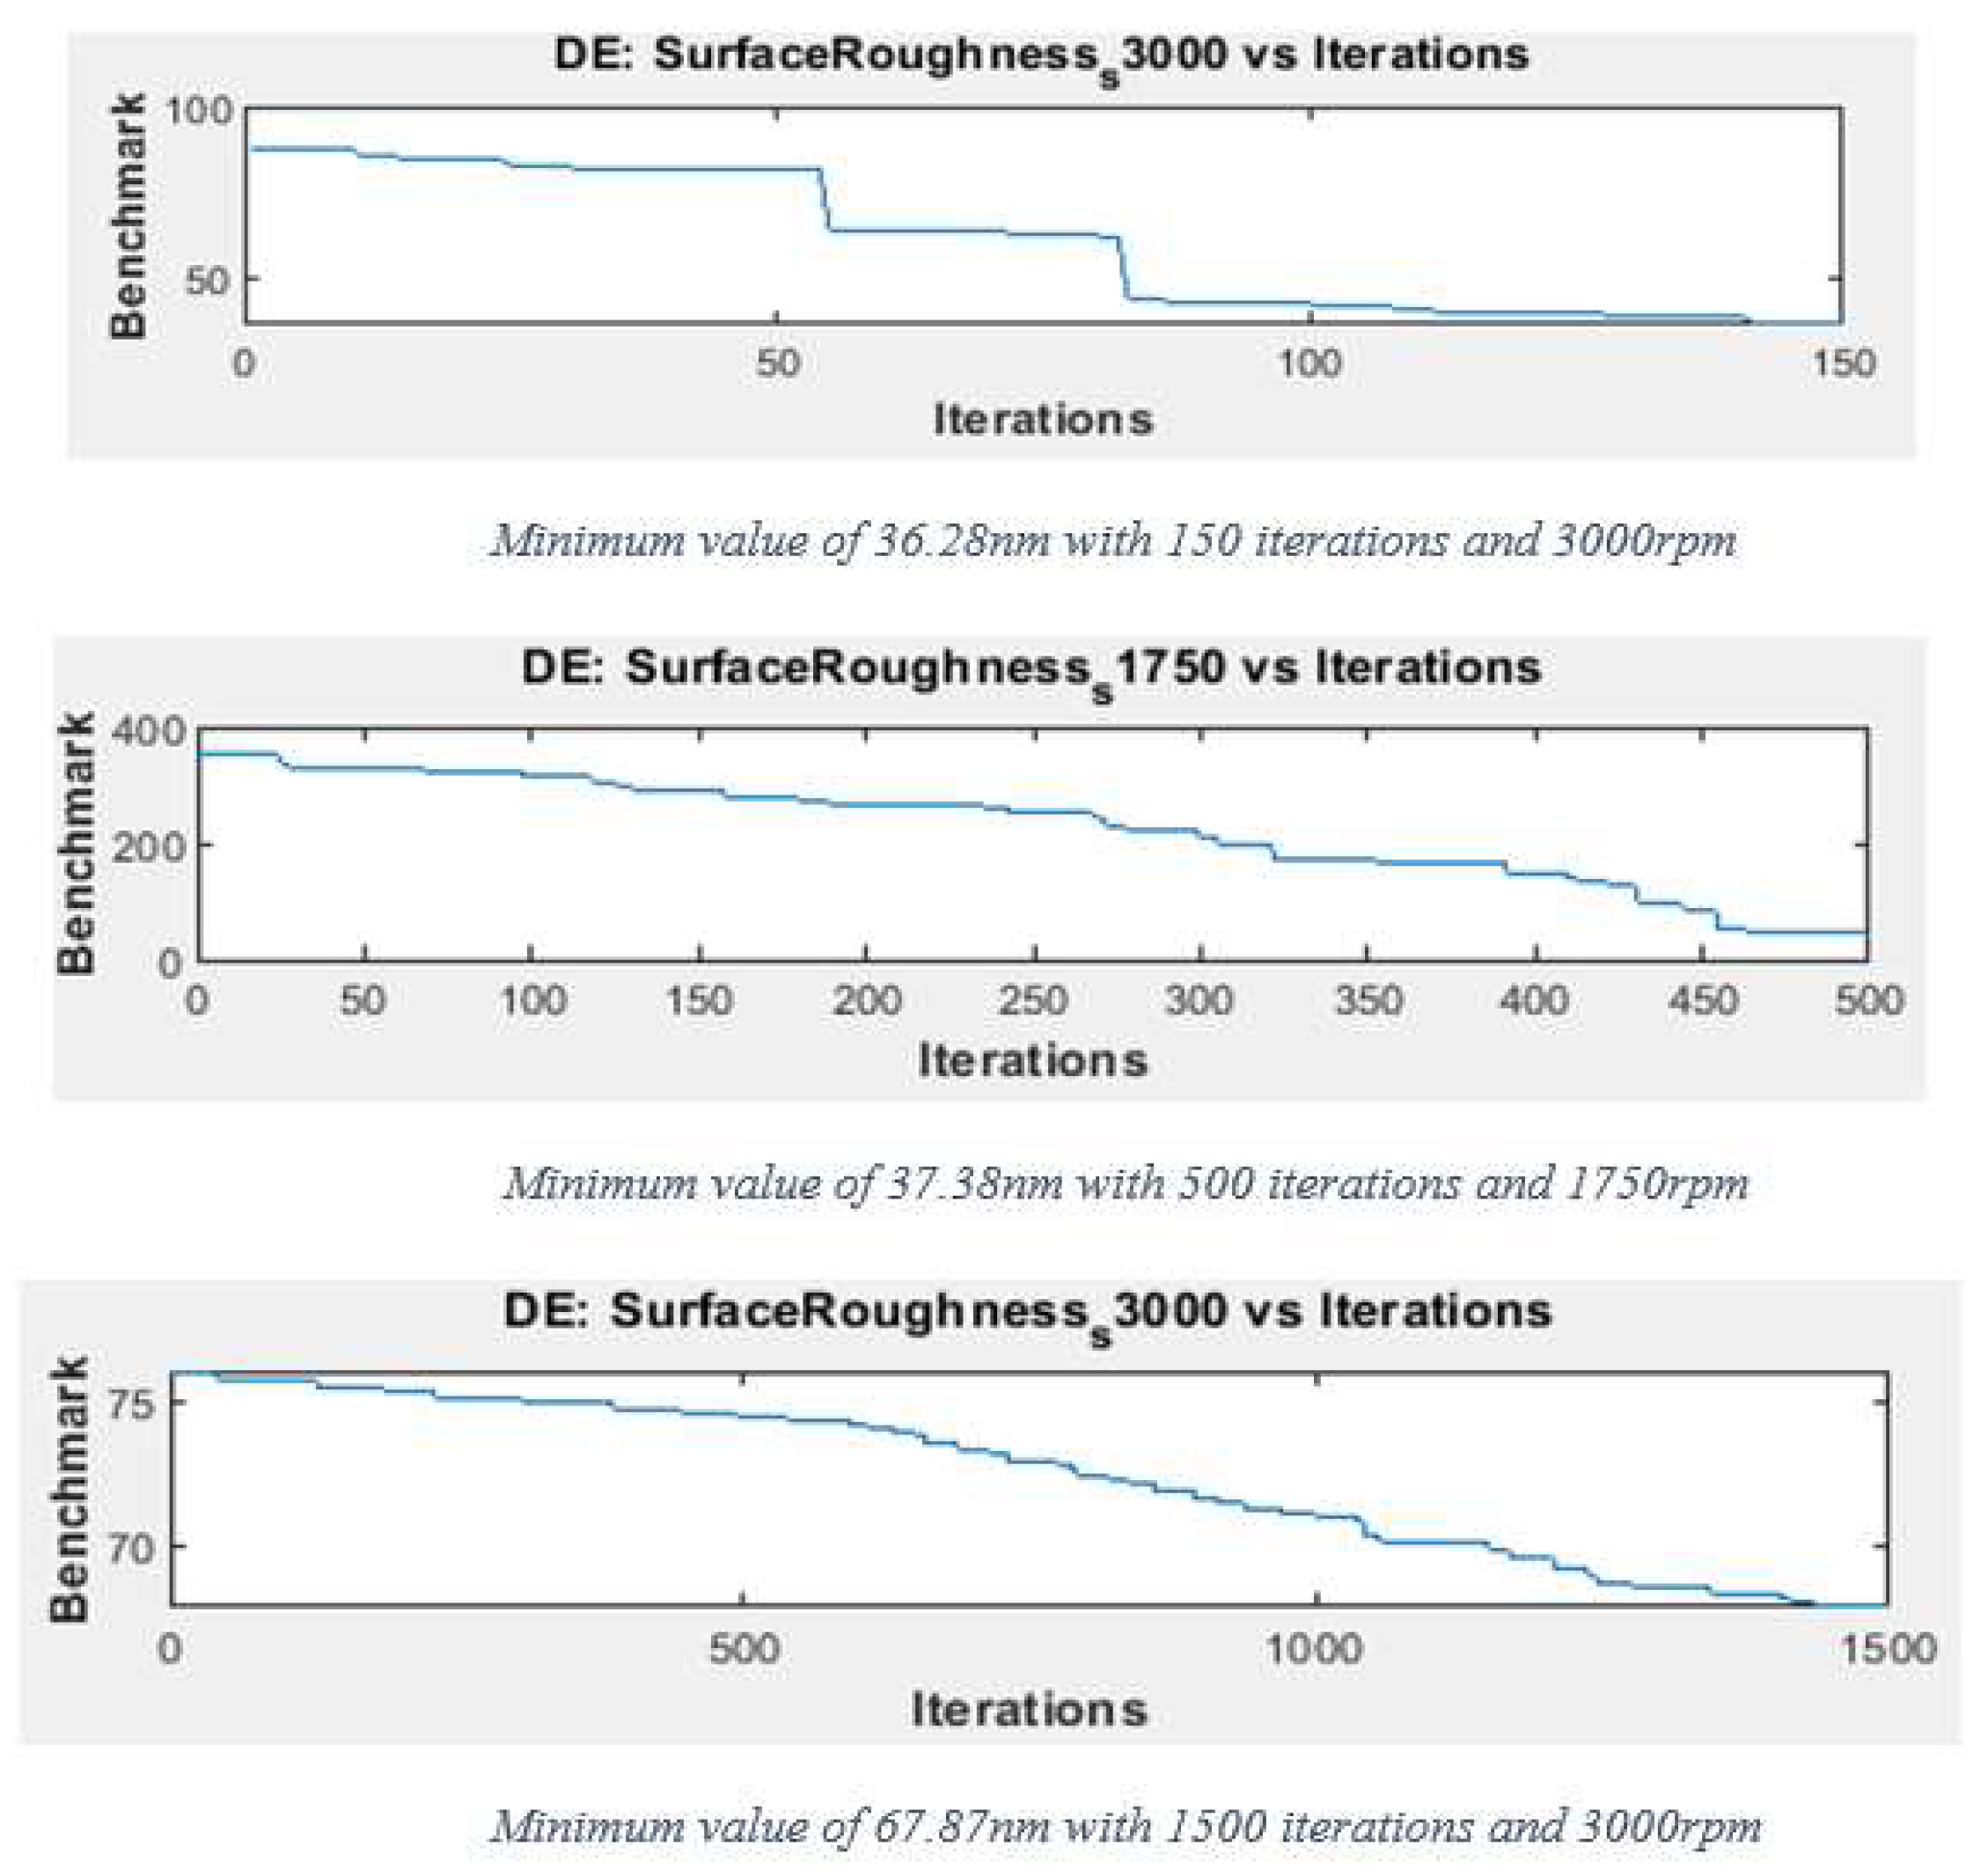
| Ra_s1500 | 1500 | - | 37.38 nm | - | |
| Ra_s3000 | 3000 | 36.28 nm | - | 67.87 nm | |
Disclaimer/Publisher’s Note: The statements, opinions and data contained in all publications are solely those of the individual author(s) and contributor(s) and not of MDPI and/or the editor(s). MDPI and/or the editor(s) disclaim responsibility for any injury to people or property resulting from any ideas, methods, instructions or products referred to in the content. |
© 2024 by the authors. Licensee MDPI, Basel, Switzerland. This article is an open access article distributed under the terms and conditions of the Creative Commons Attribution (CC BY) license (https://creativecommons.org/licenses/by/4.0/).
Share and Cite
Mbangu Tambwe, G.; Pons, D. Optimization of Surface Roughness of Aluminium RSA 443 in Diamond Tool Turning. J. Manuf. Mater. Process. 2024, 8, 61. https://doi.org/10.3390/jmmp8020061
Mbangu Tambwe G, Pons D. Optimization of Surface Roughness of Aluminium RSA 443 in Diamond Tool Turning. Journal of Manufacturing and Materials Processing. 2024; 8(2):61. https://doi.org/10.3390/jmmp8020061
Chicago/Turabian StyleMbangu Tambwe, Gregoire, and Dirk Pons. 2024. "Optimization of Surface Roughness of Aluminium RSA 443 in Diamond Tool Turning" Journal of Manufacturing and Materials Processing 8, no. 2: 61. https://doi.org/10.3390/jmmp8020061