Article

In Situ Stereo Digital Image Correlation with Thermal Imaging as a Process Monitoring Method in Vacuum-Assisted Thermoforming

1
Research Group ProPoliS, Department of Materials Engineering, KU Leuven Campus Bruges, Spoorwegstraat 12, 8200 Bruges, Belgium
2
SIM M3 Program, Technologiepark 48, 9052 Zwijnaarde, Belgium
*
Author to whom correspondence should be addressed.
J. Manuf. Mater. Process. 2024, 8(2), 49; https://doi.org/10.3390/jmmp8020049
Submission received: 19 January 2024 / Revised: 20 February 2024 / Accepted: 22 February 2024 / Published: 1 March 2024
(This article belongs to the Special Issue Advances in Material Forming)

Abstract

:
This experimental study probes the dynamic behaviour of a 3 mm ABS sheet during positive mould vacuum-assisted thermoforming. In this process, the sheet undergoes large and fast deformations caused by the applied vacuum and mechanical stretching by the mould. The objective is to elucidate the complexities of these large, rapid, and non-isothermal deformations. The non-isothermal conditions are caused by the radiative heating of the sheet, convective heat loss to the surrounding air, and conductive heat transfer from the sheet to the mould. By utilizing stereo digital image correlation (DIC) in tandem with thermal imaging, the present study accurately maps the occurring displacement, strain, and strain rate field in relation to real-time temperature variation in the material. The study progresses to observe the ABS material from the moment it contacts the mould until it conforms to a positive 250 mm diameter semi-sphere cast aluminum mould. The DIC methods are validated by comparing thickness values derived from DIC’s principal strain directions to ultrasonic thickness gauge readings. This knowledge not only broadens the understanding of the thermo-mechanical behaviour of the material but also aids in optimizing process parameters for improved thickness uniformity in thermoformed products.

1. Introduction

The vacuum-assisted thermoforming process for heavy gauge thermoplastic sheets follows a sequential series of steps, beginning with the loading and clamping of a flat sheet. The material is then heated using a radiative heater bank, typically from both the top and bottom sides of the sheet. This heating step brings the sheet to a soft, formable state. This heating phase is attentively controlled by setting a specific temperature, which is precisely measured using an infrared (IR) sensor. Despite the symmetrical arrangement of the heating elements aiming for uniform in-plane heat distribution, the temperature across the sheet is almost inevitably uneven [1]. When a uniform heating pattern is applied, the center of the sheet often reaches a higher temperature compared to the clamped edges, resulting in a temperature gradient from the center to the edges [2]. Adjusting the in-plane temperature pattern of the sheet according to the mould shape is a method to enhance the quality of the thermoformed part [3]. During the heating process, the material also experiences thermal strain, leading to warpage. This warpage typically manifests as concave deformations both upward and downward, which is caused by the material being constrained at its edges, thus hindering its ability to thermally expand freely [4]. In the pursuit of capturing intricate details of the mould shape, a common practice is to set a high temperature. However, the use of elevated temperature set points can induce sag deformation [5]. This occurs because of the lower stiffness of the material at high temperatures. The material loses its ability to support its own weight, resulting in sagging or off-sagging deformations [6]. This concave sag deformation can intensify the variation in heat flux distribution across the sheet caused by the altered view factor relative to the heater bank. This might also lead to uneven heat flux on both the upper and lower sides of the sheet, thereby creating temperature gradients both across the surface of the sheet and via its thickness [7]. While increasing the temperature is essential for capturing intricate mould details, it comes with the trade-off of potential sag deformation. To tackle the challenges associated with thermal expansion-induced warpage and sag deformation during heating, a commonly employed technique involves the creation of a pre-forming bubble. This is achieved by applying air pressure within a sealed cabinet to transform the thermoplastic sheet into a bubble-like configuration [8]. In this context, the bubble inflation method can also be considered the ideal strategy for analyzing material behaviour when subjected to extensive deformation, examining different deformation modes within a systematically controlled testing arrangement [4,9,10,11,12,13]. Via the generation of a pre-forming bubble, the onset of contact between the positive mould and the material is postponed. This intentional delay allows the material to stretch uniformly, contributing to a more consistent thickness distribution in the final part. Therefore, the creation of a pre-forming bubble serves as a dual-purpose solution, fostering both uniform stretching and controlled contact and ultimately enhancing the overall quality of the thermoforming process. The height of the pre-forming bubble is a critical parameter in this context, requiring careful matching with the mould height and precise consideration of its location within the forming process. During the subsequent forming stage, the positive mould moves upward to make contact with the softened thermoplastic sheet. In this phase of thermoforming, the mould and polymer interact at various times and locations, depending on the mould shape, aided by a vacuum in between the mould and the sheet to achieve the desired shape. Here, the friction between material and mould, which is highly temperature dependent itself [14], exhibits the highest friction load in the region with initial contact [15,16]. This differential in contact timing, combined with the temperature non-uniform distribution field and material cooling rate across different regions during forming, leads to non-uniform stretching of the polymeric sheet during forming, consequently resulting in an inevitable thickness variation in the final product [1,17].
In thermoforming, the uniformity of wall thickness, or its distribution, is considered as a key factor in determining the quality of a formed product [18,19]. To evaluate this aspect of quality during the thermoforming process and to fine-tune the process parameters for industrial applications, in situ stereo digital image correlation (DIC) as a non-contact method synchronized with a thermal camera significantly enhances the real-time monitoring of 3D surface large deformations and temperature variations across the entire field in industrial thermoforming applications [20]. This method commonly entails applying a random speckle pattern to the surface of the object, and contrasting subsets of images, both “deformed” and “undeformed”, along with performing camera calibration focused on the region of interest. In experimental setups, a stereo camera system captures these speckled patterns as the sample undergoes deformation. The technique involves correlating images taken from various angles, enabling the tracking of alterations in the 3D surface geometry throughout the deformation process [21,22,23]. Given the substantial large out-of-plane deformation inherent in vacuum-forming processes, it is crucial to employ more than one camera to capture the 3D movements involved [24,25]. Seefried and Drummer [26] utilized DIC to investigate the effects of radiation cross-linking and various process parameters. Their research focused on analyzing strain distributions in thermoformed parts, particularly examining how sheet thickness and processing parameters influence these distributions. The implementation of the DIC method on an actual vacuum-forming industrial machine, as demonstrated by Van Mieghem et al. [20], was a significant advancement in this field. Their work effectively highlighted the practicality and feasibility of applying stereo DIC in vacuum forming, contributing insights and methodologies to the industry. Building upon this, Van Mieghem et al. [27,28] introduced a methodology for determining wall thickness in thermoformed products in negative vacuum-assisted semi-sphere mould. This method, utilizing in situ surface strain DIC measurements, effectively validated various strain definition equations, thereby enhancing the precision of thickness calculations in thermoforming processes [27,28]. Later on, the complexities involved in accurately measuring pressure-induced mechanical strains during bubble-assisted thermoforming of thin gauge thermoplastic sheets were thoroughly examined by Ayadi et al. using DIC techniques [2,29]. However, the temperature field across the sheet before forming and during the forming step, which is largely related to material behaviour, was not discussed. Also, the contact between the positive mould and the heated thermoplastic sheet is another gap in the literature that needs to be explored.
To our knowledge, the literature concerning the integration of 3D DIC with thermo-vacuum-forming machinery remains scarce. This research ventures into a comprehensive analysis of the thermo-mechanical behaviour of heavy gauge ABS thermoplastic sheets during the actual thermoforming process, particularly from initial contact with the mould to full adherence to a positive semi-spherical mould of 250 mm diameter. In an effort to address the gaps identified in existing literature, particularly the limited application of 3D DIC in real thermoforming studies, our study integrates in situ stereo DIC technology with thermal imaging cameras. This innovative method provides a synchronized analysis of the material’s 3D deformations and temperature variation during the forming process. By leveraging this integrated methodology, our research aims to outline the progression of strain fields, deformation rates, and temperature variations in real time, with a specific focus on identifying the temperature at which the material exhibits peak strain and the highest strain rate. This endeavour also seeks to establish the thermo-mechanical parameters essential for material characterization in the range of industrial thermo-vacuum-forming processes. The outcomes of this investigation are primed to serve as a benchmark validation case study to enhance the precision of thermoforming simulations and contribute to the broader understanding of material behaviour under thermo-mechanical conditions [13,30].

2. Material and Equipment
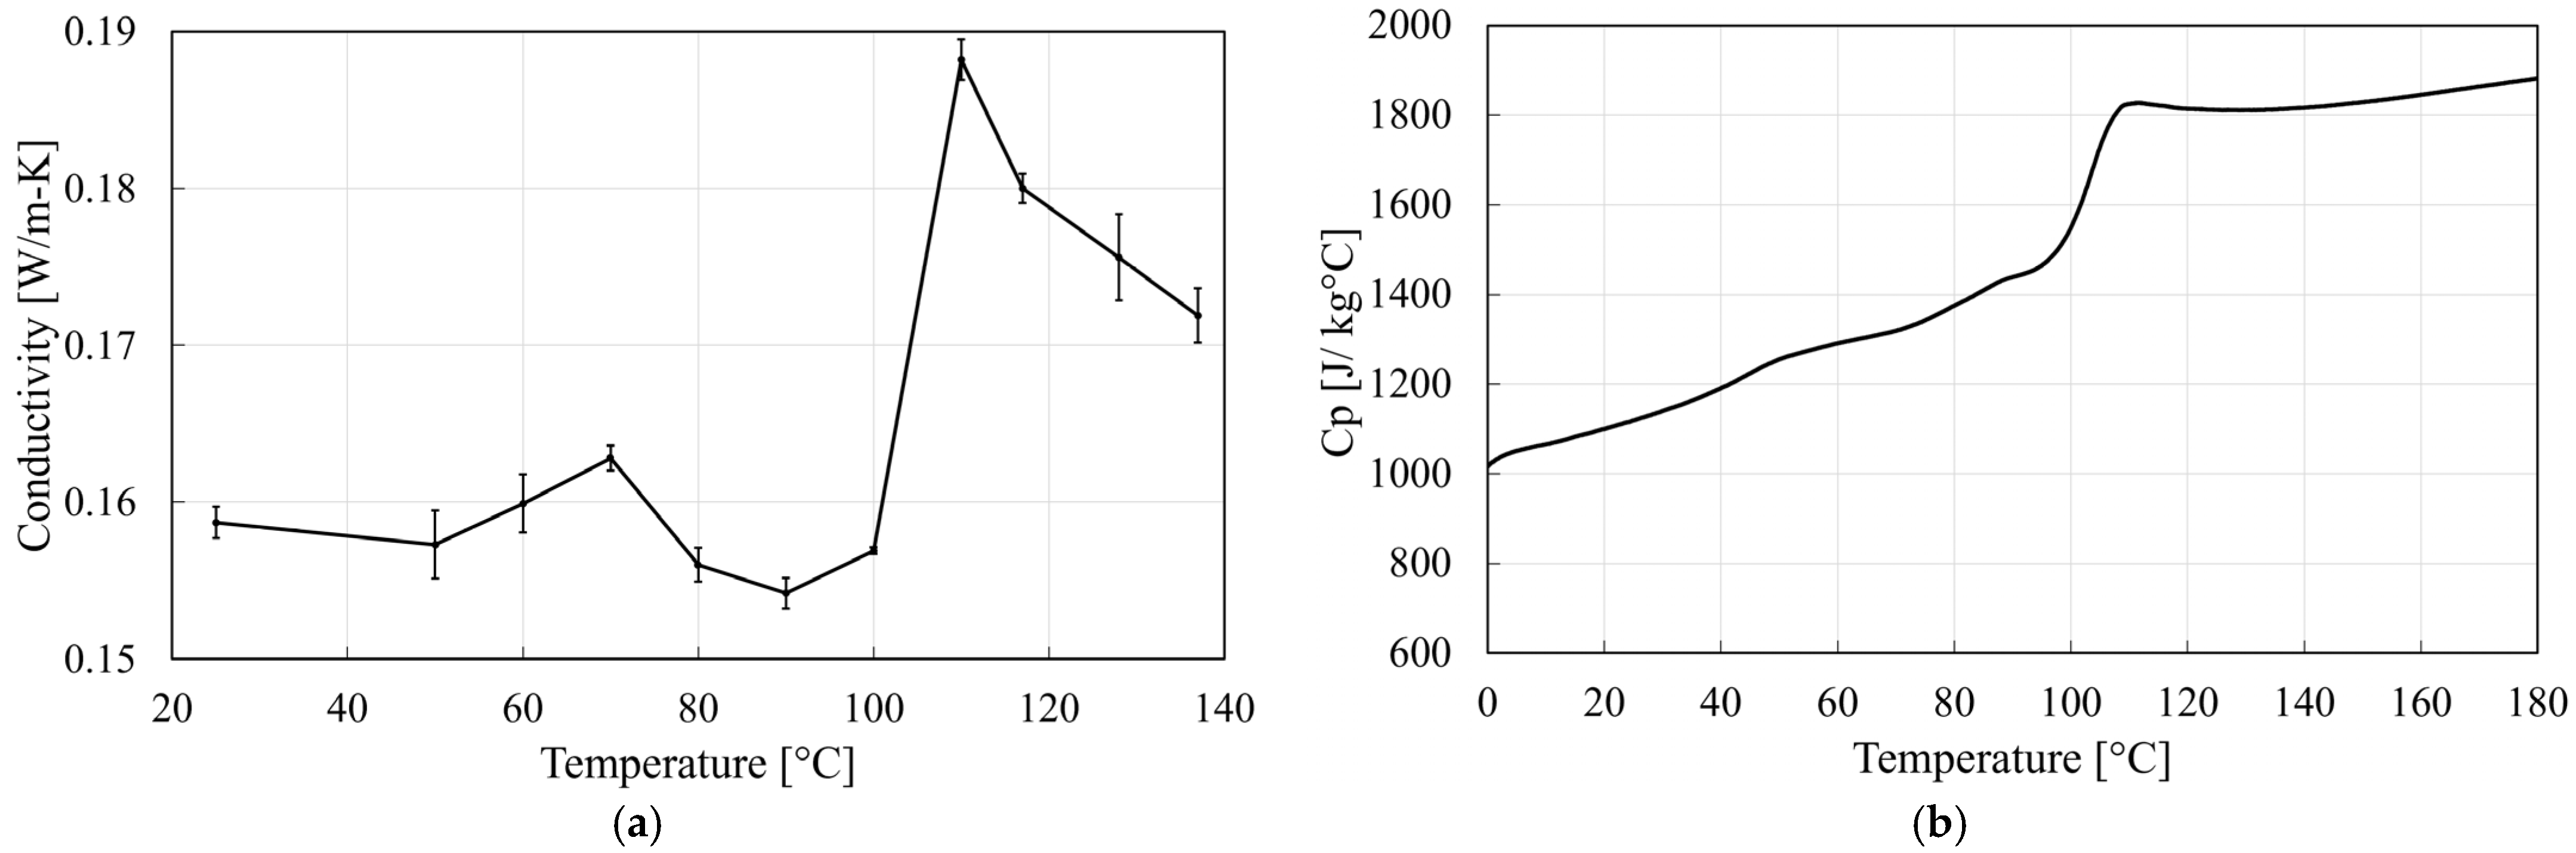
2.1. Material

In the research, a single-layer ABS EpsoTech AB AN2 V0 (Vitalo Industries N.V: Meulebeke, Belgium)extruded material was used [31]. This type of ABS has a glass transition temperature of 105 °C, a density of 1.128 g/cm3, and emissivity of 0.8. Figure 1a shows the thermal conductivity of the material as a function of temperature. This property was measured using the C-Therm instrument with a Modified Transient Plane Source (MTPS) sensor [32]. The thermal conductivity was measured from 25 °C to 140 °C using a convection oven according to the ASTM D7987 standard [33]. The heat capacity of the material as a function of temperature is depicted in Figure 1b. These data were obtained via Differential Scanning Calorimetry (DSC), using a DSC 250 (TA Instrument: Antwerp, Belgium). The procedure involved a temperature ramp rate of 20 °C/min, with an isothermal hold of 10 min both before and after the heating segment. This approach is in accordance with the ASTM E1269 standard [34], using the three-run test method. The sample sheet utilized in the thermoforming experiment has dimensions of 50 cm by 50 cm, with a nominal thickness of 3 mm.

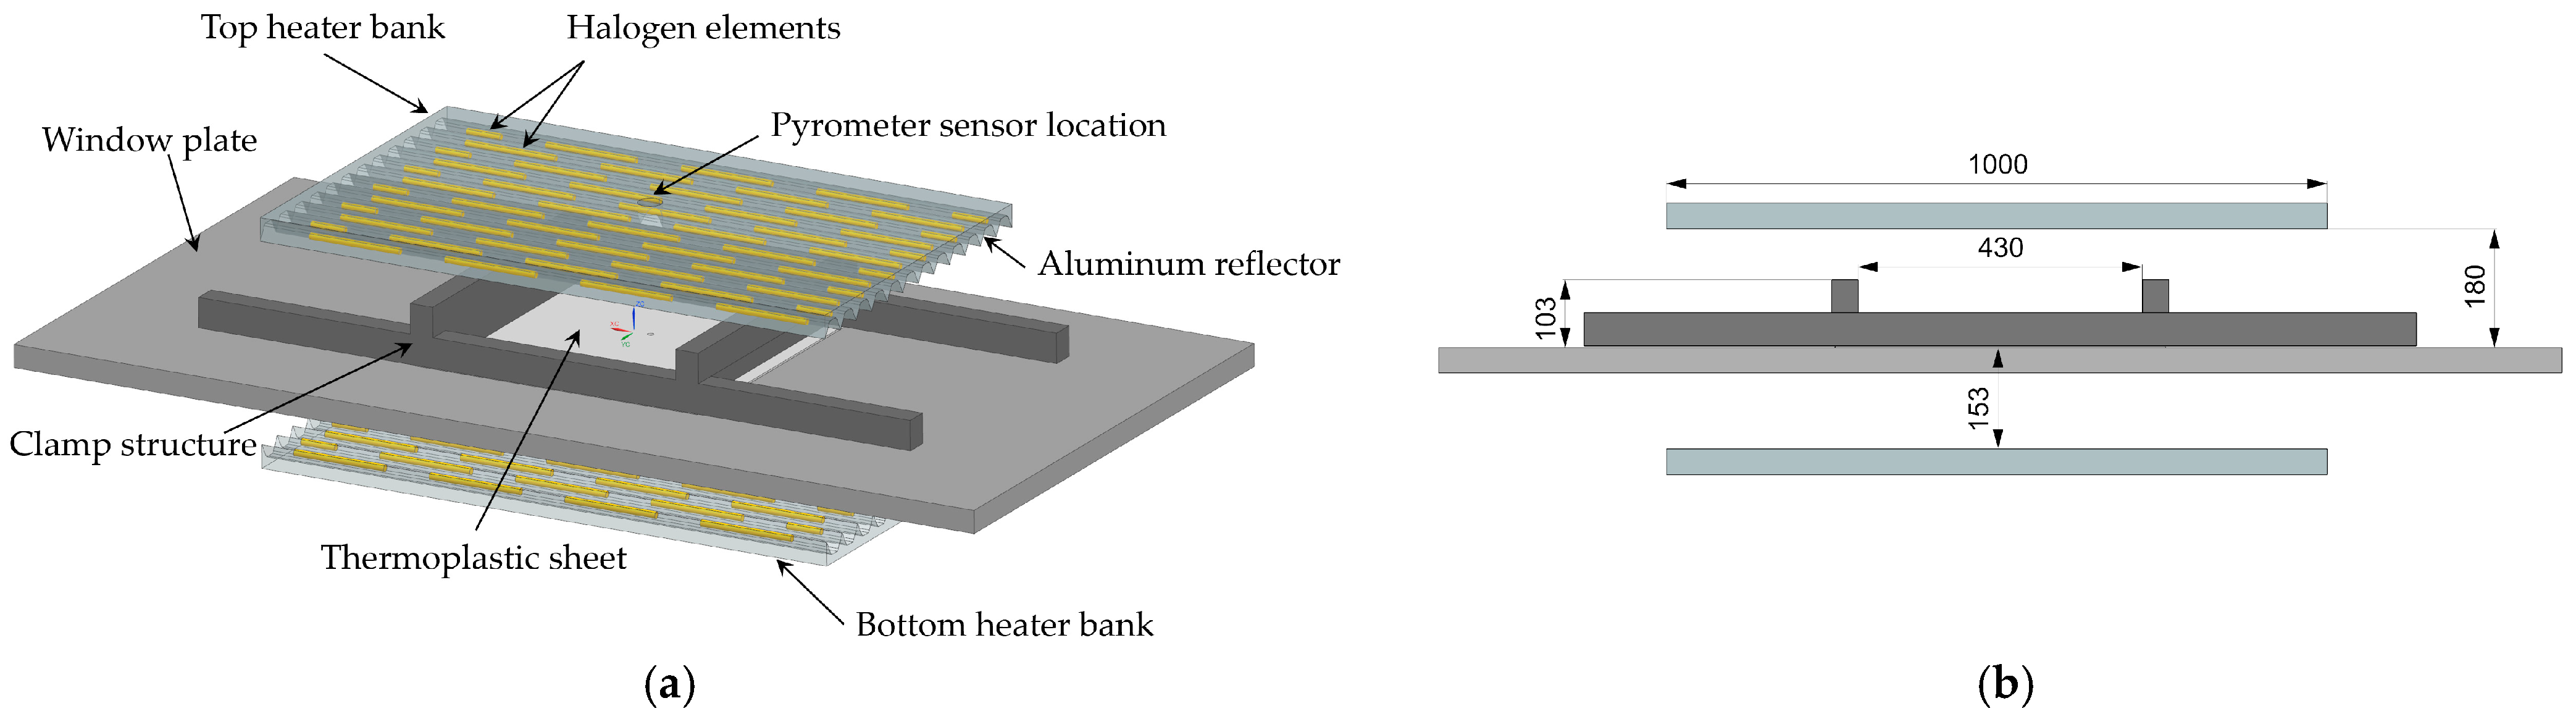
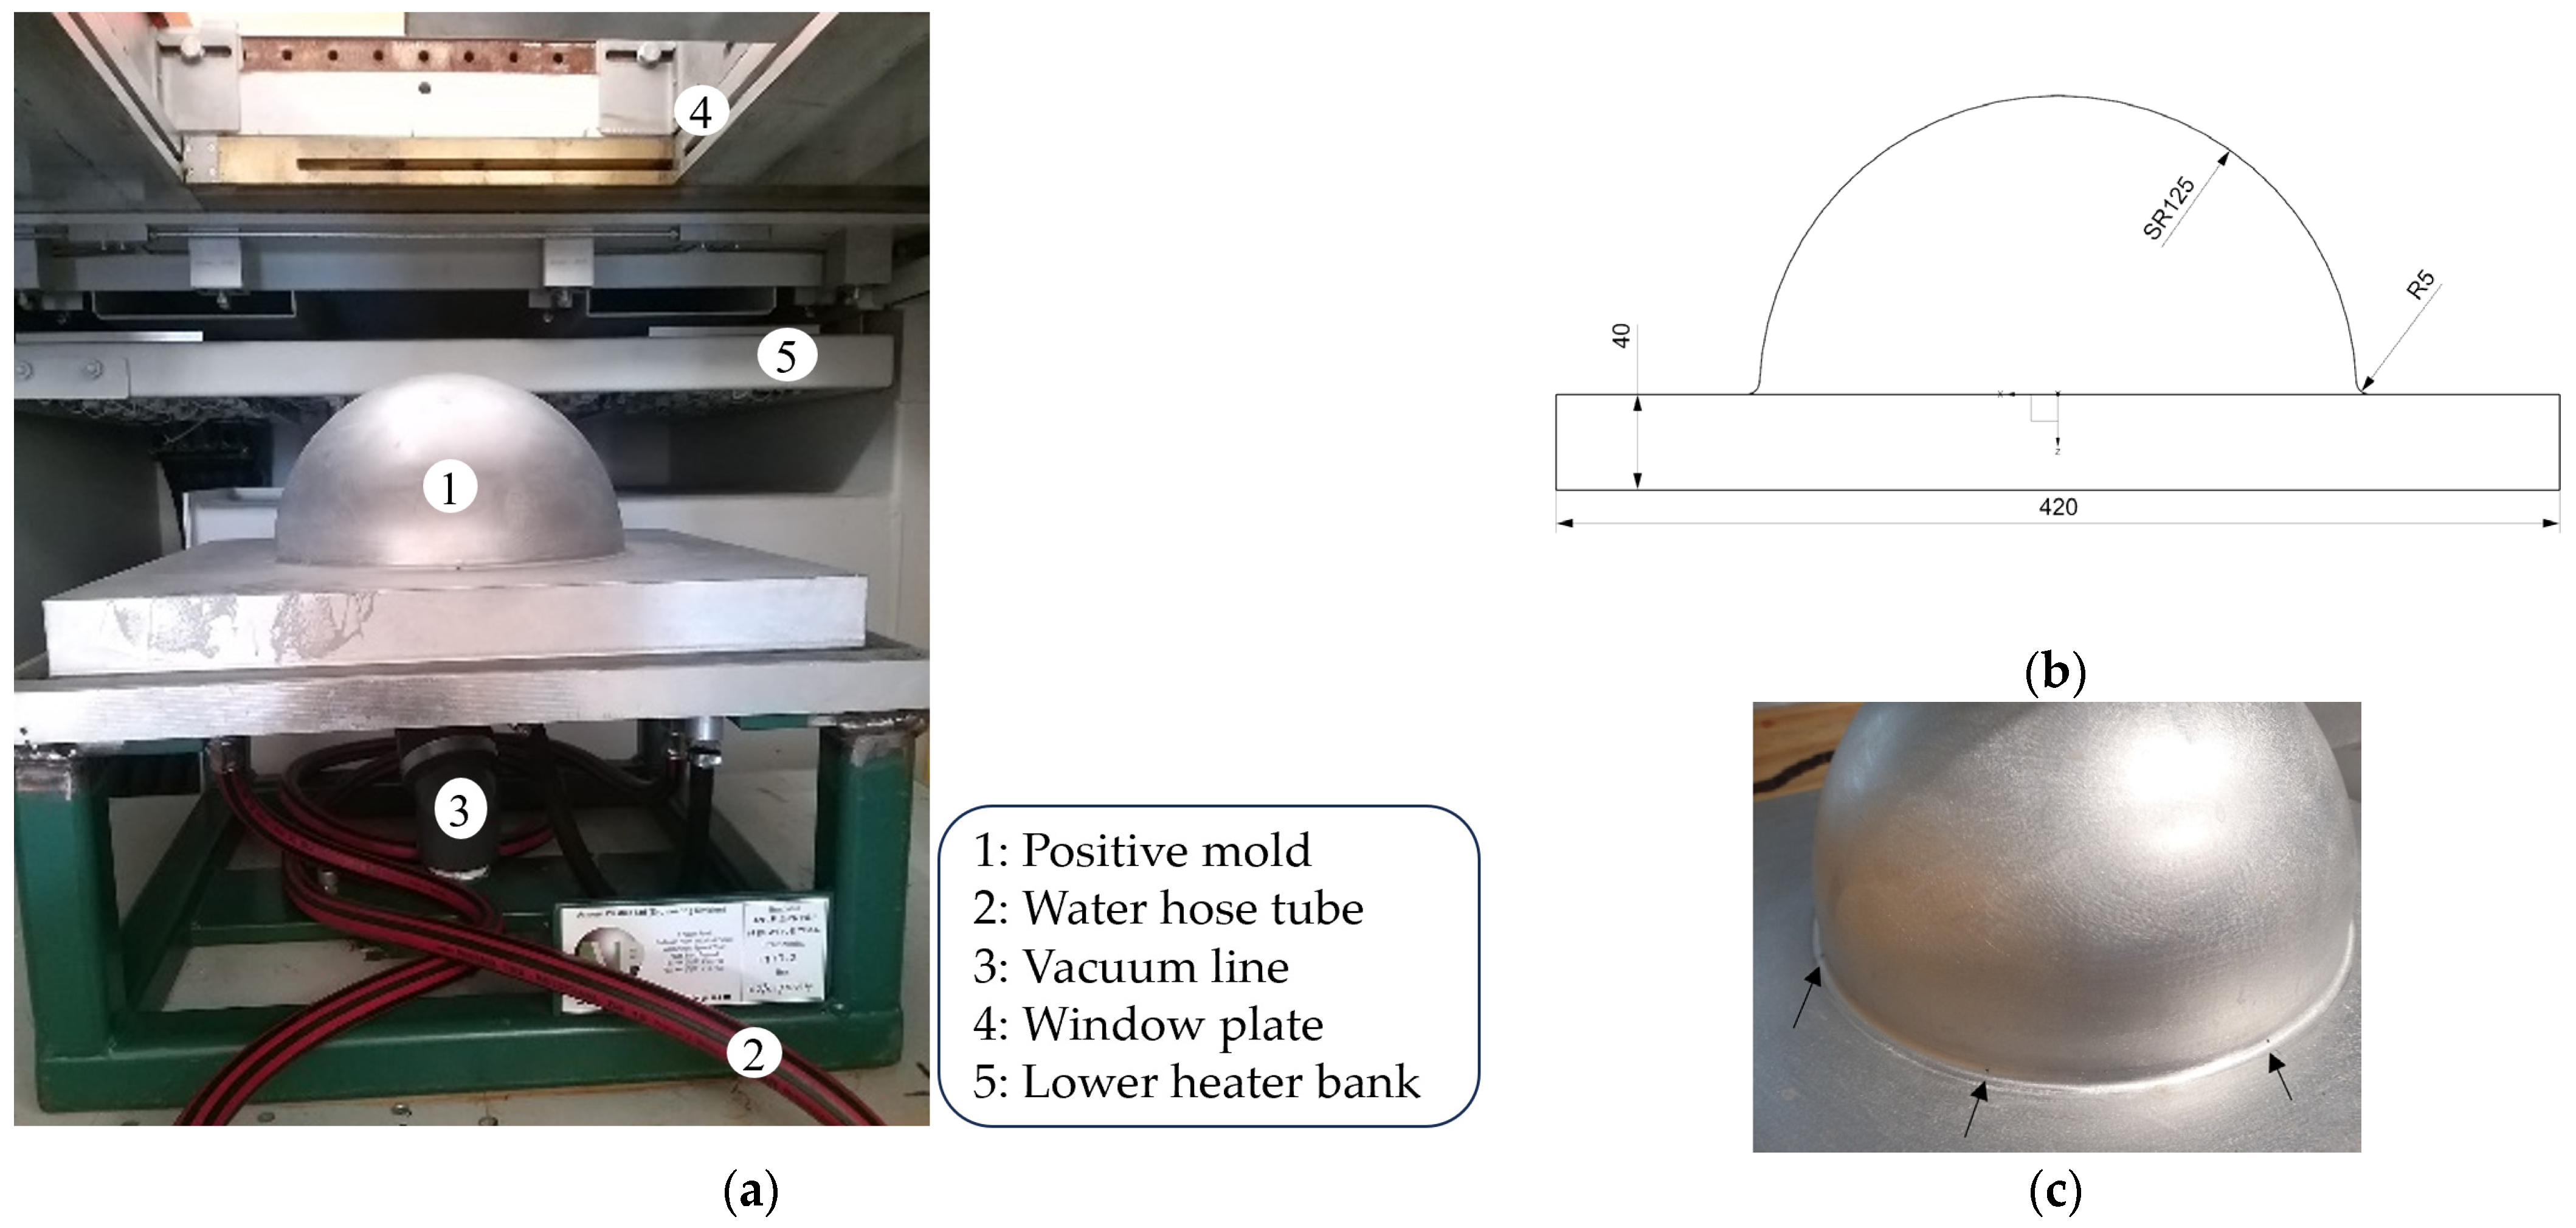
2.2. Thermoforming Equipment

The thermoforming process was conducted using a GEISS vacuum-forming machine (GEISS AG: Sesslach, Germany), model DU 1000 × 600 × 400 U8. This machine is equipped with dual heater banks positioned above and below the window plate, each measuring 100 by 60 cm, as shown in Figure 2a. The maximum total electric power of these heater banks is 61.7 kW. Each heater bank is equipped with 54 “Speedium” halogen elements. These elements come in two different coil lengths: 16 cm for 650 W elements and 6 cm for 300 W elements. The power of each coil is individually adjustable. In this thermoforming machine, the Miniature Infrared (MI) pyrometer sensor (Raytek GmbH: Berlin, Germany)is used to measure the surface temperature spot of the thermoplastic sheet while it is being heated. The sensor has an accuracy of ±1%. Based on the optical properties of the material in use, the sensor’s emissivity was calibrated to 0.8. Additionally, temperature readings are taken at intervals of every 125 milliseconds. For this experiment, the maximum heating power was considered across the heater banks. The clamping frame was set to 430 mm × 430 mm. The upper heater bank is positioned at a distance of 180 mm from the sheet, and the lower heater bank is set at a distance of 153 mm (Figure 2b). The clamping frame’s height, at 103 mm, partially obstructs the radiative heat from effectively reaching the material, especially in the corner areas. A male semi-spherical cast aluminum mould with a radius of 125 mm was installed within the machine’s sealed cabinet (Figure 3a). A detailed drawing of the mould dimensions is provided in Figure 3b. The application of vacuum pressure in our experimental setup is performed via multiple holes symmetrically designed on the corner of the hemispherical mould, as illustrated in Figure 3c. These holes distribute the vacuum pressure across the mould during the forming process. In this experiment, the temperature rise of the mould was monitored using a PT100 RTD temperature sensor (JUMO Automation B.V.B.A: Zaventum, Belgium). The mould was heated with water to a temperature of 80 °C.
The design of the thermoforming machine incorporates a programmed delay between the mould’s final ascent and the activation of vacuum assistance. For this experiment, a delay duration of 1 s was set. As a result, the material experiences several stages, including initial loading via the mould’s upward movement, subsequent reloading via vacuum pressure, and relaxation periods determined by the delay interval. Although this delay can be modified and potentially eliminated, the specific effects of this interval on the material’s residual stress remain unclear and are a subject for future exploration. To track the vacuum pressure, a WIKA pressure transducer, capable of measuring between −100 and 300 kPa with a voltage output signal of 0 to 10 V and an accuracy of ±0.5%, was installed in the vacuum line to accurately gauge the vacuum pressure during this phase.

3. Experimental Setup

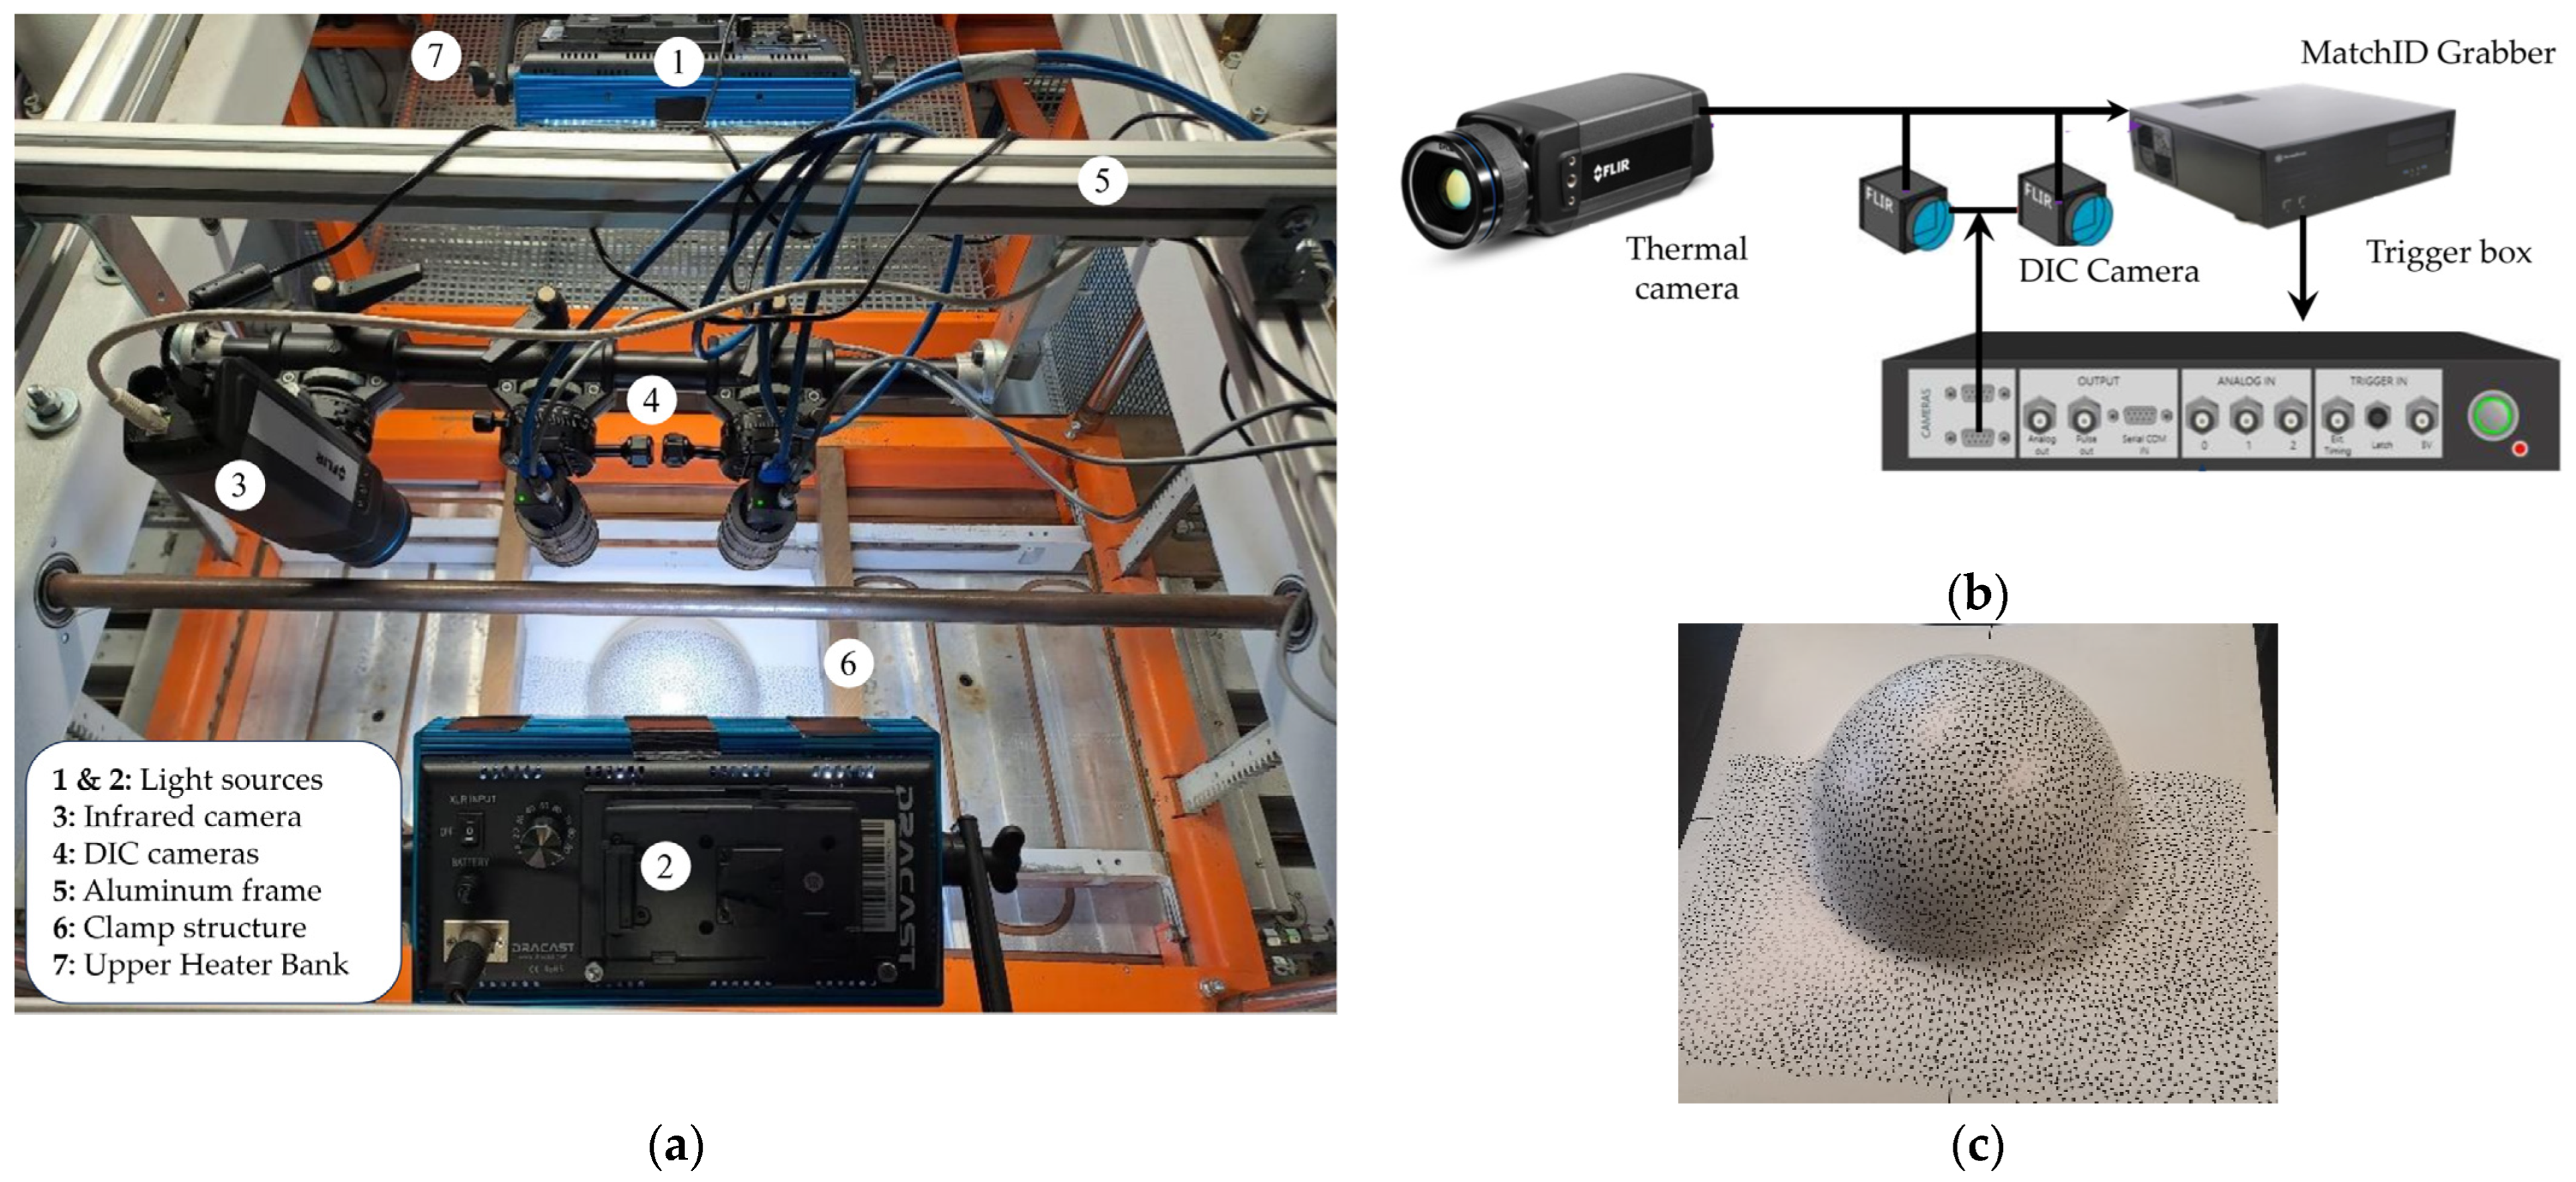
3.1. DIC Setup and Thermal Camera Synchronization

DIC was used as a technique for measuring out-of-plane displacement and the rate of deformation during the material forming process in vacuum forming. Figure 4a shows the mounting arrangement of DIC cameras with respect to thermal cameras as well as light positioning. A random, non-repeatable speckle pattern of consistent size is applied to the material surface using a permanent marker to ensure the distinction between pixels (Figure 4b). The complete surface deformation of the material during the forming process is recorded using two high-resolution Blackfly S BFLY-U3-51S5M cameras (Teledyne FLIR: Britich Columbia, Canada). These cameras have a resolution of 2080 × 2444 pixels and are equipped with 5 MP Fujinon HF-12.5SA lenses (Fujifilm Corporation: Tokyo, Japan). The pixel size of these cameras is 3.45 µm, featuring a sensor size of 8.46 mm. In this work, a FLIR thermal camera (Teledyne FLIR: California, United States) is utilized, with a sensor resolution of 640 × 480 pixels and a pixel size of 0.017 mm. The cameras were mounted on top of the machine at a distance of 83 cm using a separate frame structure to prevent vibrations from the machine during recording, as illustrated in Figure 4a. The cameras were integrated into the MatchID platform using a grabber timing box, as shown in Figure 4b [35,36]. This integration ensured precise synchronization between the DIC and temperature data to effectively track the temporal forming progression throughout the process. Calibration of both the DIC stereo camera and the IR thermal camera requires two distinct steps. For the stereo DIC, a specific calibration plate is utilized [37,38]. In contrast, the calibration of the IR thermal camera involves using a unique target. This target, characterized by its low thermal expansion coefficient, is coated with paints that have varying emissivity levels and is subjected to controlled heating. The calibration parameters for the stereo DIC system installed on the GEISS thermo vacuum-forming machine are outlined in Table 1. These parameters are categorized into intrinsic and extrinsic types across three cameras, including two white light cameras (Camera 0 and Camera 1) and one thermal camera (Camera 2). The intrinsic parameters, which are inherent to each camera, include the focal lengths in the x and y directions ( f x , f y ), the coordinates of the camera detector’s center ( C x , C y ), and the skewing factor of the sensor array ( f s ), along with the first-order lens distortion parameter ( κ 1 ). The extrinsic parameters describe the spatial relationships and orientation between the cameras. The angles (θ, ϕ, and Ψ) indicate the rotational alignment between the white light cameras (Camera 0 and Camera 1) and between Camera 0 and the thermal camera (Camera 2). Additionally, the translational distances ( T x , T y , and T z ) quantify the distances between the x, y, and z directions, respectively [39].
As required for stereo DIC full-field strain measurements, a random speckle pattern of uniform size is applied on half of the sheet surface using a permanent marker with the created average 6.6 pixels in size and exhibits a contrast level of 58.62% as shown in Figure 4c. Only half of the sheet was examined in this study due to the symmetric nature of the mould geometry. The continuous correlation during out-of-plane forming of complex parts is directly linked to the camera orientation relative to the observed surface, which changes throughout the forming process [40]. To address this, the cameras were positioned to specifically monitor deformation at the edge of the semi-spherical mould, a region known to experience maximum stretching during the vacuum process. This positioning is crucial for ensuring continuous correlation, as the material tends to orient in the z-direction when forming into a semi-sphere. It is important to highlight that both cameras must cover the entire area of interest for an effective correlation process. Two light sources equipped with polarization filters are used to provide adequate illumination over the region of interest. Throughout the forming process, stereo DIC continuously captures images of the speckled area of interest at a rate of 15 frames per second using MatchID grabber software (2022.2.0). These images are then correlated in 3D using the MatchID stereo module in tandem with synchronized thermal imaging captured via a timing trigger box. The Zero Normalized Sum of Square Difference (ZNSSD) correlation criterion with a subset size of 35 and step size of 3 pixels between two subsets was used [41].
In the pair image recording procedures, the subset defines a unique fingerprint, which enables the DIC algorithm to detect the position of each subset in the 3D space during material deformation [25,42]. The strain field is obtained on the speckled pattern surface of the specimen by continuous correlation of the size and the shape of the deformed subset. In the initial phase of the stereo DIC analysis, the reference state is established using the image pair that captures the onset of contact between the mould and the heated sheet. This approach helps to mitigate the impact of speckle discoloration due to heating, thereby enhancing the correlation in stereo DIC analysis. Due to the presence of large deformations each step of correlation is linked to its previous updated state. The strain field was computed using a strain window sized of 15 DIC data points. The correlation settings adopted in MatchID stereo software (2022.2.0) can be found in Table 2.

3.2. Wall Thickness Calculation via DIC and Validation Technique

To quantitatively assess the impact of non-uniform deformation on thickness reduction in different areas, such as the pole and edge of the mould, during the forming process, thickness calculations are performed using the principle of volume conservation [28]. This approach is crucial for determining the stretch ratio in the thickness direction. The stretch ratio for thickness, denoted as λ 3 , is derived as the reciprocal of the product of the in-plane stretch ratios in the two principal directions, λ 1 and λ 2 . The in-plane stretch ratios are determined by utilizing the engineering strains, represented as ε 1 and ε 2 , along their respective principal directions. These strains are extracted using the MatchID stereo software. The formulas defining these relationships are as follows:
λ 3 = 1 λ 1 λ 2
λ 1 = 1 + ε 1
λ 2 = 1 + ε 2
By integrating these equations, the formula for assessing thickness reduction is given by
t f = t i ( 1 + ε 1 ) ( 1 + ε 2 )
In this formula, t f represents the final thickness of the sheet, calculated by taking into account the initial thickness t i and the engineering strains in the two principal directions.
To verify the accuracy of thickness measurements obtained using the DIC technique, non-destructive testing was conducted on the thermoformed semi-spherical part. This was achieved using an Olympus 38DL PLUS ultrasonic thickness gauge (Olympus Corporation: Tokyo, Japan) equipped with an M202 transducer compatible with thermoplastic material to precisely measure the wall thickness. The M202 transducer operates by sending high-frequency sound waves into the material. When these waves encounter a boundary or interface within the material, they are reflected back to the transducer. The time taken for the sound waves to travel to the boundary and back is measured. Since the speed of sound in the material is known or can be calibrated, this time, measurement is used to calculate the thickness of the material. For ABS material, the sound velocity was determined to be 2.32 mm/µs. In this measurement, the M202 transducer was operated at a frequency of 10 MHz. The Olympus 38DL PLUS was calibrated using a digital caliper on the same sheet prior to the material’s forming process. This step established a standard reference, ensuring the accuracy of subsequent measurements. Additionally, the thickness of the pre-formed ABS sheet, which was nominally 3 mm thick and produced via extrusion, was measured to provide a precise baseline for comparison. Given the nature of the extrusion process, the sheet displayed minor variations in thickness across its surface. To evaluate this variability, measurements were taken at five points: the center and four others, each positioned 10 cm from the center. The results indicated that the maximum deviation in thickness from the center point was reported as 2.91 mm with a tolerance of ±0.05 mm.

4. Results and Discussion

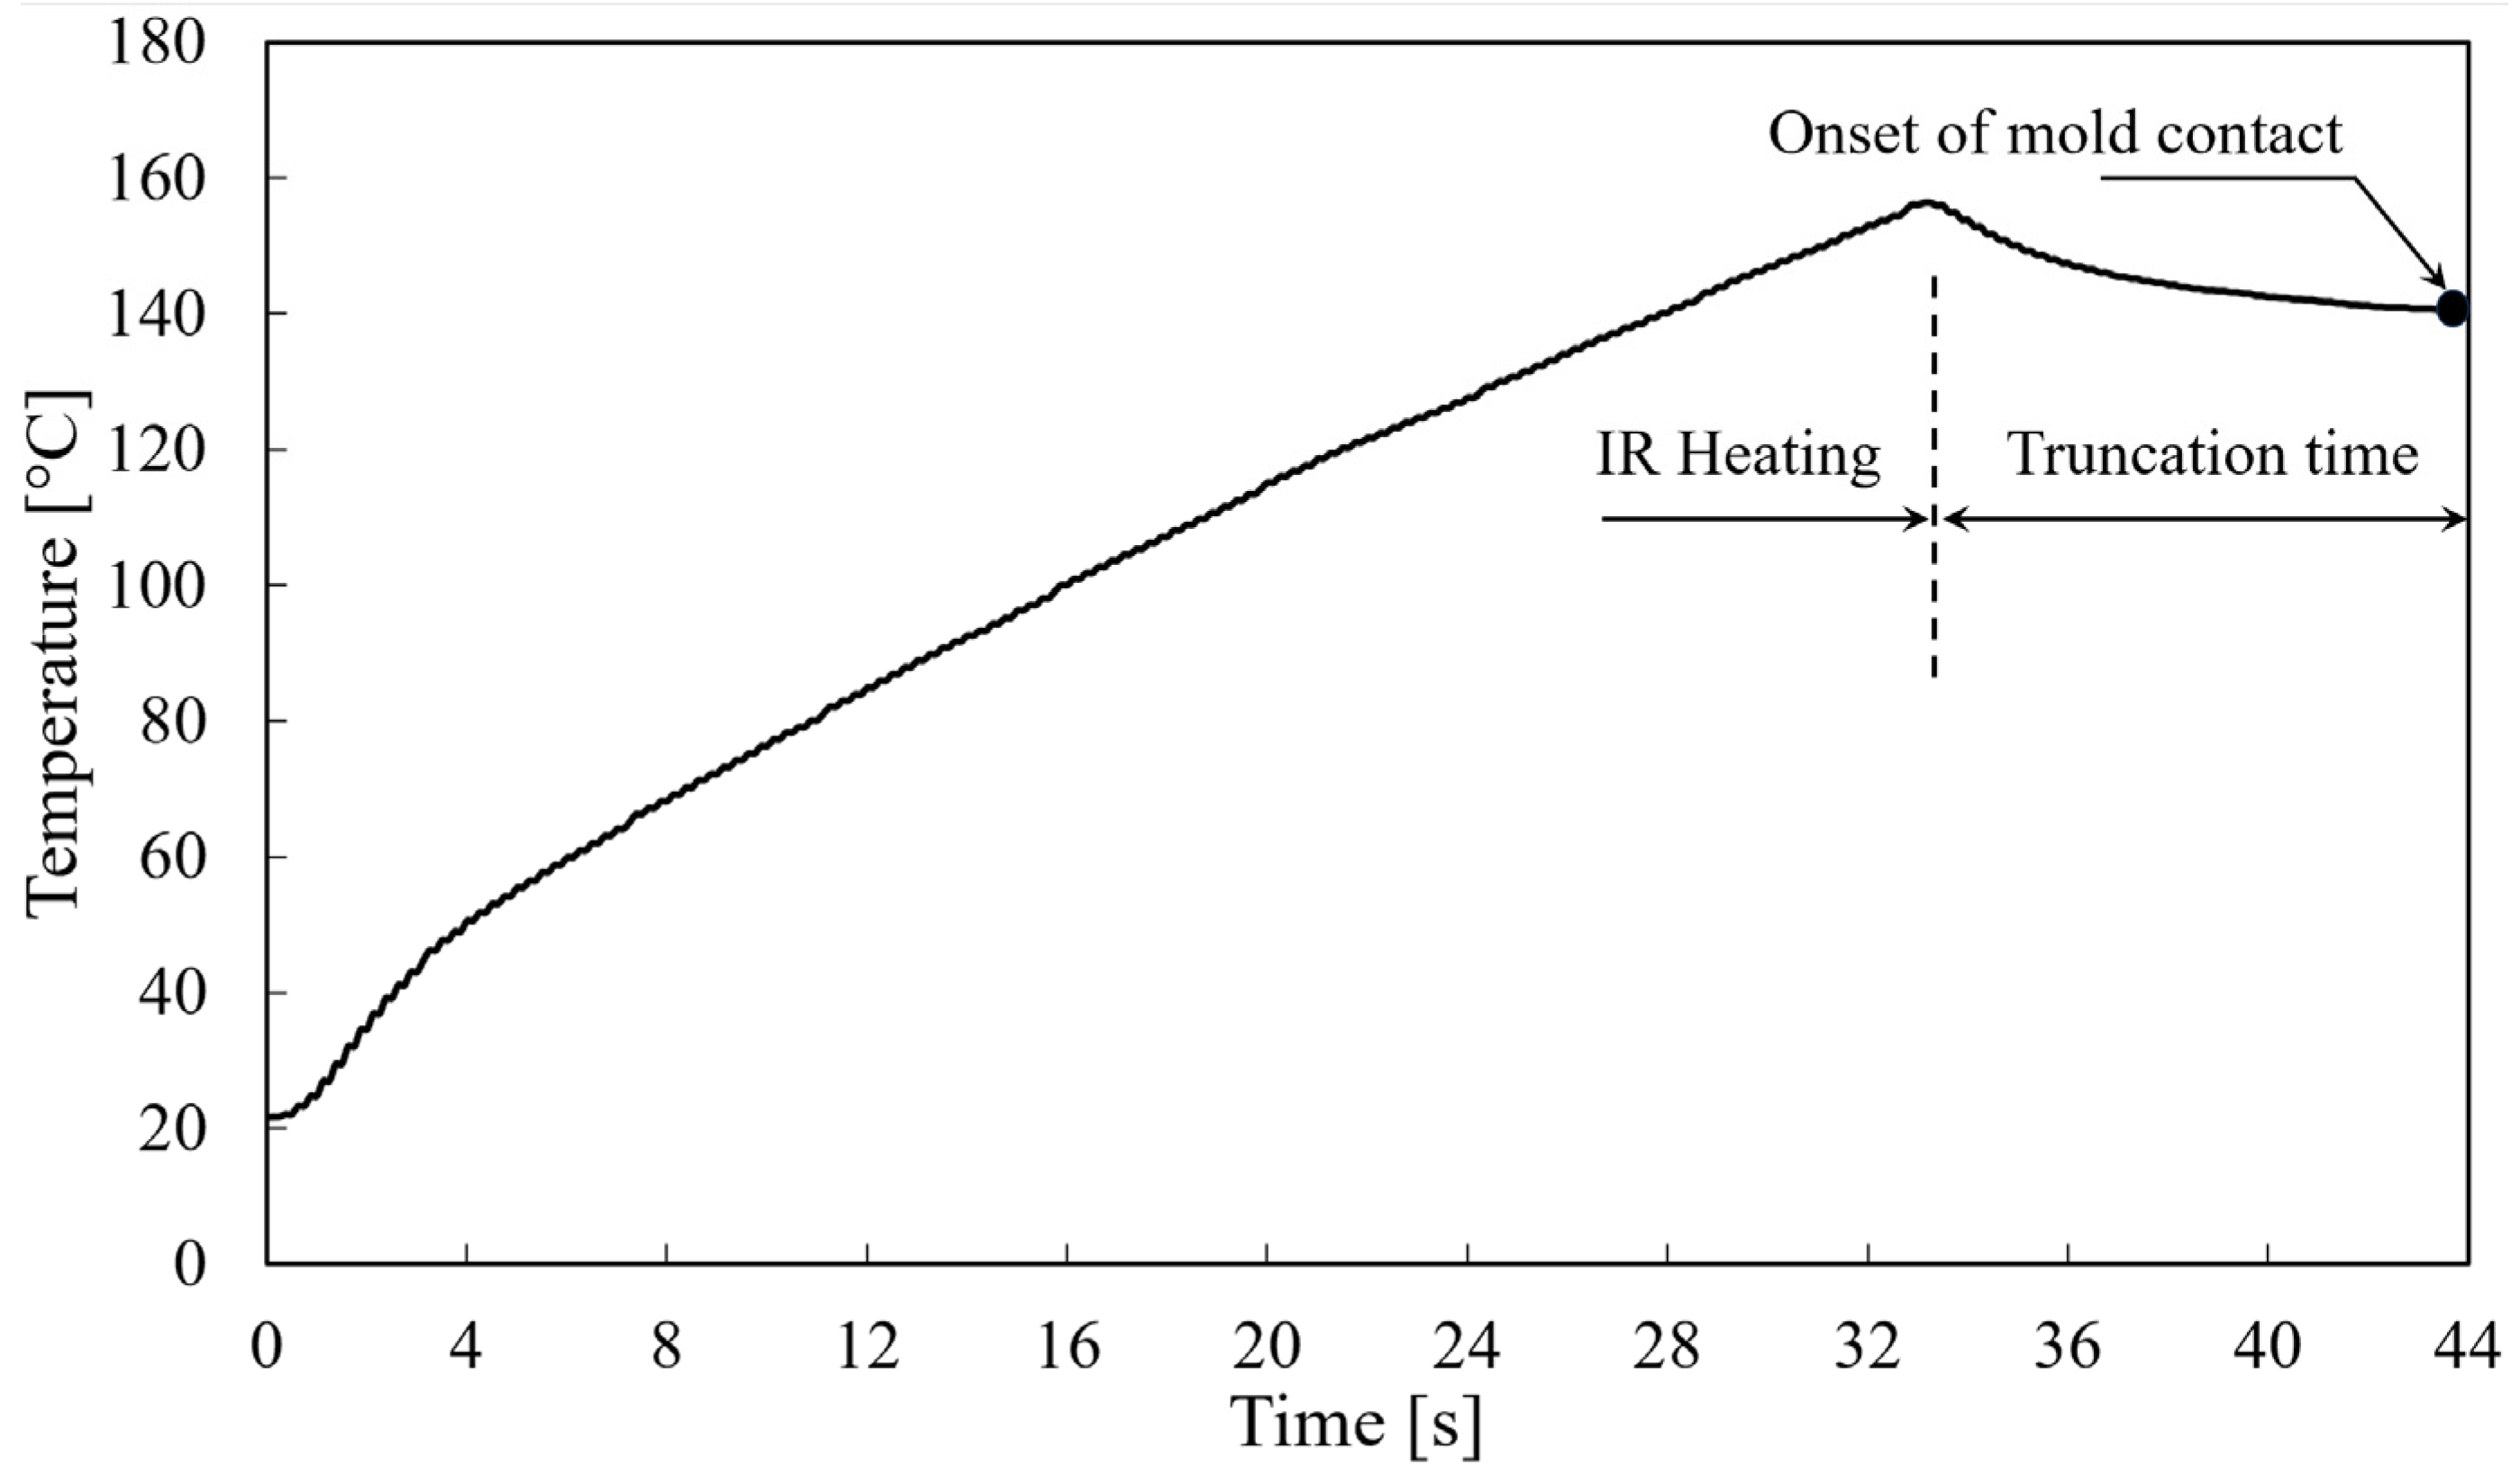
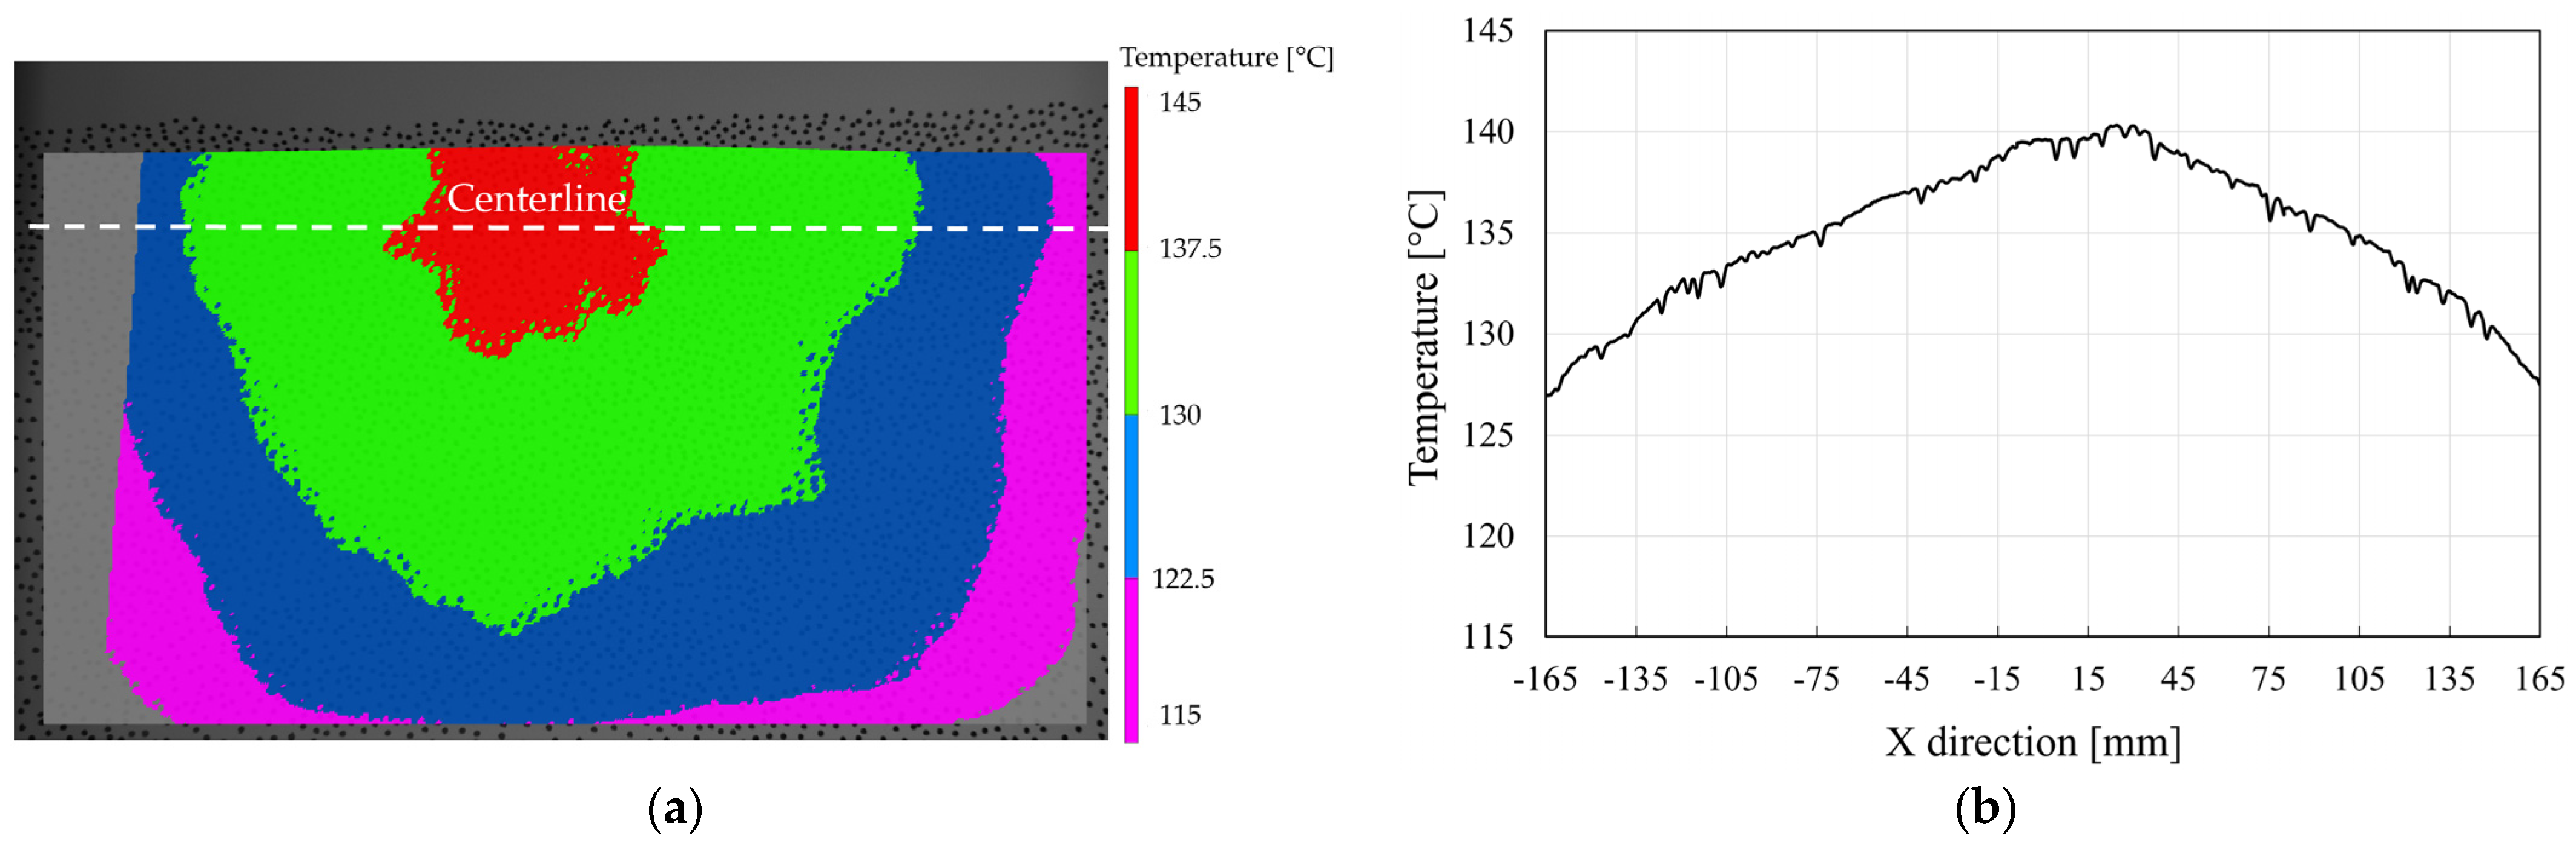
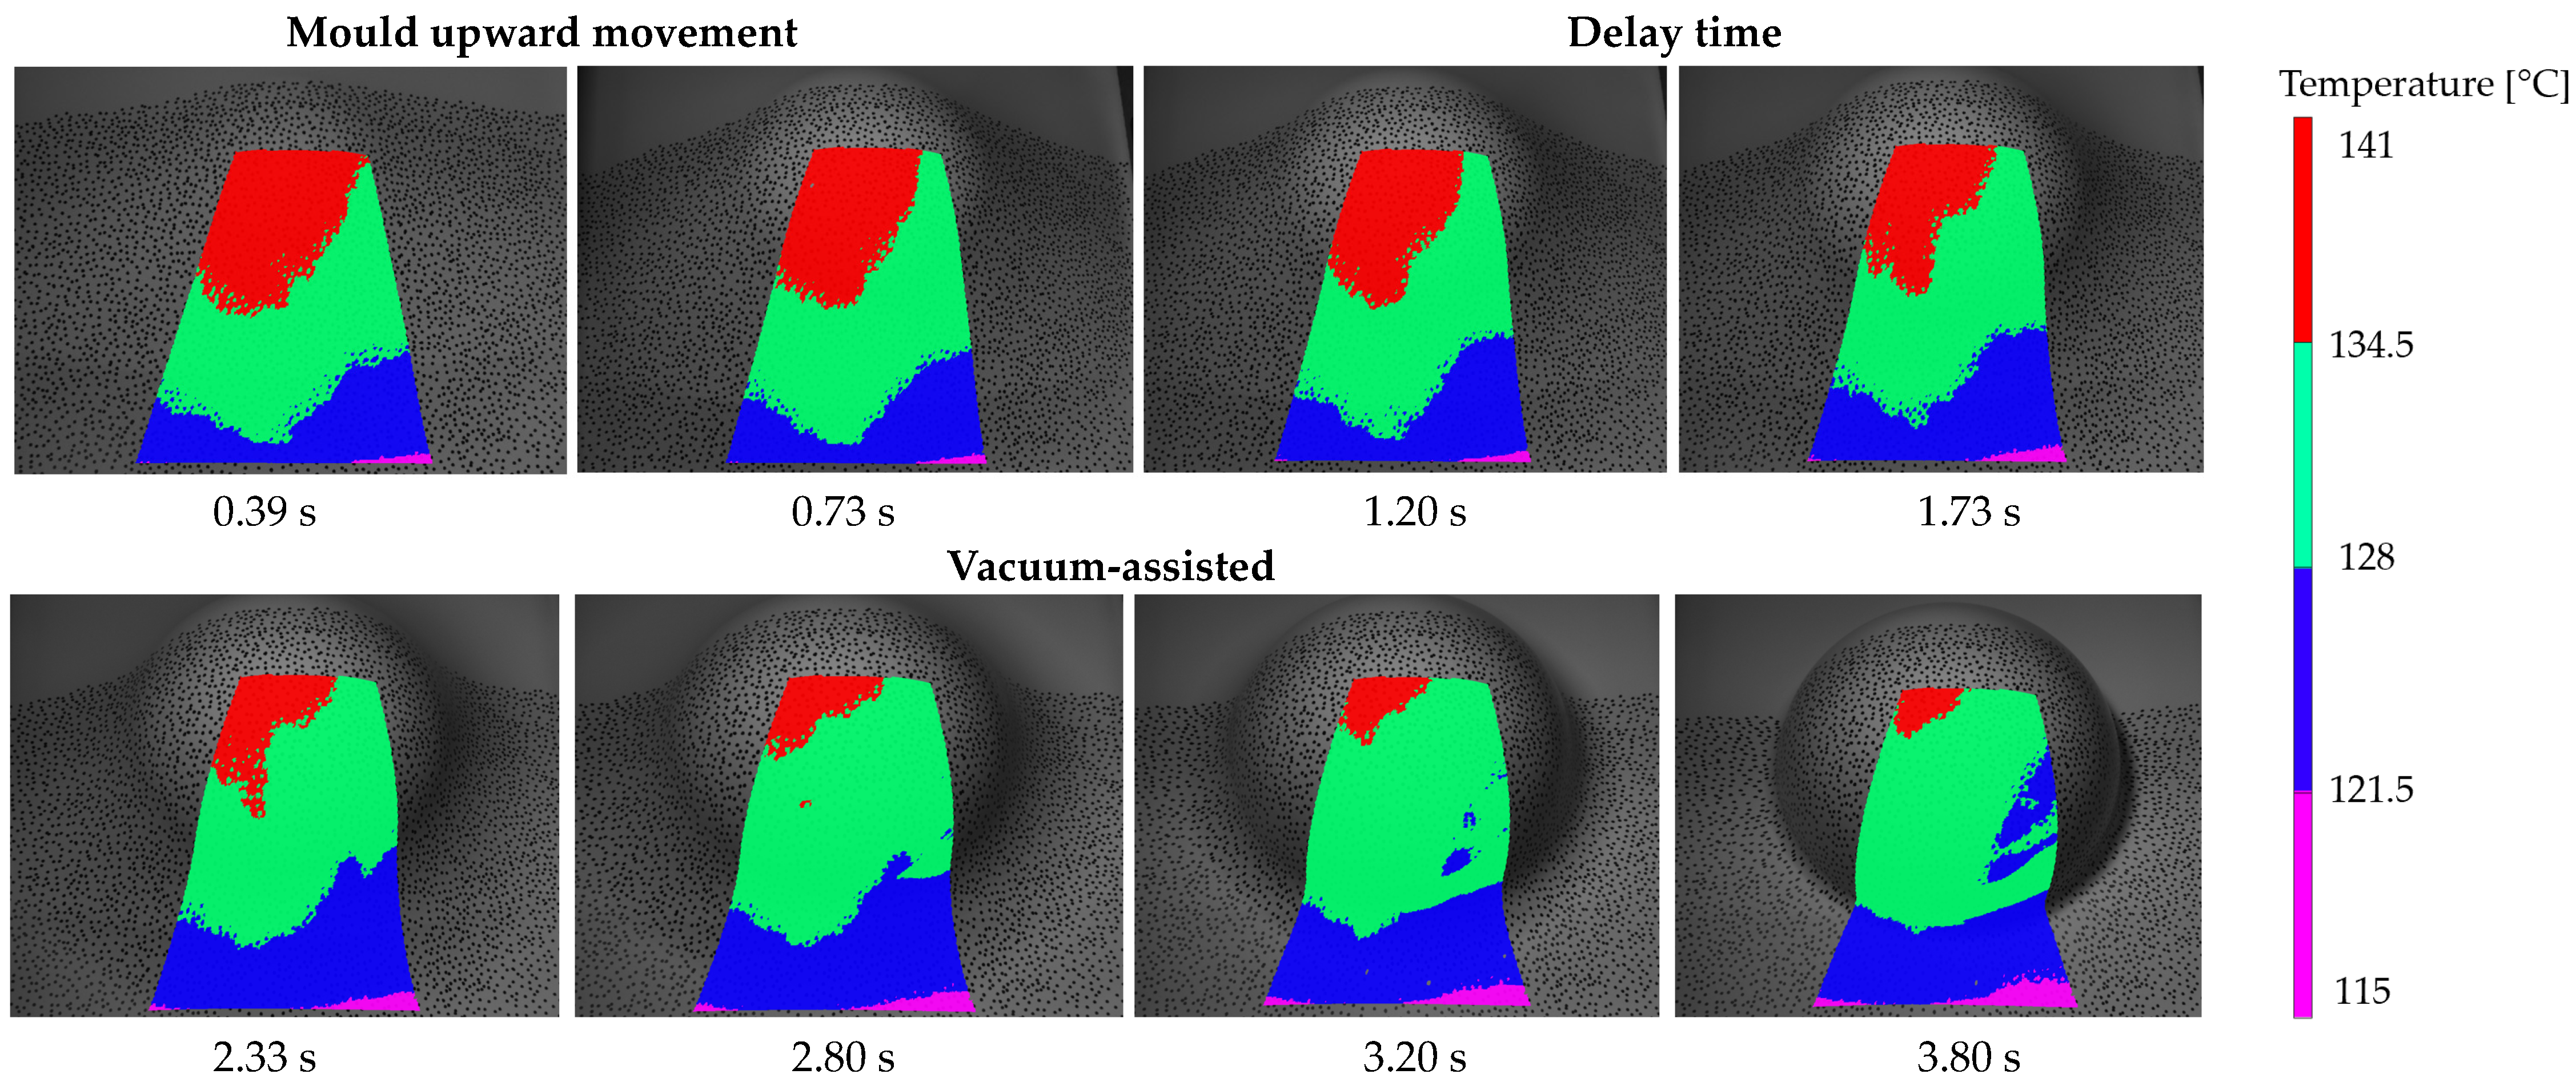
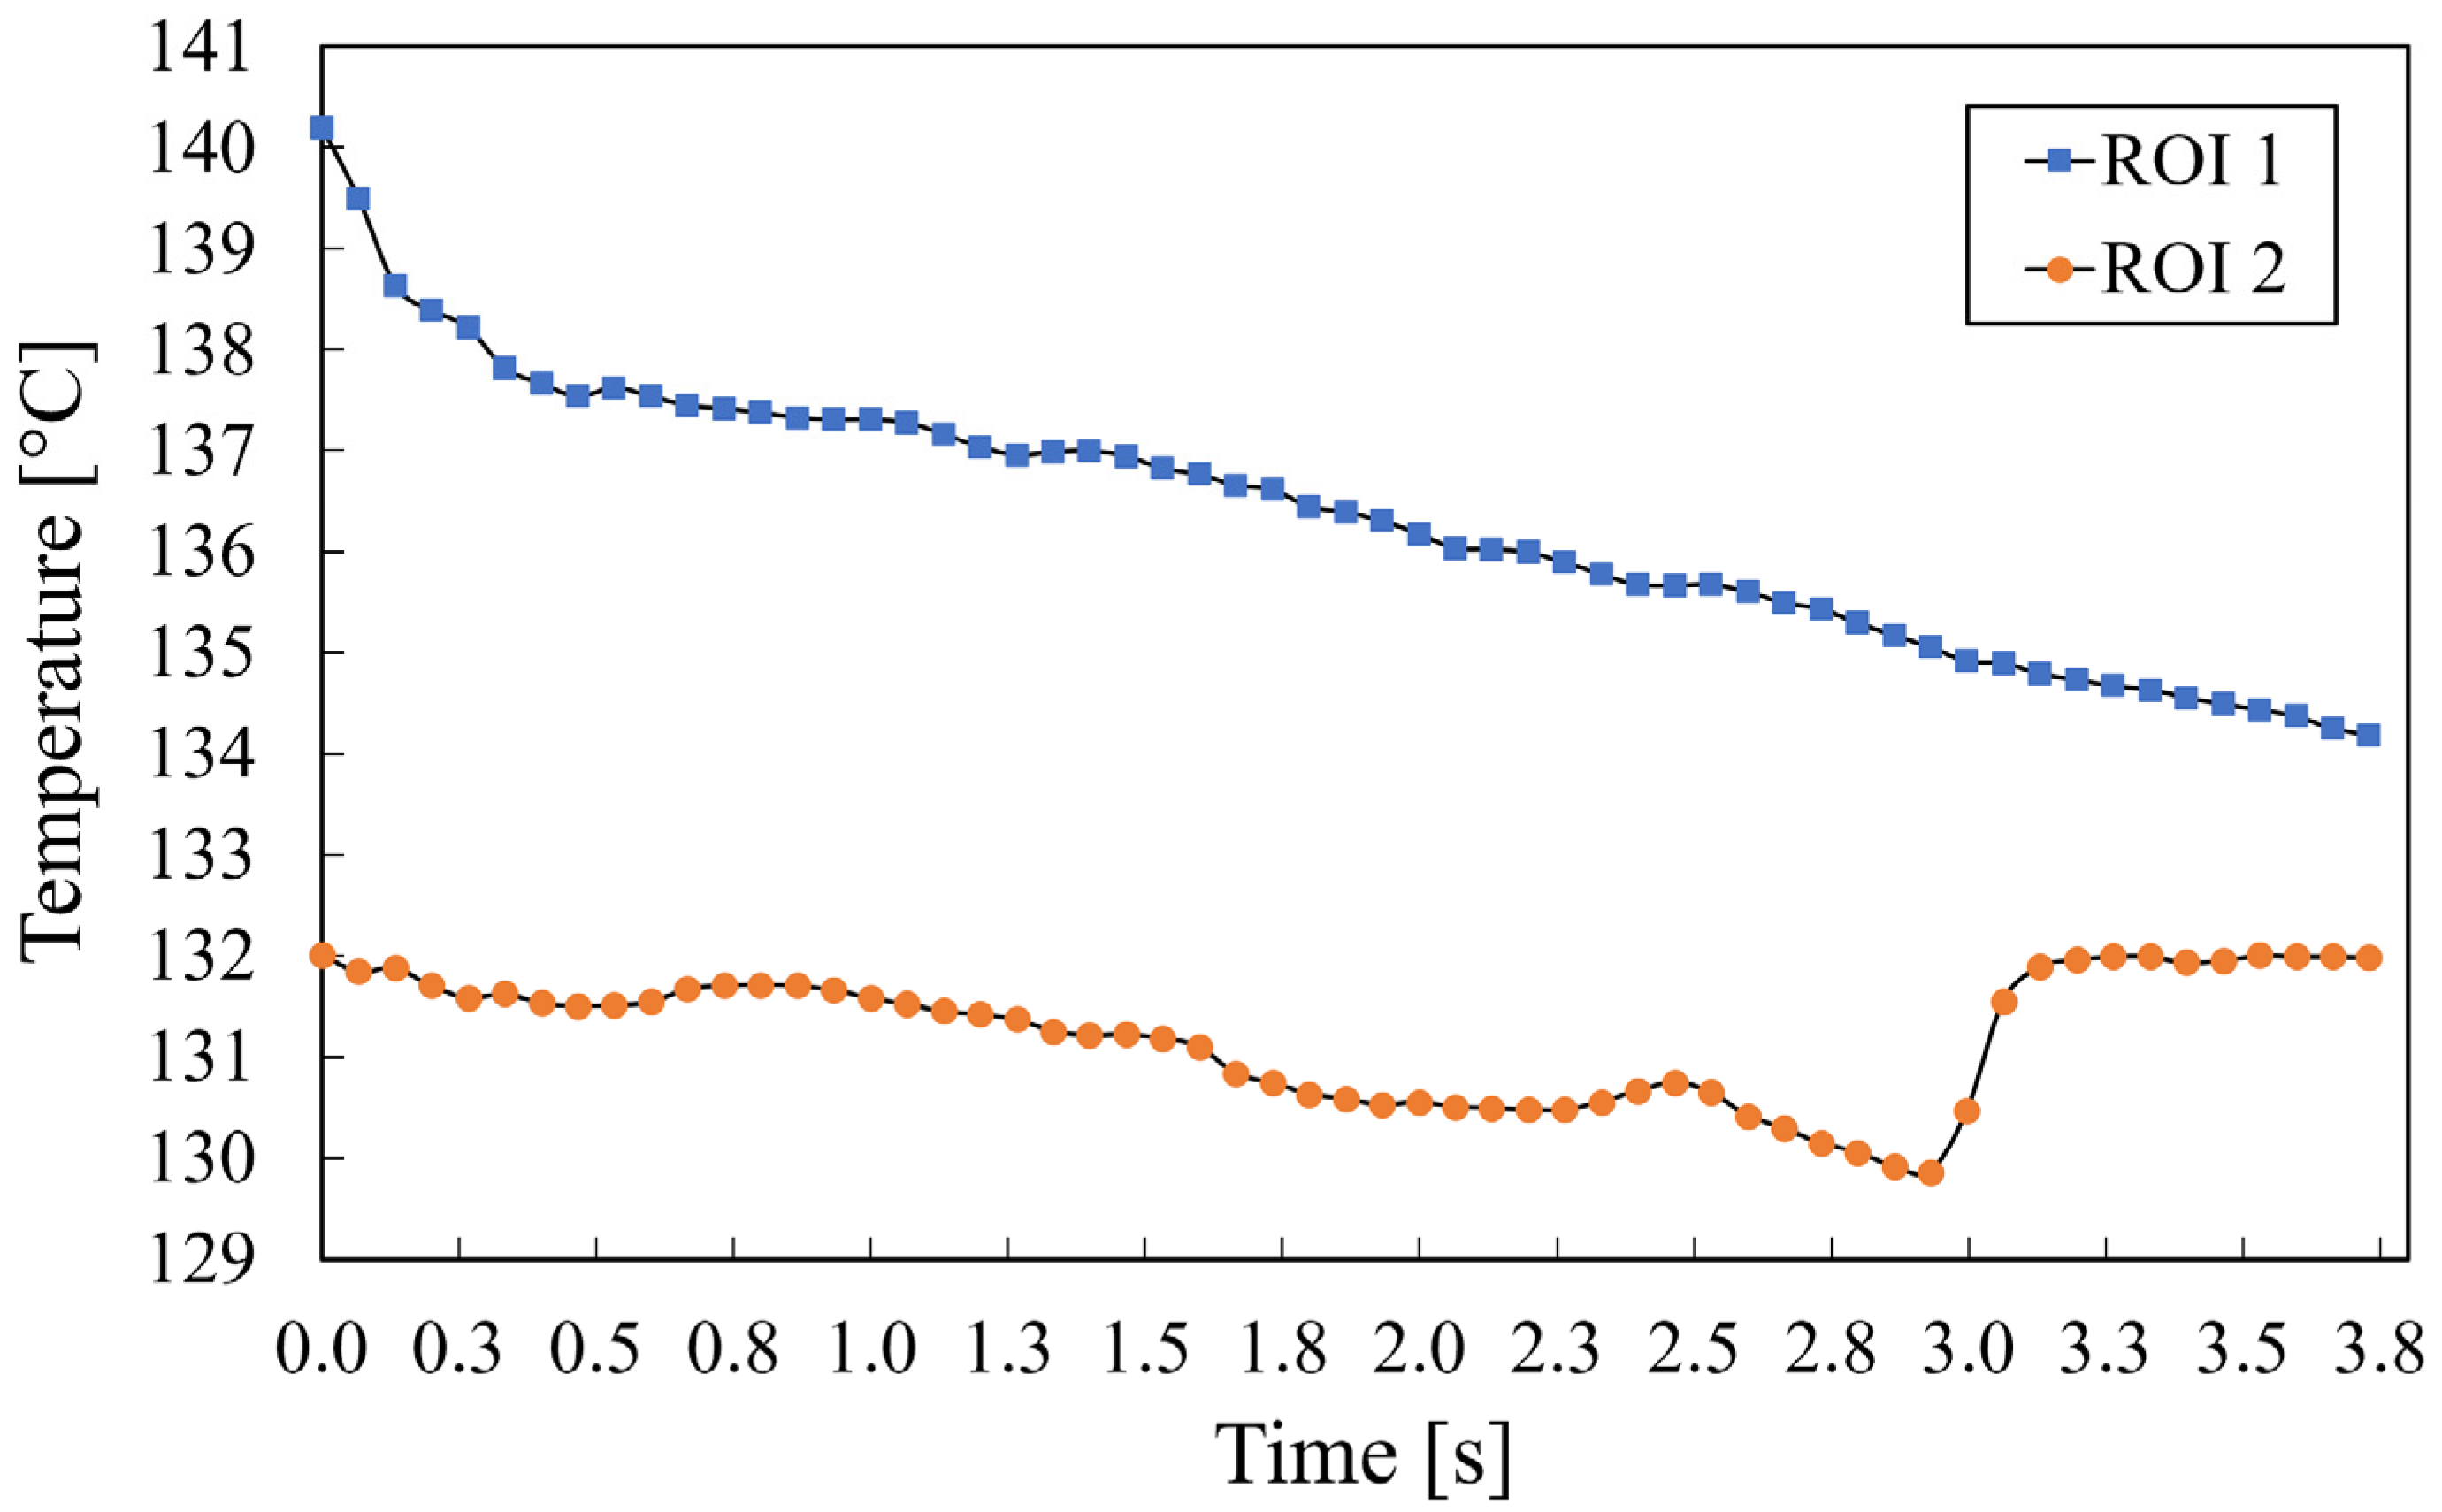
4.1. Temperature Non-Uniformity

Figure 5 displays the temperature profile of the sheet via its heating and cooling stages, particularly focusing on the cooling interval before the heated sheet contacts the mould. These data were recorded using the pyrometer sensor located at the center of the top heater bank, as shown in Figure 2a. To implement this experiment, the upper heater banks were kept in place but turned off following the heating phase to track the thermoplastic sheet’s temperature reduction. Temperature readings were initiated at the beginning of the heating process and were continuously recorded throughout. The data revealed that the target setpoint temperature of 155 °C was reached after 33 s of heating. However, a notable temperature drop was observed once the heater bank was deactivated, with the temperature decreasing to 140.3 °C within 11 s. This time lag corresponds with the typical duration required for the heater bank to retract and the moment when the mould begins its upward movement, making contact with the sheet. It is noted that increasing the mould table speed can effectively minimize the time delay, thus preventing further unwanted drops in temperature. However, this method may risk compromising the material’s structural integrity or lead to irregular deformation. Figure 6a shows the temperature distribution across half of the sheet surface at the moment of initial contact. Despite the uniform emitted radiative heat flux from the heater banks, a notable in-plane temperature gradient was observed across the sheet. The temperature distribution, characterized by concentric isothermal lines extending from the center to the edges, revealed that the highest temperature was achieved near the center region. As shown in Figure 6b, the temperature exhibited a steady decline from 140.2 °C at the center to 131.5 °C toward the edges, indicating a variation of 8.7 degrees. This variation can be primarily attributed to the sizes of the clamping frames, which tend to partially obstruct the transmission of radiative heat to the sheet, particularly in the corner areas.
Conversely, the localized variations in surface flatness, appearing as warpage and sagging from thermal strain, significantly diminished the effectiveness of radiative heating. This reduction in efficiency was mainly due to changes in the view factor, leading to an asymmetrical temperature distribution across the sheet. Additionally, the sagging alters how each part of the sheet interacts with the heater bank, further disrupting the heat flux distribution. This uneven heating can affect both the top and bottom surfaces of the sheet and result in temperature gradients that complicate the shaping process [7]. The ultimate thickness distribution of the formed part is significantly influenced by the initial temperature distribution within the sheet [43,44]. Therefore, the intermediate period between the heating stage and the forming process is a critical factor. Increasing the temperature setpoint can lead to more pronounced sag deformation in the sheet. To mitigate this, an effective method is to shorten this time interval, thereby minimizing heat loss via convective heat transfer. This approach entails a quicker movement of the mould, reducing the duration between heating and forming and thus preserving the desired temperature distribution more effectively.

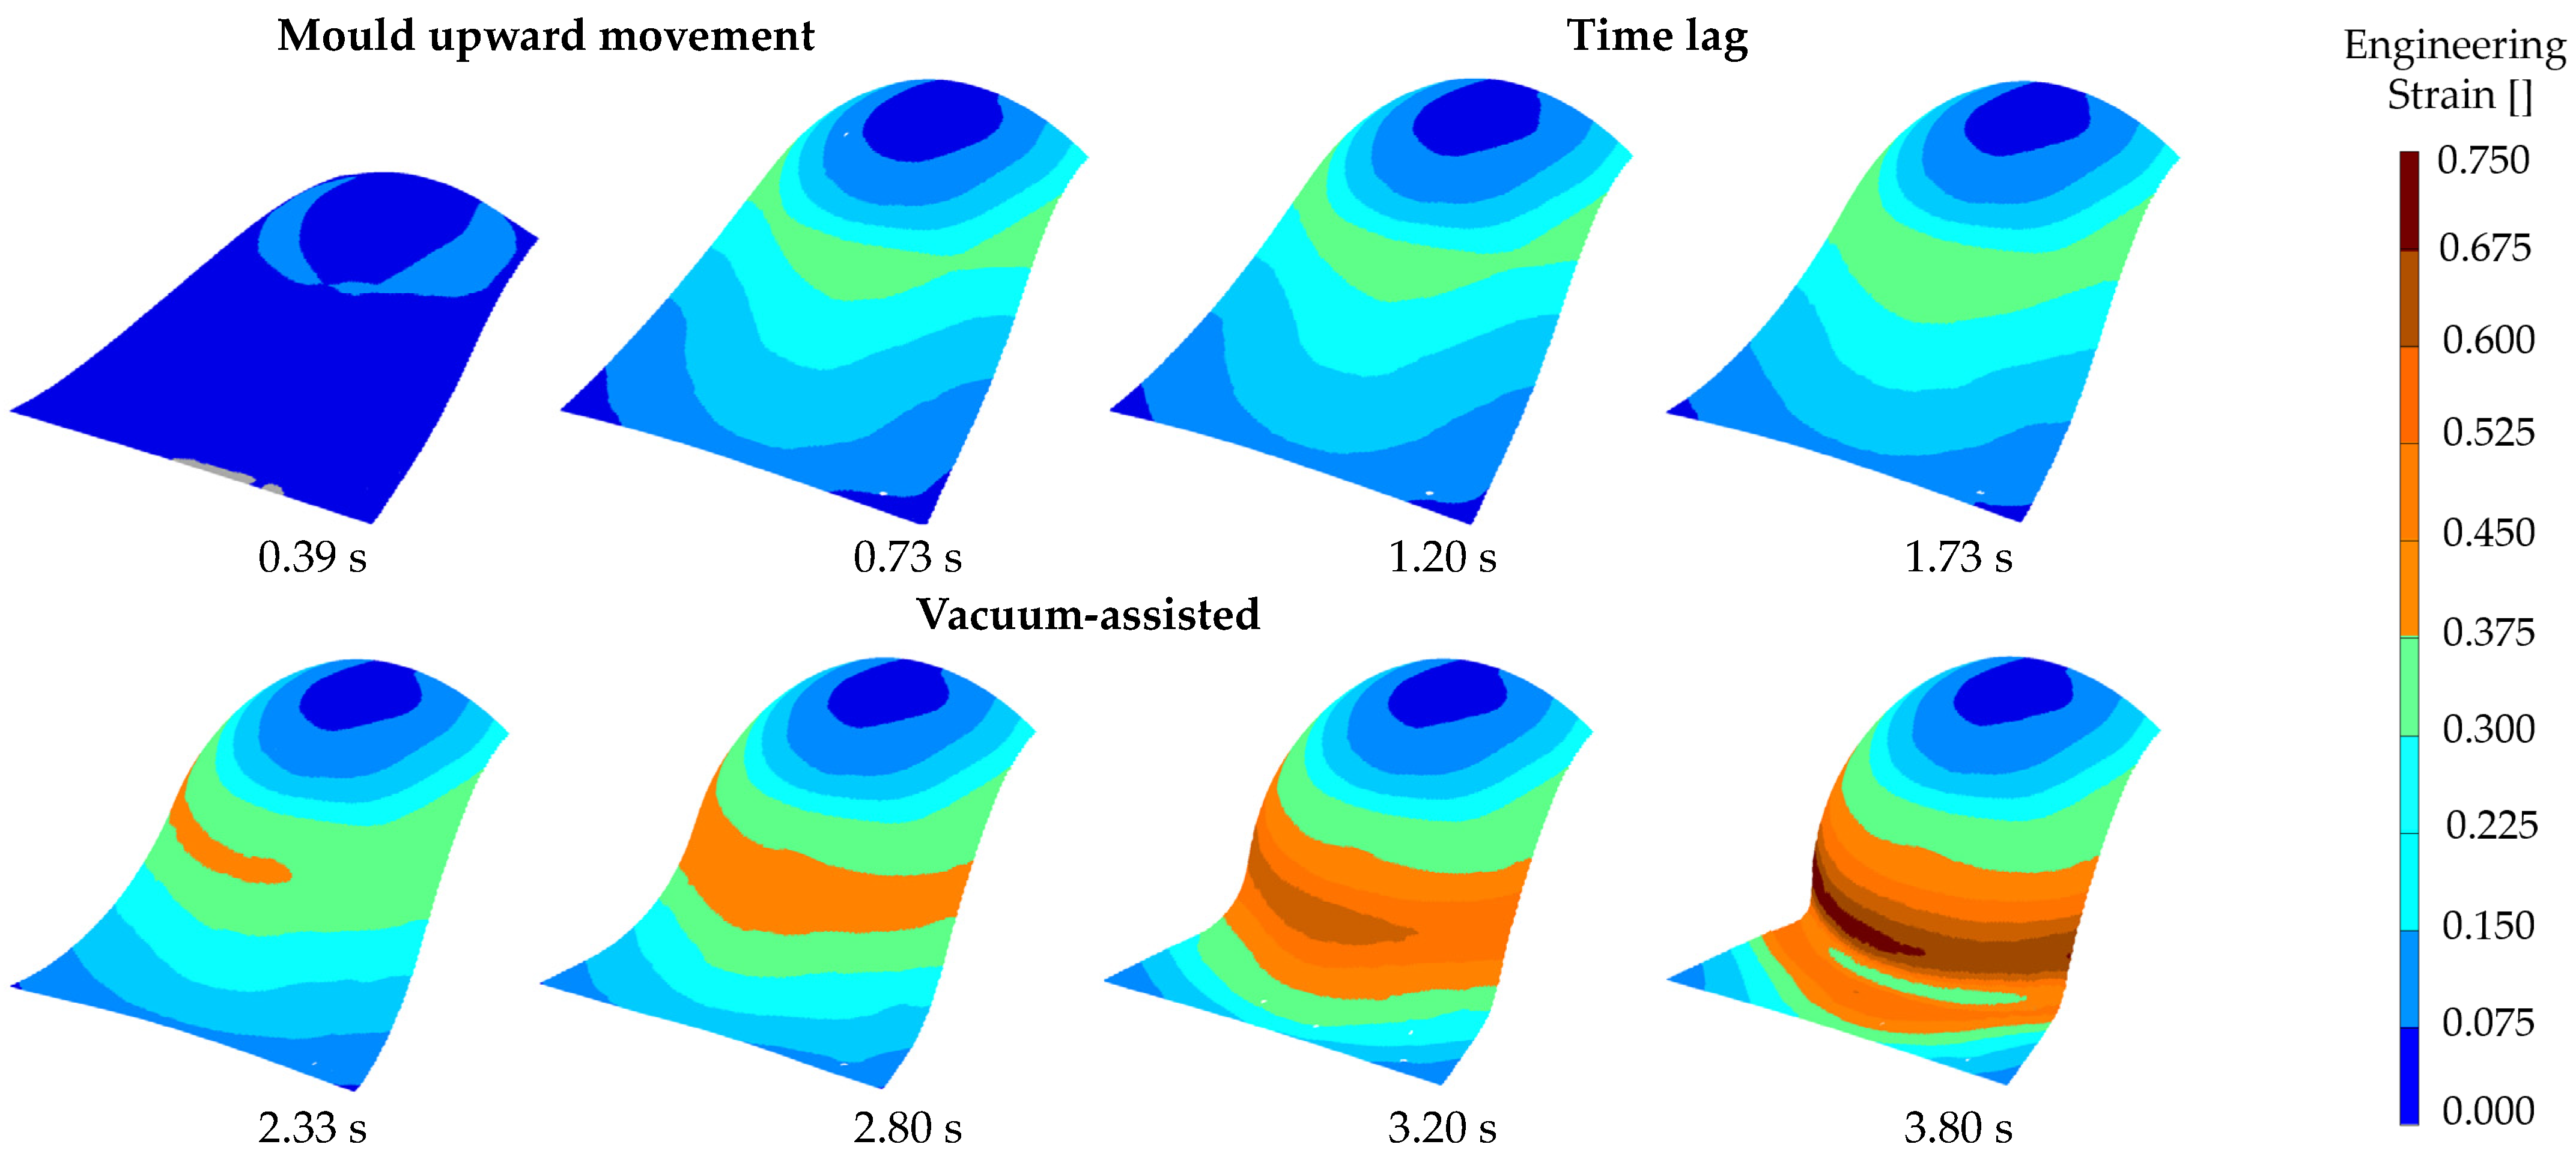
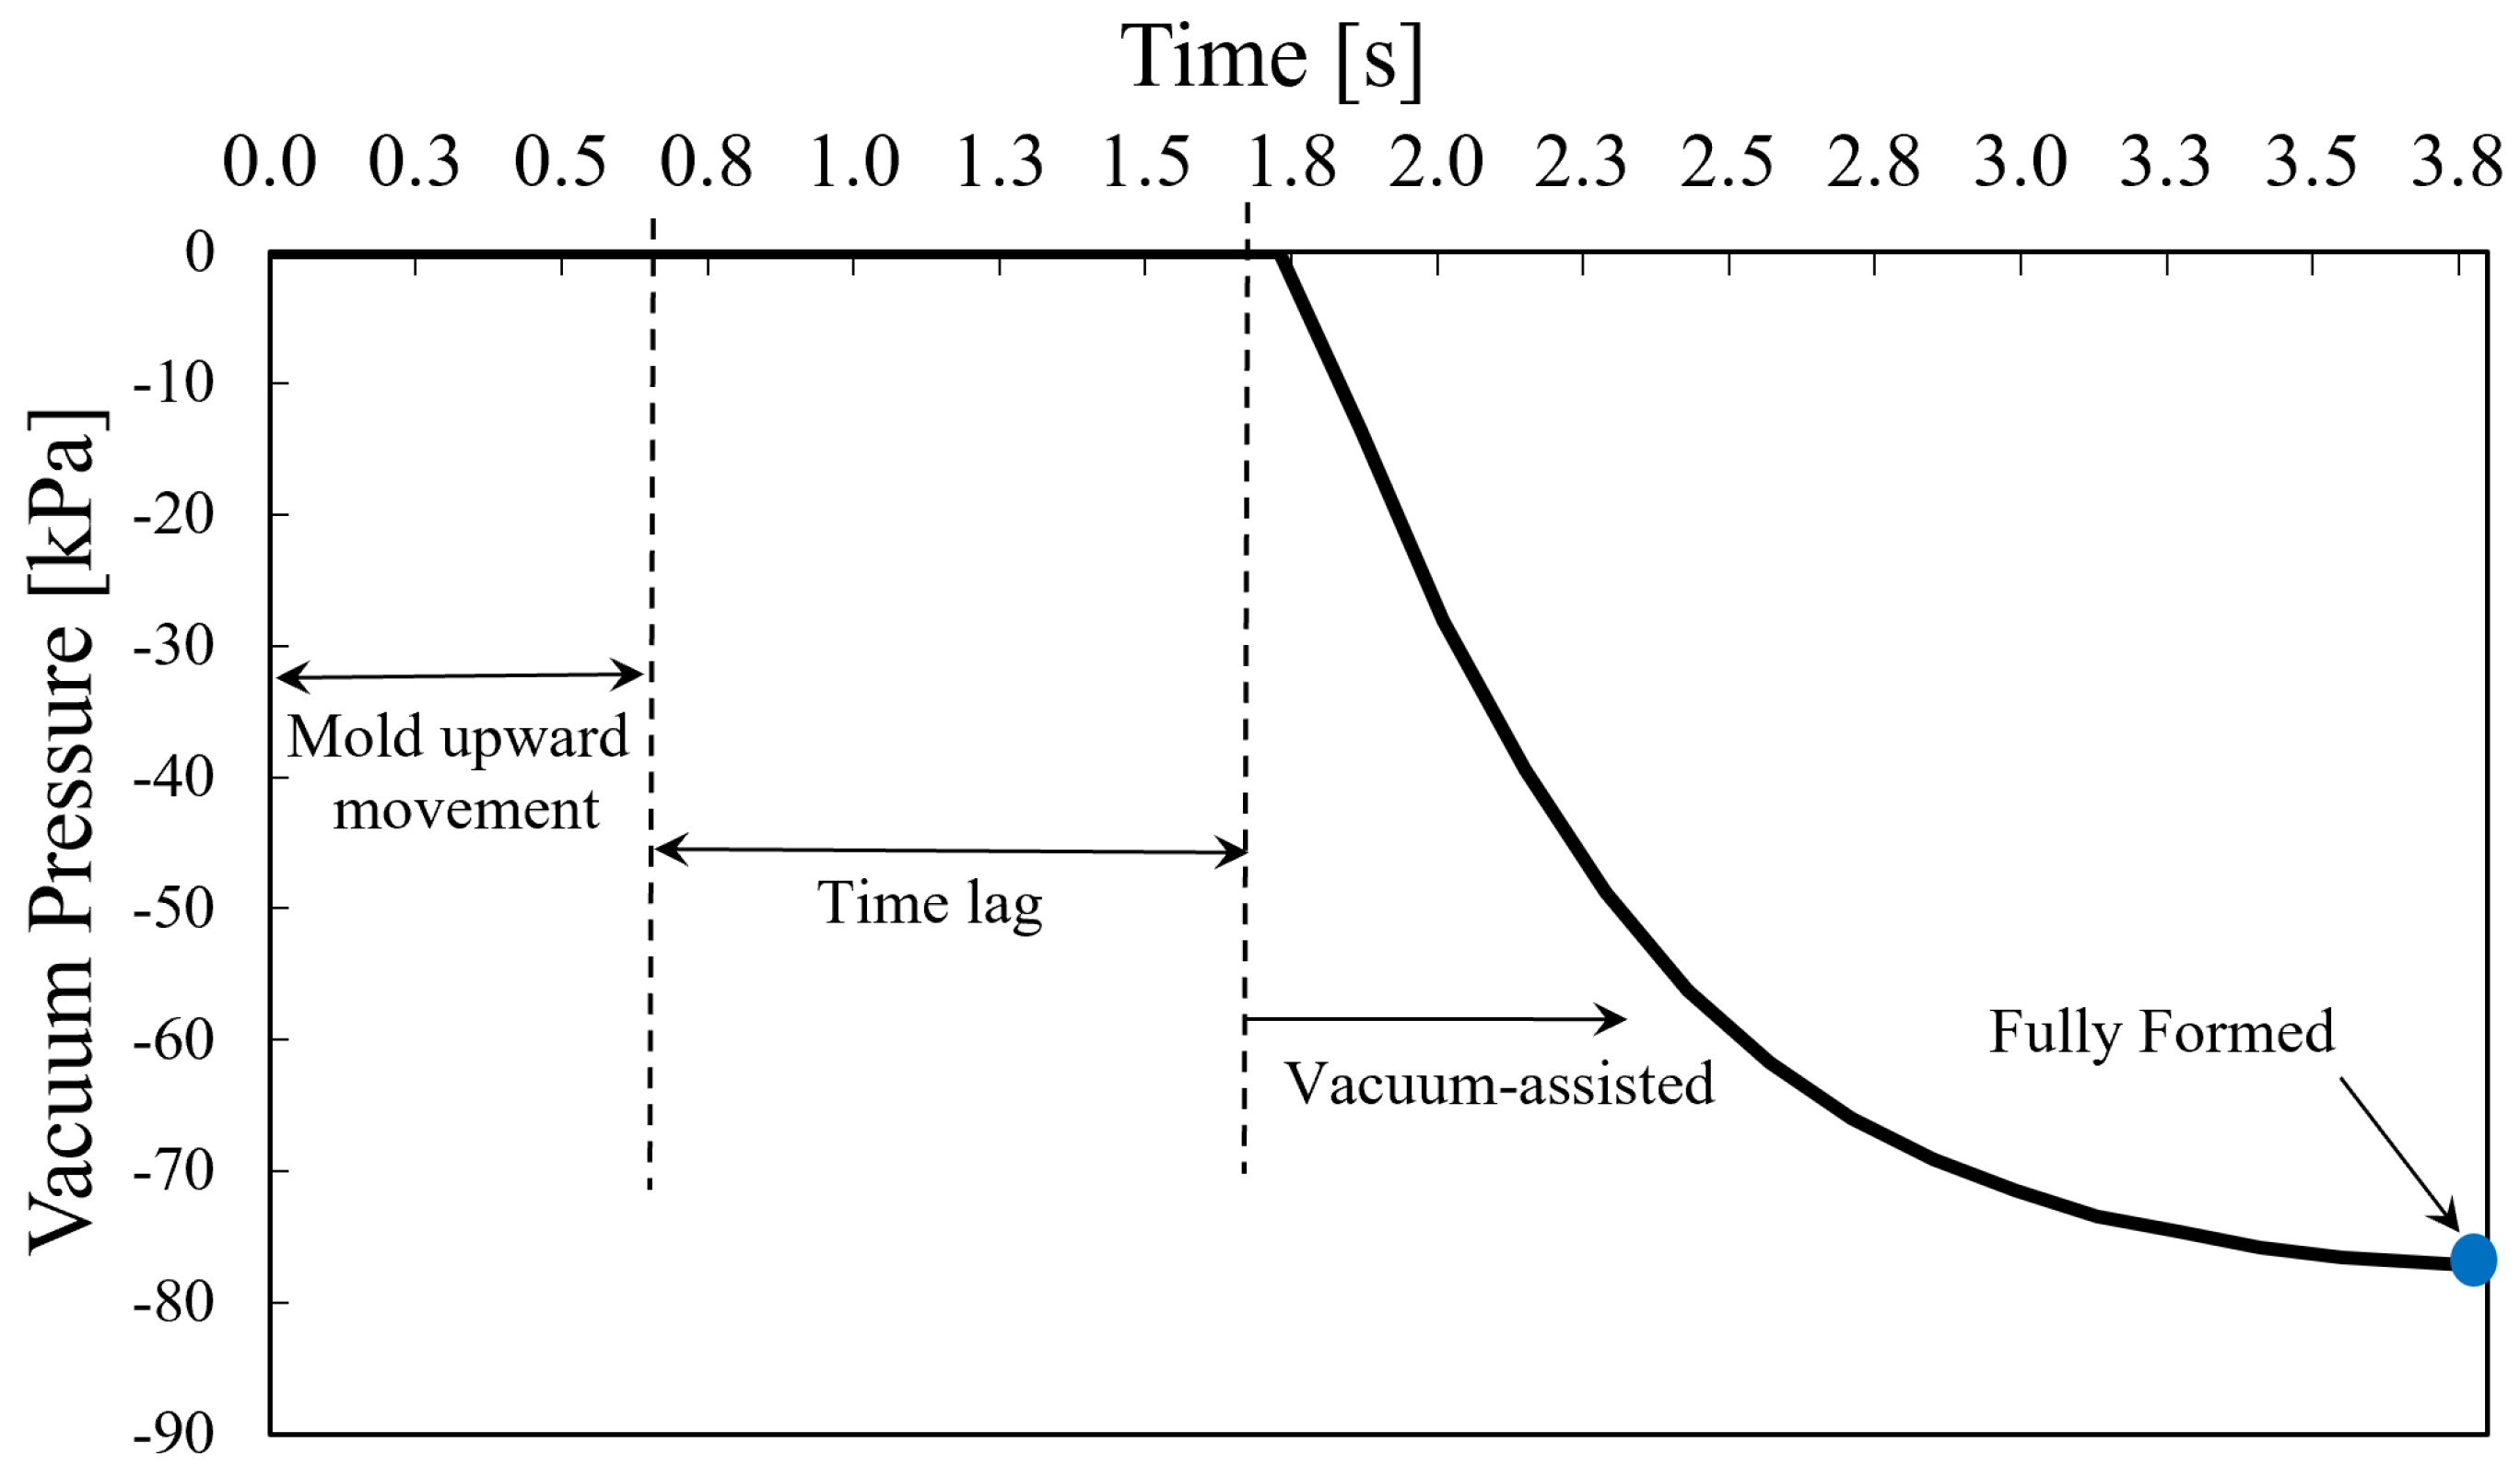
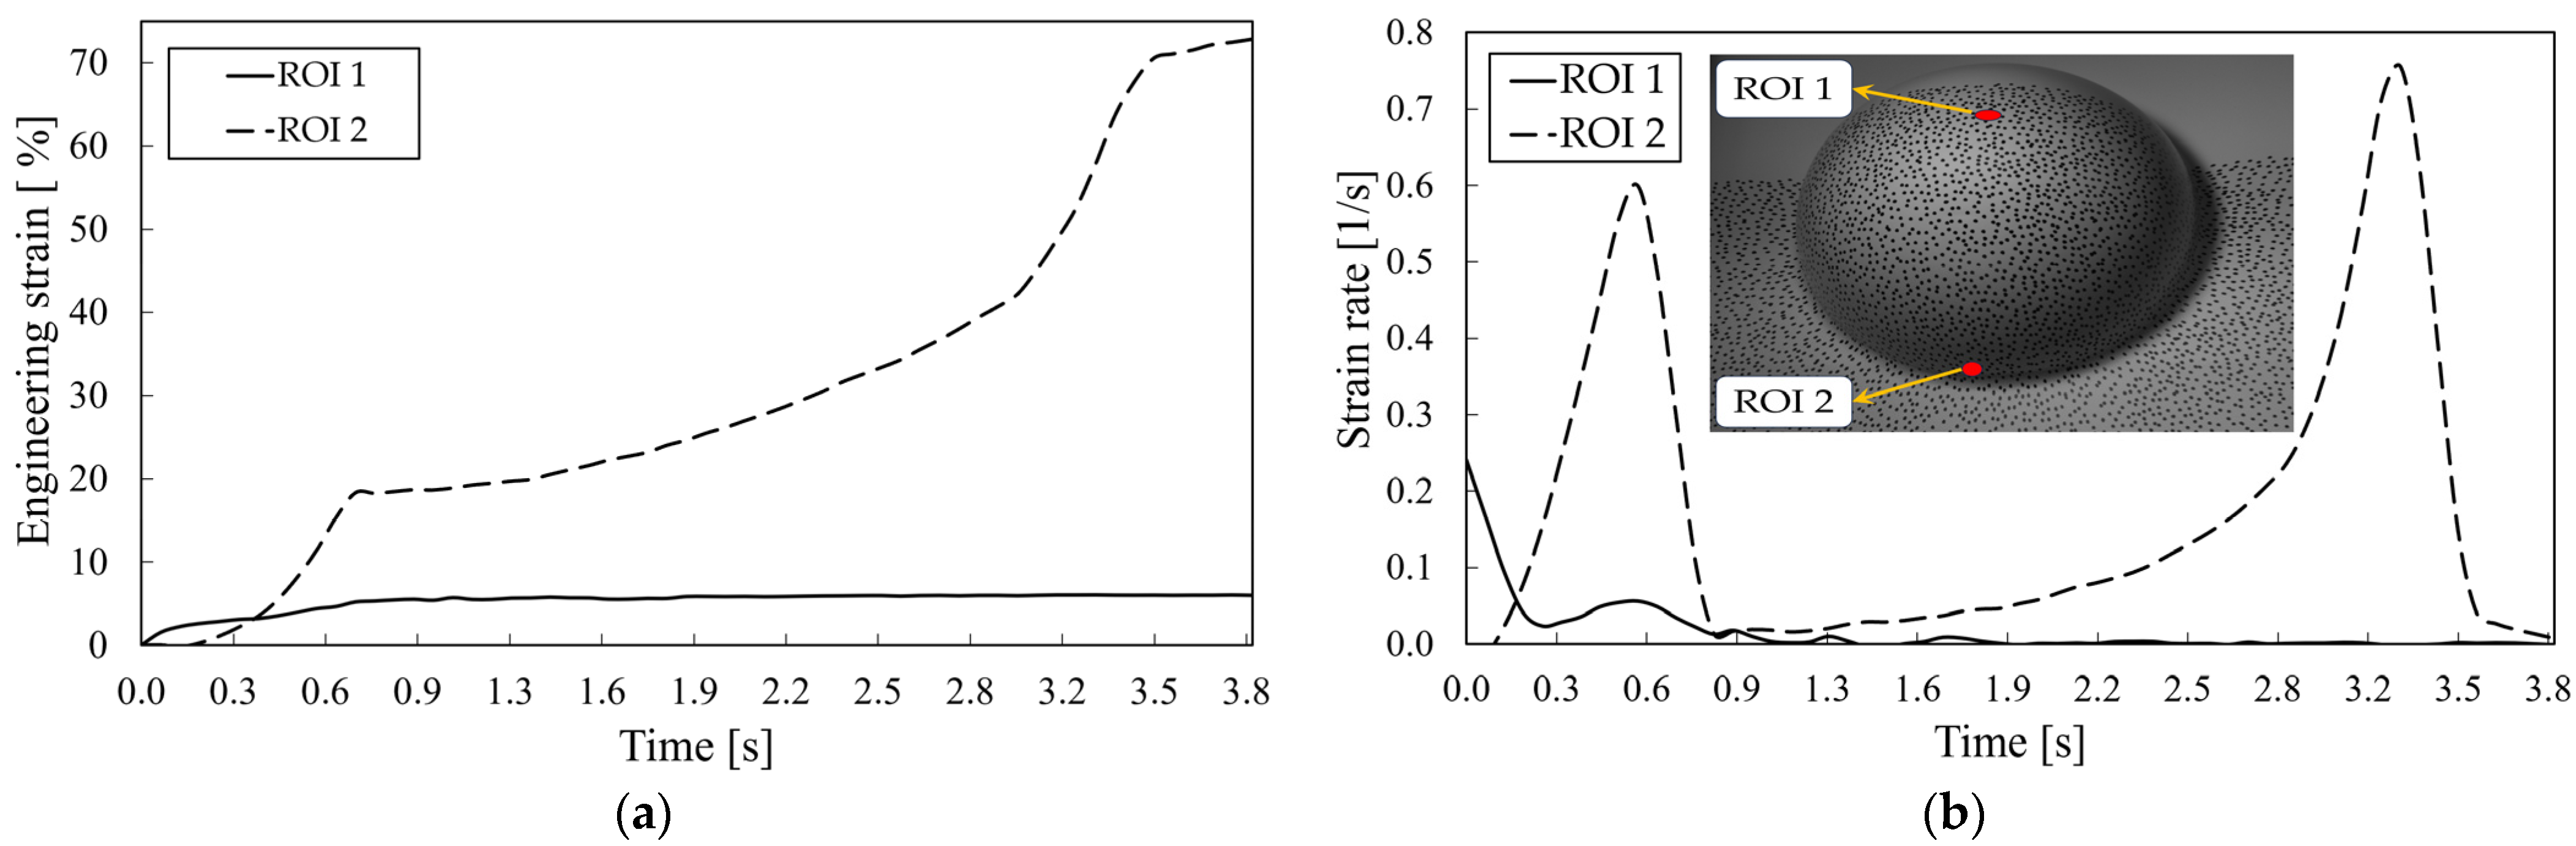
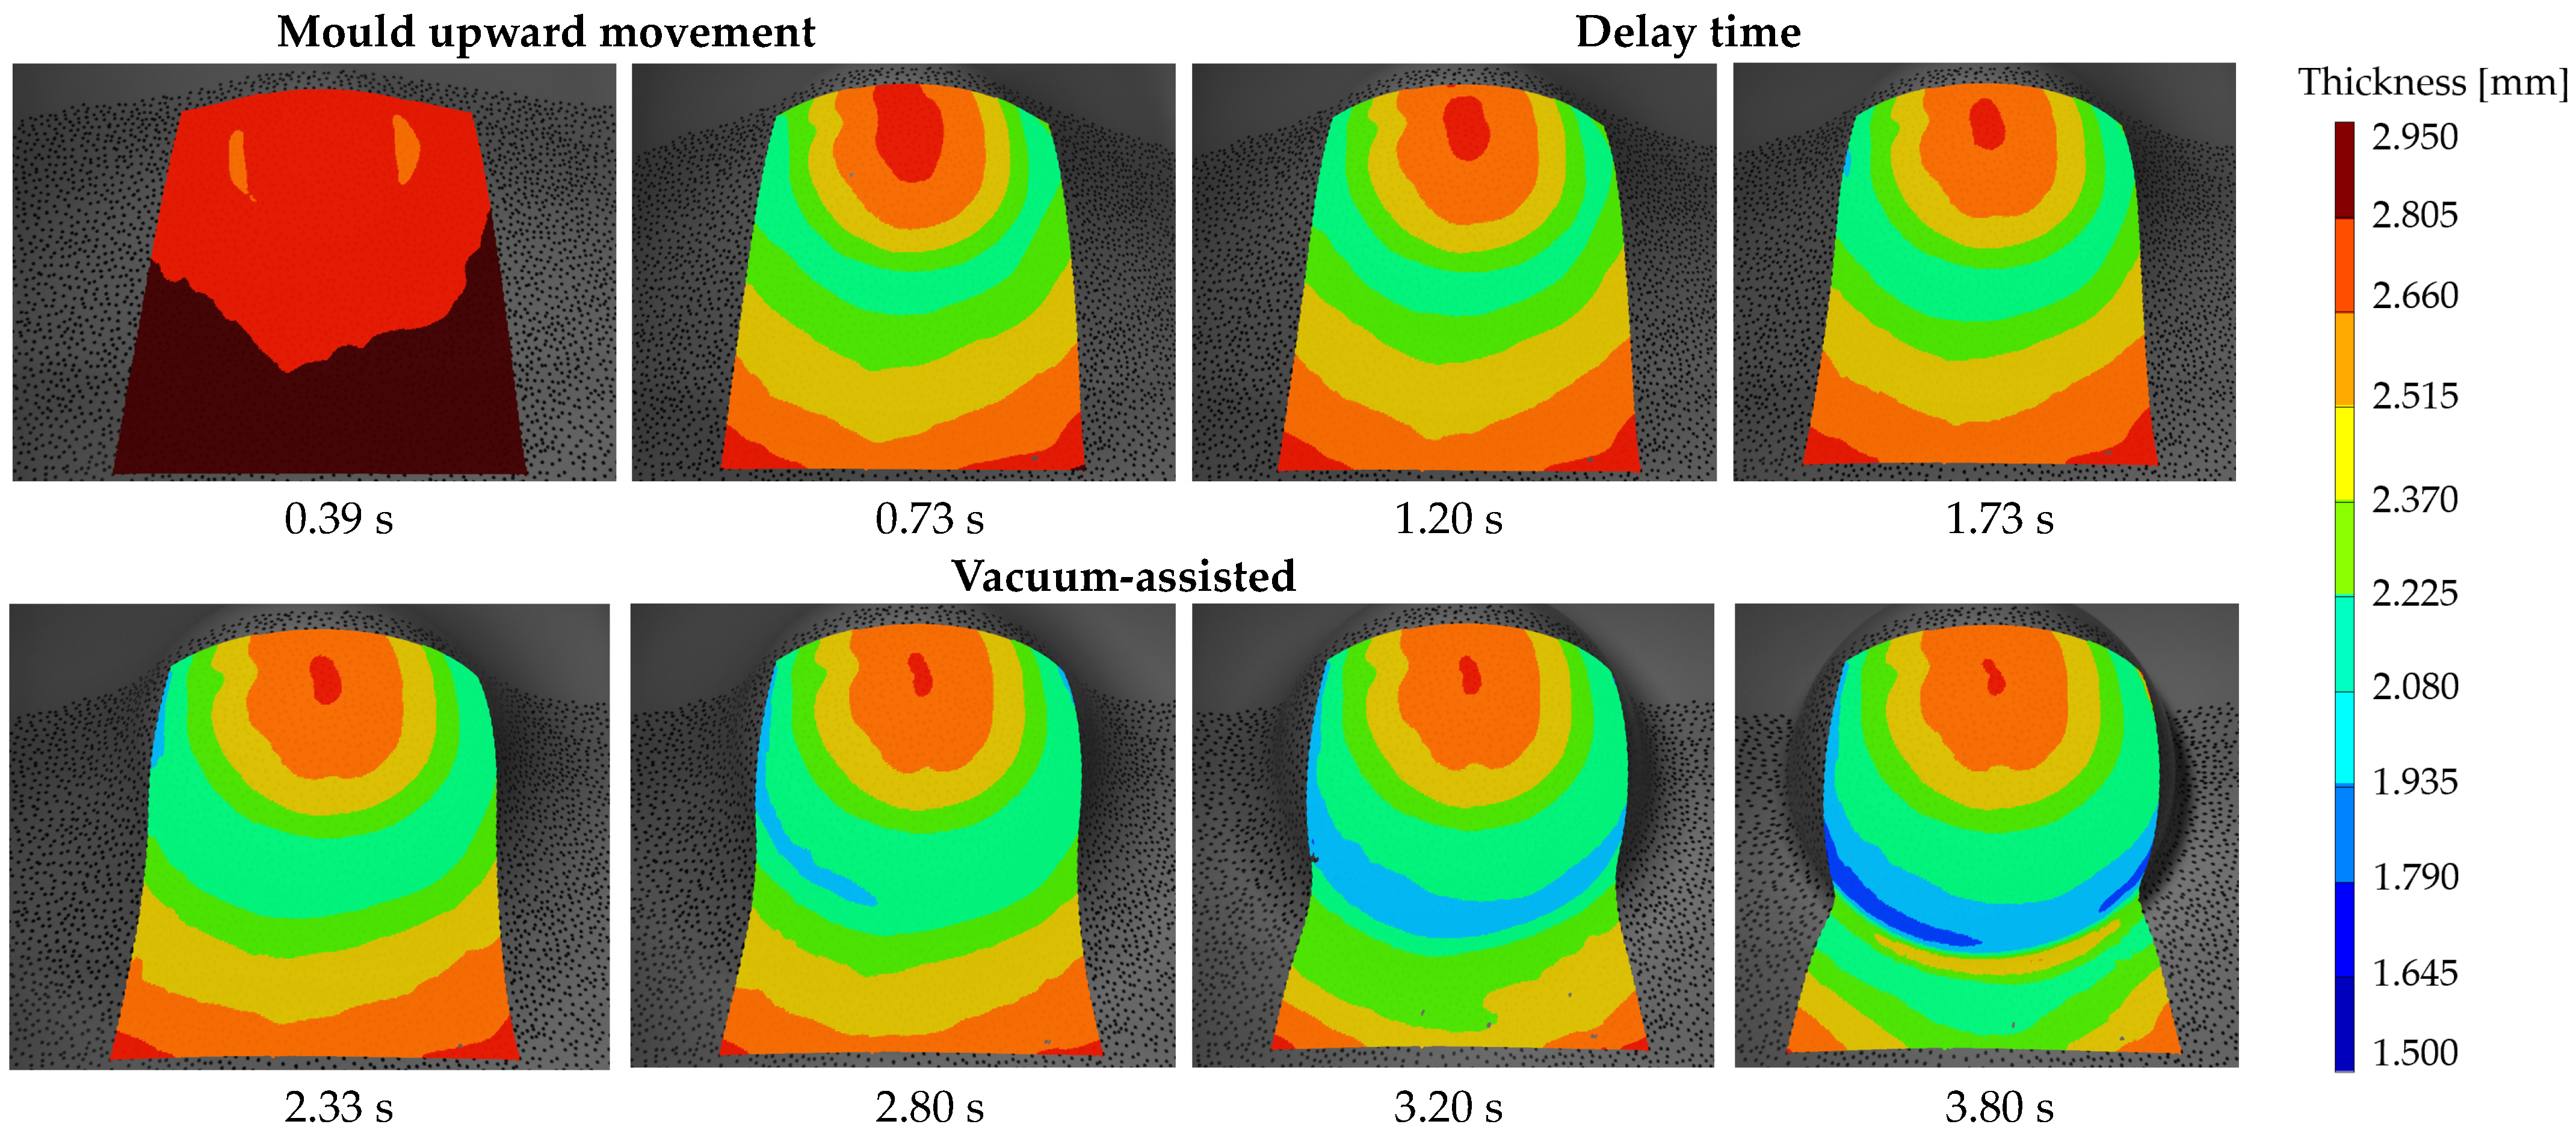
4.2. Forming of the Heated Sheet

The forming process starts with the stretching of the heated sheet by the upward movement of the mould. Figure 7 shows the strain field of the forming process. The mould reaches its peak position within 0.73 s. The initial contact between the sheet and the top of the mould acts as a constraint, preventing further stretching in the contact area even though it is the warmest part of the sheet. Notably, at the onset of this phase, the sheet displays negligible strain, owing to an existing sag deformation that compensates for the initial mechanical load. Following this, it takes 1 s before the vacuum-assisted final forming stage is started. Despite the constancy of the initial strain induced by the mould, the material’s internal stress begins to diminish, a characteristic behaviour of its viscoelastic nature [45]. Concurrently, the influence of gravity gently continues to stretch the material. Therefore, there is a dynamic interaction among mechanical constraints, viscoelastic relaxation, and gravitational forces during this 1 s time lag. The sections of the softened sheet that have not yet made contact with the mould predominantly undergo uniaxial stretching as a result of the vacuum pressure applied. This leads to the material stretching uniaxially around the sphere, beginning from the point of initial contact at the top. The complete shaping process is achieved within a timeframe of 3.8 s. Figure 8 shows the vacuum pressure gradually increasing over time. The vacuum pump is automatically turned on at 1.73 s of the process, and the vacuum pressure reaches 77.7 kPa at the end of the process. To examine the impact of vacuum pressure on the forming process, Figure 9 illustrates the engineering strain and strain rate in two distinct regions: the initial contact area located at the pole and the corner side of the semi-sphere mould. These areas are identified as Regions of Interest (ROI) 1 and 2, respectively. During the initial loading, prompted by the mould’s upward movement, the maximum strain in ROI 1 is recorded at 5.2%, while in the off-pole region, ROI 2, it reaches 18.3% (Figure 9a).
The corresponding maximum strain rates for these areas are 0.24 s−1 and 0.6 s−1 (Figure 9b). In the subsequent 1 s delay, these values experience a slight increase to 5.6% and 21.1% for ROI 1 and ROI 2, respectively. Although these measurements indicate an uneven distribution of strain, introducing bubble formation at this stage could effectively improve strain field uniformity. This can be achieved by delaying the mould’s contact with the heated sheet. The successful implementation of this technique relies on carefully balancing several critical parameters: the mould’s shape, the distribution of temperature, the timing, and the height of bubble formation.
During the vacuum-assisted pressure moulding process, significant stretching is observed in areas that are not in immediate contact with the mould. This is particularly evident in ROI 2, which experiences considerable straining. The strain in this area reaches up to 72.8%, accompanied by a peak strain rate of 0.76 s−1. From this observation, it can be inferred that once the material makes contact with the mould, further stretching is minimal, regardless of the applied temperature.
Consequently, the points of the material that contact the mould last tend to undergo the most stretching, as there is limited material remaining to conform to the mould’s surface. Figure 10 is pivotal in pinpointing the surface temperature at which the most significant deformation takes place during the forming process. This figure follows the shifts in temperature from the moment the sheet first touches the mould to the completion of its shaping. It vividly captures the sheet’s gradual cooling while in contact with the mould, effectively illustrating the material’s response and transformation under various thermal conditions throughout the moulding sequence.
Figure 11 provides a detailed view of the temperature variations in the pole (ROI 1) and the corner region (ROI 2) of semi-sphere mould during the forming process. ROI 1, making initial contact with the mould at 80 °C, shows a notable decrease in surface temperature, dropping by around 6 °C. The application of vacuum in the forming process causes the material in the vicinity of the corners to undergo more stretching and thinning, which subsequently changes the heat distribution within the material. The material in ROI 2 undergoes an acceleration in stretching at the moment of 3 s, with the deformation rate doubling from 0.35 s−1 to 0.76 s−1, coinciding with a temperature increase of approximately 2 degrees. This acceleration is associated with a rise in strain from 42.21% to 72.82% (refer to Figure 9), leading to a pronounced reduction in material thickness to 1.94 mm. As the material in ROI2 begins to stretch more rapidly, the internal friction may increase due to the polymer chains moving more quickly against each other. This could result in localized heating, which is detected by the thermal camera as a sudden increase in temperature.
As the vacuum pressure is applied, the material increasingly conforms to the mould surface, stretching further until it adheres to the mould, with no additional thickness reduction observed. Figure 12 captures the evolution of thickness reduction during the forming process. It highlights that the region first in contact with the mould during the initial loading phase undergoes minimal stretching in the later vacuum pressure phase. The vacuum pressure continues to act on corner areas, causing further stretching and, consequently, more significant thinning, as depicted by the contour lines in Figure 12. By 3.8 s, these regions have made contact with the mould, halting the stretching process and stabilizing the thickness distribution. The variations in thickness observed between 3.2 s and 3.8 s in Figure 13 prove that the corner area is not yet contacting the mould at 3.2 s, permitting further stretching driven by the vacuum pressure. At 3.2 s, the material is mid-forming, not fully conforming to the contours of the mould’s geometry, particularly at the corners. The vacuum pressure influence persists in these regions, promoting additional elongation and, hence, increased thinning. By the time of 3.8 s, these areas have established contact with the mould, which results in more stretching, as evidenced by the changes in the contour plot.
To validate the thickness measurements obtained using the DIC technique, wall thickness was also measured at every centimetre along the y-axis arc length using an ultrasonic thickness gauge. The results closely align with the DIC-derived values, thereby confirming the accuracy and reliability of the full-field strain measurements recorded during the test. The discrepancy between DIC and the ultrasonic thickness gauge measurements can be attributed to several factors. While DIC captures detailed localized deformation, the ultrasonic thickness gauge, due to its 7.9 mm probe size, smooths out thickness measurements across a wider area, potentially masking slight variations on curved surfaces. Moreover, the accuracy of the ultrasonic thickness gauge is influenced by the surface quality being examined. Imperfections or variations in surface quality can lead to less reliable readings, as the gauge requires a smooth surface for optimal sound wave transmission and reception. On the other side, in 3D DIC measurements, the accuracy of tracking surface deformations and, consequently measuring thickness can be compromised by factors such as perspective distortion and depth of field limitations. Perspective distortion arises when the positioning of cameras creates a variance in the perceived size, shape, and position of objects due to their angle of view. This effect can lead to inaccuracies in quantifying strain or displacement, as areas closer to the camera may appear disproportionately larger compared to those further away. Additionally, the depth of field presents a challenge when parts of the surface move beyond the initial focused range during deformation, resulting in a blurred speckle pattern that the DIC software struggles to track accurately. Such blurring is especially problematic in the study of large deformations or on surfaces with notable depth variations, impacting the precision of thickness measurements [36,46,47,48]. Despite these limitations, it is important to recognize that both 3D DIC and methods like the ultrasonic thickness gauge are experimental techniques, each with its inherent sources of error.

5. Conclusions

This study provides an in-depth analysis of the thermo-mechanical properties of heavy gauge ABS thermoplastic during the positive vacuum thermoforming process, with a particular focus on the forming stage where the material interacts with the mould. Utilizing digital image correlation (DIC) in tandem with thermal imaging, the research effectively mapped the correlation between real-time strain fields, deformation rates, and temperature fluctuations on the thermoplastic sheet during vacuum forming. Experiment validation was achieved by comparing thickness calculations obtained from DIC’s principal strain directions to directly measured thickness values using ultrasonic testing. This confirms the accuracy of the full-field strain measurements. While the cut-off temperature for the heaters was 155 °C, the study revealed that the maximum strain occurs at a notably lower temperature of 131 °C. By identifying a notable discrepancy in the expected versus actual temperatures at which maximum material strain occurs, our study sheds light on the interaction between the heating phase and the timing sequence of the forming process. This situation highlights the significant role of any time delay between heating and forming, which results in unwanted temperature drops. Such delays can lead to undesirable temperature reductions, posing challenges, especially for smaller moulds due to compatibility issues between the size of heater elements and the mould. To mitigate these challenges, two potential solutions are proposed: accelerating the movement of the mould table to reduce the time lag and constructing a temperature-regulated enclosure around the forming area to ensure consistent temperatures. While the former might pose risks to the material’s structural integrity or result in uneven deformation, the latter presents a promising approach to enhance process efficiency by minimizing heat loss. As a benchmark case study, these findings are poised to significantly advance the validation of simulation packages tailored for thermoforming, bridging the gap between theoretical models and industrial applications.

Author Contributions

Conceptualization, R.V., B.B. and F.D.; methodology, R.V., B.B. and F.D.; investigation, R.V.; resources, F.D.; writing—original draft preparation, R.V.; writing—review and editing, B.B. and F.D.; visualization, R.V. and B.B.; supervision, F.D.; funding acquisition, B.B. and F.D. All authors have read and agreed to the published version of the manuscript.

Funding

This work has been funded by the ICON project “ProPeL”, which fits in the MacroModelMat (M3) research program, coordinated by Siemens (Siemens Digital Industries Software, Leuven, Belgium), and funded by SIM (Strategic Initiative Materials in Flanders) and VLAIO (Flemish government agency Flanders Innovation & Entrepreneurship). The authors would like to express their profound gratitude to Güven Ogus and Pascal Lava of the MatchID team for their invaluable assistance and support. Special thanks are also due to the Vitalo Group company for kindly supplying the ABS sheet materials in a range of thicknesses and dimensions.

Data Availability Statement

Data will be made available upon request.

Conflicts of Interest

The authors declare no conflicts of interest.

References

  1. Ayadi, A.; Lacrampe, M.-F.; Krawczak, P. A comprehensive study of bubble inflation in vacuum-assisted thermoforming based on whole-field strain measurements. In Proceedings of the 21st International Esaform Conference on Material Forming: Esaform 2018, Palermo, Italy, 23–25 April 2018. [Google Scholar]
  2. Ayadi, A.; Lacrampe, M.-F.; Krawczak, P. Bubble assisted vacuum thermoforming: Considerations to extend the use of in-situ stereo-DIC measurements to stretching of sagged thermoplastic sheets. Int. J. Mater. Form. 2019, 13, 59–76. [Google Scholar] [CrossRef]
  3. Duarte, F.M.; Covas, J.A. IR sheet heating in roll fed thermoforming: Part 1-Solving direct and inverse heating problems. Plast. Rubber Compos. 2002, 31, 307–317. [Google Scholar] [CrossRef]
  4. Li, Y.; Nemes, J.A.; Derdouri, A.A. Membrane Inflation of Polymeric Materials: Experiments and Finite Element Simulations. Polym. Eng. Sci. 2001, 41, 1399–1412. [Google Scholar] [CrossRef]
  5. Throne, J.L. The effect of sheet sag on radiant energy transmission in thermoforming. Thermoforming Q. 2006, 25, 19–24. [Google Scholar]
  6. Jordan, A.M.; Meyer, L.; Kim, K.; Lee, B.; Bates, F.S.; Macosko, C.W. Improved Polypropylene Thermoformability through Polyethylene Layering. ACS Appl. Mater. Interfaces 2022, 14, 34134–34142. [Google Scholar] [CrossRef]
  7. Giacomin, A.; Mix, A.; Mahmood, O. Sag in thermoforming. Polym. Eng. Sci. 2010, 50, 2060–2068. [Google Scholar] [CrossRef]
  8. Verron, E.; Marckmann, G.; Peseux, B. Dynamic inflation of non-linear elastic and viscoelastic rubber-like membranes. Int. J. Numer. Methods Eng. 2001, 50, 1233–1251. [Google Scholar] [CrossRef]
  9. Turner, J.A.; Menary, G.H.; Martin, P.J. Biaxial characterization of poly(ether-ether-ketone) for thermoforming: A comparison between bulge and in-plane biaxial testing. Polym. Eng. Sci. 2019, 59, 1853–1865. [Google Scholar] [CrossRef]
  10. Calì, M.; Lo Savio, F. Accurate 3D reconstruction of a rubber membrane inflated during a bulge test to evaluate anisotropy. Lect. Notes Mech. Eng. 2017, 0, 1221–1231. [Google Scholar] [CrossRef]
  11. Machado, G.; Favier, D.; Chagnon, G. Membrane Curvatures and Stress-strain Full Fields of Axisymmetric Bulge Tests from 3D-DIC Measurements. Theory and Validation on Virtual and Experimental results. Exp. Mech. 2011, 52, 865–880. [Google Scholar] [CrossRef]
  12. Sasso, M.; Palmieri, G.; Chiappini, G.; Amodio, D. Characterization of hyperelastic rubber-like materials by biaxial and uniaxial stretching tests based on optical methods. Polym. Test. 2008, 27, 995–1004. [Google Scholar] [CrossRef]
  13. Varedi, R.; Buffel, B.; Desplentere, F. Characterization of the biaxial response of a thermoplastic ABS Sheet using DIC-instrumented bubble inflation technique. Mater. Res. Proc. 2023, 28, 1887–1896. [Google Scholar]
  14. Lee, J.K.; Scott, C.E.; Virkler, T.L. Effects of rheological properties and processing parameters on ABS thermoforming. Polym. Eng. Sci. 2001, 41, 240–261. [Google Scholar] [CrossRef]
  15. Warby, M.; Whiteman, J.; Jiang, W.-G.; Warwick, P.; Wright, T. Finite element simulation of thermoforming processes for polymer sheets. Math. Comput. Simul. 2002, 61, 209–218. [Google Scholar] [CrossRef]
  16. Morales, R.A.; Candal, M.V.; Santana, O.O.; Gordillo, A.; Salazar, R. Effect of the thermoforming process variables on the sheet friction coefficient. Mater. Des. 2014, 53, 1097–1103. [Google Scholar] [CrossRef]
  17. Takaffoli, M.; Hangalur, G.; Bakker, R.; Chandrashekar, N. Thermo-visco-hyperelastic behavior of polycarbonate in forming of a complex geometry. J. Manuf. Process. 2020, 57, 105–113. [Google Scholar] [CrossRef]
  18. Leite, W.D.O.; Campos Rubio, J.C.; Mata Cabrera, F.; Carrasco, A.; Hanafi, I. Vacuum thermoforming process: An approach to modeling and optimization using artificial neural networks. Polymer 2018, 10, 143. [Google Scholar] [CrossRef] [PubMed]
  19. Throne, J. 16 Thermoforming. In Applied Plastics Engineering Handbook, 2nd ed.; Elsevier: Amsterdam, The Netherlands, 2017. [Google Scholar] [CrossRef]
  20. Van Mieghem, B.; Desplentere, F.; Van Bael, A.; Ivens, J. Improvements in thermoforming simulation by use of 3D digital image correlation. Express Polym. Lett. 2015, 9, 119–128. [Google Scholar] [CrossRef]
  21. Sutton, M.; Yan, J.; Tiwari, V.; Schreier, H.; Orteu, J. The effect of out-of-plane motion on 2D and 3D digital image correlation measurements. Opt. Lasers Eng. 2008, 46, 746–757. [Google Scholar] [CrossRef]
  22. Shao, X.; Dai, X.; Chen, Z.; Dai, Y.; Dong, S.; He, X. Calibration of stereo-digital image correlation for deformation measurement of large engineering components. Meas. Sci. Technol. 2016, 27, 125010. [Google Scholar] [CrossRef]
  23. Hild, F.; Roux, S. Digital image correlation: From displacement measurement to identification of elastic properties—A review. Strain 2006, 42, 69–80. [Google Scholar] [CrossRef]
  24. Ke, X.-D.; Schreier, H.W.; Sutton, M.A.; Wang, Y.Q. Error Assessment in Stereo-based Deformation Measurements. Exp. Mech. 2011, 51, 423–441. [Google Scholar] [CrossRef]
  25. Jerabek, M.; Major, Z.; Lang, R. Strain determination of polymeric materials using digital image correlation. Polym. Test. 2010, 29, 407–416. [Google Scholar] [CrossRef]
  26. Seefried, A.; Drummer, D. The effects of radiation cross-linking and process parameters on the behavior of polyamide 12 in vacuum thermoforming. Polym. Eng. Sci. 2012, 52, 884–892. [Google Scholar] [CrossRef]
  27. Van Mieghem, B.; Ivens, J.; Van Bael, A. Consistency of Strain Fields and Thickness Distributions in Thermoforming Experiments Through Stereo DIC. Exp. Tech. 2016, 40, 1409–1420. [Google Scholar] [CrossRef]
  28. van Mieghem, B.; Lava, P.; Debruyne, D.; van Bael, A.; Ivens, J. Digital image correlation for on-line wall thickness measurements in thick gauge thermoforming. Key Eng. Mater. 2013, 554–557, 1583–1591. [Google Scholar] [CrossRef]
  29. Ayadi, A.; Lacrampe, M.-F.; Krawczak, P. Assessment of principal strain uncertainties in stereo-DIC due to uncontrollable change of initial boundary conditions during vacuum-assisted thermoforming. In Proceedings of the 22nd International Esaform Conference on Material Forming: Esaform 2019, Vitoria-Gasteiz, Spain, 8–10 May 2019. [Google Scholar]
  30. Mergan, S.; Scheuer, A.; Coppieters, S.; Desplentere, F. Development of a DIC-instrumented Bubble Inflation Test: Characterization of ABS Thermoforming. In Proceedings of the 38th International Conference of the Polymer Processing Society (PPS), St. Gallen, Switzerland, 22–26 May 2023. [Google Scholar]
  31. Epsotech Holding GmbH, Technical Datasheet for Epsotech AB AN2 V0. 2019. Available online: https://epsotech.com/files/uploads/epsotech/2020/AB%20AN2%20V0.pdf (accessed on 1 September 2013).
  32. Mokarizadehhaghighishirazi, M.; Buffel, B.; Lomov, S.V.; Desplentere, F. Homogenisation of the Local Thermal Conductivity in Injection-Moulded Short Fibre Reinforced Composites. Polymers 2022, 14, 3360. [Google Scholar] [CrossRef]
  33. ASTM D7984-21; Standard Test Method for Measurement of Thermal Effusivity of Fabrics Using a Modified Transient Plane Source (MTPS) Instrument. ASTM: West Conshohocken, PA, USA, 2021. Available online: https://www.astm.org/d7984-21.html (accessed on 20 February 2024).
  34. ASTM E1269; Standard Test Method for Determining Specific Heat Capacity by Differential Scanning Calorimetry. ASTM: West Conshohocken, PA, USA, 2011; pp. 1–6. Available online: https://global.ihs.com/doc_detail.cfm?document_name=ASTM%20E1269&item_s_key=00112085#:~:text=This%20test%20method%20covers%20the,100%20to%20600%C2%B0C (accessed on 20 February 2024).
  35. MatchID. Available online: http://www.matchid.eu/ (accessed on 22 May 2019).
  36. Lava, P.; Cooreman, S.; Coppieters, S.; De Strycker, M.; Debruyne, D. Assessment of measuring errors in DIC using deformation fields generated by plastic FEA. Opt. Lasers Eng. 2009, 47, 747–753. [Google Scholar] [CrossRef]
  37. Fauster, E.; Schalk, P.; O’Leary, P.L. Evaluation and calibration methods for the application of a video-extensometer to tensile testing of polymer materials. Mach. Vis. Appl. Ind. Insp. XIII 2005, 5679, 187. [Google Scholar]
  38. Wang, Z.; Kieu, H.; Nguyen, H.; Le, M. Digital image correlation in experimental mechanics and image registration in computer vision: Similarities, differences and complements. Opt. Lasers Eng. 2015, 65, 18–27. [Google Scholar] [CrossRef]
  39. Lava, P.; Jones, E.M.C.; Wittevrongel, L.; Pierron, F. Validation of finite-element models using full-field experimental data: Levelling finite-element analysis data through a digital image correlation engine. Strain 2020, 56, e12350. [Google Scholar] [CrossRef]
  40. Parsons, E.; Boyce, M.; Parks, D. An experimental investigation of the large-strain tensile behavior of neat and rubber-toughened polycarbonate. Polymer 2004, 45, 2665–2684. [Google Scholar] [CrossRef]
  41. Yaofeng, S.; Pang, J.H. Study of optimal subset size in digital image correlation of speckle pattern images. Opt. Lasers Eng. 2007, 45, 967–974. [Google Scholar] [CrossRef]
  42. Schreier, H.W.; Sutton, M.A. Systematic errors in digital image correlation due to undermatched subset shape functions. Exp. Mech. 2002, 42, 303–310. [Google Scholar] [CrossRef]
  43. Schmidt, F.; Le Maoult, Y.; Monteix, S. Modelling of infrared heating of thermoplastic sheet used in thermoforming process. J. Mater. Process. Technol. 2003, 143–144, 225–231. [Google Scholar] [CrossRef]
  44. Buffel, B.; Van Mieghem, B.; Van Bael, A.; Desplentere, F. Optimization of the IR-heating phase in thermoforming of thermoplastic sheets: Characterization and modelling. In Proceedings of the PPS-32: The 32nd International Conference of the Polymer Processing Society-Conference Papers, Lyon, France, 25–29 July 2016. [Google Scholar]
  45. Bergström, J.; Boyce, M. Constitutive modeling of the large strain time-dependent behavior of elastomers. J. Mech. Phys. Solids 1998, 46, 931–954. [Google Scholar] [CrossRef]
  46. Haddadi, H.; Belhabib, S. Use of rigid-body motion for the investigation and estimation of the measurement errors related to digital image correlation technique. Opt. Lasers Eng. 2008, 46, 185–196. [Google Scholar] [CrossRef]
  47. Cheng, P.; Sutton, M.A.; Schreier, H.W.; McNeill, S.R. Full-field Speckle Pattern Image Correlation with B-Spline Deformation Function. Exp. Mech. 2002, 42, 344–352. [Google Scholar] [CrossRef]
  48. Lecompte, D.; Smits, A.; Bossuyt, S.; Sol, H.; Vantomme, J.; Van Hemelrijck, D.; Habraken, A. Quality assessment of speckle patterns for digital image correlation. Opt. Lasers Eng. 2006, 44, 1132–1145. [Google Scholar] [CrossRef]
Figure 1. Thermal properties of the ABS EpsoTech material as a function of temperature, (a) thermal conductivity, and (b) heat capacity.
Jmmp 08 00049 g001
Figure 2. (a) The layout of the GEISS vacuum-forming machine DU 1000 × 600 × 400 U8, including the positioning of halogen elements, and (b) the distance between the upper and lower heater banks in relation to the window plate presented in millimetre.
Jmmp 08 00049 g002
Figure 3. (a) Semi-sphere mould fitted inside the cabinet of the vacuum-forming machine, connected to the pressurized circulating water system; (b) the dimensions marked in mm on the aluminum mould; and (c) schematic of the hemispherical mould with symmetrically placed vacuum holes at the corners.
Jmmp 08 00049 g003
Figure 4. (a) Mounting arrangement of the DIC cameras and thermal camera on the GEISS vacuum-forming machine; (b) MatchID platform for coupled DIC-thermal camera synchronization; (c) thermoformed product of positive semi-sphere mould of ABS material.
Jmmp 08 00049 g004
Figure 5. Temperature profile during radiative heating of a nominal 3 mm ABS sheet with trigger setpoint of 155 °C measured by MI pyrometer sensor followed by cooling at ambient temperature during the thermoforming process.
Jmmp 08 00049 g005
Figure 6. (a) Temperature field across the half of ABS sheet surface just prior to forming; (b) temperature profile across the center line.
Jmmp 08 00049 g006
Figure 7. Maximum principal engineering strain of the ABS sheet, recorded at different forming evolution frames via DIC correlation.
Jmmp 08 00049 g007
Figure 8. Vacuum pressure progression from the initiation of the vacuum pump to the completion of material shaping.
Jmmp 08 00049 g008
Figure 9. Diagram depicting (a) strain and (b) strain rate experienced during the forming of an ABS sheet on a semi-spherical mould. The diagram specifically focuses on two distinct areas: the pole, referred to as Region of Interest 1 (ROI 1), and the edge, labelled as Region of Interest 2 (ROI 2).
Jmmp 08 00049 g009
Figure 10. Temperature field during the forming process of a heated ABS sheet on a semi-spherical mould, ranging from the initial contact of the sheet with the mould to the completion of the forming process.
Jmmp 08 00049 g010
Figure 11. Temperature variations at pole region (ROI 1) and edge region (ROI 2) during thermo-vacuum-forming process of an ABS sheet.
Jmmp 08 00049 g011
Figure 12. Thickness distribution in 3 mm nominal thickness ABS sheet during vacuum-assisted thermoforming on a semi-spherical positive mould.
Jmmp 08 00049 g012
Figure 13. Evolution of thickness reduction in an ABS sheet during forming calculated using the digital image correlation (DIC) method, with comparative data from an ultrasonic thickness across the Y axis.
Jmmp 08 00049 g013
Table 1. Calibration parameters of the stereo DIC system mounted on the GEISS vacuum-forming machine.
Intrinsic
Parameters
Camera 0Camera 1Camera 2
(Thermal Camera)
Extrinsic
Parameters
DIC White CamerasCamera 2
(Thermal Camera)
f x   [ P i x e l ] 374537491470θ (°)0.321.48
f y   [ P i x e l ] 374337481748ϕ (°)−15.0913.15
C x   [ P i x e l ] 12211280289Ψ (°)0.240.66
C y   [ P i x e l ] 10501062235 T x [mm]180.70−164.82
f s     [ P i x e l ] 0−0.950.82 T y [mm]−1.174.05
κ 1 −0.07−0.080.01 T z [mm]44.0056.39
Table 2. Correlation setting using MatchID stereo software.
ParametersMethod
Area of Interest [Pixels]Polygon shape; 956 × 1560
Correlation algorithmZero-normalized sum of squared differences
InterpolationLocal Bicubic Spline Interpolation
Stereo transformationAffine
Correlation progressSpatial + update reference
Subset size [Pixels]35 × 35
Step size [Pixels]5
Strain window [Pixels]15
Strain Shape FunctionPolynomial bilinear
Strain tensorBiot undeformed (Engineering)
Disclaimer/Publisher’s Note: The statements, opinions and data contained in all publications are solely those of the individual author(s) and contributor(s) and not of MDPI and/or the editor(s). MDPI and/or the editor(s) disclaim responsibility for any injury to people or property resulting from any ideas, methods, instructions or products referred to in the content.

