Article

Influence of the Processing Parameters on the Microstructure and Mechanical Properties of 316L Stainless Steel Fabricated by Laser Powder Bed Fusion

by
Germán Omar Barrionuevo
1,2,*,
Jorge Andrés Ramos-Grez
2,
Xavier Sánchez-Sánchez
1,
Daniel Zapata-Hidalgo
1,
José Luis Mullo
2,3 and
Santiago D. Puma-Araujo
4,*
1
Departamento de Ciencias de la Energía y Mecánica, Universidad de las Fuerzas Armadas ESPE, Sangolquí 171103, Ecuador
2
Department of Mechanical and Metallurgical Engineering, School of Engineering, Pontificia Universidad Católica de Chile, Av. Vicuña Mackenna 4860, Santiago 8320165, Chile
3
Grupo de Ingeniería Automotriz, Movilidad y Transporte (GiAUTO), Carrera de Ingeniería Automotriz-Campus Sur, Universidad Politécnica Salesiana, Quito 170702, Ecuador
4
School of Engineering and Sciences, Tecnologico de Monterrey, Monterrey 64849, Mexico
*
Authors to whom correspondence should be addressed.
J. Manuf. Mater. Process. 2024, 8(1), 35; https://doi.org/10.3390/jmmp8010035
Submission received: 29 November 2023 / Revised: 16 January 2024 / Accepted: 18 January 2024 / Published: 9 February 2024
(This article belongs to the Special Issue Laser-Based Manufacturing II)

Abstract

:
Complex thermo-kinetic interactions during metal additive manufacturing reduce the homogeneity of the microstructure of the produced samples. Understanding the effect of processing parameters over the resulting mechanical properties is essential for adopting and popularizing this technology. The present work is focused on the effect of laser power, scanning speed, and hatch spacing on the relative density, microhardness, and microstructure of 316L stainless steel processed by laser powder bed fusion. Several characterization techniques were used to study the microstructure and mechanical properties: optical, electron microscopies, and spectrometry. A full-factorial design of experiments was employed for relative density and microhardness evaluation. The results derived from the experimental work were subjected to statistical analysis, including the use of analysis of variance (ANOVA) to determine both the main effects and the interaction between the processing parameters, as well as to observe the contribution of each factor on the mechanical properties. The results show that the scanning speed is the most statistically significant parameter influencing densification and microhardness. Ensuring the amount of volumetric energy density (125 J/mm3) used to melt the powder bed is paramount; maximum densification (99.7%) is achieved with high laser power and low scanning speed, while hatch spacing is not statistically significant.

1. Introduction

Metal additive manufacturing (AM), also known as 3D metal printing, is a cutting-edge manufacturing technology that has revolutionized the creation of intricate and complex metal components. Unlike traditional subtractive manufacturing methods, which involve cutting and shaping metal from a solid block, metal AM builds objects layer by layer, offering unparalleled design freedom and efficiency [1]. In the realm of metal AM, powdered metal alloys are meticulously deposited layer upon layer, fused together using various techniques, such as laser or electron beam melting, to construct intricate parts and assemblies with remarkable precision [2]. This transformative technology has found applications across numerous industries, including aerospace, automotive, and healthcare [3,4,5], pushing the boundaries of what is possible regarding material performance, geometric complexity, and customization.
Laser-based powder bed fusion (LPBF) is a metal AM technology that utilizes high-power lasers to selectively melt and fuse metal powder layers, building up a three-dimensional object layer by layer, using data from CAD software. Homogenizing the microstructure of additively manufactured samples stands out as a pivotal challenge in enhancing the technology’s robustness and cost-effectiveness [6,7]. LPBF leads to the development of anisotropic microstructures caused by a wide range of applied thermo-kinetics. This includes intricate process influences like reheating within individual layers and due to adding new layers, elemental segregations, and creating residual stresses, often leading to an anisotropic response [1,8,9].
It is essential to optimize the processing parameters to achieve components with superior mechanical properties compared to those conventionally produced. Defects emerge when the values of these processing parameters are inadequately chosen [10]. Typical flaws include porosities, incomplete fusion holes, delamination, and cracks [11]. Pores negatively affect the performance of additively manufactured components [12,13,14]. According to Al-Maharma et al. [15], surface porosity affects corrosion resistance, subsurface porosity fatigue strength, spherical porosity stiffness, and irregular porosity mechanical strength.
The need to find a processing window to avoid phenomena like unmelted material and spatter from molten material indicates a limitation in controlling the LPBF process, which is a function of the laser energy density (Equation (1)).
V E D = P v × h × l ,
where VED is the volumetric energy density (J mm−3), P is the laser power (W), v is the scanning speed (mm s−1), h is the hatch distance (mm), and l is the layer thickness (mm).
Several studies have been developed to evaluate the effect of the processing parameters on the microstructure of parts processed by LPBF [16,17,18,19]. As stainless steel (SS) exhibits adequate processability, good mechanical properties, and excellent corrosion resistance, it is one of the most used materials in LPBF [14]. Nevertheless, due to the high thermal gradient and cooling rate, a much finer structure is achieved than the one obtained by casting or forging [20]. In this context, Laleh et al. [21] reported an average grain size of around 6 µm for additively manufactured 316L SS samples, compared to over 15 µm for conventionally processed SS. Lin et al. [22] concluded that grain refinement improves the mechanical properties of the manufactured pieces. Therefore, the parts manufactured by LPBF should have greater resistance and hardness [23].
One of the most prominent features of laser-processed materials is the cellular/columnar microstructure. The formation of the cellular colonies results from constitutional supercooling, related to the diffusion of elements in liquid and solid phases. Enrichment of cell walls with Cr and Mo segregation has been observed in austenitic stainless steel [24]. Rotating successively deposited layers improves cell connections between molten pools [25]. In addition, the average cell size varies from the scanning strategy. According to Salman et al. [26], the stripe strategy leads to a lower average cell size linked to a smaller grain size.
The solidification process has a direct influence on microstructure formation. Grain growth, morphology, and orientation depend highly on the temperature gradient (G) and solidification rate (R) [27]. The solidification speed ratio (G/R) in laser-based material processing is high enough to facilitate planar and cellular growth [28]. Furthermore, as the magnitude of G×R increases, a refinement of the resulting grain is obtained.
The mechanical properties are intricately linked to the microstructure, particularly in laser powder bed fusion (LPBF). The rapid heating and cooling cycles induced by laser–material interactions in LPBF give rise to challenging-to-control mechanisms. These include the dimensions of the molten pool, Marangoni convection, unfused material, oxidation of the base material, and various other factors [8,29]. This behavior is repeated layer by layer, resulting in anisotropy.
On the other hand, one of the main requirements for using parts manufactured by LPBF is to obtain the highest relative density. Table 1 summarizes the relative density response of 316L SS fabricated by LPBF, highlighting the processing parameters, energy density, and machines/models. It is worth noting that previous work shows that both power and scanning speed are key factors in obtaining higher relative density [26,27,28,29,30,31,32,33,34,35].
In addition to the manufacturing parameters and scanning strategy, the base material properties are of great importance. The morphology of the powder is a crucial factor for its processability, where a spherical shape is preferred as it improves its fluidity and adhesion between layers. Yap et al. [3] found that an important parameter to consider is the laser absorption of the base material since it can be completely different from bulk materials compared to powder materials. In the case of aluminum and copper, due to their high reflectivity and thermal conductivity, irregularities are generated in the molten zone, generating residual stresses that cause the material to contract and, in combination with existing porosities, cause cracking and delamination [27]. Given that 316L SS powder has adequate properties for its processability and excellent resistance to oxidation and corrosion, it is one of the most used materials in AM.
With the motivation to determine the effect of laser power, scanning speed, and hatch spacing over the relative density, microhardness, and microstructure, a full factorial study was designed and statistically analyzed.

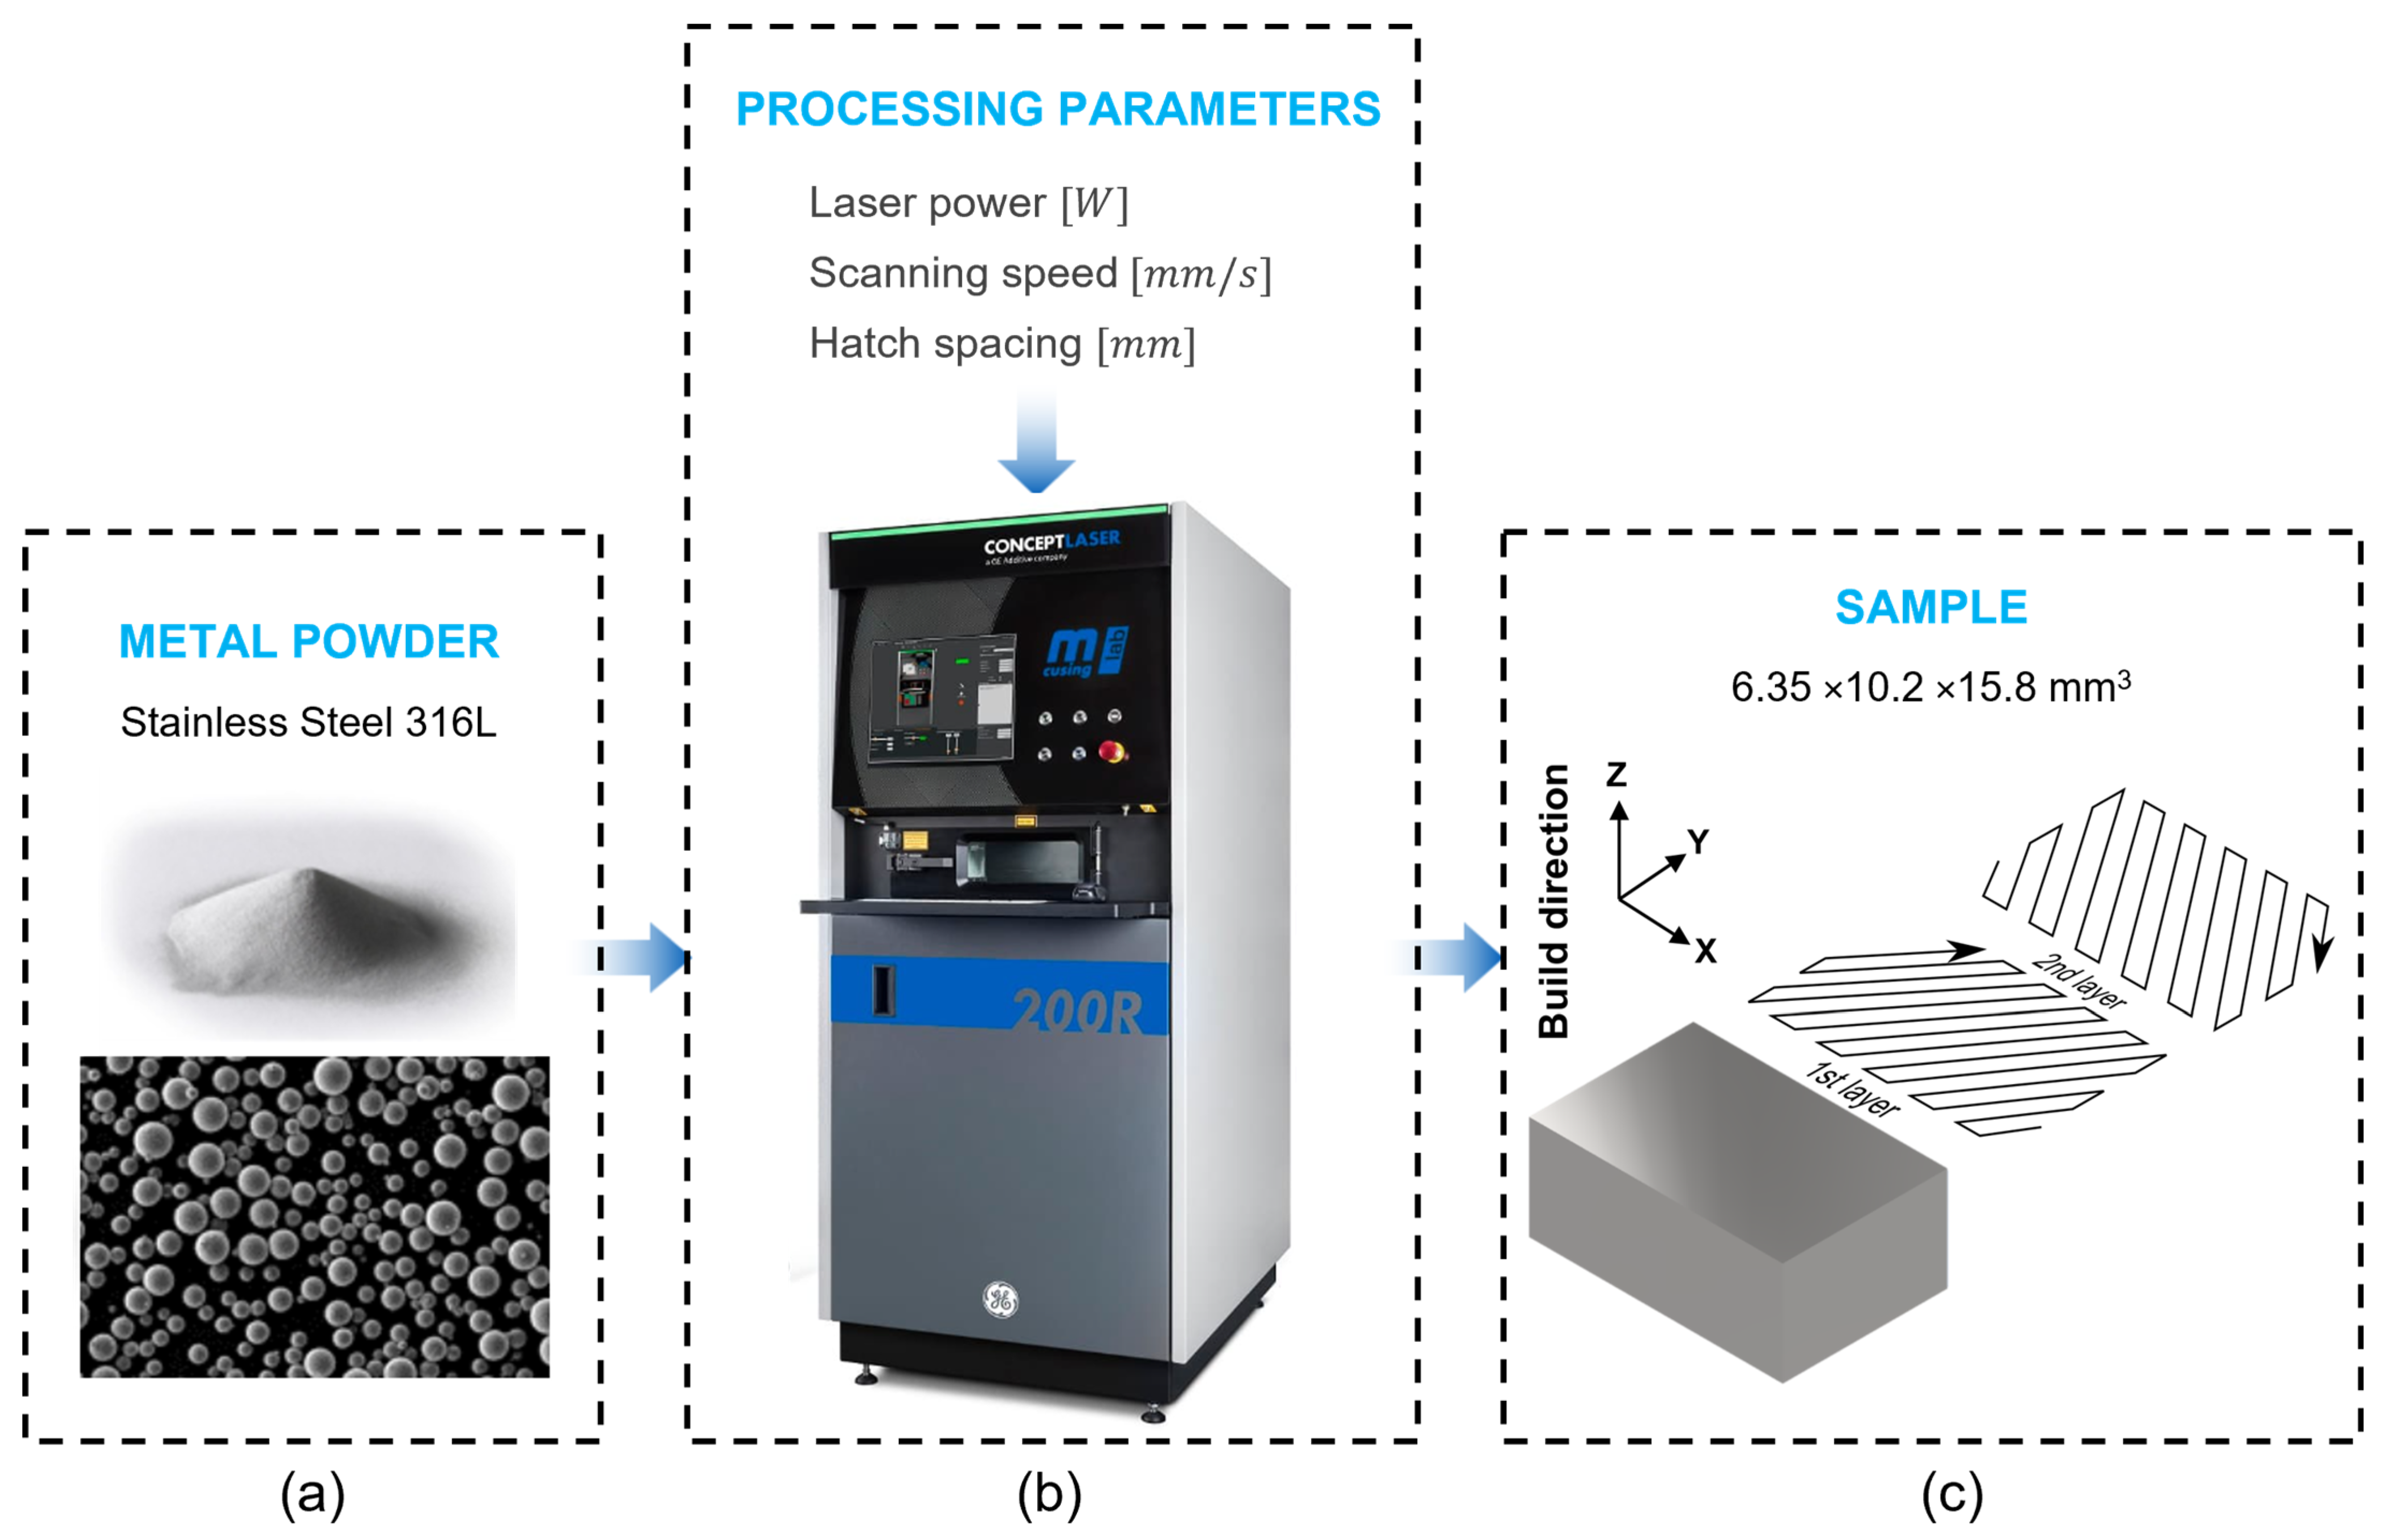
2. Materials and Methods

Austenite stainless steel metallic powders grade AISI 316L was provided by General Electric Additive, with a powder size distribution from 20 to 50 µm, an average of 31 µm; the nominal composition is detailed in Table 2.
Prismatic samples measuring 15.8 × 10.2 × 6.35 mm³ (Figure 1) were fabricated using a Concept Laser equipment model MLAB 200R through laser powder bed fusion (LPBF). The equipment has a 200 W (Nb: YAG) fiber laser featuring a focused beam diameter of approximately 80 μm and a wavelength of 1070 nm. The working chamber was sealed during operation and supplied high-purity nitrogen, reducing the oxygen content to less than 800 ppm. The powders were deposited on a 16 mm thick 316L stainless-steel support plate of 100 mm × 100 mm in area. The processing parameters are reported in Table 3. A meander scan pattern was employed, with the scan direction rotated by 67° in each successive layer.
A full factorial study of three factors at three levels was designed (Table 3); the design of experiment (DOE) levels was obtained based on previous work [6,10] to maximize relative density. A constant layer thickness of 30 µm was employed since it coincides with the average size distribution of the powder. Two replicates of each experimental run were carried out to ensure the reliability of the results.
The results derived from the experimental work were assessed using Minitab 19®. An analysis of variance (ANOVA) was performed to identify the primary effects, analyze their interaction graphs, and assess the contribution of each factor.
The surface roughness (Ra) of the printed samples was measured on each face using a roughness tester (SRT-6200, Merit-mi) with a resolution of 0.001 μm.
The chemical composition of the printed samples was determined by glow discharge emission spectrometry (GDOES) bulk analysis (GDA 750 HR, Spectruma Analytik GmbH, Hof, Germany). The average of three spots on three samples was recorded.
The relative density (RD) of each sample was determined using Archimedes’ principle on distilled water by Equation (2):
R D   % = m a × ρ w m a m w 100 ρ S S
where ma is the mass of the sample in the air, ρw is the density of the distilled water, mw is the mass of the distilled water, and ρSS is the theoretical density of 316L SS.
For the metallographic analysis, the samples were first ground using SiC paper for metallographic inspection, starting from 120 down to 2000 grit, and then finely polished using diamond paste. The microstructure was revealed by chemical etching immersion in Aqua regia solution (20 mL HNO3 and 60 mL HCl) for 50 s. Surface morphology was inspected by optical microscopy (OM) (MEIJI IM 7200). For the analysis by scanning electron microscopy (SEM), (TESCAN—MIRA 3) equipped with energy-dispersive spectroscopy (EDS) was used. The OM and SEM micrographs were processed and analyzed using Fiji software (National Institutes of Health, MD, USA) to study microstructural features and evaluate porosity through the threshold tool [40].
Microhardness was evaluated using a Vickers automated hardness tester (TUKON 2500), using 500 g force and 10 s dwell time, applying the ASTM E384 standard. Mean values were recorded through five measurements.

3. Results

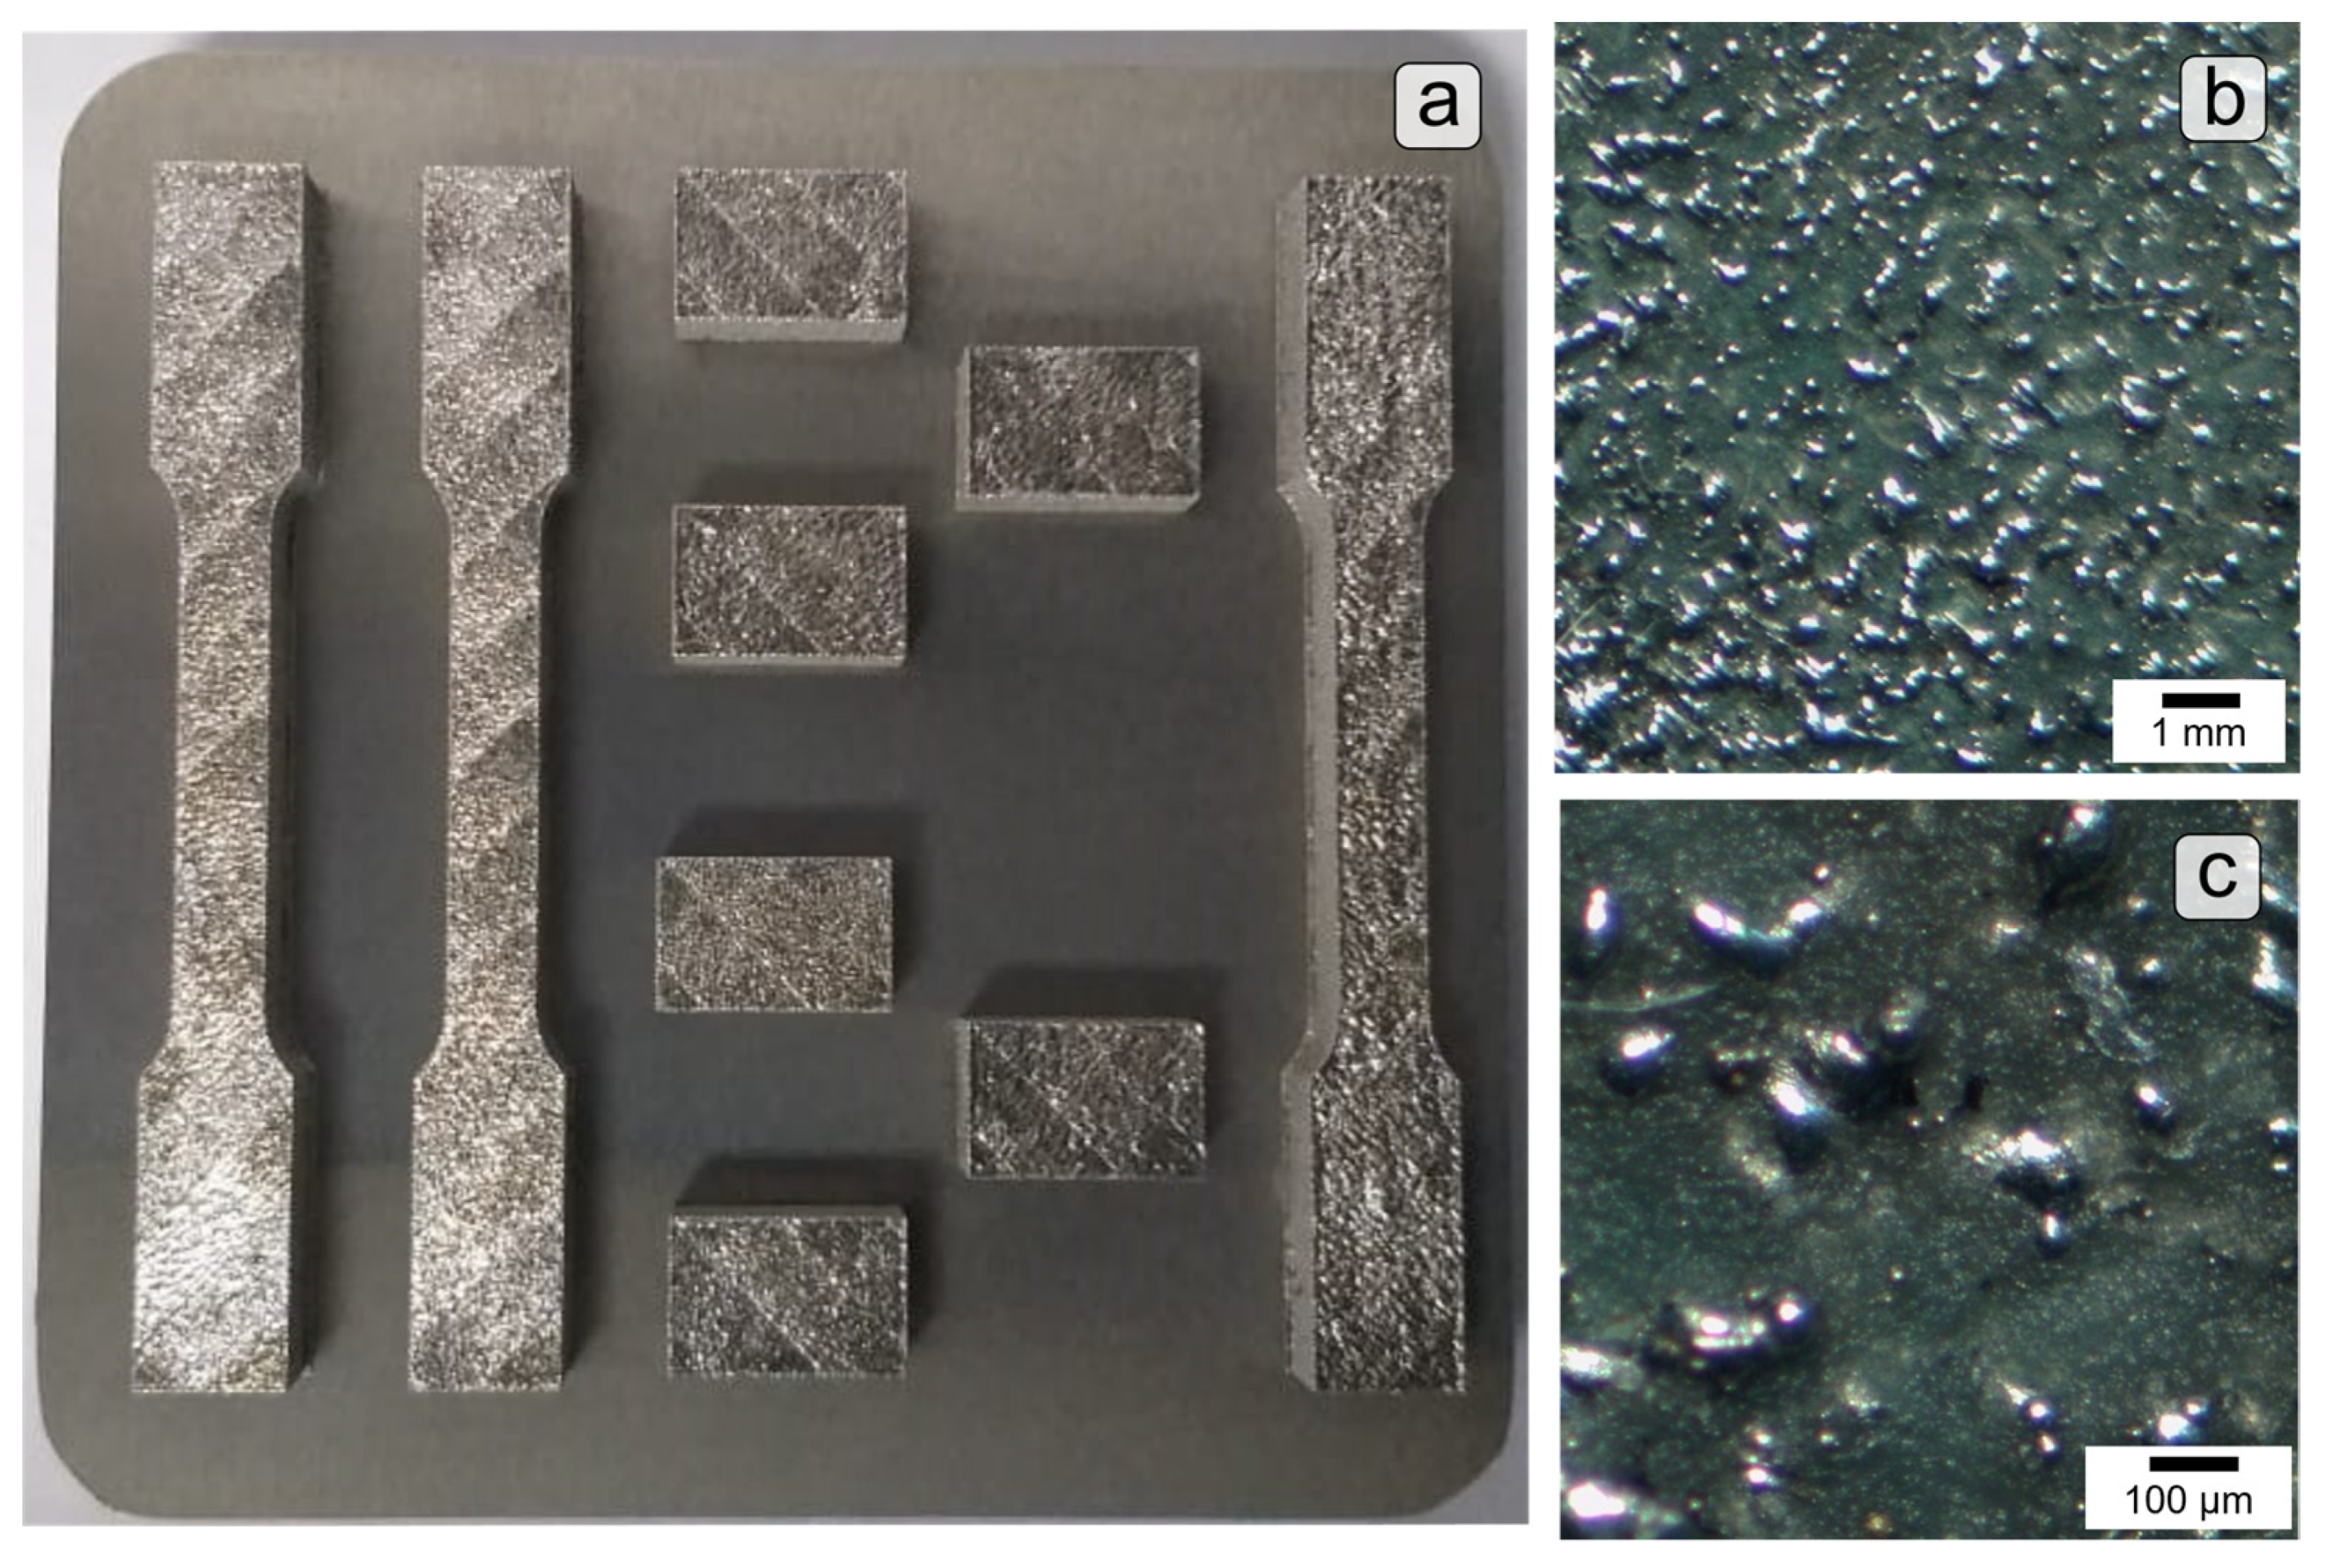
3.1. Surface Roughness

Figure 2a shows the printed samples, where the first characteristic that stands out is the poor surface quality. Figure 2b,c show a magnification of 5 and 60×, respectively, to appreciate the balling formation on the surface of the additively manufactured specimens. The as-built roughness (Ra) at the surfaces was around 10 ± 2 μm.

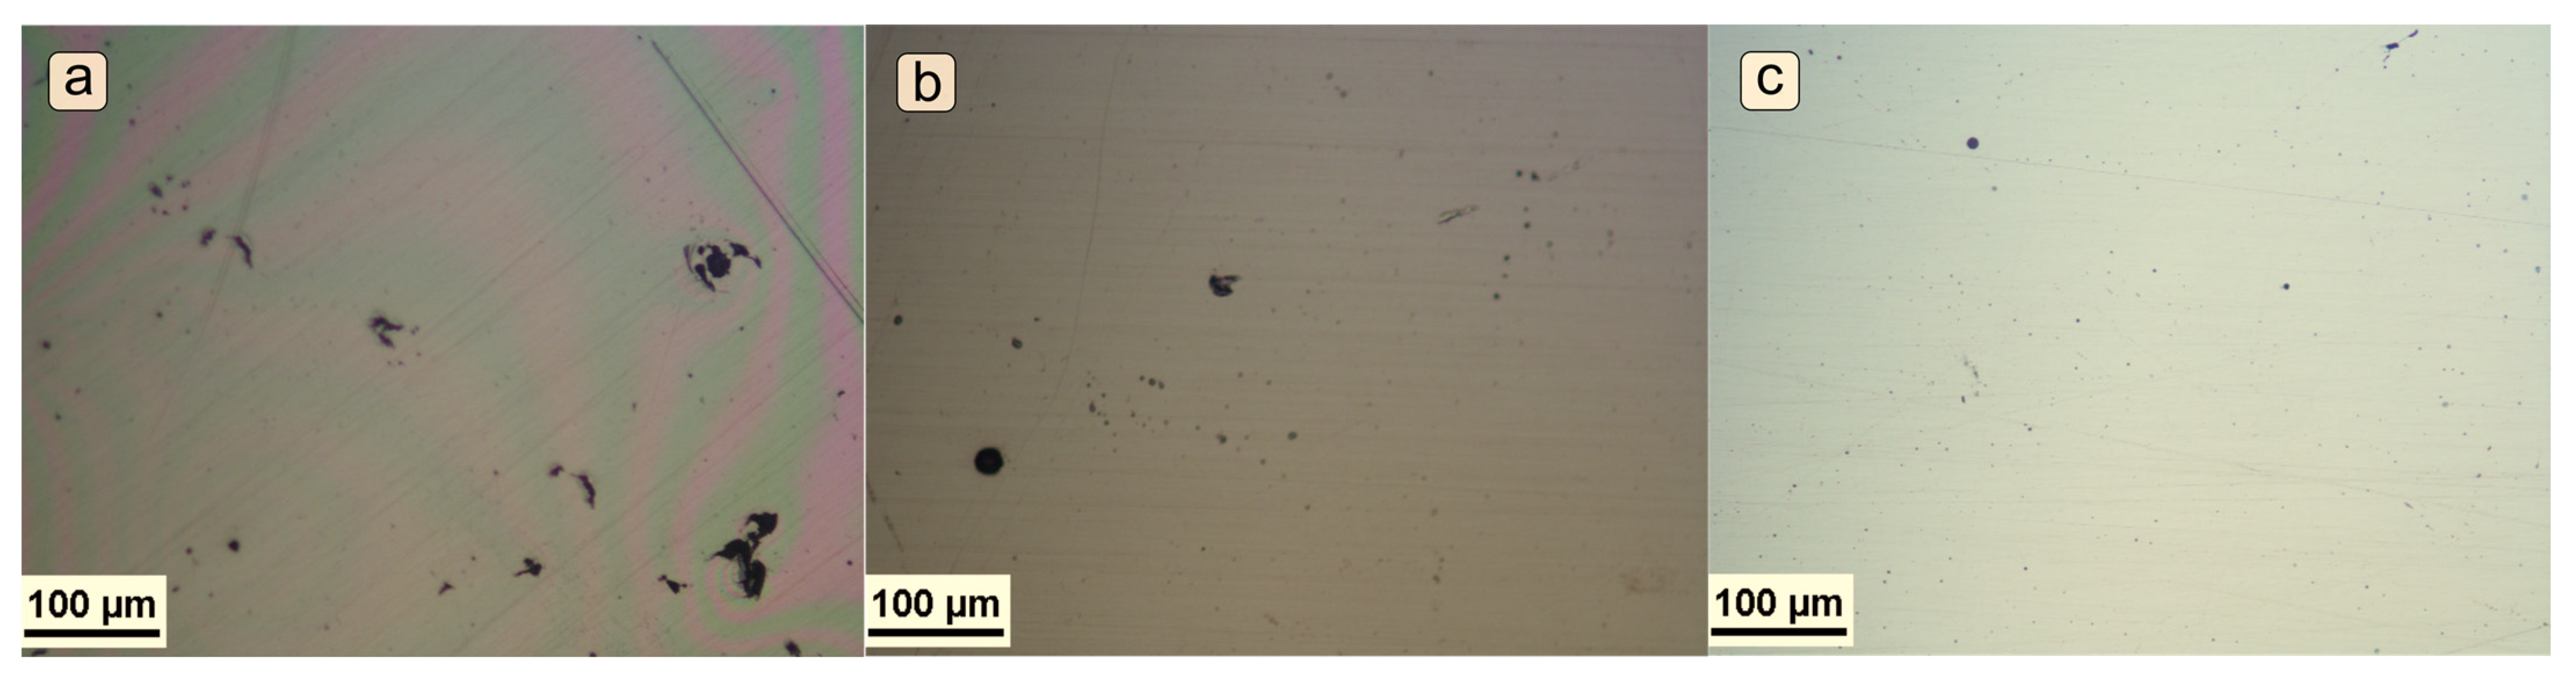
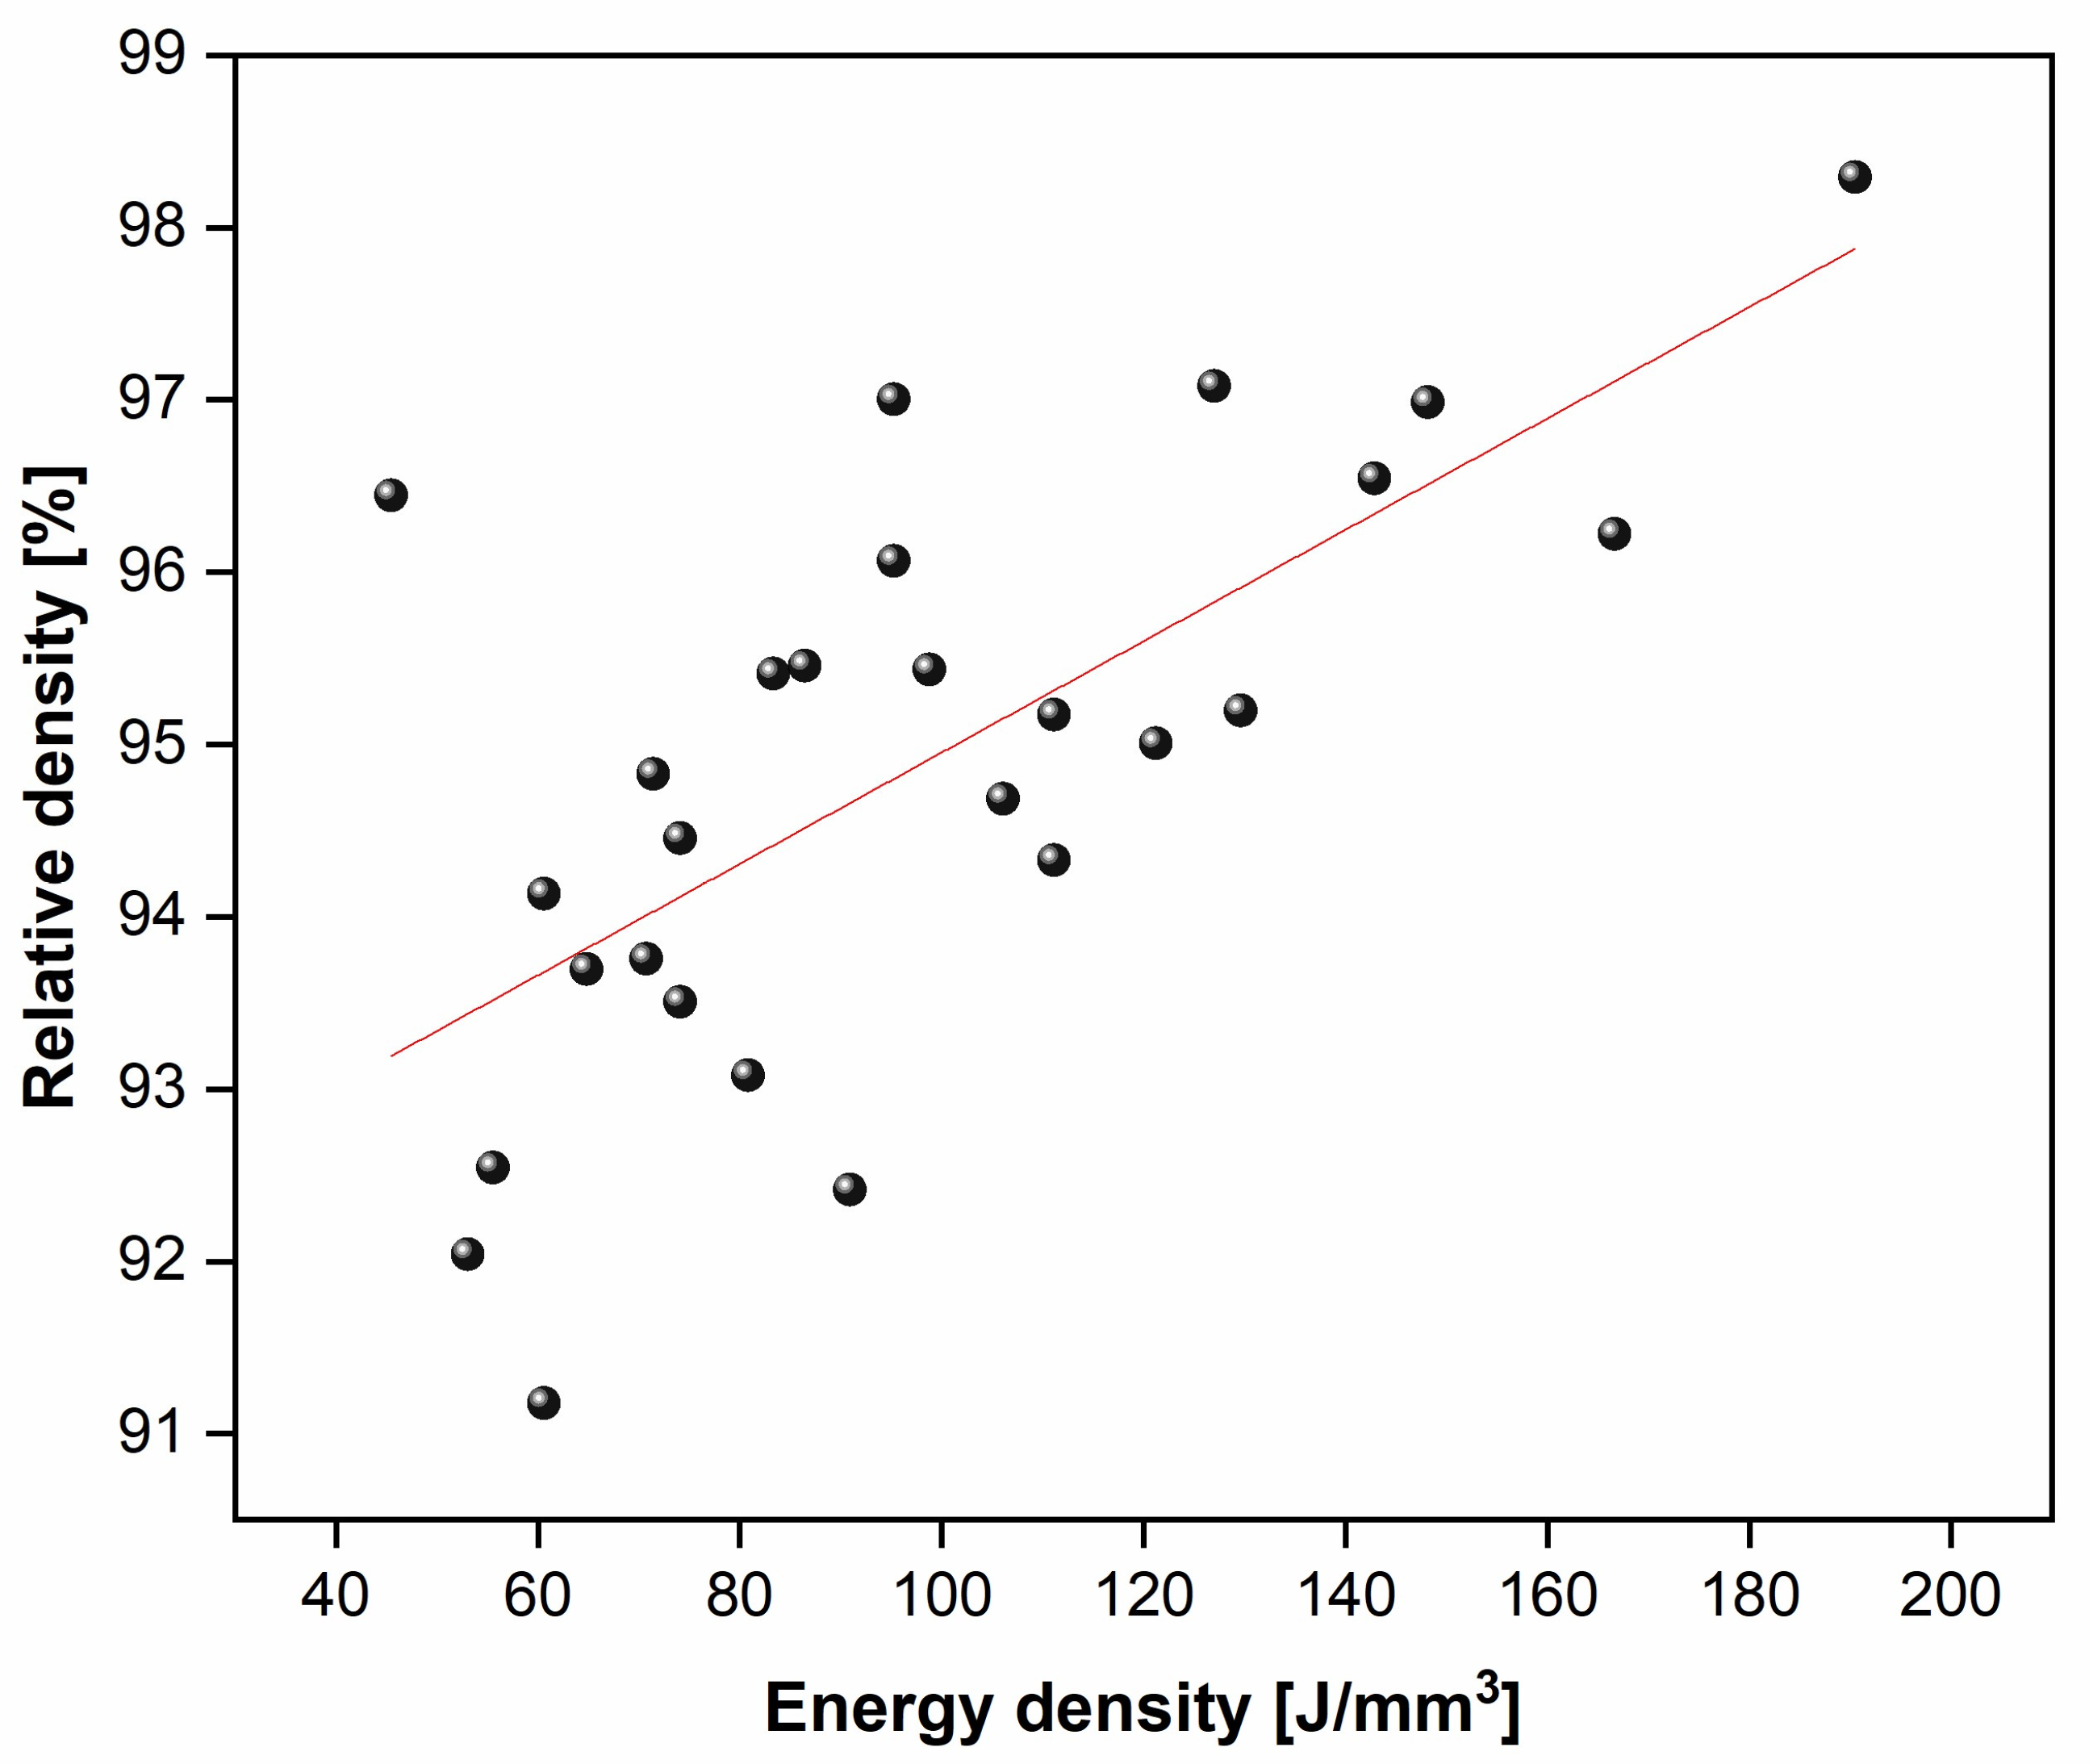
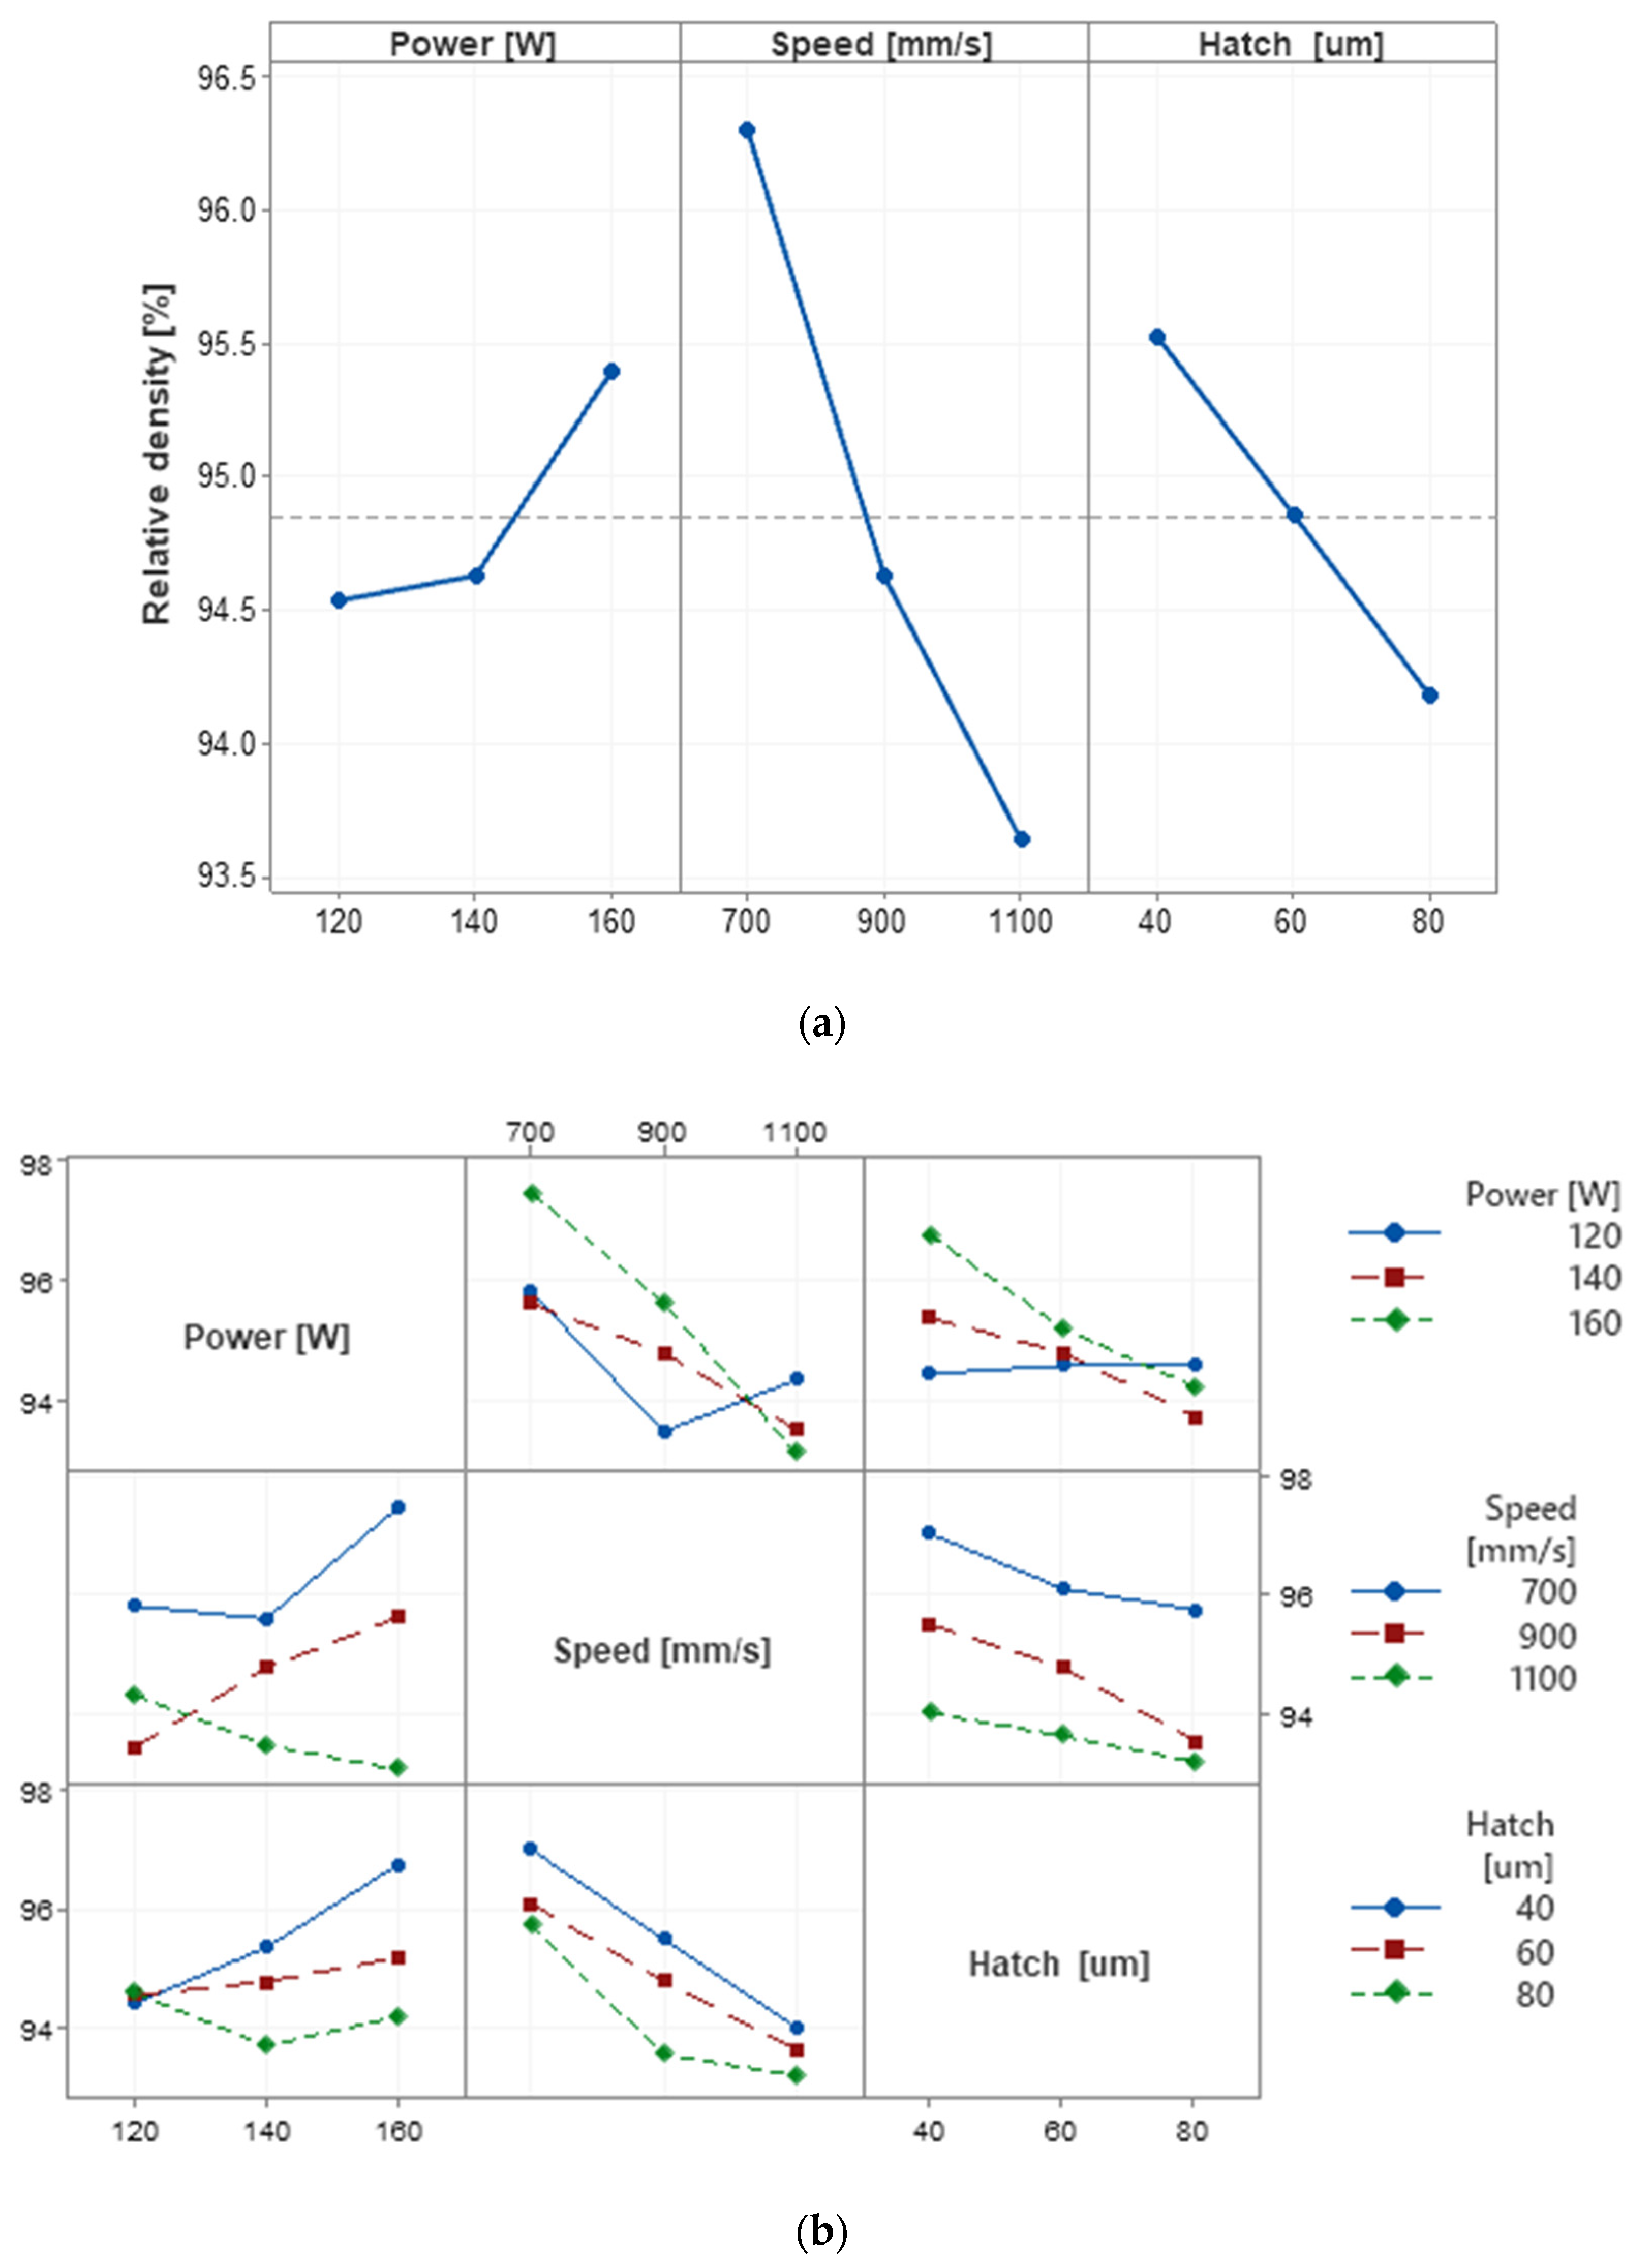
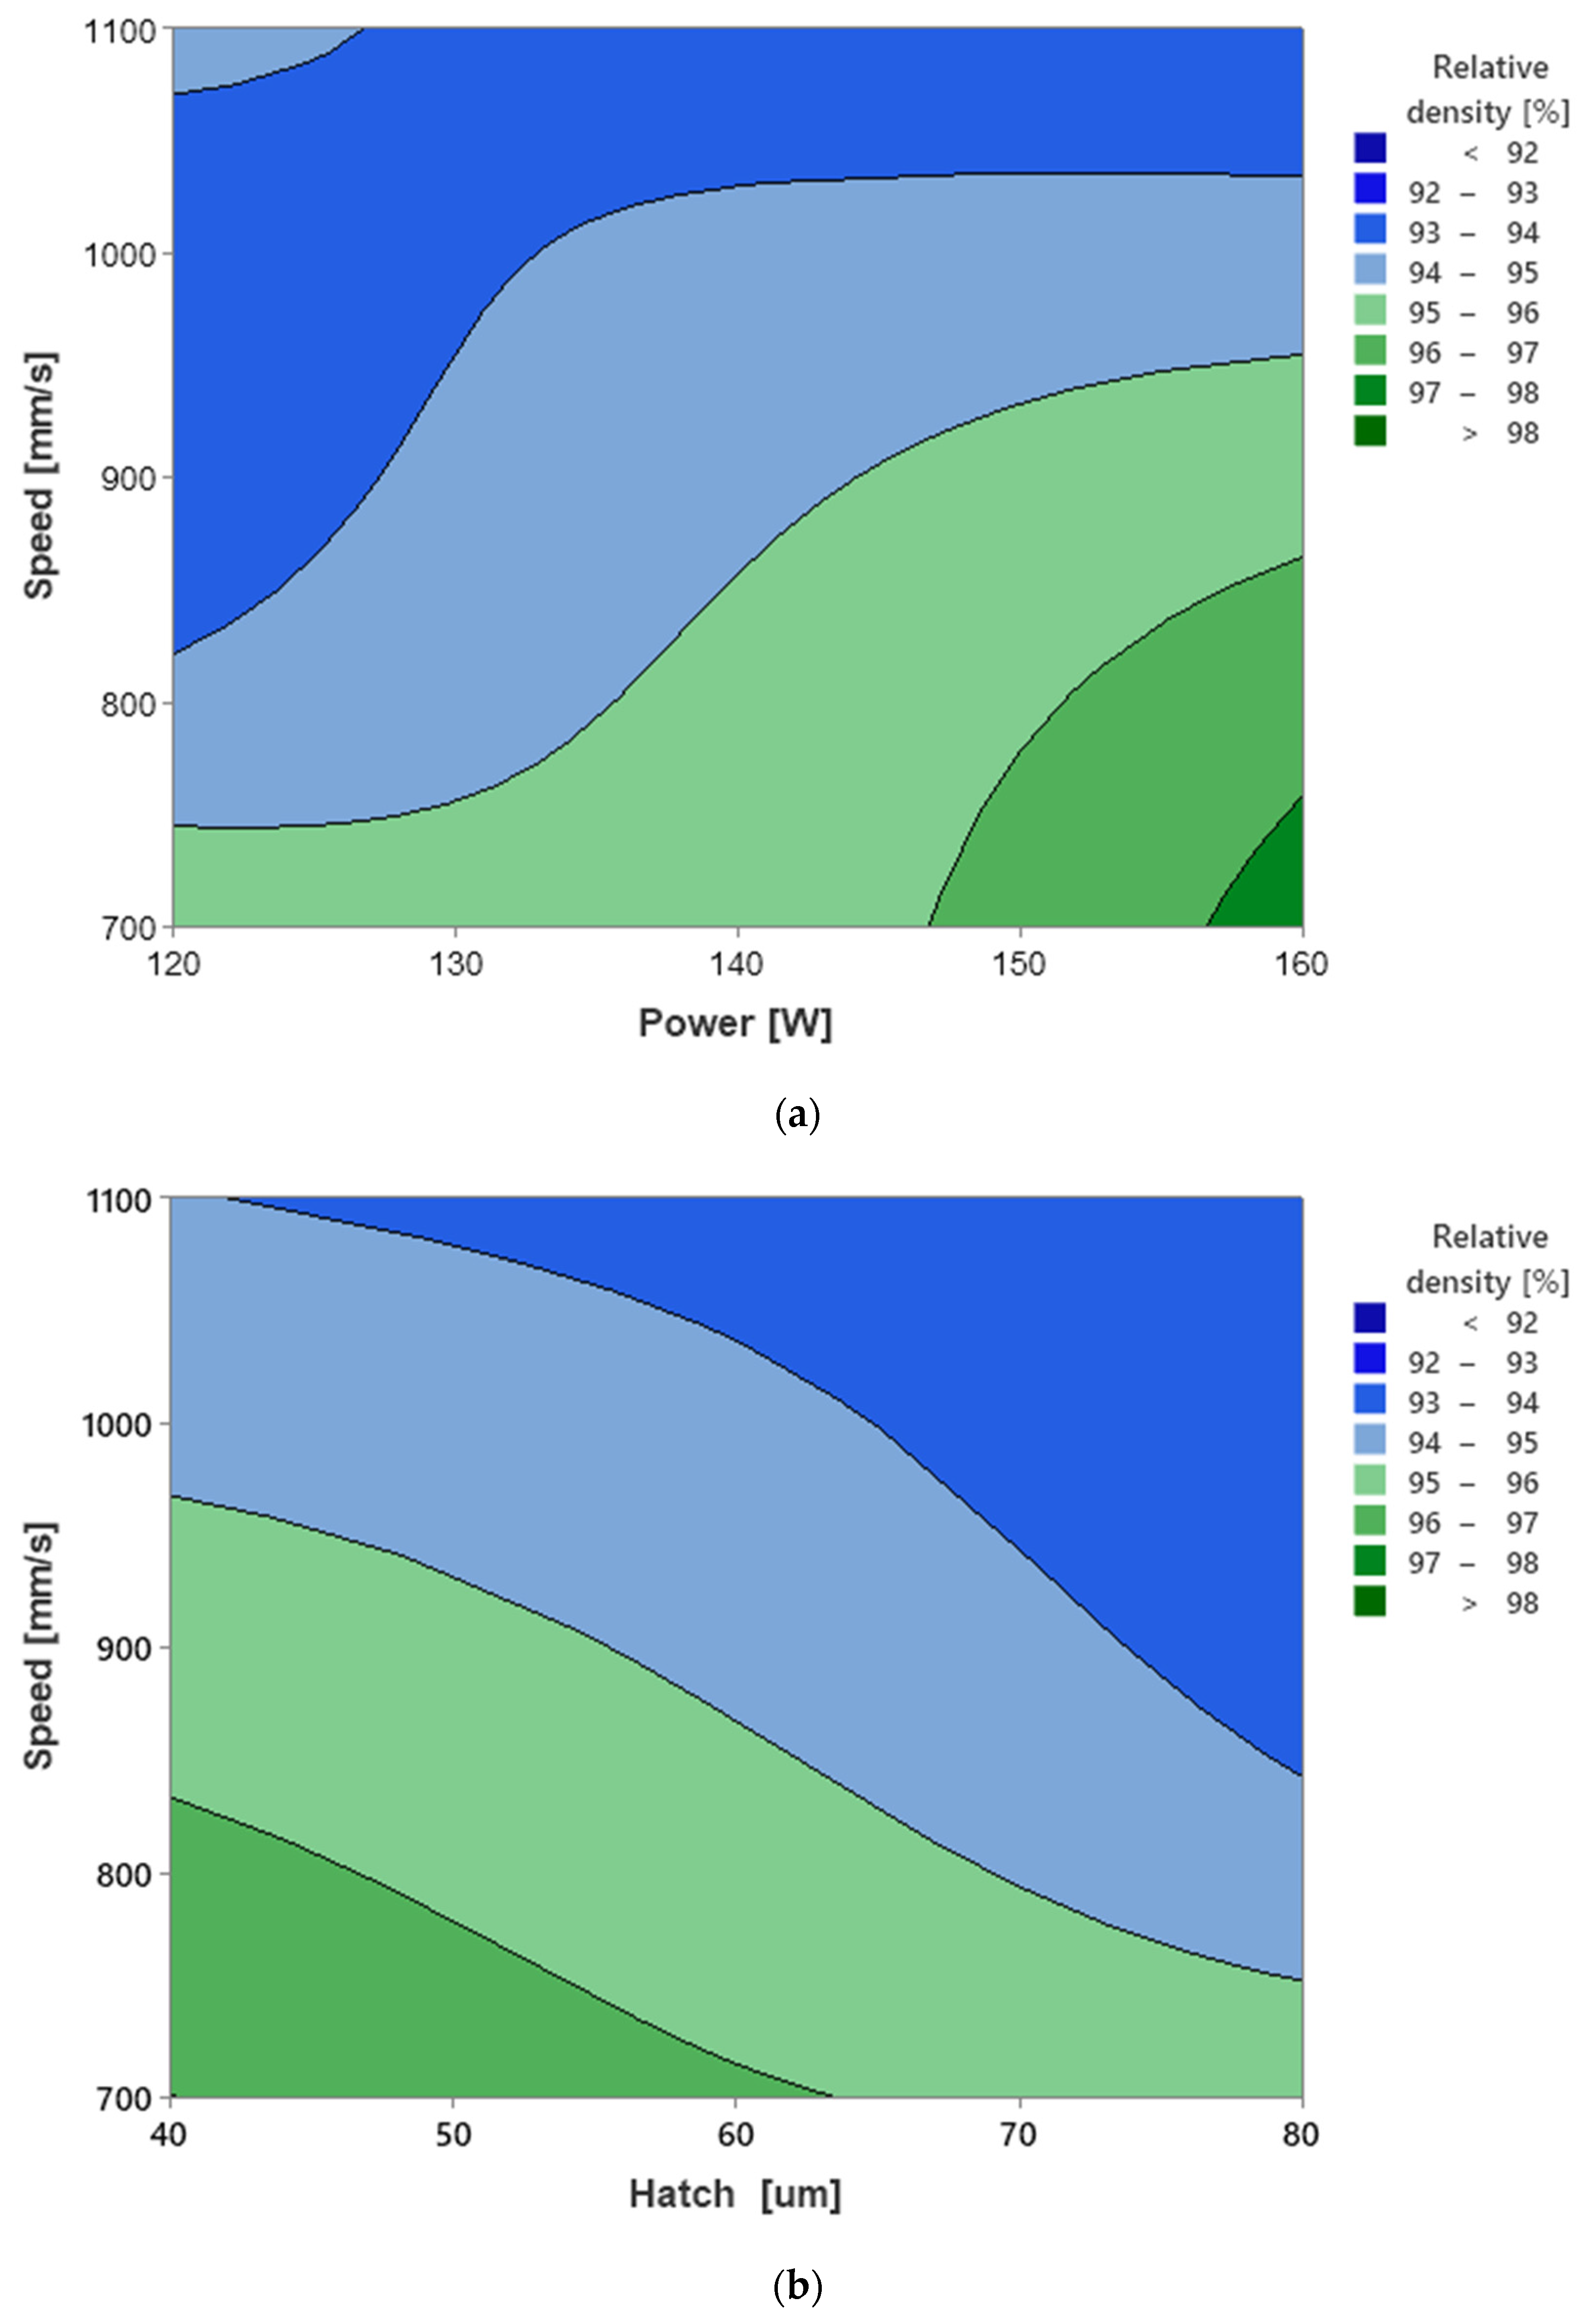
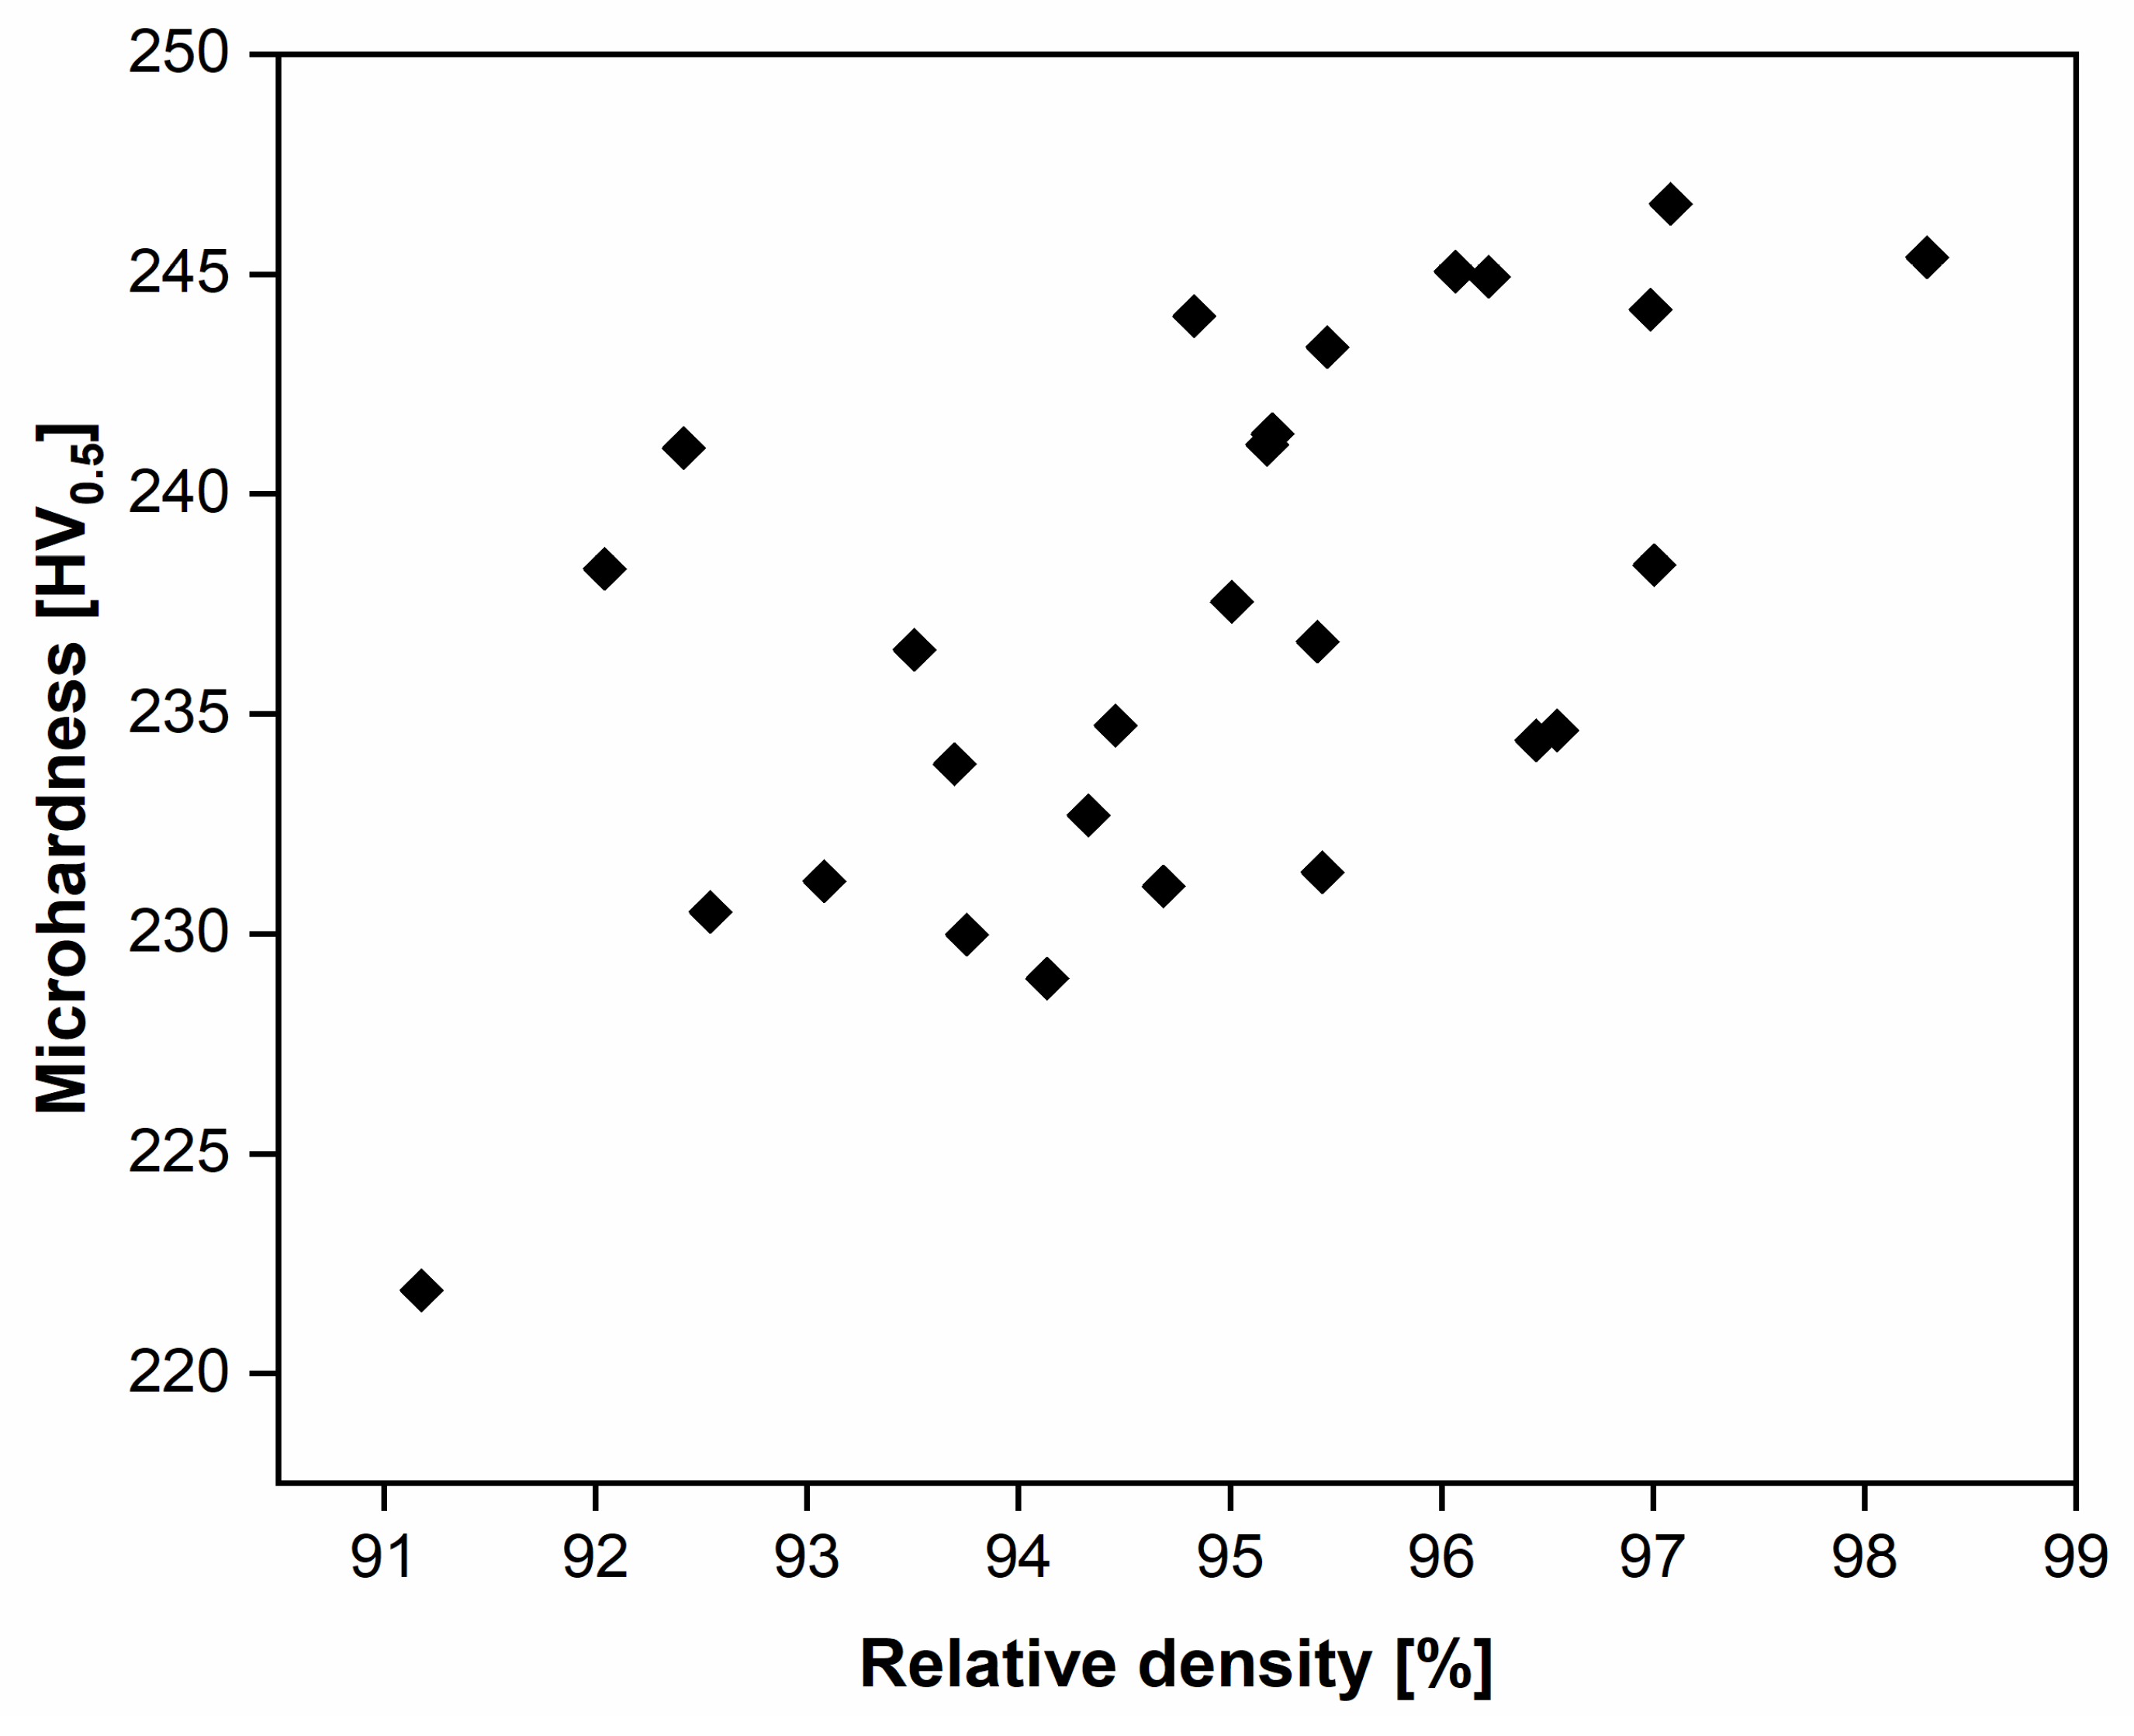
3.2. Relative Density Assessment

The sample with the highest densification (98.3%) was produced with the following parameters: laser power of 160 W, scanning speed of 700 mm/s, and a hatch spacing of 40 µm. The specimens manufactured at a lower scanning speed have a higher relative density (RD). The average RD at 700 m/s is 96.29 ± 1.02%, the RD at 900 mm/s is 94.62 ± 1.24%, and the RD at the highest speed was 93.64 ± 1.55%.
Figure 3 shows a representative image of the porosity level, illustrating the scanning speed effect on the processed samples. At the same laser power (160 W) and hatch spacing (40 µm) but at different scanning speeds, at a scanning speed of 1100 mm/s, there were irregular porosities due to insufficient VED to melt the metal powders, which can compromise the mechanical properties and integrity of the parts (Figure 3a). Figure 3b shows round porosities associated with gas entrapped inside the metal powder, which can also affect the structural performance of the samples [41]. Finally, Figure 3c shows a more homogenous surface topography (700 mm/s). The cross-section porosity measured by image analysis shows a relative density of 96.68%, 97.41%, and 99.70%, respectively.
Figure 4 shows that a higher relative density is obtained as the volumetric energy density increases. It is worth noting that despite having VED with close values, the relative density results vary. This is because some processing parameters have a greater influence on the relative density, as detailed in Table 4. It should be noted that these results are specific to the manufacturing equipment used. Therefore, higher VED can be obtained with the same scanning speed and hatch spacing parameters in higher-power laser equipment. In addition, the geometry and the scanning strategy also influence the densification of the specimens.
Table 4 shows the results of the analysis of variance (ANOVA), where the scanning speed appears as the only statistically significant factor (p-value < 0.005). These results validate the observations presented in Figure 3.
Figure 5 illustrates the effect of each factor on the relative density and the interaction between processing parameters. Figure 5a shows that the slope of speed is steeper with respect to power and hatch. Therefore, its effect on the relative density is greater. With regard to the effect of hatching, it is observed that the slope does not change and maintains the trend, i.e., the lower the hatch, the higher the density. As for the power, when it increases from 140 to 160 W, there is an increase in slope, becoming a main effect. Figure 5b presents the interaction between factors. The only visible interaction is between power and speed. However, the trend is clear: the higher the power and the lower the speed, the higher the relative density.
Figure 6 shows the contour plots of the interaction between scanning speed with laser power and hatch spacing. In Figure 6a, the highest relative density was obtained with the lowest speed and the highest power. In Figure 6b, the highest relative density was obtained with the lowest speed and hatch spacing.

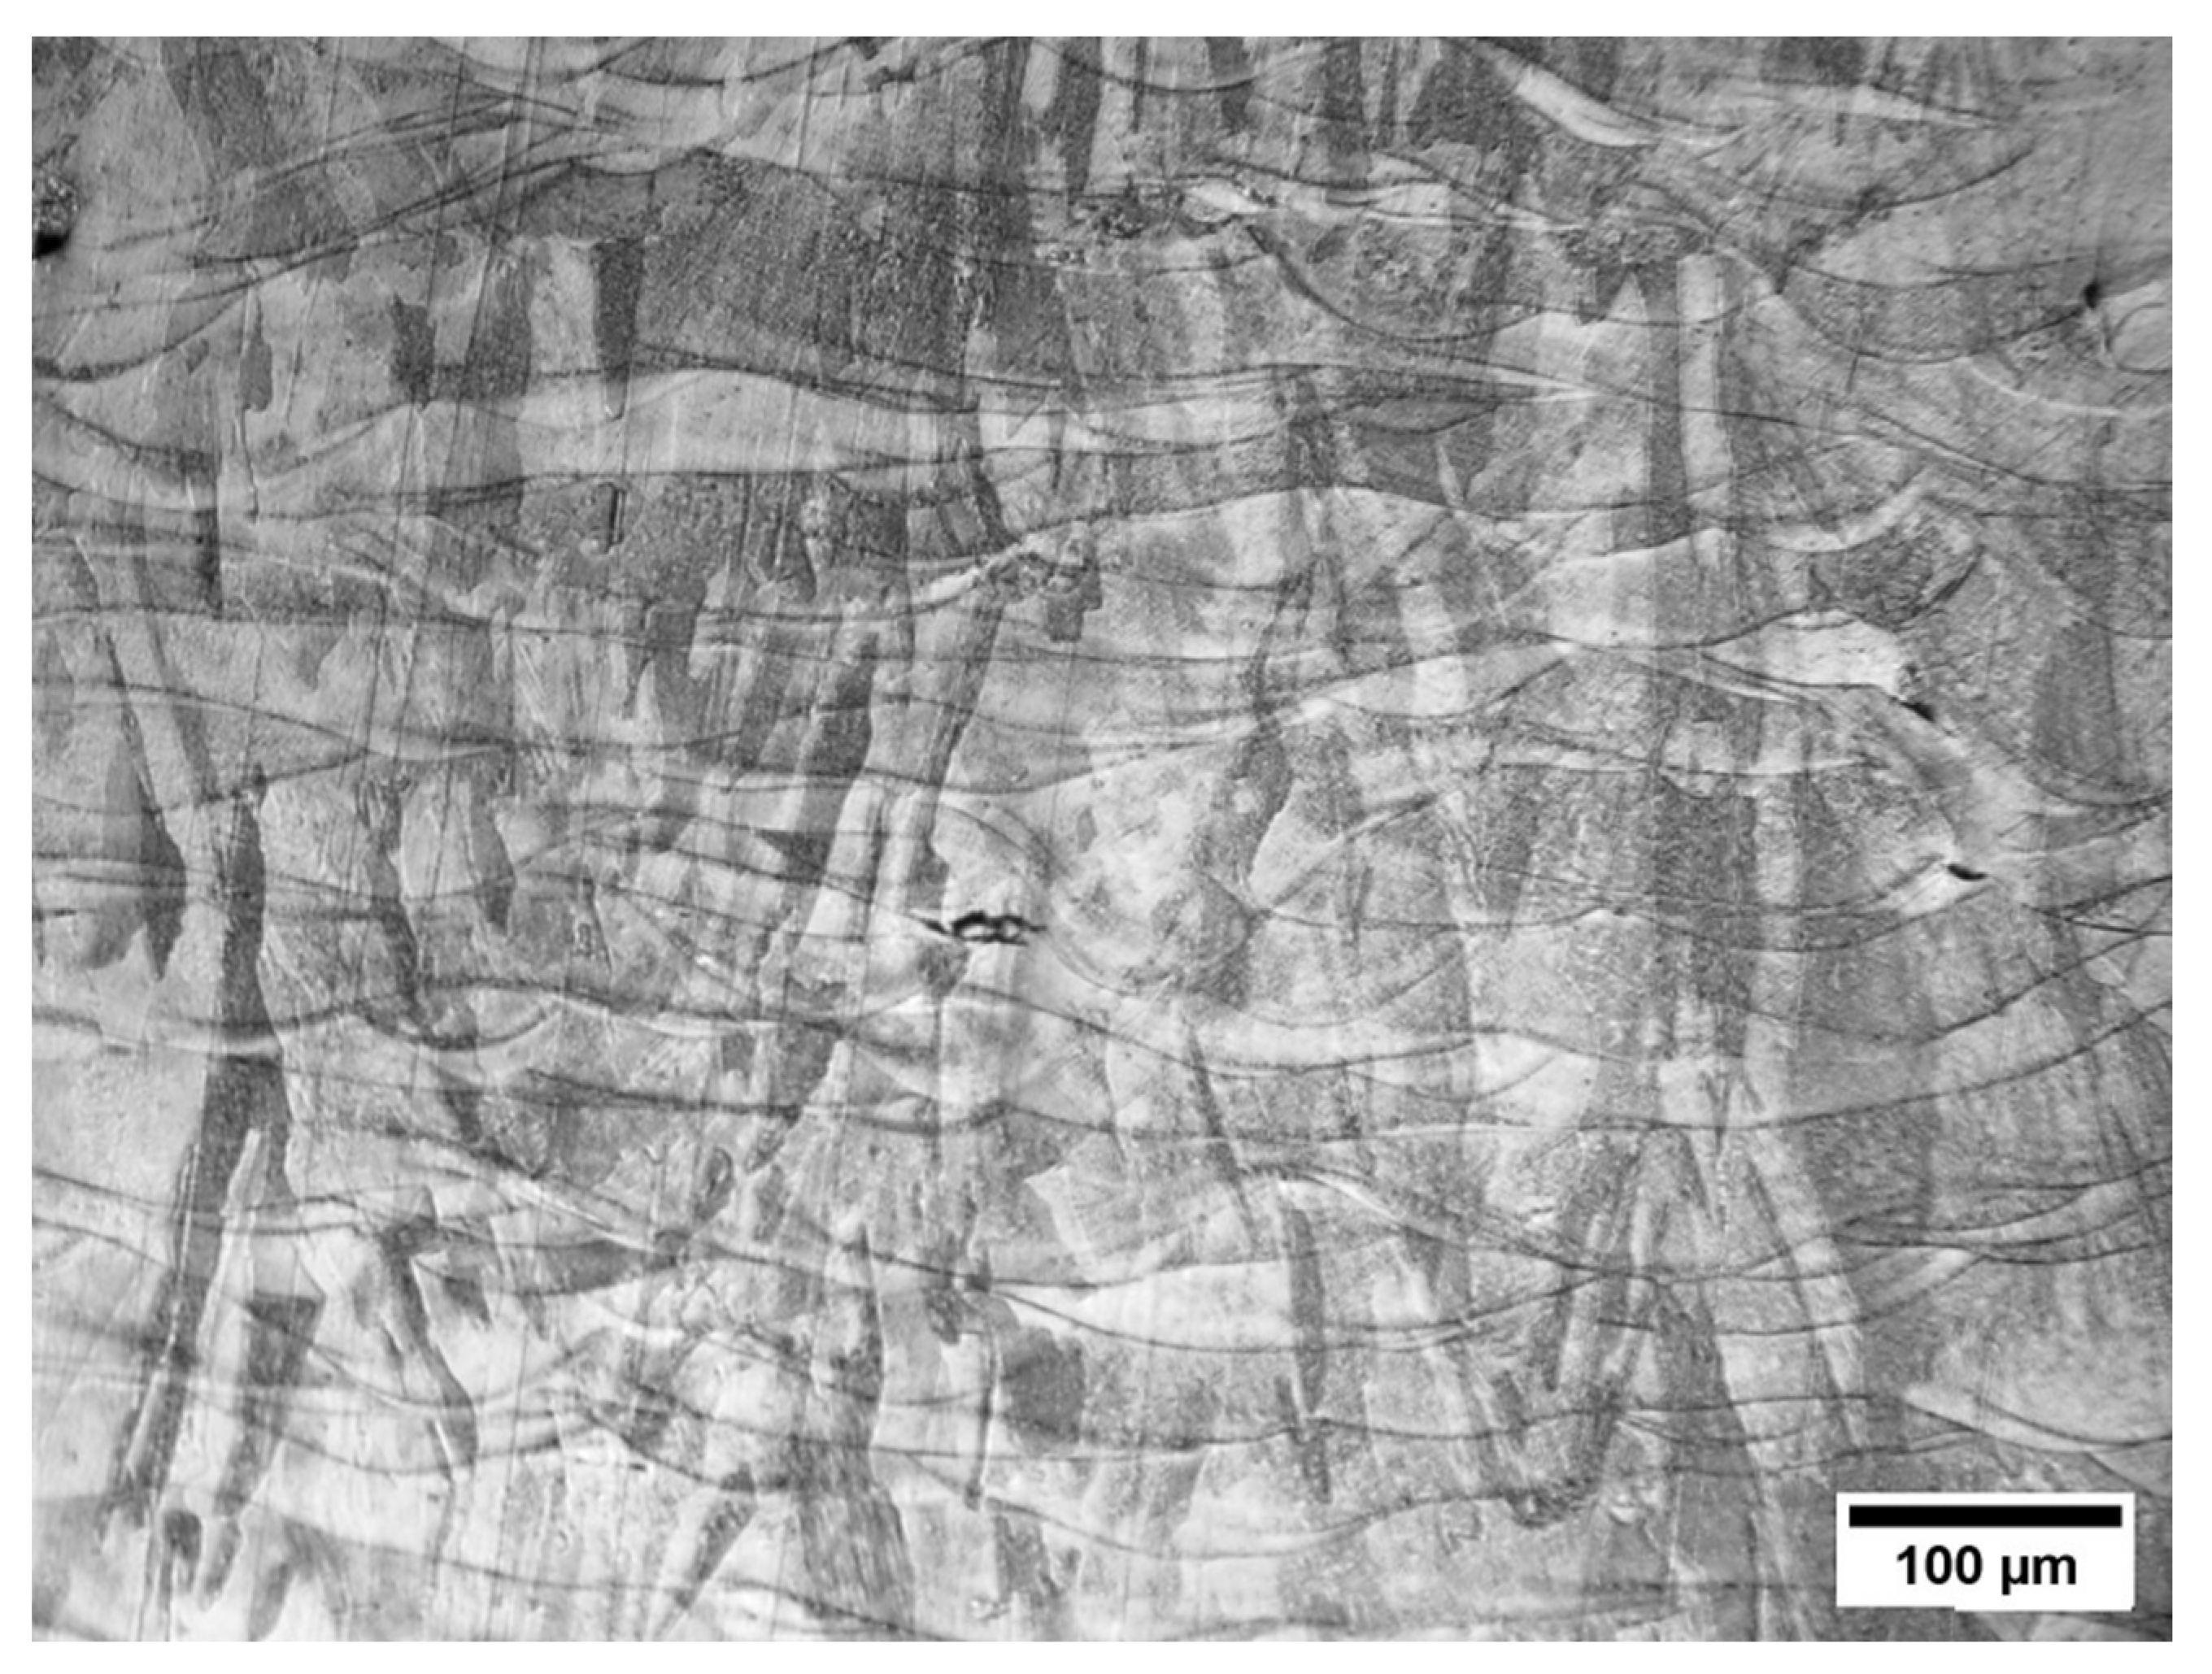
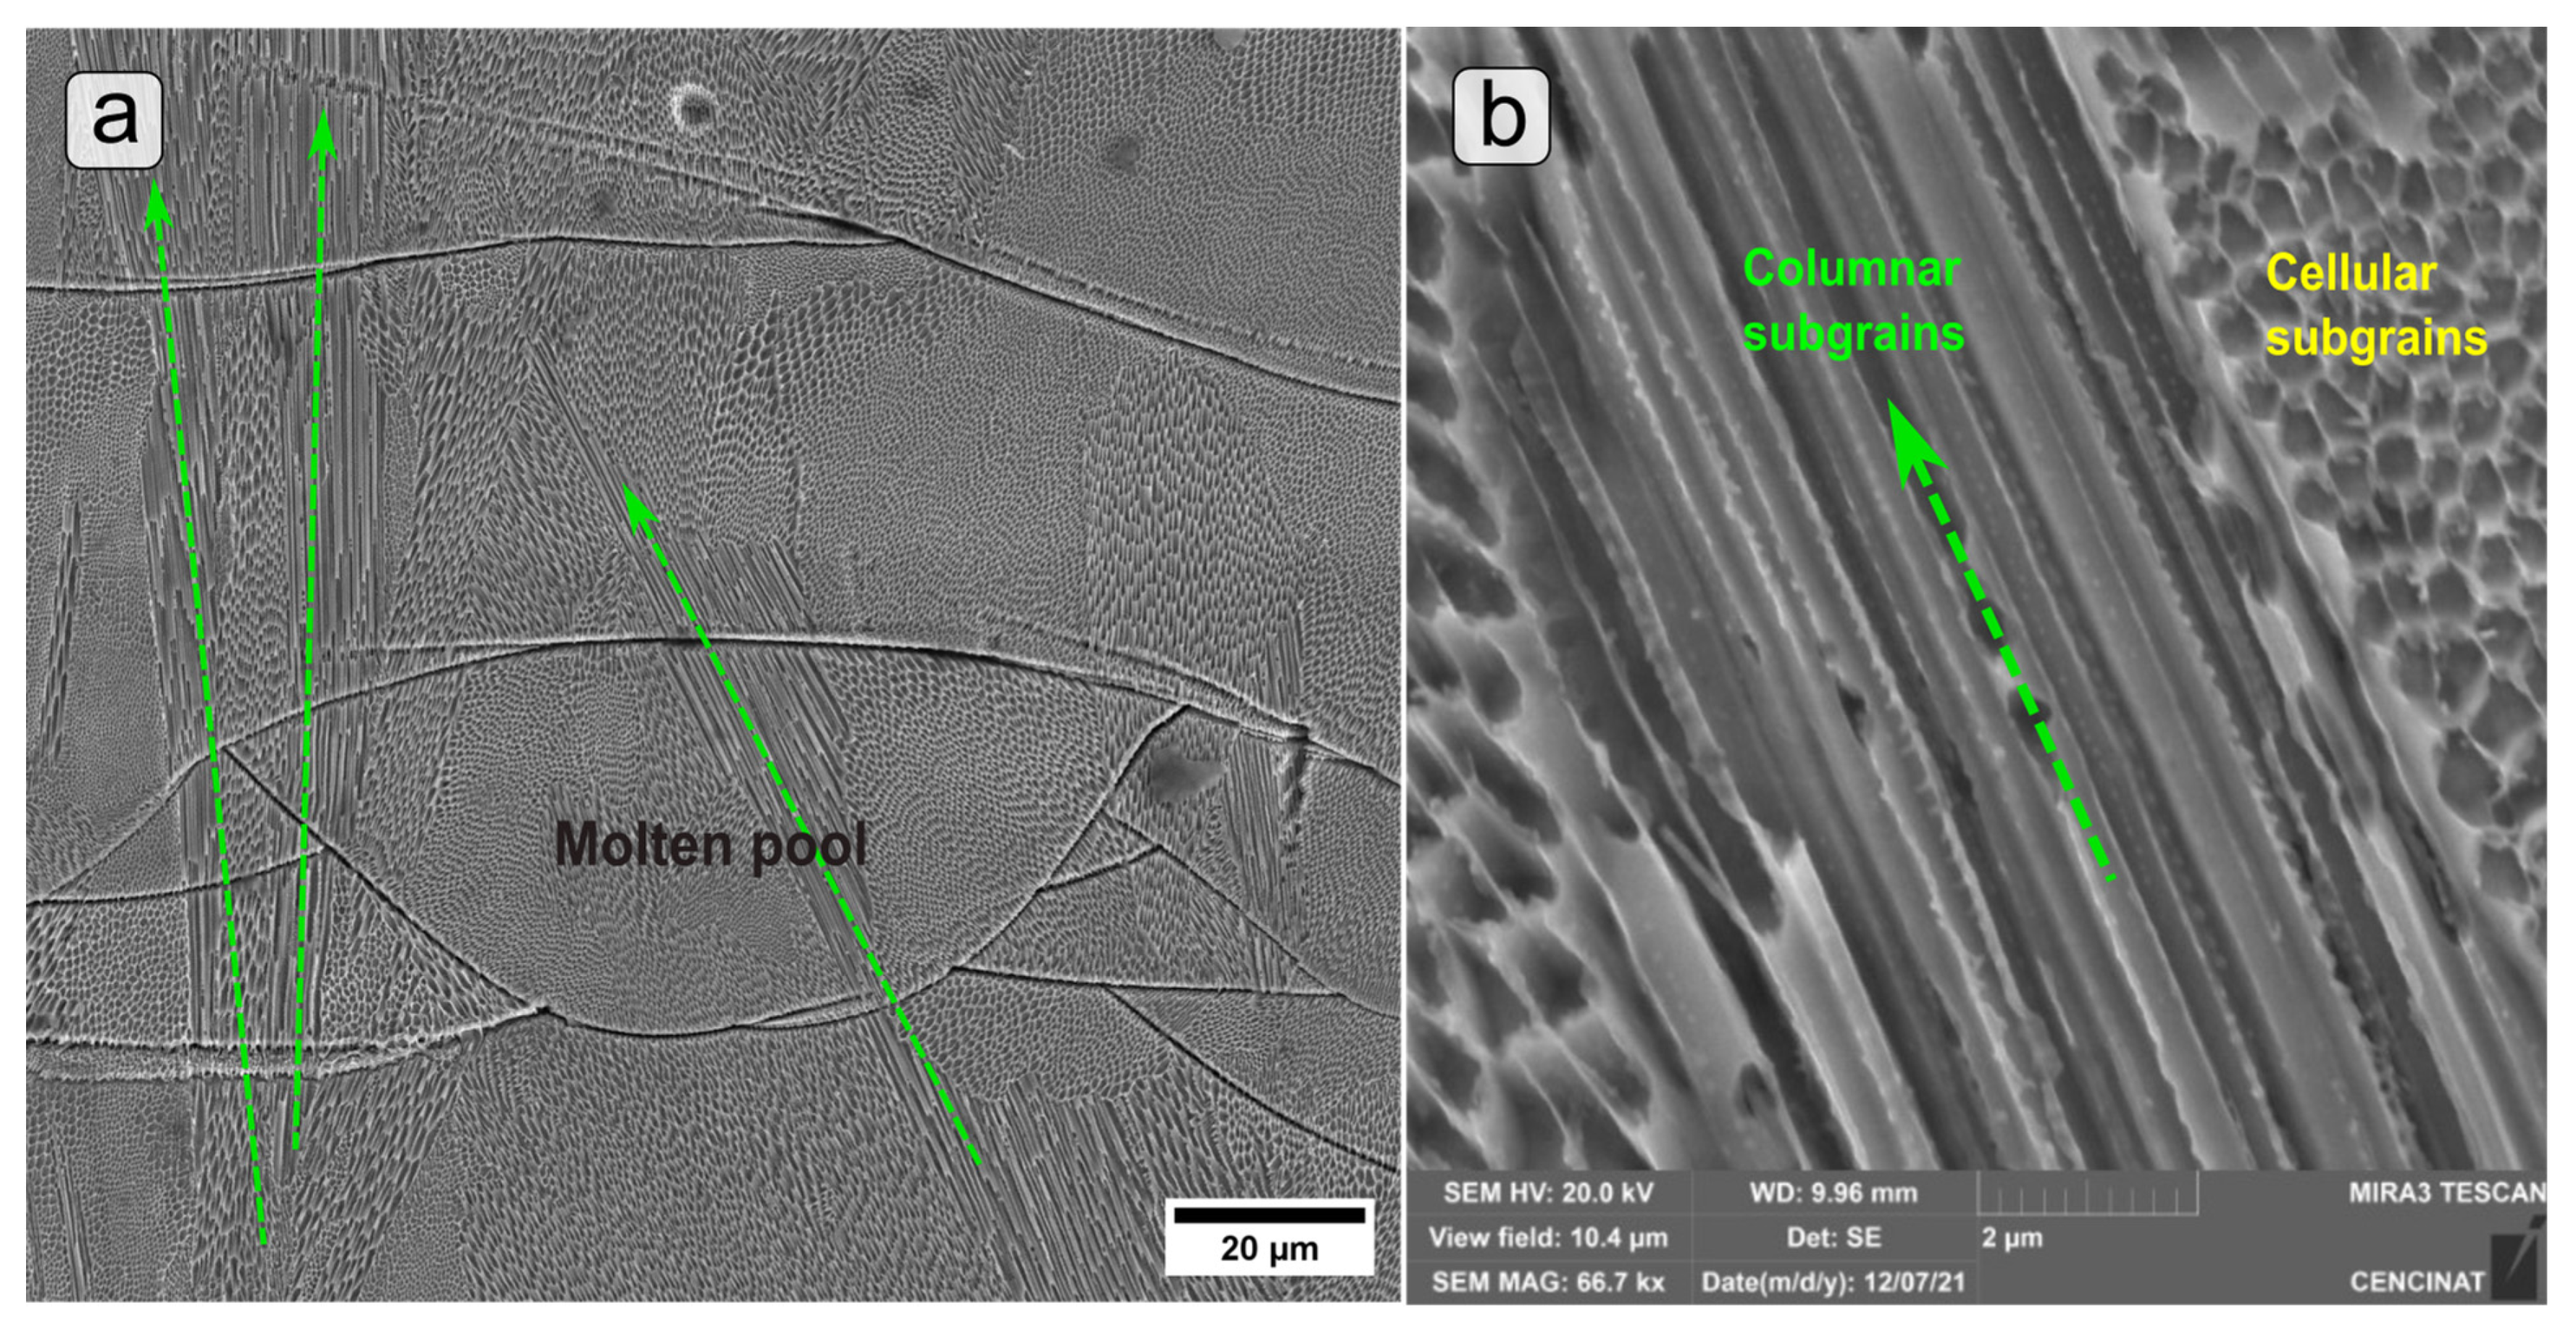
3.3. Microstructure Evaluation
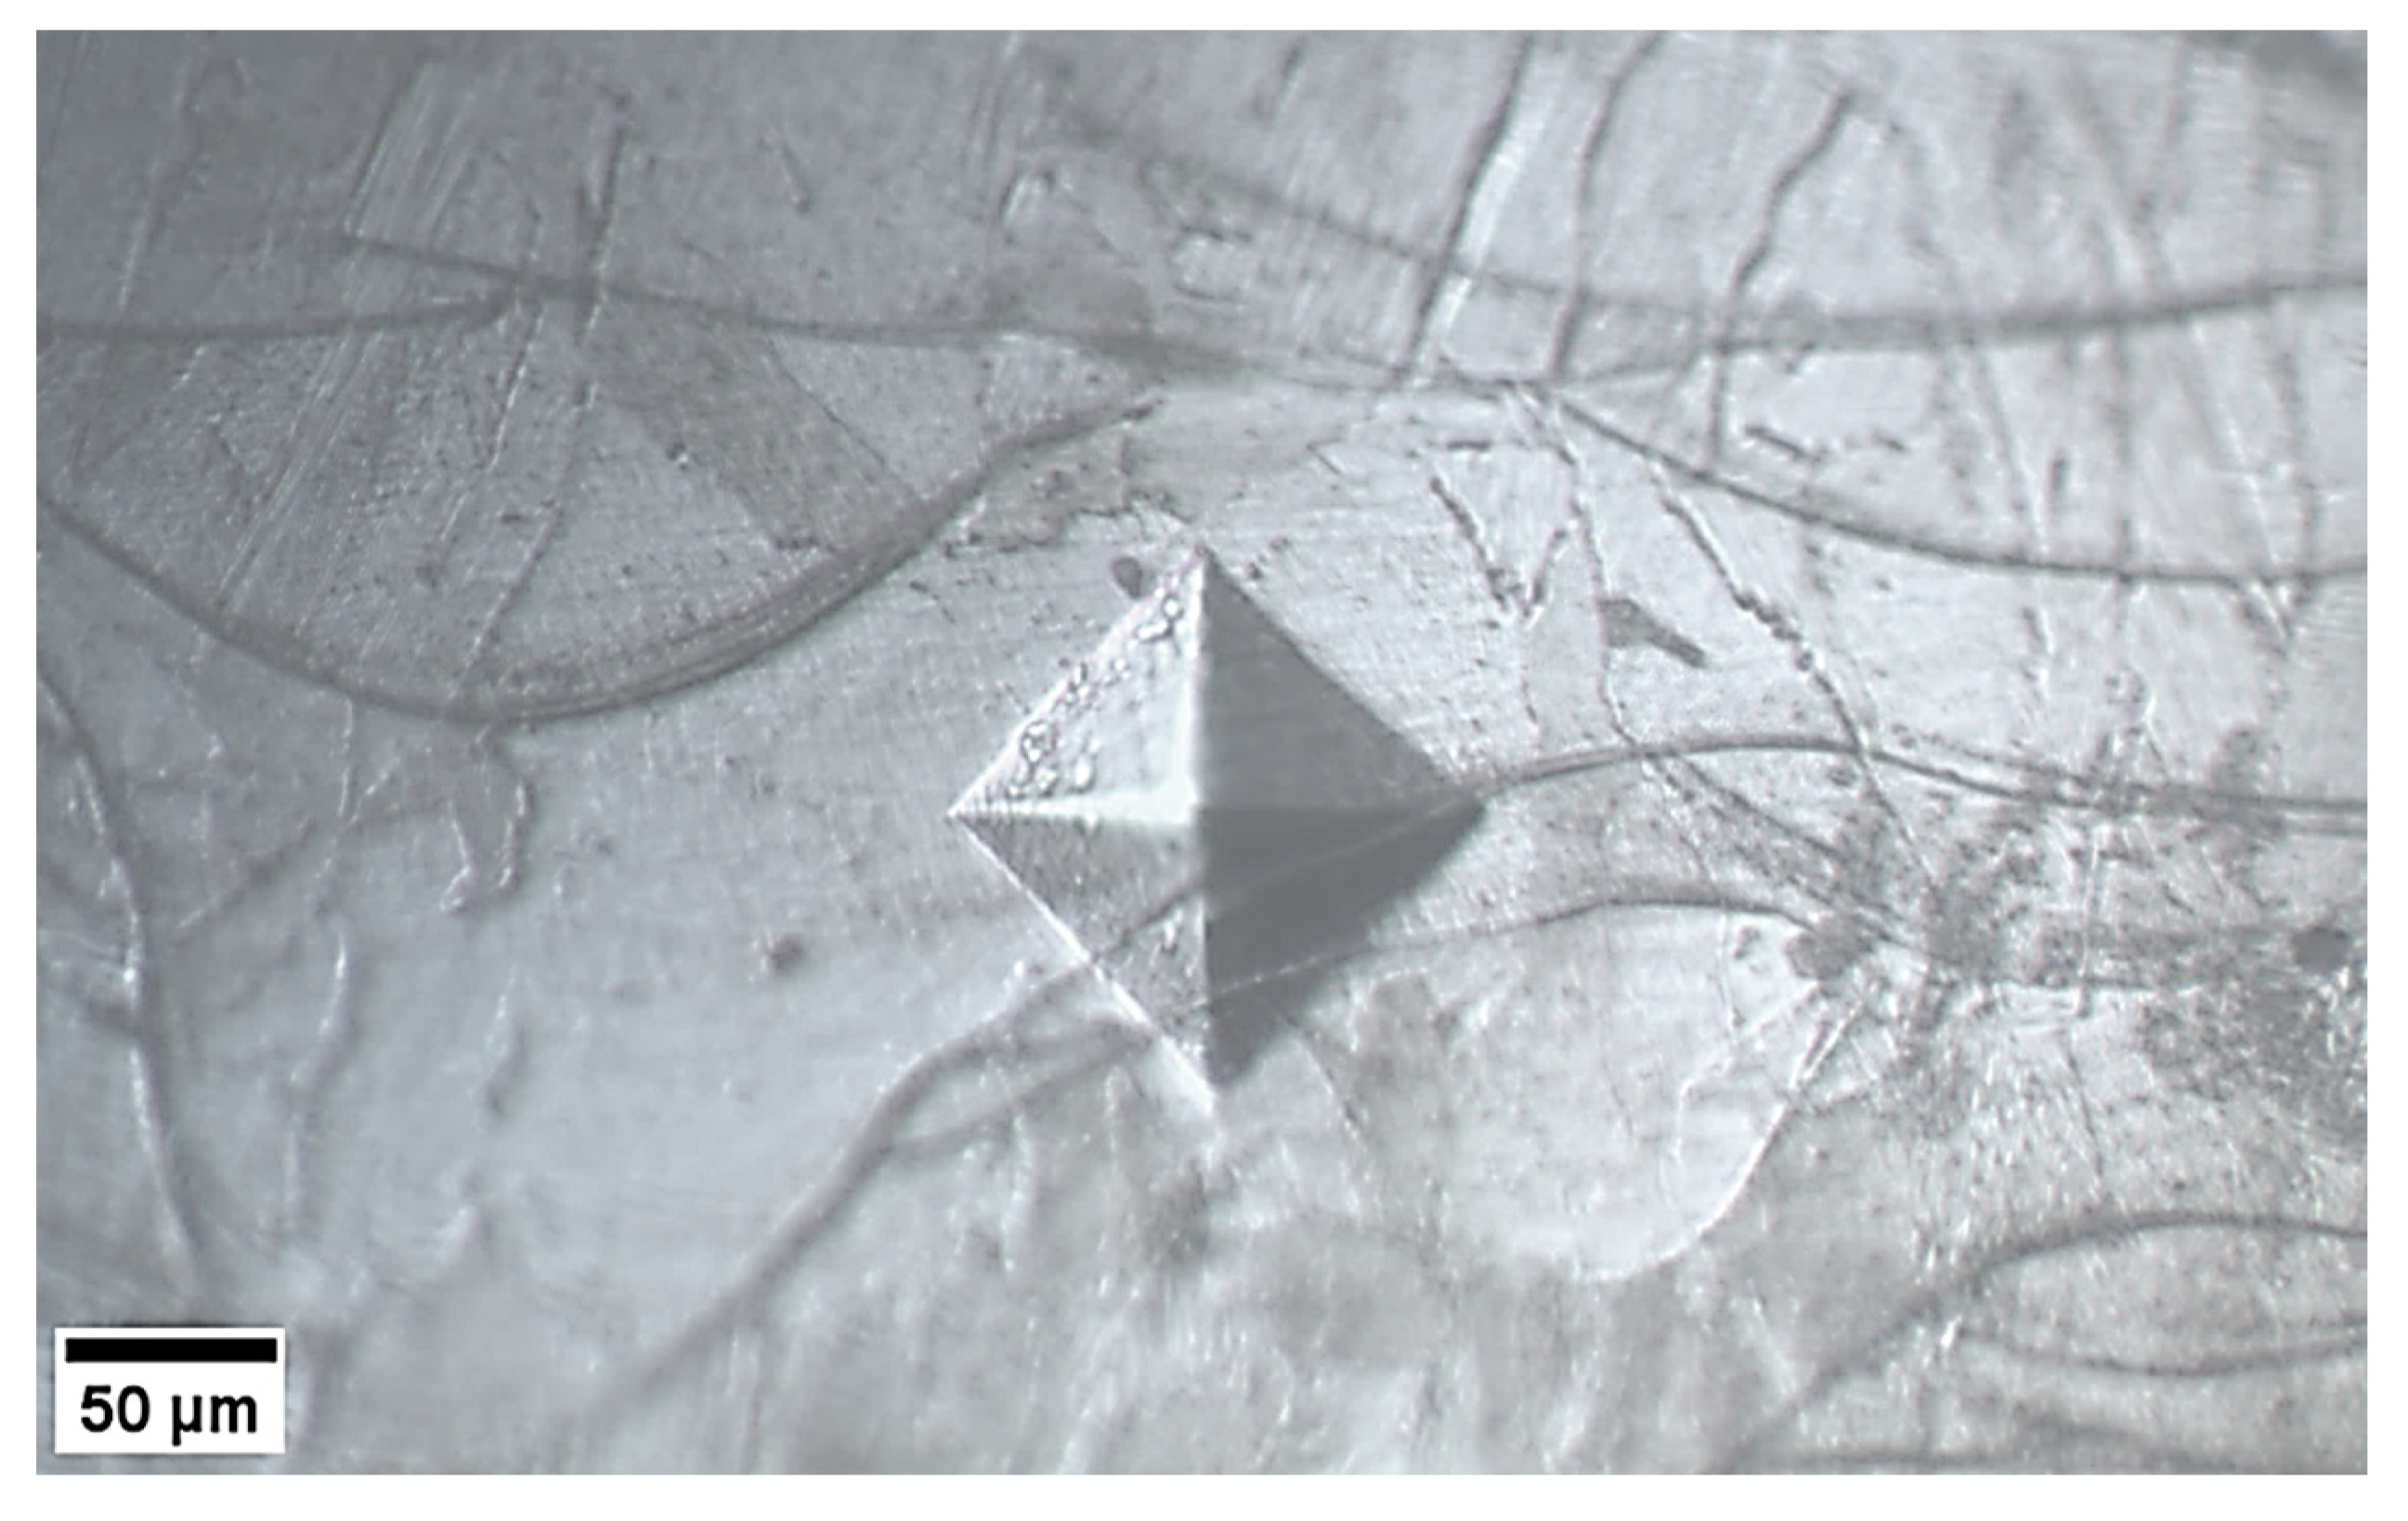
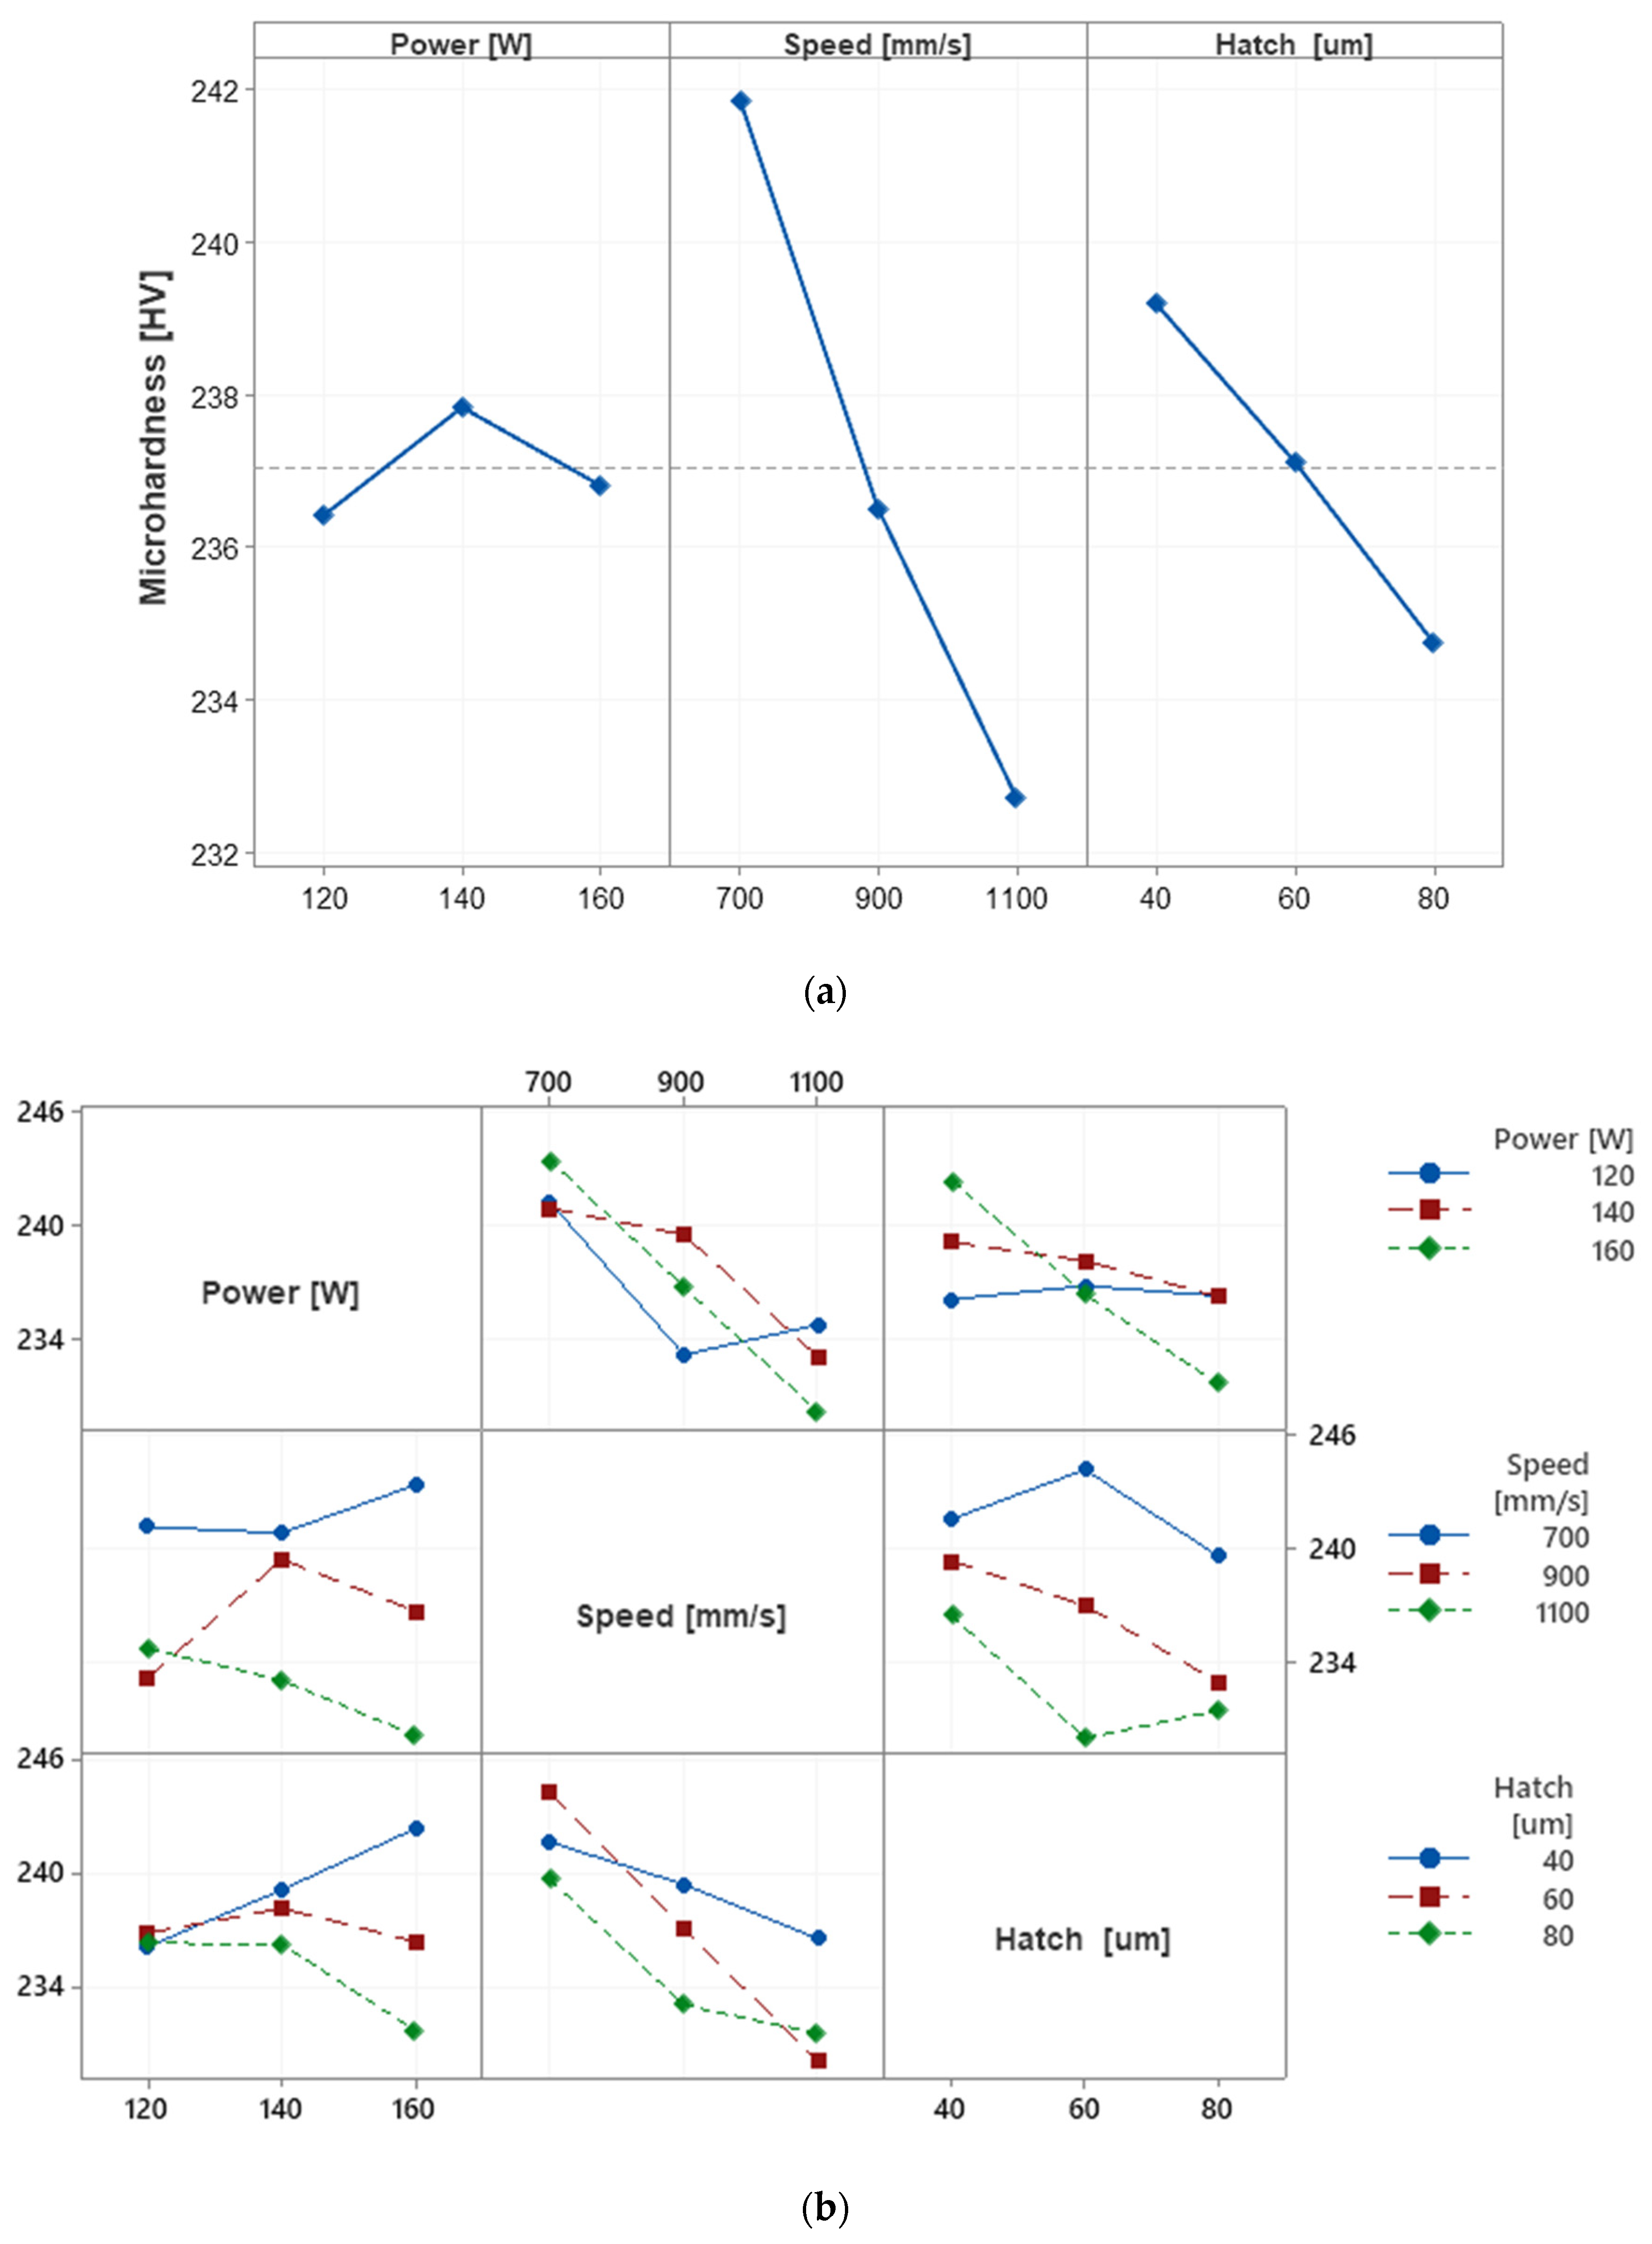
Table 5 shows the chemical composition results by GDOES and EDS techniques.
OM micrograph is presented in Figure 7, where the stacking of molten pools and elongated grains of the sample with the highest relative density is observed. It can be distinguished that the grains grow parallel to the building direction, and in some cases, these columnar grains grow for distances of more than 300 µm, which is consistent with similar reports by several authors [22,33,34,35,36,37,42,43,44,45]; this is observed more clearly in the SEM images (Figure 8).
Figure 8a shows a representative SEM micrograph of the molten pool. Within each molten pool (Figure 8b), it is possible to observe the formation of both cellular and columnar sub-grains. The green arrows indicate the direction of growth of the columnar grains. Epitaxial growth is favored by the direction of the thermal gradient, which leads to the formation of large columnar grains, as shown in Figure 7.

3.4. Microhardness

The microstructure of a material is directly connected to its mechanical properties. In the context of additively manufactured samples, the yield strength, microhardness, and wear resistance are significantly influenced by the characteristics of the grains and sub-grains, as recently reported in [46,47]. Figure 9 shows a representative indentation response of the austenitic stainless steel beneath a molten pool.
The average microhardness obtained was around 237 ± 9 HV0.5. These results agree with those reported in [32,35,39,48]. Moreover, microhardness shows a linear relationship with relative density, i.e., the higher the density, the higher the microhardness (Figure 10) [49]. It is worth noting that, despite having relative densities with close values, the microhardness results vary. This is because some processing parameters have a greater influence on the microhardness, as detailed in Table 6.
Table 6 shows the ANOVA results, where each factor’s significance is determined using the p-value; a p-value of less than 0.05 indicates that the factors are statistically significant. Therefore, and under the experimental design employed, the scanning speed is the only statistically significant factor (p-value ≤ 0.005). Figure 11 shows the effect of each factor on the microhardness and the interaction between factors. Again, speed appears as the factor with the steepest slope and, therefore, the greatest contribution of its effect on microhardness (Figure 11a). Figure 11b presents the interaction between factors. The only visible interaction is between power and speed: the higher the power and the lower the speed, the higher the microhardness.

4. Discussion

The results have shown that the densification of the 316L stainless steel manufactured by LPBF is governed by the speed (v) of the laser beam. If the v used is more than 700 mm/s, the heat source (laser) cannot completely melt the metal powders, causing a lack of fusion. It was shown that the different types of porosity are linked to the processing parameters. When insufficient VED is supplied (<100 J/mm3), irregular porosities are generated, even with unmelted powder particles. It was also observed that entrapped gas porosity was associated with the porosity of the feedstock [14]. In most cases, spherical porosity was observed (Figure 3) with an average diameter of less than 9 ± 2 µm.
There are two ways to ensure the proper fusion of the powder bed: (1) reducing the speed and (2) increasing the laser power. For instance, a VED higher than 125 J/mm3 is recommended. However, to make this technology cost-effective, reducing the scanning speed implies a longer manufacturing time, reducing its competitiveness. For this reason, using a higher-power heat source is recommended; in this work, 160 W was chosen as the maximum power; however, a power of up to 200 W could be used according to the manufacturer’s limitations. In order to corroborate this statement, additional experiments were carried out. When a power of 180 W was used, the relative density increased to 99.41 ± 0.23%. However, at higher powers (>180 W), the relative density started to decrease again to <98% due to overheating of the molten pool.
In addition to laser power and scanning speed, the effect of the hatch spacing was also evaluated. According to the statistical analysis, it was found that the smaller the hatch, the higher the densification. Nevertheless, this parameter has a similar effect to speed, where reducing the hatch implies a longer printing time, that is, the competitiveness of this technology is reduced. In the contour plots (Figure 6), it can be observed that the difference between using a hatch of 40 and 60 μm is minimal, so it is suggested to use a hatch spacing of 60 μm.
Processing parameters influence molten pool dimensions. By examining Figure 12, it is possible to infer that when the hatch spacing is excessively large, and the supplied volumetric energy density (VED) is insufficient, the molten pool width fails to surpass the hatch. Consequently, a lack of fusion occurs due to insufficient VED, as indicated near the red molten pools. Conversely, when there is an excess of VED, the occurrence of balling is observed as the molten pool becomes excessively large or deep [27], as denoted by the yellow molten pools. It is essential for the molten pool depth to be adequate to penetrate the layer thickness and melt a percentage of the previous layers (illustrated by the orange molten pool), while the molten pool depth serves as a determinant of melting efficiency. Typically, the width exceeds the diameter of the laser beam. In the case of a layer thickness of around 30 μm, the depth is recommended to fall within the range of 50 to 80 μm to ensure proper anchoring to the layer below. Additionally, the width should not be less than the laser focus, for instance, 100 μm.
It is worth noting that the scanning strategy plays a fundamental role in the densification of parts manufactured by LPBF. The thermal gradient and the solidification rate can be altered depending on this. If a constant strategy is used (without rotations), an ordered stacking of molten pools would be obtained and a completely anisotropic material would be designed, as observed in the results obtained by Yang et al. [50]. The studies of Bahshwan et al. [51,52] highlighted that the sudden changes in laser energy density occur at the end of the laser path, causing more porosity at the beginning and end of scan lines. In addition, Salman et al. [26] conclude that the highest densification is obtained with a unidirectional pattern as long as the contour is previously scanned since the contour acts as a limit for heat transfer. It is important to consider that heat transfer varies depending on the part’s geometry to be manufactured. Hence, a more detailed study of its effect is necessary.
The molten pool shows the solidification behavior in the plane parallel to the building direction (Figure 8a), but it should also be considered that the solidification occurs in the three dimensions. Temperature gradients (G) and solidification rates (R) are pivotal parameters in solidification. It is worth noting that both the G and the R are linked to the processing parameters, especially the laser power, scanning speed, and scanning strategy [8]. In laser powder bed fusion, the generation of high thermal gradients (106 K/m) and ultra-fast cooling rates (106 K/s) [6] manifests as cellular/dendritic microstructures, exemplified in Figure 8b. The cellular microstructure favors the accumulation of dislocations in the subgrains, which increases the strength and hardness of the materials processed by LPBF [46].
Due to the high crystallization rate, a boundary layer enriched with solute develops ahead of the solid–liquid interface, approaching conditions conducive to constitutional supercooling. In LPBF, the solid–liquid interface within the melt pool exhibits a complex shape since the temperature gradient continuously changes along with the interface. The maximum temperature gradient is observed at the bottom of the melt pool, gradually diminishing along the interface towards the ends and sides of the molten pool. Conversely, the solidification rate is minimal at the bottom but reaches its peak at the ends and sides of the molten pool [53]. When the temperature gradient is steep, the material undergoes crystallization in a cellular fashion. Conversely, if G is gently sloping, it leads to the direct solidification of dendrites with well-developed arms.
Figure 13 shows the crystallization process of 316L stainless steel processed by LPBF. Initially, the nuclei appear stochastically (green color), then they serve as a substrate for other nuclei to grow around them (blue color). As the temperature decreases, grains with different orientations start to crystallize. Epitaxial nucleation has been reported for austenitic steels, aluminum, and nickel alloy processing [54]. Epitaxial growth involves the initiation of new grains on a polycrystalline substrate, inheriting their crystallographic orientation from parental grains, as illustrated in Figure 7 and Figure 8. These grains develop with a favored crystallographic orientation and align with the heat flow direction due to a high solidification rate [55]. In LPBF, there is a dynamic interplay between the alignment of various crystallographic directions with the build direction and the competition between thermal gradient-driven and epitaxial growth [56].
During the solidification process, various types of defects are also produced, such as pores that act as stress concentrators affecting the mechanical response, as shown in Figure 10. When there is a near full dense material, a maximum microhardness (248 HV) is reached, while when there is high porosity, the microhardness drops to 222 HV.

5. Conclusions

This work evaluates relative density, microhardness, and microstructure evolution in the LPBF process. The main results can be summarized as follows:
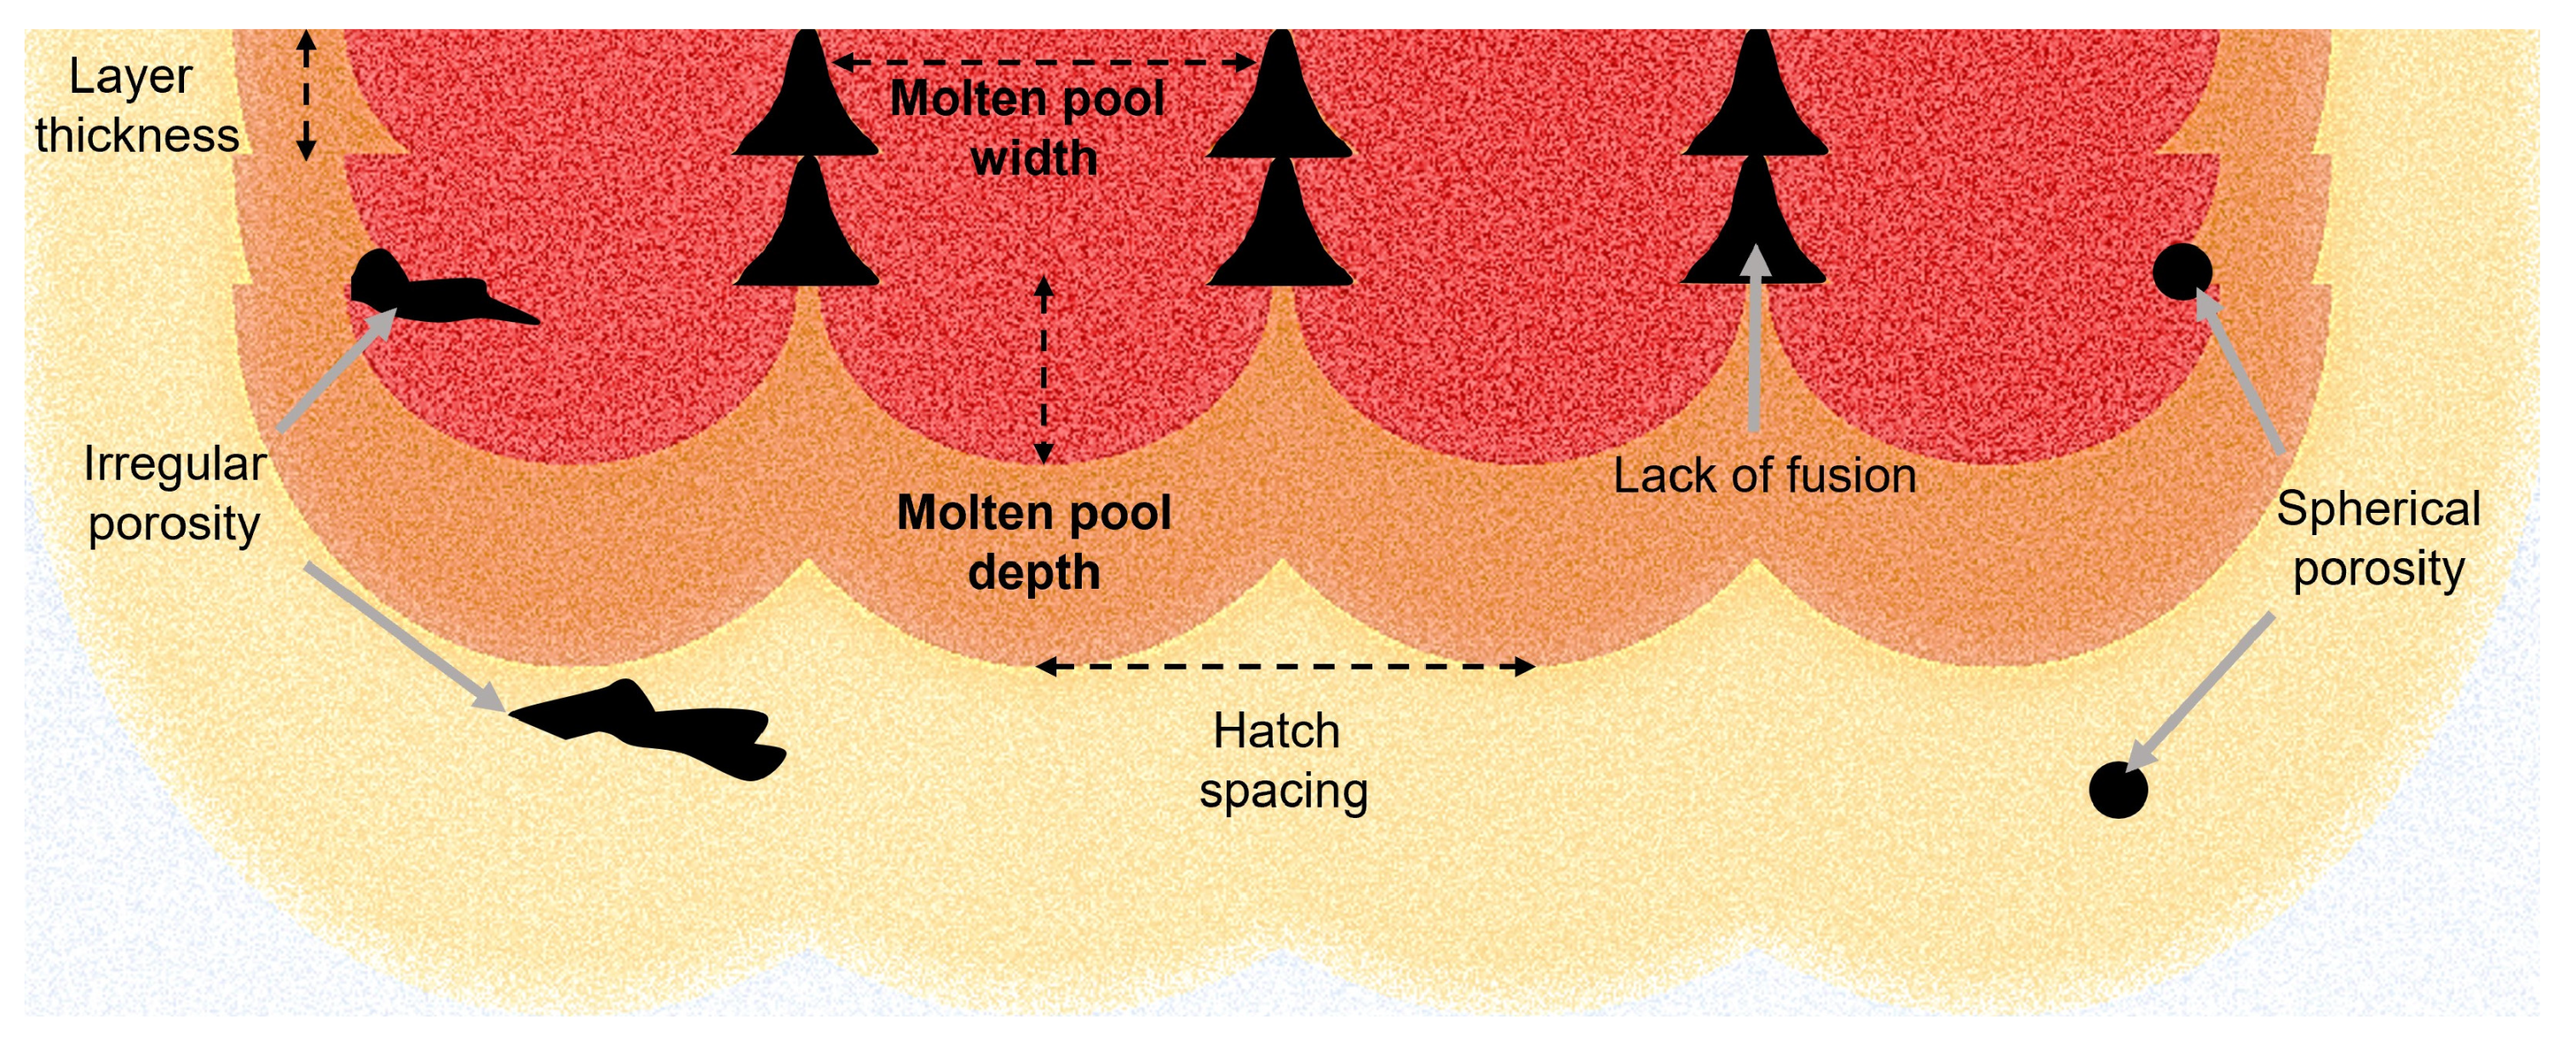
  • It has been found that there is a direct relationship between scanning speed and the porosity level. Enough volumetric energy (125 J/mm3) density must be provided to avoid fusion errors and balling phenomena to obtain pieces with maximum relative density. Within the levels evaluated in the design of experiments, it was found that scanning speed is the most statistically significant factor that affects the relative density and microhardness of the 316L SS processed by LPBF.
  • The maximum densification reached was 99.41%, obtained with Archimedes’ principle, equivalent to 99.9% by image correlation, utilizing 180 W of laser power, 700 mm/s of scanning speed, and a hatch spacing of 40 μm. To increase productivity, it is recommended to use a laser power greater than 160 W and a hatch spacing of 60 μm.
  • Microstructurally, it was found that the samples are composed of stacked molten pools, one on top of the other, aligned in the build direction; columnar sub-grains can be distinguished within the elongated grains with an extension that sometimes exceeds 300 µm.
  • Densification in additive manufacturing processes has reached porosity levels comparable to conventional processes (>99%). Therefore, the laser powder bed fusion technique is suitable for manufacturing mechanical elements.

Author Contributions

Conceptualization, G.O.B. and J.A.R.-G.; data curation, D.Z.-H. and J.L.M.; formal analysis, X.S.-S. and S.D.P.-A.; funding acquisition, J.A.R.-G.; investigation, G.O.B.; methodology, G.O.B. and X.S.-S.; supervision, J.A.R.-G. and S.D.P.-A.; validation, D.Z.-H. and J.L.M.; writing—original draft, G.O.B.; writing—review and final editing, S.D.P.-A., J.L.M. and D.Z.-H. All authors have read and agreed to the published version of the manuscript.

Funding

This research was funded by SENESCYT grant number ARSEQ-BEC-000329-2017, ANID FONDECYT grant number 1201068 project, and the APC was funded by Tecnologico de Monterrey.

Data Availability Statement

Data are available upon request from the corresponding authors.

Acknowledgments

The authors gratefully acknowledge the Research Center for Nanotechnology and Advanced Materials (CIEN-UC), Centro de Nanociencia y Nanotecnologia (CENCINAT), and Tecnologico de Monterrey.

Conflicts of Interest

The authors declare no conflicts of interest.

References

  1. Gong, G.; Ye, J.; Chi, Y.; Zhao, Z.; Wang, Z.; Xia, G.; Du, X.; Tian, H.; Yu, H.; Chen, C. Research status of laser additive manufacturing for metal: A review. J. Mater. Res. Technol. 2021, 15, 855–884. [Google Scholar] [CrossRef]
  2. Peng, T.; Chen, C. Influence of energy density on energy demand and porosity of 316L stainless steel fabricated by selective laser melting. Int. J. Precis. Eng. Manuf. Green Technol. 2018, 5, 55–62. [Google Scholar] [CrossRef]
  3. Yap, C.Y.; Chua, C.K.; Dong, Z.L.; Liu, Z.H.; Zhang, D.Q.; Loh, L.E.; Sing, S.L. Review of selective laser melting: Materials and applications. Appl. Phys. Rev. 2015, 2, 041101. [Google Scholar] [CrossRef]
  4. Li, N.; Huang, S.; Zhang, G.; Qin, R.; Liu, W.; Xiong, H.; Shi, G.; Blackburn, J. Progress in additive manufacturing on new materials: A review. J. Mater. Sci. Technol. 2019, 35, 242–269. [Google Scholar] [CrossRef]
  5. Haghdadi, N.; Laleh, M.; Moyle, M.; Primig, S. Additive manufacturing of steels: A review of achievements and challenges. J. Mater. Sci. 2021, 56, 64–107. [Google Scholar] [CrossRef]
  6. Barrionuevo, G.O.; Ramos-Grez, J.A.; Walczak, M.; Sánchez-Sánchez, X.; Guerra, C.; Debut, A.; Haro, E. Microstructure simulation and experimental evaluation of the anisotropy of 316L stainless steel manufactured by laser powder bed fusion. Rapid Prototyp. J. 2023, 29, 425–436. [Google Scholar] [CrossRef]
  7. La Fé-Perdomo, I.; Ramos-Grez, J.A.; Jeria, I.; Guerra, C.; Barrionuevo, G.O. Comparative analysis and experimental validation of statistical and machine learning-based regressors for modeling the surface roughness and mechanical properties of 316L stainless steel specimens produced by selective laser melting. J. Manuf. Process 2022, 80, 666–682. [Google Scholar] [CrossRef]
  8. Sharma, S.; Joshi, S.S.; Pantawane, M.V.; Radhakrishnan, M.; Mazumder, S.; Dahotre, N.B. Multiphysics multi-scale computational framework for linking process–structure–property relationships in metal additive manufacturing: A critical review. Int. Mater. Rev. 2023, 68, 943–1009. [Google Scholar] [CrossRef]
  9. Liu, C.M.; Gao, H.B.; Li, L.Y.; Wang, J.D.; Guo, C.H.; Jiang, F.C. A review on metal additive manufacturing: Modeling and application of numerical simulation for heat and mass transfer and microstructure evolution. China Foundry 2021, 18, 317–334. [Google Scholar] [CrossRef]
  10. Barrionuevo, G.; Ramos-Grez, J.; Walczak, M.; Betancourt, C. Comparative evaluation of supervised machine learning algorithms in the prediction of the relative density of 316L stainless steel fabricated by selective laser melting. Int. J. Adv. Manuf. Technol. 2021, 113, 419–433. [Google Scholar] [CrossRef]
  11. Mukherjee, T.; DebRoy, T. Mitigation of lack of fusion defects in powder bed fusion additive manufacturing. J. Manuf. Process 2018, 36, 442–449. [Google Scholar] [CrossRef]
  12. Kan, W.H.; Chiu, L.N.S.; Lim, C.V.S.; Zhu, Y.; Tian, Y.; Jiang, D.; Huang, A. A critical review on the effects of process-induced porosity on the mechanical properties of alloys fabricated by laser powder bed fusion. J. Mater. Sci. 2022, 57, 9818–9865. [Google Scholar] [CrossRef]
  13. Wang, D.; Han, H.; Sa, B.; Li, K.; Yan, J.; Zhang, J.; Liu, J.; He, Z.; Wang, N.; Yan, M. A review and a statistical analysis of porosity in metals additively manufactured by laser powder bed fusion. Opto-Electron. Adv. 2022, 5, 210058–210061. [Google Scholar] [CrossRef]
  14. Sola, A.; Nouri, A. Microstructural porosity in additive manufacturing: The formation and detection of pores in metal parts fabricated by powder bed fusion. J. Adv. Manuf. Process. 2019, 1, e10021. [Google Scholar] [CrossRef]
  15. Al-Maharma, A.Y.; Patil, S.P.; Markert, B. Effects of porosity on the mechanical properties of additively manufactured components: A critical review. Mater. Res. Express 2020, 7, 122001. [Google Scholar] [CrossRef]
  16. Alafaghani, A.; Qattawi, A.; Alrawi, B.; Guzman, A. Experimental Optimization of Fused Deposition Modelling Processing Parameters: A Design-for-Manufacturing Approach. Procedia Manuf. 2017, 10, 791–803. [Google Scholar] [CrossRef]
  17. Gustmann, T.; Neves, A.; Kühn, U.; Gargarella, P.; Kiminami, C.S.; Bolfarini, C.; Eckert, J.; Pauly, S. Influence of processing parameters on the fabrication of a Cu-Al-Ni-Mn shape-memory alloy by selective laser melting. Addit. Manuf. 2016, 11, 23–31. [Google Scholar] [CrossRef]
  18. Barrionuevo, G.O.; Ramos-Grez, J.; Walczak, M.; La Fé-Perdomo, I. Numerical analysis of the effect of processing parameters on the microstructure of stainless steel 316L manufactured by laser-based powder bed fusion. Mater Today Proc. 2021, 59, 93–100. [Google Scholar] [CrossRef]
  19. Koutiri, I.; Pessard, E.; Peyre, P.; Amlou, O.; De Terris, T. Influence of SLM process parameters on the surface finish, porosity rate and fatigue behavior of as-built Inconel 625 parts. J. Mater. Process Technol. 2018, 255, 536–546. [Google Scholar] [CrossRef]
  20. AlMangour, B.; Baek, M.S.; Grzesiak, D.; Lee, K.A. Strengthening of stainless steel by titanium carbide addition and grain refinement during selective laser melting. Mater. Sci. Eng. A 2018, 712, 812–818. [Google Scholar] [CrossRef]
  21. Laleh, M.; Hughes, A.E.; Xu, W.; Gibson, I.; Tan, M.Y. Unexpected erosion-corrosion behaviour of 316L stainless steel produced by selective laser melting. Corros. Sci. 2019, 155, 67–74. [Google Scholar] [CrossRef]
  22. Lin, K.; Gu, D.; Xi, L.; Yuan, L.; Niu, S.; Lv, P.; Ge, Q. Selective laser melting processing of 316L stainless steel: Effect of microstructural differences along building direction on corrosion behavior. Int. J. Adv. Manuf. Technol. 2019, 104, 2669–2679. [Google Scholar] [CrossRef]
  23. Barrionuevo, G.O.; Walczak, M.; Ramos-grez, J.; Sánchez-sánchez, X. Microhardness and wear resistance in materials manufactured by laser powder bed fusion: Machine learning approach for property prediction. CIRP J. Manuf. Sci. Technol. 2023, 43, 106–114. [Google Scholar] [CrossRef]
  24. Yadroitsev, I.; Yadroitsava, I.; Plessis, A.D.; MacDonald, E. Fundamentals of Laser Powder Bed Fusion of Metals; Elsevier: Amsterdam, The Netherlands, 2021. [Google Scholar]
  25. Yan, X.; Gao, S.; Chang, C.; Huang, J.; Khanlari, K.; Dong, D.; Ma, W.; Fenineche, N.; Liao, H.; Liu, M. Effect of building directions on the surface roughness, microstructure, and tribological properties of selective laser melted Inconel 625. J. Mater. Process. Technol. 2021, 288, 116878. [Google Scholar] [CrossRef]
  26. Salman, O.O.; Brenne, F.; Niendorf, T.; Eckert, J.; Prashanth, K.G.; He, T.; Scudino, S. Impact of the scanning strategy on the mechanical behavior of 316L steel synthesized by selective laser melting. J. Manuf. Process 2019, 45, 255–261. [Google Scholar] [CrossRef]
  27. Zhang, J.; Song, B.; Wei, Q.; Bourell, D.; Shi, Y. A review of selective laser melting of aluminum alloys: Processing, microstructure, property and developing trends. J. Mater. Sci. Technol. 2019, 35, 270–284. [Google Scholar] [CrossRef]
  28. Zhong, Y. Sub-Grain Structure in Additive Manufactured Stainless Steel 316L. Ph.D. Thesis, Stockolm University, Stockholm, Sweden, 2017. [Google Scholar]
  29. Zhang, X.; Yocom, C.J.; Mao, B.; Liao, Y. Microstructure evolution during selective laser melting of metallic materials: A review. J. Laser Appl. 2019, 31, 031201. [Google Scholar] [CrossRef]
  30. Huang, M.; Zhang, Z.; Chen, P. Effect of selective laser melting process parameters on microstructure and mechanical properties of 316L stainless steel helical micro-diameter spring. Int. J. Adv. Manuf. Technol. 2019, 2154, 2117–2131. [Google Scholar] [CrossRef]
  31. Deng, Y.; Mao, Z.; Yang, N.; Niu, X.; Lu, X. Collaborative optimization of density and surface roughness of 316L stainless steel in selective laser melting. Materials 2020, 13, 1601. [Google Scholar] [CrossRef]
  32. Larimian, T.; Kannan, M.; Grzesiak, D.; AlMangour, B.; Borkar, T. Effect of energy density and scanning strategy on densification, microstructure and mechanical properties of 316L stainless steel processed via selective laser melting. Mater. Sci. Eng. A 2020, 770, 138455. [Google Scholar] [CrossRef]
  33. Tucho, W.M.; Lysne, V.H.; Austbø, H.; Sjolyst-Kverneland, A.; Hansen, V. Investigation of effects of process parameters on microstructure and hardness of SLM manufactured SS316L. J. Alloys Compd. 2018, 740, 910–925. [Google Scholar] [CrossRef]
  34. Ramirez-Cedillo, E.; Uddin, M.J.; Sandoval-Robles, J.A.; Mirshams, R.A.; Ruiz-Huerta, L.; Rodriguez, C.A.; Siller, H.R. Process planning of L-PBF of AISI 316L for improving surface quality and relating part integrity with microstructural characteristics. Surf. Coat. Technol. 2020, 396, 125956. [Google Scholar] [CrossRef]
  35. Zhang, Z.; Chu, B.; Wang, L.; Lu, Z. Comprehensive effects of placement orientation and scanning angle on mechanical properties and behavior of 316L stainless steel based on the selective laser melting process. J. Alloys Compd. 2019, 791, 166–175. [Google Scholar] [CrossRef]
  36. Röttger, A.; Geenen, K.; Windmann, M.; Binner, F.; Theisen, W. Comparison of microstructure and mechanical properties of 316L austenitic steel processed by selective laser melting with hot-isostatic pressed and cast material. Mater. Sci. Eng. A 2016, 678, 365–376. [Google Scholar] [CrossRef]
  37. Liverani, E.; Lutey, A.H.A.; Ascari, A.; Fortunato, A. The effects of hot isostatic pressing (HIP) and solubilization heat treatment on the density, mechanical properties, and microstructure of austenitic stainless steel parts produced by selective laser melting (SLM). Int. J. Adv. Manuf. Technol. 2020, 107, 109–122. [Google Scholar] [CrossRef]
  38. Sun, Y.; Moroz, A.; Alrbaey, K. Sliding wear characteristics and corrosion behaviour of selective laser melted 316L stainless steel. J. Mater. Eng. Perform. 2014, 23, 518–526. [Google Scholar] [CrossRef]
  39. Chen, W.; Yin, G.; Feng, Z.; Liao, X. Effect of powder feedstock on microstructure and mechanical properties of the 316L stainless steel fabricated by selective laser melting. Metals 2018, 8, 729. [Google Scholar] [CrossRef]
  40. Cole, M.E.; Stout, S.D.; Dominguez, V.M.; Agnew, A.M. Pore Extractor 2D: An ImageJ toolkit for quantifying cortical pore morphometry on histological bone images, with application to intraskeletal and regional patterning. Am. J. Biol. Anthropol. 2022, 179, 365–385. [Google Scholar] [CrossRef]
  41. Zhang, B.; Li, Y.; Bai, Q. Defect Formation Mechanisms in Selective Laser Melting: A Review. Chin. J. Mech. Eng. (Engl. Ed.) 2017, 30, 515–527. [Google Scholar] [CrossRef]
  42. Shen, X.-J.; Zhang, C.; Yang, Y.-G.; Liu, L. On the microstructure, mechanical properties and wear resistance of an additively manufactured Ti64/metallic glass composite. Mater. Des. 2016, 25, 499–510. [Google Scholar] [CrossRef]
  43. Shin, W.S.; Son, B.; Song, W.; Sohn, H.; Jang, H.; Kim, Y.J.; Park, C. Heat treatment effect on the microstructure, mechanical properties, and wear behaviors of stainless steel 316L prepared via selective laser melting. Mater. Sci. Eng. A 2021, 806, 140805. [Google Scholar] [CrossRef]
  44. Kamariah, M.S.I.N.; Harun, W.S.W.; Khalil, N.Z.; Ahmad, F.; Ismail, M.H.; Sharif, S. Effect of heat treatment on mechanical properties and microstructure of selective laser melting 316L stainless steel. In IOP Conference Series: Materials Science and Engineering; IOP Publishing: Bristol, UK, 2017; Volume 257. [Google Scholar] [CrossRef]
  45. Montero-Sistiaga, M.L.; Godino-Martinez, M.; Boschmans, K.; Kruth, J.P.; Van Humbeeck, J.; Vanmeensel, K. Microstructure evolution of 316L produced by HP-SLM (high power selective laser melting). Addit. Manuf. 2018, 23, 402–410. [Google Scholar] [CrossRef]
  46. Barrionuevo, G.O.; Walczak, M.; Ramos-grez, J.; Mendez, P.; Debut, A. Microstructure effect on sliding wear of 316L stainless steel selectively laser melted. Mater. Sci. Technol. (UK) 2024, 02670836231217393. [Google Scholar] [CrossRef]
  47. Barrionuevo, G.O.; La Fé-perdomo, I.; Cáceres-Brito, E.; Navas-Pinto, W. Tensile/Compressive Response of 316L Stainless Steel Fabricated by Additive Manufacturing. Ingenius Rev. De Cienc. Y Tecnol. 2024, 31, 9–18. [Google Scholar] [CrossRef]
  48. Kovacı, H.; Seçer, Y. Improved tribological performance of AISI 316L stainless steel by a combined surface treatment: Surface texturing by selective laser melting and plasma nitriding. Surf. Coat. Technol. 2020, 400, 126178. [Google Scholar] [CrossRef]
  49. Chen, H.; Gu, D. Effect of metallurgical defect and phase transition on geometric accuracy and wear resistance of iron-based parts fabricated by selective laser melting. J. Mater. Res. 2016, 31, 1477–1490. [Google Scholar] [CrossRef]
  50. Yang, Y.; Zhu, Y.; Khonsari, M.M.; Yang, H. Wear anisotropy of selective laser melted 316L stainless steel. Wear 2019, 428, 376–386. [Google Scholar] [CrossRef]
  51. Bahshwan, M.; Myant, C.W.; Reddyhoff, T.; Pham, M.S. The role of microstructure on wear mechanisms and anisotropy of additively manufactured 316L stainless steel in dry sliding. Mater. Des. 2020, 196, 109076. [Google Scholar] [CrossRef]
  52. Bahshwan, M.; Gee, M.; Nunn, J.; Myant, C.W.; Reddyhoff, T. In situ observation of anisotropic tribological contact evolution in 316L steel formed by selective laser melting. Wear 2022, 490, 204193. [Google Scholar] [CrossRef]
  53. Lee, Y.; Nordin, M.; Babu, S.S.; Farson, D.F. Effect of fluid convection on dendrite arm spacing in laser deposition. Metall. Mater. Trans. B Process Metall. Mater. Process. Sci. 2014, 45, 1520–1529. [Google Scholar] [CrossRef]
  54. Li, X.; Tan, W. Numerical investigation of effects of nucleation mechanisms on grain structure in metal additive manufacturing. Comput. Mater. Sci. 2018, 153, 159–169. [Google Scholar] [CrossRef]
  55. Cao, Y.; Bai, P.; Liu, F.; Hou, X. Grain growth in IN718 superalloy fabricated by laser additive manufacturing. Mater. Sci. Technol. (UK) 2020, 36, 765–769. [Google Scholar] [CrossRef]
  56. Fergani, O.; Brotan, V.; Bambach, M.; Pérez-Prado, M.T. Texture evolution in stainless steel processed by selective laser melting and annealing. Mater. Sci. Technol. 2018, 34, 2223–2230. [Google Scholar] [CrossRef]
Figure 1. Schematic diagram of the experimental procedure of the LPBF process: (a) feedstock; (b) studied processing parameters; (c) scanning strategy of the fabricated sample.
Jmmp 08 00035 g001
Figure 2. (a) Top view of the printed samples (printing area of 100 mm × 100 mm); (b) 5×; (c) 60× magnification.
Jmmp 08 00035 g002
Figure 3. Optical microscopy images of samples produced at different scanning speeds: (a) 1100 mm/s; (b) 900 mm/s; (c) 700 mm/s. Laser power of 160 W and hatch spacing of 40 µm.
Jmmp 08 00035 g003
Figure 4. Relative density as a function of the energy density in 316L stainless steel processed by LPBF.
Jmmp 08 00035 g004
Figure 5. Summary of the effects of processing parameters over relative density in 316L stainless steel processed by LPBF: (a) main effects plot; (b) interactions plot.
Jmmp 08 00035 g005
Figure 6. Contour plot of interaction between scanning speed and (a) laser power and (b) hatch spacing.
Jmmp 08 00035 g006
Figure 7. The optical micrograph of the 316L stainless steel processed by LPBF shows the molten pools’ stacking and the columnar grain growth.
Jmmp 08 00035 g007
Figure 8. SEM micrograph of the 316L stainless steel processed by LPBF: (a) molten pool detail; (b) sub-grains (cellular and columnar).
Jmmp 08 00035 g008
Figure 9. Microhardness evaluation of the 316L stainless steel processed by LPBF.
Jmmp 08 00035 g009
Figure 10. Microhardness as a function of the relative density in 316L stainless steel processed by LPBF.
Jmmp 08 00035 g010
Figure 11. Effects of processing parameters over microhardness in 316L stainless steel processed by LPBF: (a) main effects plot; (b) interactions plot.
Jmmp 08 00035 g011
Figure 12. Schematic representation of the effect of molten pool dimensions on the densification process.
Jmmp 08 00035 g012
Figure 13. Schematic crystal nucleation and grain growth representation during laser-based powder bed fusion solidification: (a) nuclei of crystallization; (b) crystal growing; (c) grain formation; (d) grain boundaries.
Jmmp 08 00035 g013
Table 1. Summary of literature data of processing parameters on relative density response of 316L SS fabricated by LPBF.
Power
(W)
Speed
(mm/s)
Hatch
(μm)
Layer Thickness
(μm)
Energy Density
(J/mm3)
Machine/
Model
Relative Density
(%)
Reference
200750–10005011035–50-97.97[2]
120–160800–120060–8020–4032–130Concept Laser
Mlab200
96.6[7]
150400–800408060–120Self-developed 500W96.82[22]
80–100300–17002040–12020–400EP-M100T98.77[30]
150–300700–13002060–12036–350FS271M98.52[31]
100111–25050110–12066–400SLM 12596.00[32]
150–200446–16673080–14020–180SLM 280HL98.59[33]
125–175180–2604020–60200–1200RENISHAW AM 40098.62[34]
220960408070BLT S20095.61[35]
100400–6003030–15040–280REALIZER SLM 10096.50[36]
70–130700–1200206050–150MYSINT10096.84[37]
1756683012070SLM 250 HL99.05[26]
150125–2005090160–260RENISHAW 12596.40[38]
2002000306055AFS-M12097.38[39]
Table 2. Nominal chemical composition of the AISI 316L stainless steel powders.
Elements (wt%)
FeCrNiMoMnSiCPS
Bal.16.5–1810–132–2.50–20–10–0.030–0.040–0.03
Table 3. Factors and levels of the design of experiments.
FactorsLevels
−101
Laser power (W)120140160
Scanning speed (mm/s)7009001100
Hatch spacing (µm)406080
Table 4. ANOVA results for the relative density assessment.
SourceDFAdj SSAdj MSF-Valuep-Value
Laser Power (W)20.025340.012671.220.317
Scanning speed (mm/s)20.206290.103159.910.001
Hatch spacing (um)20.051600.025802.480.109
Error200.208150.01041
Total260.49138
DF: degrees of freedom; SS: sum of squares; MS: mean square; F and p-value: statistics.
Table 5. Chemical composition of the fabricated AISI 316L stainless steel determined by GDOES and EDS.
Glow Discharge Emission Spectrometry (GDOES)
Element (wt%)
FeCrNiMoSiMnCo
Bal.18.9 ± 1.612.5 ± 0.92.7 ± 0.20.9 ± 0.20.5 ± 0.030.1 ± 0.01
Energy Dispersive Spectroscopy (EDS)
Element (wt%)
FeCrNiMoSiMnCo
Bal.16.9811.142.100.560.750.65
Table 6. ANOVA results for the microhardness assessment.
SourceDFAdj SSAdj MSF-Valuep-Value
Power (W)29.744.8700.180.836
Speed (mm/s)2380.51190.2577.060.005
Hatch (um)289.4644.7321.660.215
Error20538.6526.932
Total261018.37
DF: degrees of freedom; SS: sum of squares; MS: mean square; F and p-value: statistics.
Disclaimer/Publisher’s Note: The statements, opinions and data contained in all publications are solely those of the individual author(s) and contributor(s) and not of MDPI and/or the editor(s). MDPI and/or the editor(s) disclaim responsibility for any injury to people or property resulting from any ideas, methods, instructions or products referred to in the content.

