Article

Three-Dimensional Printing of Biomass–Fungi Biocomposite Materials: The Effects of Mixing and Printing Parameters on Fungal Growth

1
Department of Industrial & Systems Engineering, Texas A&M University, College Station, TX 77843, USA
2
Department of Plant Pathology and Microbiology, Texas A&M University, College Station, TX 77845, USA
*
Author to whom correspondence should be addressed.
These authors contributed equally to this work.
J. Manuf. Mater. Process. 2024, 8(1), 2; https://doi.org/10.3390/jmmp8010002
Submission received: 15 September 2023 / Revised: 13 December 2023 / Accepted: 18 December 2023 / Published: 19 December 2023

Abstract

:
Biomass–fungi biocomposite materials are derived from sustainable sources and can biodegrade at the end of their service. They can be used to manufacture products that are traditionally made from petroleum-based plastics. There are potential applications for these products in the packaging, furniture, and construction industries. In the biomass–fungi biocomposite materials, the biomass particles (made from agricultural waste such as hemp hurd) act as the substrate, and a network of fungal hyphae grow through and bind the biomass particles together. Typically, molding-based methods are used to manufacture products using these biocomposite materials. Recently, the authors reported a novel extrusion-based 3D printing method using these biocomposite materials. This paper reports a follow-up investigation into the effects of mixing parameters (mixing time and mixing mode) on fungal growth in biomass–fungi mixtures prepared for 3D printing and the effects of printing parameters (printing speed and extrusion pressure) on fungal growth in printed samples. The fungal growth was quantified using the number of fungal colonies that grew from samples. The results show that, when mixing time increased from 15 to 120 s, there was a 52% increase in fungal growth. Changing from continuous to intermittent mixing mode resulted in an 11% increase in fungal growth. Compared to mixtures that were not subjected to printing, samples printed with a high printing speed and high extrusion pressure had a 14.6% reduction in fungal growth, while those with a low printing speed and low extrusion pressure resulted in a 16.5% reduction in fungal growth.

1. Introduction

Biomass–fungi biocomposite materials are composed of two main components: biomass particles derived from agricultural waste (such as corn stover, beechwood sawdust, and hemp hurd) that act as the substrate, and a network of fungal hyphae that grow through and bind the biomass particles together [1]. These biocomposite materials can be used to manufacture products that are traditionally made from petroleum-based plastics. Potential applications of these products can be found in diverse industries, including packaging [2,3,4,5], furniture [6], and construction [7].
Biomass–fungi biocomposite materials possess good thermal and acoustic insulation properties [8,9,10]. It is estimated that the cost of the raw material in these biocomposite materials is in the range of $0.07–0.17 per kilogram [9]. In contrast, plastic materials such as polystyrene and polyurethane cost approximately $2 and $9 per kilogram, respectively [9]. These biocomposite materials are obtained from sustainable sources and can biodegrade at the end of their service. In contrast, about 90% of plastic waste ends up in landfills [11], where it takes years, even decades, for them to decompose.
Generally, molding-based methods are used in manufacturing products using biomass–fungi biocomposite materials [9,12,13,14]. In a reported study [13], various grades of biomass–fungi biocomposite materials were categorized, and the effects of biomass substrate and cultivation time on mechanical properties were investigated. The study revealed a significant correlation between substrate density and mechanical strength. Another study [14] delved into the morphological and mechanical aspects of biomass–fungi biocomposite materials, and proposed a fiber network-based model for mycelium to predict tensile and compressive behaviors of the biocomposite materials. Additionally, the properties (such as morphology, density, tensile strength, and flexural strength) of different biomass–fungi biocomposite materials were investigated [12]. These properties, along with moisture- and water-uptake characteristics, could be adjusted by changing the substrate type (such as straw, sawdust, or cotton), fungal species (Pleurotus ostreatus or Trametes versicolor), and processing method (no pressing, cold pressing, or heat pressing). The results also highlighted the influence of fungal species on colonization level and the thickness of the exposed mycelium layer, known as the fungal skin. The degree of colonization, skin thickness, and substrate type, in turn, affected the stiffness and water resistance of the resulting materials.
The authors of this paper published the first paper on extrusion-based 3D printing manufacturing method using biomass–fungi biocomposite materials [15]. Three-dimensional printing offers a new approach to manufacturing products using biomass–fungi biocomposite materials, as an alternative to traditional molding-based methods. Three-dimensional printing enables the manufacturing of parts with complex shapes in art, architecture, interior design, packaging, and construction [1,16,17,18] that cannot be easily produced using molding-based methods. Furthermore, this approach reduces manufacturing waste [19]. The six stages of this extrusion-based 3D printing method are discussed elaborately in previously published papers [5,20,21].
The authors’ preliminary experimental results [20] showed that fungi could survive the mixing and printing stages and continue growing on the printed samples. The authors also investigated the effects of mixture composition on rheological properties of biomass–fungi mixtures prepared for 3D printing [20]. Additionally, they investigated the effects of waiting time (between the time the mixture was prepared and the time of 3D printing using the mixture) on the mechanical properties and rheological properties of the biomass–fungi mixtures, as well as the minimum printing pressure required for continuous extrusion during 3D printing, and the quality of the printed samples (characterized by layer height shrinkage and filament width uniformity) [21].
Since the authors of this paper published the first paper on extrusion-based 3D printing method using biomass–fungi biocomposite materials, other researchers have also published papers involving extrusion-based 3D printing of biomass–fungi biocomposite materials. One research group developed a dedicated extrusion system for robotic printing, and investigated the manufacturing processes as well as rheological and biological behavior of the biomass–fungi materials [18]. Another research group investigated 3D printing workflows and extrudable mixtures with mycelium-based composites that were cultivated on wastepaper and waste cardboard. They also investigated ways to mitigate contamination [22]. Another article [23] reported a novel fungi extrusion-based 3D printing method using a non-fluid agar gel and non-sterile printing conditions, incorporating recycled coffee grounds as a nutrient source. A new ink composition was developed for accessible and sustainable fungi 3D printing, eliminating the need for expensive equipment and extensive sterilization, opening possibilities for applications like self-regenerating materials or binding agents. Another article reported an investigation into the effects of temperature and various growth media on the fungal growth of two white rot fungi, Pleurotus ostreatus (Winter Oyster) and Ganoderma lucidum (Reishi), under laboratory conditions. The results revealed that potato dextrose agar was the most effective medium for promoting fungal growth in both fungal strains [24]. The literature does not include any papers regarding the effects of mixing and printing parameters on fungal growth in the 3D printing-based manufacturing method using biomass–fungi biocomposite materials. This paper aims to fill this gap by presenting an investigation into the effects of mixing parameters on fungal growth in the biomass–fungi mixtures prepared for printing and the effects of printing parameters on fungal growth in the printed samples.

2. Materials and Methods
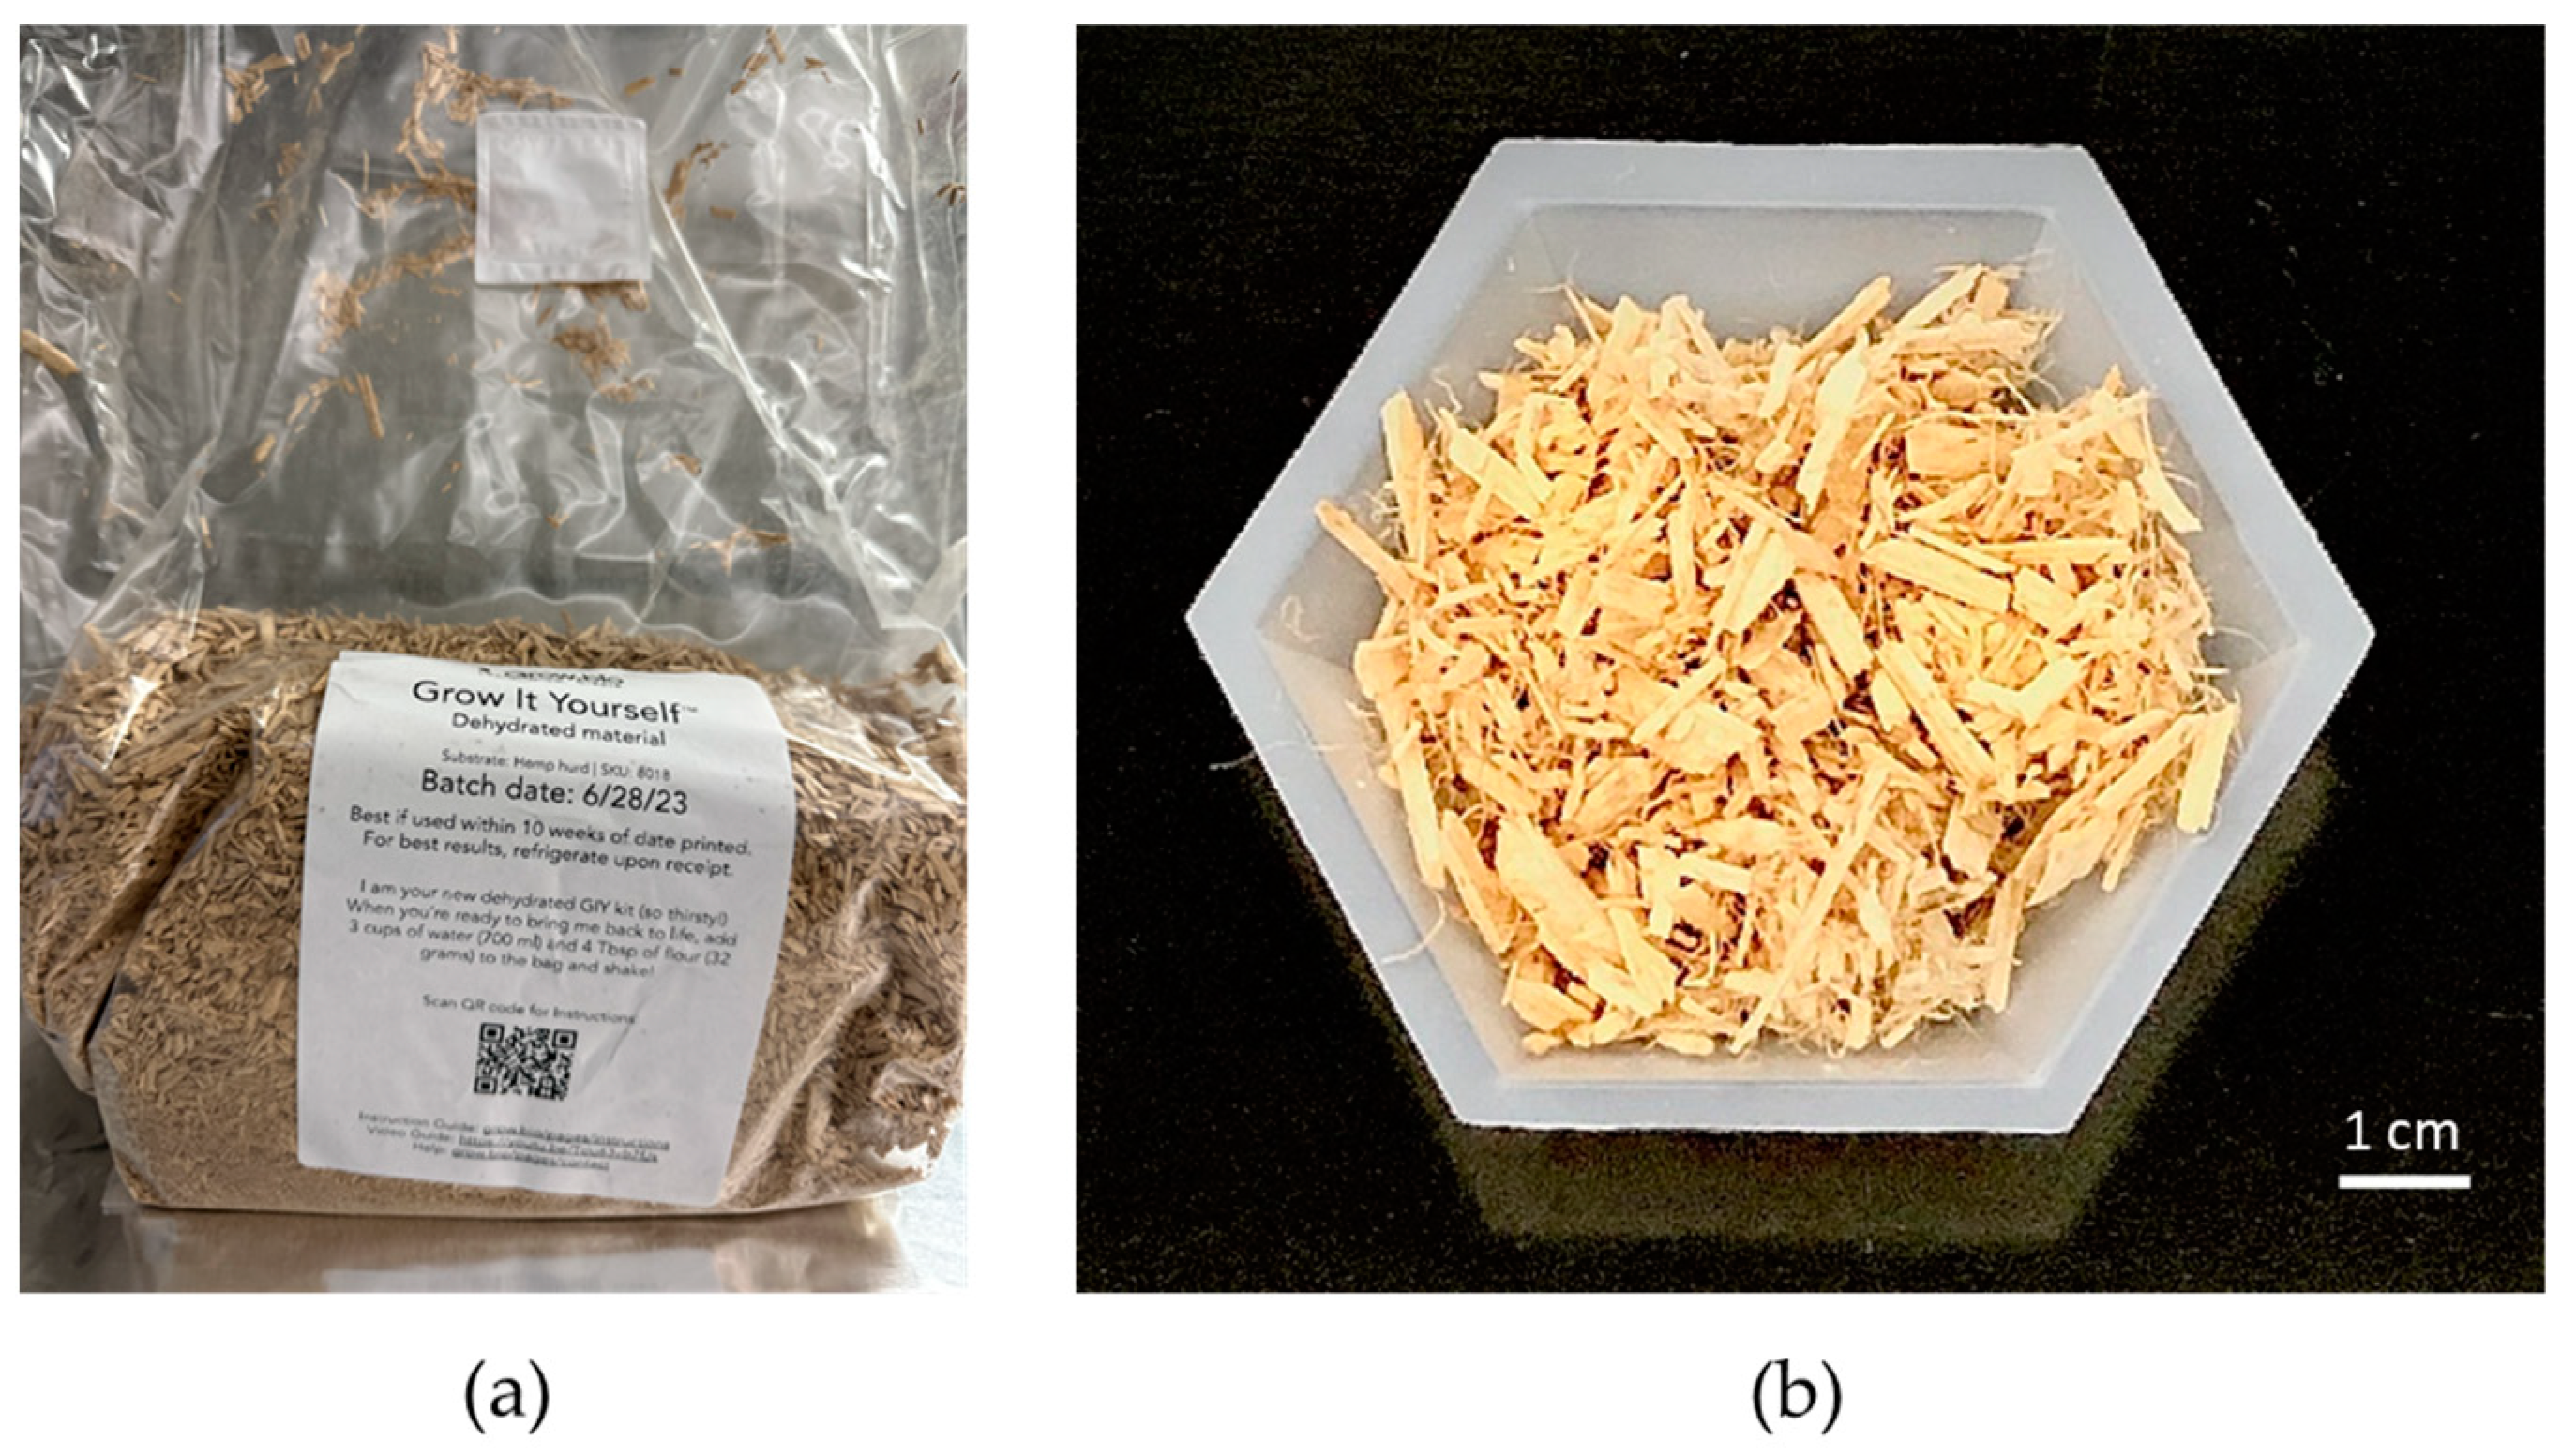
2.1. Materials

The biomass–fungi material was procured from GROW.bio (Green Island, NY, USA) and was received in a polypropylene bag with a square-shaped filter (1.5 × 1.5 inch in size) with 0.2 µm pores. The biomass material comprises hemp hurd [2]. Based on the sieve analysis of the biomass material, more than 80% of the particles were greater than 1 mm in size. While 92% of the particles passed through a sieve with a mesh opening of 4.75 mm, only 4% of the particles passed through a sieve with the mesh opening of 600 µm. Figure 1 shows the biomass–fungi material. Wheat flour (all-purpose flour: Great Value, Walmart, Bentonville, AR, USA) and psyllium husk (NOW Supplements, Bloomingdale, IL, USA) were purchased from a local Walmart store.

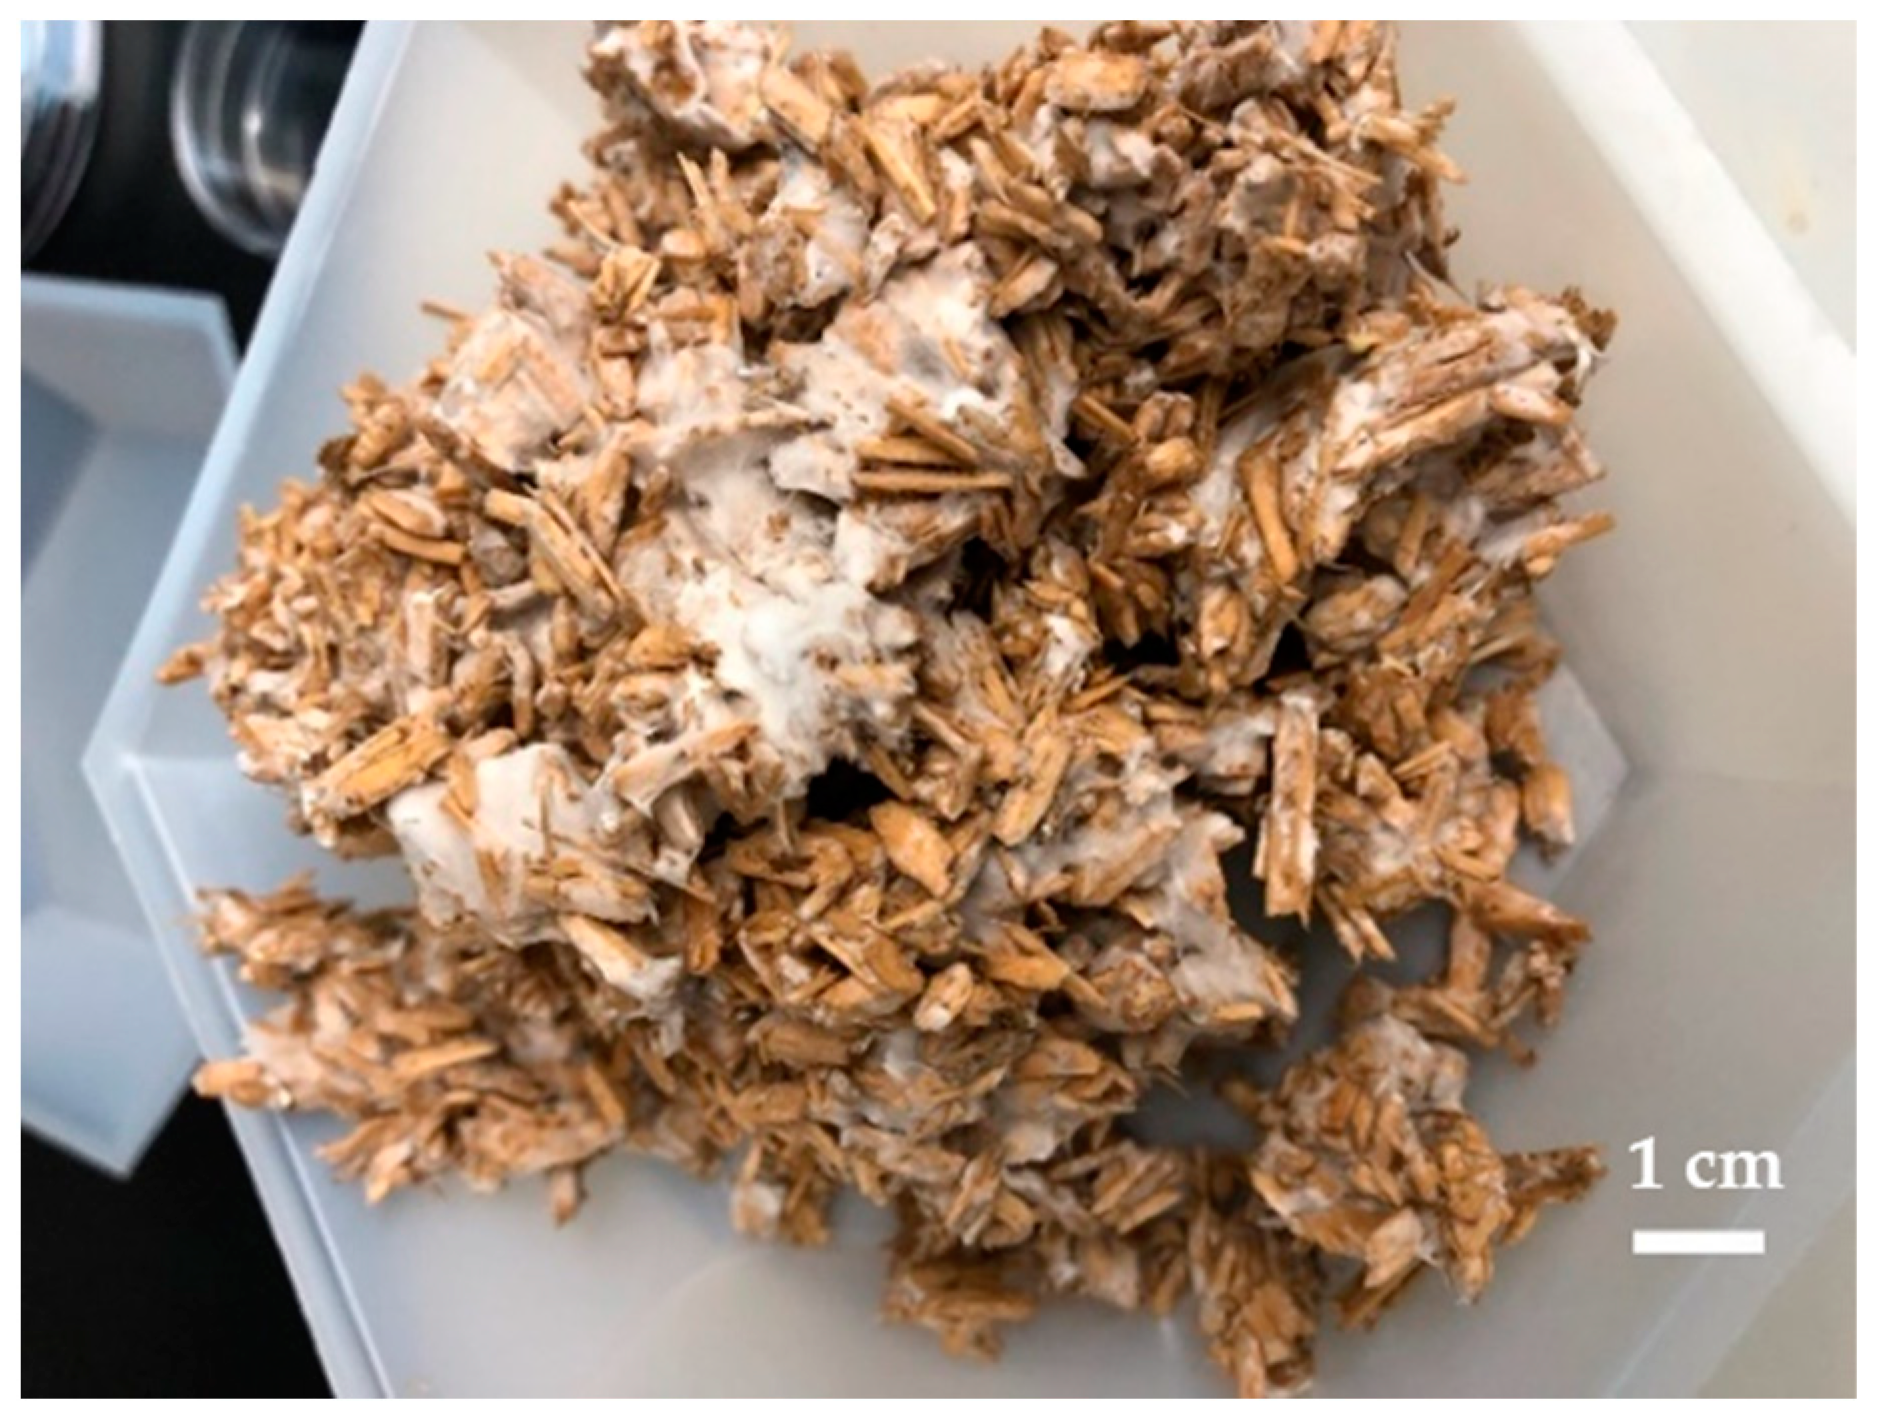
2.2. Preparation of Biomass–Fungi Mixtures for 3D Printing

Water and wheat were sterilized in the autoclave machine at 120 °C for 50 min. Then, 700 mL of autoclaved water and 32 g of autoclaved wheat flour were added to the filter patch bag that contained the as-received biomass–fungi material. The bag was shaken vigorously by hand for one minute. This bag was then stored in a closet at 23 °C for five days for fungi to grow (i.e., primary colonizing). Figure 2 show some biomass–fungi material after primary colonizing.
Then, 100 g of primary colonized biomass–fungi material were broken into small chunks by hand and mixed with 400 g of autoclaved water and 20 g of autoclaved wheat flour using a commercial mixer (NutriBullet PRO: Capital Brands, Los Angeles, CA, USA). Mixing time refers to the duration of mixing. The two different mixing modes used were continuous or intermittent. During continuous mixing, the mixing was performed for the full duration without stopping. For intermittent mixing, the mixing was performed for a period of five seconds. Afterwards, the mixing container was shaken manually twice to ensure good contact of the mixture with the blades. Then the mixing was started again. Thereafter, 20 g of psyllium husk powder was mixed into this mixture using a spatula.
Results regarding the effects of mixing parameters on fungal growth in mixture were used to select mixing time (120 s) and mixing mode (intermittent) to prepare the mixtures for 3D printing experiments.

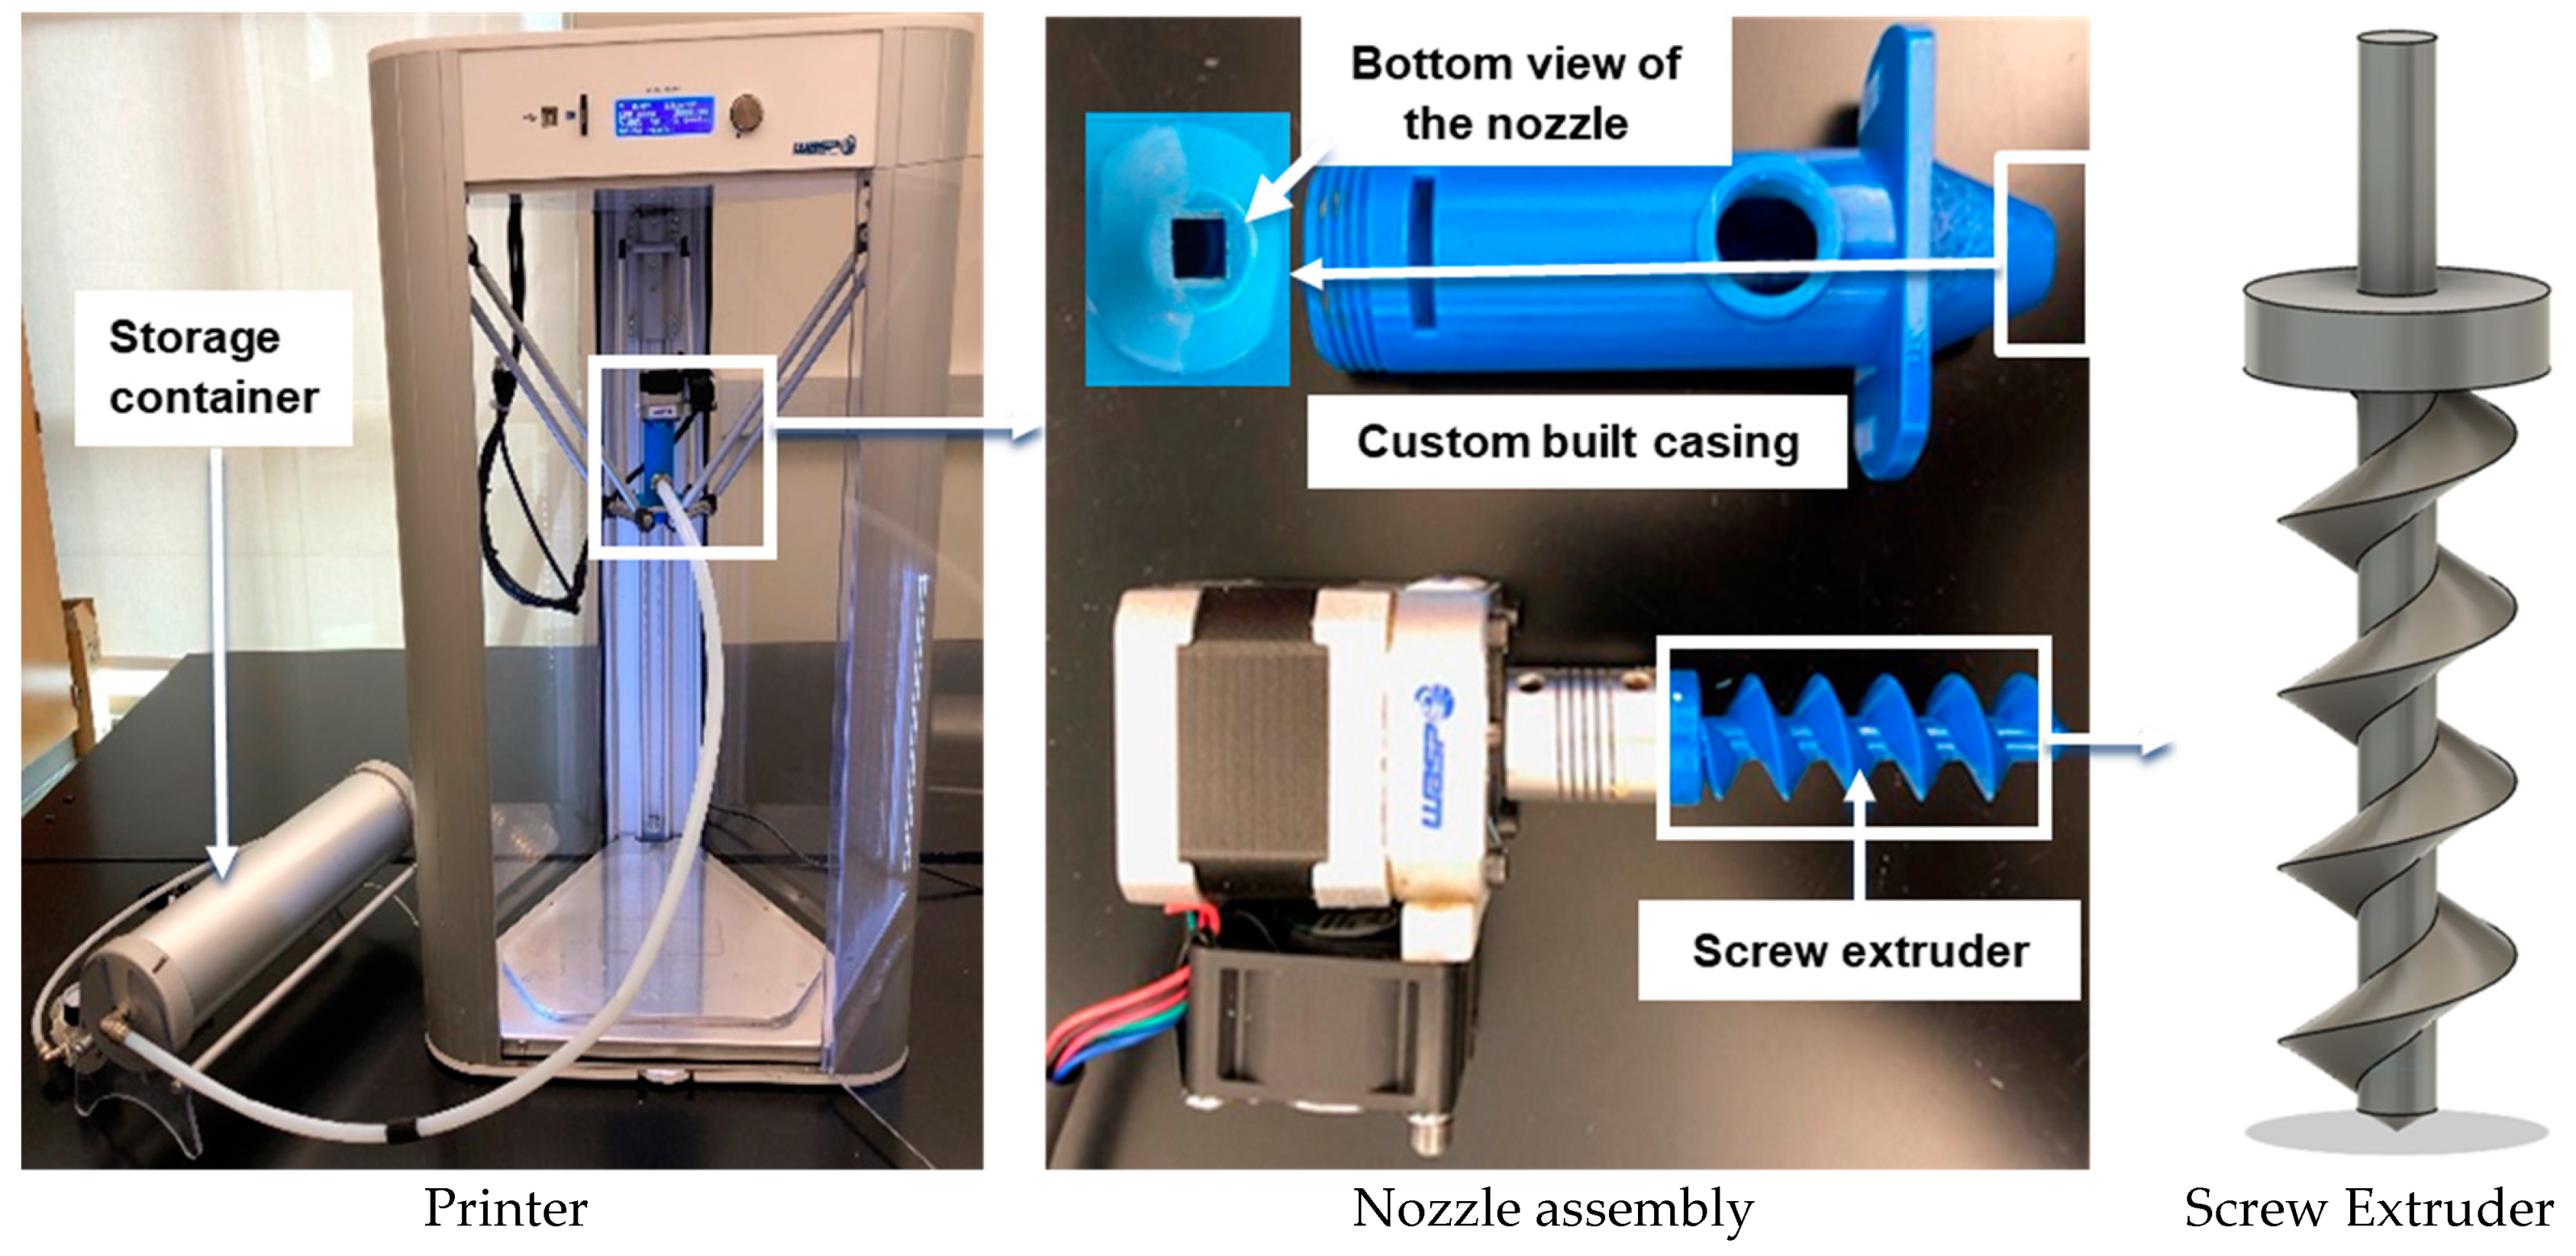
2.3. Three-Dimensional Printing Experimental Setup

The WASP Delta 2040 (WASP, Massa Lombarda RA, Italy) 3D printer shown in Figure 3 was used for the printing experiments. This printer was equipped with an LDM (Liquid deposition modeling) extruder kit [20,21] and a material storage container (with a storage volume of 3 L). A pneumatically operated plastic piston was used to push the mixture through the nozzle assembly. The custom-built nozzle assembly comprised a screw extruder and a casing with a 6 mm opening. The screw extruder had 15 mm outer diameter, 44 mm height, and 11 mm pitch. During printing, the screw extruder rotated at 2 revolutions per second for printing speed of 30 mm/s and 8 revolutions per second for printing speed of 120 mm/s. The average temperature for all test conditions was 22 °C.
The size of the printed samples was 80 mm × 80 mm × 30 mm (Figure 4). Their layer height was 6 mm and infill ratio was 50%. Slic3r software (version 1.3.0) was used to generate the G-code for the 3D printer.

2.4. Measurement of Fungal Growth

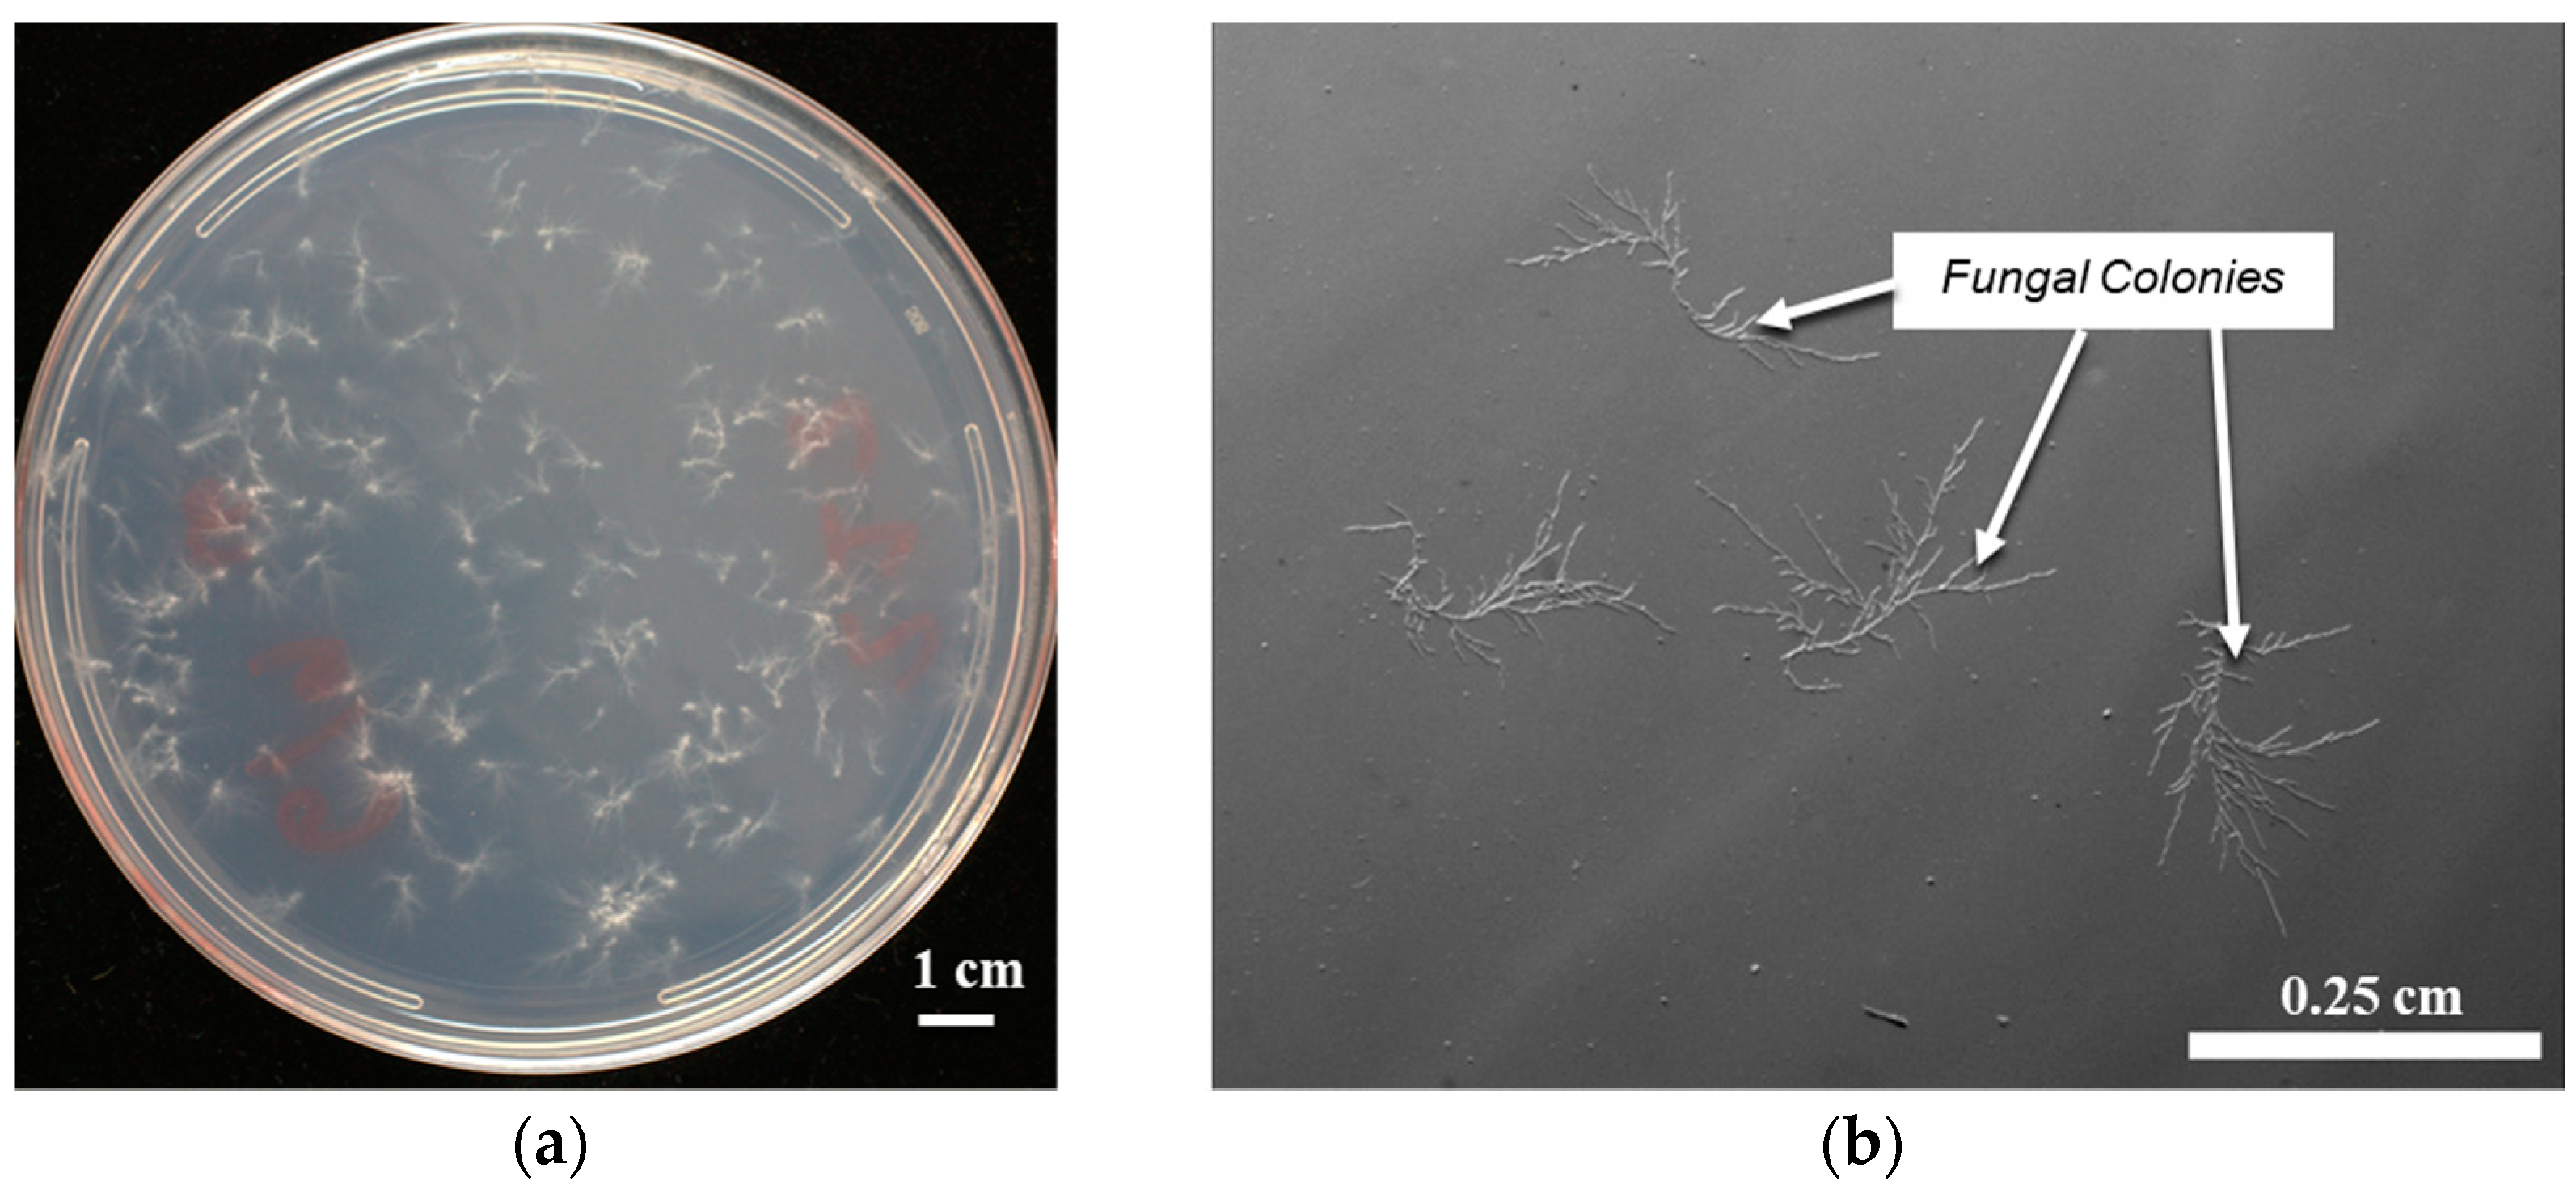
2.4.1. Counting Colony-Forming Units per Milliliter Using Optical Microscope

An optical microscope was used to count colony-forming units per milliliter. This method was used by other authors in their studies [25,26]. There are other evaluation methods for fungi growth, such as comparison of hyphal length, mycelium dry weight, and colony diameter [27]. The authors will use more methods to evaluate fungi growth in their future investigations.
Colony-forming units per milliliter (CFUs/mL) was used to quantify the fungal growth in biomass–fungi mixtures prepared for 3D printing or in printed samples. After the mixtures were prepared or samples were printed, one gram of the mixture or printed sample was suspended in 10 mL of autoclaved water. Then this solution went through serial dilution, where 1 mL of this solution was further mixed with 10 mL of autoclaved water and then this step was repeated. Subsequently, 100 µL of the diluted solution was spread onto half strength Potato Dextrose Agar (HPDA) [28] plates (19.5 g/L Difco PDA (Potato Dextrose Agar), adjusted to 1.5% agar). The nutrient-rich PDA was used as growth medium [24]. The result of spreading the diluted solution on the HPDA plates is called the “plated sample” in this study (Figure 5a).
All the plated samples were incubated at 22 °C for 48 h. This temperature level (22 °C) was selected as it was the optimum temperature for fungal growth [29]. One image was taken for each sample. The colonies appeared to be uniformly distributed over the plate. Then the number of fungal colonies were counted under an Olympus SZX9 dissecting microscope using a Hamamatsu ORCA-ER digital camera connected to the Slidebook 5.0 software. This number was multiplied by 10,000 to obtain the colony-forming units because of the serial dilution performed while making the plated samples. This number represented the number of viable fungal colonies present in the mixture or the printed sample (reported herein as CFUs/mL). Figure 5 shows some pictures of plated samples.

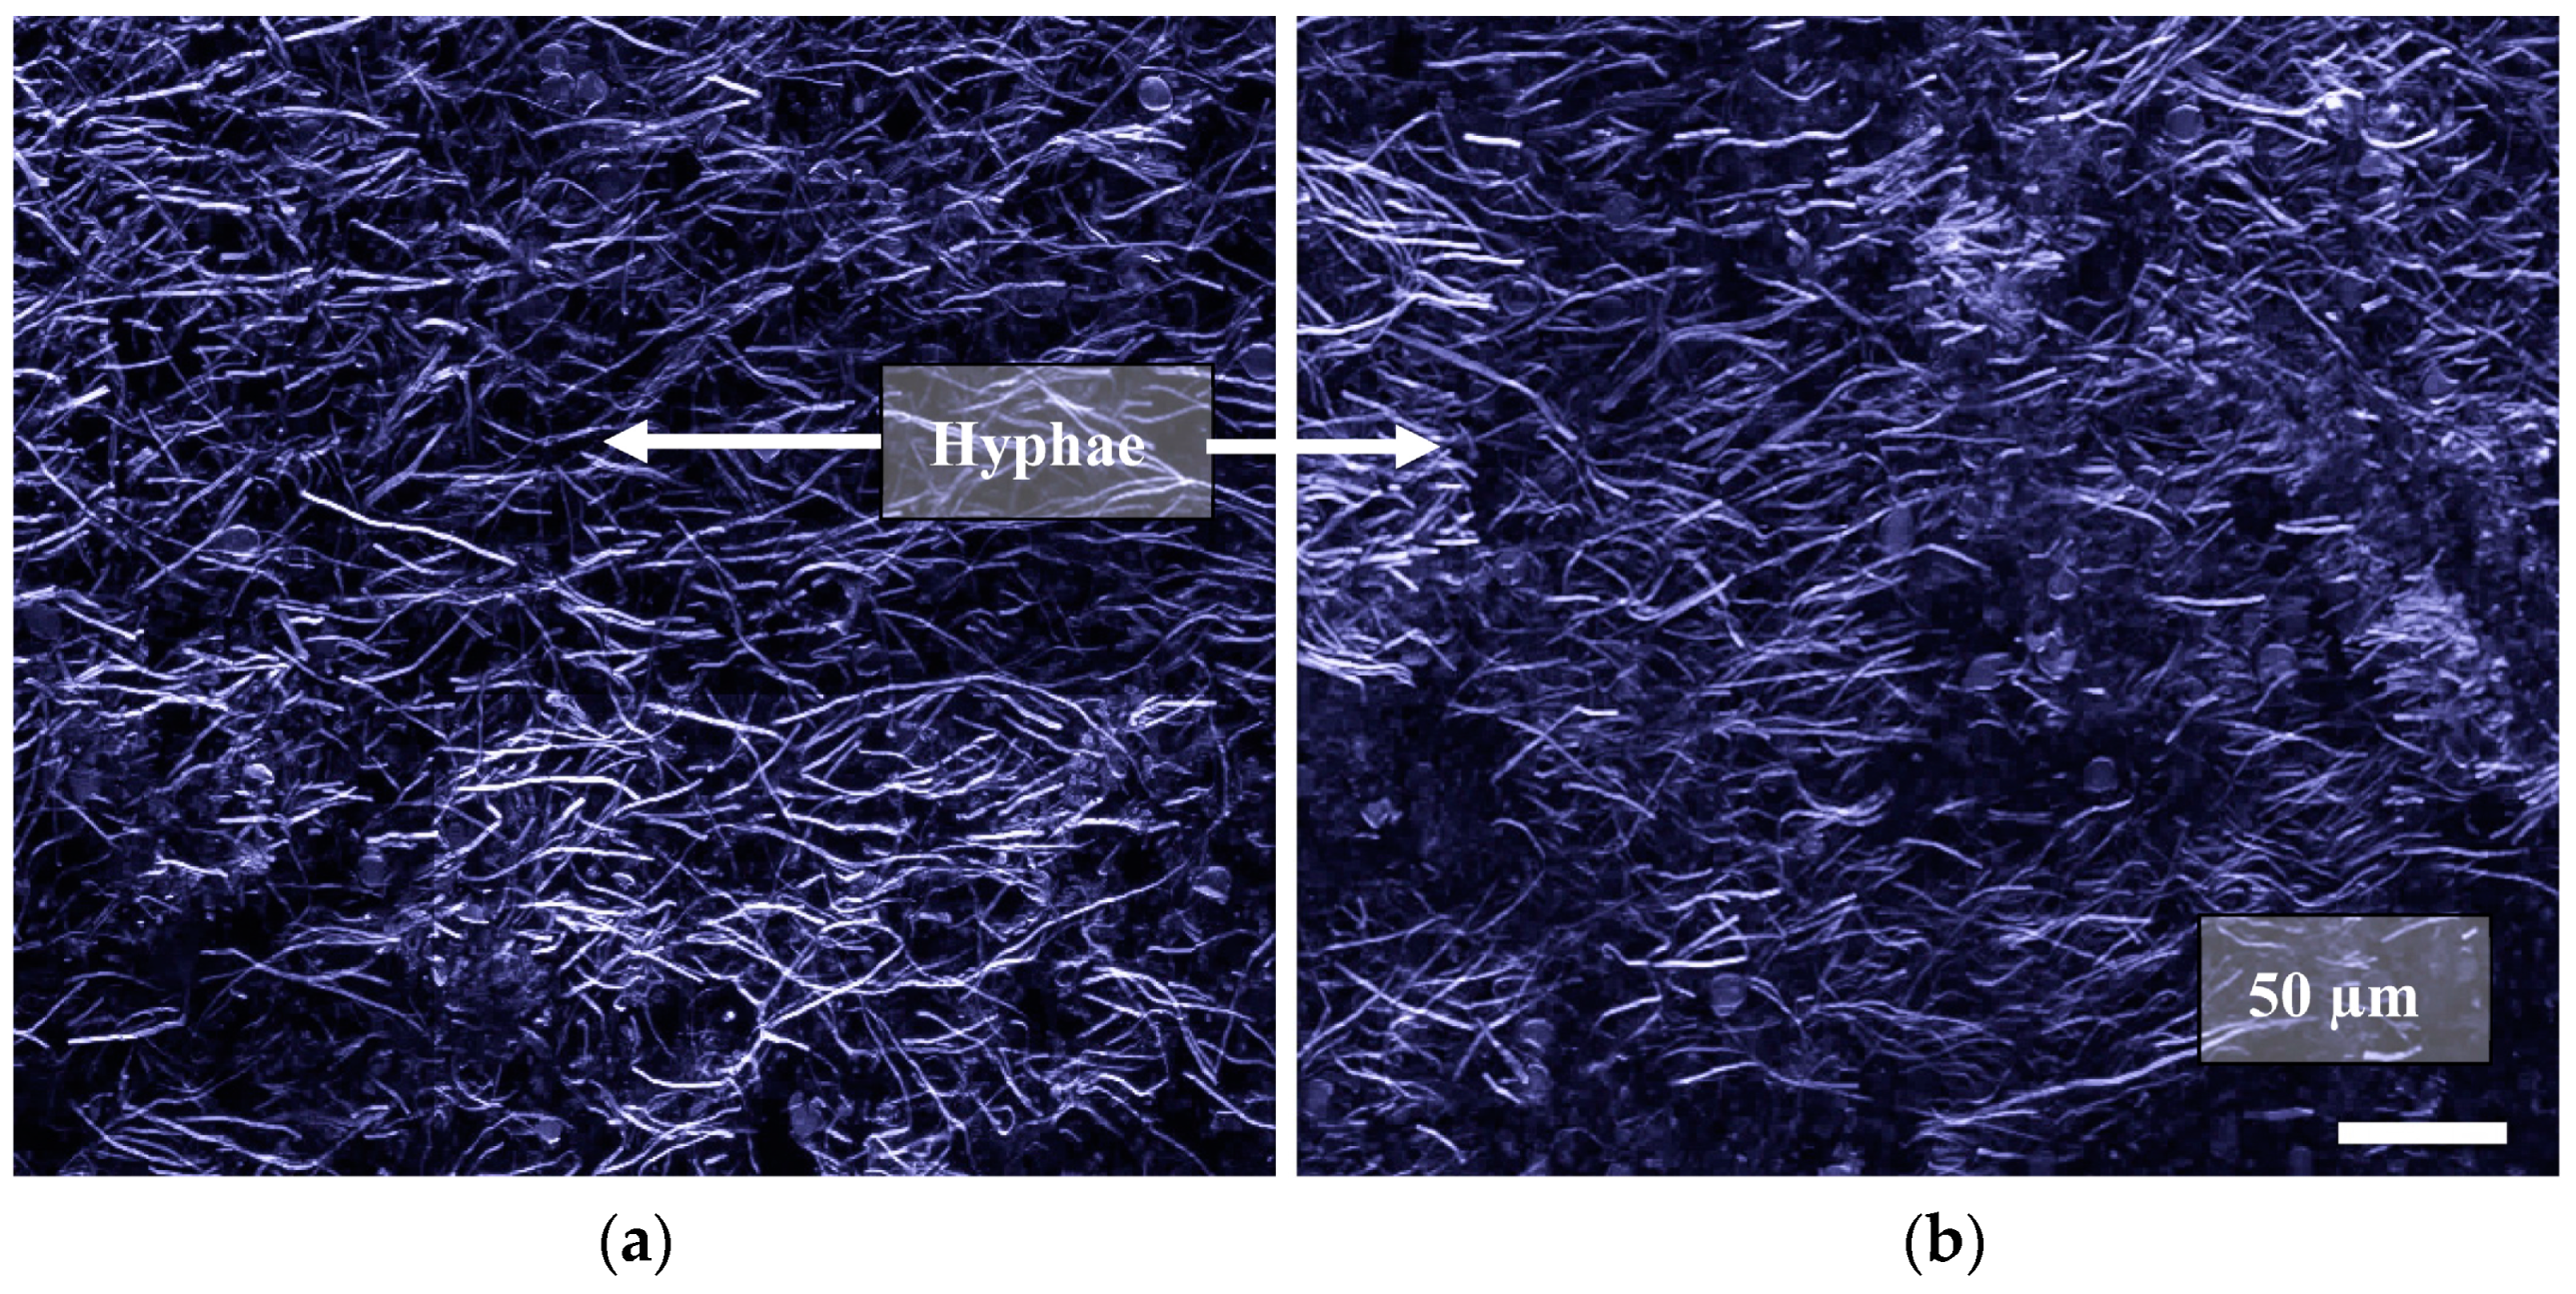
2.4.2. Observing Fungal Colonization of the Substrate Using Confocal Microscope

Fluorescently labeled printed samples were observed using an Olympus FV3000 laser scanning confocal system mounted to an Olympus IX83 inverted microscope with a galvanometer scanner and high sensitivity GaAsP PMT detectors (Olympus America, Center Valley, PA, USA). The objective used to image fluorescently labeled hyphae was the UPlanSAPO 10× (NA = 0.4), which utilized the 405 nm laser line to excite hyphal cell walls labeled with 10 µg/mL calcofluor white (CFW). CFW is a chitin-binding fluorescent dye that has been shown to effectively label fungal cell walls [30]. Fluorescence images were generated via optical sectioning of multiple planes in the z-axis and combining them into a single max-projected image. These images were then exported via Olympus Cellsens software (version 2.3) and figures were created using GIMP software (2.10.20).

2.5. Design of Experiments

A 22 (two factors, two levels, four tests) full factorial design was used to study the effects of mixing parameters on fungal growth in mixtures prepared for 3D printing. The experiment matrix is shown in Table 1 and the factor levels are listed in Table 2. Five repetitions were conducted under each test condition described in Table 1 each day. The experiments were replicated over three consecutive days. Consequently, a total of sixty runs were conducted. A thermometer was used to take the temperature of the mixture after each mixture preparation.
Table 3 shows the two printing parameters (printing speed and extrusion pressure) and their values which were used to study the effects of printing parameters on fungal growth in the printed samples. Five samples were printed for each of the two printing parameter combinations (the combination of high printing speed and high extrusion pressure, or the combination of low printing speed and low extrusion pressure). From each printed sample, one plated sample was taken for measurement of fungal growth using Olympus SZX9 dissecting microscope. Five plated samples were also taken from the mixtures that were not used for printing as a baseline. So, a total of 15 plated samples were used to investigate the effects of printing parameters on fungal growth.

2.6. Statistical Analysis

The differences in fungal growth (CFUs/mL) in mixtures caused by change in the mixing parameters were examined by t-tests (one-tailed for increase or decrease and two-tailed for difference) using Minitab software (2019) (Minitab, State College, PA, USA). ANOVA (analysis of variance) was also conducted to find out the significance level at which each factor’s effect was statistically significant. p-value is the lowest significance level at which the effect of a factor is significant [31,32]. In other words, if the significance level is set at a value lower than the p-value, the effect of the factor will not be statistically significant. A significance level of 0.05 is used to determine whether a difference is statistically significant when experimental results are presented in Section 3.
The differences in fungal growth (CFUs/mL) in printed samples, caused by changes in the printing parameters, were examined using one-way ANOVA (analysis of variance).

3. Results and Discussion

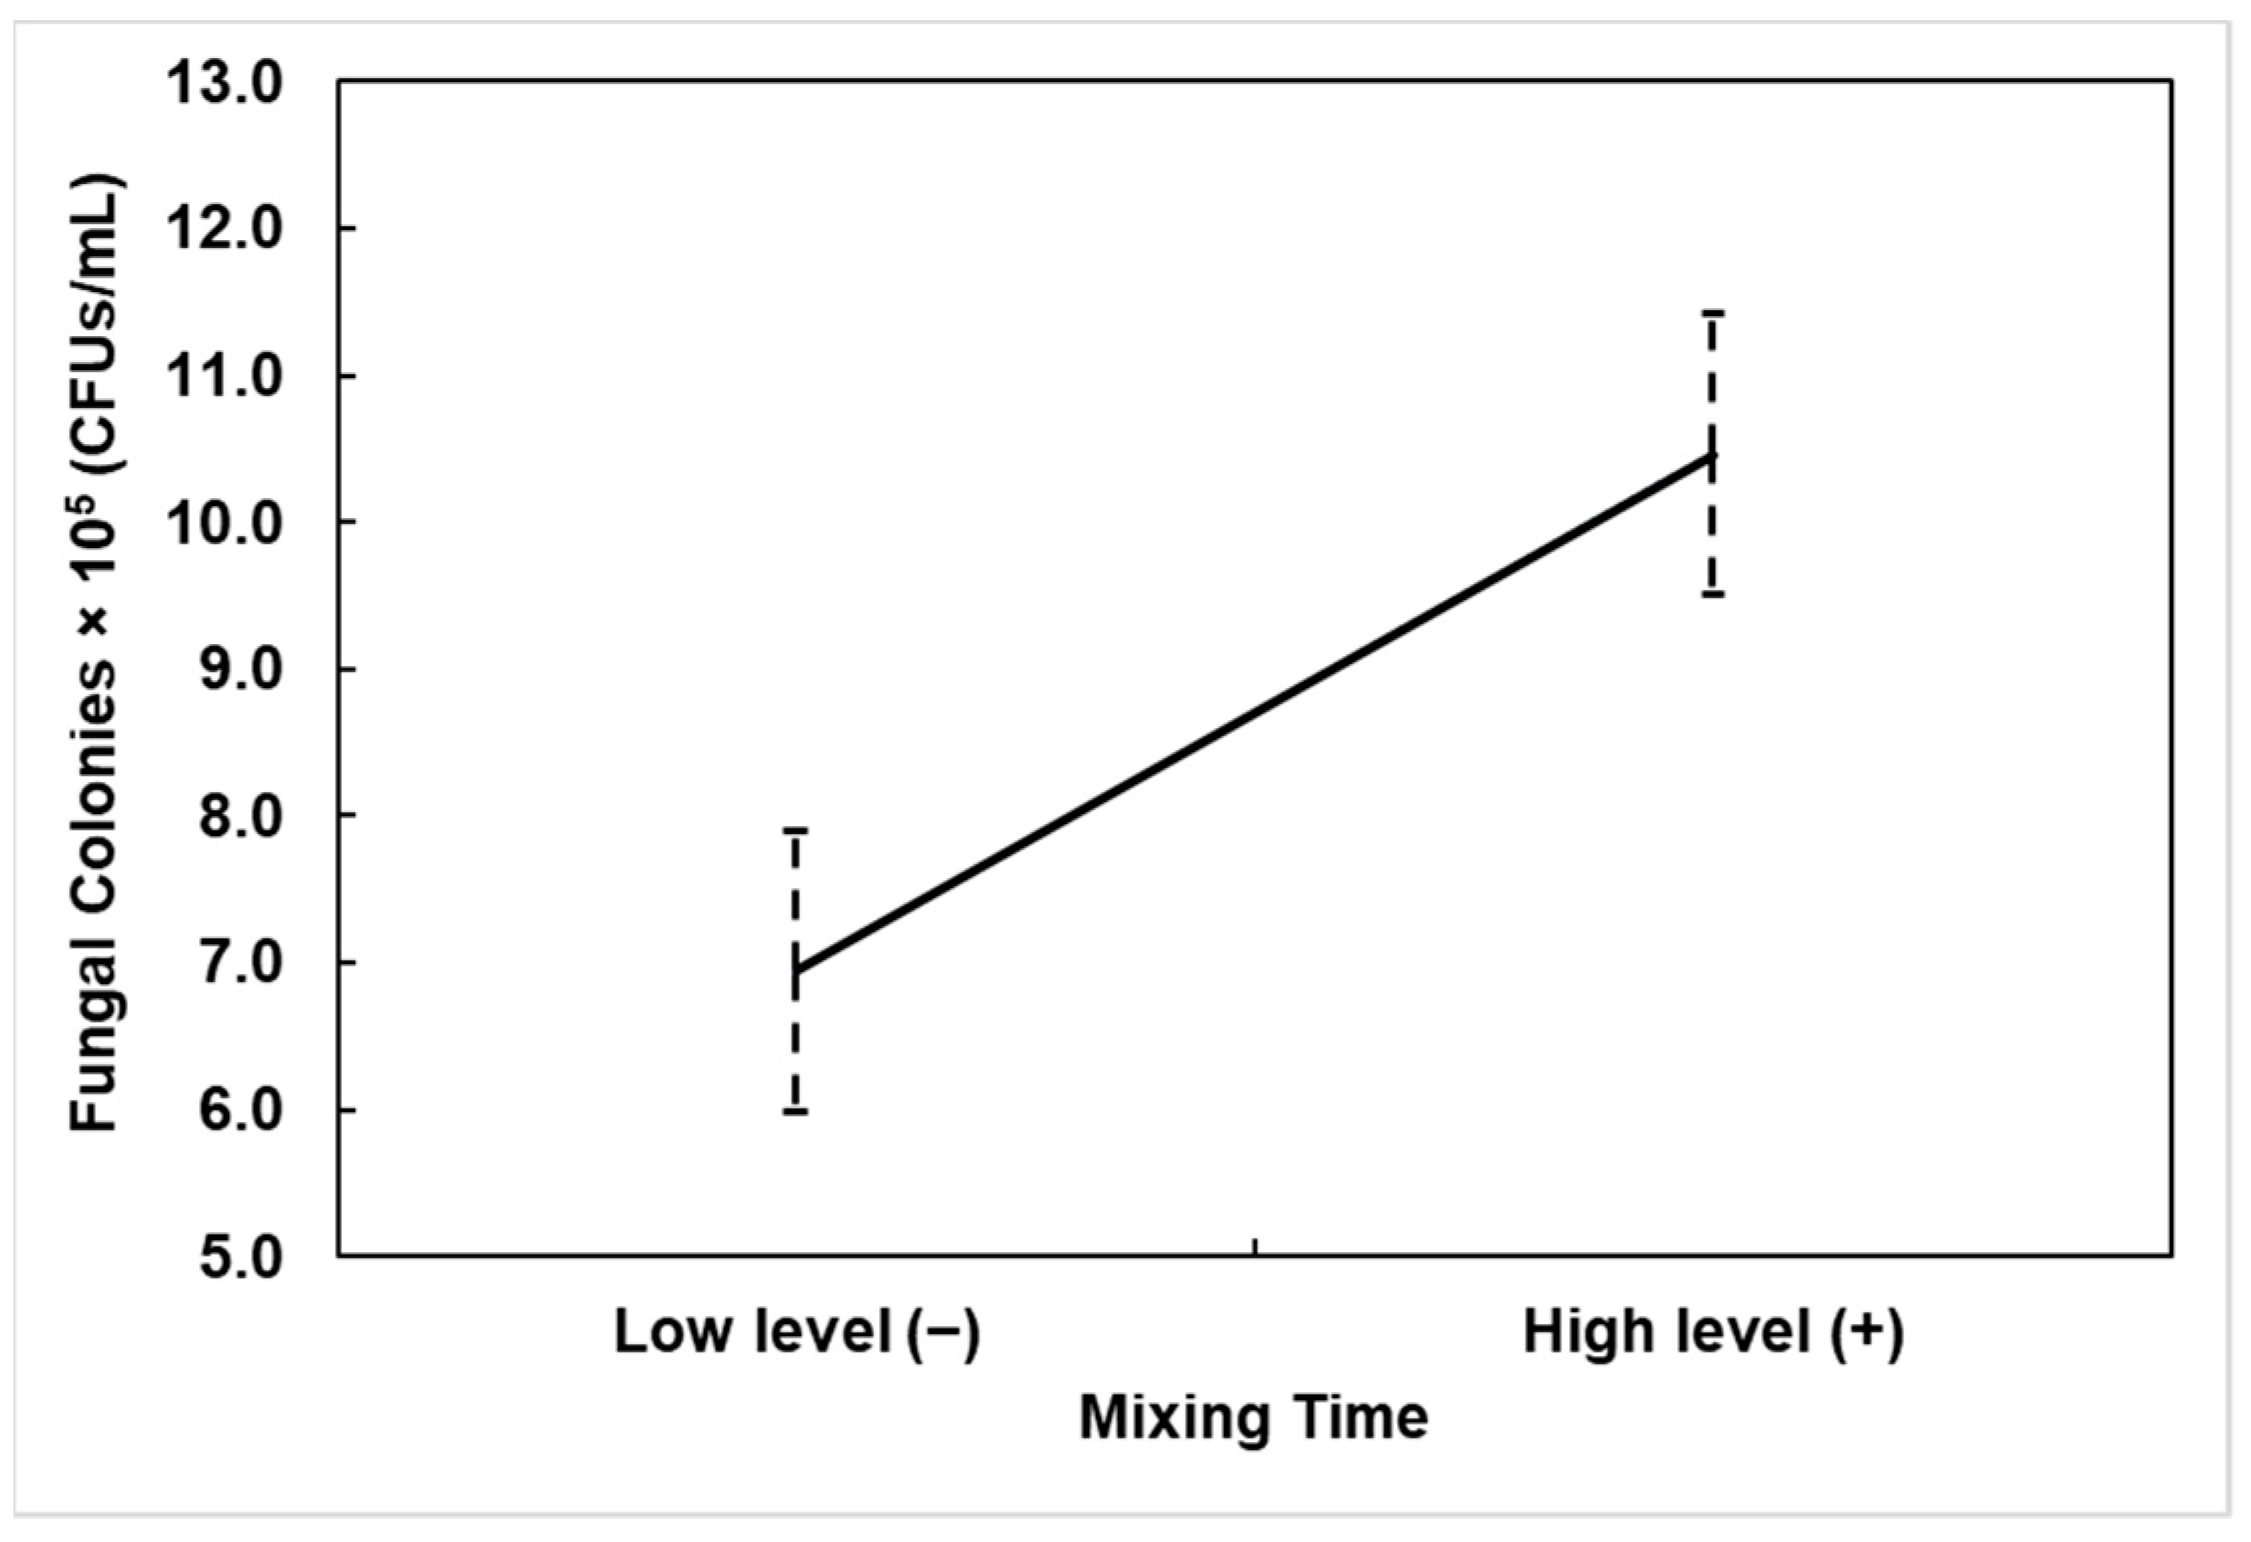
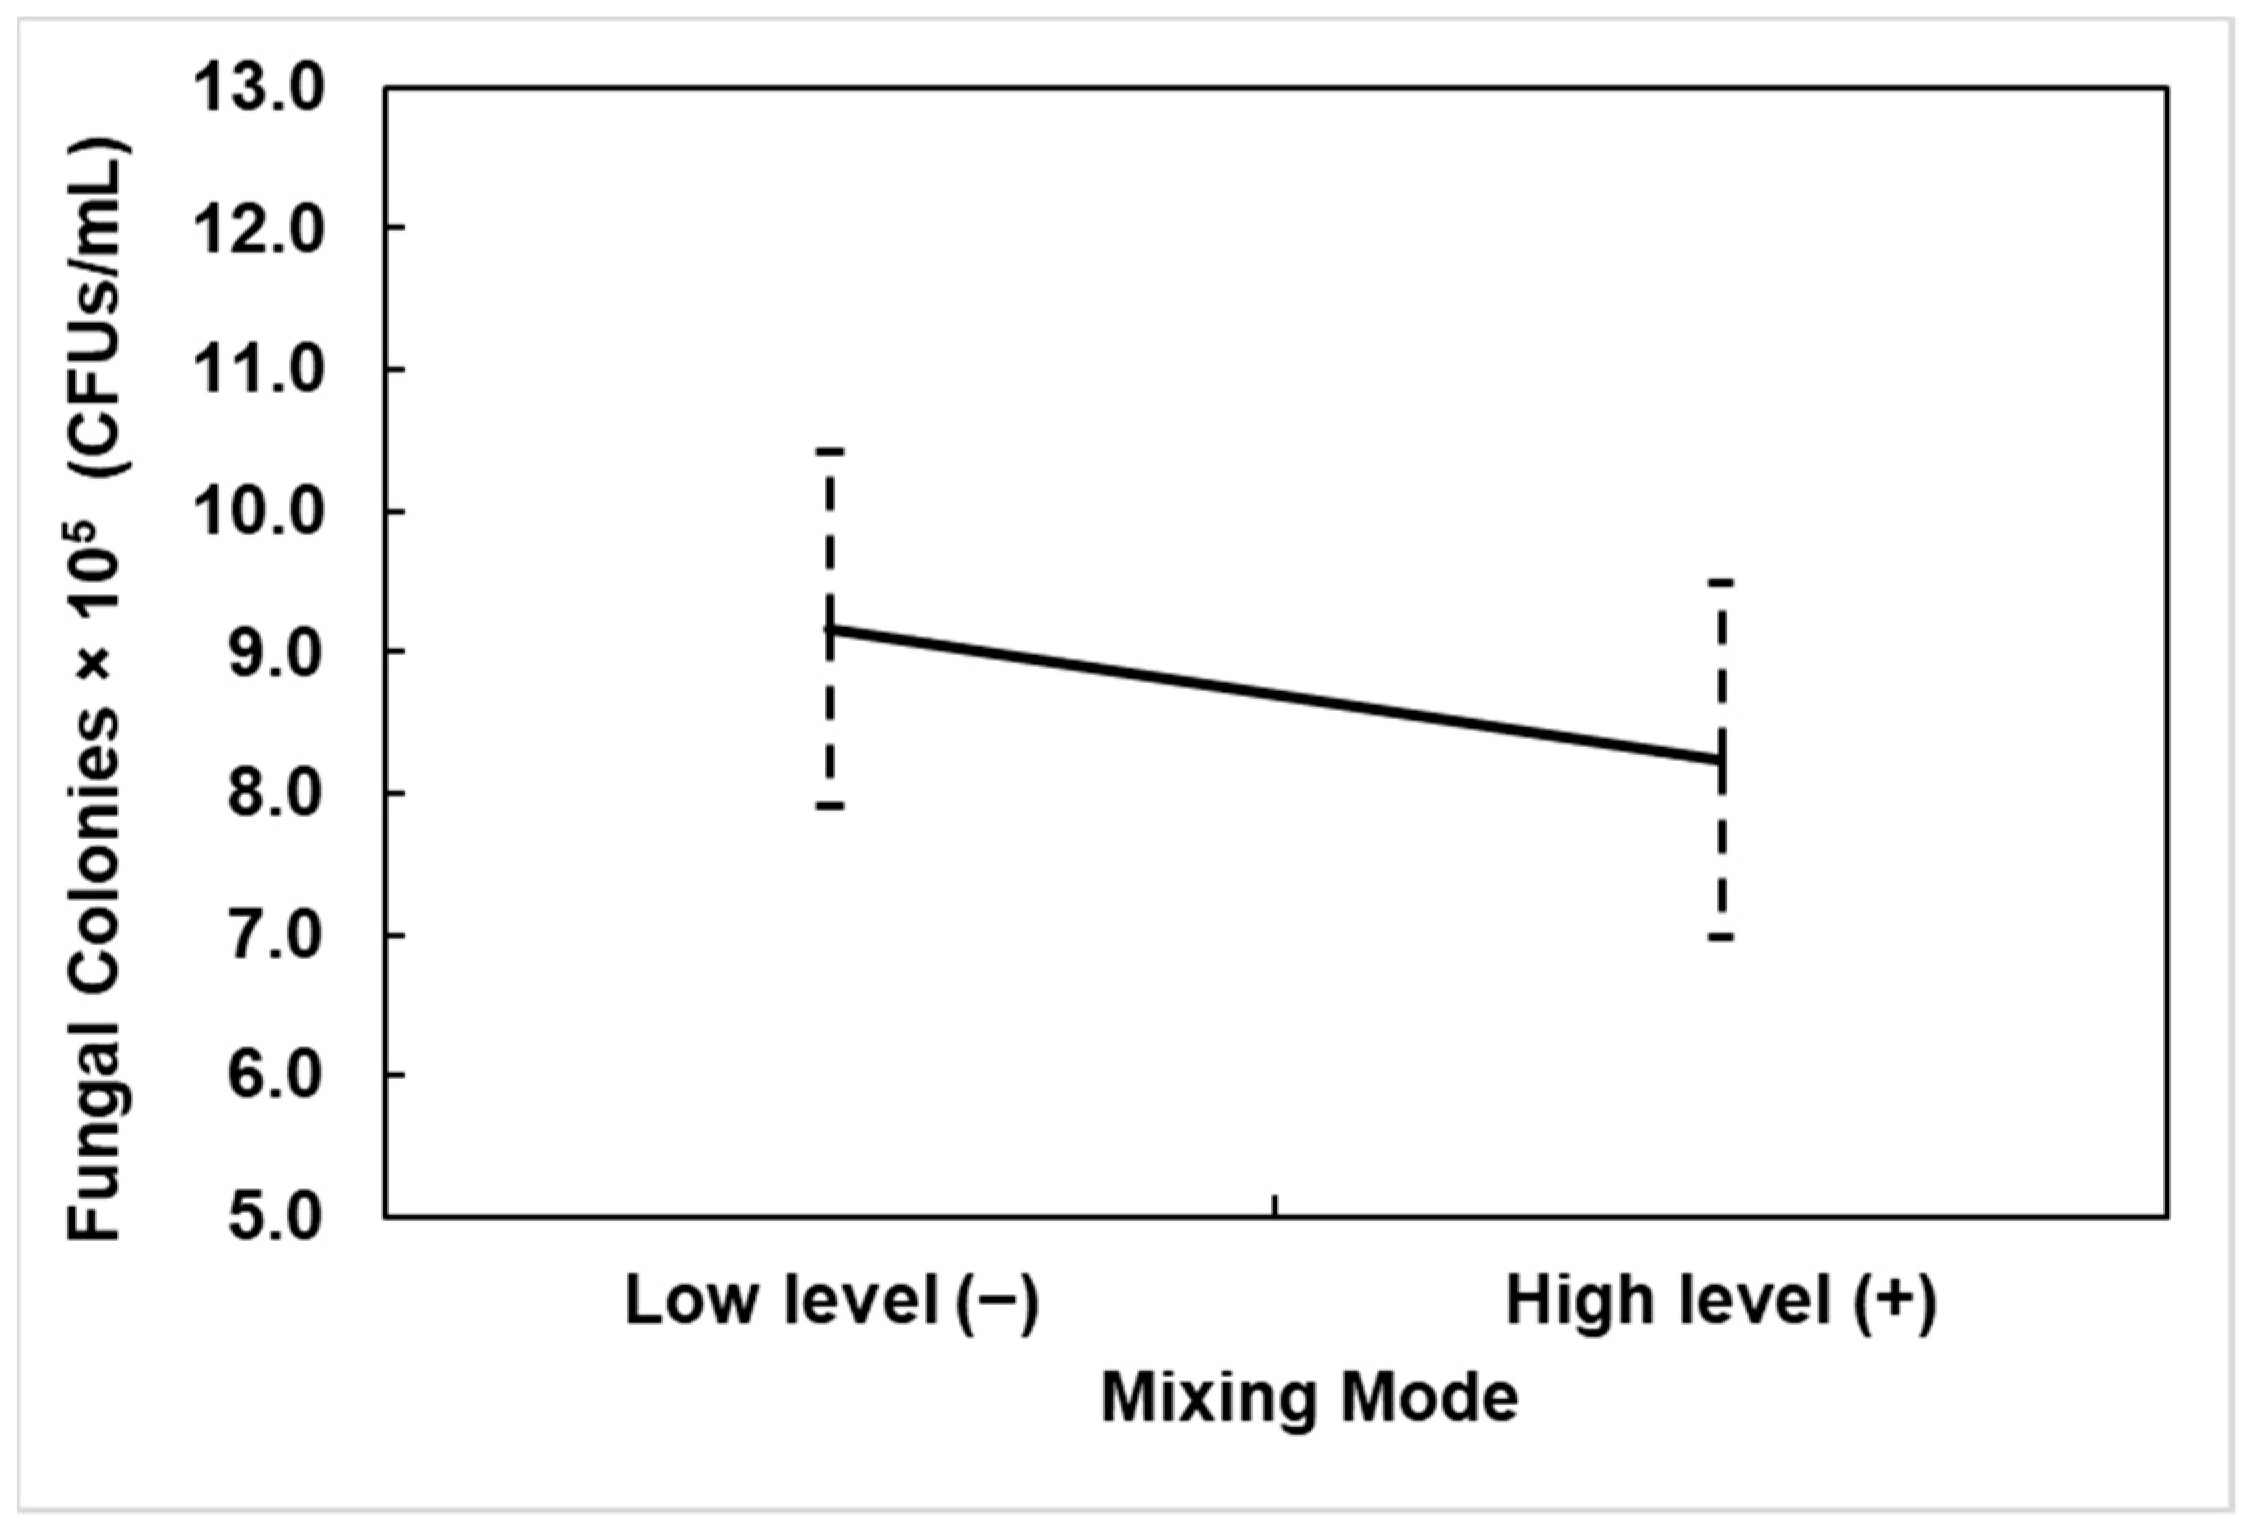
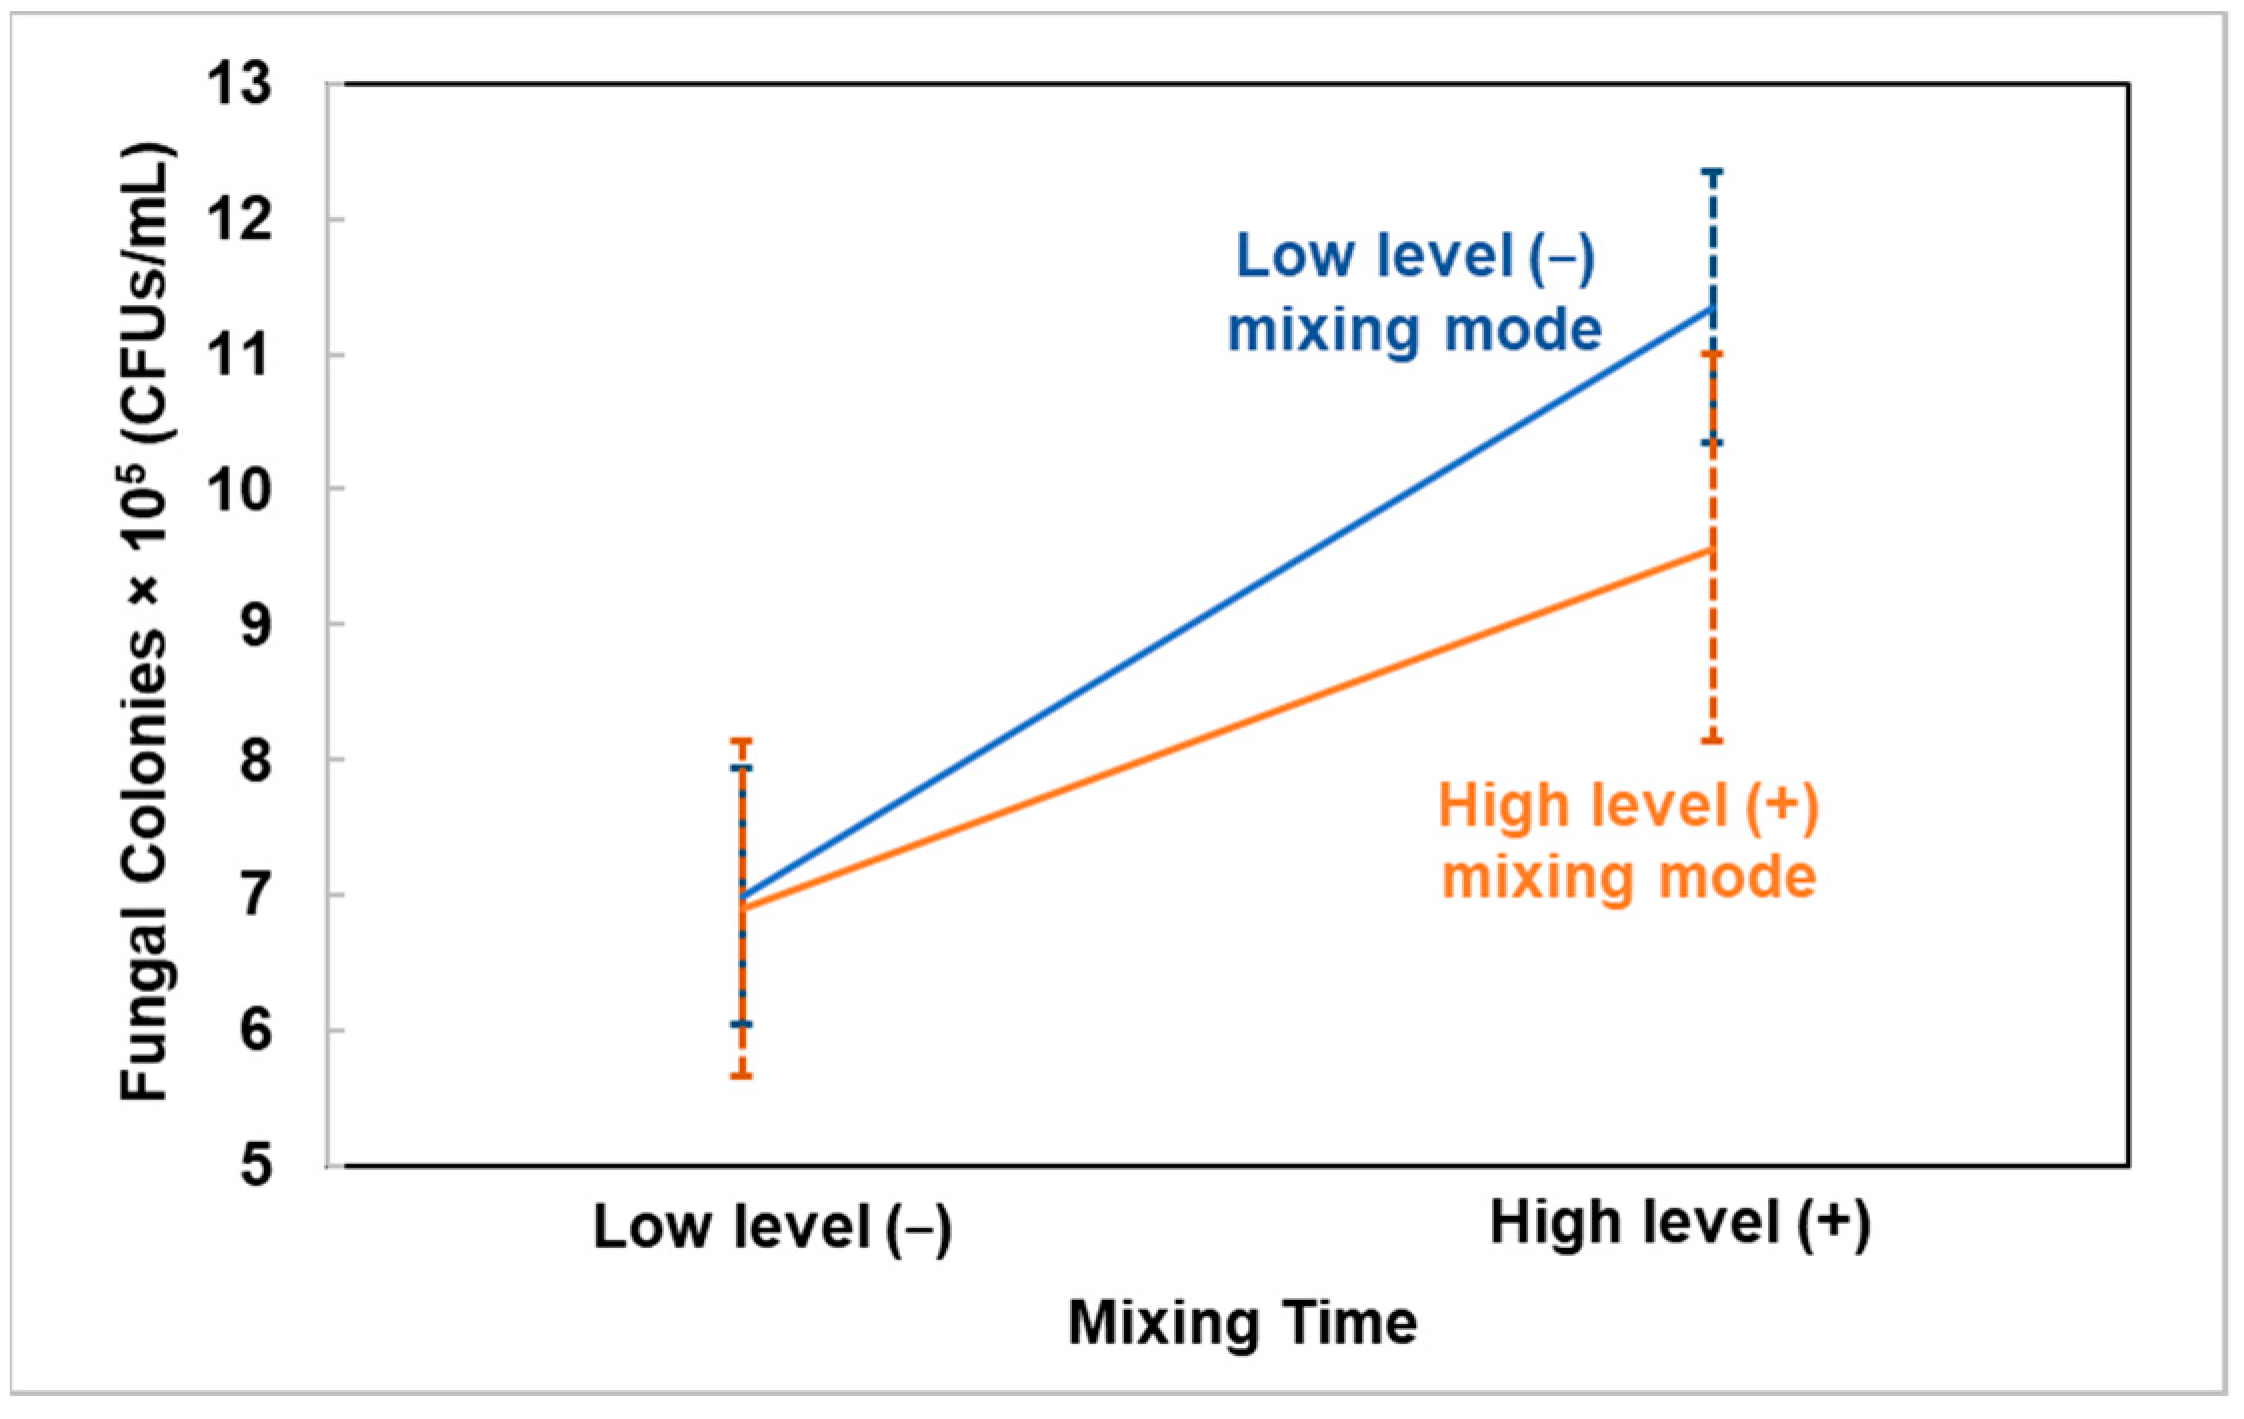
3.1. Effects of Mixing Parameters on Fungal Growth in Prepared Mixtures

The main effects of mixing time are shown in Figure 6. In Figure 6, the error bars indicate 95% confidence intervals in the means. It can be seen that the mixtures prepared at the lower level of mixing time (15 s) had an average fungal growth of 6.9 × 10⁵ CFUs/mL. In contrast, the mixtures prepared at the higher level of mixing time (120 s) had an average fungal growth of 10.5 × 10⁵ CFUs/mL. The results show that, when mixing time increased from 15 to 120 s, there was a 52% increase in fungal growth. A one-tailed t-test analysis showed that fungal growth in the mixtures prepared using a mixing time of 120 s was significantly higher than that in the mixtures prepared using a mixing time of 15 s, at the significance level of 0.05. The p-value for the effect of mixing time is 0.0001 (Table 4). A possible explanation for this observation could be as follows: a mixing time of 120 s would facilitate a better breakdown of the biomass material and the fungal inoculum as compared to a mixing time of 15 s. More surface area was available for the fungi to derive nutrition. Additionally, a longer mixing time could potentially enhance the distribution of the number of viable hyphal fragments dispersed throughout the mixture. The temperature recorded after mixing continuously for 120 s was 37.3 °C. This temperature was significantly lower than the temperature (93 °C) used to deactivate the fungi during the drying stage.
The main effects of mixing mode are shown in Figure 7. The error bars in Figure 7 indicate 95% confidence intervals in the means. It can be seen that the mixtures prepared by using the higher level mixing mode (continuous) had an average fungal growth of 8.2 × 10⁵ CFUs/mL, and the mixtures prepared by using the lower level mixing mode (intermittent) had an average fungal growth of 9.17 × 10⁵ CFUs/mL. The results show that, when mixing mode changed from continuous to intermittent, there was an 11% increase in fungal growth. Maximum temperatures recorded during the mixing process for continuous and intermittent mixing were 37.7 °C and 36.3 °C, respectively, when mixed for a duration of 120 s. The ANOVA table (Table 4) shows the p-value for the effect of mixing mode is 0.203. This means that the main effect of mixing mode is not statistically significant at the significance level of 0.05. This result seemed to contradict the results obtained by Fletcher et al. [24]. Fletcher et al. studied the effects of temperature and growth media on fungal growth (without mixing or 3D printing). They found minimal to no mycelium growth at 37 °C. According to Jayasinghe et al. [33], elevated temperatures could lead to the denaturation and deactivation of crucial enzymes responsible for catalyzing the metabolic activities of fungi. But in this study, fungi experienced the temperature of 37.7 °C or 36.3 °C for a very short period of time (approximately 5 min) before the temperature returned to 22 °C, while in other reported studies [24,29,33], fungi were kept at 37 °C for 2 to 12 days. This could potentially explain why the increased temperature resulting from the mixing mode did not exert a significant impact on the fungal growth in the mixtures.
The interaction effect of mixing time and mixing mode on fungal growth is shown in Figure 8. The error bars in Figure 8 represent 95% confidence intervals in the means. The change in mixing mode caused a larger change in fungal growth at the high level of mixing time (120 s) than at the low level of mixing time (15 s) and the p-value is 0.251 (Table 4). The interaction effect is not statistically significant at the significance level of 0.05.

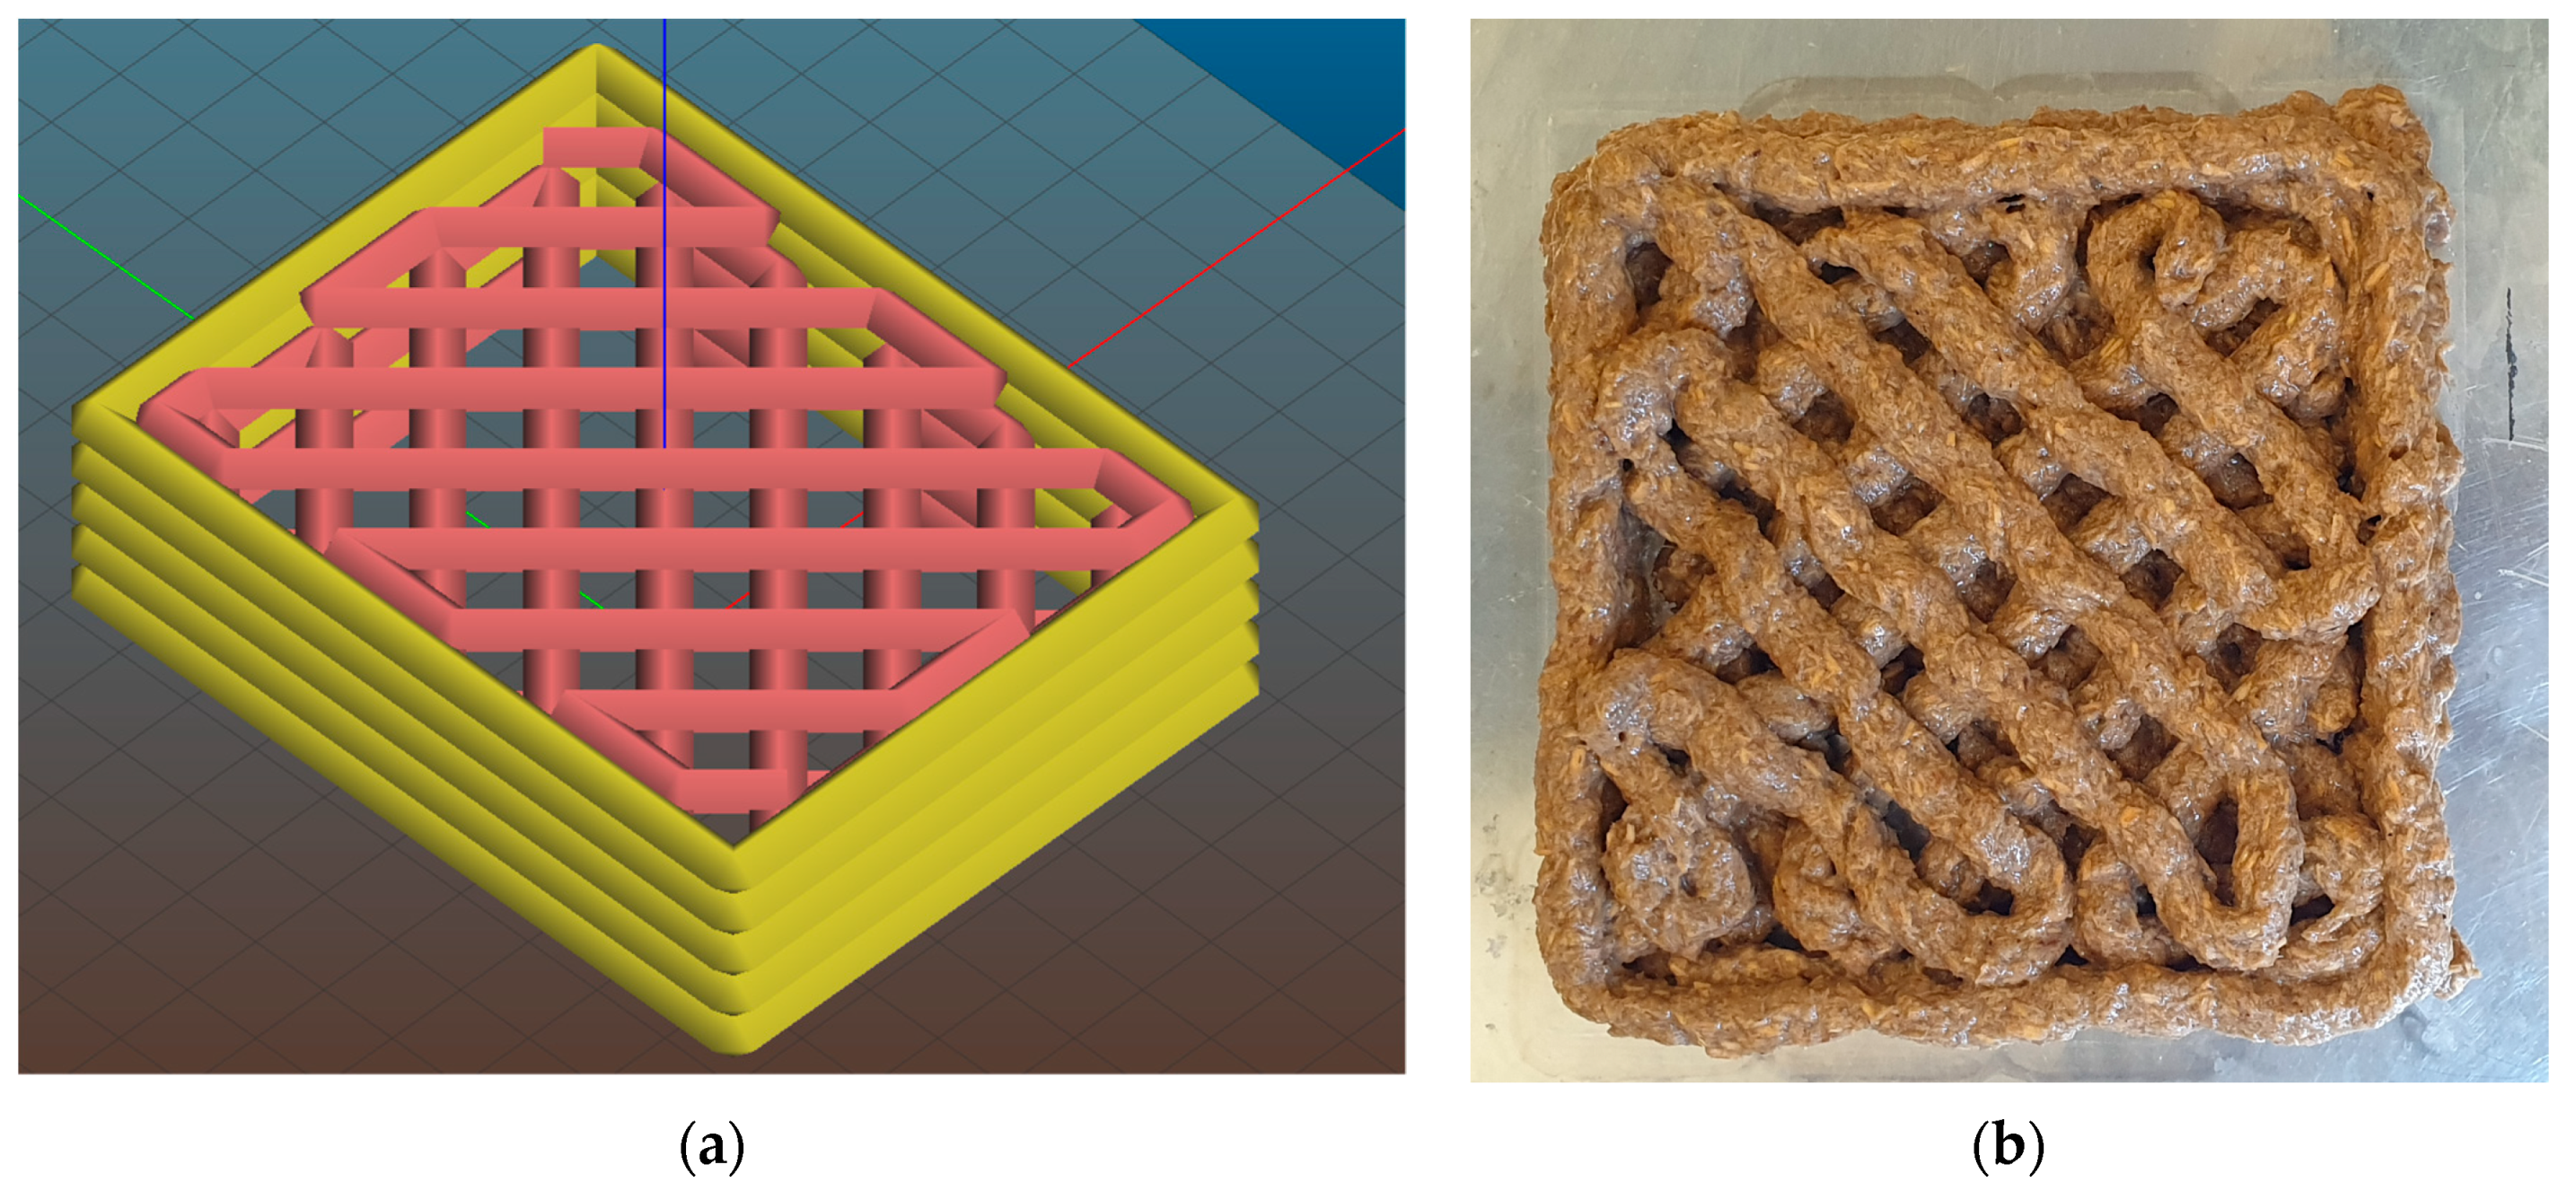
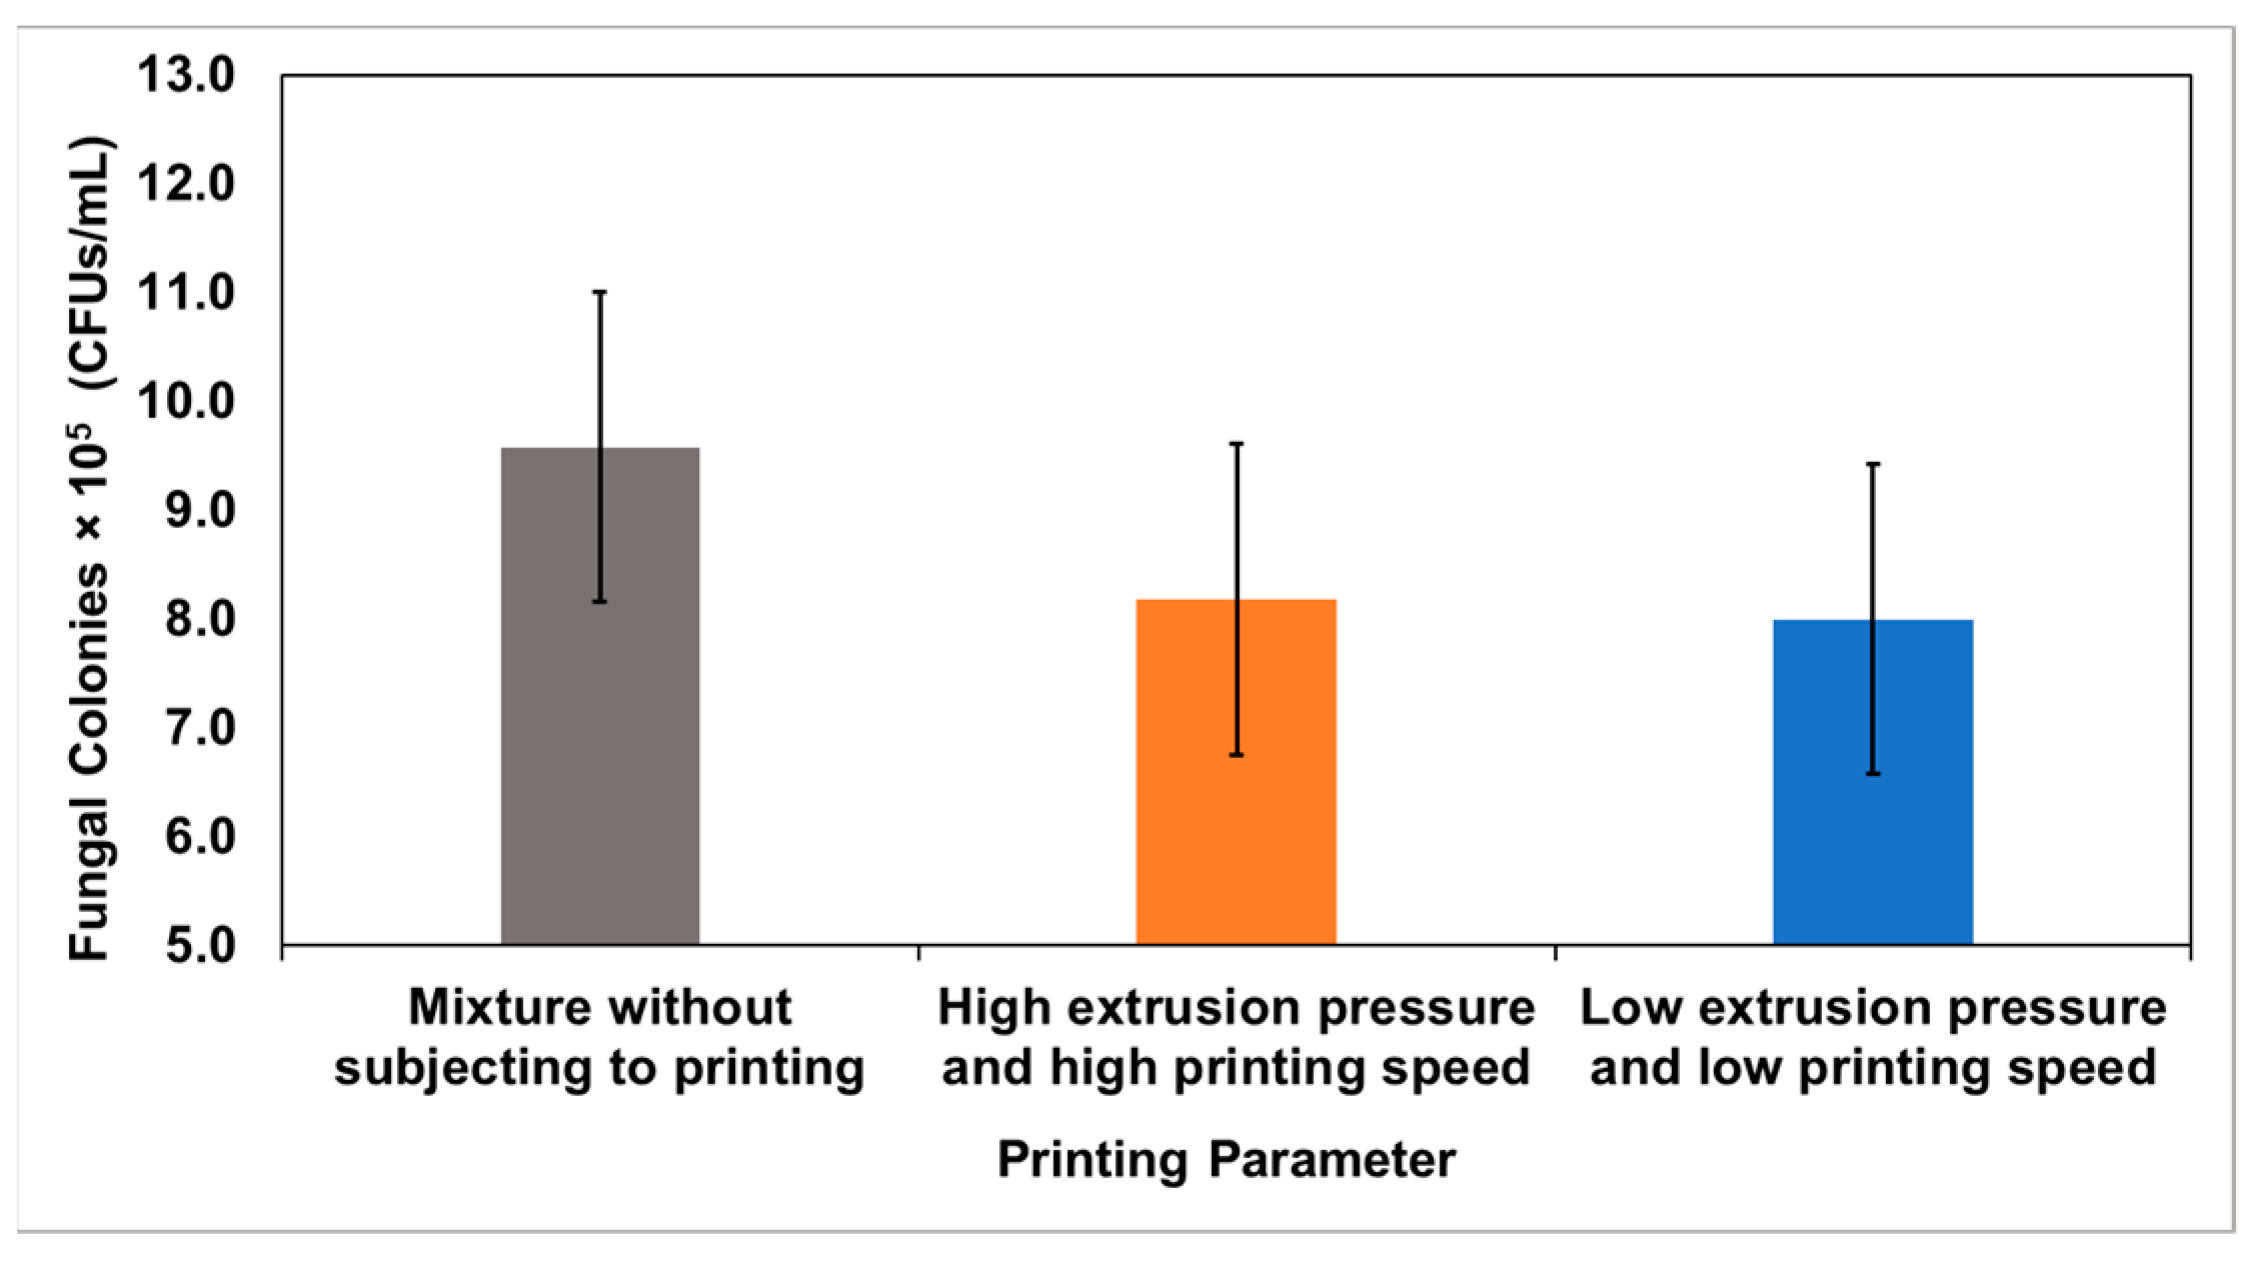
3.2. Effects of Printing Parameters on Fungal Growth in Printed Samples

The results in Section 3.1 showed that the combination of a mixing time of 120 s and the intermittent mixing mode produced the highest fungal growth in the mixtures among all the combinations of mixing parameters. Therefore, the biomass–fungi mixtures for the 3D printing experiments were prepared using this combination of mixing parameters. Printed samples were prepared by extruding the biomass–fungi mixture using the combination of a high printing speed of 120 mm/s and a high extrusion pressure of 6 bars, as well as the combination of a low printing speed of 30 mm/s and a low extrusion pressure of 2 bars.
The effects of printing parameters on fungal growth are shown in Figure 9, where the error bars represent 95% confidence intervals in the means. As shown in Figure 9, the biomass–fungi mixtures that were not subjected to 3D printing had an average fungal growth of 9.58 × 10⁵ CFUs/mL. In comparison with the mixtures that were not subjected to printing, the samples printed using the combination of high printing speed and high extrusion pressure exhibited a 14.6% reduction in fungal growth, and the samples printed using the combination of low printing speed and low extrusion pressure had an average reduction in fungal growth of 16.5%. A one-way ANOVA resulted in a p-value of 0.414 regarding the differences in fungal growth among the three groups of samples: those that were not printed; those printed using the combination of high printing speed and high extrusion pressure; and those printed using the combination of low printing speed and low extrusion pressure. The difference is not statistically significant at the significance level of 0.05.
During isothermal flow through a circular tube, the maximum shear stress is generated near the wall of the tube [34]. In extrusion-based printing, the shear stress near the wall is approximately proportional to the volumetric flow rate of the material which was controlled by printing speed and extrusion pressure [35]. Therefore, the combination of high printing speed and high extrusion pressure would cause a high shear stress while the combination of low printing speed and low extrusion pressure would cause a low shear stress in the extrusion nozzle. Within the ranges of the printing parameters (printing speed and extrusion pressure) tested in this study, shear stress did not have statistically significant effects on fungal growth at the significance level of 0.05 (because the p-value is 0.414).
In the literature, it was reported that the shear stress generated during extrusion-based 3D printing could significantly influence the growth of mammalian cells in the printed samples [36]. Another study showed that printing parameters had significant effects on algae cell quantity in printed samples [37]. Unlike mammalian cells, fungal cells have cell walls made of glucans, chitin, and glycoproteins [38]. The presence of the cell walls might make the fungal cells more resistant to shear stress. This might be the reason for the observation that shear stress, within the tested ranges of printing parameters, did not have significant effects on fungal growth at the significance level of 0.05.
Figure 10 shows the optical images of the printed samples using a confocal microscope with Calcofluor-white (CFW). In Figure 10, no visible difference was observed in the amount of colonization in the samples. This observation of the printed samples using confocal microscope is consistent with the results obtained by counting the number of fungi-colonies using microscope images.

4. Concluding Remarks

This paper reports the effects of mixing parameters (mixing time and mixing mode) on fungal growth in biomass–fungi mixtures prepared for 3D printing, and the effects of printing parameters (printing speed and extrusion pressure) on fungal growth in printed samples. The main conclusions are:
  • Increasing mixing time from 15 to 120 s led to a 52% increase in fungal growth.
  • Change from continuous to intermittent mixing mode resulted in an 11% increase in fungal growth.
  • The change in mixing mode caused a larger change in fungal growth at the high level of mixing time (120 s) than at the low level of mixing time (15 s).
  • Compared to mixtures that were not subjected to printing, samples printed with a high printing speed and high extrusion pressure had a 14.6% reduction in fungal growth, while those with a low printing speed and low extrusion pressure resulted in a 16.5% reduction in fungal growth.
Most of the results obtained in this study had p-value that was much higher than the standard 0.05. This was mostly because of the high variation in fungal growth (living material) results.
Topics of future studies include (1) the effects of different additives in the mixtures of biomass–fungi biocomposite materials on fungal growth, (2) the effects of the environment such as temperature and humidity on fungal growth during the primary and secondary colonization, (3) the biodegradability of printed samples, and (4) life cycle analysis.

Author Contributions

Methodology, A.B. and A.M.R.; experiments A.B., A.M.R. and J.G.V.; data analysis, A.B., A.M.R. and J.G.V.; writing—original draft preparation, A.B. and A.M.R.; writing—review and editing, A.M.R., Z.P., A.B., J.G.V. and B.D.S.; supervision, Z.P. and B.D.S. All authors have read and agreed to the published version of the manuscript.

Funding

This material is based upon work supported by the National Science Foundation under Grant No. 2308575.

Data Availability Statement

The authors confirm that the analyzed data to support the findings of this study are available within the article and others are upon request.

Conflicts of Interest

The authors declare that they have no known competing financial interests or personal relationships that could have appeared to influence the work reported in this study.

References

  1. Soh, E.; Chew, Z.Y.; Saeidi, N.; Javadian, A.; Hebel, D.; Le Ferrand, H. Development of an extrudable paste to build mycelium-bound composites. Mater. Des. 2020, 195, 109058. [Google Scholar] [CrossRef]
  2. Ecovative Design. Available online: https://grow.bio/pages/grow-it-yourself-education-and-instruction-docs (accessed on 17 December 2023).
  3. Abhijith, R.; Ashok, A.; Rejeesh, C. Sustainable packaging applications from mycelium to substitute polystyrene: A review. Mater. Today Proc. 2018, 5, 2139–2145. [Google Scholar] [CrossRef]
  4. Holt, G.A.; Mcintyre, G.; Flagg, D.; Bayer, E.; Wanjura, J.; Pelletier, M. Fungal mycelium and cotton plant materials in the manufacture of biodegradable molded packaging material: Evaluation study of select blends of cotton byproducts. J. Biobased Mater. Bioenergy 2012, 6, 431–439. [Google Scholar] [CrossRef]
  5. Rahman, A.M.; Rahman, T.T.; Pei, Z.; Ufodike, C.O.; Lee, J.; Elwany, A. Additive Manufacturing Using Agriculturally Derived Biowastes: A Systematic Literature Review. Bioengineering 2023, 10, 845. [Google Scholar] [CrossRef]
  6. Elsacker, E.; Vandelook, S.; Van Wylick, A.; Ruytinx, J.; De Laet, L.; Peeters, E. A comprehensive framework for the production of mycelium-based lignocellulosic composites. Sci. Total Environ. 2020, 725, 138431. [Google Scholar] [CrossRef]
  7. Ecovative at MoMA PS1. Available online: https://www.bfi.org/2014/07/28/ecovative-at-moma-ps1/ (accessed on 17 December 2023).
  8. Gandia, A.; van den Brandhof, J.G.; Appels, F.V.; Jones, M.P. Flexible fungal materials: Shaping the future. Trends Biotechnol. 2021, 39, 1321–1331. [Google Scholar] [CrossRef]
  9. Jones, M.; Mautner, A.; Luenco, S.; Bismarck, A.; John, S. Engineered mycelium composite construction materials from fungal biorefineries: A critical review. Mater. Des. 2020, 187, 108397. [Google Scholar] [CrossRef]
  10. Pelletier, M.; Holt, G.; Wanjura, J.; Lara, A.; Tapia-Carillo, A.; McIntyre, G.; Bayer, E. An evaluation study of pressure-compressed acoustic absorbers grown on agricultural by-products. Ind. Crops Prod. 2017, 95, 342–347. [Google Scholar] [CrossRef]
  11. Geyer, R.; Jambeck, J.R.; Law, K.L. Production, use, and fate of all plastics ever made. Sci. Adv. 2017, 3, e1700782. [Google Scholar] [CrossRef]
  12. Appels, F.V.; Camere, S.; Montalti, M.; Karana, E.; Jansen, K.M.; Dijksterhuis, J.; Krijgsheld, P.; Wösten, H.A. Fabrication factors influencing mechanical, moisture-and water-related properties of mycelium-based composites. Mater. Des. 2019, 161, 64–71. [Google Scholar] [CrossRef]
  13. Ghazvinian, A.; Gürsoy, B. Mycelium-Based Composite Graded Materials: Assessing the Effects of Time and Substrate Mixture on Mechanical Properties. Biomimetics 2022, 7, 48. [Google Scholar] [CrossRef] [PubMed]
  14. Islam, M.R.; Tudryn, G.; Bucinell, R.; Schadler, L.; Picu, R. Morphology and mechanics of fungal mycelium. Sci. Rep. 2017, 7, 13070. [Google Scholar] [CrossRef] [PubMed]
  15. Bhardwaj, A.; Vasselli, J.; Lucht, M.; Pei, Z.; Shaw, B.; Grasley, Z.; Wei, X.; Zou, N. 3D Printing of Biomass-Fungi Composite Material: A Preliminary Study. Manuf. Lett. 2020, 24, 96–99. [Google Scholar] [CrossRef]
  16. Zheng, J.; Rehmann, L. Extrusion pretreatment of lignocellulosic biomass: A review. Int. J. Mol. Sci. 2014, 15, 18967–18984. [Google Scholar] [CrossRef] [PubMed]
  17. Sydor, M.; Bonenberg, A.; Doczekalska, B.; Cofta, G. Mycelium-based composites in art, architecture, and interior design: A review. Polymers 2021, 14, 145. [Google Scholar] [CrossRef] [PubMed]
  18. Elsacker, E.; Peeters, E.; De Laet, L. Large-scale robotic extrusion-based additive manufacturing with living mycelium materials. Sustain. Futures 2022, 4, 100085. [Google Scholar] [CrossRef]
  19. Block, P.; Van Mele, T.; Liew, A.; DeJong, M.; Escobedo, D.; Ochsendorf, J.A. Structural design, fabrication and construction of the Armadillo vault. Struct. Eng. J. Inst. Struct. Eng. 2018, 96, 10–20. [Google Scholar] [CrossRef]
  20. Bhardwaj, A.; Rahman, A.M.; Wei, X.; Pei, Z.; Truong, D.; Lucht, M.; Zou, N. 3d printing of biomass–fungi composite material: Effects of mixture composition on print quality. J. Manuf. Mater. Process. 2021, 5, 112. [Google Scholar] [CrossRef]
  21. Rahman, A.M.; Bhardwaj, A.; Pei, Z.; Ufodike, C.; Castell-Perez, E. The 3D Printing of Biomass–Fungi Composites: Effects of Waiting Time after Mixture Preparation on Mechanical Properties, Rheological Properties, Minimum Extrusion Pressure, and Print Quality of the Prepared Mixture. J. Compos. Sci. 2022, 6, 237. [Google Scholar]
  22. Mohseni, A.; Vieira, F.R.; Pecchia, J.A.; Gürsoy, B. Three-Dimensional Printing of Living Mycelium-Based Composites: Material Compositions, Workflows, and Ways to Mitigate Contamination. Biomimetics 2023, 8, 257. [Google Scholar] [CrossRef]
  23. Soh, E.; Teoh, J.H.; Leong, B.; Xing, T.R.; Le Ferrand, H. 3D printing of mycelium engineered living materials using a waste-based ink and non-sterile conditions. Mater. Des. 2023, 236, 112481. [Google Scholar] [CrossRef]
  24. Fletcher, I. Effect of temperature and growth media on mycelium growth of Pleurotus ostreatus and Ganoderma lucidum Strains. Cohesive J. Microbiol. Infect. Dis. 2019, 2. [Google Scholar]
  25. Sachivkina, N.; Lenchenko, E.; Strizakov, A.; Zimina, V.; Gnezdilova, L.; Gavrilov, V.; Byakhova, V.; Germanova, S.; Zharov, A.; Molchanova, M. The evaluation of intensity of formation of biomembrane by microscopic fungi of the Candida genus. Int. J. Pharm. Res. 2018, 10, 738–744. [Google Scholar]
  26. Aberkane, A.; Cuenca-Estrella, M.; Gomez-Lopez, A.; Petrikkou, E.; Mellado, E.; Monzon, A.; Rodriguez-Tudela, J. Comparative evaluation of two different methods of inoculum preparation for antifungal susceptibility testing of filamentous fungi. J. Antimicrob. Chemother. 2002, 50, 719–722. [Google Scholar] [CrossRef] [PubMed]
  27. Taniwaki, M.H.; Pitt, J.I.; Hocking, A.D.; Fleet, G.H. Comparison of hyphal length, ergosterol, mycelium dry weight, and colony diameter for quantifying growth of fungi from foods. In Advances in Food Mycology; Springer: Berlin/Heidelberg, Germany, 2006; pp. 49–67. [Google Scholar]
  28. Henry, P.; Halbus, A.F.; Athab, Z.H.; Paunov, V.N. Enhanced Antimould Action of Surface Modified Copper Oxide Nanoparticles with Phenylboronic Acid Surface Functionality. Biomimetics 2021, 6, 19. [Google Scholar] [CrossRef] [PubMed]
  29. Neelam, S.; Chennupati, S.; Singh, S. Comparative studies on growth parameters and physio-chemical analysis of Pleurotus ostreatus and Pleurotus florida. Asian J. Plant Sci. Res. 2011. Available online: https://www.imedpub.com/abstract/comparative-studies-on-growth-parameters-and-physiochemical-analysis-of-pleurotus-ostreatus-and-pleurotus-florida-13970.html (accessed on 10 December 2023).
  30. Lichius, A.; Zeilinger, S. Application of membrane and cell wall selective fluorescent dyes for live-cell imaging of filamentous fungi. JoVE (J. Vis. Exp.) 2019, 153, e60613. [Google Scholar]
  31. Richard, E.; Chang, T.-h.; Sutherland, J.W. Statistical Quality Design and Control; Prentice Hall: Hoboken, NJ, USA, 1992. [Google Scholar]
  32. Tabachnick, B.G.; Fidell, L.S. Experimental Designs Using ANOVA; Thomson/Brooks/Cole: Belmont, CA, USA, 2007; Volume 724. [Google Scholar]
  33. Jayasinghe, C.; Imtiaj, A.; Hur, H.; Lee, G.W.; Lee, T.S.; Lee, U.Y. Favorable culture conditions for mycelial growth of Korean wild strains in Ganoderma lucidum. Mycobiology 2008, 36, 28–33. [Google Scholar] [CrossRef]
  34. White, F.M. Fluid Mechanics; Academic Press: New York, NY, USA, 1990. [Google Scholar]
  35. Chung, C.I. Extrusion of Polymers: Theory & Practice; Carl Hanser Verlag GmbH Co KG: Munich, Germany, 2019. [Google Scholar]
  36. Blaeser, A.; Duarte Campos, D.F.; Puster, U.; Richtering, W.; Stevens, M.M.; Fischer, H. Controlling shear stress in 3D bioprinting is a key factor to balance printing resolution and stem cell integrity. Adv. Healthc. Mater. 2016, 5, 326–333. [Google Scholar] [CrossRef]
  37. Thakare, K.; Jerpseth, L.; Qin, H.; Pei, Z. Bioprinting Using Algae: Effects of Extrusion Pressure and Needle Diameter on Cell Quantity in Printed Samples. J. Manuf. Sci. Eng. 2020, 143, 014501. [Google Scholar] [CrossRef]
  38. Boynton, T.T.; Ferneini, E.M. 9—Antimicrobial Pharmacology for Head, Neck, and Orofacial Nonbacterial Infections. In Head, Neck, and Orofacial Infections; Hupp, J.R., Ferneini, E.M., Eds.; Elsevier: St. Louis, MI, USA, 2016; pp. 164–173. [Google Scholar]
Figure 1. Biomass–fungi material: (a) in a polypropylene bag; (b) in a plastic bowl.
Jmmp 08 00002 g001
Figure 2. Biomass–fungi material after primary colonizing.
Jmmp 08 00002 g002
Figure 3. Delta WASP 2040 3D printer, nozzle assembly, and screw extruder.
Jmmp 08 00002 g003
Figure 4. Observation of 3D printed parts: (a) model created in the Slic3r software (yellow color represents the perimeters, and red color means the infills); (b) 3D printed sample.
Jmmp 08 00002 g004
Figure 5. Observation of plated samples: (a) view of entire plated sample; (b) microscopic view of plated sample.
Jmmp 08 00002 g005
Figure 6. Plot of the main effect of mixing time on fungal growth.
Jmmp 08 00002 g006
Figure 7. Plot of the main effect of mixing mode on fungal growth.
Jmmp 08 00002 g007
Figure 8. Plot of interaction effect of mixing time and mixing mode on fungal growth.
Jmmp 08 00002 g008
Figure 9. Effects of printing parameters on fungal growth.
Jmmp 08 00002 g009
Figure 10. Confocal microscope images of the surface of printed samples; (a) printed using the combination of low printing speed and low extrusion pressure; (b) printed using the combination of high printing speed and high extrusion pressure; arrows in both pictures point to individual thread-like hypha.
Jmmp 08 00002 g010
Table 1. Experiment matrix to study the effects of mixing parameters on fungal growth in mixtures.
TestMixing TimeMixing Mode
1
2+
3+
4++
Table 2. Factor levels to study the effects of mixing parameters on fungal growth in mixtures.
FactorLow Level (−)High Level (+)
Mixing Time (Second)15120
Mixing ModeIntermittentContinuous
Table 3. Printing parameters and their values.
ParameterValue
Printing Speed (mm/s)30, 120
Extrusion Pressure (Bar)2, 6
Table 4. ANOVA table for the factorial design experiments.
Source of VarianceDegrees of
Freedom
Sum of SquaresMean SquareF-Valuep-Value
Model320,8636954.38.770.000
Mixing Time118,48018,480.123.300.000
Mixing Mode113161316.01.660.203
Interaction110671066.81.350.251
Error5644,416793.1
Total5965,279
Disclaimer/Publisher’s Note: The statements, opinions and data contained in all publications are solely those of the individual author(s) and contributor(s) and not of MDPI and/or the editor(s). MDPI and/or the editor(s) disclaim responsibility for any injury to people or property resulting from any ideas, methods, instructions or products referred to in the content.

