Communication

Correlating Ultrasonic Velocity in DC04 with Microstructure for Quantification of Ductile Damage

by
Steffen Wackenrohr
*,
Sebastian Herbst
,
Patrick Wöbbeking
,
Gregory Gerstein
and
Florian Nürnberger
*
Institut für Werkstoffkunde (Materials Science), Leibniz Universität Hannover, An der Universität 2, 30823 Garbsen, Germany
*
Authors to whom correspondence should be addressed.
J. Manuf. Mater. Process. 2023, 7(4), 142; https://doi.org/10.3390/jmmp7040142
Submission received: 28 June 2023 / Revised: 28 July 2023 / Accepted: 4 August 2023 / Published: 7 August 2023
(This article belongs to the Special Issue Advances in Metal Forming and Thermomechanical Processing)

Abstract

:
The detection of ductile damage by image-based methods is time-consuming and typically probes only small areas. It is therefore of great interest for various cold forming processes, such as sheet-bulk metal forming, to develop new methods that can be used during the forming process and that enable an efficient detection of ductile damage. In the present study, ductile damage in DC04 was examined using ultrasonic testing. First, different grain sizes were set by heat treatment. Subsequently, the sheet metal was formed by cold rolling. A clear correlation between the average void diameter and the measured ultrasonic velocity could be shown. The ultrasonic velocity showed a clear decrease when the average void size increased because of the increasing forming degree. The ultrasonic measurements were finally employed to calculate a damage parameter D to determine the amount of ductile damage in the microstructure for different grain sizes after cold rolling.

1. Introduction

The process class of sheet-bulk metal forming (SBMF) combines sheet metal forming with bulk forming operations and enables the production of components with integrated functional elements [1]. As a result of cold forming, ductile damage in the form of void formation in the material can occur [2]. These voids can act as crack nucleation sites and finally lead to premature failure of the component under cyclic loading [3,4]. Various models used in fracture mechanics, for example, the ΔJ-integral approach, utilize void parameters to calculate the initial crack lengths and then predict the service life of a component [5]. Knowledge of the position of the voids in the component and their size is therefore of interest for component design and for planning a metal forming technology such as SBMF.
In contrast to relatively large defects within the microstructure, which can extend to several hundred micrometers as, for example, those that are often present when using processes like additive manufacturing [6] or casting [7], the defects resulting from cold forming are much smaller. For instance, Besserer et al. reported that the smallest voids were in the range from 0.00 to 0.02 μm2 (single void area observed in scanning electron microscopy (SEM) analysis) [3]. Clearly, it is challenging to detect ductile damage in the form of such small defects resulting from SBMF.
Ductile damage generally describes void formation, void growth and void coalescence as a result of an increasing degree of deformation [2,8]. In principle, a distinction can be made between homogeneous void formation in areas of high dislocation densities or heterogeneous void formation in particles and at grain boundaries [2]. A variety of models already exist in the literature to predict void formation. The damage mechanics model proposed by Gurson, Needleman and Tvergaard (GNT) is widely used in this context; further models are described by Bonora et al. [9]. All these models try to predict void evolution based on various material-related input variables. A major challenge in the validation of these models is the detection of the voids. In contrast to defects close to the surface, which can be detected by imaging methods such as visual inspection, microscopy or fringe projection profilometry [10], the voids are located inside the component. One possibility for determining a void volume fraction is using computer tomography (CT). As a downside, conventional CT methods typically have a resolution limit of approx. 1 µm. An advantage is that CT provides for a three-dimensional image of the microstructure [11].
Another method that can be employed to detect defects even in the nanometer range is SEM imaging [12]. However, this requires the destruction of the component for further sample preparation and only small areas can be investigated [5]. It should be noted that the type of sample preparation, such as mechanical polishing, ion polishing or cryogenic fracturing, can have a substantial effect on the result [13]. Depending on the test method (CT or SEM), the void volume fraction (three-dimensional) or void area fraction (two-dimensional) is determined.
An alternative to the determination of the void volume fraction is to initially define an appropriate damage parameter. This approach is often used in damage mechanics models to later calculate the void volume fraction. According to Lemaitre [14], a damage parameter D criterion can be determined based on several different reference parameters X such as the elastic modulus, the microhardness, the electrical conductivity or the ultrasonic velocity [14]:
D = 1 X d a m a g e d 2 X i n i t i a l 2
For metallic materials, the elastic modulus is often determined from cyclic load tests [9,15] or tensile testing. Unfortunately, these tests are time-consuming and they are also unsuitable for testing finished components due to their destructive nature. Furthermore, when comparing the scatter of the absolute values of the damage parameter determined by different methods (mechanical tensile tests, resonance frequencies of self-oscillating specimen, ultrasonic wave propagation velocity and electron microscopy) the good agreement between the data based on electron microscopy and ultrasonic measurements was noted [16].
The determination of ductile damage by ultrasonic measurement is comparatively simple and non-destructive. The measurement relies on the well-known relationship between the acoustic and mechanical properties of metals [17]. With knowledge of the component thickness, the ultrasonic velocity of the material can be determined accurately based on time measurement. This method has also been used for non-metallic materials, for example, for concrete [18,19] or polymers [20]. There is also a large number of studies on different metals [16,21,22]. For instance, Kennedy et al. studied the influence of the martensite content on the ultrasonic velocity. It was shown that the ultrasonic velocity was significantly lower for microstructures containing martensite compared to ferrite-dominated microstructures [23]. However, other factors influencing the microstructure, such as the grain size, are often not considered in these investigations. Despite the fact that studies of changes in the ultrasonic velocity depending on the microstructure have been conducted for quite a long time [24,25,26], the details of the relationship between ultrasonic velocity and the microstructural features remains unclear.
Within the scope of this study, the damage parameter D was determined for different degrees of deformation and grain sizes by means of ultrasonic testing. In this way, possible factors in the microstructure influencing the measurement of the ultrasonic velocity were identified and evaluated.

2. Materials and Methods

2.1. Material

The material used for the study was hot rolled DC04, a steel grade often employed for conventional sheet cold forming processes like deep-drawing. The chemical composition was analyzed by spark spectrometry and is given in Table 1.
For the experiments, several grain sizes were set by applying different heat treatments. The resulting microstructures are shown in Figure 1. Figure 1a represents the initial condition without additional heat treatment. The average grain size was determined using the line intercept technique. Grain sizes were determined with a total of 10 lines for each micrograph. The average grain size for the initial condition was 20 µm, and the Vickers hardness was 108 HV10. For each hardness measurement, 5 different measuring points were recorded. The standard deviation of the 5 measurements was less than 1.7% for each heat treatment condition. The comparatively low hardness of the initial condition confirmed that no cold forming had occurred during the manufacture of the semi-finished product, which could lead to initial damage. Figure 1b shows the microstructure after heat treatment at 850 °C for 30 min, followed by cooling in air. The average grain size was 28 µm, and the Vickers hardness was 122 HV10. Figure 1c shows the microstructure after a heat treatment of 1150 °C for a duration of 5 h and cooling in the furnace. The average grain size was 57 µm, and the Vickers hardness was 109 HV10.
The speed of sound in the material depends substantially on the volume fraction of damage caused by deformation of the metal upon processing [27]. To simulate processing, the three different microstructural conditions obtained after the heat treatments were subsequently cold-rolled in several passes. The initial thickness of the sheet was h0 = 3 mm; the initial sheet length was 165 mm. The main forming degrees set were φ = 0.1 and φ = 0.3. The logarithmic forming degree was determined according to Equation (2).
φ = l n ( h 0 h 1 )  
In order to minimize the possible influences of the specimen thickness on the measurement, the specimens were ground to an initial thickness of 2 mm each. Using polyethylene plates, an increase in the speed of sound with increasing specimen thickness was already demonstrated in Zhang et al. [20]. This effect can be attributed to the difference in the wave front propagation in thicker samples and the density difference between specimen, contact fluid and air when coupling the ultrasonic signal into the specimen.

2.2. Measuring the Ultrasonic Velocity

The ultrasound measurements were carried out using an Elcometer© FD800DL+ fault detector. Figure 2 depicts the general measurement setup schematically. The ultrasonic transducer was placed on the specimen with a contact fluid (UltraSoniX™, Echo Ultrasonics®, Bellingham, WA, USA). The contact pressure of the transducer was kept constant at 5 N. The ultrasonic frequency emitted by the transducer was 2.5 MHz. A total of 5 measurements were performed per measuring point. For each specimen, 5 different measurement points were placed across the cross-section with a distance of 20 mm. The measuring points were evenly distributed over the sample cross-section to measure as large a sample volume as possible. The distance between the measuring points was chosen so that the measuring areas did not overlap. The ultrasonic velocity v was determined based on the pulse-echo technique. If the sample thickness t is known and the time of flight (TOF) s is measured, the speed of the ultrasonic can be determined according to Equation (3) [28]. Knowing the ultrasonic velocity of the material, a damage parameter D can then be determined by comparing the initial condition with the cold-rolled conditions, cf. Equation (1).
v = 2 × t s  

2.3. Void Fraction Measurement

Scanning electron microscopy was employed to determine the void area fraction. The samples were mechanically polished in several stages with a final polish of 1 µm, and then images were taken with a Zeiss SUPRA 55VP. The total observation area was 24,960 µm2, resulting from 25 individual backscattered electron (BSE) SEM images, each measuring 26.2 µm × 38.1 µm. The magnification for the SEM images was 3000× in order to find a good compromise between high resolution and large measured area. The voids could be clearly distinguished from the rest of the microstructure based on the gray values. The gray scale analysis was performed using Olympus Stream Enterprise software.
Since scanning electron microscopy can only image a small area compared to ultrasonic testing, the average void size in the range from 0.02 to 0.2 μm2 was determined in the subsequent evaluation. By this, it can be excluded that single large voids influenced the result too much, which would lead to false conclusions when evaluating the average void size. Based on the use of the average void size, no damage parameter D could be determined. However, the average void size allowed conclusions to be drawn about the void development during the forming process. It can therefore be assumed that the damage parameter D and the average void size correlated with increasing ductile damage.

3. Results and Discussion

3.1. Ultrasonic Measurement and Damage Parameter

Figure 3 depicts the results of the ultrasonic measurements showing the ultrasonic velocity as a function of the degree of deformation. The error bars correspond to the standard deviation of the five individual measurements. The measured values were approximated by a linear fit based on the sum of the least square errors. The resulting linear equations are also indicated in Figure 3. For the initial condition (Figure 3a), a slight decrease in the sonic velocity could be observed with increasing degree of deformation. The heat-treated specimens showed a similar trend (Figure 3b,c). The absolute values of the ultrasonic velocities correlated well with measurements on the 304 L stainless steel performed at 2.25 MHz [29]. The decrease in the ultrasonic velocity with progressive deformation was also shown in previous investigations after fatigue and creep tests. The decrease was attributed to the formation of microvoids [30,31].
It was observed that the initial ultrasonic velocities without any cold forming differed as well. Thus, a relatively large influence of the grain size on the sonic velocity could be assumed. Similar effects were shown by Choi et al. for different grain sizes of a 304 L stainless steel, where the ultrasonic velocity was found to decrease linearly with increasing grain size [29]. An approximately linear decrease in the sonic velocity with increasing grain size according to the model of Hirsekorn [32] could not be shown since other microstructural effects, such as the change of the residual stress state, grain size and dislocation density due to the different heat treatments have an influence on the sonic velocity too. The influence of residual stresses on sonic velocity has already been shown by Crecraft [33].
The ultrasonic measurements were employed to determine the damage parameters for the different material conditions. The damage parameter D based on sonic velocity measurements was determined using the trend lines and Equation (1). As can be seen from Table 2, the value of the damage parameter turned out to be more sensitive to the degree of deformation than what followed from the measurements made earlier at lower frequencies [16,34]. Nevertheless, the damage parameter D showed good agreement with previous studies by Gerstein et al. [16].
Figure 4 depicts the relationship between the calculated damage parameters and the grain size. A logarithmic increase in the damage parameter with increasing grain size can be seen for both forming degrees. This correlation is consistent with previous studies on the influence of grain size on ultrasonic velocity [32]. However, it indicates that the grain size must be taken into account when determining the damage parameter.
In order to separate possible further influences such as the change in residual stress state clearly from the effects of void evolution, the three different material states that were cold rolled with φ = 0.3 were subsequently heat treated. Stress relief heat treatment at 600 °C for 2 h was carried out. Due to the relatively low temperature, which was well below the transformation temperature for steel, the subsequent heat treatment was not expected to change the microstructure or the void volume fraction. Subsequently, the ultrasonic velocity measurements were repeated. Within the measurements, no relevant changes from the states that were not heat-treated were observed. The change in the ultrasonic velocities was ≤±0.25% for all three conditions compared to the cold-rolled states and was well below the measurement uncertainty. Hence, no considerable influence of the residual stresses on the ultrasonic velocities could therefore be demonstrated.

3.2. Void Analysis by Scanning Electron Microscopy

Figure 5 shows four representative SEM micrographs that were employed for the void area fraction measurements. Figure 5a displays the initial condition, where the individual voids can clearly be seen. Figure 5b depicts the largest defect found in the microstructure of a deformed sample (1150 °C, 5 h, φ = 0.3). This large defect was not taken into account for the determination of the average void size (cf. Section 2), as it could be assumed that these defects did not arise due to ductile damage but were already present in the initial condition.
Figure 5c shows the initial state at φ = 0.3. In the area with a high grain boundary density, an increased void volume fraction can be observed. In addition, a slight elongation of the voids in the rolling direction (RD) can be seen. Figure 5d (1150 °C, 5 h, φ = 0.3) shows an area without any grain boundaries and low void volume fraction. The observations are in good line with investigations according to Goods, who was able to show a heterogeneous void formation at the grain boundaries (cf. also Figure 6) [2].
Figure 6 shows the average void size for the different material conditions as a function of the degree of forming. For all conditions, a slight increase in the average void size with increasing degree of deformation can be seen. For the material states with smaller grain sizes a stronger increase in the average void sizes can be seen. According to Goods this can be attributed to a higher heterogeneous void growth at the grain boundaries [2]. In general, the measured data were subject to a relatively high scatter due to the small area of measurement. However, the absolute values of the average void sizes showed a good agreement with previous investigations from Besserer et al. where an average void size of approx. 0.05 μm2 was determined for tailored blanks from DC04 that were also formed in a process similar to cold rolling [3].

4. Conclusions

In the present study a clear correlation between the increase in ductile damage and the degree of deformation was shown. For different grain sizes, a damage parameter D could be determined from ultrasonic measurements that also correlated with the average void sizes. The results can be summarized as follows:
  • Ultrasonic measurement methodology can cover a much larger area compared to SEM examinations. The voids cannot be measured directly by ultrasonic due to the resolution being too low, but the damage parameter D showed a good correlation to the average void size determined in the SEM examinations.
  • The ultrasonic velocity decreases significantly with increasing deformation. This effect can be used to determine a damage parameter D according to standard calculation methods. In further works, the determined damage parameters can be used in damage mechanics models. Due to the time-of-flight determination of the ultrasonic velocity, this methodology can currently only be applied to sheet metal strips. For measurements on components, the methodology has to be extended.
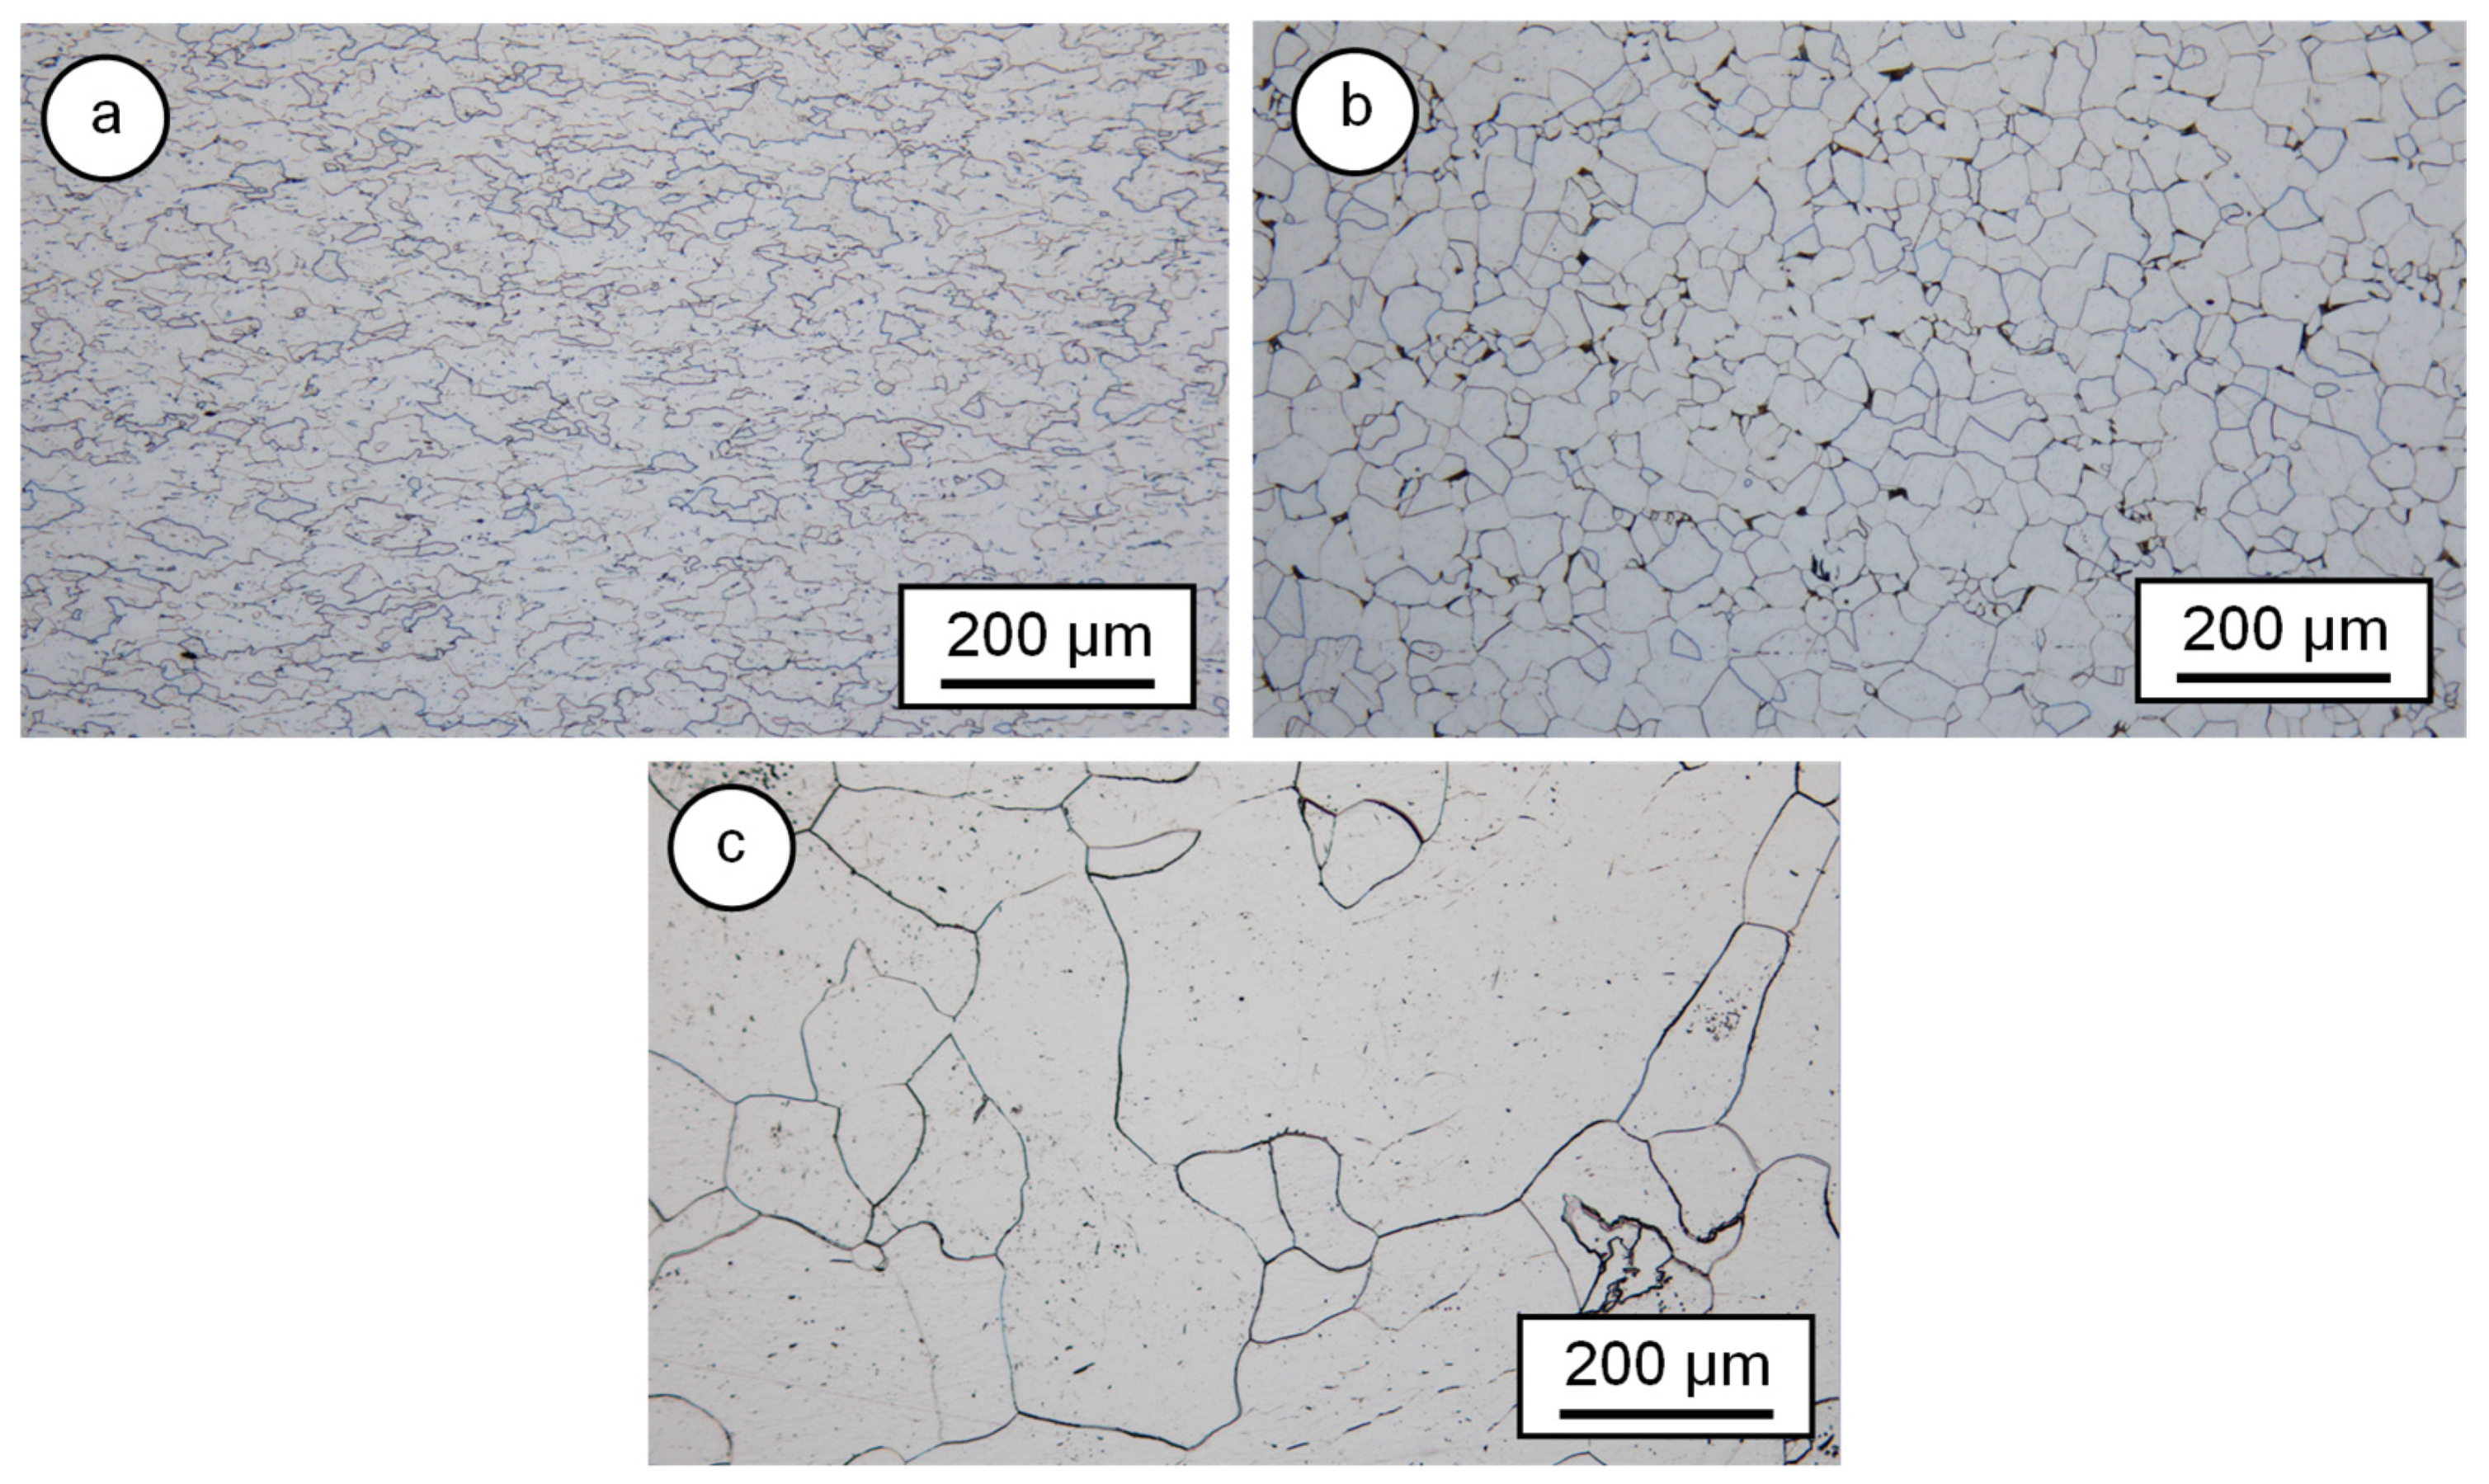
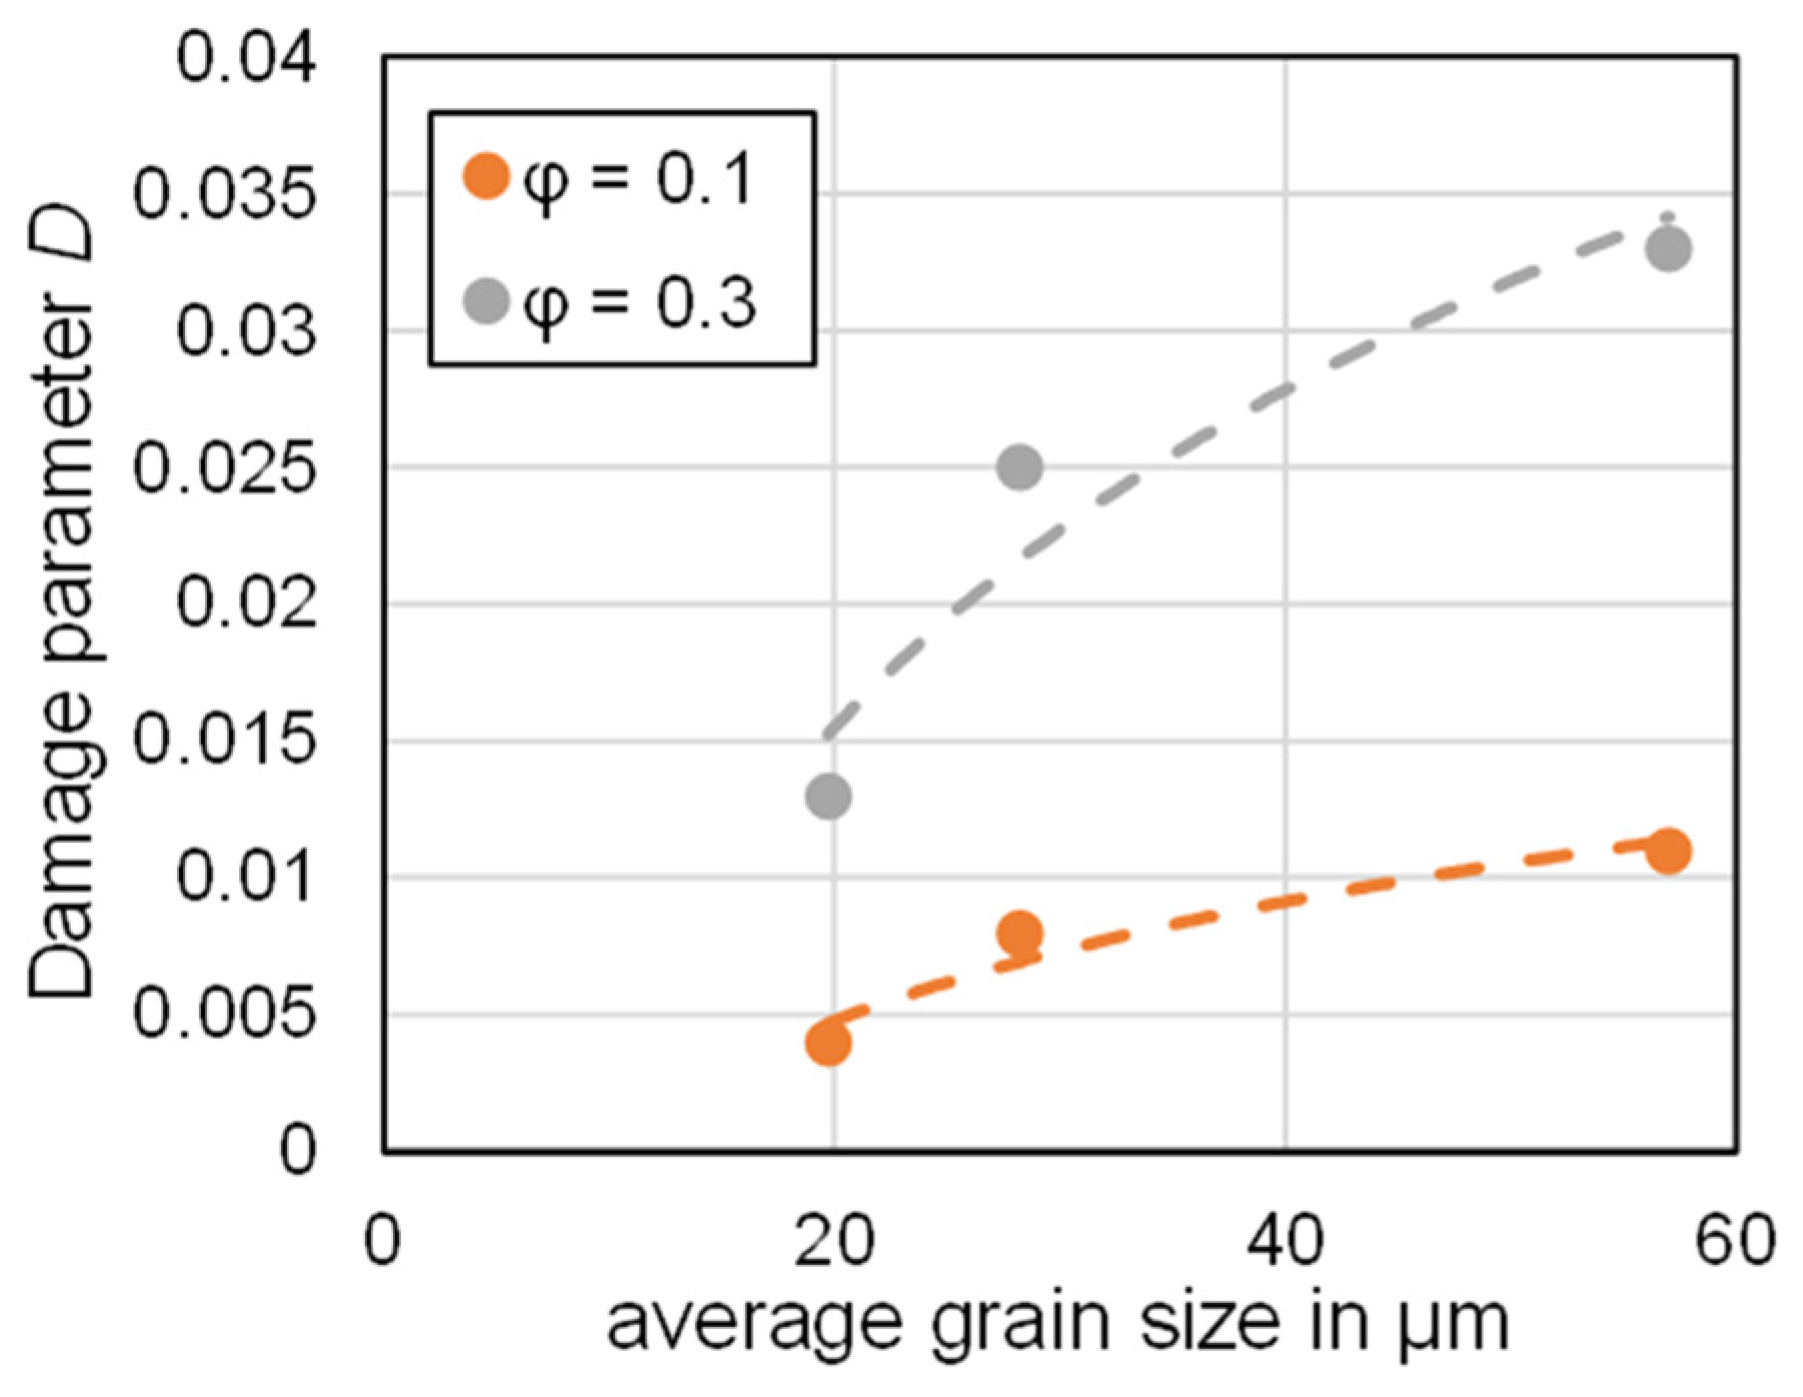
  • The grain size shows a significant influence on the ultrasonic velocities, and thus on the damage parameter D. This effect has to be taken into account when comparing different heat treatment conditions and grain sizes of the same alloy with regard to their ductile damage.
  • Various factors that characterize the microstructure contribute to the change in the ultrasonic propagation velocity: the amount of deformation, the presence and type of heat treatment, the size of the defects, the grain size and configuration of the samples. However, it was demonstrated that the residual stresses had no influence on the ultrasonic velocities in the present study. In further investigations, the various microstructural effects during cold forming and their influence on the ultrasonic velocities must be more clearly separated from each other.

Author Contributions

Conceptualization, S.H. and F.N.; methodology, G.G.; formal analysis, P.W.; investigation, S.W. and P.W.; writing—original draft preparation, S.W.; writing—review and editing, S.H. and F.N. All authors have read and agreed to the published version of the manuscript.

Funding

Funded by the Deutsche Forschungsgemeinschaft (DFG, German Research Foundation)—Project-ID 68237143—SFB/TR 73.

Data Availability Statement

The data presented in this study are available on request from the corresponding author. The data are not publicly available due to ongoing research.

Conflicts of Interest

The authors declare no conflict of interest.

References

  1. Henneberg, J.; Merklein, M. Investigation on extrusion processes in sheet-bulk metal forming from coil. CIRP J. Manuf. Sci. Technol. 2020, 31, 561–574. [Google Scholar] [CrossRef]
  2. Goods, S.H.; Brown, L.M. Overview No. 1. Acta Metall. 1979, 27, 1–15. [Google Scholar] [CrossRef]
  3. Besserer, H.-B.; Hildenbrand, P.; Gerstein, G.; Rodman, D.; Nürnberger, F.; Merklein, M.; Maier, H.J. Ductile Damage and Fatigue Behavior of Semi-Finished Tailored Blanks for Sheet-Bulk Metal Forming Processes. J. Mater. Eng. Perform. 2016, 25, 1136–1142. [Google Scholar] [CrossRef]
  4. Schönbauer, B.M.; Ghosh, S.; Kömi, J.; Frondelius, T.; Mayer, H. Influence of small defects and nonmetallic inclusions on the high and very high cycle fatigue strength of an ultrahigh-strength steel. Fatigue Fract. Eng. Mat. Struct. 2021, 44, 2990–3007. [Google Scholar] [CrossRef]
  5. Wackenrohr, S.; Nürnberger, F.; Maier, H.J. Fatigue Life Compliant Process Design for the Manufacturing of Cold Die Rolled Components. In Sheet Bulk Metal Forming; Merklein, M., Tekkaya, A.E., Behrens, B.-A., Eds.; Springer International Publishing: Cham, Switzerland, 2021; pp. 568–585. ISBN 978-3-030-61901-5. [Google Scholar]
  6. Wackenrohr, S.; Torrent, C.J.J.; Herbst, S.; Nürnberger, F.; Krooss, P.; Ebbert, C.; Voigt, M.; Grundmeier, G.; Niendorf, T.; Maier, H.J. Corrosion fatigue behavior of electron beam melted iron in simulated body fluid. NPJ Mater. Degrad. 2022, 6, 1917. [Google Scholar] [CrossRef]
  7. Li, J.; Oberdorfer, B.; Habe, D.; Schumacher, P. Determining casting defects in near-net shape casting aluminum parts by computed tomography. Front. Mech. Eng. 2018, 13, 48–52. [Google Scholar] [CrossRef]
  8. Rousselier, G. Ductile fracture models and their potential in local approach of fracture. Nucl. Eng. Des. 1987, 105, 97–111. [Google Scholar] [CrossRef]
  9. Bonora, N.; Gentile, D.; Pirondi, A.; Newaz, G. Ductile damage evolution under triaxial state of stress: Theory and experiments. Int. J. Plast. 2005, 21, 981–1007. [Google Scholar] [CrossRef]
  10. Hinz, L.; Metzner, S.; Müller, P.; Schulte, R.; Besserer, H.-B.; Wackenrohr, S.; Sauer, C.; Kästner, M.; Hausotte, T.; Hübner, S.; et al. Fringe Projection Profilometry in Production Metrology: A Multi-Scale Comparison in Sheet-Bulk Metal Forming. Sensors 2021, 21, 2389. [Google Scholar] [CrossRef]
  11. Xue, S.; Zhang, P.; Bao, J.; He, L.; Hu, Y.; Yang, S. Comparison of Mercury Intrusion Porosimetry and multi-scale X-ray CT on characterizing the microstructure of heat-treated cement mortar. Mater. Charact. 2020, 160, 110085. [Google Scholar] [CrossRef]
  12. Stephensen, H.J.T.; Darkner, S.; Sporring, J. Restoring drifted electron microscope volumes using synaptic vesicles at sub-pixel accuracy. Commun. Biol. 2020, 3, 81. [Google Scholar] [CrossRef] [PubMed] [Green Version]
  13. Hering, O.; Dunlap, A.; Tekkaya, A.E.; Aretz, A.; Schwedt, A. Characterization of damage in forward rod extruded parts. Int. J. Mater. Form. 2020, 13, 1003–1014. [Google Scholar] [CrossRef]
  14. Lemaitre, J. A Course on Damage Mechanics, 2nd ed.; Springer: Berlin/Heidelberg, Germany, 1996; ISBN 978-3-540-60980-3. [Google Scholar]
  15. Kostic, S.; Miljojkovic, J.; Simunovic, G.; Vukelic, D.; Tadic, B. Uncertainty in the determination of elastic modulus by tensile testing. Eng. Sci. Technol. Int. J. 2022, 25, 100998. [Google Scholar] [CrossRef]
  16. Gerstein, G.; Briukhanov, A.; Gutknecht, F.; Volchok, N.; Clausmeyer, T.; Nürnberger, F.; Tekkaya, A.E.; Maier, H.J. Evaluation of micro-damage by acoustic methods. Procedia Manuf. 2018, 15, 527–534. [Google Scholar] [CrossRef]
  17. Hünicke, U.-D.; Krautkrämer, J.; Krautkrämer, H. Werkstoffprüfung mit Ultraschall; Springer: Berlin/Heidelberg, Germany, 1987. [Google Scholar]
  18. Rhim, H.C.; Kim, D.Y.; Cho, C.S.; Kim, D.H. Effect of Steel Plates on Estimation of the Compressive Strength of Concrete via Ultrasonic Testing. Materials 2020, 13, 887. [Google Scholar] [CrossRef] [Green Version]
  19. Liu, X.; Sun, D.; Liu, D.; Meng, K.; Ni, C.; Shao, Z.; Sun, L. Simulation of ultrasonic propagation in porous cellular concrete materials. Constr. Build. Mater. 2021, 285, 122852. [Google Scholar] [CrossRef]
  20. Zhang, Y.; Ben Jar, P.-Y.; Nguyen, K.-C.T.; Le, L.H. Characterization of ductile damage in polyethylene plate using ultrasonic testing. Polym. Test. 2017, 62, 51–60. [Google Scholar] [CrossRef]
  21. Poletika, I.M.; Egorova, N.M.; Kulikova, O.A.; Zuev, L.B. Supersonic testing of mechanical property uniformity in hot-rolled steel. Tech. Phys. 2001, 46, 307–310. [Google Scholar] [CrossRef]
  22. Semukhin, B.S.; Zuev, L.B.; Bushmeleva, K.I. The velocity of ultrasound in low-carbon steel deformed at the low yield limit. J. Appl. Mech. Tech. Phys. 2000, 41, 556–559. [Google Scholar] [CrossRef]
  23. Kennedy, J.; Wiskel, J.; Henein, H.; Ivey, D. Characterization oF L80 Steel Microstructure Using Ultrasonic Measurements: Materials Science & Technology Conference and Exhibition, MS & T’14: Pittsburgh, Pennsylvania, USA, 12–16 October 2014, 1st ed.; Association for Iron & Steel Technology: Warrendale, PA, USA, 2014; ISBN 978-163439723-0. [Google Scholar]
  24. Carreon, H. Ultrasonic Characterization of the Elastic Constants in an Aging Ti-6Al-4V ELI Alloy. In Proceedings of the ASME 2019 International Mechanical Engineering Congress and Exposition, Salt Lake City, UT, USA, 11–14 November 2019; Volume 11: Acoustics, Vibration, and Phononics. American Society of Mechanical Engineers: New York, NY, USA, 2020. ISBN 978-0-7918-5948-3. [Google Scholar]
  25. Love, J.; Walluk, M.; Reis, H.L. Nonlinear ultrasonic assessment of damage in cast iron components. In Proceedings of the Health Monitoring of Structural and Biological Systems XVI, Long Beach, CA, USA, 6 March–11 April 2022; Fromme, P., Su, Z., Eds.; SPIE: Bellingham, WA, USA, 2022; p. 43, ISBN 9781510649712. [Google Scholar]
  26. Carreon, H.; Carreon-Garcidueñas, M. The Elastic Constants Measurement in a Medical TI–6AL–4V ELI Alloy by Using Ultrasonic Means. In Characterization of Minerals, Metals, and Materials 2022; Zhang, M., Li, J., Li, B., Monteiro, S.N., Ikhmayies, S., Kalay, Y.E., Hwang, J.-Y., Escobedo-Diaz, J.P., Carpenter, J.S., Brown, A.D., et al., Eds.; Springer International Publishing: Cham, Switzerland, 2022; pp. 463–471. ISBN 978-3-030-92372-3. [Google Scholar]
  27. Muraviev, V.V.; Zuev, L.B.; Komarov, K.L. The ultrasound velocity and structure of steels and alloys. Nauka 1996, 185. [Google Scholar]
  28. Toozandehjani, M.; Matori, K.A.; Ostovan, F.; Mustapha, F.; Zahari, N.I.; Oskoueian, A. On the correlation between microstructural evolution and ultrasonic properties: A review. J. Mater. Sci. 2015, 50, 2643–2665. [Google Scholar] [CrossRef]
  29. Choi, S.; Ryu, J.; Kim, J.-S.; Jhang, K.-Y. Comparison of Linear and Nonlinear Ultrasonic Parameters in Characterizing Grain Size and Mechanical Properties of 304L Stainless Steel. Metals 2019, 9, 1279. [Google Scholar] [CrossRef] [Green Version]
  30. Permikin, V.S. Diagnostics of Creep of Heat-Resistant Steels on the Basis of Measurements of the Ultrasonic Wave Velocity in Nondestructive Testing of Energy Equipment: I. Probes and Tools for Measuring the Velocity of Ultrasound. Russ. J. Nondestruct. Test. 2004, 40, 35–45. [Google Scholar] [CrossRef]
  31. Zuev, L.B.; Semukhin, B.S.; Bushmelyova, K.I. Ultrasound-velocity measurement of strain in metallic polycrystals. Mater. Res. Innov. 2002, 5, 140–143. [Google Scholar] [CrossRef]
  32. Hirsekorn, S. The scattering of ultrasonic waves by polycrystals. J. Acoust. Soc. Am. 1982, 72, 1021–1031. [Google Scholar] [CrossRef]
  33. Crecraft, D.I. The measurement of applied and residual stresses in metals using ultrasonic waves. J. Sound. Vib. 1967, 5, 173–192. [Google Scholar] [CrossRef]
  34. Gerstein, G.; Clausmeyer, T.; Isik, K.; Nürnberger, F.; Tekkaya, A.E.; Bruchanov, A.A.; Maier, H.J. Experimental analysis of anisotropic damage in dual-phase steel by resonance measurement. Int. J. Damage Mech. 2017, 26, 1147–1169. [Google Scholar] [CrossRef]
Figure 1. Micrographs of the three different material conditions of DC04 analyzed: (a) initial condition, (b) 850 °C, 30 min, (c) 1150 °C, 5 h.
Jmmp 07 00142 g001
Figure 2. Measurement setup for ultrasonic testing.
Jmmp 07 00142 g002
Figure 3. Evolution of the sonic velocity vs. the degree of deformation: (a) initial condition, (b) 850 °C, 30 min, (c) 1150 °C, 5 h.
Jmmp 07 00142 g003
Figure 4. Development of damage parameter D for different grain sizes at φ = 0.1 and φ = 0.3.
Jmmp 07 00142 g004
Figure 5. SEM images of the microstructure for void analysis, rolling direction (RD) marked in the figures: (a) initial condition, (b) 1150 °C, 5 h, φ = 0.3, (c) initial condition, φ = 0.3 with increased void formation at grain boundaries, (d) 1150 °C, 5 h, φ = 0.3 with areas with low void volume fraction.
Jmmp 07 00142 g005
Figure 6. Evolution of the average void size vs. the degree of deformation: (a) initial condition, (b) 850 °C, 30 min, (c) 1150 °C, 5 h.
Jmmp 07 00142 g006
Table 1. Chemical composition in wt.-% of DC04.
CSiMnPSAlCuCrNiFe
DC040.0470.0140.2250.0070.0120.0720.0120.0180.010balance
Table 2. Damage parameter D calculated for the different material conditions based on the ultrasonic measurements.
Initial Condition850 °C, 30 min1150 °C, 5 h
cold rolling, φ = 0.10.0040.0080.011
cold rolling, φ = 0.30.0130.0250.033
Disclaimer/Publisher’s Note: The statements, opinions and data contained in all publications are solely those of the individual author(s) and contributor(s) and not of MDPI and/or the editor(s). MDPI and/or the editor(s) disclaim responsibility for any injury to people or property resulting from any ideas, methods, instructions or products referred to in the content.

