
Influence of Carbon on Additively Manufactured Ti-6Al-4V

Abstract
:1. Introduction
2. Materials and Methods
2.1. Ti-6Al-4V in PBF-L/M
2.2. Preparation of Ti-6Al-4V Powder
2.3. Specimen Geometries and Test Scheme
2.4. Microstrucural Characterization
2.5. Mechanical Characterization
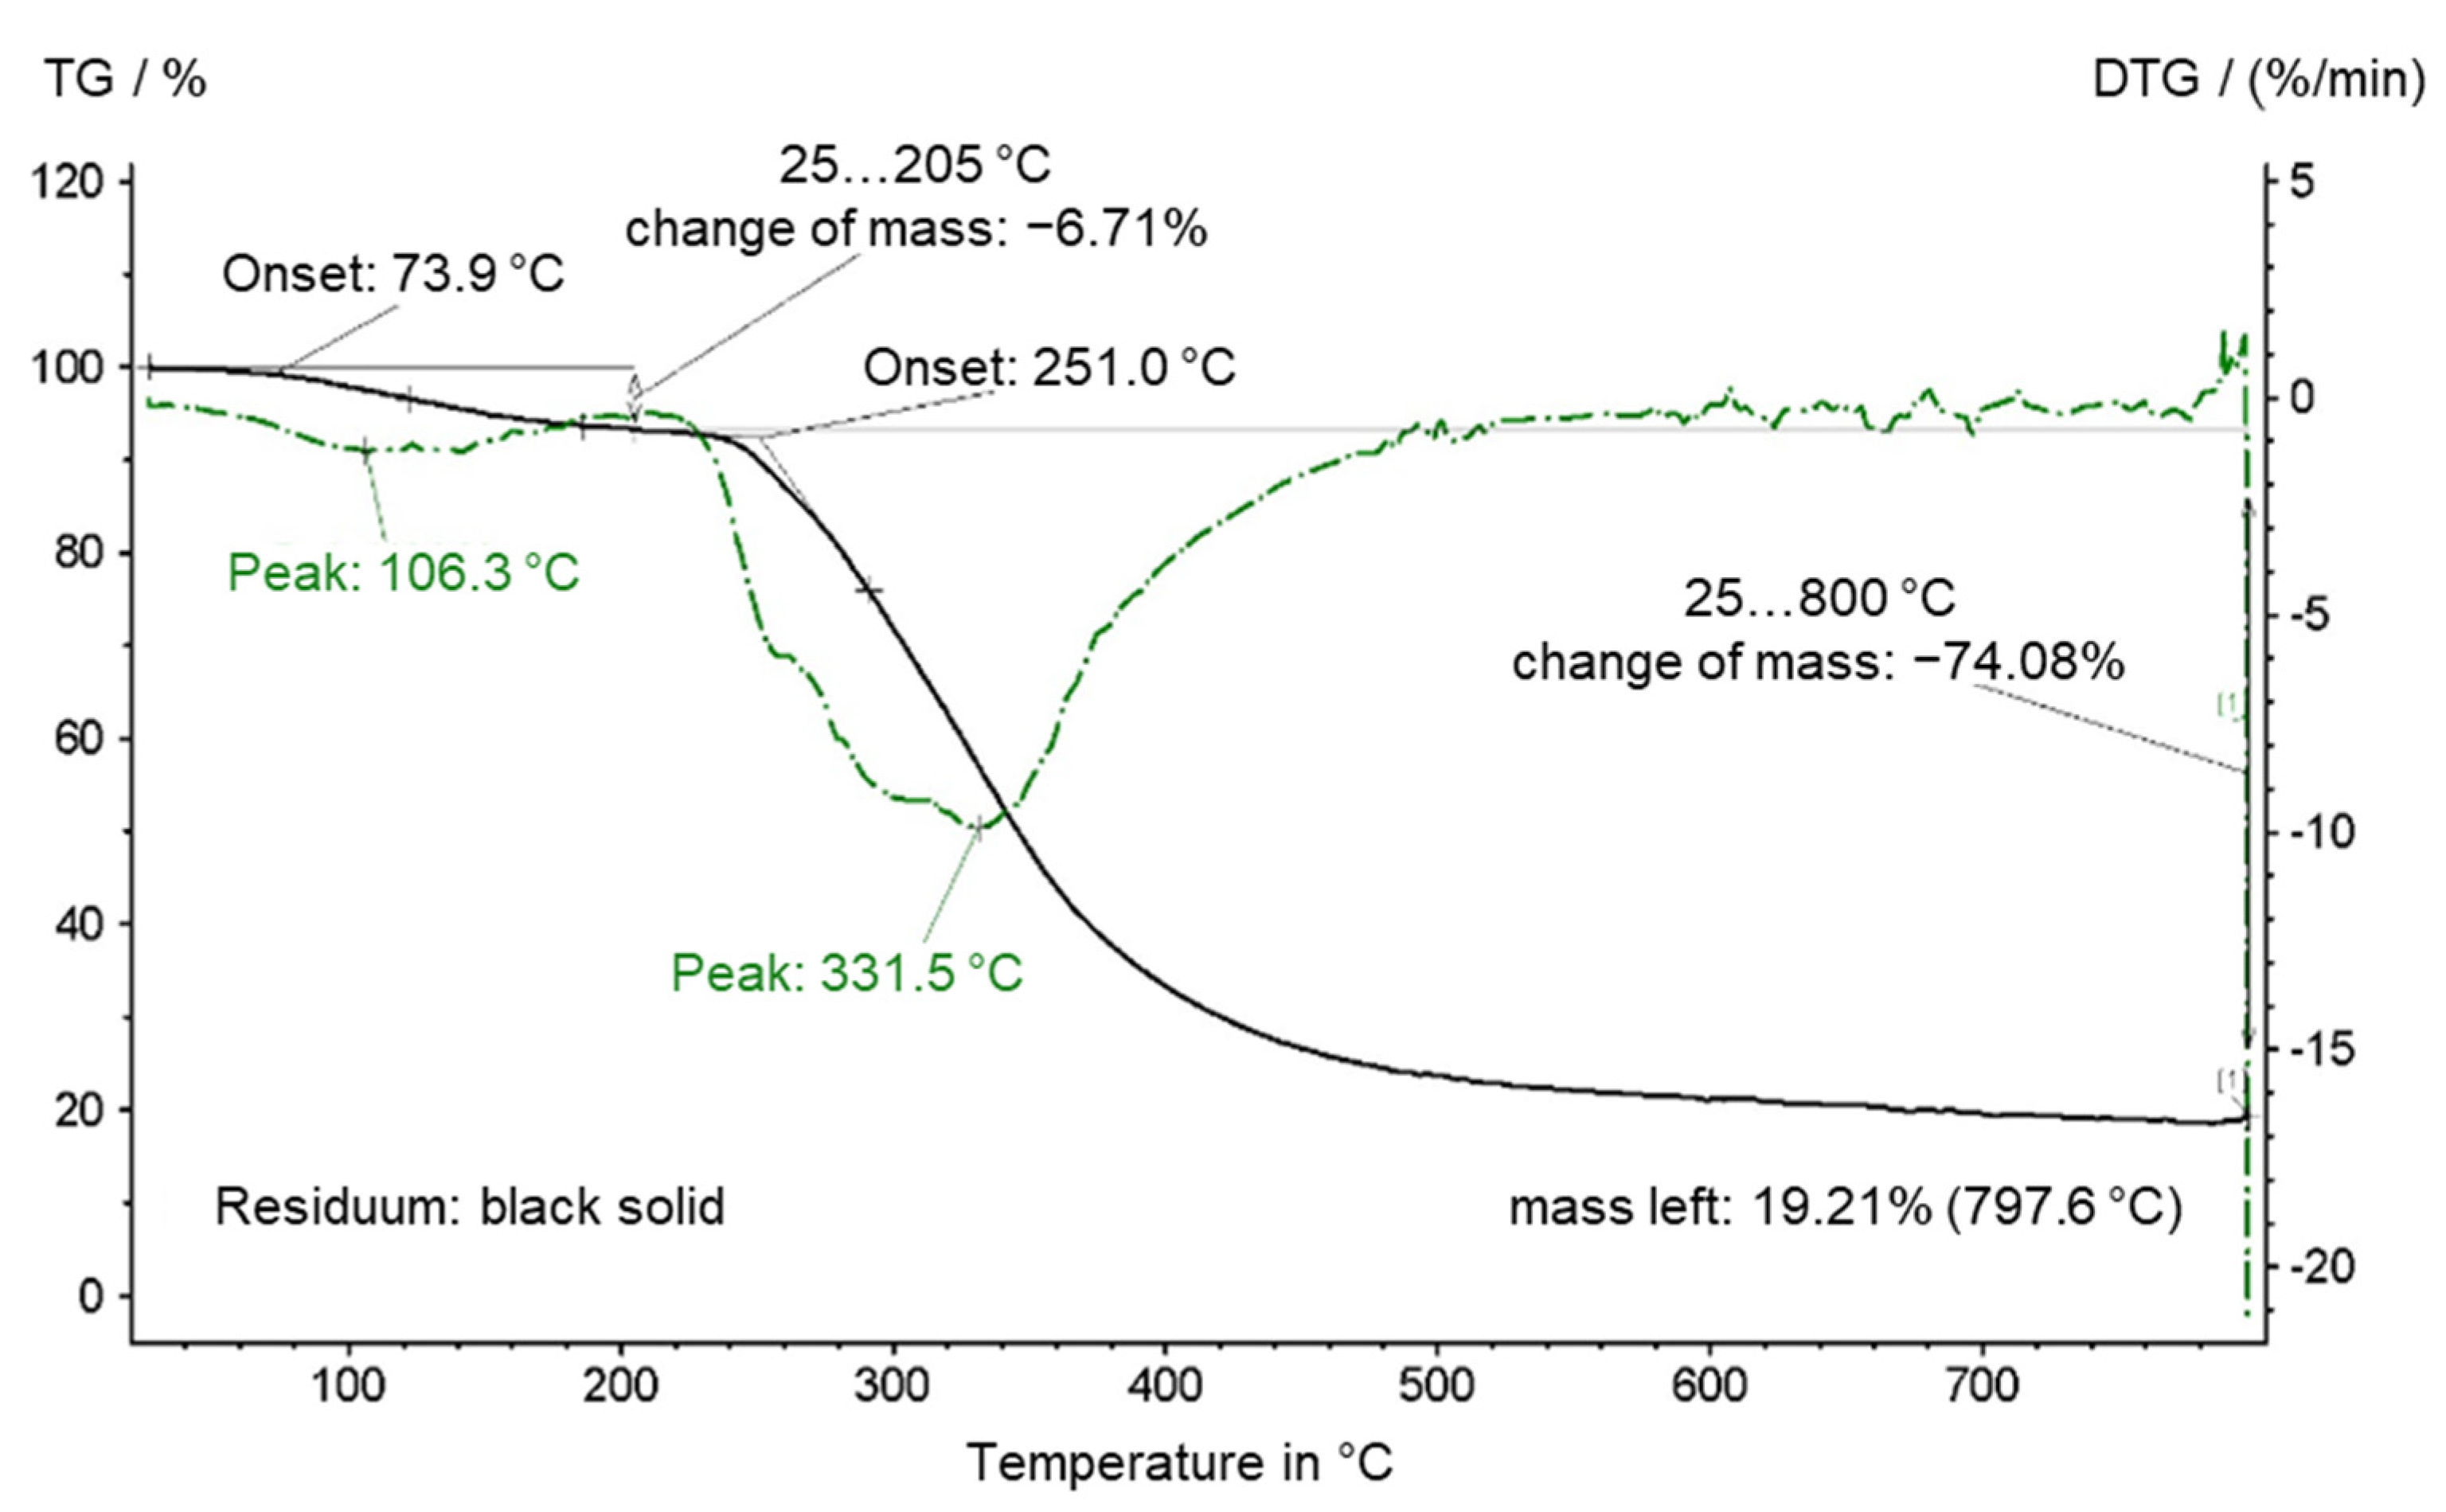
2.6. Thermogravimetric Analysis
3. Results
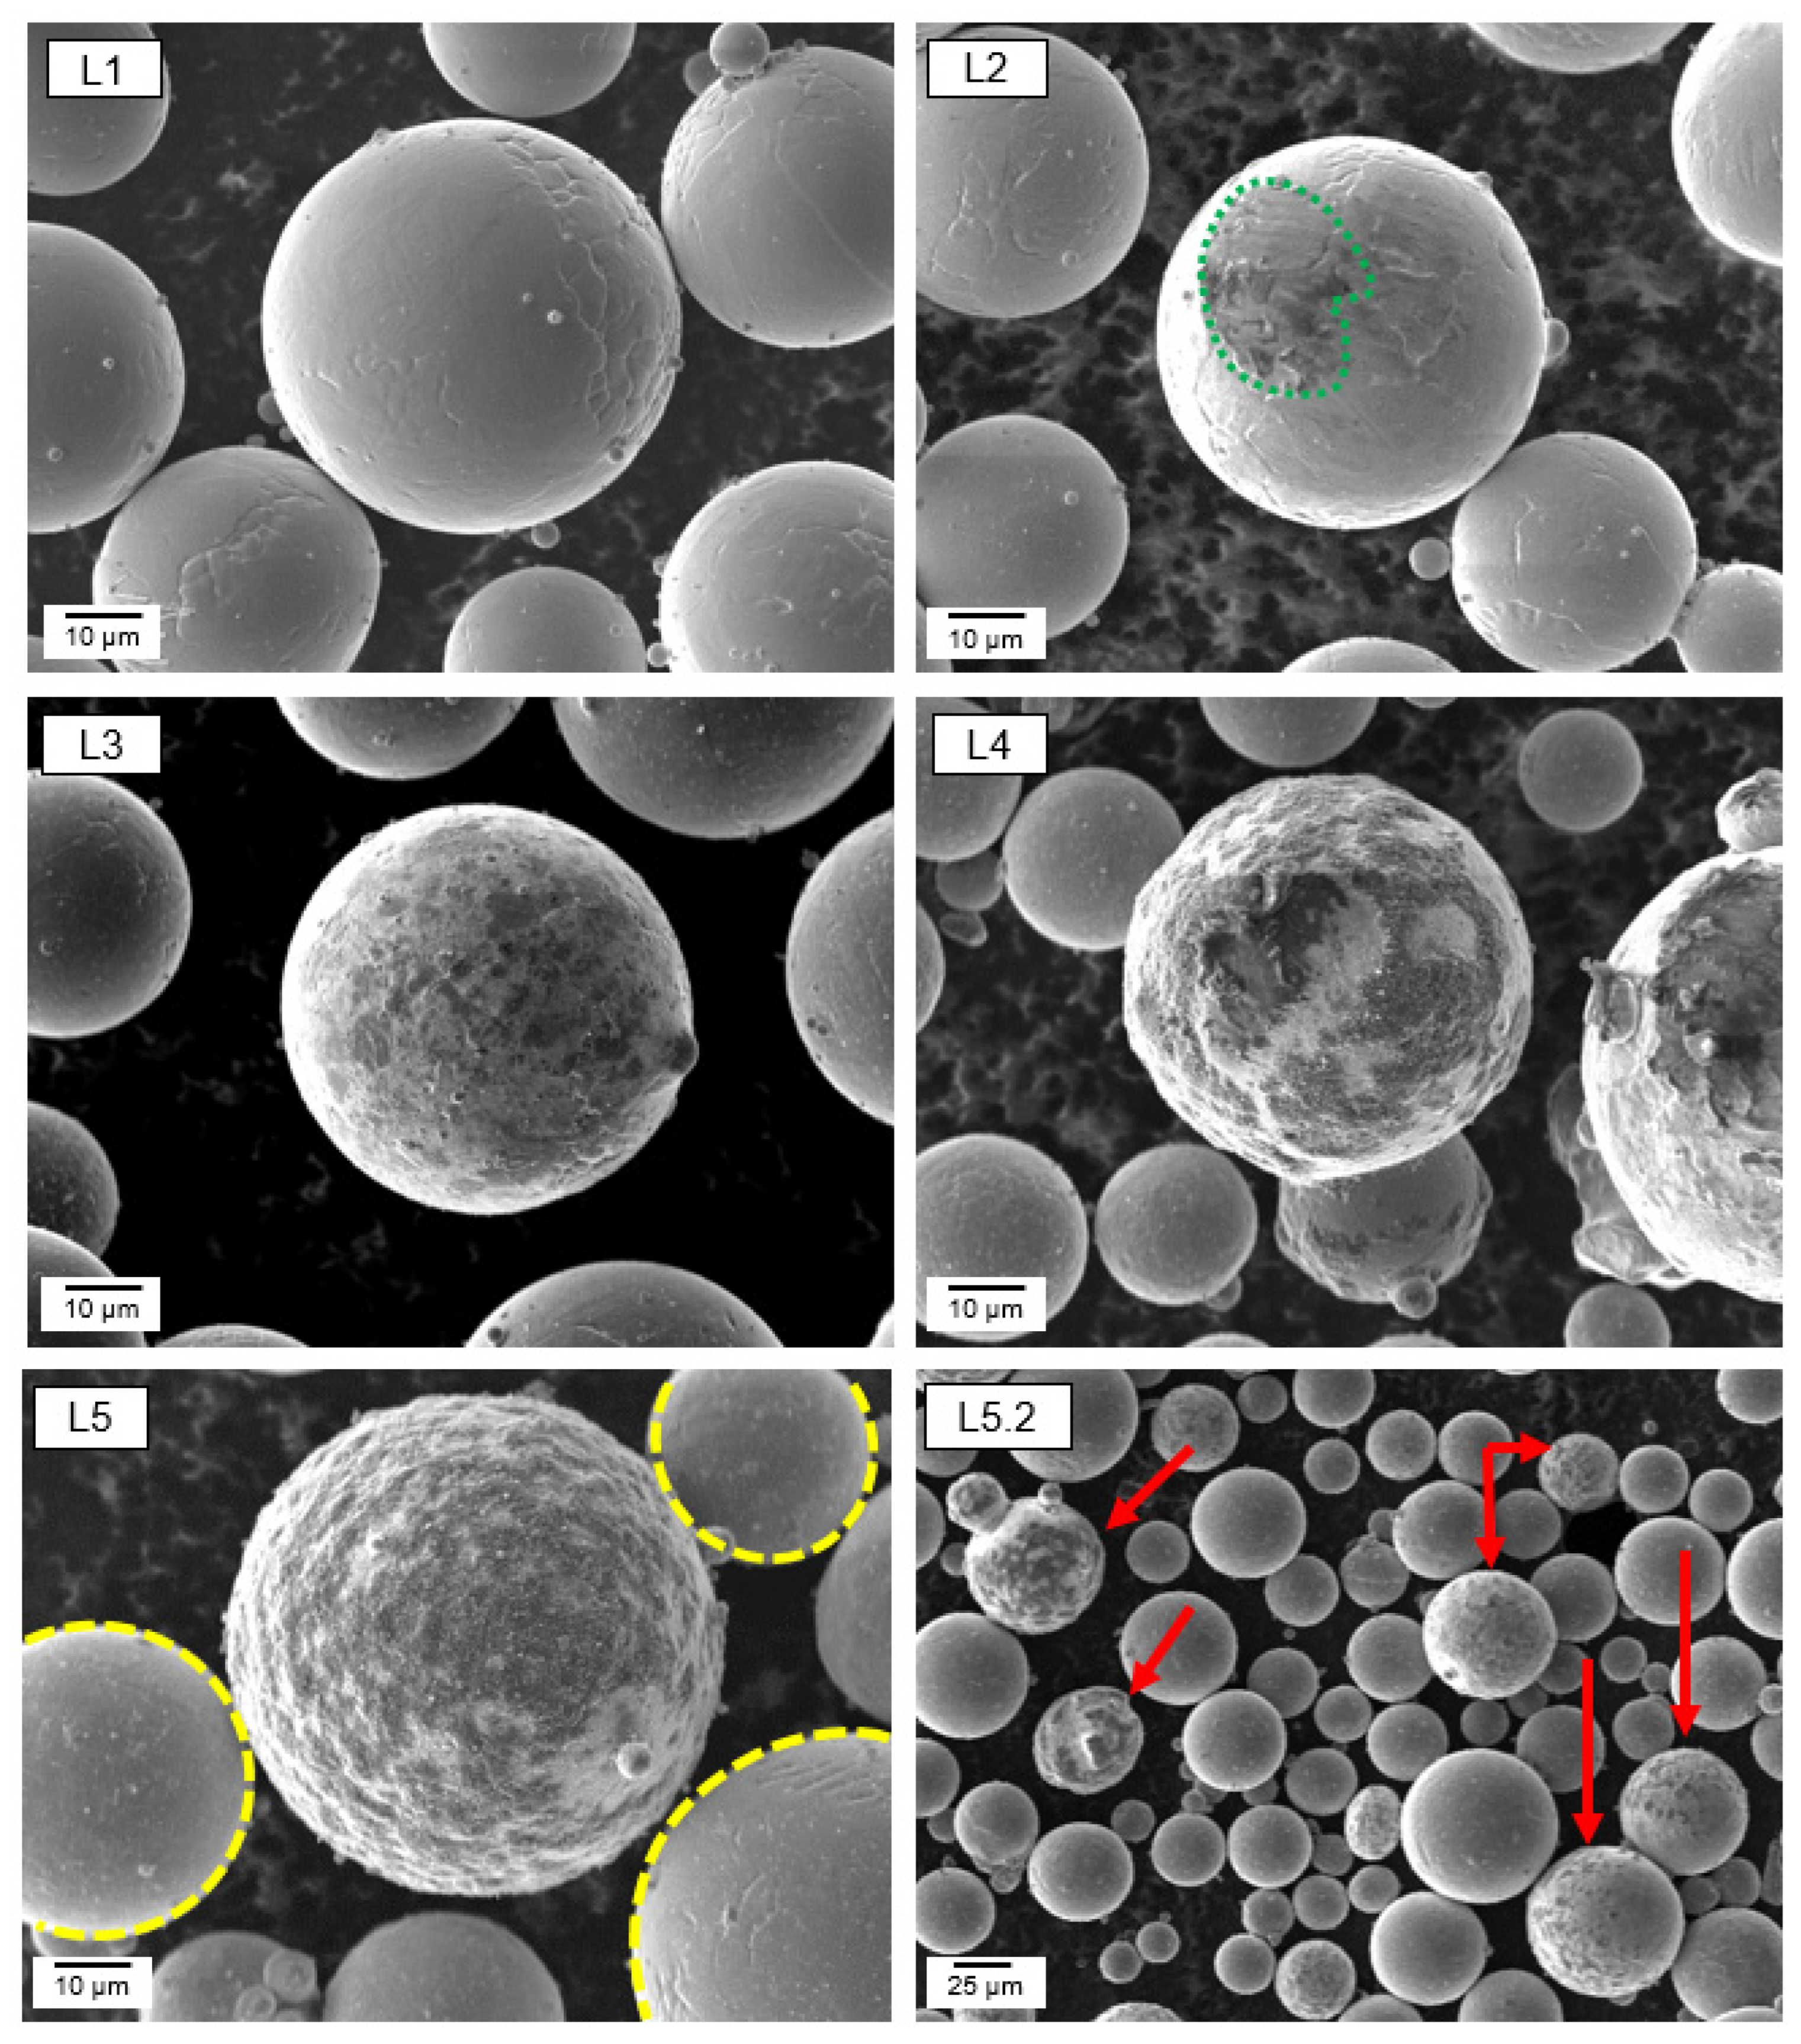
3.1. Powder Analysis
3.2. Additive Manufacturing
3.3. Microstructure of Ti-6Al-4V Specimen
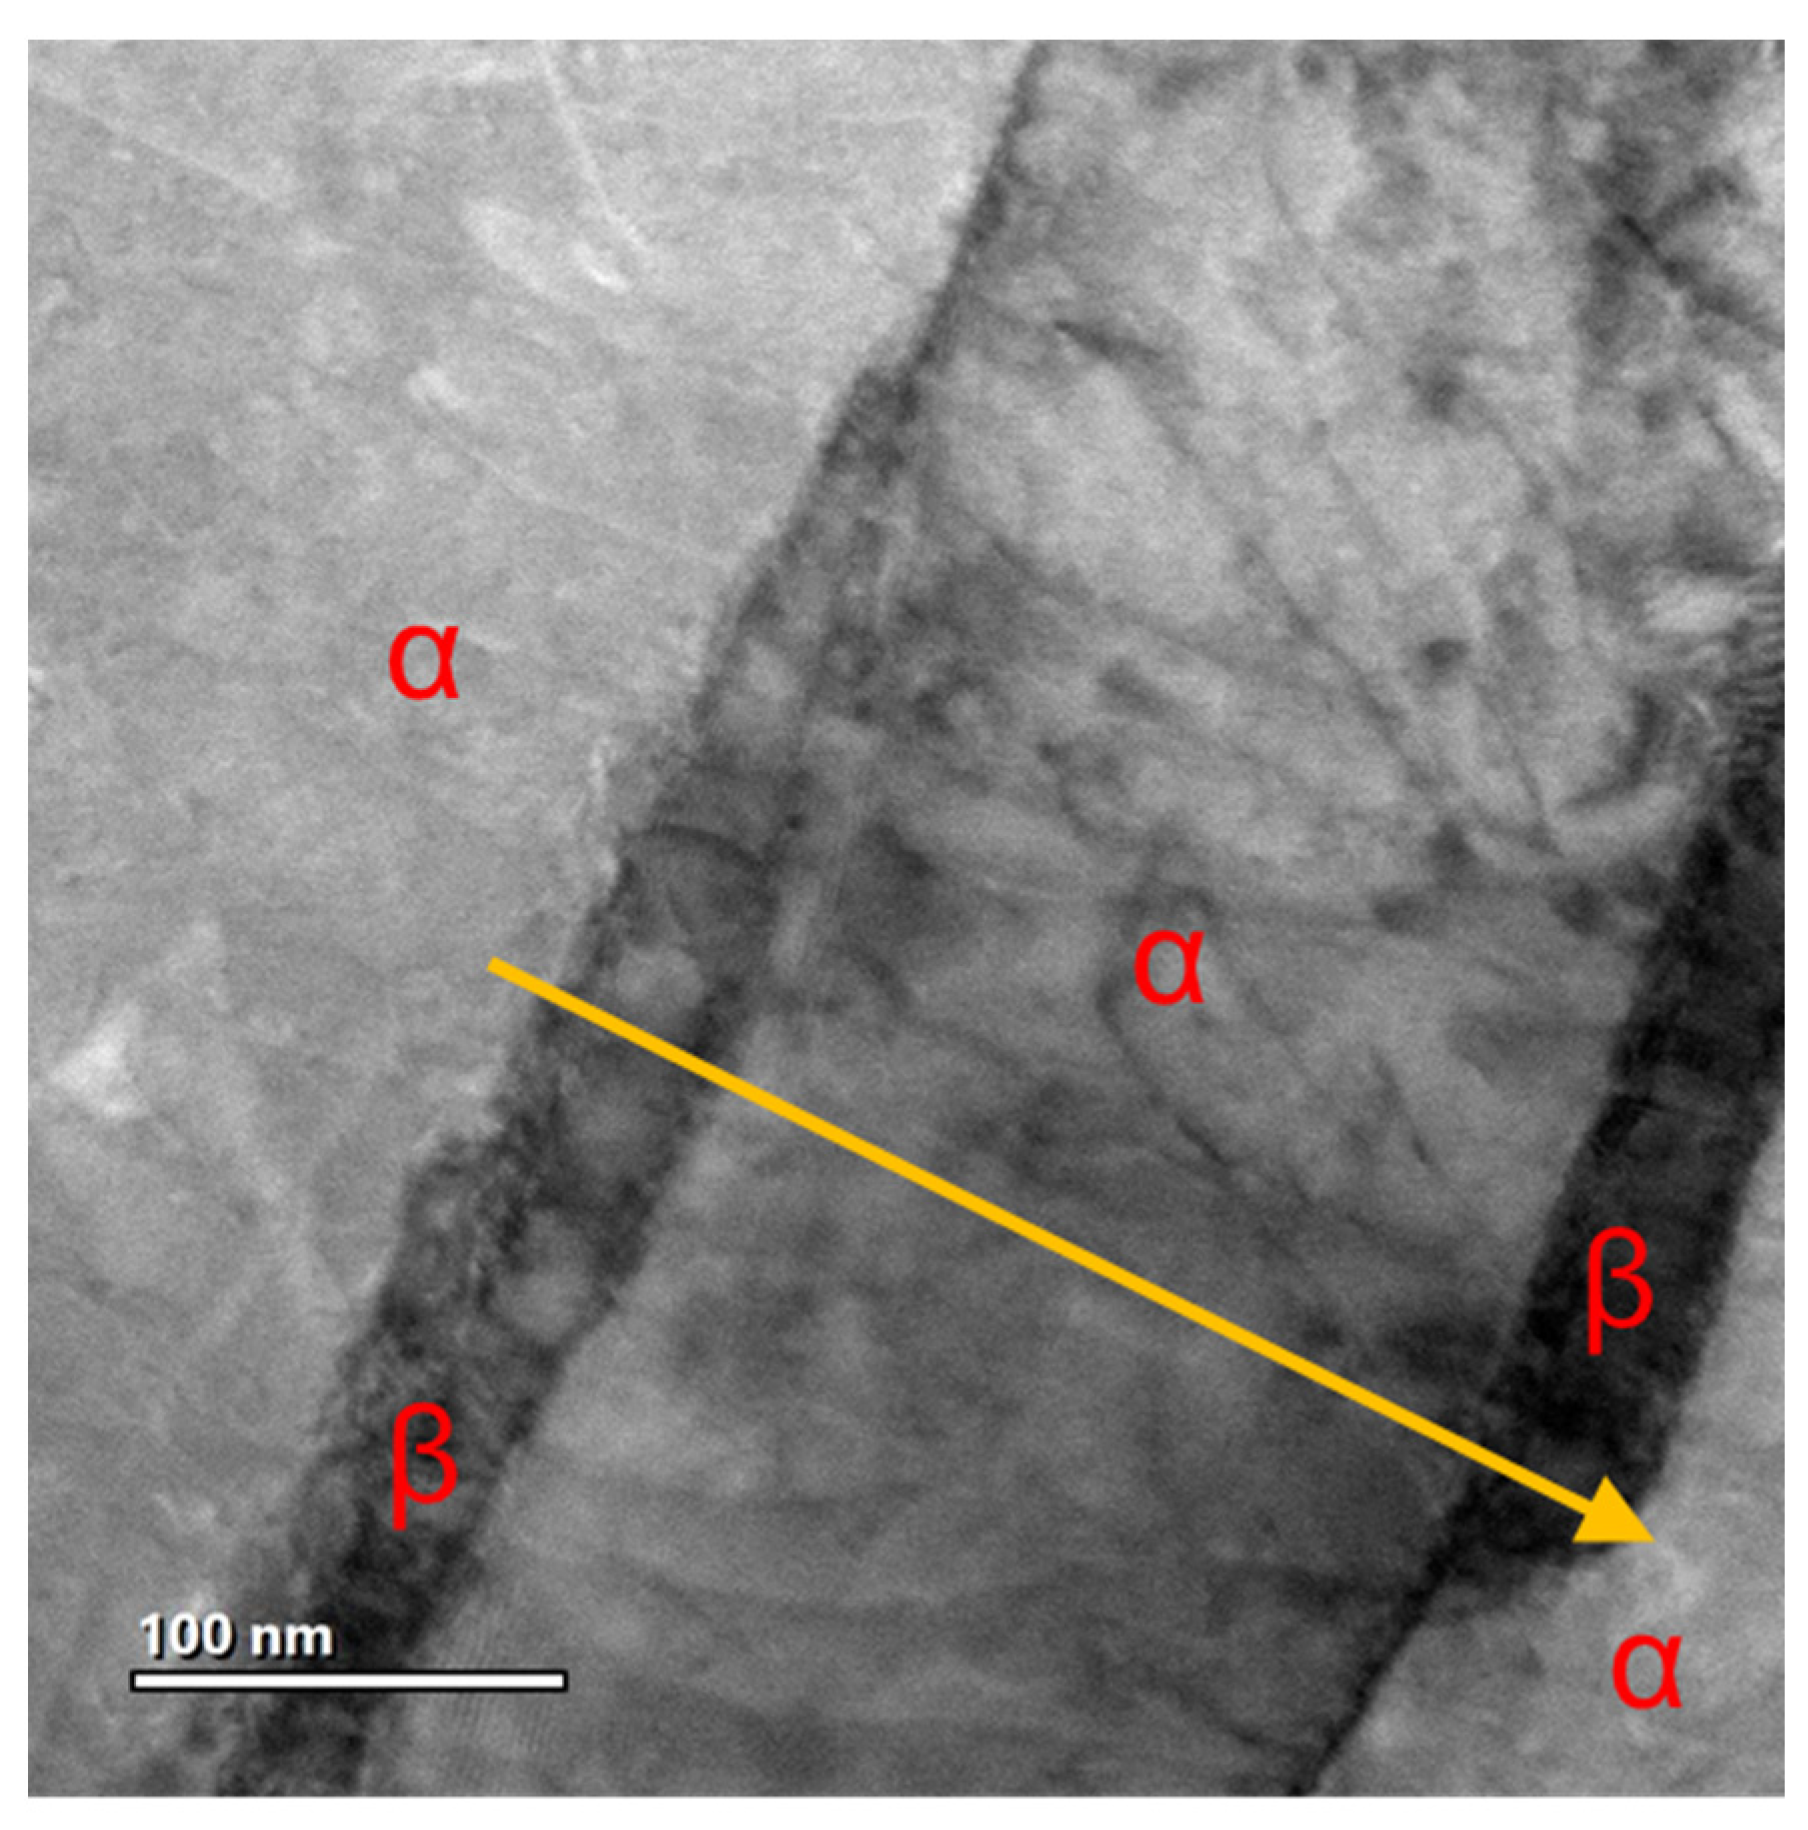
3.4. Details of the Microstructure and Elemental Distribution

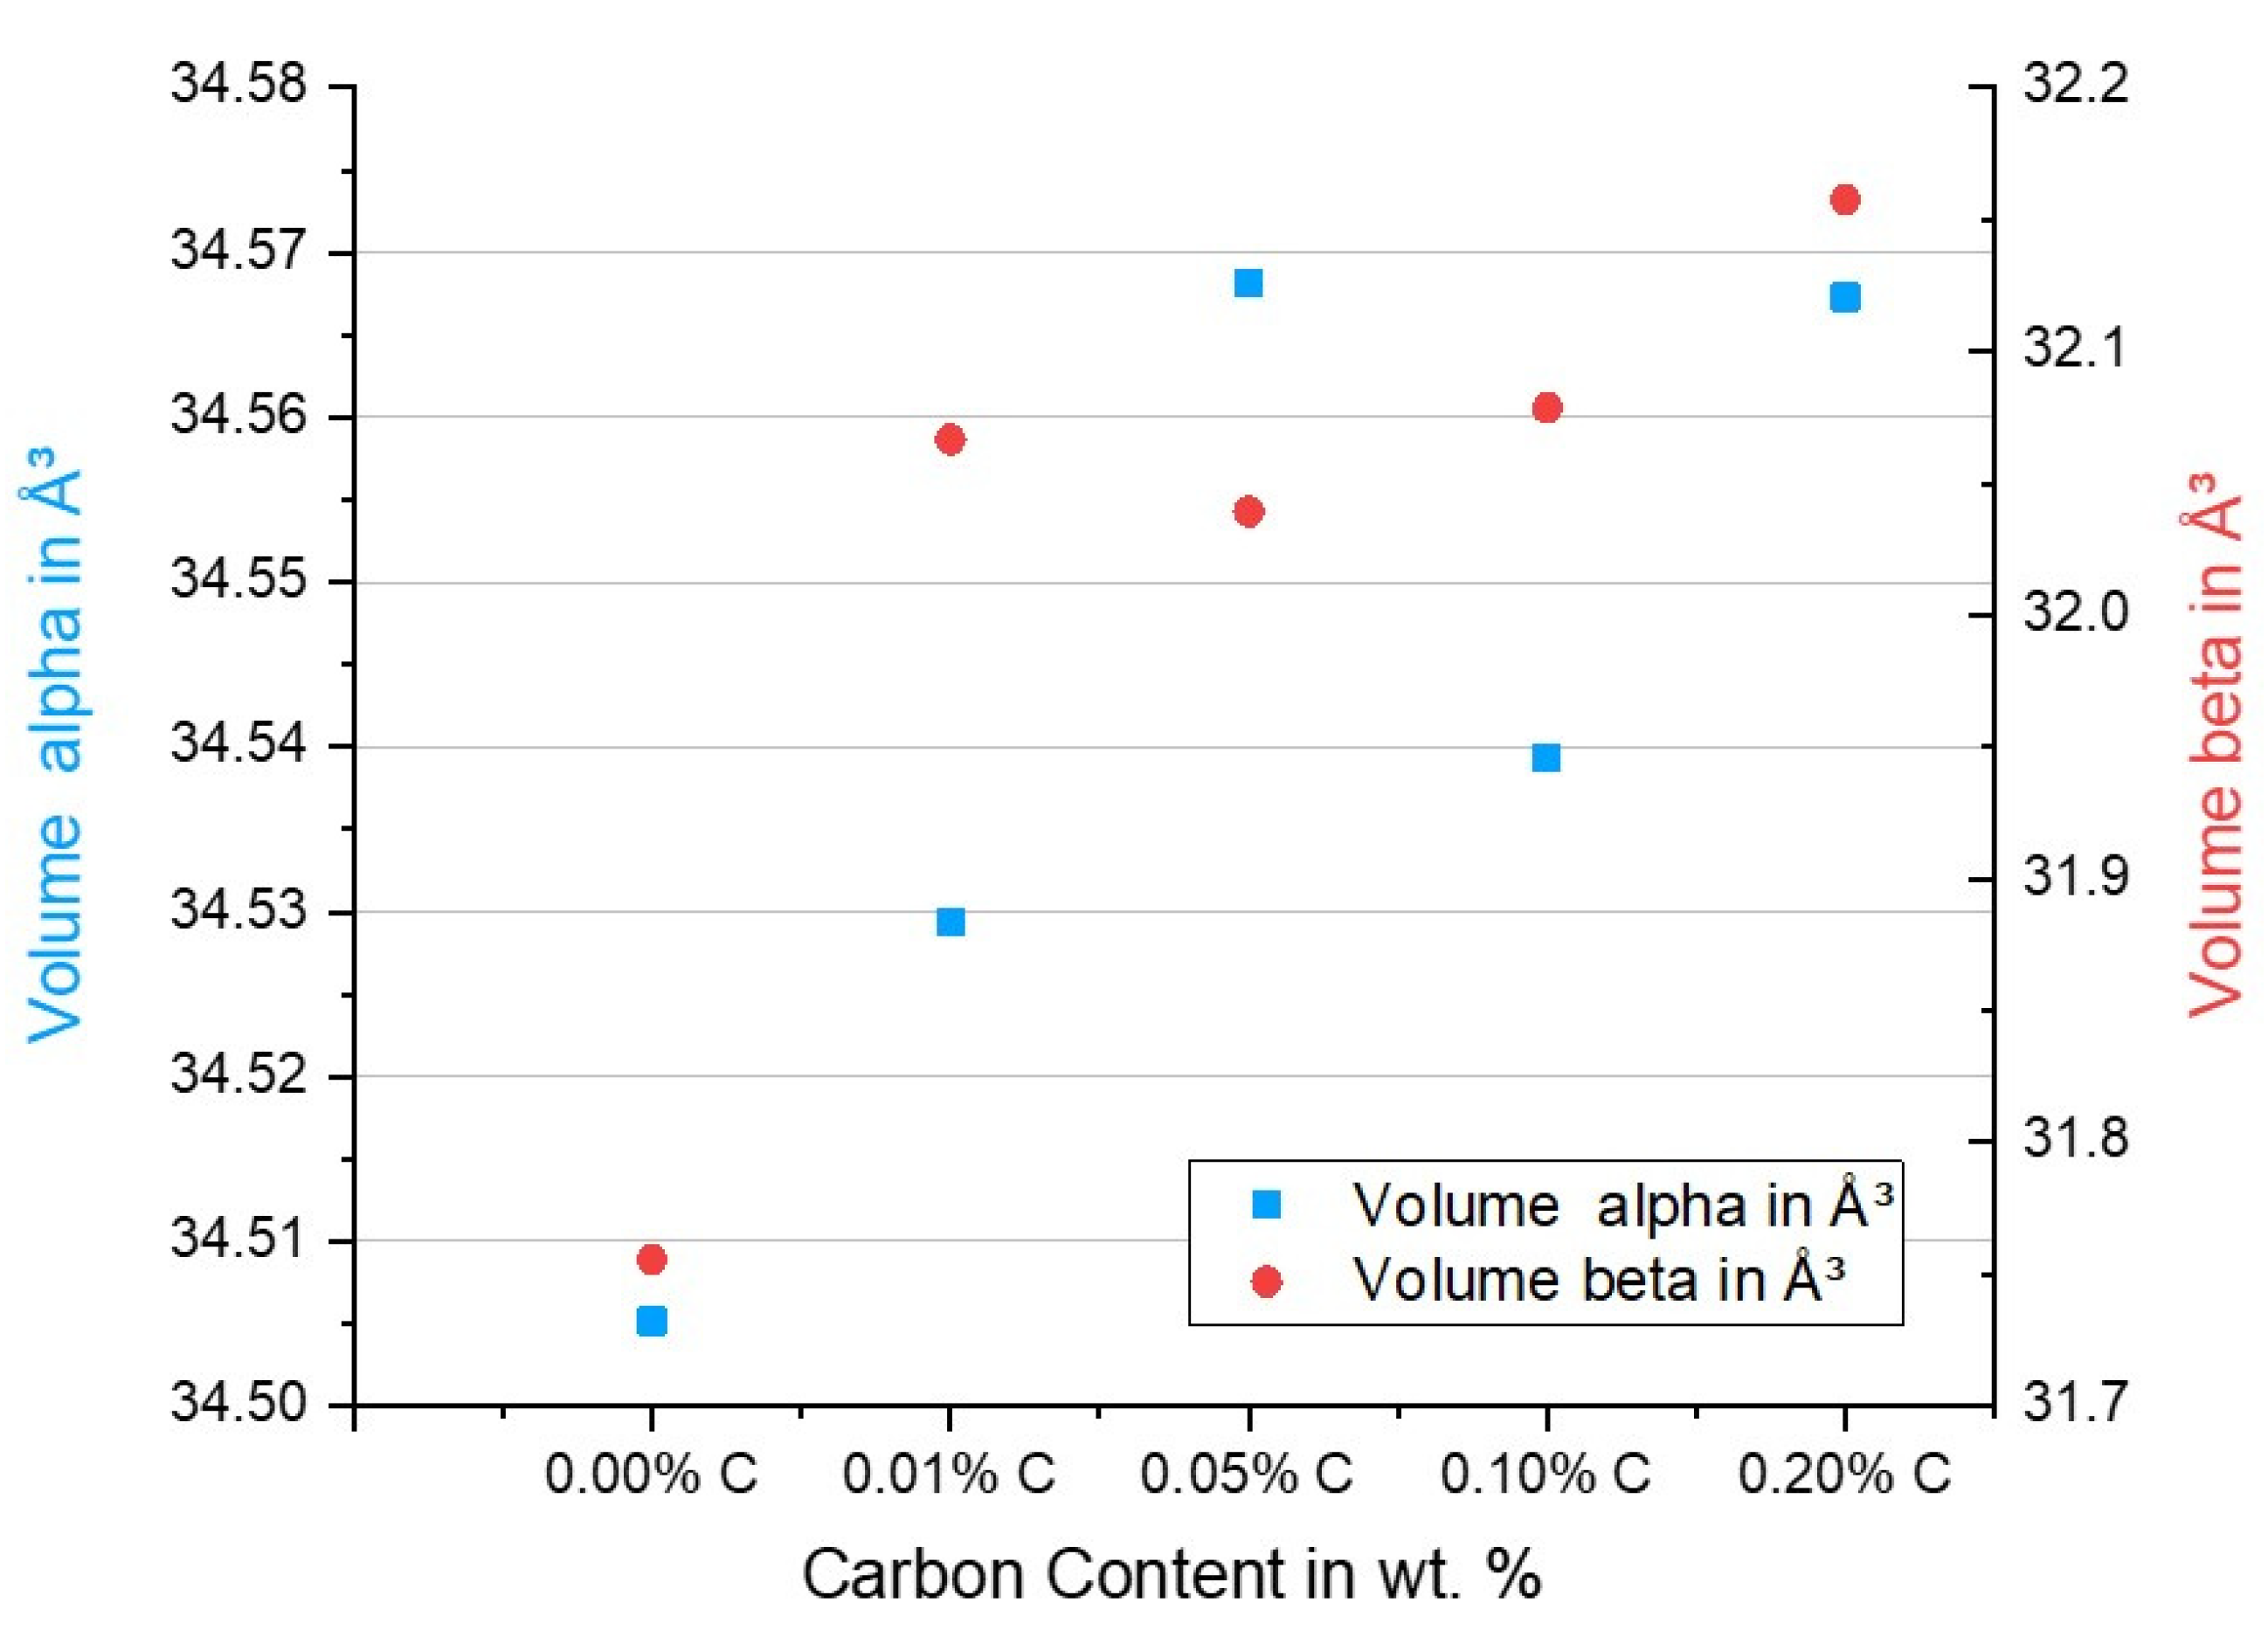
3.5. Lattice Parameters

3.6. Hardness Measurement
3.7. Tensile Testing
3.8. Axial Fatigue Testing
4. Conclusions
Author Contributions
Funding
Institutional Review Board Statement
Informed Consent Statement
Data Availability Statement
Acknowledgments
Conflicts of Interest
References
- Statista. Globales Marktvolumen von 3D-Druck-Verfahren in Ausgewählten Branchen bis 2030 Statista. Available online: https://de.statista.com/statistik/daten/studie/802439/umfrage/globales-marktvolumen-von-3d-druck-verfahren-in-ausgewaehlten-branchen/ (accessed on 26 May 2023).
- Uckelmann, I. ‘Buy-to-Fly’ Ratio Cutting Costs with Metal 3D Printing; Materialise Manufacturing: Leuven, Belgium, 2017. [Google Scholar]
- Liu, R.; Wang, Z.; Sparks, T.; Liou, F.; Newkirk, J. 13—Aerospace applications of laser additive manufacturing. In Laser Additive Manufacturing: Materials, Design, Technologies, and Applications; Brandt, M., Ed.; Elsevier/Woodhead Publishing: Amsterdam, The Netherlands, 2016; pp. 351–371. ISBN 978-0-08-100433-3. [Google Scholar]
- Dutta, B.; Froes, F.H. (Eds.) Chapter 1—The Additive Manufacturing of Titanium Alloys. In Additive Manufacturing of Titanium Alloys; Butterworth-Heinemann: Oxford, UK, 2016; pp. 1–10. ISBN 978-0-12-804782-8. [Google Scholar]
- Yadroitsev, I. Fundamentals of Laser Powder Bed Fusion of Metals; Elsevier: Amsterdam, The Netherlands, 2021; ISBN 9780128240915. [Google Scholar]
- Russell, R.; Wells, D.; Waller, J.; Poorganji, B.; Ott, E.; Nakagawa, T.; Sandoval, H.; Shamsaei, N.; Seifi, M. 3—Qualification and certification of metal additive manufactured hardware for aerospace applications**Disclaimer: The views presented in this paper are those of the authors and should not be construed as representing official rules interpretation or policy of ASTM International, General Electric (GE), Lockheed Martin Corporation (LMCO), National Aeronautics and Space Agency (NASA), Japanese Space and Exploration Agency (JAXA), or the Federal Aviation Administration (FAA). In Additive Manufacturing for the Aerospace Industry; Froes, F., Boyer, R., Eds.; Elsevier: Amsterdam, The Netherlands, 2019; pp. 33–66. ISBN 978-0-12-814062-8. [Google Scholar]
- Blakey-Milner, B.; Gradl, P.; Snedden, G.; Brooks, M.; Pitot, J.; Lopez, E.; Leary, M.; Berto, F.; du Plessis, A. Metal additive manufacturing in aerospace: A review. Mater. Des. 2021, 209, 110008. [Google Scholar] [CrossRef]
- Katz-Demyanetz, A.; Popov, V.V.; Kovalevsky, A.; Safranchik, D.; Koptyug, A. Powder-bed additive manufacturing for aerospace application: Techniques, metallic and metal/ceramic composite materials and trends. Manuf. Rev. 2019, 6, 5. [Google Scholar] [CrossRef] [Green Version]
- Handke, V. Kornfeinung von Titanschweißnähten Durch Mechanisch-Thermische Behandlung. Diplomarbeit; Hochschule für Angewandte Wissenschaften Hamburg: Hamburg, Germany, 2012. [Google Scholar]
- Wycisk, E. Ermüdungseigenschaften der Laseradditiv Gefertigten Titanlegierung TiAl6V4; Springer: Berlin/Heidelberg, Germany, 2017; ISBN 978-3-662-56059-4. [Google Scholar]
- Hooper, P.A. Melt pool temperature and cooling rates in laser powder bed fusion. Addit. Manuf. 2018, 22, 548–559. [Google Scholar] [CrossRef]
- DIN SPEC 17071:2019-12; Additive Fertigung_- Anforderungen an Qualitätsgesicherte Prozesse für Additive Fertigungszentren. Beuth Verlag GmbH: Berlin, Germany, 2019; (In German and English).
- Popov, V.V.; Lobanov, M.L.; Stepanov, S.I.; Qi, Y.; Muller-Kamskii, G.; Popova, E.N.; Katz-Demyanetz, A.; Popov, A.A. Texturing and Phase Evolution in Ti-6Al-4V: Effect of Electron Beam Melting Process, Powder Re-Using, and HIP Treatment. Materials 2021, 14, 4473. [Google Scholar] [CrossRef] [PubMed]
- Powell, D.; Rennie, A.E.; Geekie, L.; Burns, N. Understanding powder degradation in metal additive manufacturing to allow the upcycling of recycled powders. J. Clean. Prod. 2020, 268, 122077. [Google Scholar] [CrossRef]
- Seyda, V. Werkstoff- und Prozessverhalten von Metallpulvern in der Laseradditiven Fertigung; Springer: Berlin/Heidelberg, Germany, 2018; ISBN 978-3-662-58232-9. [Google Scholar]
- Winkler, K.; Ahmad, H.; Danzig, A.; Gloetter, P.; Schubert, F.; Wagner, G.; Kroll, L. Effect of organic impurity in additive manufactured Ti-6Al-4V. Addit. Manuf. Lett. 2023, 5, 100116. [Google Scholar] [CrossRef]
- AP&C. Material Certificate No: MC-17-0120: Ti-6Al-4V Grade 23 Powder; AP&C: Quebec, QC, Canada, 2017. [Google Scholar]
- Jäger, C.; Henning, T.; Schlögl, R.; Spillecke, O. Spectral properties of carbon black. J. Non-Cryst. Solids 1999, 258, 161–179. [Google Scholar] [CrossRef]
- Wang, D.; Wu, S.; Fu, F.; Mai, S.; Yang, Y.; Liu, Y.; Song, C. Mechanisms and characteristics of spatter generation in SLM processing and its effect on the properties. Mater. Des. 2017, 117, 121–130. [Google Scholar] [CrossRef]
- Mereddy, S.; Bermingham, M.J.; Kent, D.; Dehghan-Manshadi, A.; StJohn, D.H.; Dargusch, M.S. Trace Carbon Addition to Refine Microstructure and Enhance Properties of Additive-Manufactured Ti-6Al-4V. JOM 2018, 70, 1670–1676. [Google Scholar] [CrossRef]
- Pederson, R. Microstructure and Phase Transformation of Ti-6 Al-4 V ROBERT PEDERSON. Doctoral Dissertation, Luleå Tekniska Universitet, Luleå, Sweden, 2002. [Google Scholar]
- Swarnakar, A.K.; van der Biest, O.; Baufeld, B. Thermal expansion and lattice parameters of shaped metal deposited Ti–6Al–4V. J. Alloys Compd. 2011, 509, 2723–2728. [Google Scholar] [CrossRef]
- Steiner, R. Metals Handbook, 5. Print; ASM International: Metals Park, OH, USA, 1997; ISBN 0-87170-377-7. [Google Scholar]
- Peters, M. Titan und Titanlegierungen, 3rd ed.; Wiley-VCH: Weinheim, Germany, 2002; ISBN 3527305394. [Google Scholar]


| Concentration Level | L1 | L2 | L3 | L4 | L5 |
|---|---|---|---|---|---|
| Carbon black in weight-% | 0.0 | 0.01 | 0.05 | 0.1 | 0.2 |
| Test Specimen | Measurements |
|---|---|
| axial fatigue | Ø17 mm, height 104 mm |
| tensile testing | Ø11 mm, height 80 mm |
| test cubes | edge length 19 mm |
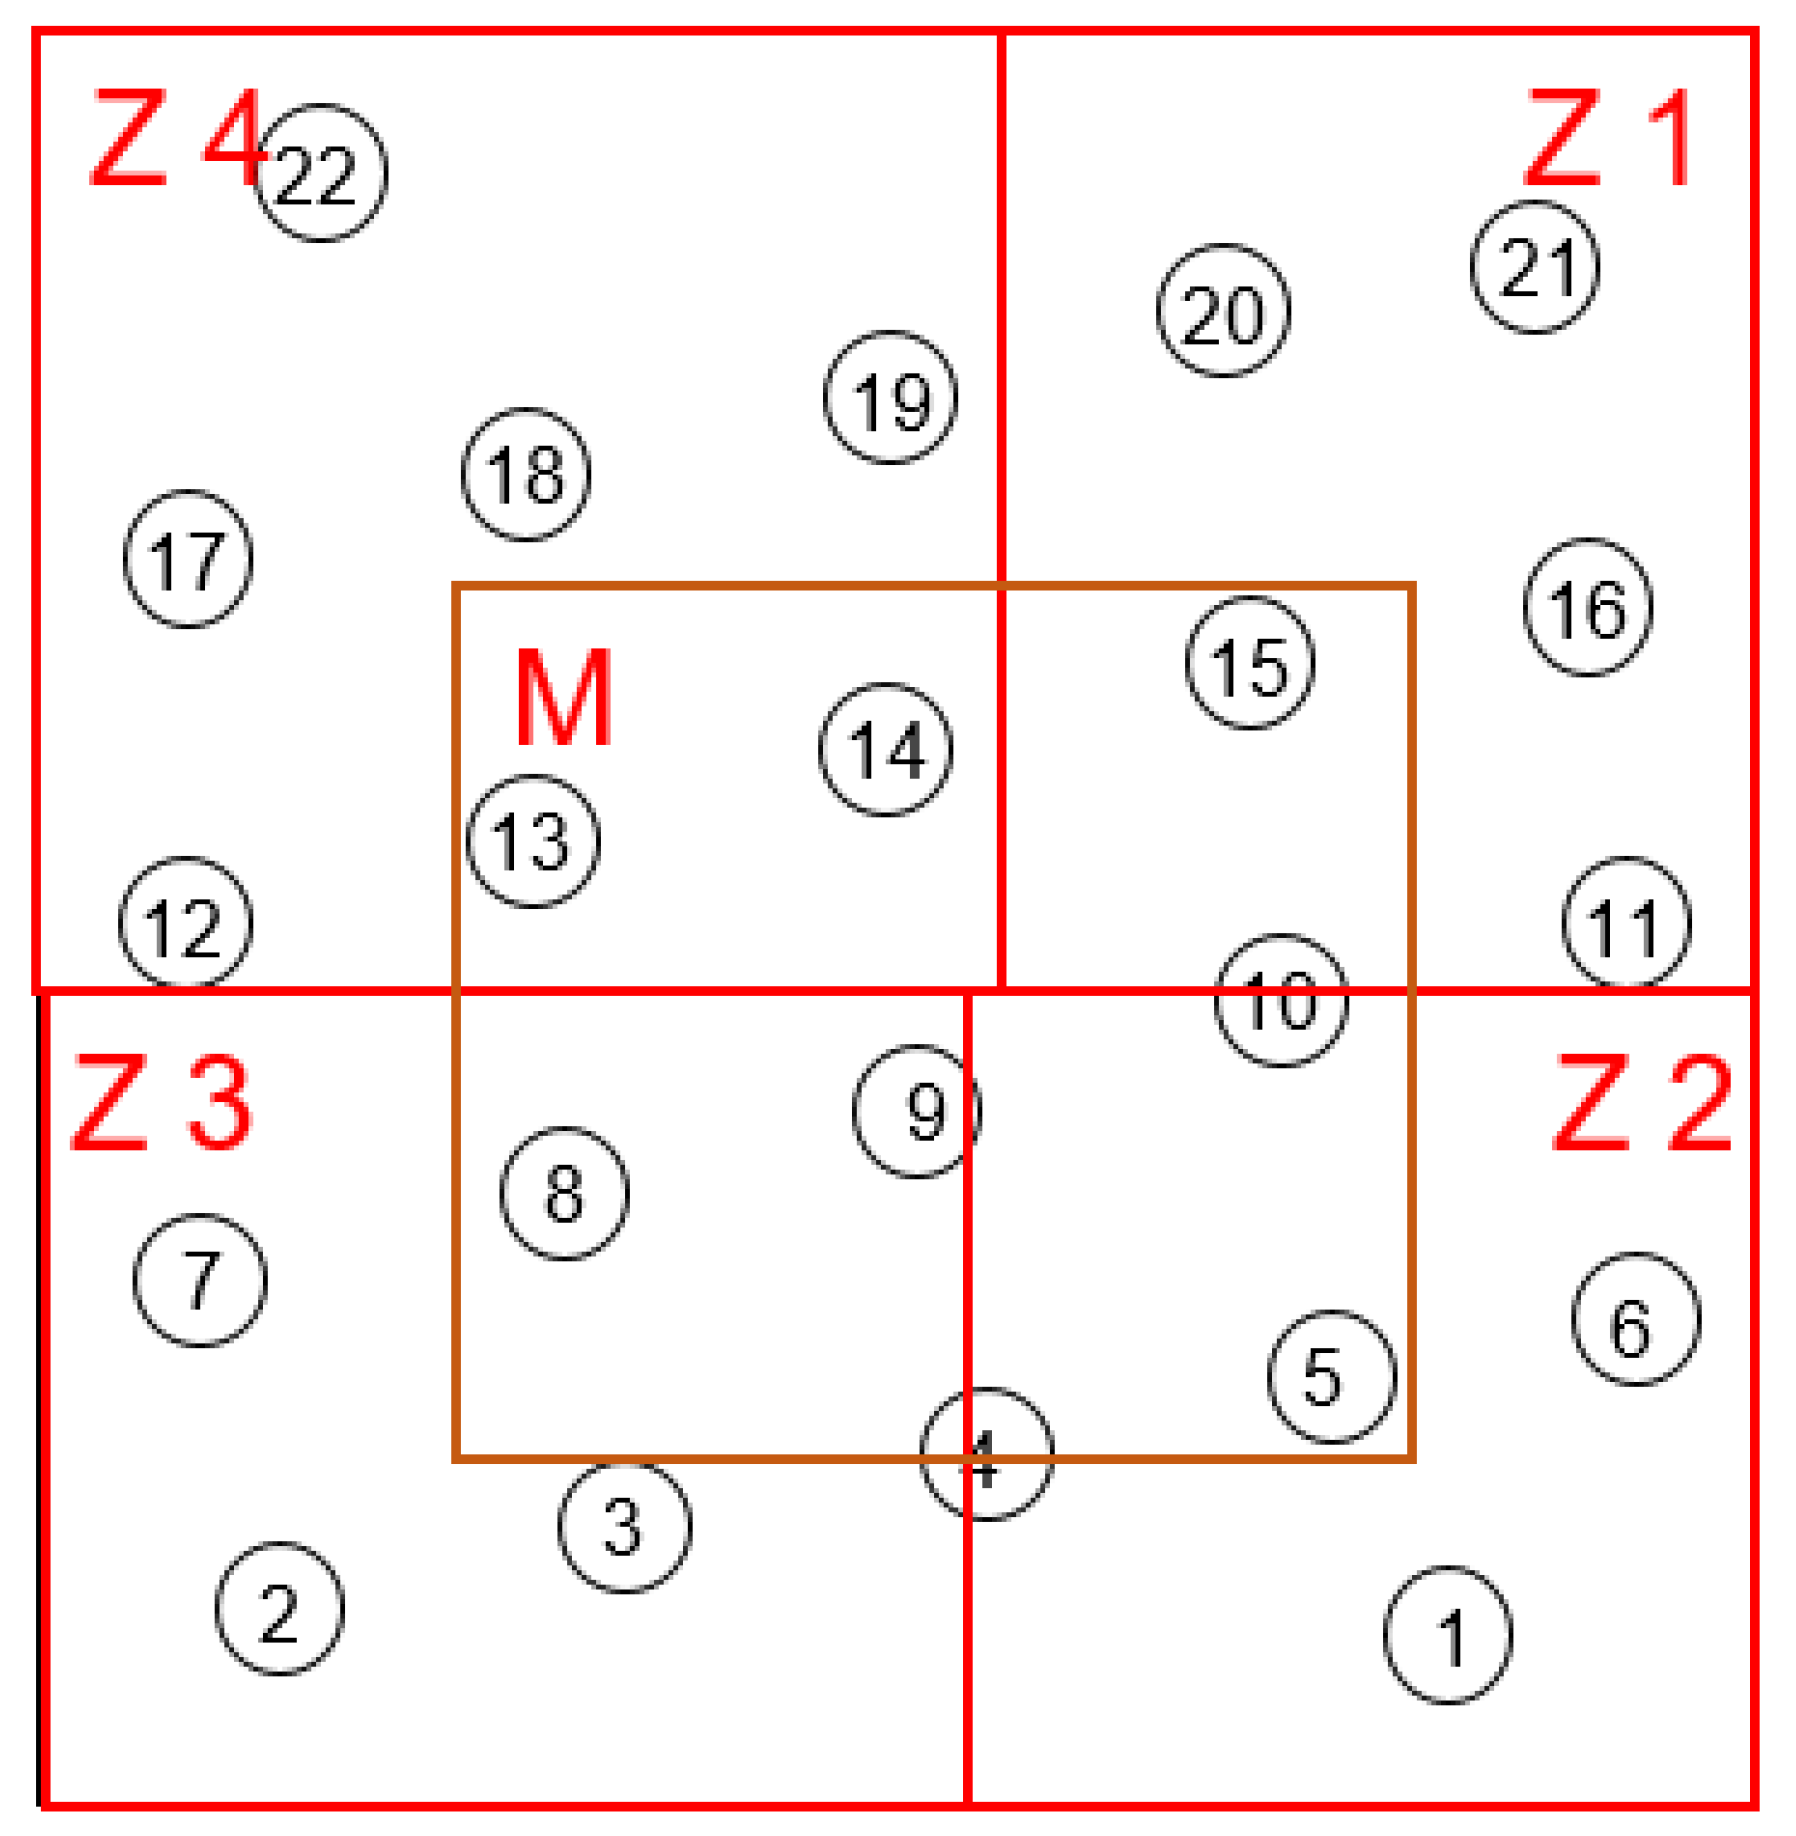
| Load Level | Stress in MPa | Sample No. | Zone |
|---|---|---|---|
| 1 | 450 | 1, 9, 18 | M, Z2, Z4 |
| 2 | 500 | 4, 7, 19 | M, Z3, Z4 |
| 3 | 550 | 13, 16, 22 | M, Z1, Z4 |
| 4 | 600 | 8, 10, 21 | M, M, Z1 |
| 5 | 650 | 2, 6, 15 | M, Z2, Z3 |
| 6 | 700 | 3, 5, 20 | M, Z1, Z3 |
| 7 | 750 | 11, 14, 17 | M, Z1, Z4 |
| 0 | 425 resp. 400 |
| Concentration Level | α-Ti: a in Å | α-Ti: c in Å | β -Ti: a in Å | α-Ti: V in Å3 | α-Ti: c/a Ratio | β -Ti: V in Å3 |
|---|---|---|---|---|---|---|
| L1 (0.00%) | 2.9921 | 4.6662 | 3.1667 | 34.51 | 1.5969 | 31.76 |
| L2 (0.01%) | 2.9925 | 4.6682 | 3.1770 | 34.53 | 1.5973 | 31.07 |
| L3 (0.05%) | 2.9237 | 4.6696 | 3.1761 | 34.57 | 1.5972 | 32.04 |
| L4 (0.10%) | 2.9222 | 4.6705 | 3.1774 | 34.54 | 1.5983 | 32.08 |
| L5 (0.20%) | 2.9226 | 4.6730 | 3.1800 | 34.57 | 1.5989 | 32.16 |
| Concentration Level | Yield Strength [MPa] | Tensile Strength [MPa] | Elongation [%] |
|---|---|---|---|
| L1 (0.00%) | 1135 | 1196 | 13.4 |
| L2 (0.01%) | 1150 | 1217 | 10.8 |
| L3 (0.05%) | 1187 | 1256 | 8.6 |
| L4 (0.10%) | 1214 | 1278 | 8.2 |
| L5 (0.20%) | 1290 | 1339 | 4.2 |
Disclaimer/Publisher’s Note: The statements, opinions and data contained in all publications are solely those of the individual author(s) and contributor(s) and not of MDPI and/or the editor(s). MDPI and/or the editor(s) disclaim responsibility for any injury to people or property resulting from any ideas, methods, instructions or products referred to in the content. |
© 2023 by the authors. Licensee MDPI, Basel, Switzerland. This article is an open access article distributed under the terms and conditions of the Creative Commons Attribution (CC BY) license (https://creativecommons.org/licenses/by/4.0/).
Share and Cite
Winkler, K.; Seidel, P.; Danzig, A.; Kroll, L.; Undisz, A. Influence of Carbon on Additively Manufactured Ti-6Al-4V. J. Manuf. Mater. Process. 2023, 7, 134. https://doi.org/10.3390/jmmp7040134
Winkler K, Seidel P, Danzig A, Kroll L, Undisz A. Influence of Carbon on Additively Manufactured Ti-6Al-4V. Journal of Manufacturing and Materials Processing. 2023; 7(4):134. https://doi.org/10.3390/jmmp7040134
Chicago/Turabian StyleWinkler, Kerstin, Paul Seidel, Andre Danzig, Lothar Kroll, and Andreas Undisz. 2023. "Influence of Carbon on Additively Manufactured Ti-6Al-4V" Journal of Manufacturing and Materials Processing 7, no. 4: 134. https://doi.org/10.3390/jmmp7040134