Article

Impact of Gas Metal Arc Welding Parameters on Bead Geometry and Material Distortion of AISI 316L

1
Industrial Engineering Department, Faculty of Engineering, Jordan University of Science and Technology, P.O. Box 3030, Irbid 22110, Jordan
2
Aeronautical Engineering Department, Faculty of Engineering, Jordan University of Science and Technology, Jordan-Irbid, P.O. Box 3030, Irbid 22110, Jordan
*
Author to whom correspondence should be addressed.
J. Manuf. Mater. Process. 2023, 7(4), 123; https://doi.org/10.3390/jmmp7040123
Submission received: 13 May 2023 / Revised: 22 June 2023 / Accepted: 27 June 2023 / Published: 29 June 2023

Abstract

:
This study investigates the impact of gas metal arc welding (GMAW) parameters on the bead geometry and material distortion of AISI 316L. Three parameters—arc current in ampere (A), filler feed rate (m/min), and gas composition—were modified at varying levels in order to examine their effects. This study sheds new light on MAG welding lines’ physical properties and behavior and highlights the influence of quaternary shielding gas compositions. Taguchi analysis, which includes signal-to-noise (S/N) ratio and analysis of variance (ANOVA), was utilized to analyze and optimize the welding parameters. This study found that arc current significantly impacts bead geometry, while the shielding gas composition has the most significant effect on angular distortion and transverse shrinkage. The optimal welding parameters for achieving the best bead height and width are 160 A, 3.5 m/min, G1, with a bead height of 4.89 mm, and 120 A, 3 m/min, G2, with a bead width of 6.69 mm. Moreover, the optimal welding parameters for minimizing both angular distortion and transverse shrinkage are 120 A, 4 m/min, G2, resulting in an angular distortion value of 0.0042° and a transverse shrinkage value of 0.0254 mm. This research has practical implications for improving welding performance and can contribute to the advancement of MAG and MIG welding in manufacturing applications.

1. Introduction

MAG welding is a type of gas metal arc welding (GMAW) that uses shielding gas and an electrode wire to create a strong weld joint for thick plate materials. It is versatile and can be used to weld various metals in the construction, aerospace, automotive, and maintenance equipment industries. MAG welding is also useful for welding thin materials that require precise control, and it can be easily automated for large-scale manufacturing operations. Overall, MAG welding is a reliable and popular choice for both professionals and hobbyists [1,2,3]. In addition, the welding productivity and region quality can be enhanced by shielding gas mixtures of inert and active gases [4,5].
AISI 316L stainless steel is widely used in industrial equipment such as heat exchangers, reactors, and medical devices because of its excellent mechanical properties, weldability, and resistance to corrosion and oxidation. Consequently, extensive research and experimentation have been conducted on AISI 316L [6,7,8,9]. In their study, Ghosh et al. [10] identified the most effective MIG welding parameters by determining the optimal gas flow rate, current, and nozzle-to-plate distance. They found that a current of 100 A, a gas flow rate of 20 L/min, and a nozzle-to-plate distance of 15 mm produced the best results. These findings can help to improve the quality and efficiency of MIG welding processes. Ghosh et al. [11] also investigated the influence of heat input on the welding AISI 316L steel microstructure, microhardness, bead geometry, and heat-affected zone (HAZ). The effect of the welding current, gas flow rate, and nozzle distance on the ultimate tensile strength and yield strength of AISI 409 to AISI 316L was investigated. Ekaputra et al. [12] investigated the effects of welding speed on AISI 316L mechanical properties, specifically its microhardness and tensile strength. They determined that the optimal welding speed for the application of AISI 316L stainless steel was 175 mm/min. Demarque et al. [13] studied the impact of varying heat inputs on bead geometry, grain size, and microhardness during GMAW, as it related to the HAZ carbon. They found that the heat input increases, which leads to an expansion in the dimensions of the fusion area, an increase in the volumetric fraction of δ-ferrite, and larger grain size of austenite in the heat-affected zone (HAZ).
The angular distortion, transverse shrinkage, bead geometry, and mechanical properties are controlled by correctly selecting the MIG welding parameters for each product. Furthermore, the process requires efforts from the welder technician and the engineer to determine the appropriate MIG parameter sets before starting in order to guarantee the product quality and the expected results. Thus, choosing the appropriate parameters is the first step in ensuring the process’s success, ensuring the required product specifications to obtain the best physical properties of bead geometry and minor distortion [14,15]. The angular deformation in MIG and MAG welding is influenced by various factors, including the heat input, welding speed, technique, joint design, material properties, and fixturing. Higher heat input and faster welding speeds tend to increase distortion. Proper welding techniques, balanced welding sequences, and suitable joint designs help to reduce distortion. Material properties such as thermal expansion coefficients affect the distortion levels. Adequate fixturing and clamping are crucial for controlling movement and cooling. Considering these factors helps to minimize the angular distortion in MIG welding [16,17,18].
Bead geometry is an important physical property that affects the welding joint performance and stress distribution in real-world conditions [19]. Several studies emphasize the importance of improving bead geometry for structural analysis [20]. The bead geometry includes the width, height, and penetration depth, as shown in Figure 1. Many welding parameters affect the bead geometry, such as the shielding gas, welding current, voltage, and welding speed [21,22]. The convexity index (H/W) of a weld is significantly influenced by thermal input and feeding speed. The H/W is employed as a metric to assess the level of convexity or curvature in a weld bead. It is obtained by dividing the object’s height (H) by its width (W). This index provides the units of measurement and serves the purpose of describing the weld’s shape or curvature. When the input and feeding speed increases, the level of curvature decreases. Furthermore, it is noteworthy that the toe angle of the weld deposit rises as the bead height increases, but it declines with an increase in bead width, as reported by Adak et al. [21]. Moreover, the width of the weld will decrease with an increase in current, but the penetration depth will increase [16]. The width and the penetration of welded beads depend on the polarity used during welding. When direct current electrode positive (DCEP) polarity is used, the thermal energy is concentrated at the anode, leading to higher values for width and penetration depth. Conversely, direct current electrode negative (DCEN) polarity has lower thermal energy at the anode, resulting in narrower beads and shallower penetration. This is according to research by Singh et al. [23]. Therefore, selecting the appropriate polarity is essential in achieving the desired welded bead parameters. The influence of GMAW parameters, including voltage, current, and welding speed, on the geometry of stainless steel 316 beads was investigated by Saha et al. [24] (width, height, and penetration). Arya et al. [25] also investigated the effect of welding parameters such as the nozzle-to-plate distance and the plate thickness on bead geometry. Narang et al. [26] studied a welding joint carried on stainless steel 409L to explore the most influential MIG welding parameter impacting bead geometry and its effects on the mechanical properties. Taguchi analysis was used by Esme et al. [27] to optimize the bead geometry (width, height, and penetration) of welded joints.
Distortion can occur during welding when the workpiece is exposed to uneven heating and cooling. This causes the workpiece to contract and expand, resulting in a difference between the workpiece’s initial and final dimensions. To prevent distortion, it is essential to distribute the heat uniformly throughout the workpiece during welding [28]. The dimensional changes caused by distortion can fail the workpiece. Therefore, it is essential to minimize distortion during welding as much as possible. This can be achieved by selecting appropriate welding parameters, which significantly affect the degree of distortion [23]. Distortions may take several forms, including bending, transverse shrinkage, angular distortion, rotational distortion [29], and buckling distortion [30]. Figure 2A,B shows two common distortions [31]. The welding current is the most influential parameter impacting angular distortion, according to a study by Aggarwal et al. [32], who also studied the effects of welding speed and torch angle. The effect of the bead geometry on angular distortion during TIG welding was studied by Rong et al. [33]. Pandit et al. [34] demonstrated that increasing the input heat (current) also increased the angular distortion. Furthermore, the distortion is further influenced by the depth of the welding, the variety of the materials being welded, and the thickness of the plate [35].
MIG welding uses Ar and He as inert gases, which may be used individually or as a composition, as well as in MAG welding, which uses active gases such as CO2 and O2 [36]. The shielding gas rate and the gas composition affect the welding joints and materials differently. It is important to carefully select the proper gas and metal for each welding process [37,38]. Kah and Mvola [38] have provided guideline tables illustrating the characteristics of gases and materials to facilitate the selection of gases (the shielding gas standard EN ISO 14175) [39]. Another critical aspect is utilizing the regulator valve to keep the gas pressure and gas flow steady during the welding process (between 0.021 and 0.05 MPa and 14 and 18 L/min, respectively) [40]. Thus, the automatic gas flow was used to reduce gas consumption and improve the welding process [41]. Furthermore, choke flow was used by Kim et al. [42] to maintain the flow rate and minimize fluctuations, whereas the gas flow rate was high to avoid the obstacles that had accumulated in the gun nozzle.
The Taguchi design method is widely used in industrial applications because it reduces variance and improves the process requirements by employing an orthogonal array (L9). Hence, it allows the process parameters to be accurately evaluated by applying the lowest number of experiments [43]. The L9 array was used to organize the samples as part of the work setup. ANOVA was also used to determine the contribution percentage for each welding parameter [44]. Furthermore, the optimal welding parameters were achieved by the S/N ratio [45]. Taguchi analysis was utilized by Datta et al. [46] to determine the response and multi-response of arc welding. Trang et al. [47] applied the Taguchi method to enhance the bead geometry during gas tungsten arc welding (GTAW).
This study investigates the effect of MAG and MIG parameters on bead geometry (width and height) and distortion (angular and transverse shrinkage) of AISI 316L. At the same time, welding parameters such as arc current, filler feed rate, and gas mixture were adjusted at three levels. The Taguchi method (L9) was used to analyze and optimize the results, including ANOVA and S/N ratio. There has been no earlier investigation into the bead geometry and distortion during MAG welding using quaternary shielding gas compositions. Furthermore, this study provides a better understanding of the physical properties of welding lines, AISI 316L behavior, and the identification of welding parameters for professionals and engineers.

2. Materials and Methods

This study specifically focused on MAG welding, and the data were collected from the laboratories of the Jordan University of Science and Technology.

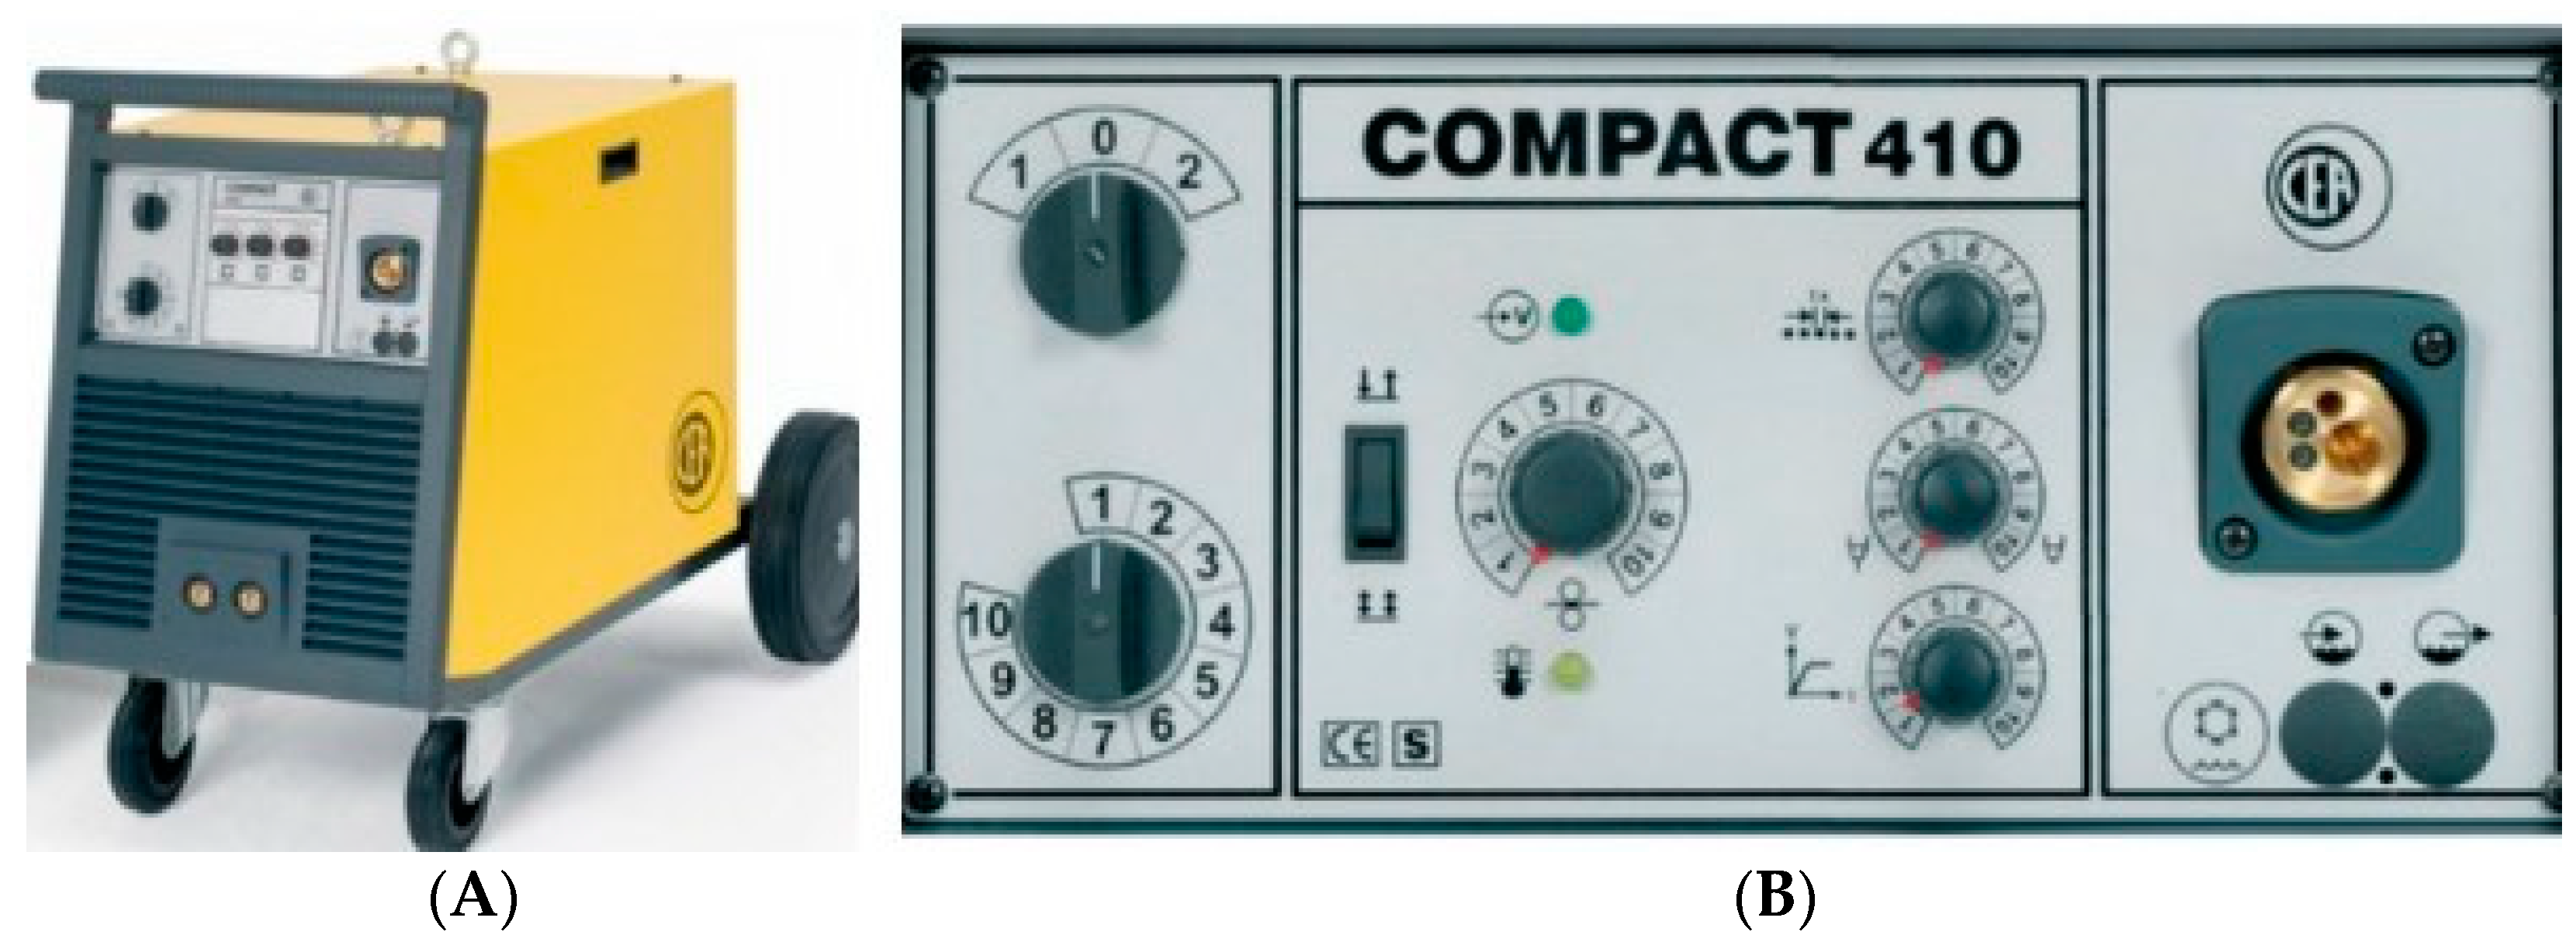
2.1. Welding Equipment

The CEA COMPACT 410 welding machine, which was utilized in this study, has the capacity to be adjusted to varying levels of current and filler feed rate. This feature enables the machine to be utilized for a wide range of welding tasks, with precision and high-quality results, including those on different types of materials, such as steel, stainless steel, and cast iron. For this, the first switch should be set to number one, indicating that each number on the second switch represents a value of 20 A. For instance, when using the second switch, number one corresponds to 20 A, number two corresponds to 40 A, and so on, until you reach number ten, which represents 200 A. As shown in Figure 3A,B.

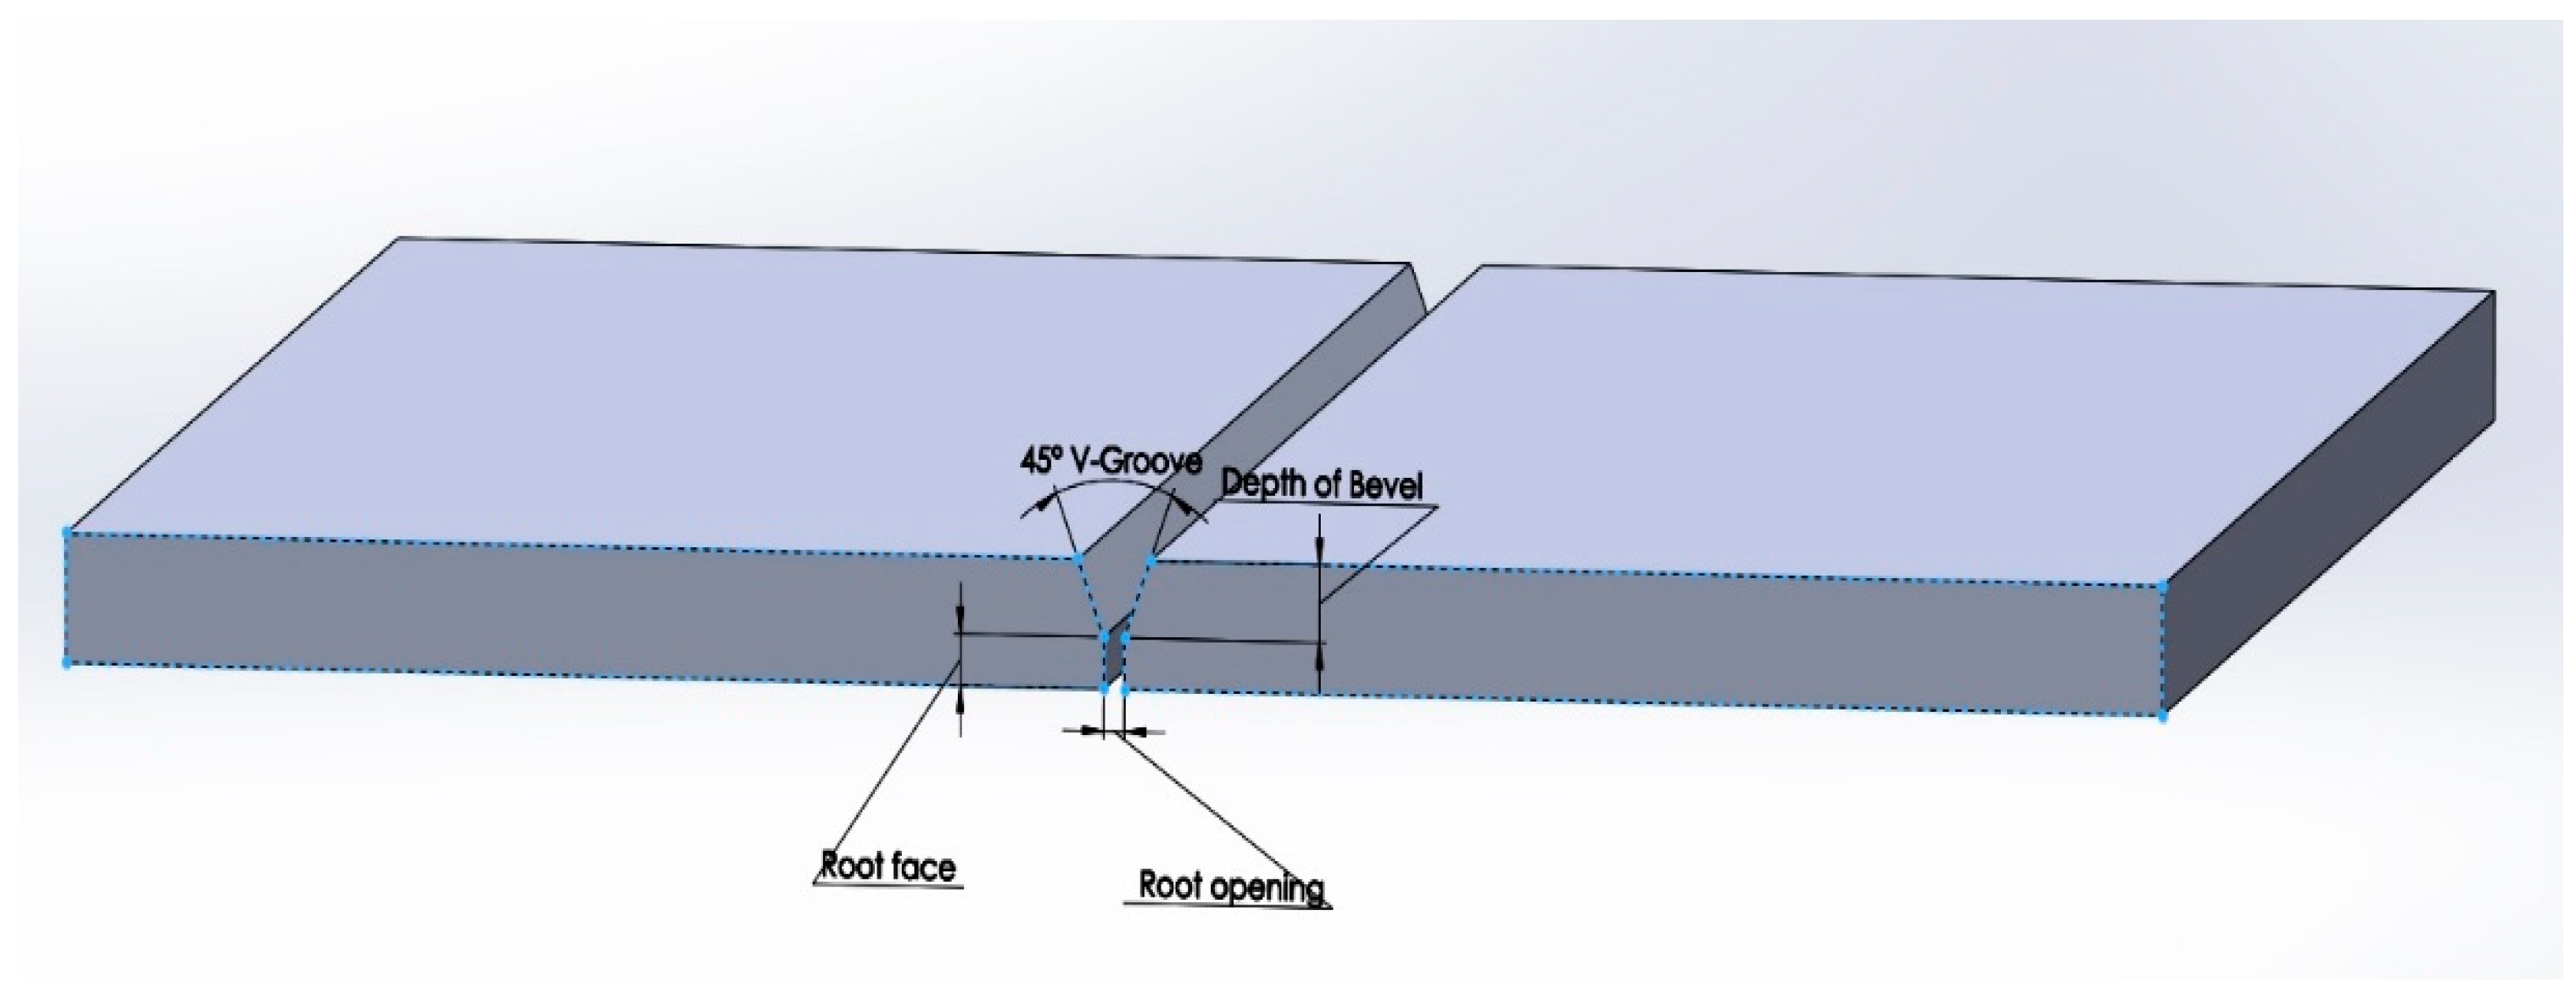
2.2. AISI 316L Workpiece (Substrate Preparation)

In this context, the workpiece utilized is composed of AISI 316L material and has a size of 100 × 100 × 5 mm. It also possesses a bevel angle, root face, and root opening of 45° V groove, 2 mm, 1 mm, respectively, as illustrated in Figure 4. Additionally, Table 1 outlines the chemical composition of the AISI 316L material. AISI 316L is a versatile stainless-steel alloy with excellent corrosion resistance. Its mechanical properties include a typical tensile strength of 560 MPa, yield strength of 290 MPa, elongation of 50%, hardness ranging from 79 HB onwards, and impact toughness of 103 J/cm2. The information on AISI 316L regarding its material properties was obtained from Mat Web [48].

2.3. Filler Material

The filler material applied is ER316L, which has a diameter of 1 mm. Table 2 provides information on the chemical composition of the ER316L filler material. ER316L filler wire is a frequently employed material in the welding process, specifically for connecting stainless steels. It provides commendable resistance against corrosion and exhibits notable tensile strength. The customary mechanical characteristics of ER316L filler wire consist of a tensile strength of 580 MPa, yield strength of 40 MPa, and an elongation in the range of 38%. The ER 316L standards were established by organizations such as the American Welding Society (AWS) and the International Organization for Standardization (ISO).

2.4. Mixing the Shielding Gases

In this research, a shielding gas mixture (Ar-He-O2-CO2) was used for welding. The mixture was divided into three groups (G1, G2, and G3), each with different volume percentages of the four gases, as shown in Table 3. The regulator valves installed in each cylinder gas port were utilized to control the quaternary gas compositions for welding purposes.

2.5. Taguchi Experiment Design

The Taguchi method was utilized to optimize the MAG welding parameters, and the experimental sample size required for this study was nine samples, as displayed in Table 4. This corresponds to the L9 orthogonal array design, which involved three parameters and three levels.

2.6. Visual Inspection

Visual inspection is a crucial non-destructive testing (NDT) technique used to assess the quality of welding. It is considered one of the primary methods for evaluating the quality and workability of welds, and it can identify most defects without the need for costly tests [50]. During the visual inspection, defects such as welding surface defects, base metal surface defects caused by welding, and base metal surface defects repaired by welding can be observed. Due to its importance, many studies have been conducted to develop artificial intelligence solutions that can automate the visual inspection process [51].

3. Results

3.1. Visual Inspection
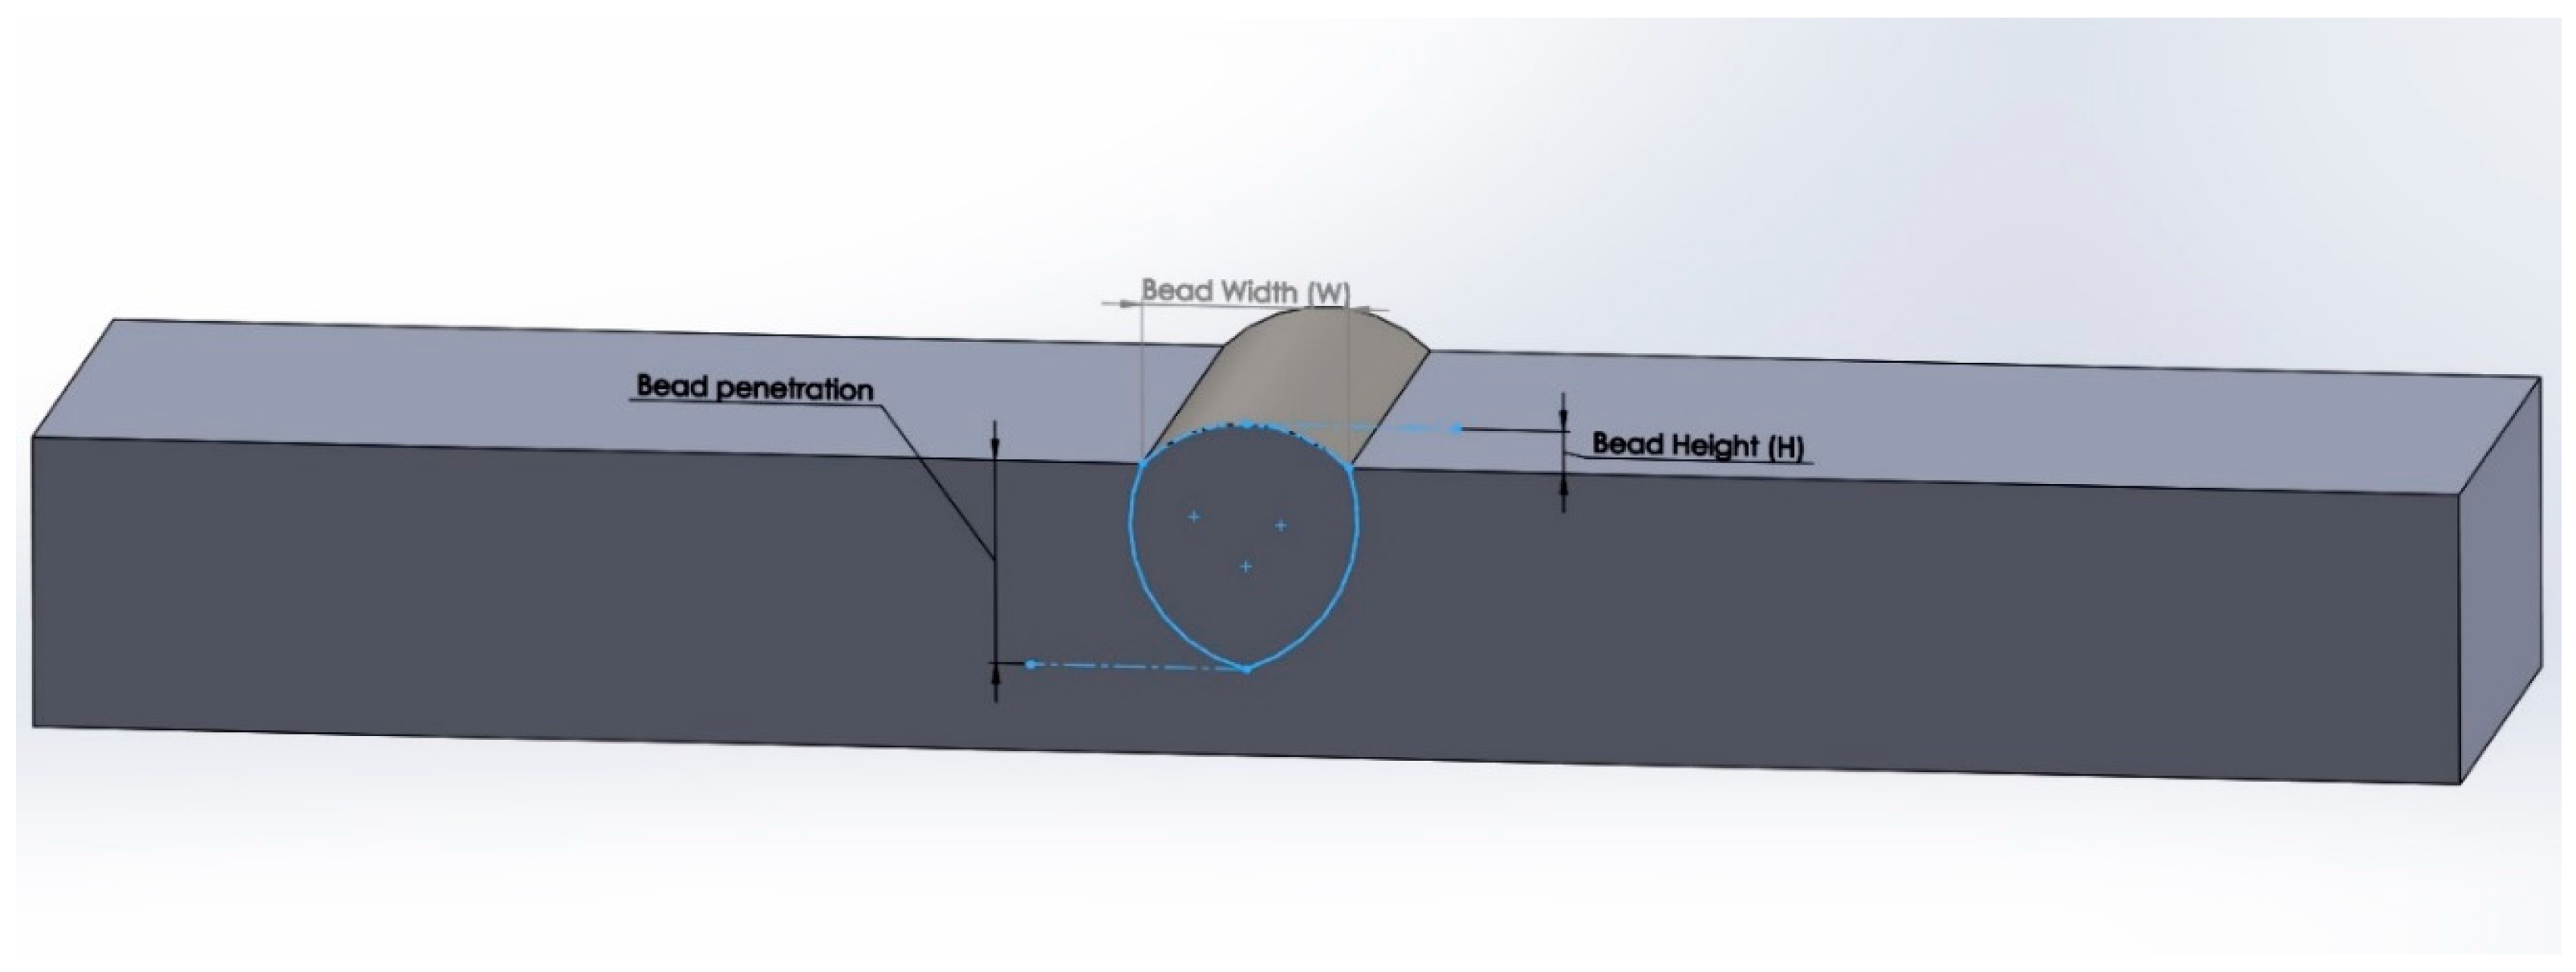
In this study, a direct visual inspection was conducted on all of the weld samples according to the requirements of EC-SRC-0002. Table 5 and Figure 5 indicate that no discontinuities or defects were found in the weld joints, except for the weld spatter around the joints in Samples 1, 2, 3, and 7. The defects that were examined in this research include the following: arc strike and other fabrication scars, burn through and melt through, crack or tear (transverse, longitudinal, and axial), porosity (pin holes), undercut, underfill, irregular bead profile, concave or convex fillet welds, weld reinforcement, weld spatter, slag, offset, overlap, roughness, incomplete fusions, and incomplete penetration.

3.2. Bead Geometry

When combining low thermal conductivity inert shielding gases with higher thermal conductivity active shielding gases, the resulting mixture can cause an increase in heat input, which requires careful monitoring and control. To control the heat input, the shielding gas mixture can be altered, measured amounts of active gases can be added to the mixture, or other welding parameters can be adjusted, such as increasing the arc current or decreasing the gap between the electrode and workpiece.
The graphs in Figure 6 and Figure 7 depict the bead width and the total height in millimeters, while comparing the excess height of the weld bead to the industry standard BS EN ISO 5817 for moderately severe and stringent severe applications.

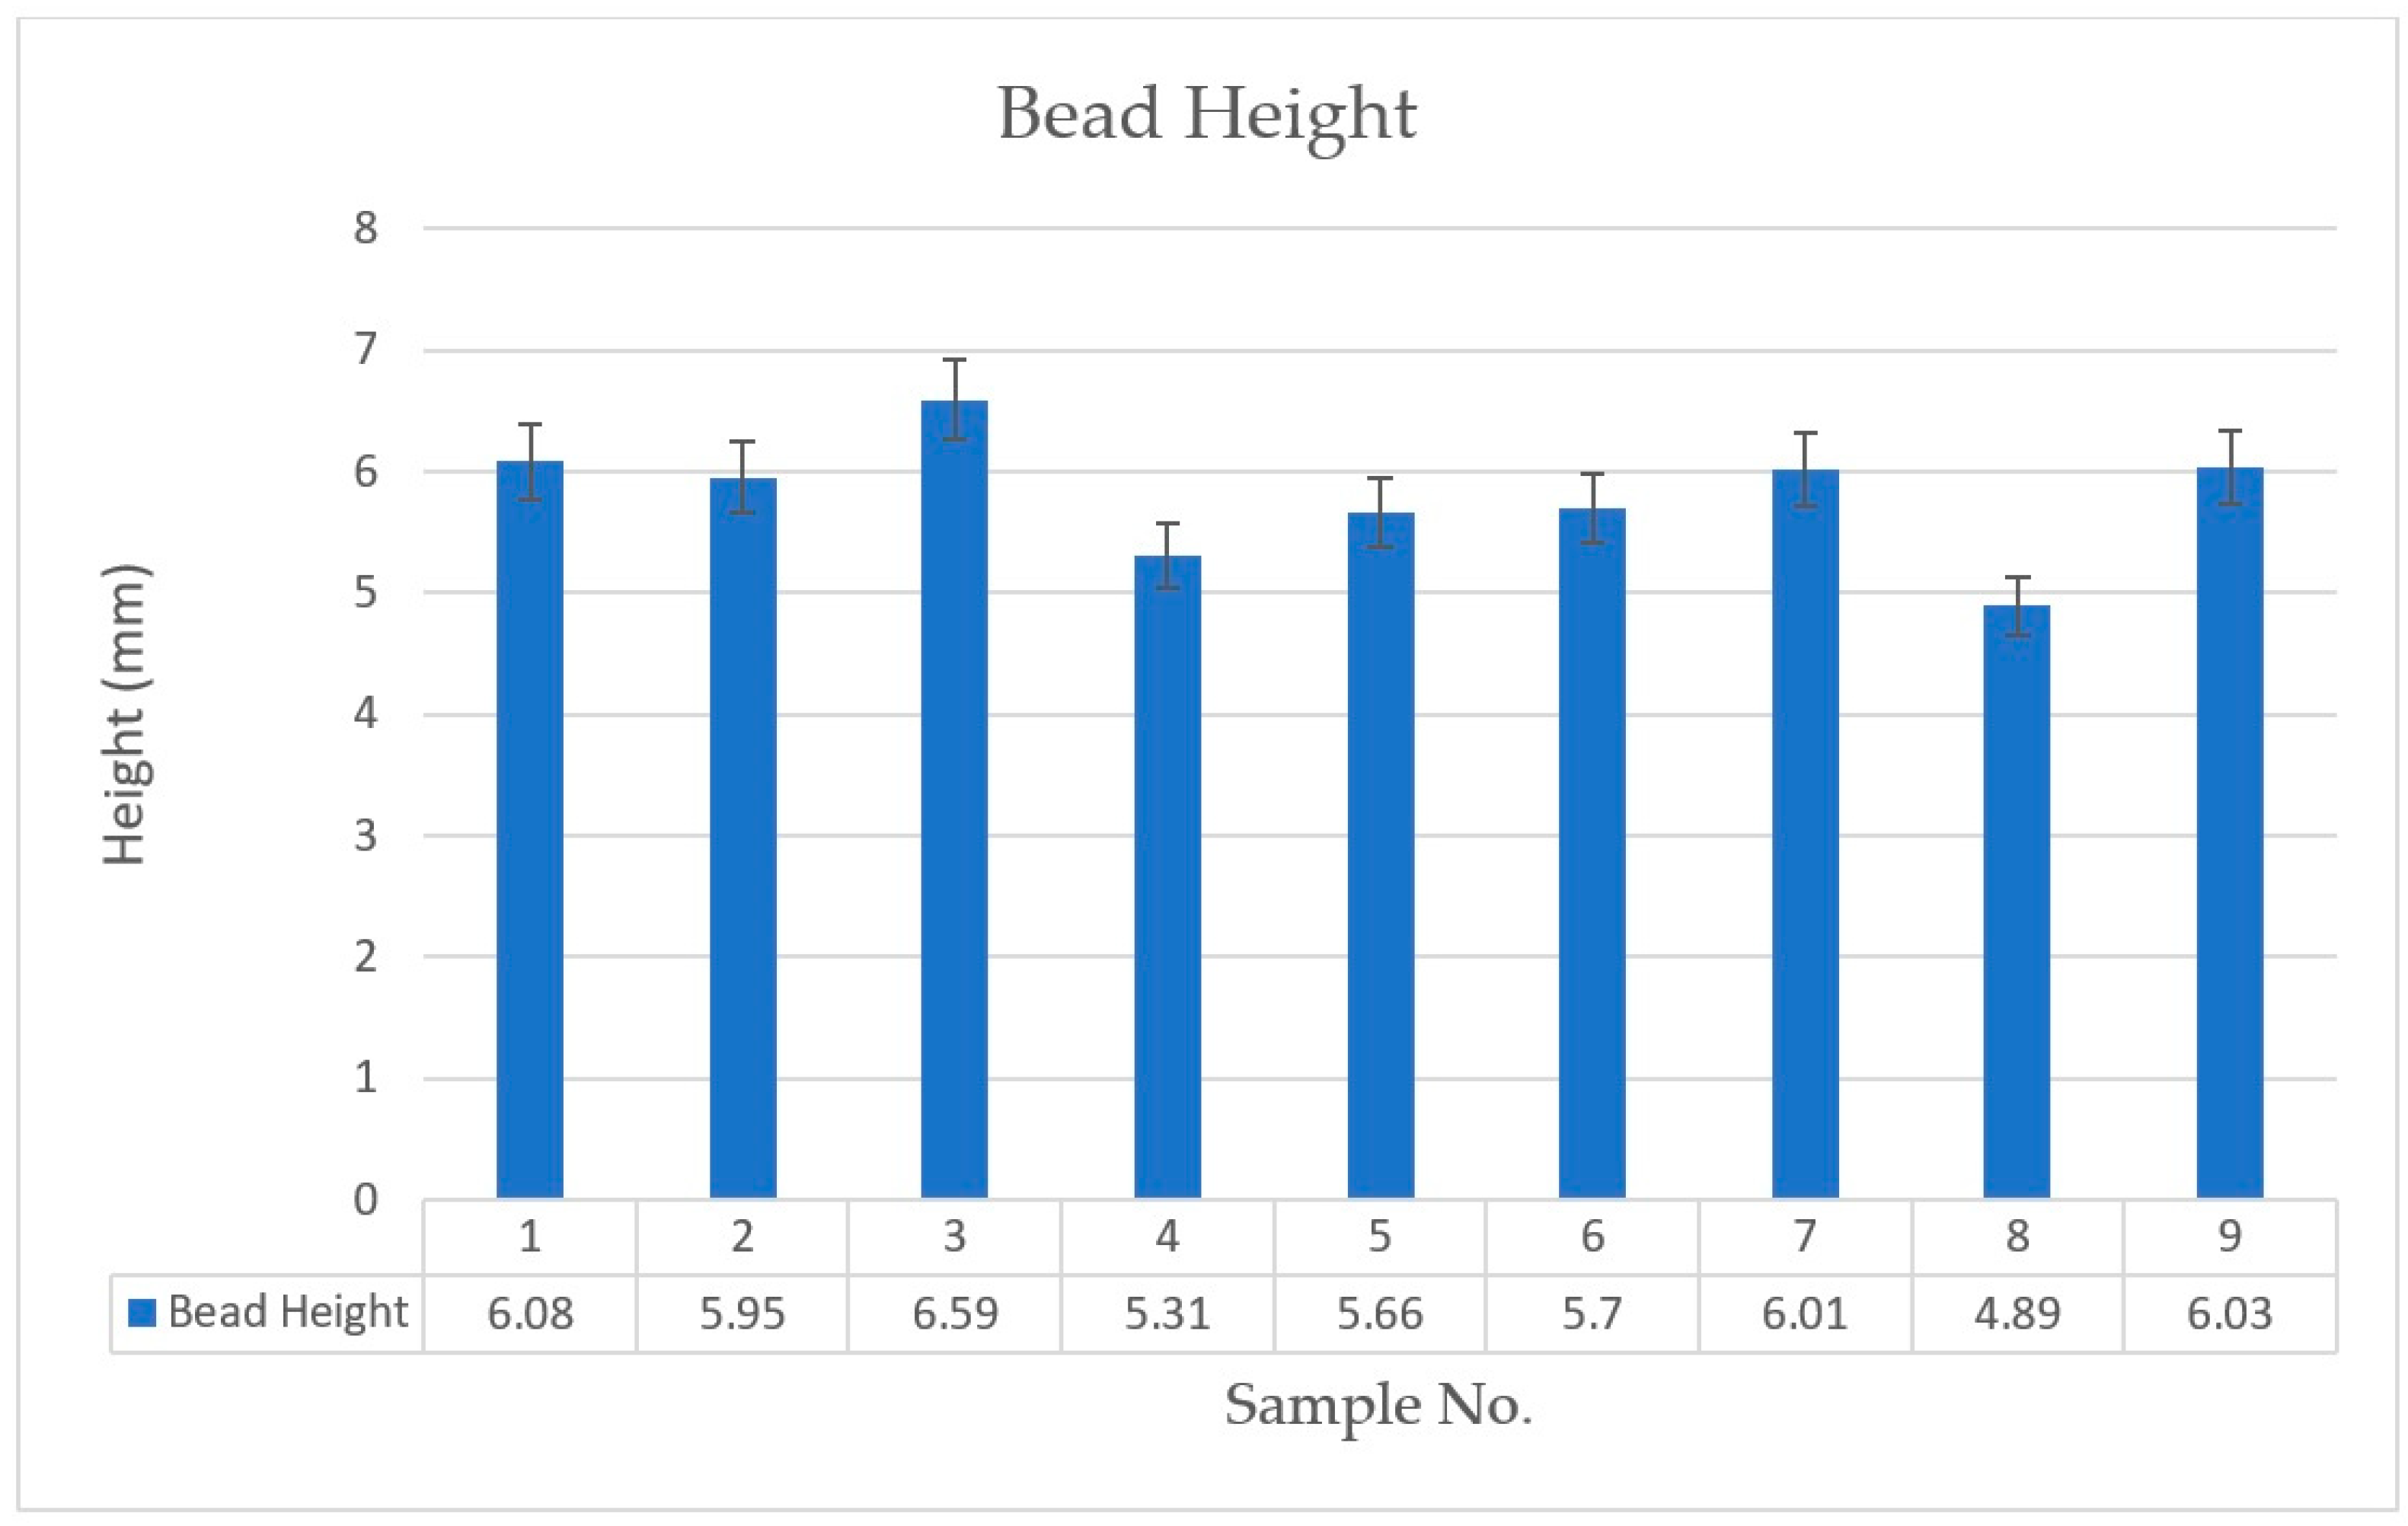
3.2.1. Average Bead Height

The height of the beads in the sample batch is uniform and closely matched. Sample No. 3 had the highest bead height of 6.59 mm, due to the welding parameters of the arc current, filler feed rate, and gas composition (120 A, 4 m/min, and G3, respectively). In contrast, Sample No. 8 had the lowest bead height of 4.89 mm, due to the welding parameters of the arc current, filler feed rate, and gas composition (200 A, 3.5 m/min, and G1, respectively). Changes in the wire filler feed (3 to 4 m/min) and the gas composition (G1, G2, and G3) affected Samples 1, 2, 3, 4, 5, and 6, as shown in Figure 6. Moreover, increasing the arc current from 120 to 180 A (heat input) led to a decrease in the bead height, as observed in both sets of samples, namely Samples No. 1–3 and 4–6.
According to research by Kim et al. [42] and Balaji et al. [8], increasing the amount of heat input (through the arc current) and changing the composition of the shielding gas can cause a decrease in bead height. This is because the arc current is a source of heat input, while the shielding gas regulates the heat input and creates a protective atmosphere around the weld. The shielding gas helps to prevent atmospheric contamination from reacting with the molten metal and causing defects in the weld. As a result, the shielding gas plays a significant role in determining the bead height. These findings are consistent with studies conducted by Chuaiphan and Srijaroenpramong [52] and Kuk et al. [53]. Therefore, it is important to analyze the bead height in order to determine the optimal welding parameters and to understand how these parameters affect the bead height.

3.2.2. Average Bead Width

The GMAW parameters of the arc current, filler feed rate, and gas composition for Sample No. 5 and Sample No. 7 are 160 A, 3.5 m/min, and G3; and 200 A, 3 m/min, and G3, respectively, and they have the highest bead width values of 10.24 mm and 10.15 mm, respectively. Sample No. 4 and Sample No. 1 (160 A, 3 m/min, G2; and 120 A, 3 m/min, G1) have the lowest bead width values of 6.69 mm and 7.52, respectively. Samples 1, 2, and 3 were modified by varying the filler feed rate (3, 3.5, and 4 m/min) and the gas composition (G1, G2, and G3), while maintaining the same current of 120 A. While increasing the filler feed rate can result in an increase in the amount of metal deposited and a wider bead, the effect may be relatively small. Furthermore, for Samples 5, 6, 7, 8, and 9, the results indicate that the bead width increased as the current parameter was increased to both 160 and 200 A. This finding is consistent with the previous research conducted by Saha et al. [24], which showed that the bead geometry becomes wider with an increase in heat input (current). Moreover, the shielding gas composition significantly affects the change in the bead width values, regardless of the other welding parameters [52].
In addition, the shielding gas can influence the heat transfer and fluid dynamics of the welding line. The composition of the shielding gas can affect the ionization potential, thermal conductivity, and reactivity of the plasma generated during welding, which, in turn, can influence the bead geometry [38]. Using an inert gas such as argon or helium can result in a narrower bead due to the higher thermal conductivity and lower reactivity of these gases. On the other hand, using a more reactive gas such as CO2 and O2 can result in a wider bead, due to the increased heat input and greater fluidity of the molten metal [24]. However, further analysis is needed in order to specifically understand the effect of these parameters on bead width. Finally, all of the samples exhibited excellent mechanical properties and were within the limit specified in the standard BS EN ISO 5817 [54], as shown in Figure 6 and Figure 7. As a result, all of the samples are acceptable.

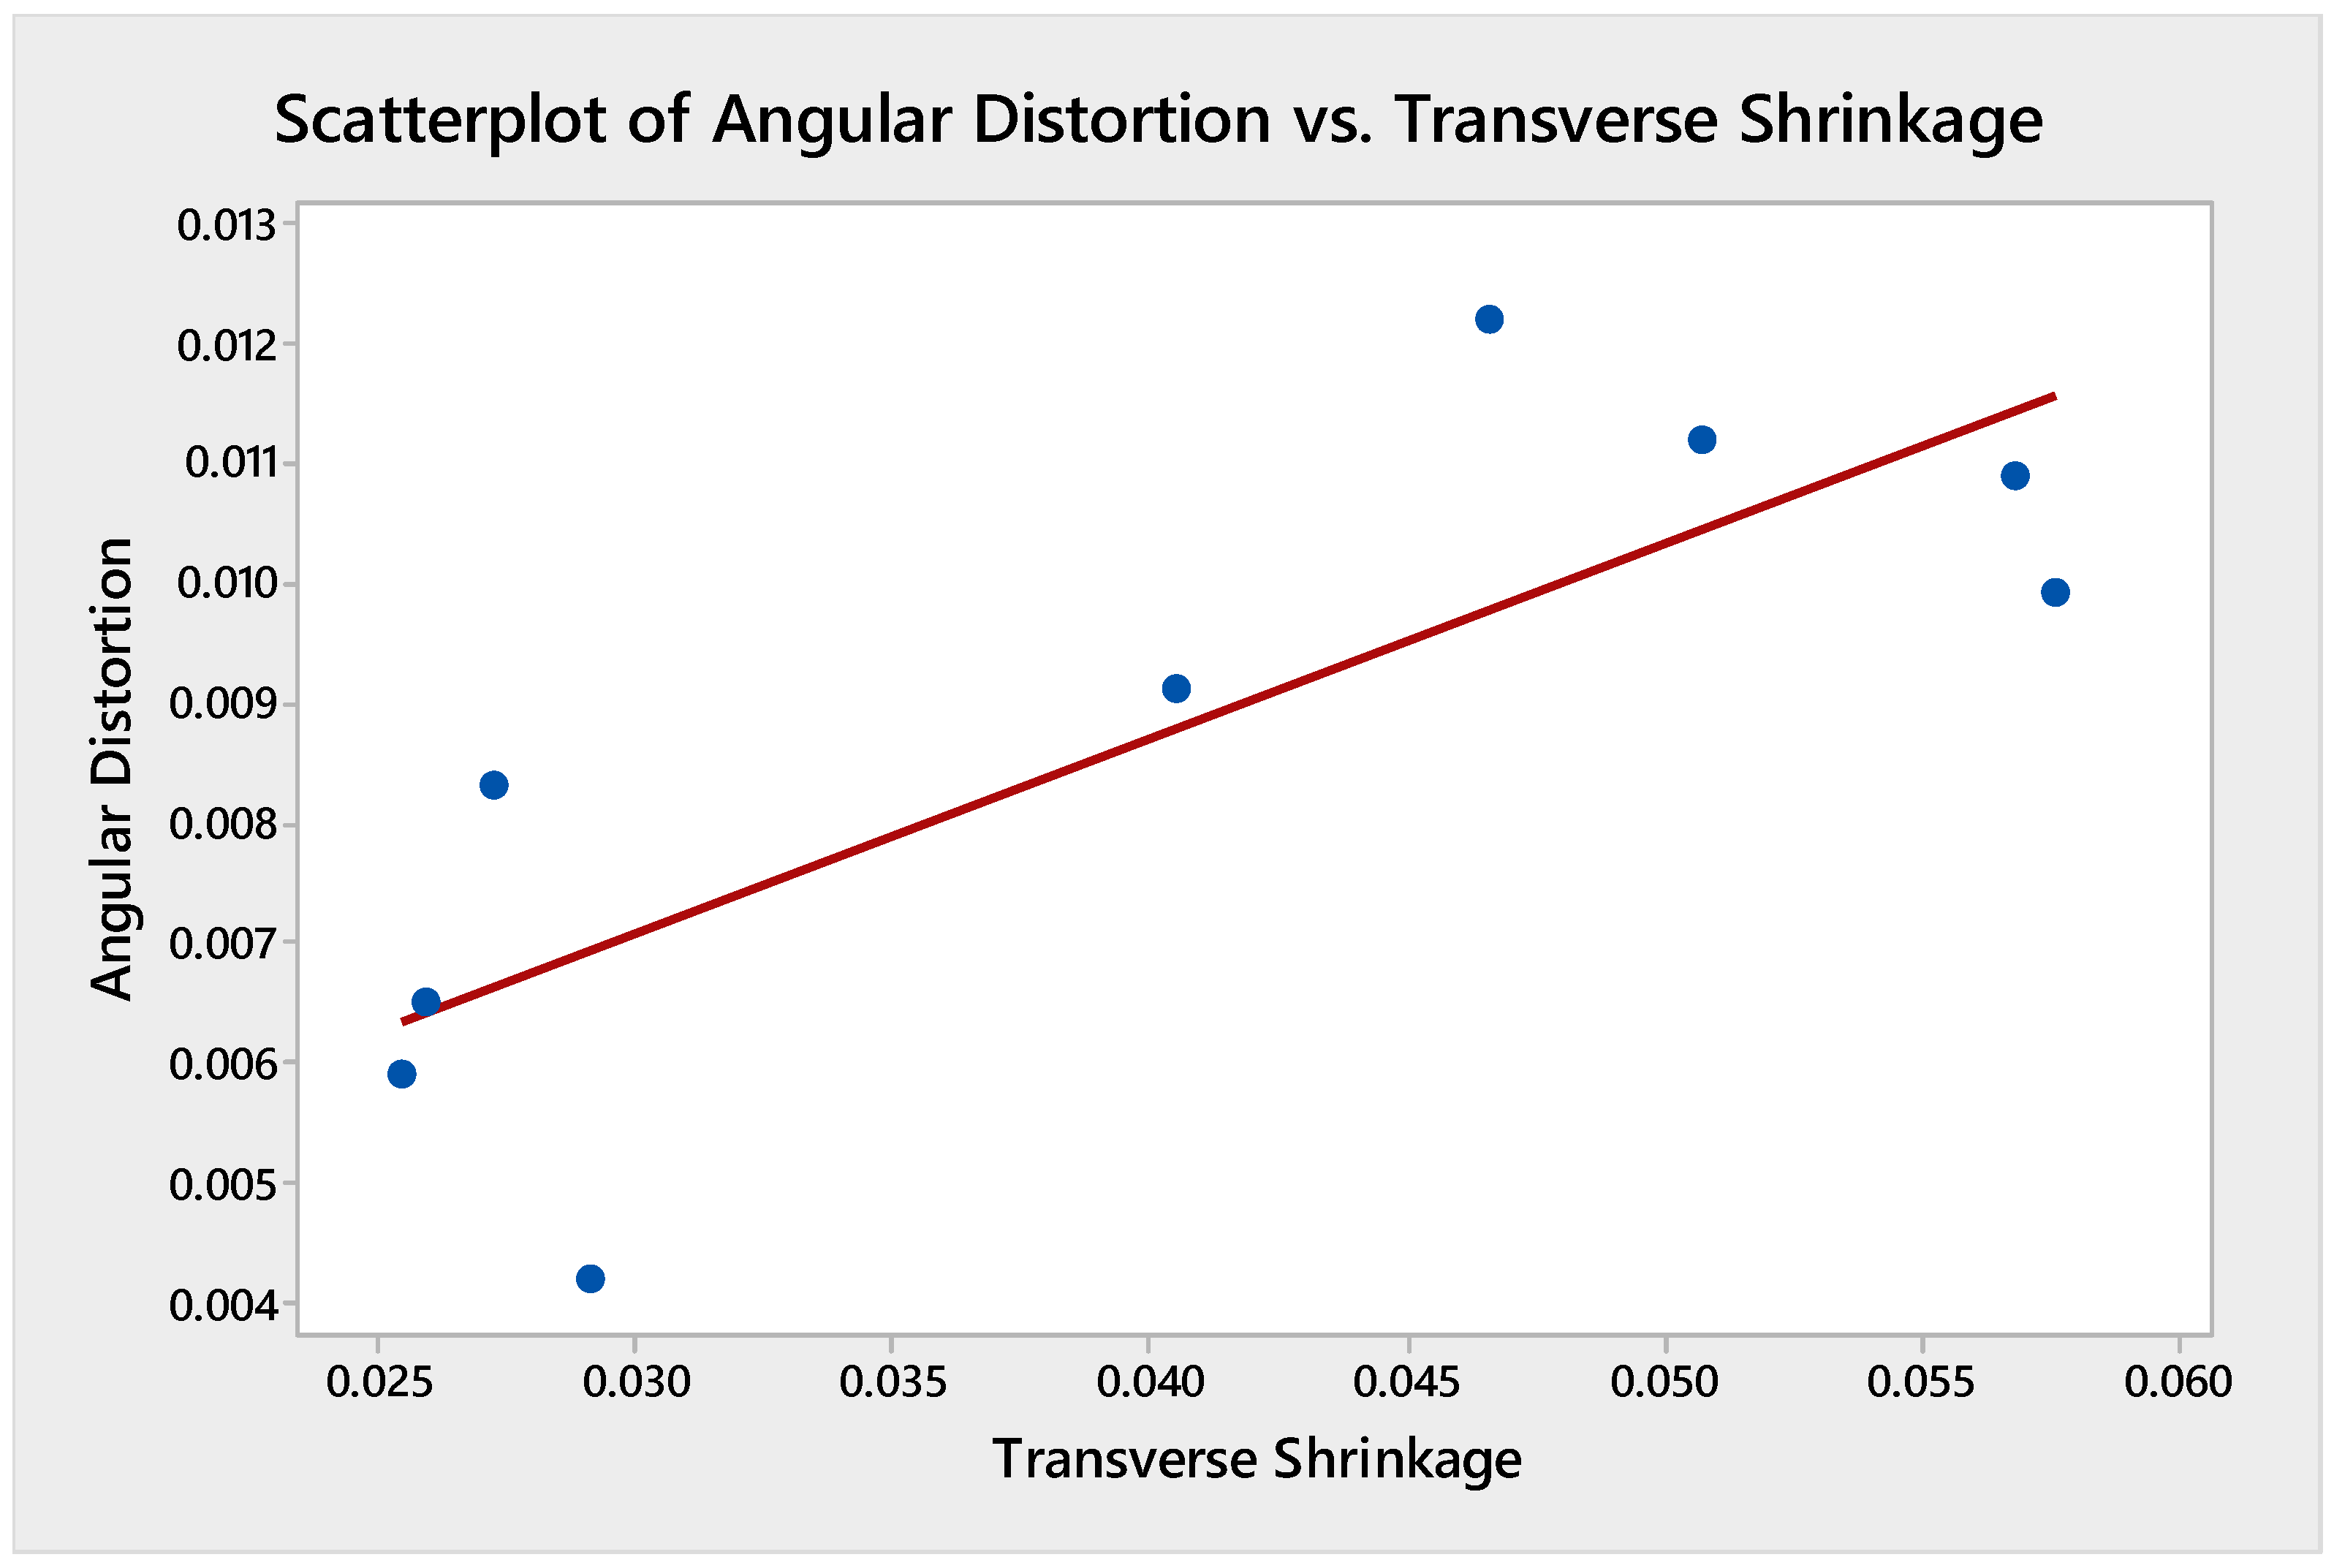
3.3. Angular Distortion and Transverse Shrinkage Results

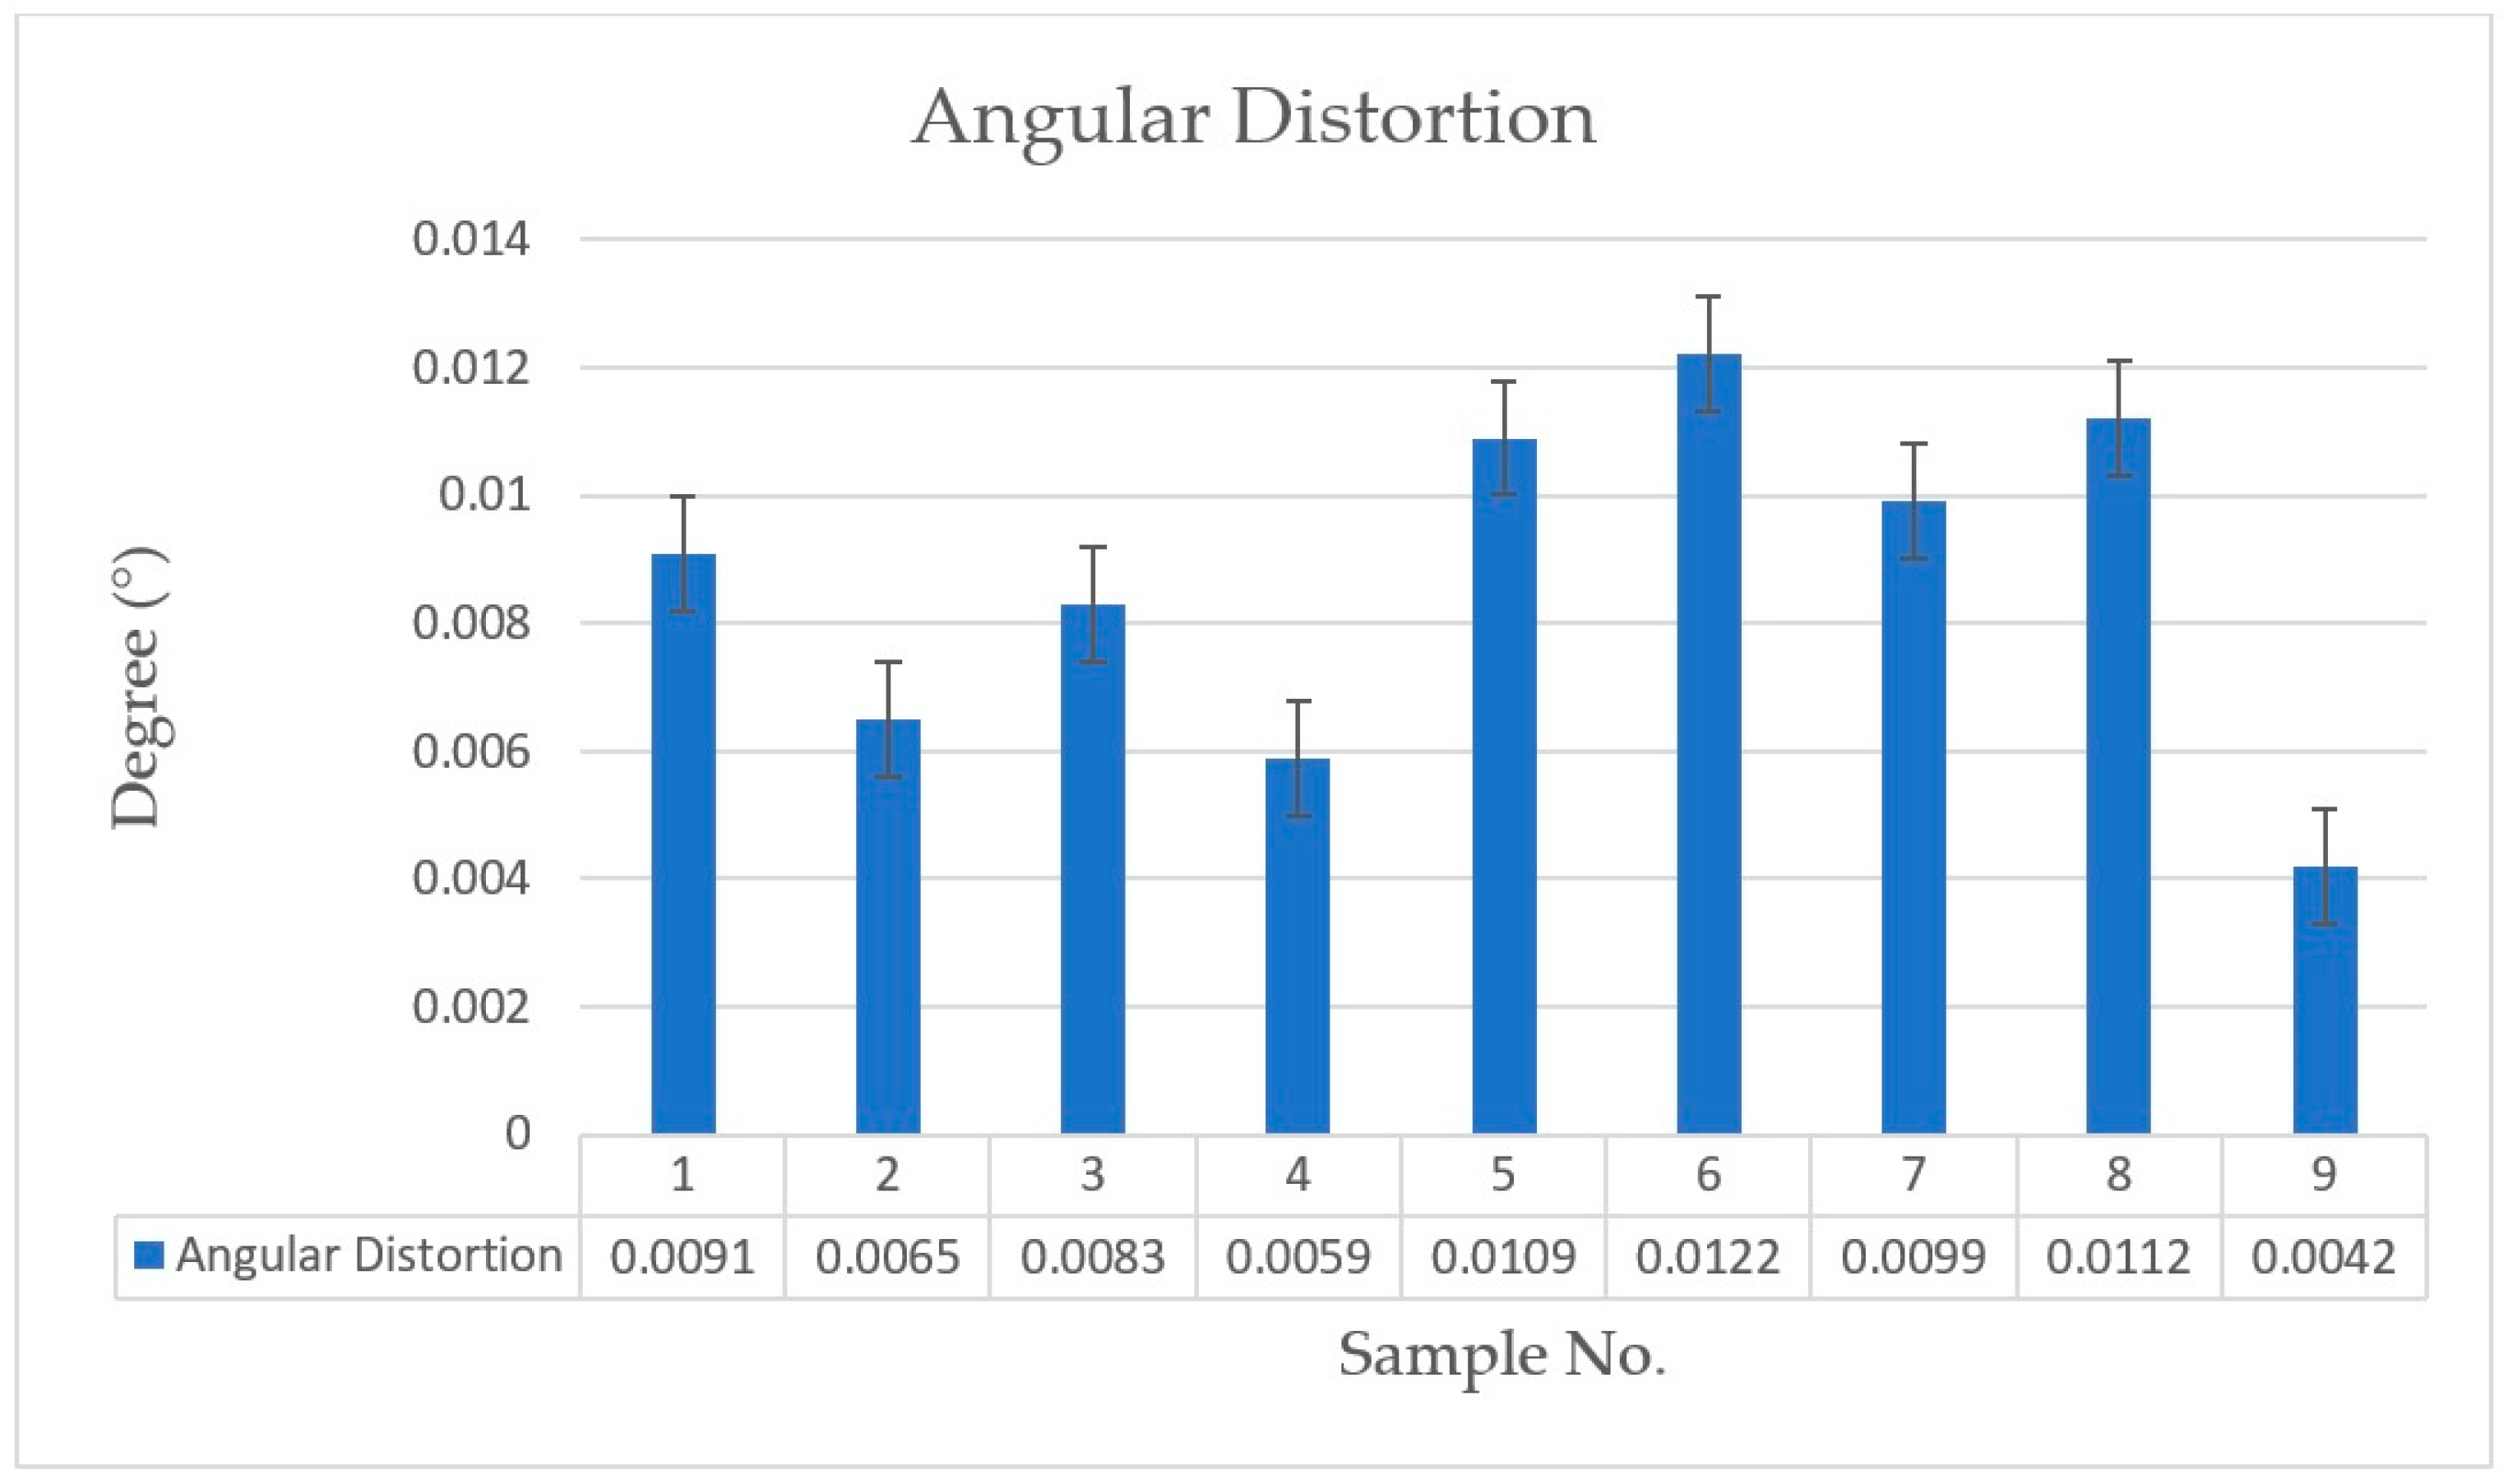
3.3.1. Angular Distortion

Angular distortion is a common issue in welding, as the heat and thermal stresses involved in the process can cause the welded components to deform or warp. The MAG parameters for Sample No. 9 included an arc current of 200 A, a filler feed rate of 4 m/min, and a gas composition of G2. This sample exhibited the least angular distortion of 0.0042 degrees (θ). In contrast, Sample No. 6 was welded with a current of 160 A, a filler feed rate of 4 m/min, and a gas of G1, and showed the highest angular distortion of 0.0122 degrees (θ).
As shown in Figure 8, Samples No. 1, 2, and 3 were affected by the gas composition (G1, G2, and G3) and the filler feed rate (3, 3.5, and 4 m/min) at the same arc current (120 A), and each gas composition produced a different angular value. Studies by Yan et al. [17] and Tian et al. [55] showed that increasing the heat input affects the angular distortion. After reaching a critical value, the angular distortion begins to decrease. In Samples 5 and 6, the arc current was increased to 160 A, while the gas compositions were G3 and G1. Samples No. 2, 4, and 9 had the lowest value of angular distortion, and they had the same gas composition of G2. Additionally, the shielding gas composition and arc current contribute to the total heat input and heat content. Thus, the effects of angular distortion vary depending on the rate at which the gas mixtures are mixed and the amount of arc current, as shown by the changing angular distortion in the three categories of samples, 1–3, 4–6, and 7–9.
The arc current and filler feed rate are directly related to the amount of heat input into the weld, which, in turn, affects the amount of distortion. Increasing the arc current and filler feed rate due to the higher amount of weld metal being deposited can lead to a higher heat input, which can cause more angular distortion. This is because the increased heat can cause the metal to expand and contract more, leading to greater angular distortion. Additionally, the proper selection of shielding gas can help to reduce residual stresses and angular distortion by ensuring proper fusion between the weld and the base metal. Furthermore, the shielding gas can also control the cooling rate of the weld, which can affect the amount of distortion. If the cooling rate is too fast, it can cause excessive shrinkage and lead to distortion and cracking, while, if it is too slow, it can cause excessive expansion and contraction, leading to warping and distortion. In conclusion, it is necessary to perform a statistical analysis using the Taguchi method in order to obtain the optimal parameters [56,57,58].

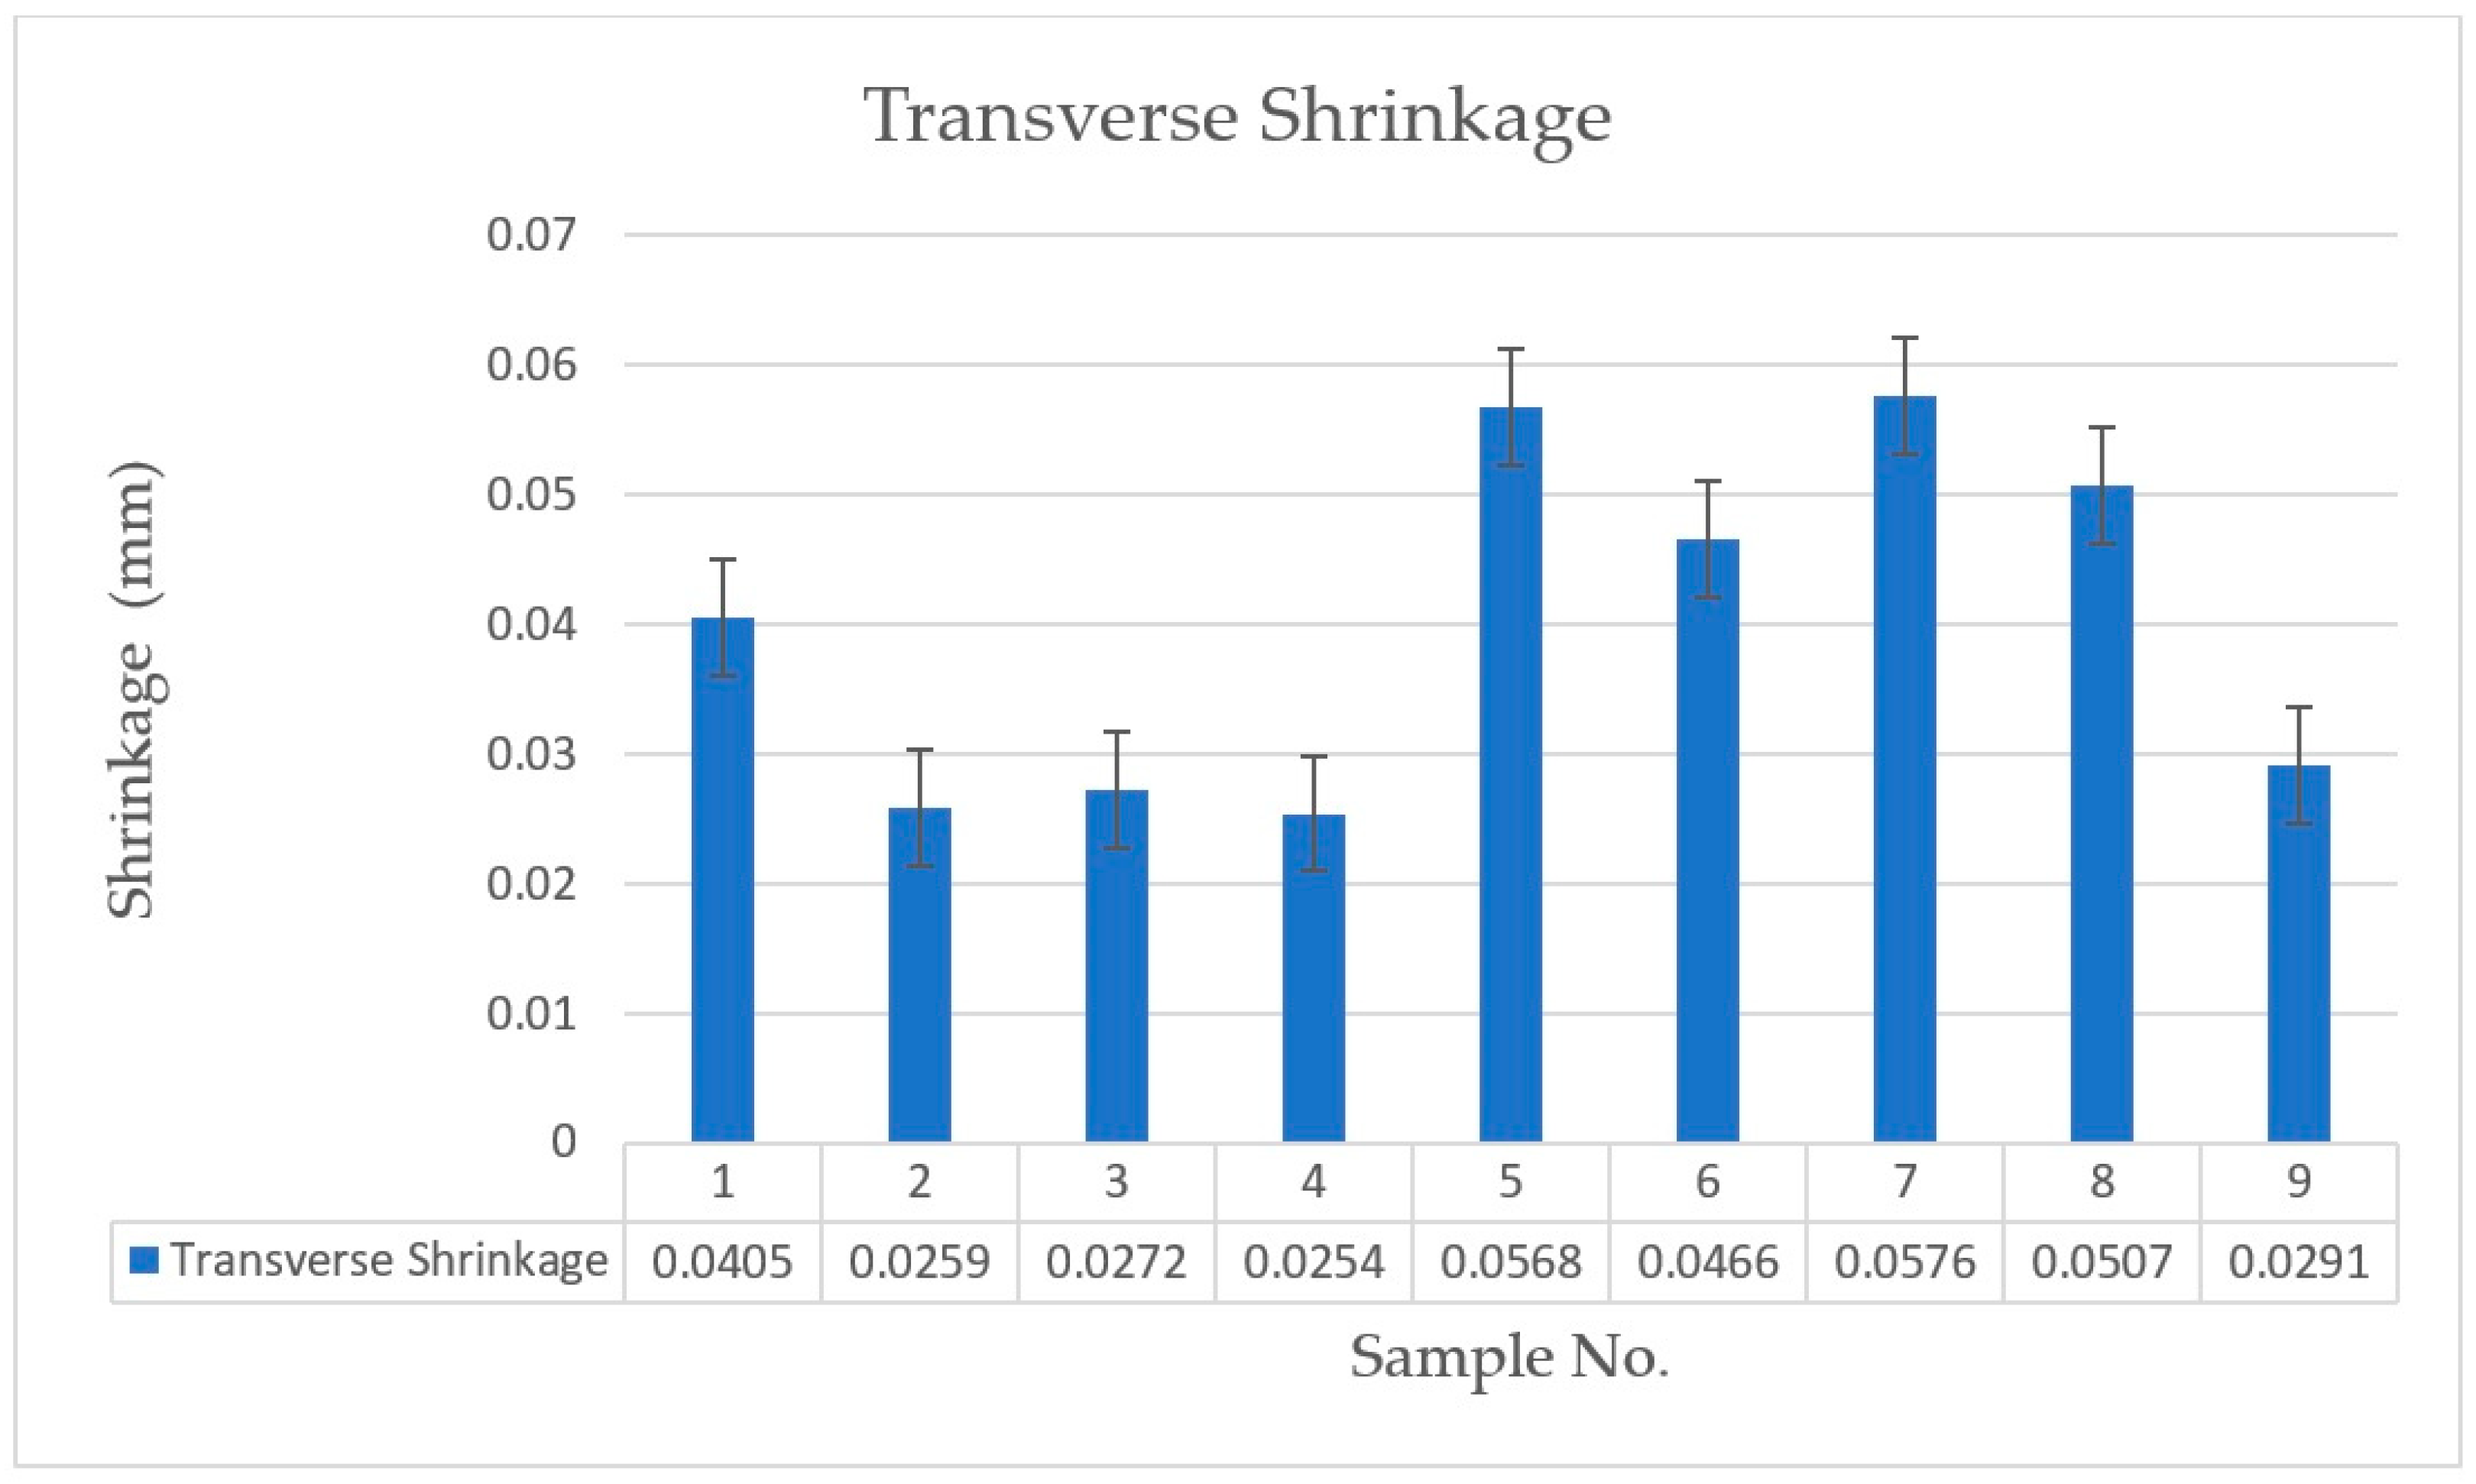
3.3.2. Transverse Shrinkage

The transverse shrinkage in welding is primarily caused by the thermal expansion and contraction of the base material and the weld metal as they are heated and cooled during the welding process.
The transverse shrinkage values of Samples No. 5 and 7 were found to be the highest among all of the samples, measuring 0.0268 mm and 0.0276 mm, respectively. These values were obtained using specific welding parameters, including an arc current of 160 A and 200 A, a filler feed rate of 3.5 and 3 m/min, and a gas composition of G3. On the other hand, Sample No. 2 (welded with an arc current of 120 A, a filler feed rate of 3 m/min, and a gas composition of G1) and Sample No. 4 (welded with an arc current of 160 A, a filler feed rate of 3 m/min, and a gas composition of G2) had the smallest transverse shrinkage values, measuring 0.0259 mm and 0.0254 mm, respectively.
Figure 9 shows that the transverse shrinkage increased from Sample 1 to 2 due to changes in the filler feed rate (3 and 3.5 m/min) and gas composition (G1 and G2). However, for Samples No. 2, 3, and 4, the values indicate that the filler feed rate did not have a strong effect on transverse shrinkage. Additionally, the change in the arc current (from 160 A to 200 A) from Sample No. 5 to Sample No. 9 interacted strongly with the gas mixture, generating greater heat input, and resulting in an increase in transverse shrinkage. This finding is consistent with a study that was conducted by Tian et al. [55]. Increasing the heat input over a larger area of the sheet may lead to an increase in the shrinkage area on the workpiece, resulting in transverse shrinkage. To mitigate this effect, pre-heating can be used to ensure a uniform distribution of heating and cooling inputs [59]. Samples No. 2, 4, and 9 (G2) had the same gas composition. Irrespective of the other welding parameters, the shielding gas mixture had a significant impact on decreasing the transverse shrinkage values. The relationship between angular distortion and transverse shrinkage was direct, with increasing angular distortion leading to an increase in transverse shrinkage, as shown in Figure 10. Moreover, the same results were observed in a study by Fernandes et al. [57].
The bead width is an important factor in welding that affects transverse shrinkage. The appropriate bead width for a specific welding process and joint design is crucial in reducing the risk of distortion or defects in the welded structure. A wider bead width can cause greater transverse shrinkage, while a narrower bead width can result in greater residual stresses. Finding the optimal bead width that can minimize transverse shrinkage while still providing enough strength and penetration is essential. By carefully selecting the appropriate MAG welding to make optimal bead width, the likelihood of distortion or other defects in the welded structure can be reduced, according to Dogan et al. [60].
The shielding gas is used to protect the welded pool from atmospheric contamination such as O2, which can lead to defects in the welded joint. When welding in a transverse shrinkage configuration, where the weld is made perpendicular to the direction of the force that causes the shrinkage, controlling the shielding gas is important for ensuring a high-quality weld. A higher percentage of Ar in the shielding gas can result in a slower cooling rate, which can increase the transverse shrinkage. Conversely, using a higher percentage of He in the shielding gas can result in a faster cooling rate, which can decrease the transverse shrinkage. O2 is often used in small amounts (less than 5%) in shielding gas mixtures because it can help to increase the arc stability and penetration of the welding process. However, using too much O2 in the shielding gas can increase the cooling rate of the weld pool, which can lead to higher levels of transverse shrinkage. CO2 has a higher thermal conductivity than Ar, which can increase the heat input and penetration of the welding process, resulting in less transverse shrinkage. However, too much CO2 in the shielding gas can also increase the cooling rate of the weld pool, which can increase transverse shrinkage [38,57,61]. In order to minimize transverse shrinkage, it is necessary to optimize the percentage of the shielding gas in order to achieve the desired level of heat input and cooling rate for a specific welding application. Therefore, it is crucial to determine the optimal MAG welding parameters and demonstrate the effect of each parameter and its contribution to the welding process through Taguchi analysis.

3.4. Taguchi Method (Analysis)

The effects of each factor on the material’s bead geometry and distortion were investigated. Minitab software 17 was employed to analyze the data, using the signal-to-noise (S/N) ratio approach utilizing ‘smaller is better’.

3.5. The Effect of Welding Parameters on Bead Height

The ANOVA and S/N ratio rank analysis clearly indicates that the arc current is the most influential parameter among the three parameters: arc current, filler feed rate, and gas mixture. This parameter has the most significant impact on the bead height, contributing 38.91%, followed by the filler feed rate at 28.76%, and the gas composition, with 22.30%, as shown in Table 6. In addition, based on the findings, it has been determined that the optimal welding parameters for achieving the best bead height are an arc current of 160 A, a filler feed rate of 3.5 m/min, and a gas mixture of G1, as presented in Table 7. The corresponding figures for each gas component are shown in Figure 11A, Figure 11B, Figure 11C, and Figure 11D, respectively.

3.6. The Effect of Welding Parameters on Bead Width

The arc current is the most effective MAG parameter for controlling the bead width, gas composition, and filler feed rate. After conducting an ANOVA analysis, the optimal welding parameters were found to be an arc current of 120 A, a filler feed rate of 3 m/min, and a gas composition of G2. The ANOVA results also revealed the following percentage of effects of each welding parameter: an arc current of 43.19%, a filler feed rate of 11.67%, and a gas composition of 34.88%, as shown in Table 8. Furthermore, it was determined that the most influential MAG parameters, based on the contribution percentage (ANOVA), should be consistent with the S/N ratio (rank), as shown in Table 9. The corresponding figures for each gas component are shown in Figure 12A, Figure 12B, Figure 12C, and Figure 12D, respectively.

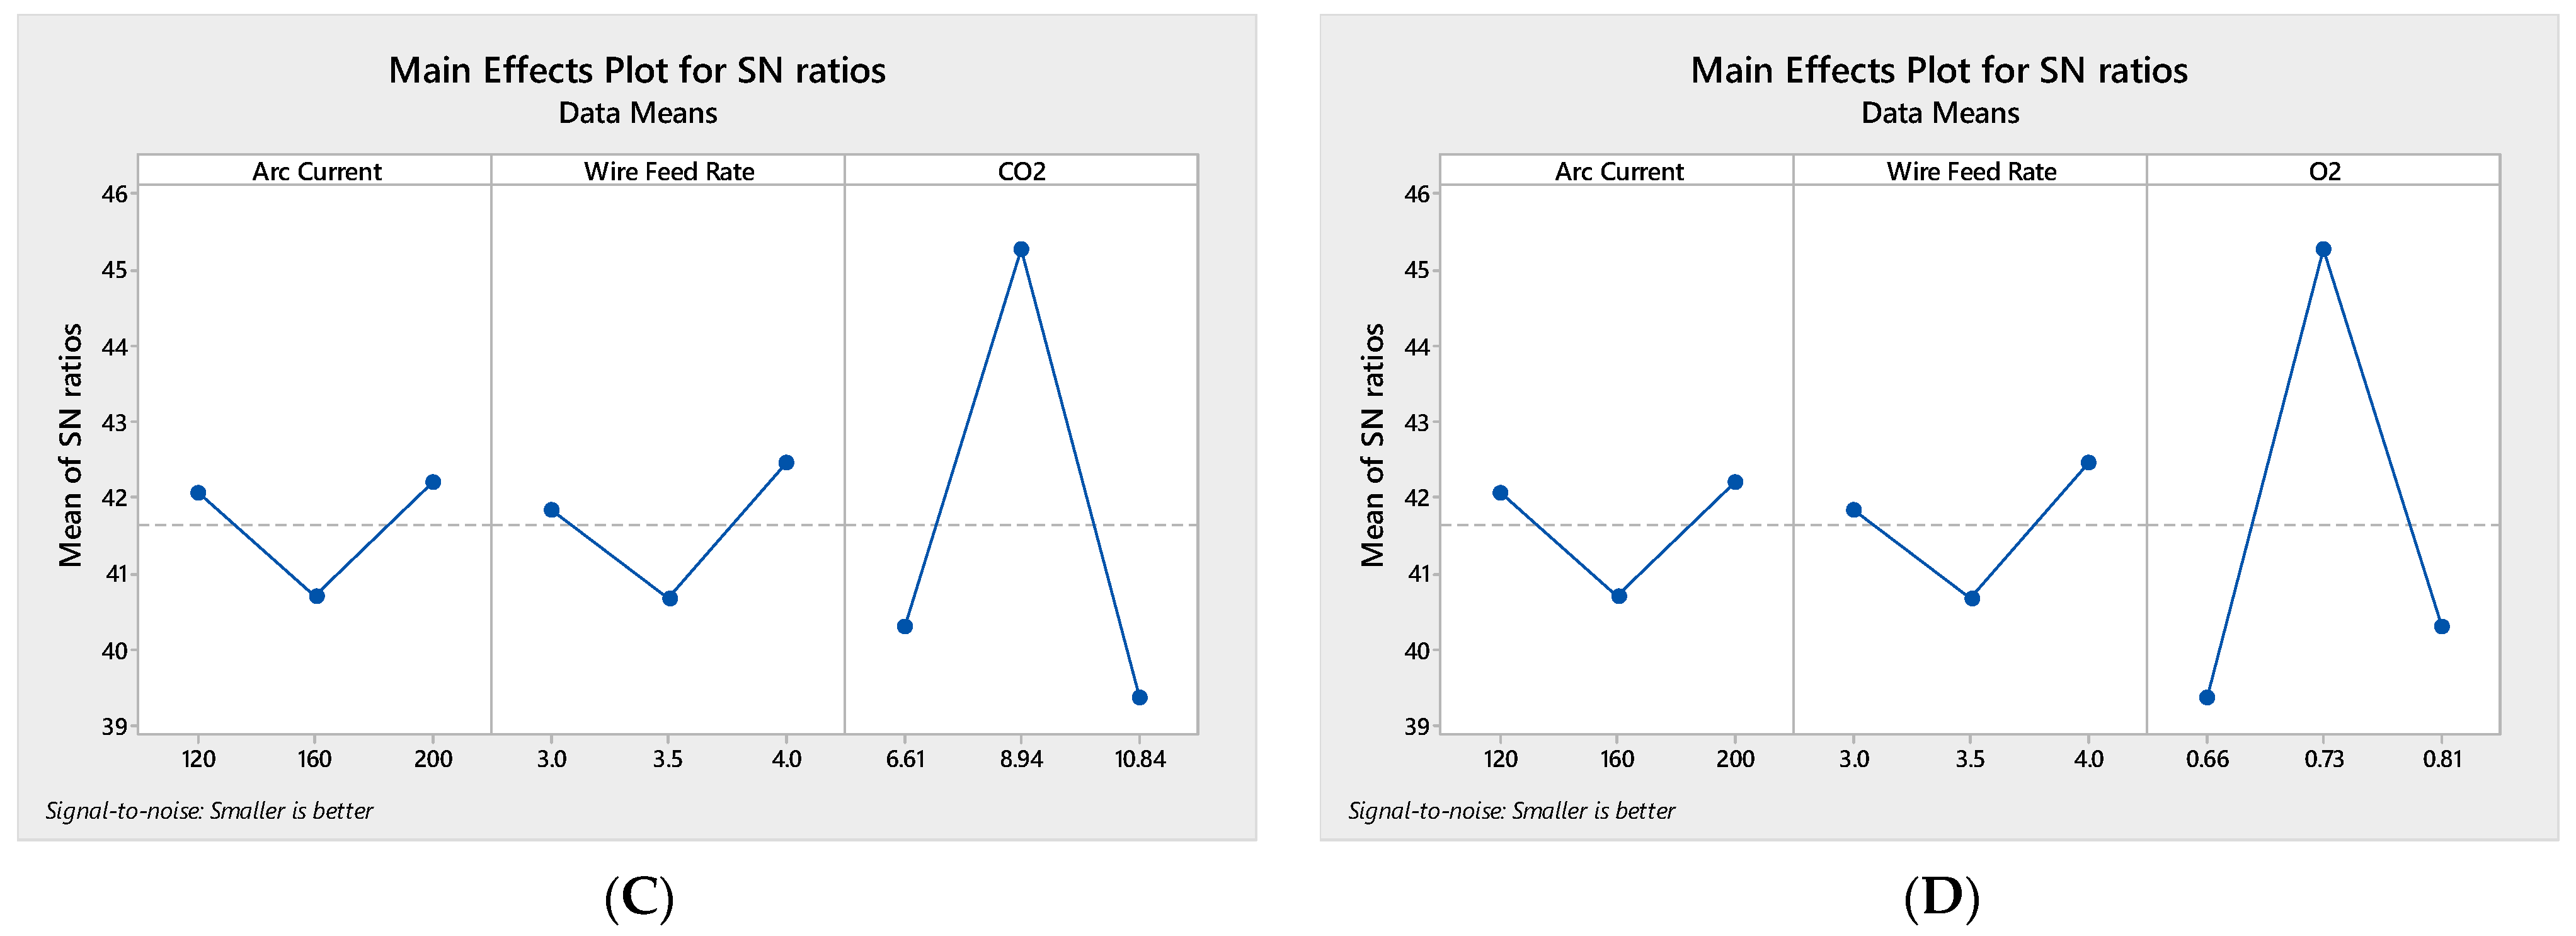
3.7. The Effect of MAG Parameters on Angular Distortion

Of the MAG welding parameters, the gas composition is the most effective parameter for controlling angular distortion, followed by the arc current, and the filler feed rate. After conducting an ANOVA analysis, it was determined that the optimal welding parameters are an arc current of either 120 A or 200 A, a filler feed rate of 4 m/min, and a gas mixture of G2. The ANOVA results revealed that the gas composition (ranked first with 80.54%) has the most significant impact on angular distortion, followed by arc current (ranked second with 7.98%), and filler feed rate (ranked last with 5.54%), based on the contribution percentage (ANOVA) and S/N ratio (rank), as shown in Table 10. The corresponding figures for each gas component are presented in Figure 13A, Figure 13B, Figure 13C, and Figure 13D, respectively, as indicated in Table 11.

3.8. The Effect of MAG Parameters on Transverse Shrinkage

Among the MAG welding parameters, the gas composition is the most effective parameter for controlling transverse shrinkage, followed by arc current, and filler feed rate. The ANOVA results show that the gas composition (ranked first with 54.25%) has the greatest impact on transverse shrinkage, followed by the arc current (ranked second with 24.85%), and the filler feed rate (ranked last with 11.17%), based on the contribution percentage (ANOVA) and S/N ratio (rank), as shown in Table 12 and Table 13. These findings suggest that the gas mixture and the arc current are the primary factors affecting transverse shrinkage. The optimal welding parameters are an arc current of 120 A, a filler feed rate of 4 m/min, and a gas mixture of G2. The corresponding figures for each gas component are shown in Figure 14A, Figure 14B, Figure 14C, and Figure 14D, respectively.

3.9. Mathematical Components

3.9.1. Characterization Measurements

Nine samples were manually welded by an experienced welder and then left to cool for a few days before being used in the experiment. Two gauges, the Vernier caliper and the Vernier height gauge, were used for the measurement. These instruments have an accuracy of approximately 0.02 mm.

3.9.2. Bead Geometry

The standard BS EN ISO 5817 is utilized to evaluate the acceptability of the bead height, with the upper limit being established based on the severity of the application. It is recommended to keep the size of the bead welding lines (geometry) as minimal as possible in order to achieve favorable mechanical properties. For applications of moderate severity, the maximum permissible bead height is calculated using the following equation [54]:
H 1 + 1.0 b
In cases of stringent severe applications, the calculation for the maximum permissible bead height is determined using the following equation:
H 1 + 0.2 b
where H is the height of the excess weld (mm) (the total weld height minus the workpiece thickness) and b is the width of the bead.
The measurements of the weld width and height were obtained at three different points, and the average value was considered. For measuring the bead width, a standard Vernier caliper was used, and for measuring the bead height, a standard Vernier height gauge was employed.

3.9.3. Distortion

The average measurement (D) is obtained from five equally spaced points on the sample surface. Subsequently, the average length (L) is calculated using the measurements from the three middle points. Finally, the deformation angle is determined by applying Equation (3).
The formula for calculating angular distortion θ (in degrees) is given as follows:
θ = t a n 1 ( 2 D L )
where D is the average vertical displacement and L is the length of the specimen in millimeters.
ρ = 1 3 Δ L 1 L 1 + Δ L 2 L 2 + Δ L 3 L 3
Transverse shrinkage ρ (in millimeters) can be determined by measuring the length at different points ( L i , i = 1,2 , 3 ) and the change in the length at the same location ( L i ) using the equation.
In order to calculate both angular distortion and transverse shrinkage, a Vernier caliper gauge is used to measure each point, as shown in Figure 15.

3.9.4. Taguchi Equations

Equation larger is better:
S N = 10   L o g 1 n i = 1 n 1 y i 2
Equation smaller is better:
S N = 10   L o g 1 n i = 1 n y i 2
The equations of the (S/N) may be classified into two groups: smaller is better and larger is better. Using Equation (5) (smaller is better) as a rule of thumb, the minimum value of distortion and bead geometry is obtained. The optimal MAG welding setups are determined by ANOVA analysis [45].

4. Conclusions

The following conclusions have been reached regarding the effect of the MAG welding parameters on the bead geometry and distortion of AISI 316L austenitic stainless steel:
  • A Taguchi’s analysis of bead height and S/N ratio curves has been produced. The arc current is the most influential parameter. The best MAG parameter set for bead height has been obtained, which includes an arc current of 160 A, a filler feed rate of 3.5, and a shielding gas mixture of G1. The desired bead height value was 4.89 mm. The current, the filler feed rate, and the gas mixture contributed 38.93%, 28.76%, and 22.30%, respectively.
  • A Taguchi’s analysis of bead width and S/N ratio curves has been produced. The arc current is the most influential parameter. The best MAG parameter set for bead height has been obtained, which includes an arc current of 160 A, a filler feed rate of 3.5, and a shielding gas mixture of G2. The desired bead width was 6.69 mm. The arc current, the gas mixture, and the filler feed rate contributed 43.19%, 11.67%, and 34.88%, respectively.
  • A Taguchi’s analysis of angular distortion and S/N ratio curves has been produced by considering “smaller is better.” The gas composition is the most influential parameter. The optimal MAG parameter set of bead height has been achieved, which includes an arc current of 120 A), a filler feed rate of 4, and a shielding gas mixture of G2. The lowest value of angular distortion was 0.0042°. The contribution of each parameter is an arc current of 7.98%), a filler feed rate of 5.54%, and a gas composition of 80.54%.
  • A Taguchi’s analysis of transverse shrinkage and S/N ratio curves has been produced by considering “smaller is better.” The gas composition is the most influential parameter. The optimal MAG parameter set of bead height has been achieved, which includes an arc current of 120 A), a filler feed rate of 4, and a shielding gas mixture of G2. The lowest transverse shrinkage was 0.0254 mm. The contribution of each parameter was an arc current of 24.85%), a filler feed rate of 11.17%), and a gas composition of 54.25%.

Author Contributions

S.K.: Conceptualization, Methodology, Software, Validation, Formal analysis, Investigation, Resources, Data curation, Project administration, Visualization, Supervision, Funding acquisition, Writing—original draft preparation; H.A.H. and A.A.A.: Methodology, Software, Investigation, Validation, Data curation, Formal analysis, Visualization, Writing—original draft preparation; T.D.: Resources, Supervision, Project administration, Writing—review and editing. All authors have read and agreed to the published version of the manuscript.

Funding

This research was funded by the Deanship of Research/Jordan University of Science and Technology, grant number 20170082.

Data Availability Statement

The data presented in this study are available on request from the corresponding author.

Conflicts of Interest

The authors declare no conflict of interest.

References

  1. Planckaert, J.P.; Djermoune, E.H.; Brie, D.; Briand, F.; Richard, F. Modeling of MIG/MAG welding with experimental validation using an active contour algorithm applied on high speed movies. Appl. Math. Model. 2010, 34, 1004–1020. [Google Scholar] [CrossRef]
  2. Vairamani, V.; Mohan, N.; Venkatesh; Karthikeyan, S.K.; Sakthivel, M. Optimization and microstructure analysis of Corten steel joint in mag welding by post heat treatment. Mater. Today Proc. 2020, 21, 673–680. [Google Scholar] [CrossRef]
  3. Kuang, X.; Qi, B.; Zheng, H. Effect of pulse mode and frequency on microstructure and properties of 2219 aluminum alloy by ultrahigh-frequency pulse Metal-Inert Gas Welding. J. Mater. Res. Technol. 2022, 20, 3391–3407. [Google Scholar] [CrossRef]
  4. Sato, T. Influence of shielding gases on quality and efficiency in gas shielded arc welding. Weld. Int. 2001, 15, 616–619. [Google Scholar] [CrossRef]
  5. Egerland, S.; Colegrove, P.; Williams, S. Influence of shielding gas nozzle design on power density distribution in low-current TIG welding arcs. Weld. World 2020, 64, 831–845. [Google Scholar] [CrossRef]
  6. Reza Tabrizi, T.; Sabzi, M.; Mousavi Anijdan, S.H.; Eivani, A.R.; Park, N.; Jafarian, H.R. Comparing the effect of continuous and pulsed current in the GTAW process of AISI 316L stainless steel welded joint: Microstructural evolution, phase equilibrium, mechanical properties and fracture mode. J. Mater. Res. Technol. 2021, 15, 199–212. [Google Scholar] [CrossRef]
  7. Guilherme, L.H.; Benedetti, A.V.; Fugivara, C.S.; Magnabosco, R.; Oliveira, M.F. Effect of MAG welding transfer mode on sigma phase precipitation and corrosion performance of 316L stainless steel multi-pass welds. Integr. Med. Res. 2020, 9, 10537–10549. [Google Scholar] [CrossRef]
  8. Balaji, C.; Kumar, S.A.; Kumar, S.A.; Sathish, R.; Nadu, T. Evaluation of Mechanical Properties of SS 316 L Weldments Using Tungsten Inert Gas Welding. Int. J. Eng. Sci. Technol. 2012, 4, 2053–2057. [Google Scholar]
  9. Kulkarni, A.; Dwivedi, D.K.; Vasudevan, M. Microstructure and mechanical properties of A-TIG welded AISI 316L SS-Alloy 800 dissimilar metal joint. Mater. Sci. Eng. A 2020, 790, 139685. [Google Scholar] [CrossRef]
  10. Ghosh, N.; Pal, P.K.; Nandi, G. Parametric Optimization of MIG Welding on 316L Austenitic Stainless Steel by Grey-based Taguchi Method. Procedia Technol. 2016, 25, 1038–1048. [Google Scholar] [CrossRef]
  11. Ghosh, N.; Pal, P.K.; Nandi, G. GMAW dissimilar welding of AISI 409 ferritic stainless steel to AISI 316L austenitic stainless steel by using AISI 308 filler wire. Eng. Sci. Technol. Int. J. 2017, 20, 1334–1341. [Google Scholar] [CrossRef]
  12. Ekaputra, I.M.W.; Mungkasi, S.; Dwi Haryadi, G.; Tungga Dewa, R.; Kim, S.J. The influence of welding speed conditions of GMAW on mechanical properties of 316L austenitic stainless steel. MATEC Web Conf. 2018, 159, 02009. [Google Scholar] [CrossRef]
  13. Demarque, R.; dos Santos, E.P.; Silva, R.S.; de Castro, J.A. Evaluation of the effect of the thermal cycle on the characteristics of welded joints through the variation of the heat input of the austhenitic AISI 316L steels by the GMAW process. Sci. Technol. Mater. 2018, 30, 51–59. [Google Scholar] [CrossRef]
  14. Girón-Cruz, J.A.; Pinto-Lopera, J.E.; Alfaro, S.C.A. Weld bead geometry real-time control in gas metal arc welding processes using intelligent systems. Int. J. Adv. Manuf. Technol. 2022, 123, 3871–3884. [Google Scholar] [CrossRef]
  15. Kolahan, F.; Heidari, M. A new approach for predicting and optimizing weld bead geometry in GMAW. World Acad. Sci. Eng. Technol. 2009, 59, 138–141. [Google Scholar]
  16. Mochizuki, M.; Okano, S. Effect of welding process conditions on angular distortion induced by bead-on-plate welding. ISIJ Int. 2018, 58, 153–158. [Google Scholar] [CrossRef]
  17. Yan, Z.; Liu, W.; Tang, Z.; Liu, X.; Zhang, N.; Wang, Z.; Zhang, H. Effect of thermal characteristics on distortion in laser cladding of AISI 316L. J. Manuf. Process. 2019, 44, 309–318. [Google Scholar] [CrossRef]
  18. Tomków, J.; Sobota, K.; Krajewski, S. Influence of tack welds distribution and welding sequence on the angular distortion of tig welded joint. Facta Univ. Ser. Mech. Eng. 2020, 18, 611–621. [Google Scholar] [CrossRef]
  19. Mastanaiah, P.; Sharma, A.; Reddy, G.M. Process parameters-weld bead geometry interactions and their influence on mechanical properties: A case of dissimilar aluminium alloy electron beam welds. Def. Technol. 2018, 14, 137–150. [Google Scholar] [CrossRef]
  20. Ganjigatti, J.P.; Pratihar, D.K.; Roy Choudhury, A. Global versus cluster-wise regression analyses for prediction of bead geometry in MIG welding process. J. Mater. Process. Technol. 2007, 189, 352–366. [Google Scholar] [CrossRef]
  21. Adak, D.K.; Mukherjee, M.; Pal, T.K. Development of a Direct Correlation of Bead Geometry, Grain Size and HAZ Width with the GMAW Process Parameters on Bead-on-plate Welds of Mild Steel. Trans. Indian Inst. Met. 2015, 68, 839–849. [Google Scholar] [CrossRef]
  22. Pathak, D.; Pratap Singh, R.; Gaur, S.; Balu, V. To study the influence of process parameters on weld bead geometry in shielded metal arc welding. Mater. Today Proc. 2011, 44, 39–44. [Google Scholar] [CrossRef]
  23. Singh, R.P.; Garg, R.K.; Shukla, D.K. Mathematical modeling of effect of polarity on weld bead geometry in submerged arc welding. J. Manuf. Process. 2016, 21, 14–22. [Google Scholar] [CrossRef]
  24. Saha, M.K.; Hazra, R.; Mondal, A.; Das, S. Effect of Heat Input on Geometry of Austenitic Stainless Steel Weld Bead on Low Carbon Steel. J. Inst. Eng. Ser. C 2019, 100, 607–615. [Google Scholar] [CrossRef]
  25. Arya, H.; Singh, K.; Saxena, R.K. Effect of Welding Parameters on Penetration and Bead Width for Variable Plate Thickness in Submerged Arc Welding. In Proceedings of the 17th International Conference on Robotics and Mechanical Engineering (ICRME), Paris, France, 26 August 2015; Volume 9, pp. 2482–2486. [Google Scholar]
  26. Narang, R.; Maheshwari, V.; Khanna, P. Prediction of bead geometry parameters in MIG welded stainless steel 409L plates by mathematical modelling. Mater. Today Proc. 2021, 44, 900–908. [Google Scholar] [CrossRef]
  27. Esme, U.; Bayramoglu, M.; Kazancoglu, Y.; Ozgun, S. Optimization of weld bead geometry in TIG welding process using grey relation analysis and Taguchi method. Mater. Tehnol. 2009, 43, 143–149. [Google Scholar]
  28. Narwadkar, A.; Bhosle, S. Optimization of MIG Welding Parameters to Control the Angular Distortion in Fe410WA Steel. Mater. Manuf. Process. 2016, 31, 2158–2164. [Google Scholar] [CrossRef]
  29. Zhang, L. Modelling welding stress and distortion in large structures. Minimization Weld. Distortion Buckling Model. Implement. 2011, 99–126. [Google Scholar] [CrossRef]
  30. Dong, P.; Zhou, W.; Xing, S. An analytical method for interpreting distortion effects on fatigue test results of thin plate panel specimens. Weld. World 2019, 63, 1707–1714. [Google Scholar] [CrossRef]
  31. Distortion. Distorion. Available online: https://ir-welding-consultancy.nl/Materials-Science/ (accessed on 26 June 2023).
  32. Aggarwal, I. Mathematical Modeling for Predicting Angular Distortion in Tig Welding of Stainless Steel 409L Butt Welds. Int. J. Res. Eng. Technol. 2018, 7, 92–97. [Google Scholar] [CrossRef]
  33. Rong, Y.; Huang, Y.; Zhang, G.; Chang, Y.; Shao, X. Prediction of angular distortion in no gap butt joint using BPNN and inherent strain considering the actual bead geometry. Int. J. Adv. Manuf. Technol. 2016, 86, 59–69. [Google Scholar] [CrossRef]
  34. Pandit, M.; Sood, S.; Mishra, P.; Khanna, P. Mathematical analysis of the effect of process parameters on angular distortion of MIG welded stainless steel 202 plates by using the technique of response surface Methodology. Mater. Today Proc. 2019, 41, 1045–1054. [Google Scholar] [CrossRef]
  35. Rubio-Ramirez, C.; Giarollo, D.F.; Mazzaferro, J.E.; Mazzaferro, C.P. Prediction of angular distortion due GMAW process of thin-sheets Hardox 450® steel by numerical model and artificial neural network. J. Manuf. Process. 2021, 68, 1202–1213. [Google Scholar] [CrossRef]
  36. Zhao, Y.; Shi, X.; Yan, K.; Wang, G.; Jia, Z.; He, Y. Effect of shielding gas on the metal transfer and weld morphology in pulsed current MAG welding of carbon steel. J. Mater. Process. Technol. 2018, 262, 382–391. [Google Scholar] [CrossRef]
  37. Weman, K. Welding Processes Handbook; libgen.lc; Woodhead Publishing: Sawston, UK, 2012; Volume 1999, ISBN 9780857095107. [Google Scholar]
  38. Mvola, B.; Kah, P. Effects of shielding gas control: Welded joint properties in GMAW process optimization. Int. J. Adv. Manuf. Technol. 2017, 88, 2369–2387. [Google Scholar] [CrossRef]
  39. ISO 14175:2008; Gases and Gas Mixtures. International Organization for Standardization: Geneva, Switzerland, 2008. Available online: https://www.iso.org/standard/39569.html#:~:text=Abstract,arcwelding(Process13)%3B)/ (accessed on 26 June 2023).
  40. Uttrachi, G.D. GMAW shielding gas flow control systems. Weld. J. 2007, 86, 22–23. [Google Scholar]
  41. Campbell, S.W.; Galloway, A.M.; McPherson, N.A. Techno-economic evaluation of reducing shielding gas consumption in GMAW whilst maintaining weld quality. Int. J. Adv. Manuf. Technol. 2012, 63, 975–985. [Google Scholar] [CrossRef]
  42. Kim, I.S.; Son, J.S.; Kim, H.J.; Chin, B.A. A study on variation of shielding gas in GTA welding using finite element method. Manuf. Eng. 2006, 17, 249–252. [Google Scholar]
  43. Karazi, S.M.; Moradi, M.; Benyounis, K.Y. Statistical and Numerical Approaches for Modeling and Optimizing Laser Micromachining Process-Review; Elsevier Ltd.: Amsterdam, The Netherlands, 2019; ISBN 9780128035818. [Google Scholar]
  44. Ramarao, M.; King, M.F.L.; Sivakumar, A.; Manikandan, V.; Vijayakumar, M.; Subbiah, R. Optimizing GMAW parameters to achieve high impact strength of the dissimilar weld joints using Taguchi approach. Mater. Today Proc. 2021, 50, 861–866. [Google Scholar] [CrossRef]
  45. Akbari, M.; Asadi, P.; Givi, M.K.B.; Khodabandehlouie, G. Artificial Neural Network and Optimization; Elsevier: Amsterdam, The Netherlands, 2014; ISBN 9780857094551. [Google Scholar]
  46. Datta, S.; Bandyopadhyay, A.; Pal, P.K. Grey-based taguchi method for optimization of bead geometry in submerged arc bead-on-plate welding. Int. J. Adv. Manuf. Technol. 2008, 39, 1136–1143. [Google Scholar] [CrossRef]
  47. Tarng, Y.S.; Yang, W.H.; Juang, S.C. Use of fuzzy logic in the Taguchi method for the optimization of the submerged arc welding process. Int. J. Adv. Manuf. Technol. 2000, 16, 688–694. [Google Scholar] [CrossRef]
  48. Mathematics, A. AISI 316L Sheet. 2016. Available online: https://www.matweb.com/search/DataSheet.aspx?MatGUID=1336be6d0c594b55afb5ca8bf1f3e042/ (accessed on 26 June 2023).
  49. Aircraft Materials. Available online: https://www.aircraftmaterials.com/data/weld/er316l.html (accessed on 26 June 2023).
  50. Tagami, M. Non-destructive inspection for weld joint of steel structure. Weld. Int. 2008, 22, 77–81. [Google Scholar] [CrossRef]
  51. Hou, W.; Wei, Y.; Guo, J.; Jin, Y.; Zhu, C. Automatic Detection of Welding Defects using Deep Neural Network. J. Phys. Conf. Ser. 2018, 933, 012006. [Google Scholar] [CrossRef]
  52. Chuaiphan, W.; Srijaroenpramong, L. Heat input and shielding gas effects on the microstructure, mechanical properties and pitting corrosion of alternative low cost stainless steel grade 202. Results Mater. 2020, 7, 100111. [Google Scholar] [CrossRef]
  53. Kuk, J.M.; Jang, K.C.; Lee, D.G.; Kim, I.S. Effects of temperature and shielding gas mixture on fatigue life of 5083 aluminum alloy. J. Mater. Process. Technol. 2004, 155, 1408–1414. [Google Scholar] [CrossRef]
  54. A General Review of the Causes and Acceptance of Shape Imperfections—Part 2. Available online: https://www.twi-global.com/technical-knowledge/job-knowledge/a-general-review-of-the-causes-and-acceptance-of-shape-imperfections-part-2-068 (accessed on 26 June 2023).
  55. Tian, L.; Luo, Y.; Wang, Y.; Wu, X. Prediction of transverse and angular distortions of gas tungsten arc bead-on-plate welding using artificial neural network. Mater. Des. 2014, 54, 458–472. [Google Scholar] [CrossRef]
  56. Tseng, K.H.; Chou, C.P. The study of nitrogen in argon gas on the angular distortion of austenitic stainless steel weldments. J. Mater. Process. Technol. 2003, 142, 139–144. [Google Scholar] [CrossRef]
  57. Fernandes, C.A.; do Vale, N.L.; de Abreu Santos, T.F.; Urtiga Filho, S.L. Investigation of transverse shrinkage and angular distortion caused by hybrid laser-arc welding. Int. J. Adv. Manuf. Technol. 2020, 107, 4705–4711. [Google Scholar] [CrossRef]
  58. Okano, S.; Tsuji, H.; Mochizuki, M. Temperature distribution effect on relation between welding heat input and angular distortion. Sci. Technol. Weld. Join. 2017, 22, 59–65. [Google Scholar] [CrossRef]
  59. Singh, R. Stresses, Shrinkage, and Distortion in Weldments; Butterworth-Heinemann: Oxford, UK, 2020; ISBN 9780128213483. [Google Scholar]
  60. Dogan, E.; Ay, M.; Kurtulmus, M.; Yukler, A.I.; Etyemez, A. Effects of welding parameters on the angular distortion of welded steel plates. Open Chem. 2022, 20, 417–423. [Google Scholar] [CrossRef]
  61. Kah, P.; Martikainen, J. Influence of shielding gases in the welding of metals. Int. J. Adv. Manuf. Technol. 2013, 64, 1411–1421. [Google Scholar] [CrossRef]
Figure 1. Evaluation criteria of weld bead geometry (width, height, and penetration).
Jmmp 07 00123 g001
Figure 2. (A) Transverse shrinkage and (B) angular distortion.
Jmmp 07 00123 g002
Figure 3. (A) COMPACT 410 welding machine and (B) COMPACT 410 control panel.
Jmmp 07 00123 g003
Figure 4. Schematic diagram of the AISI 316L workpiece.
Jmmp 07 00123 g004
Figure 5. Sample faces of the experimental work.
Jmmp 07 00123 g005
Figure 6. Average bead height of the batch.
Jmmp 07 00123 g006
Figure 7. Average bead width of the batch.
Jmmp 07 00123 g007
Figure 8. Angular distortion of the batch.
Jmmp 07 00123 g008
Figure 9. Transverse shrinkage of the batch.
Jmmp 07 00123 g009
Figure 10. The correlation of transverse shrinkage and angular distortion.
Jmmp 07 00123 g010
Figure 11. The effects of welding parameter plots on bead height. (A) the effect of Ar (B) the effect of He (C) the effect of CO2 (D) The effect of O2.
Jmmp 07 00123 g011
Figure 12. The effect of welding parameter plots on bead width. (A) the effect of Ar (B) the effect of He (C) the effect of CO2 (D) The effect of O2.
Jmmp 07 00123 g012
Figure 13. The effect of welding parameter plots on angular distortion. (A) the effect of Ar (B) the effect of He (C) the effect of CO2 (D) The effect of O2.
Jmmp 07 00123 g013aJmmp 07 00123 g013b
Figure 14. The effect of welding parameter plots on transverse shrinkage. (A) the effect of Ar (B) the effect of He (C) the effect of CO2 (D) The effect of O2.
Jmmp 07 00123 g014
Figure 15. Transverse shrinkage and angular distortion measurements taken at each point.
Jmmp 07 00123 g015
Table 1. AISI 316L chemical composition.
Chemical ElementFeCrMoNiMnSiCPS
Percentage (wt. %)Bal.16.0–18.0%2.0–3.0%10.0–14.0%2.0% max.0.75% max.0.03%0.045% max.0.03% max.
Table 2. The ER316L filler material chemical composition [49].
Chemical ElementFeCrNiMoMnCSiSP
Percentage (wt. %)Bal.16.0–18.0%10.0–14.0%2.0–3.0%2.0% max.0.03% max.0.75% max.0.03% max.0.045% max.
Table 3. Gas composition in this study.
Shielding Gas (G1)Shielding Gas (G2)Shielding Gas (G3)
Ar (63.22 vol. %)Ar (62.54 vol. %)Ar (61.72 vol. %)
He (25.28 vol. %)He (27.79 vol. %)He (30.86 vol. %)
CO2 (10.84 vol. %)CO2 (8.94 vol. %)CO2 (6.61 vol. %)
O2 (0.66 vol. %)O2 (0.73 vol. %)O2 (0.81 vol. %)
Table 4. L9 orthogonal array setup.
Sample No.Arc Current (A)Filler Feed Rate (m/min)Gas Mixture
1(6 × 20) = 1203G1
2(6 × 20) = 1203.5G2
3(6 × 20) = 1204G3
4(8 × 20) = 1603G2
5(8 × 20) = 1603.5G3
6(8 × 20) = 1604G1
7(10 × 20) = 2003G3
8(10 × 20) = 2003.5G1
9(10 × 20) = 2004G2
Table 5. Visual inspection results.
Visual Inspection Criteria
Sample #Arc StrikeCrack or TearDamaged Base Metal Surface after WeldingIncomplete FusionIncomplete PenetrationIrregular Bead ProfileSurface PorosityUnderfillWeld Spatter
1NoNoNoNoNoNoNoNoYes
2NoNoNoNoNoNoNoNoNo
3NoNoNoNoNoNoNoNoNo
4NoNoNoNoNoNoNoNoYes
5NoNoNoNoNoNoNoNoYes
6NoNoNoNoNoNoNoNoNo
7NoNoNoNoNoNoNoNoNo
8NoNoNoNoNoNoNoNoNo
9NoNoNoNoNoNoNoNoYes
Table 6. ANOVA table of bead height.
Source of Variation Degree of FreedomSeq Sum SquareAdj Mean SquareFPParameter Contribution
Current20.74740.373683.890.20538.93%
Filler feed rate20.55210.276042.870.25828.76%
Gas Composition20.42820.214082.230.31022.30%
Residual error20.19220.09608 10.01%
Total81.9198
Table 7. Analysis of S/N for bead height.
LevelArc CurrentFiller Feed Rate O2ArHeCO2
1−15.85−15.25−14.86−15.67−14.86−15.67
2−14.89−14.78−15.20−15.20−15.20−15.20
3−14.99−15.70−15.67−14.86−15.67−14.86
Delta0.960.920.800.800.800.80
Rank123
Table 8. ANOVA table of bead width.
Source of VariationDegree of FreedomSeq Sum SquareAdj Mean SquareFPParameter Contribution
Current25.4102.70504.220.19243.19%
Filler feed rate21.4620.73111.140.46711.67%
Gas composition24.3692.18463.400.22734.88%
Residual error21.2830.6417 10.25%
Total812.525
Table 9. Analysis of S/N for bead width.
LevelArc CurrentFiller Feed RateO2ArHeCO2
1−17.89−18.05−18.46−18.46−18.46−19.61
2−18.36−19.11−17.91−17.91−17.91−17.91
3−19.73−18.82−19.61−19.61−19.61−18.46
Delta1.841.051.701.701.701.70
Rank132
Table 10. ANOVA table of angular distortion.
Source of Variation Degree of FreedomSeq Sum SquareAdj Mean SquareFpParameter Contribution
Current20.0000050.0000021.340.4277.98%
Filler feed rate20.0000030.0000020.930.5185.54%
Gas Composition20.0000470.00002313.550.11480.54%
Residual error20.0000030.000002 5.94%
Total80.000058
Table 11. Analysis of S/N for angular distortion.
LevelArc CurrentFiller Feed RateO2ArHeCO2
142.0641.8339.3739.3739.3739.37
240.7040.6745.2945.2945.2945.29
342.2142.4840.3240.3240.3240.32
Delta1.511.815.925.925.925.92
Rank231
Table 12. ANOVA table of transverse shrinkage.
Source of VariationDegree of FreedomSeq Sum SquareAdj Mean SquareFPParameter Contribution
Current20.0003590.0001802.550.28124.85%
Filler Feed rate20.0001610.0000811.150.46611.17%
Gas Composition20.0007840.000003925.570.15254.25%
Residual error20.0001410.000210 9.73%
Total80.001445
Table 13. Analysis of S/N for transverse shrinkage.
LevelArc CurrentFiller Feed RateO2 (%)Ar (%)He (%)CO2
130.3028.1826.7927.0026.7926.79
227.8227.5231.4531.4531.4531.45
327.1429.5527.0026.7927.0027.00
Delta3.162.044.664.664.664.66
Rank231
Disclaimer/Publisher’s Note: The statements, opinions and data contained in all publications are solely those of the individual author(s) and contributor(s) and not of MDPI and/or the editor(s). MDPI and/or the editor(s) disclaim responsibility for any injury to people or property resulting from any ideas, methods, instructions or products referred to in the content.

