Article

Understanding Inhomogeneous Mechanical Properties in PBF-LB/M Manufactured Parts Due to Inhomogeneous Macro Temperature Profiles Based on Process-Inherent Preheating

by
Jonas Zielinski
1,2,*,
Jan Theunissen
1,
Henrik Kruse
1,
Silja-Katharina Rittinghaus
3,
Johannes Henrich Schleifenbaum
1,
Dongjian Zhu
4 and
Mustafa Megahed
5
1
Digital Additive Production DAP, RWTH Aachen University, Campus Boulevard 73, 52074 Aachen, Germany
2
ModuleWorks GmbH, Henricistraße 50, 52072 Aachen, Germany
3
Chair of Materials Science and Additive Manufacturing, School of Mechanical Engineering and Safety Engineering, University of Wuppertal, Gaußstr. 20, 42119 Wuppertal, Germany
4
GKN Powder Metallurgy Engineering GmbH, Pennefeldsweg 11-15, 53177 Bonn, Germany
5
ESI Germany GmbH, Kruppstr. 90, 45145 Essen, Germany
*
Author to whom correspondence should be addressed.
J. Manuf. Mater. Process. 2023, 7(3), 88; https://doi.org/10.3390/jmmp7030088
Submission received: 31 March 2023 / Revised: 25 April 2023 / Accepted: 1 May 2023 / Published: 5 May 2023
(This article belongs to the Special Issue Progress in Powder-Based Additive Manufacturing)

Abstract

:
The mechanical properties in laser-based powder bed fusion (PBF-LB/M) manufactured parts are anisotropic in nature due to the layer-wise build-up but also change due to different solidification conditions in dependence on the process strategy and the geometry. In this work, the latter effect is examined by means of simulating the thermal history on a part scale (macro temperature) and correlating the critical temperature and holding time with the local hardness and microstructure. A macro temperature model is introduced and validated with vector-based thermal simulations and thermo couple measurements from the build-up process. Two cone-shaped geometries are investigated, namely, an upright and an inverted cone. The examinations are performed and validated with Inconel 718. An outlook to further investigations and more complex, real-life applicable geometries is given.

1. Introduction

Laser powder bed fusion is an advanced fusion additive manufacturing process for melting metal using a laser beam (PBF-LB/M). Complex three-dimensional structures can be created by selectively melting and fusing successive layers of metal powder. In comparison to other additive manufacturing processes, such as direct energy deposition, the productivity is lower. However, PBF-LB/M exhibits a higher level of precision and accuracy, allowing parts to be manufactured closer to the near net shape of manufactured parts. Complex geometries pose the challenge of achieving homogeneous mechanical properties because the geometry can affect the thermal behaviour during the process. Therefore, understanding and addressing the challenges associated with geometrical complexity is essential for the successful implementation of PBF-LB/M in new industrial applications.
The high geometric accuracy is a result of the small laser beam diameter of ~100 µm and, consequently, smaller melt pool size during the process. The solidification process during PBF-LB/M is strongly out of thermodynamic equilibrium, and the solidification conditions are classified as “rapid solidification”, with large temperature gradients on the phasefront of solidification and a fast solidification velocity being characteristic [1,2,3]. The local solidification rate determines the resulting microstructure and, thus, the as-built mechanical properties. Due to process inherent preheating, the solidification conditions vary throughout the part geometry, and this can unfavourably influence the mechanical properties since a more homogenous part is usually desired. However, the determination of the real solidification conditions in the PBF-LB/M processes is a challenge since these cannot be measured experimentally along the moving phase front. Measurement methods, such as radiation thermometry or temperature measurement using thermocouples, only allow the determination of the surface temperature or determination of the temperature history of a fixed point at a great distance from the solidification front. Due to these experimental limitations, simulations are a useful tool to determine the temperature at any time, in any location, during build-up and in the cool down phase of the process. Thereby it has to be distinguished with respect to the time and length scale at which position the temperature is investigated. Due to the vector-based nature of the PBF-LB/M process and the relatively small area of energy input area, and the high intensities of up to ~ 10 10   W / m 2 occurring in the process, a resolution in the range of the melt pool scale has to be chosen for an accurate description of the process. Typical scanning velocities are ~ 1   m / s , a melt pool size of ~200 µm, a beam diameter of ~100 µm, and an interaction time of 100 µs. This fine resolution of the process, which is required for deeper understanding, is associated with high expenditures for mapping to an entire component, since the integrated length of all scanning vectors in a typical component is on the order of ~km and a numerical evaluation along all scanning vectors is associated with high resolution in time and, thus, would require a tremendous calculation time.
In this work, the mechanical properties of critical component areas/volumes are investigated and compared to the microstructure formed under different process-related preheating temperatures. For this purpose, a reduced order model is presented for the purpose to calculate the macro temperature, which is the temperature before the next exposure. The macro temperature is correlated with mechanical properties (hardness) and the formed microstructure. The macro temperature model is for coarse scale at the component level and is validated in this work with a high-fidelity resolution model, which is itself verified with experimental thermocouple measurements [4,5].
The scope of this work is to calculate and correlate the macro temperature with resulting mechanical properties—identifying critical temperatures and holding times for certain solid–solid phase changes, and presenting a simulation tool for further uses and more complex geometries.
The following sections first describe the test specimens used and the experimental procedure. Then, the numerical models, the macro temperature model for calculating the preheating temperatures and the melt pool model for determining cooling rates are described. Finally, the results are presented and discussed.

2. Methods and Approach

2.1. Processing and Characterization Techniques

The aim of this study is to investigate the effect of process-inherent preheating on the mechanical properties of parts manufactured by PBF-LB/M. For this purpose, two conical shaped specimens (cf. Figure 1) are additively manufactured using a commercial PBF-LB/M system with a reduced build volume (e.g., Aconity Mini) and investigated. Two oppositely oriented truncated cones are chosen as test specimens to be able to investigate the effects of heat accumulation. The truncated cone geometry has a small diameter of d 1 = 1.5 mm, large diameter d 2 = 35 mm and a height of h c = 33.5 mm. Heat accumulation is to be expected for the cone, whose cross-sectional area decreases towards the substrate plate since heat dissipation in the process primarily takes place in this direction. This specimen, hereinafter referred to as C v in analogy to a V-shaped cone, is built up from the small to the large diameter, and the second specimen C A is mirrored to the substrate plate.
For this work, the process parameters are adopted from Verhülsdonk et al. [4]. The specimens are fabricated with contour hatch exposure, layer-by-layer rotation of the scan vectors, and optimized process parameters (Table 1) derived from preliminary studies for the fabrication of dense bulk structures (ρ > 99.9%). A more detailed description of the test specimens and the experimental manufacturing process is given in [4]. The simulation parameters are defined in analogy to the experimental values and further described in Section 2.2.3.
The material used in this study is Inconel 718 (IN718). IN718 is a high-strength nickel-iron-chromium alloy that is resistant to corrosion and oxidation. Due to its low aluminium and low titanium content, the material IN718 exhibits good weldability compared to other nickel-based alloys and is predestined for processing by PBF-LB/M, which is comparable to a certain extent to continuous welding processes. By suitable selection of the process parameters, a density approaching 100% can be achieved, with only minimal defects occurring [6]. The hardness of additively processed IN718 is in the range of about 30 HRC/300 HV. The liquidus temperature of a common alloy composition of IN718 is 1336 °C. The solidus temperature, below which complete solidification of the microstructure occurs, is 1260 °C. Typical applications of the alloy are, for example, aerospace engineering or turbomachinery construction, where the material is used in the environment of combustion reactions at up to 60–80% of the melting temperature. The composition of the powder used in this study is within the standard composition range specified for IN718 powder by the supplier EOS GmbH [4]. The mean particle size of the IN718 powder is D50 = 30 µm.
After processing and removal from the substrate plate, an analysis of the mechanical properties of the cones is conducted by measuring the Vickers hardness according to ISO 6507-1 on the cross-sections of the cones in as-build state (Figure 1b). Deliberately, no heat treatment is carried out (as usually after PBF-LB/M) in order to be able to examine the effect of the process-inherent heat treatment. Vickers hardness (HV0.1) is determined by measuring the diagonals of an indentation formed after loading the specimen with a pyramid-shaped diamond indenter under a specified test load. The length of the diagonals is recorded optically, and afterwards, the hardness is determined using a table. The hardness was determined at intervals of 1 mm along the build height, and the mean value and standard deviation were determined layer by layer from multiple measurements.
After measuring the hardness, a microstructural analysis of the cones is performed. The cross-section of a central area of the cones is examined using a scanning electron microscope. The micrographs of the transverse sections at different magnifications for the A-cone and the V-cone are investigated. The secondary phase is made visible by etching in an alcoholic solution.

2.2. Model Description of PBF-LB/M Macro Temperature Model

In this work, we focus on the macro temperature scale. The goal is to estimate the temperature before the exposure of the consecutive layer, thus yielding a good estimate of the process inherent preheating temperature. Since the macroscopic approach aims at achieving trade-offs between model accuracy and computation time, a complete physical description of the process phenomena is not feasible, which implies that various simplifications are implicitly assumed. The assumption is made that the solidification conditions are strongly influenced by the local preheating temperature due to the hyperbolic nature of heat conduction equation. Additionally, the knowledge of the macro temperature allows a rough estimation of the susceptibility to distortion of a certain volume of the part, as this is proportional to the difference between melting temperature and chamber temperature. In order to reduce the computational effort, the macro temperature model is based on a multilayer approach: multiple physical layers with typical layer heights between~10–100 µm are combined into a numerical layer, which is exposed n e x p -times and alternated with the same amount of laser-inactive cooling steps. In order to obtain a reliable temperature profile in dependency of the component shape, both the part and the substrate plate are modelled, resulting in a computational domain 3 . Due to the heat conduction conditions together with the assumption of a moderately placed component density in the building space, it is not necessary to integrate the solution over the entire substrate plate, as most of the heat is conducted into the negative z -direction in this case. The size of the substrate plate in the x y direction is therefore chosen to be slightly larger than the projection of the component. The powder is not modeled with finite elements in this approach but is considered within the boundary conditions of the part and substrate.

2.2.1. Governing Equations and Boundary Conditions

In the modelling of the thermal budget of the PBF-LB/M process, the heat transport due to the heat supplied by the laser radiation to the powder particles and the substrate performs the key role. The model considers the heat equation is for the boundary conditions defined by the PBF-LB/M process in a commercial machine where the heat input to the system can be described by the simplest form of the heat equation:
c p ρ T t + ( k T ) = Q
Here, T is the current temperature, t is the time, ρ , c p , and k are the material-specific quantities density, specific heat capacity and thermal conductivity and Q as the surface heat source. For a detailed physical description of the thermal processes, boundary conditions must be assumed for this equation, which is linked to the process conditions at hand. A two-dimensional resolution of the heat source is, for this reason, modelled in this approach.
During exposure ( b L a s e r = 1 ), the cut top surface A t o p of the part is heated by the laser radiation. The heat input q L for the top surface follows:
q L = A t o p α P L h d v S Δ t i , b 1 d A ,
where α is the material state dependent absorptivity, P L is laser power, h d is hatch distance, v S c a n is scanning speed, and Δ t i , b 1 is the time during exposure. The timestep Δ t i , b 1 size is calculated in dependence on the process parameters hatch distance h d and scanning speed v s for the current layer i . At the surface, a conductive heat transfer term q v describes the cooling by the shielding gas flow describing as:
q v = h c ( T s u r f ( x , y , z ) T 0 )
where h c as the convective heat transfer coefficient and T s u r f as the surface temperature. An initial heating of the substrate plate and the powder layers with T p r e h e a t = 80 °C is assumed, the ambient temperature T 0 during PBF-LB/M is defined as 20 °C. The initial temperature condition at time t 0 is a uniform temperature distribution:
T x , y , z , 0 = T p r e h e a t x , y , z
The bottom side of the building plate is taken to be constant and equal to the preheating temperature T p r e h e a t . The walls of the substrate plate in perpendicular direction to the build directions are modelled as thermally insulating. On the top side of the substrate plate, the contact with the powder is considered and, therefore, is treated in the same way as the lateral surfaces of the component. The heat transfer from the side surface, thus both from the part and from the top of the substrate plate, into the powder surrounding the part depends for each time step only on the thermal properties of the powder.

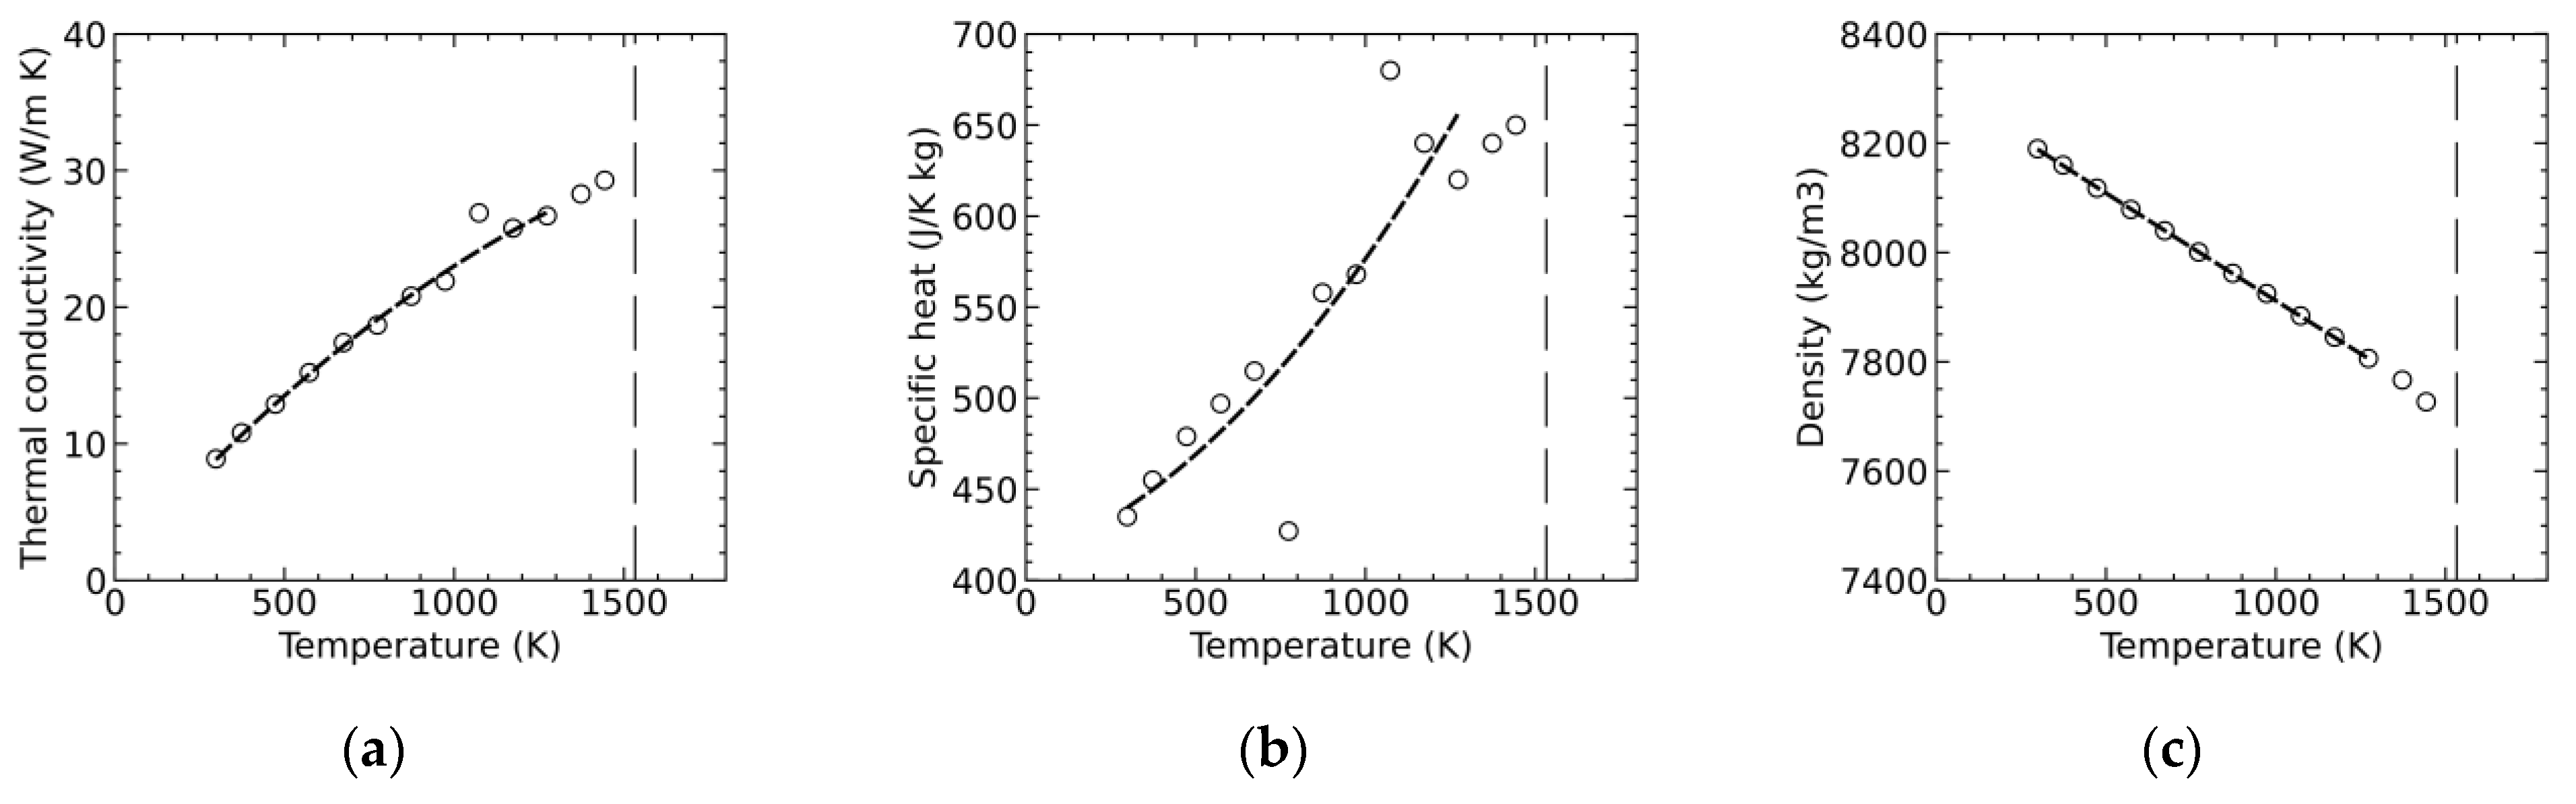
2.2.2. Material Properties

The material properties are modelled as temperature-dependent and are calculated before exposing a layer with the laser based on the preheating temperatures in the previous layer. The material properties are calculated for the solid-state region up to a temperature of 1230 °C; higher preheating temperatures are not considered, the material properties are used as constant. The material constants for the solid-state region according to [7] were considered, which can be taken from Figure 2. The heat conduction from the component into the powder is set to be 1%, the density ρ p o w d e r and the specific heat capacity c p , p o w d e r are assumed to be 50% and 100% of the solid material properties, respectively [8]. It is also expected that the powder temperature does not increase significantly and can be assumed to be constant.

2.2.3. Numerical Setup

The macro temperature model described calculates the temperature as a function of the build-up time and is used to estimate preheating temperatures after powder application and before the next exposure. The preparation of the CAD geometries, including meshing, was performed in Gmsh [9], an open-source finite element mesh generator and the simulative implementation was completed in FreeFEM [10], an open-source differential equation solver.
The mesh generator used cannot generate a regular mesh with tetrahedra, as the thermal model requires. In order to limit the size of the elements in the z-direction (building direction) and to avoid overlapping of elements in the planes proportional to the thickness of the layers, the geometry has been intersected into slices with a numerical layer height. This ensures that no finite elements intersect the plane of the current active numerical layer. Therefore, a cutting of the finite elements during the build-up process is not necessary, and the mesh resolution does not have to be adapted locally. The numerical layer height is chosen to be 10 times of the real layer height (30 µm). The geometries are positioned on a virtual substrate plate with the dimensions 75 × 90 × 10 mm (x, y, z). The meshing of components and substrate plate is performed with a total of 385,663 finite element cells. The parameters P L , v S c a n , and h d are defined in analogy to the experimental values and can be taken from Table 1. The time for recoating is 4 s.
All elements above the top layer height of the mesh are deactivated for the calculation to reduce the computational time of the solution. After activating a new layer, the total heating time for the current layer is determined according to Equation 2 using the parameters laser speed, hatch distance, and scanning speed. Following the planar heating on the surface, a second calculation cycle is performed for the layer based on the recoating time. Additional holding times are estimated to be 10% of the recoating time and are added to the cooling cycle. The numerical simulation of the described geometries took about 75 min with n e x p = 2 exposures per layer. The model runs on a single core on a workstation with an Intel Xeon Gold 5220 processor at 2.20 GHz.

2.2.4. Reference Thermal Model

For purposes of validation, data from a numerical model that spatially resolves the heat input due to the scan vectors are available to represent both the short and long-time scales [5]. This model is validated against experimental results where temperature sensors were used [4].

2.3. Melt Pool Simulation Model

In order to estimate the effect of the process’s inherent preheating conditions on the melt pool formation (size) and solidification conditions, well established melt pool simulations are run. The susceptibility of experimental approaches is high since, for example, melt pools with similar surface temperatures at the top surface can have significantly different shapes below the surface, resulting in different cooling rates at different locations of the melt pool [11]. Therefore, a melt pool simulation is performed to evaluate the influence of different preheating temperatures on the solidification conditions and melt pool geometry.
In the thermal simulation, the quasi-stationary state of a single-track during exposure to the laser is simulated, for which the melt pool geometry and temperature is assumed to be constant over time. The thermal simulation model is based on the principle of the finite element method (FEM), where the modelling of the melt pool is a free boundary problem whose solution is based on the integration of the time-dependent heat conduction equation. A more detailed description of the applied PBF-LB/M model is given by [6].
The input parameters are the process parameters laser power P L and scan speed v S c a n , the preheating temperature T p r e a h e a t , and the temperature-dependent material properties in analogy to the description in the macro-temperature model. The laser beam is described by a gaussian beam profile of a typical PBF-LB/M system in the processing plane (beam diameter d s = 84 μm, edge steepness n = 2). In addition to a basic absorption determined in preliminary tests, an increased effective absorption with increasing melt pool depth is assumed. In this way, reflections within the melt pool are considered, which are observed in the PBF-LB/M at high beam intensities (deep welding) and a consequent formation of a vapor capillary (so-called keyhole). To model the formation of a keyhole, it is assumed that the material reaching the vaporization temperature ( T e v a p = 3200 °C) is transparent to the laser radiation. The solidus temperature, below which complete solidification of the melt occurs, is T s o l i d u s = 1260 °C. The result of the simulation is a transient three-dimensional temperature distribution of the melt pool. The cooling rate perpendicular to the 3D liquidus surface on the isotherm of T s o l i d u s is calculated as:
= G · v S o l = T x 2 + T y 2 + T z 2 · v S c a n cos α ,
where G is the thermal gradient and v S o l the solidification velocity. T represents the temperature, x , y , a n d   z the cartesian coordinates, and α the angle between the normal on the isotherm of the solidus temperature and the scan direction.

3. Results and Discussion

The results are divided into four sections. First, the experimental results for the Vickers hardness of the additively manufactured cones are presented. Then, the microstructure analysis is performed to discuss the differences between the cones and correlated to the hardness measurements. Next, the novel macro-temperature model is validated and used to estimate the process-inherent preheating temperatures for the two cone samples at the points that have been previously investigated experimentally. Based on this, the relationship between the mechanical properties and microstructure to the predicted preheating temperatures can be discussed. Finally, an estimation of the cooling rates based on the different preheating temperatures using a single-track model for the melt pool in PBF-LB/M is carried out to evaluate the effect on the solidification condition caused by process-inherent preheating.

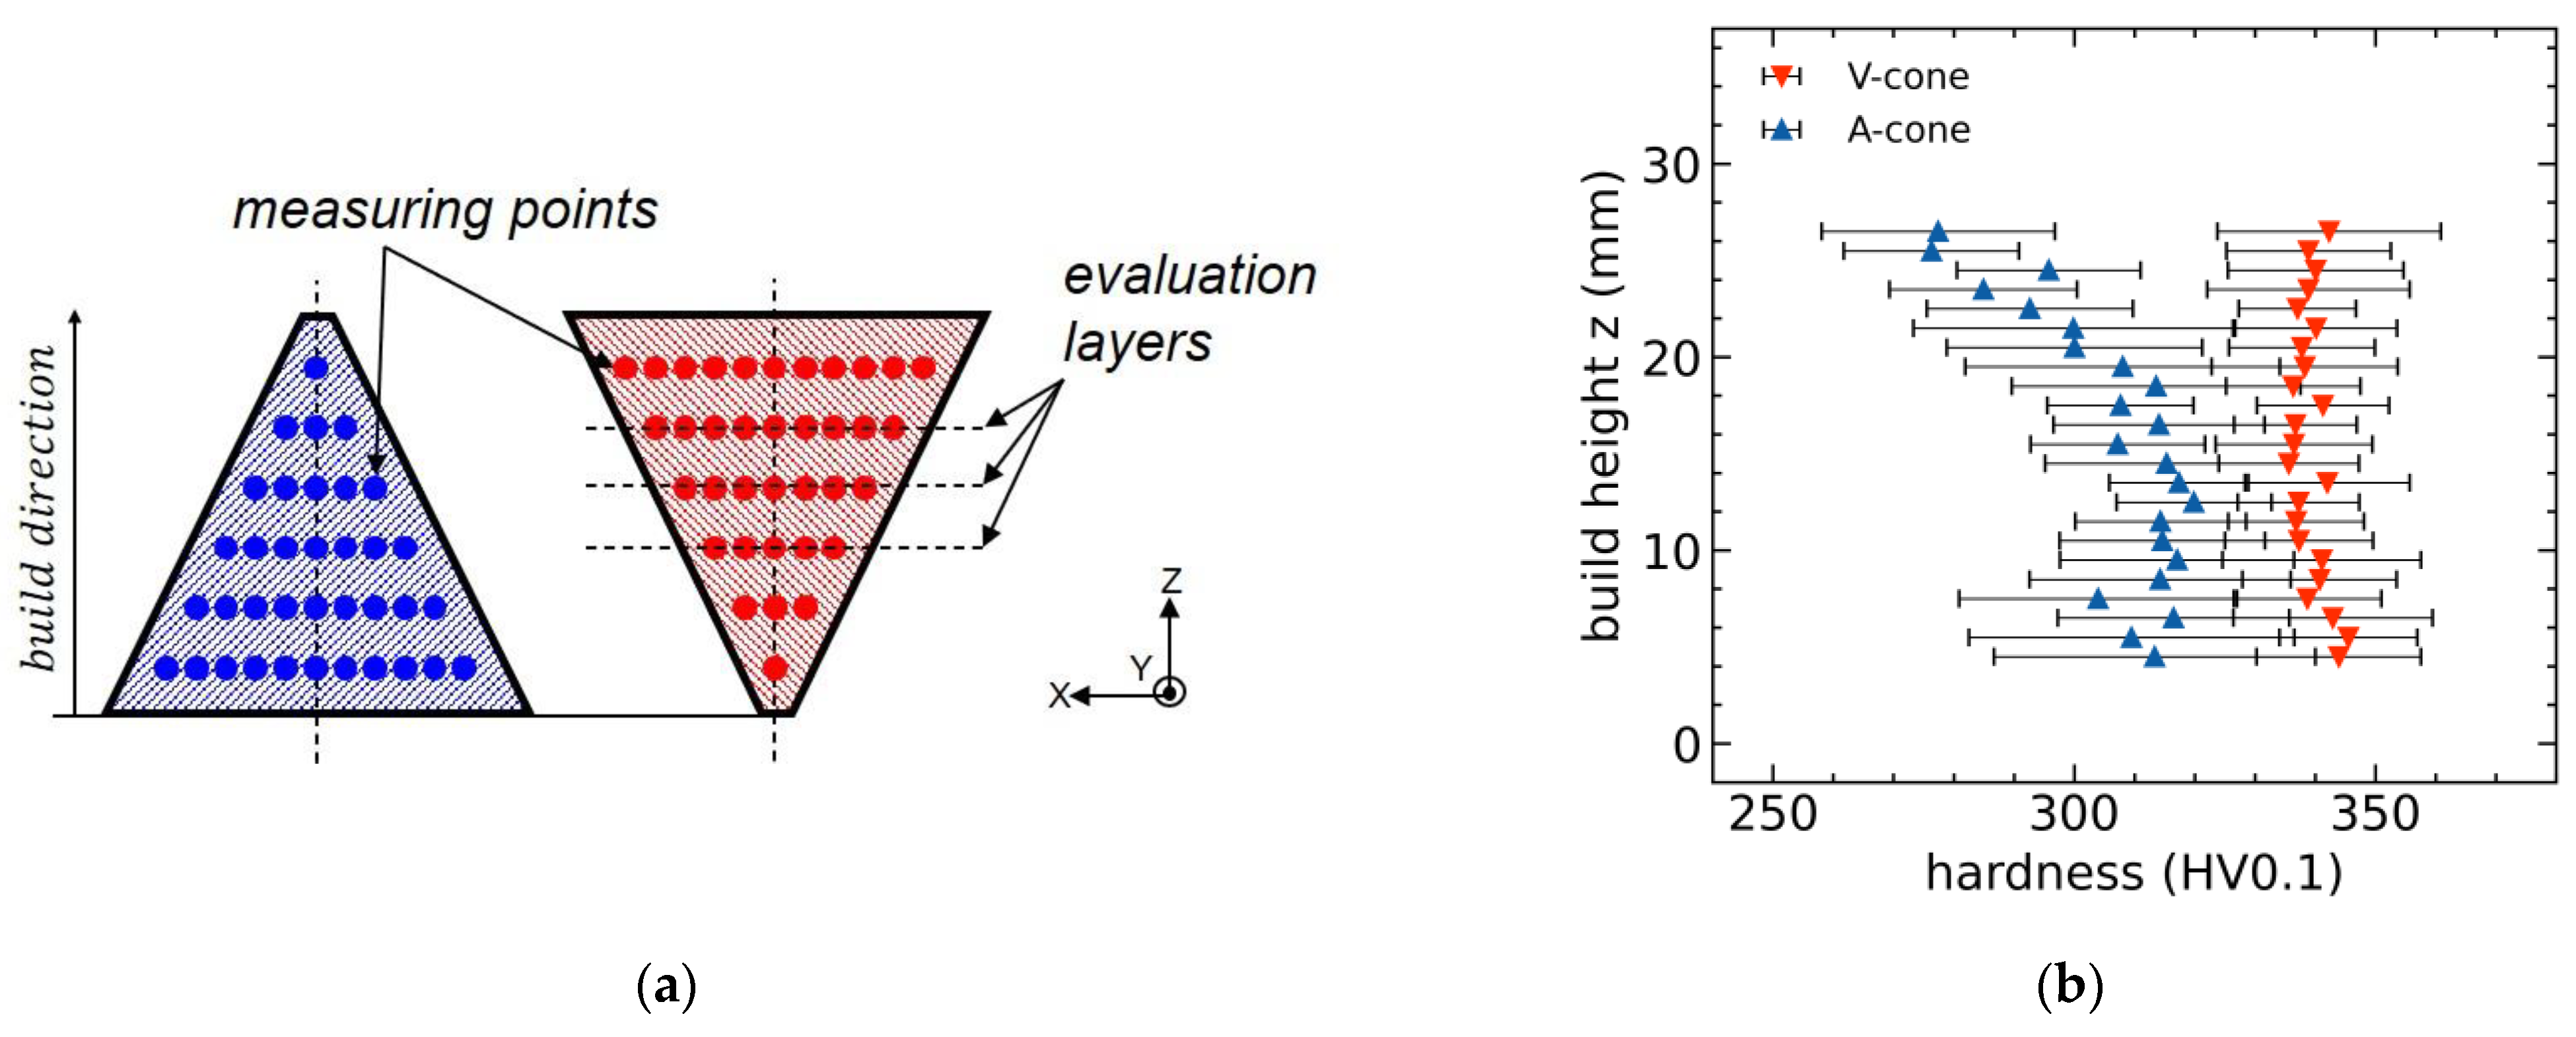
3.1. Analysis of Microhardness

For the hardness measurement, the cones were divided into two halves parallel to the build direction. The measuring points are selected on the cross-sectional area at different build heights, whereby the number of measuring points varies due to the shape of the truncated cylinder. The evaluation is carried out on different layers, which is schematically illustrated in Figure 3a.
Figure 3b shows the result of the Vickers hardness measurements. No values for the lowest build heights (below 4.5 mm) of the cones could be recorded due to the necessary separation of the specimens from the substrate plate. The mean and standard deviations are determined layer by layer from several measurements, the number of which correlates with the width of the cone at the respective height. The number of measuring points for the C A specimen decreases from an initial 25 measuring points at z = 4.5 mm over the build height to a minimum of 5 measuring points at z = 26.5 mm. Correspondingly, the number of measuring points for the C v specimen increases with the build height, from an initial 9 measuring points at z = 4.5 mm to 31 measuring points at z = 26.5 mm.
The experimental results show a higher overall hardness for the V-shaped cone C v with a mean value of 339 ± 14 HV in comparison to a mean value of 310 ± 22 HV0.1 for C A . This is in the range of technically well-knows values of about 30 HRC/300 HV (compare Section 2.1). In addition to that, the layer-wise visualization of the hardness indicates that the difference in hardness between the cones increases with increasing height. This is attributed to a heat accumulation and consequently slower cooling for C v , which is assumed to promote the formation of y’(‘) precipitates and, therefore, higher hardness for the V-shaped cone.

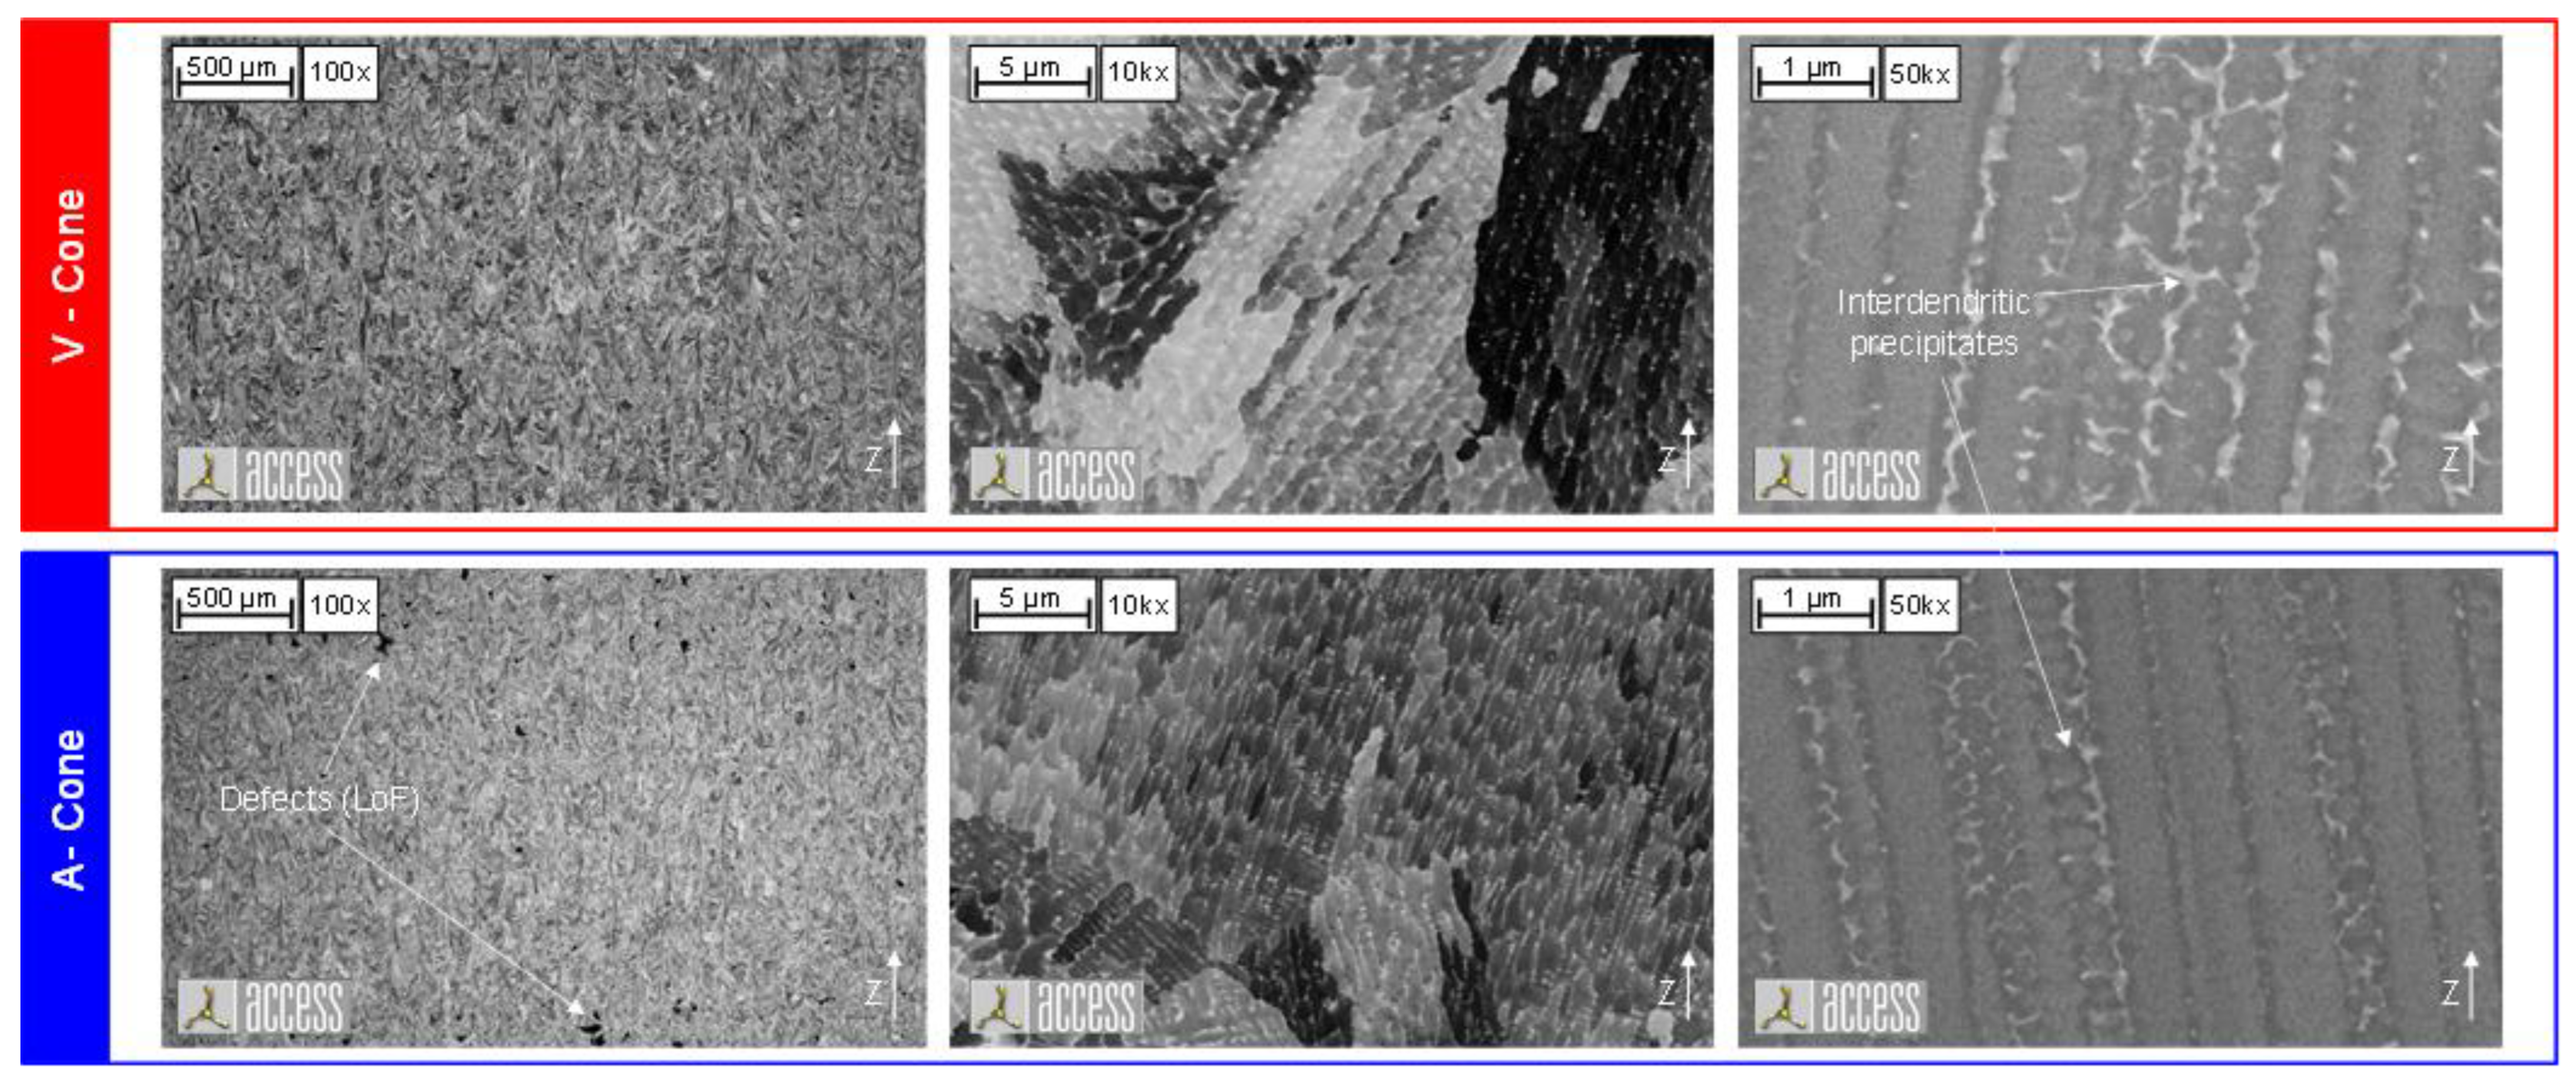
3.2. Analysis of Microstructure

To further investigate the inhomogeneous mechanical properties in the specimens, a microstructure analysis is performed. From the micrographs (cf. Figure 4, 100× magnification), a typical defect phenomenon known for LPBF can be seen (typically referred to as Lack of Fusion (LoF)) [12]. This occurs when, during melting of the powder, no complete fusion metallurgical bond can be achieved with adjacent tracks and layers. The observed solidification structure consists of filigree columnar dendrites (γ-phase) with widths of a few µm and is, for the most part, very similar for the A-cone and for the V-cone. At the highest magnification, the formation of interdendritic phases, presumably alloy typical Laves, δ, NbC, or TiN of the order of a few nm is evident. Qualitatively, a larger proportion of interdendritic phase fractions can be observed in the SEM images of the V-cone. No definite statement can be made about the composition of the interdendritic phase detected without an additional phase determination. Most likely, it is mainly Laves phase, which forms from the last solidifying melt at high Nb-concentrations (beyond 20%) [13]. This phase commonly forms during solidification of IN718, dissolves during subsequent heat treatment and provides for the high strength of the IN718 superalloy through the subsequent precipitation of nano-fine γ″ or γ′/γ″ particles through the mechanisms of precipitation hardening and solid solution strengthening [14,15]. Even if rapid cooling might suppress melt segregation, Laves phase formation has been observed under the non-equilibrium solidification conditions of PBF-LB/M [16,17]. Qualitatively, slightly coarser dendrites and a larger proportion of presumably Laves phase can be seen in the case of the V-cone. This observation is in accordance with the literature, where, e.g., Kumara et al. [18] found both lower cooling rates (cf. Section 3.5) and temperature gradients being beneficial for increased Laves-phase formation. In combination with the assumption derived from hardness measurements that the heat treatment-like process conditions during build of the V-cone promote γ′/γ″-formation from Laves, this seems even more plausible.
In the SEM image with the lowest magnification, the sample area is imaged from the centre of the test geometries in an area of 2.25 × 3 mm. Within this area, no change in the width or height of the microstructure image can be seen. Therefore, it can be claimed that the microstructure behaves comparatively homogeneously in this range. No statement can be made about the entirety of the samples based on the available data. From the hardness measurements, it can be concluded that the proportion of Laves phase precipitates should decrease with the height of the A cone, analogous to the decrease in hardness.

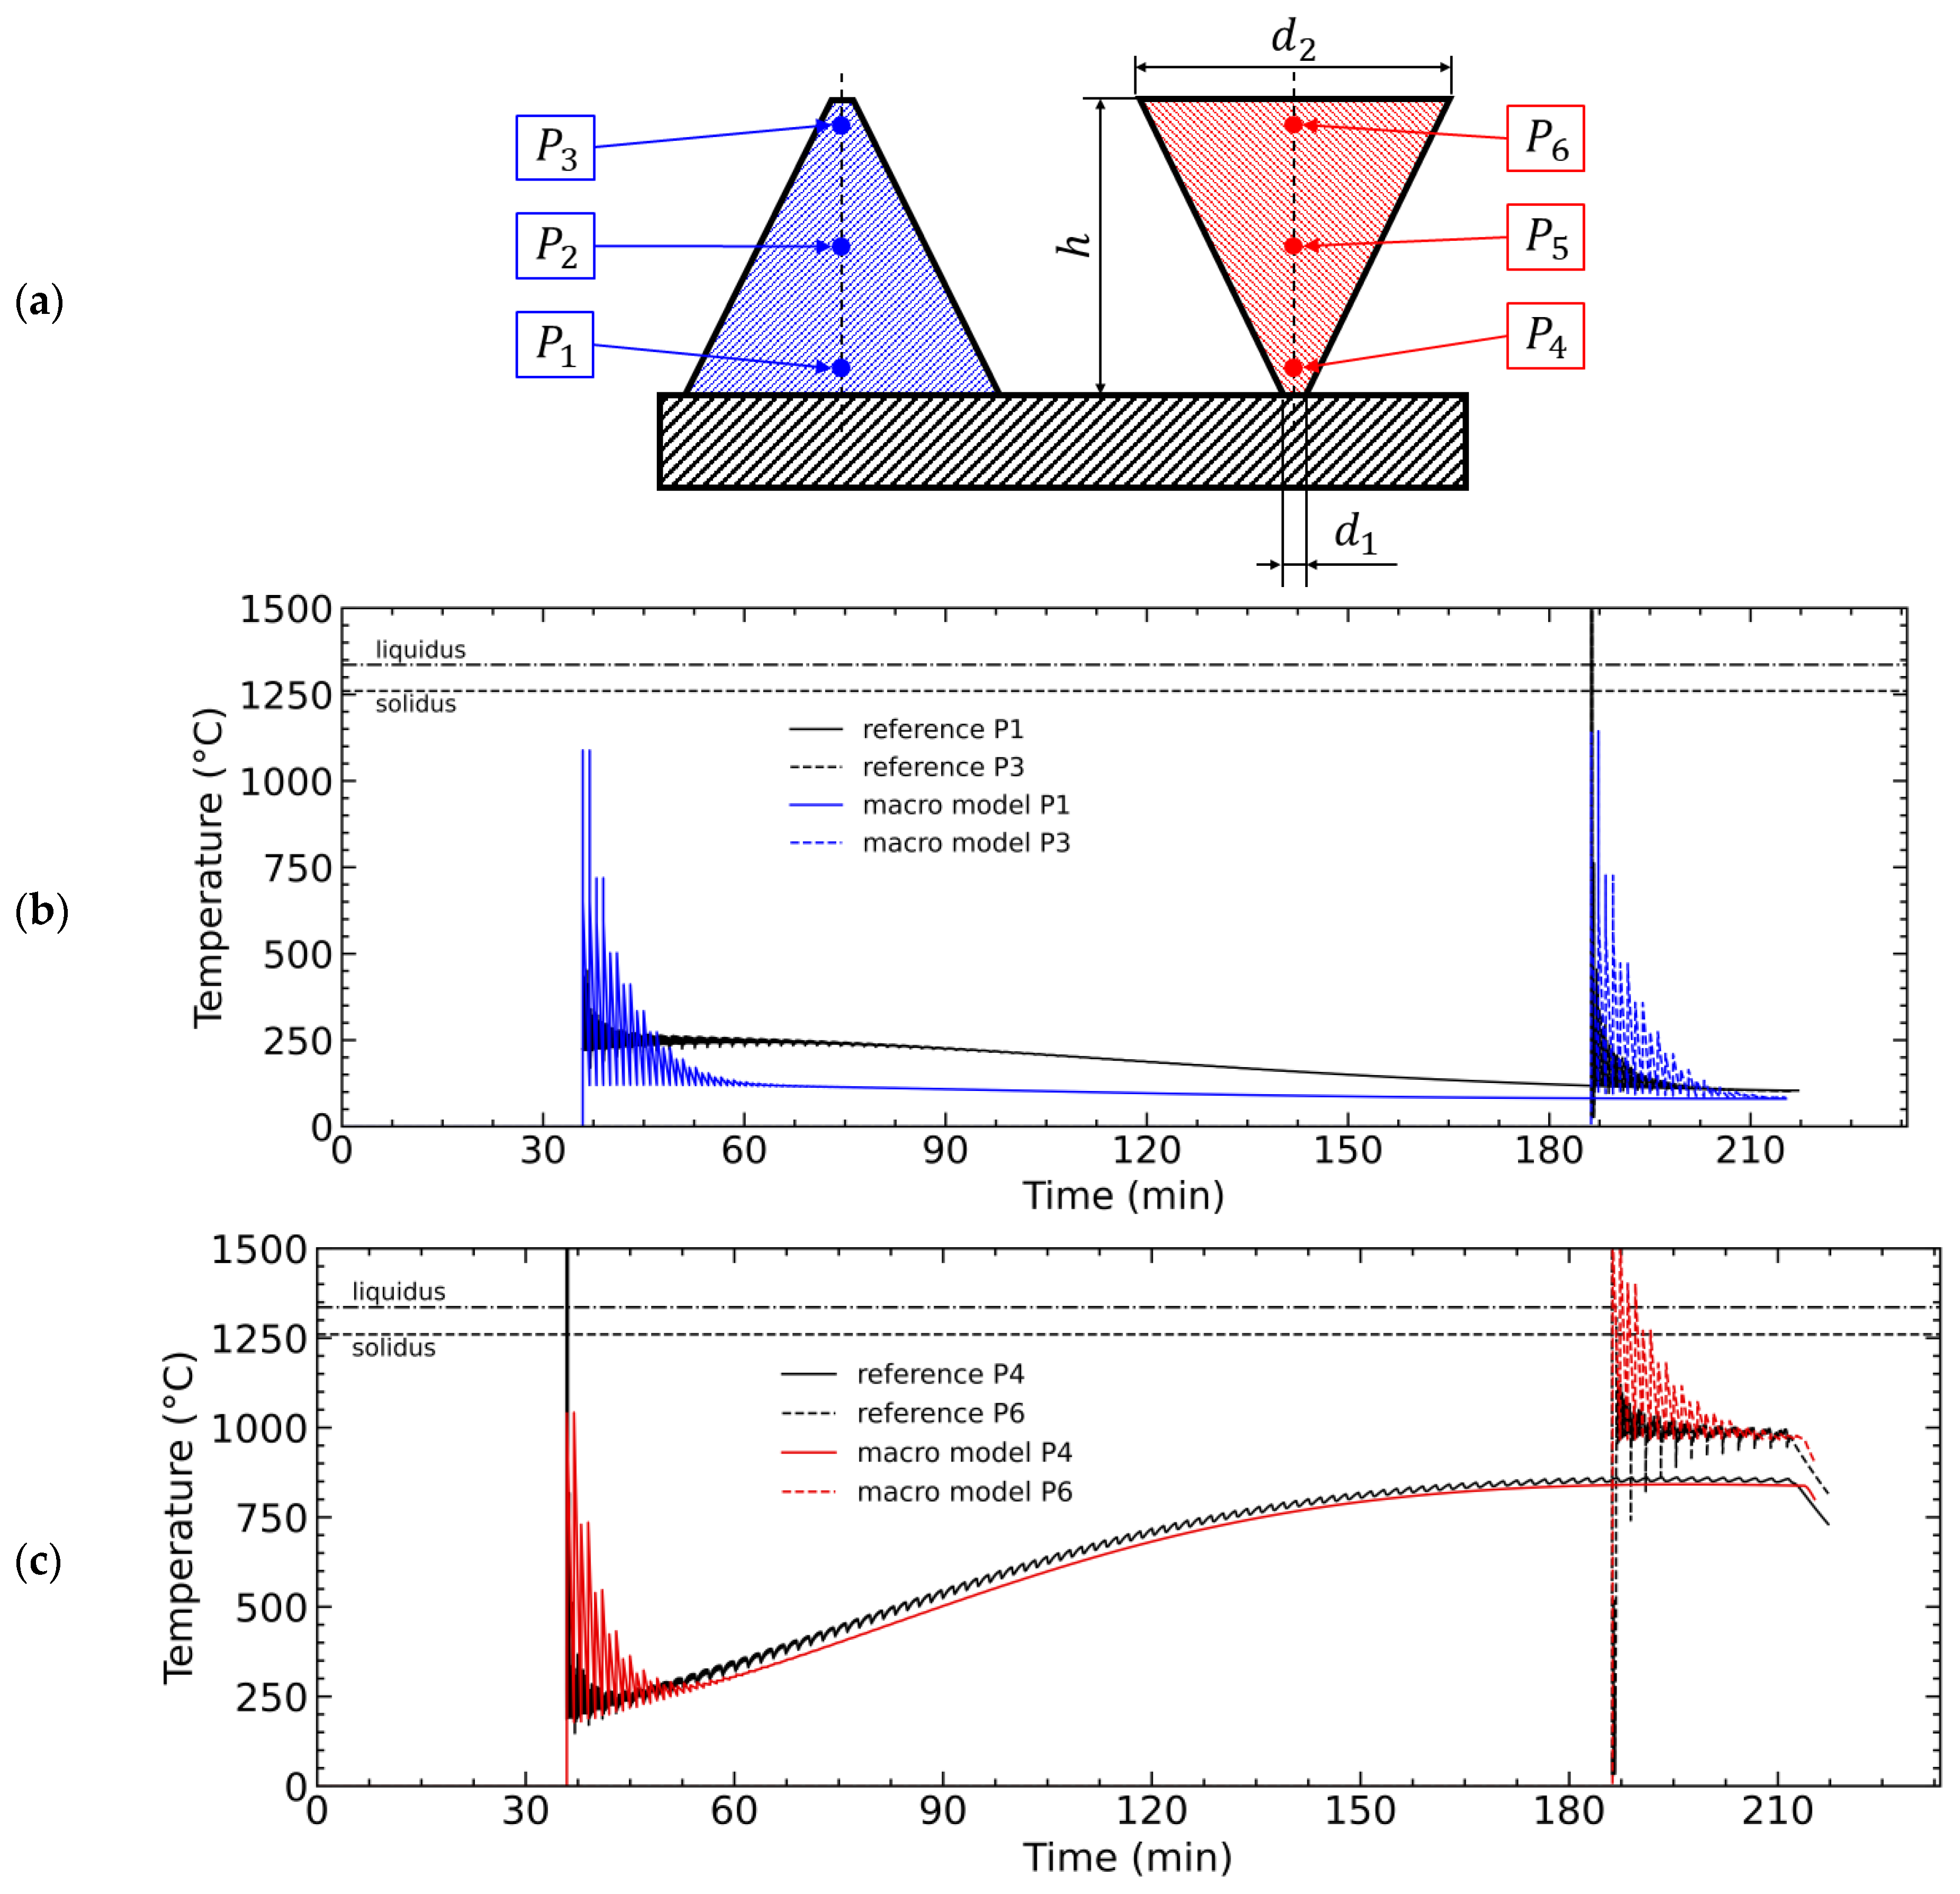
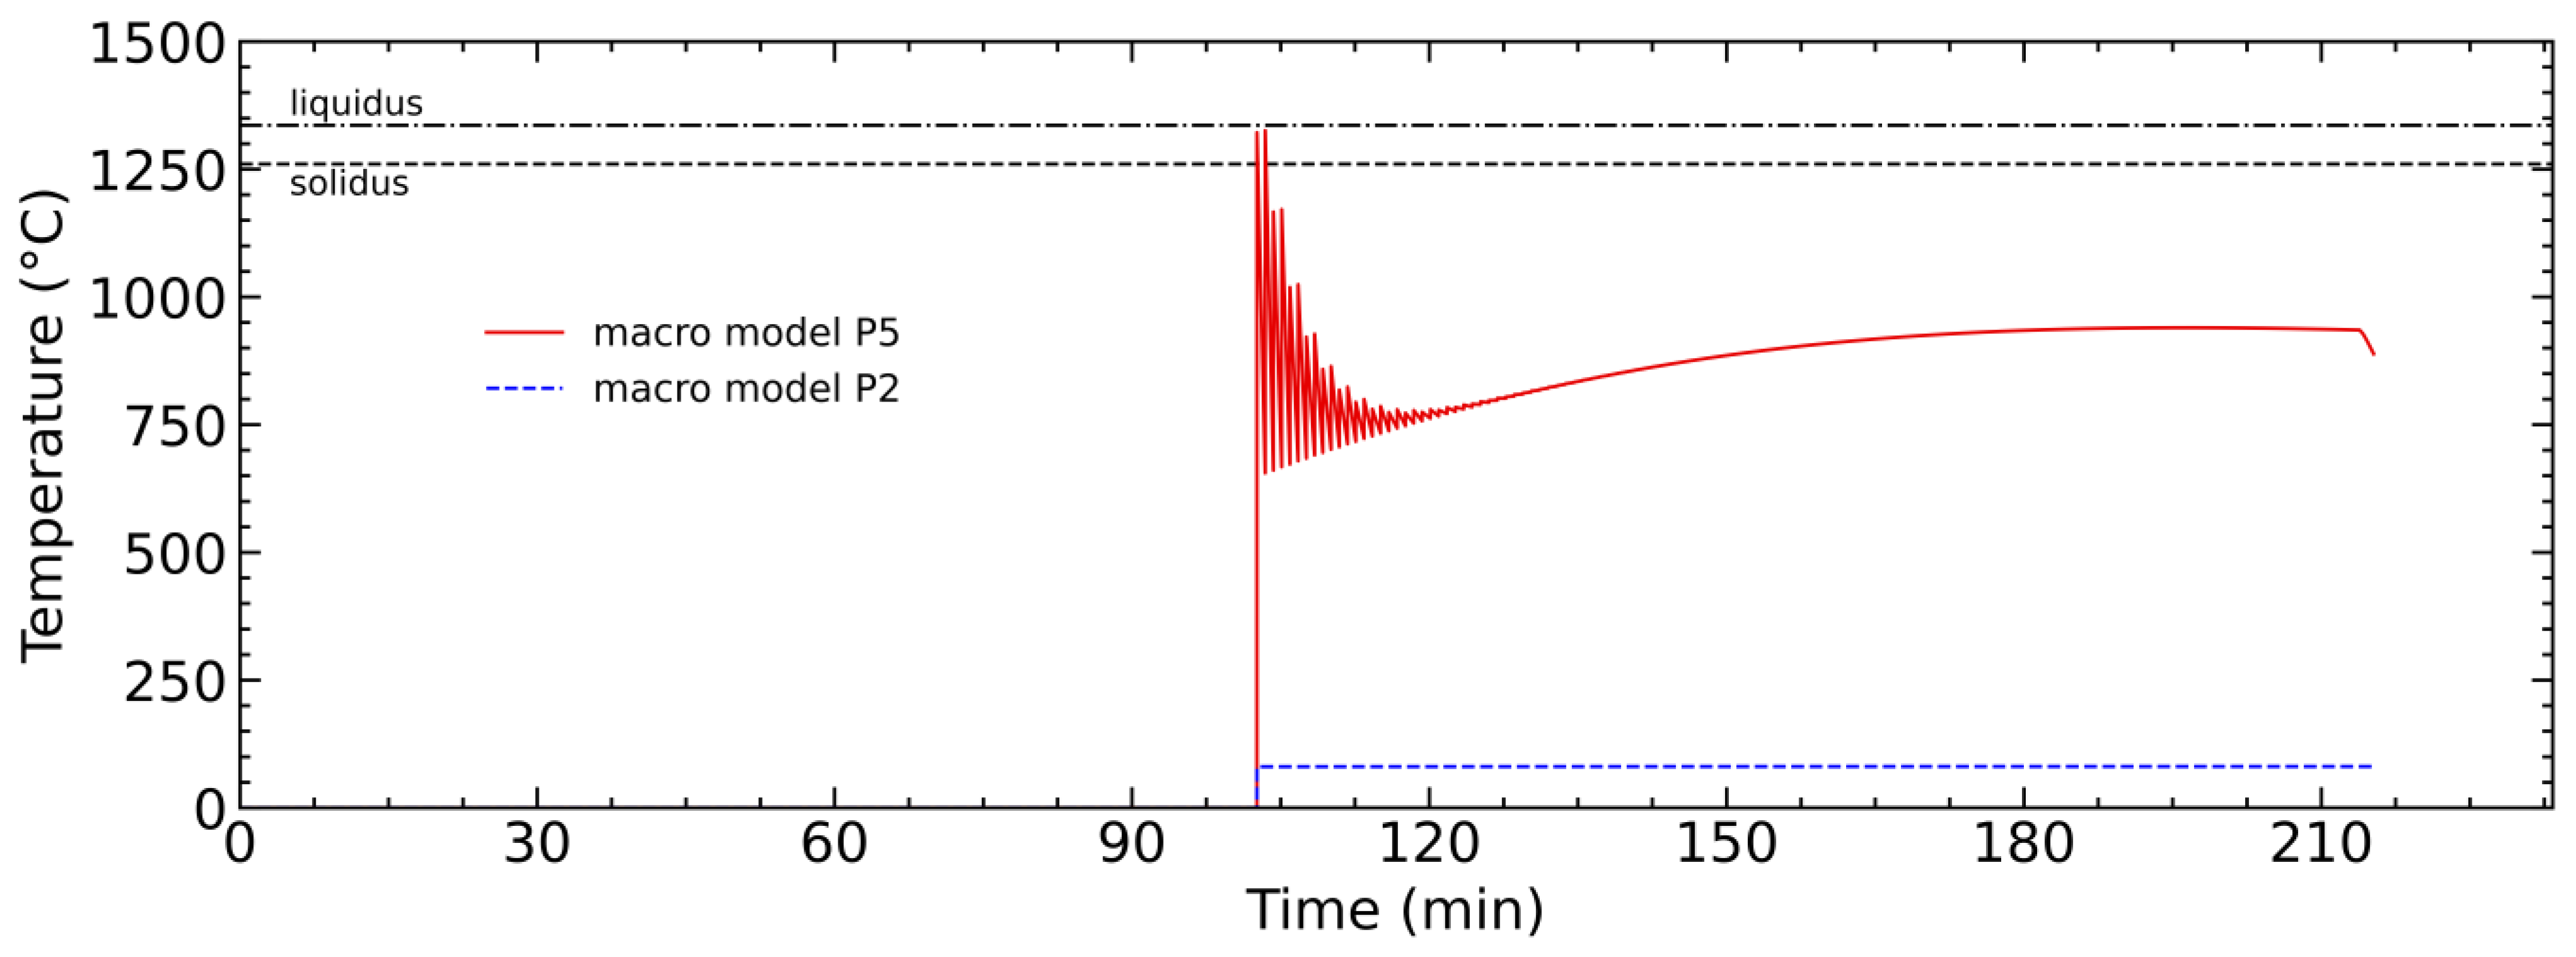
3.3. Validation of the Macro Temperature Model

Typically, the thermal history for AM manufactured components must be mapped on different time scales, one global resolution on a part scale level in the order of hours and the other local to the area of the melt pool with a magnitude in the range of milliseconds. With the described model, the local time scale is not considered due to the layer-wise exposure. Therefore, an approximation of the temperature history on the component scale is performed to identify preheating temperatures in the component layers. The output of the numerical model is the thermal history for the entire part geometry.
With increasing build height, a clear heat accumulation can be observed in the V-cone. The maximum preheating temperature in relation to the ambient temperature is 951 °C. Here, the temperature at the time before the next layer is exposed has been used, resulting in a certain uniformity of temperature in the uppermost surface layer. For further validation, three points have been defined in each cone. These points are located on the central axis of the cones at the build-up heights of 5 mm, 16.5 mm, and 30 mm (cf. Figure 5a).
Figure 5b,c show the temperature plots for the points of interest P 1 and P 3 (A-cone) and P 4 and P 6 (V-cone) for the reference numerical model and the macro model. This illustrates the influence of the total energy input in relation to the geometry and build-up time. The trend of the points P 1 in Figure 5b illustrates that due to the tapering geometry, the energy input in the next layer is always lower than in the current layer, and at the same time, the heat dissipation into the substrate plate is high due to the ratio of the decreasing exposure area compared to the cross-sectional area to the substrate or the cross-sectional volume below the current layer. Approximately 30 min after the layer has been built up with P 1 , the preheating temperature begin to decrease. Therefore, it must be noted that a small channel is designed in the A-cone for the insertion of a thermocouple. This channel has a height of approx. 4.6 mm and a width of approx. 4 mm and becomes pointed towards the top from a height of approx. 1 mm, with the result that the cross-section resembles a house with a roof. This channel is not included in the numerical model. Since P 1 is located only about 1 mm above the channel, it is assumed that this leads to a heat accumulation in this point and, therefore, causes the large deviation between both simulation models at point P 1 .
Figure 5c shows the temperature profiles of points P 4 and P 6 in the V-cone. Accordingly, it can be seen from Figure 5a that the temperature in the cone increases over the building time. The effect of the heat accumulation can be well observed in P 4 . After approx. 188 min, a temperature plateau is reached, with a temperature increase of approx. 820 °C compared to the environmental temperature of 20 °C. As the build-up height increases, the local preheating temperature also increases over the layers. Before the layer with P 4 is exposed, the preheating temperature in the previous layer is approx. 966 °C. The temperature increase in the A-cone can be explained by the previously described relationship of the cross-sectional area change of the layers to the height. It must thereby be considered that the heat transfer from the cone into the powder is small compared to the heat conduction from the cone into the substrate. Here, the circular surface of the A-cone connected to the substrate with d 1 = 1.5 mm cannot dissipate enough heat. Furthermore, it should be noted that the ratio of the two cone areas in each layer is decisive for the waiting times, these being cooling times. These cooling times must be added to the recoating time so that the inter-layer time increases. Observations show that a shorter interlayer time leads to a significant increase in heat accumulation when the cross sections per layer remain to be equal [19,20].

3.4. Prediction of the Process-Inherent Preheating Temperature Profiles

The preheating temperatures are evaluated for the defined points P 2 (A-cone) and P 5 (V-cone) according to Figure 5b,c. The preheating temperature is determined halfway through the build-up of the cones in the layer after the exposure and cooling cycles have been completed. Figure 6 shows the temperature curve of these points plotted over the building time. The developed model illustrates a process-inherent preheating in agreement with the expectation to be inferred from the geometry. The preheating is determined to be T p r e a h e a t , P 5 = 700   ° C in the centre of the specimen, C v , and T p r e a h e a t , P 2 = 81   ° C for C A .
These results support the observations and considerations from Section 3.2, following the observations by Rielli et al. [21], even short dwell times above the γ′/γ″-formation temperature of approx. 600–900 °C are sufficient to initiate significant precipitation of said phases, especially as these tend to form at dislocations, which are present in AM microstructures in particularly high density. However, it is stated by the same authors that the expected size of γ′/γ″ formed under these conditions might be well below 5 nm and, thus, below the detection limit of SEM. Additionally, the pre-existence of Ti and Nb binding Laves-phase might also hinder γ′/γ″ precipitation so that no clear statement is possible.

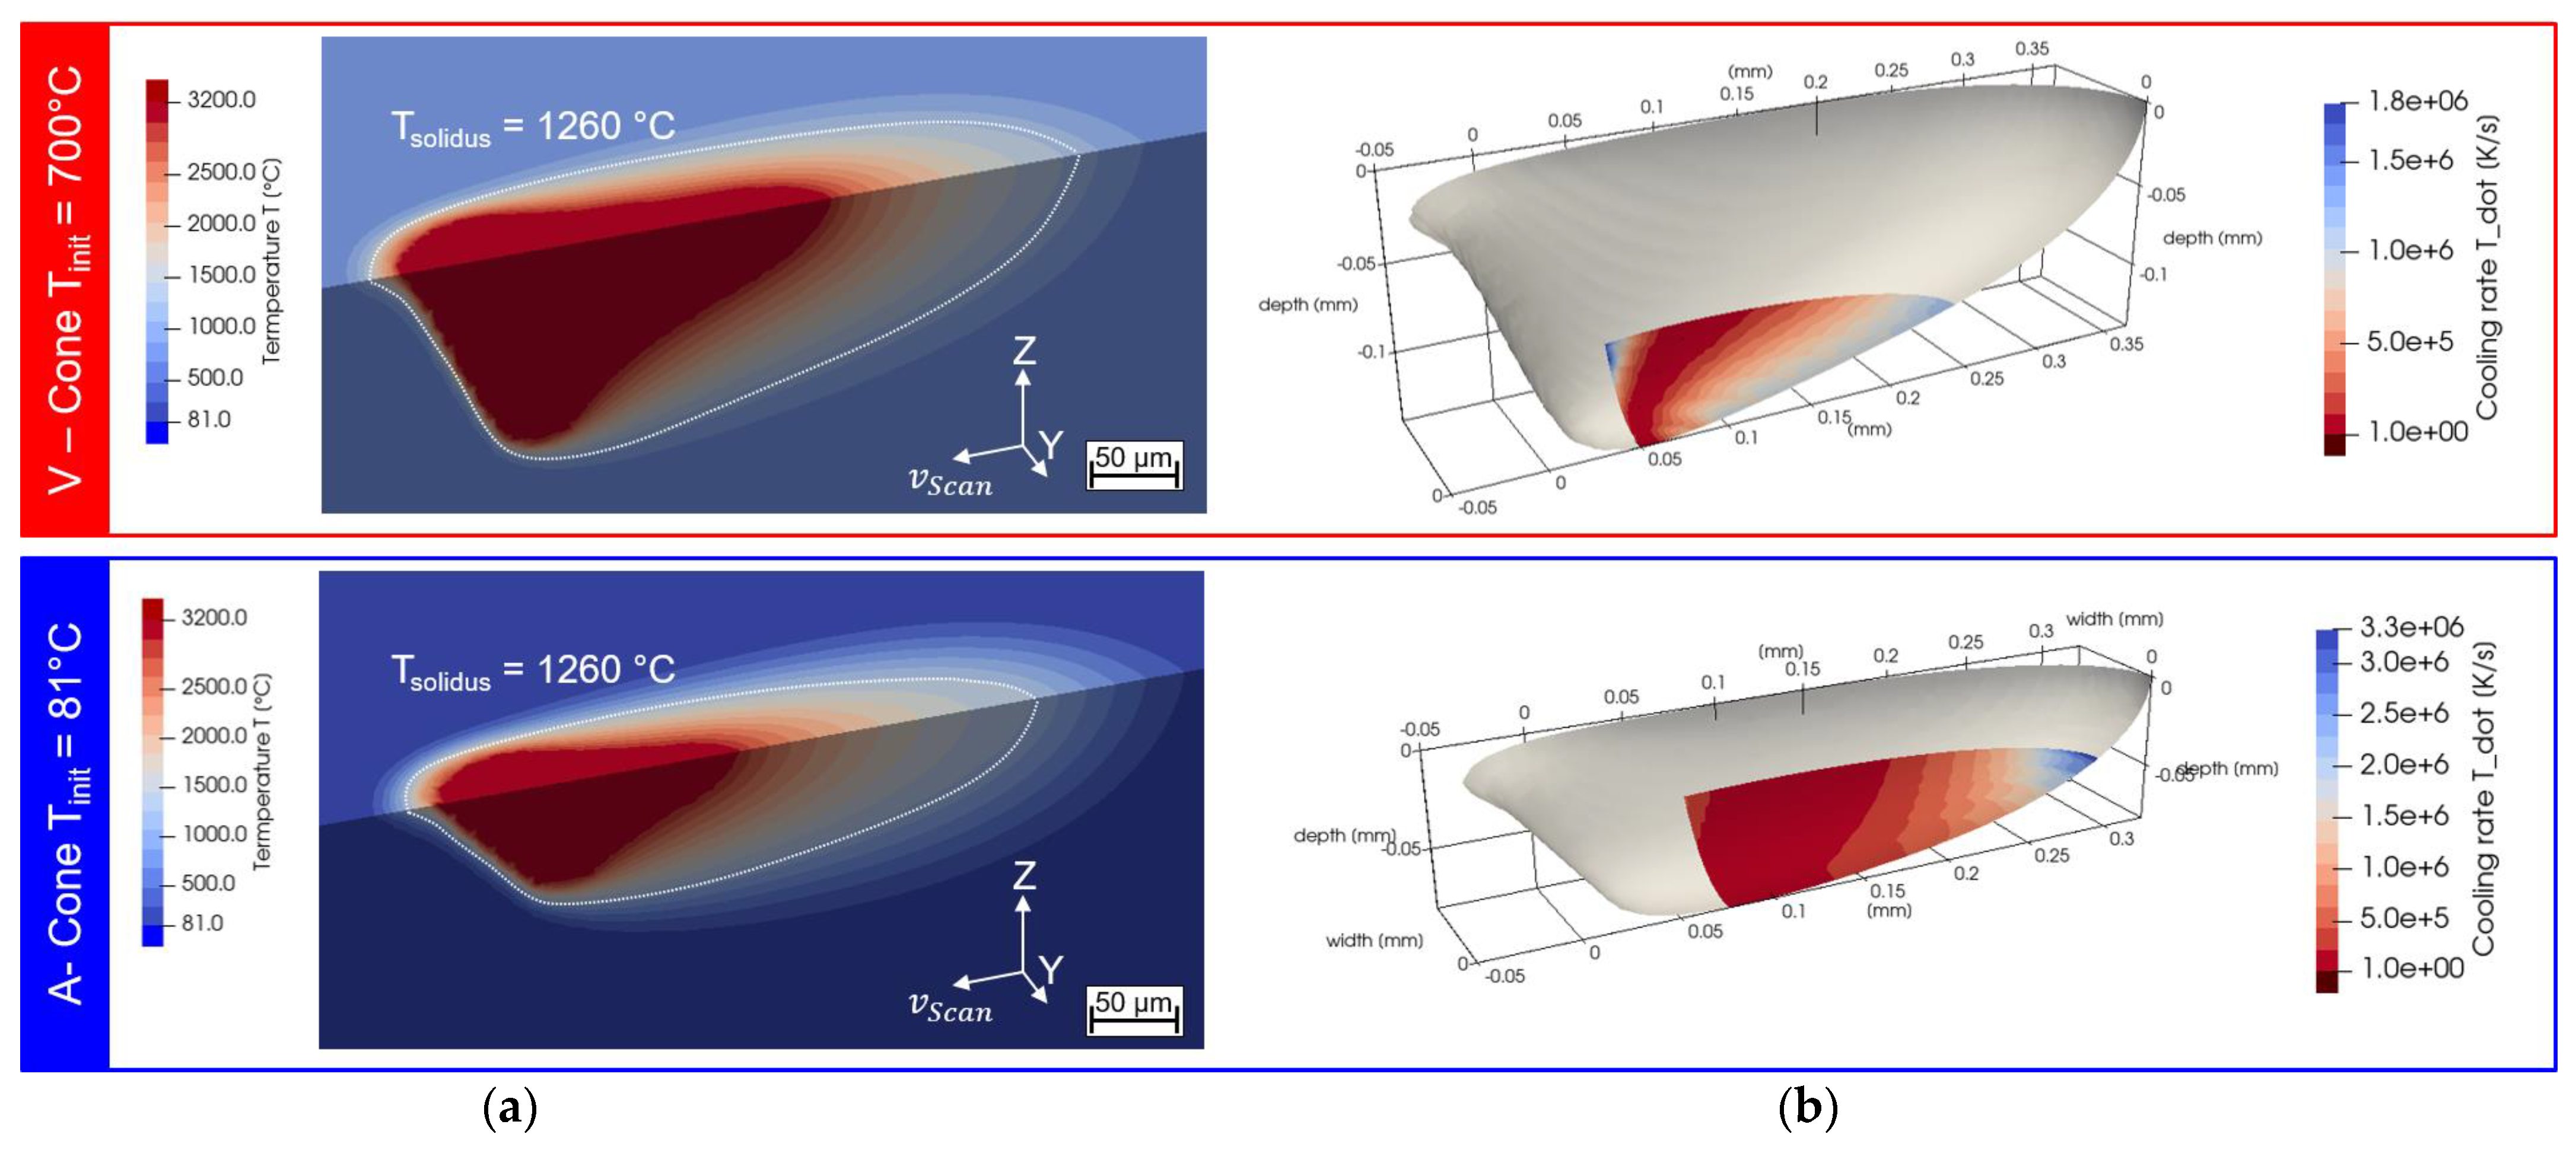
3.5. Evaluation of Solidification Conditions

The result of the simulation for the selected preheating temperatures of T p r e a h e a t , P 5 = 700   ° C for specimen C v , and T p r e a h e a t , P 2 = 81   ° C for C A is the transient three-dimensional temperature distribution of the PBF-LB/M molten pool (cf. Figure 7a). The solidification conditions occurring on the isotherms of the solidus temperature behind the deepest or widest point of the melt pool determine the microstructure of the material solidifying behind it. Therefore, the results for the given preheating temperatures are shown in the form of an isopleth diagram in Figure 7b. Only the lower 40 µm of the melt pool are taken into consideration since everything above this is melted again in the next layer.
It can be clearly seen from the simulation results that a larger melt pool for the V-shaped cone can be expected for the higher process-inherent preheating of 700 °C than in the case of 81 °C. The calculated melt pool depth and length is d700 = 140 µm and l700 = 422 µm, compared to d81 = 81 µm and l81 = 371 µm, respectively, for the smaller preheating temperature calculated for the A-cone.
The result for the calculated solidification conditions shows how the solidification rate varies within the melt pool. The lowest cooling rates occur in the widest area of the melt pool, while the highest cooling rate occur at the rear end of the melt pool on the solidification front. For the larger melt pool at the preheating temperature of 700 °C, the largest cooling rate is 1.2 × 10⁶ K/s, while in the other case, it is 3.0 × 10⁶ K/s. The calculated cooling rates are within the range usually expected for the PBF-LB/M of 106–107 K/s but consequently do not differ significantly. Due to the somewhat lower cooling rate calculated for specimen C v based on the melt pool simulation, a larger dendrite arm spacing can be calculated in principle, from which a higher hardness can be derived for the V-cone case in agreement with the experimental findings. However, from the observation of the cooling rates from single-track melt pool simulations alone, the difference is not significant enough to be able to conclude on different microstructures due to process-inherent preheating.

4. Conclusions

In the present study, geometry-related effects leading to high process-inherent preheating and their influence on mechanical properties have been studied. Experimental investigations of the hardness of cones made of Inconel 718 and microstructure analyses were conducted to establish a relationship between geometry and the local temperature profile. A thermal model for fast calculation of the pre-exposure temperature on macro level has been presented and is validated with a high-resolution scan-vector based simulation. The temperature histories have been used to determine the cooling rates of the melt pool. The results can be summarised as follows:
  • A macro temperature model is developed and validated. Thereby, the presented reduced order model is significantly faster than the scan-vector resolved reference model: 75 min for the presented coarse-scale model on a single CPU core in comparison to 16 h for the high-fidelity model, which runs also on multiple cores.
  • The macro temperature model allows a qualitative prediction of the process-inherent preheating during PBF-LB/M and is used to determined preheating temperatures and local heating cycles for two geometries.
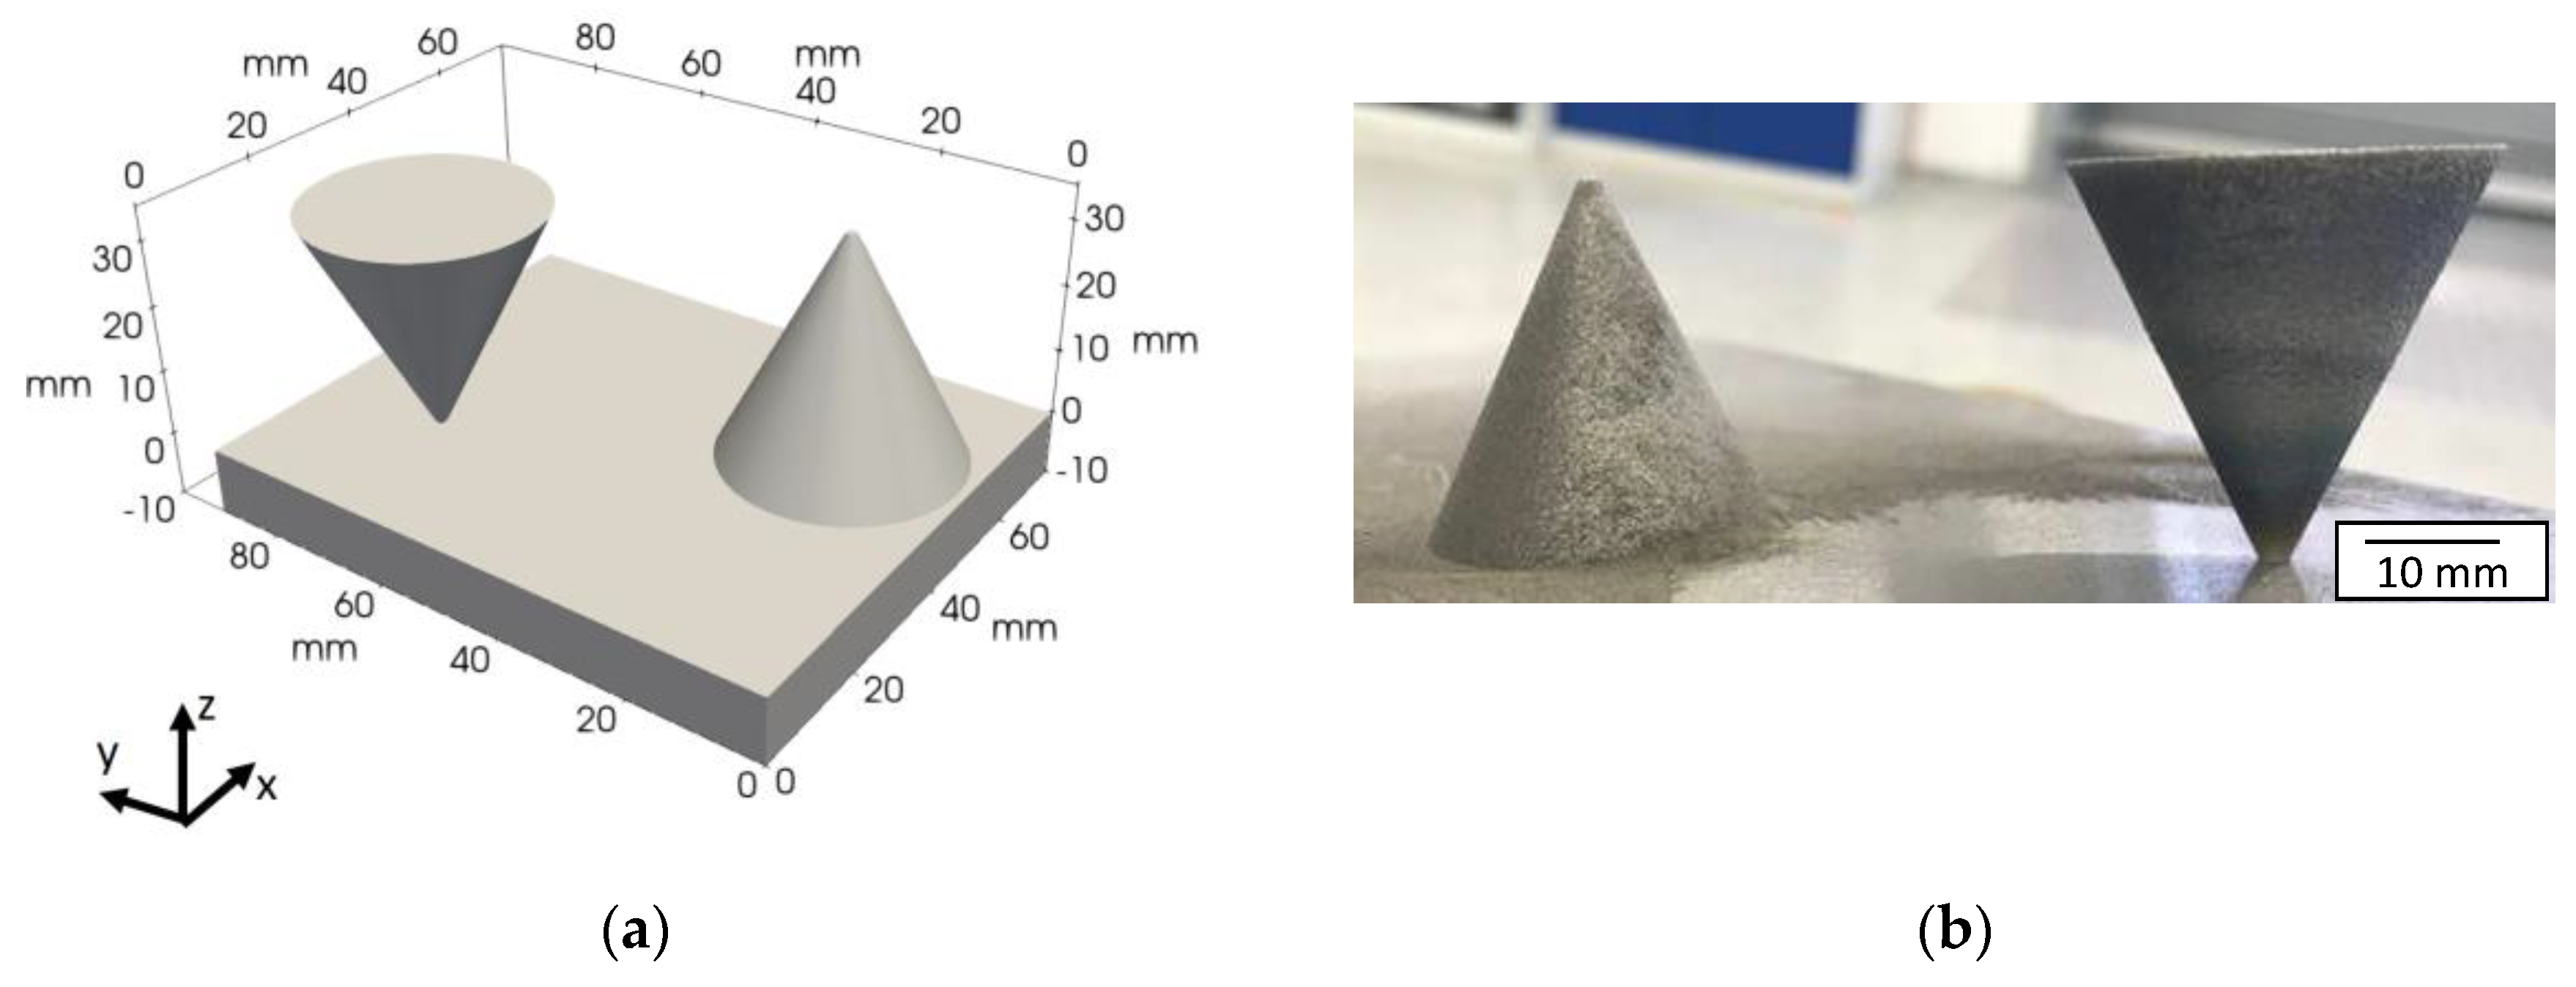
  • Geometric susceptibility to heat accumulation during PBF-LB/M is demonstrated experimentally, and an increase in Vickers hardness with build height for a V-shaped cone is found.
  • From analysis of microstructure, minor differences in the phase fraction of Laves phase can be observed and correlated to the increase in Vickers hardness. The proportion of strength-increasing precipitates is greater in the cross sections under process-inherent preheating. It can be assumed that nano-sized γ′/γ″ precipitates contribute to an increase in hardness. A precise assignment of whether the precipitates are Laves phase, δ or other precipitates, such as nitrides or carbides, cannot be definitively determined without an analysis of the phase composition.
  • The transient three-dimensional temperature distribution of the PBF-LB/M melt pool and solidification conditions are determined in a single-track simulation, based on the determined preheating temperatures, but the difference is not significant enough to conclude the different microstructure on its own.
Future research will address the transferability of the macro-temperature model to materials of other types and to more complex geometries. Furthermore, a coupling with structural, mechanical numerical models is being worked on to determine the occurring inherent distortion. For experimental investigations, the analysis of the phase composition lends itself to assessing whether the precipitates found are Laves phases.

Author Contributions

J.Z.: conceptualization, review and editing, methodology, investigation, and software; J.T.: conceptualization, original draft preparation, review and editing, data curation, methodology, investigation, software, and formal analysis; H.K.: conceptualization, original draft preparation, review and editing, visualization, methodology, investigation, and formal analysis; S.-K.R.: review and editing, methodology, investigation, validation, and formal analysis; D.Z.: conceptualization, investigation, and resources; M.M.: conceptualization, review and editing, methodology, software, validation, and formal analysis; J.H.S.: supervision; All authors have read and agreed to the published version of the manuscript.

Funding

This research is funded by the Digital Photonic Production DPP Research Campus as part of the “Research Campus Public-Private Partnership for Innovation” research funding initiative of the German Federal Ministry of Education and Research (BMBF). As part of the German government’s high-tech strategy, the BMBF is using this initiative to promote strategic and long-term cooperation between science and industry “under one roof” (Funding number: 13N15423). We are also grateful for the support of the Collaborative Research Center SFB1120-236616214 “Bauteilpräzision durch Beherrschung von Schmelze und Erstarrung in Produktionsprozessen”, which is funded by the German Research Foundation (DFG).

Institutional Review Board Statement

Not applicable.

Data Availability Statement

The data presented in this study are available on request from the corresponding author. The data are not publicly available for privacy reasons.

Acknowledgments

The authors thank Access e.V., and Susanne Hemes and Ulrike Hecht from Access e.V. for providing equipment, and conducting and evaluating the microstructure analyses. We also thank Markus Sudmanns for providing valuable Feedback to the final manuscript.

Conflicts of Interest

The authors declare no conflict of interest.

References

  1. Kurz, W.; Fisher, D.J. Fundamentals of Solidification, 4th ed.; Trans Tech Publ: Uetikon-Zuerich, Switzerland, 2005; ISBN 0878498044. [Google Scholar]
  2. Greven, K.; Ludwig, A. Schnelle Erstarrung. In Schmelze, Erstarrung, Grenzflächen; Sahm, P.R., Egry, I., Volkmann, T., Eds.; Springer: Berlin/Heidelberg, Germany, 1999; pp. 208–223. ISBN 978-3-540-41566-4. [Google Scholar]
  3. Boussinot, G.; Apel, M.; Zielinski, J.; Hecht, U.; Schleifenbaum, J.H. Strongly out-of-equilibrium columnar solidification during the Laser Powder-Bed Fusion additive manufacturing process. Phys. Rev. Appl. 2019, 11, 567. [Google Scholar] [CrossRef]
  4. Verhülsdonk, M.; Vervoort, S.; Dionne, P.; Megahed, M. LPBF thermal history of IN718 part and metallurgical considerations. Addit. Manuf. 2023. under review. [Google Scholar]
  5. Duong, E.; Masseling, L.; Knaak, C.; Dionne, P.; Megahed, M. Scan path resolved thermal modelling of LPBF. Addit. Manuf. Lett. 2022, 3, 100047. [Google Scholar] [CrossRef]
  6. Zielinski, J. A Holistic Approach to Understand Laser Additive Manufacturing from Melt Pool to Microstructure. Ph.D. Thesis, RWTH Aachen University, Aachen, Germany, 2022. [Google Scholar]
  7. Romano, J.; Ladani, L.; Sadowski, M. Laser Additive Melting and Solidification of Inconel 718: Finite Element Simulation and Experiment. Jom 2016, 68, 967–977. [Google Scholar] [CrossRef]
  8. Schrage, J.; Schleifenbaum, J.; Manfi, M. Influence of Powder Application Parameters on Powder Bed Properties and on Productivity of Laser Powder Bed Fusion (L-PBF). In Proceedings of the 4th Metal Additive Manufacturing Conference, Orebro, Sweden, 25–27 November 2019. [Google Scholar]
  9. Geuzaine, C.; Remacle, J.-F. Gmsh: A 3-D finite element mesh generator with built-in pre- and post-processing facilities. Int. J. Numer. Meth. Engng. 2009, 79, 1309–1331. [Google Scholar] [CrossRef]
  10. Hecht, F. New development in FreeFem++. J. Numer. Math. 2012, 20, 251–266. [Google Scholar] [CrossRef]
  11. Raghavan, N.; Dehoff, R.; Pannala, S.; Simunovic, S.; Kirka, M.; Turner, J.; Carlson, N.; Babu, S.S. Numerical modeling of heat-transfer and the influence of process parameters on tailoring the grain morphology of IN718 in electron beam additive manufacturing. Acta Mater. 2016, 112, 303–314. [Google Scholar] [CrossRef]
  12. Jia, Q.; Gu, D. Selective laser melting additive manufacturing of Inconel 718 superalloy parts: Densification, microstructure and properties. J. Alloys Compd. 2014, 585, 713–721. [Google Scholar] [CrossRef]
  13. Burbaum, B. Verfahrenstechnische Grundlagen für das Laserstrahl-Umschmelzen einkristalliner Nickelbasis-Superlegierungen. Ph.D. Thesis, RWTH Aachen, Aachen, Germany, 2010. [Google Scholar]
  14. Amato, K.N.; Gaytan, S.M.; Murr, L.E.; Martinez, E.; Shindo, P.W.; Hernandez, J.; Collins, S.; Medina, F. Microstructures and mechanical behavior of Inconel 718 fabricated by selective laser melting. Acta Mater. 2012, 60, 2229–2239. [Google Scholar] [CrossRef]
  15. Renhof, L. Mikrostruktur und Mechanische Eigenschaften der Nickellegierung IN 718. Ph.D. Thesis, Technical University of Munich, Munich, Germany, 2007. [Google Scholar]
  16. Wang, Z.; Guan, K.; Gao, M.; Li, X.; Chen, X.; Zeng, X. The microstructure and mechanical properties of deposited-IN718 by selective laser melting. J. Alloys Compd. 2012, 513, 518–523. [Google Scholar] [CrossRef]
  17. Deng, D.; Peng, R.L.; Brodin, H.; Moverare, J. Microstructure and mechanical properties of Inconel 718 produced by selective laser melting: Sample orientation dependence and effects of post heat treatments. Mater. Sci. Eng. A 2018, 713, 294–306. [Google Scholar] [CrossRef]
  18. Kumara, C.; Balachandramurthi, A.R.; Goel, S.; Hanning, F.; Moverare, J. Toward a better understanding of phase transformations in additive manufacturing of Alloy 718. Materialia 2020, 13, 100862. [Google Scholar] [CrossRef]
  19. Mohr, G.; Altenburg, S.J.; Hilgenberg, K. Effects of inter layer time and build height on resulting properties of 316L stainless steel processed by laser powder bed fusion. Addit. Manuf. 2020, 32, 101080. [Google Scholar] [CrossRef]
  20. Sprengel, M.; Mohr, G.; Altenburg, S.J.; Evans, A.; Serrano-Munoz, I.; Kromm, A.; Pirling, T.; Bruno, G.; Kannengiesser, T. Triaxial Residual Stress in Laser Powder Bed Fused 316L: Effects of Interlayer Time and Scanning Velocity. Adv. Eng. Mater. 2022, 24, 2101330. [Google Scholar] [CrossRef]
  21. Rielli, V.V.; Theska, F.; Godor, F.; Stanojevic, A.; Oberwinkler, B.; Primig, S. Evolution of nanoscale precipitates during common Alloy 718 ageing treatments. Mater. Des. 2021, 205, 109762. [Google Scholar] [CrossRef]
Figure 1. Geometries used for experiment and simulation. (a) Full part geometry with substrate and (b) manufactured metallic specimens.
Jmmp 07 00088 g001
Figure 2. Temperature-dependent material properties for IN718: (a) Thermal conductivity, k ; (b) specific heat capacity, c p ; and (c) density ρ ; ○ Tabular data according [7], - - approximated polynomial.
Jmmp 07 00088 g002
Figure 3. (a) Qualitative representation of the measuring points in the cross section of the cones and exemplary illustration of the evaluation layers; (b) Hardness (HV0.1), evaluated as mean value and standard deviation, measured layer-wise over the build height. A higher hardness for specimen C v in comparison to sample C A and slightly smaller deviations for the V shaped cone can be identified.
Jmmp 07 00088 g003
Figure 4. SEM images of the V- and A-cone of the cross-sections parallel to the build direction z in the middle of the build height of the cones. A typical dendritic microstructure for PBF-LB/M -processed IN718 can be seen, while in the case of the V-cone. the proportion of Laves-phase is more pronounced.
Jmmp 07 00088 g004
Figure 5. (a) Geometric relationships of the test specimens and localization of the analysis points with numbering; Temperature profiles at the points of interest for the (b) A-cone and (c) V-cone.
Jmmp 07 00088 g005
Figure 6. Temperature profiles at the points P 2 and P 5 .
Jmmp 07 00088 g006
Figure 7. (a) Temperature distribution in the melt pool simulation of a single track during PBF-LB/M for varying preheating temperatures Tinit 700/81 °C, (b) resulting cooling rates (K/s) on the solidification front of Tsolidus = 1260 °C. Different size of the resulting melt pool geometries and small deviations of cooling rates at the solidification front can be seen.
Jmmp 07 00088 g007
Table 1. PBF-L/M process parameters for simulation and experiment.
ParameterValue
Laser   Power   P L 160 W
Scanning   speed   v S 960 mm/s
Hatch   Spacing   h d 0.1 mm
Layer thickness30 µm
Recoating time4 s
Disclaimer/Publisher’s Note: The statements, opinions and data contained in all publications are solely those of the individual author(s) and contributor(s) and not of MDPI and/or the editor(s). MDPI and/or the editor(s) disclaim responsibility for any injury to people or property resulting from any ideas, methods, instructions or products referred to in the content.

