Article

Real-Time In-Process Evaluation of Spatter Area and Depth of Aluminium Surface in a Pulsed Laser Ablation Process Using Received Radio Frequency Power from Plasma Plumes

by
Mahdieh Samimi
1,2,*,
Hassan Hosseinlaghab
3 and
Patrick J. McNally
1,2
1
School of Electronic Engineering, Dublin City University, D09 W6Y4 Dublin, Ireland
2
Science Foundation Ireland, I-Form Advanced Manufacturing Research Centre, D09 NR58 Dublin, Ireland
3
Independent Consultancy, Dublin, Ireland
*
Author to whom correspondence should be addressed.
J. Manuf. Mater. Process. 2023, 7(2), 56; https://doi.org/10.3390/jmmp7020056
Submission received: 2 February 2023 / Revised: 26 February 2023 / Accepted: 1 March 2023 / Published: 3 March 2023

Abstract

:
During the pulsed laser ablation of metals, as well as other materials, the development of a plasma plume close to the ablated surface leads to the emission of radio frequency energy. In this paper, we describe a process for analysing the received radio frequency power (RFP) for an aluminium (Al) surface ablation process in atmosphere using picosecond laser pulses at a wavelength of 1064 nm. The analysis of the RFP was carried out on two sets of experiments, where two parameters of the laser (repetition rate of laser (RRL) and power of laser (PL)) were varied while other parameters remained constant. In addition to the RFP measurement during the laser processing, the spatter area (SA), which is defined in this paper, and the depth of the ablated hole were measured post-process using a 3D microscope. It was observed that there is a direct relationship between (RFP)2 and SA. Accordingly, an appropriate RF calibration was performed, which leads to the definition of a quantity called the RF regulation % (RFR%). By comparing the RFR and PL/RRL variations, to which the laser beam fluence is proportional in these experiments, a diagnostic process (i.e., flowchart) for real-time depth evaluation was proposed and experimentally confirmed. This diagnostic process can indicate if the depth of the laser ablated crater is less than or exceeds a predetermined depth, which in this study was set to 15 µm. It is also demonstrated that the SA variation can be estimated in real-time by analysing the received RF power and, secondly, the depth of ablation can be measured in real time using a combination of information from the received RF power and laser parameters.

1. Introduction

Pulsed laser ablation, which uses laser–metal interaction, is applied to precision micromachining processes, and the measurement of the outcomes of the ablation process (e.g., the quality of the ablated surface) is important in industries such as aerospace, automobiles and medicine [1,2]. Many approaches have been used for studying and measuring metallurgical, geometrical and quality characteristics during the process in real time or near real time [3,4,5]. For laser ablated surfaces, chief among the factors that need to be measured are spatter formation and crater depth [3,4,6]. Spatter is produced when the melted material and ejected particles are scattered vertically and laterally and end up covering the periphery of the laser ablated hole [7,8,9]. In most of studies, a CCD camera has been applied to study those characteristics in process [6,10,11]. As the formation of an ablated depth is essentially a random process, measuring depth has some uncertainty [6,12], and because of this, finding a reliable, repeatable and real-time method to evaluate the ablation depth has been difficult.
During the laser ablation process, it is now understood that a plasma plume is created at the interface between the laser and the surface [13,14,15]. Until recently, these have been studied using high-speed cameras and CCD systems principally aimed at capturing the formation of the plasma plume from the laser hole ablation [6,10,16,17,18]. When the plasma plume expands out of the hole, the ejected particles and removed material spread across the surface leading to a spatter area (SA), but the aforementioned systems tend not to target the SA for analysis.
Despite the complexity of the interaction of the laser, surface, plasma plume, ambient atmosphere, etc., it is known that the plasma plume ionic and molecular excitation and de-excitation processes play a role in the generation of radio frequency emissions in the ranges of these ion/molecular plasma frequencies [19,20], typically in the range of hundreds of megahertz. We have recently shown that the monitoring of these RF emissions, which is known as radio emission spectroscopy (RES), can be used to extract information on the surface quality of the material subjected to pulsed laser ablation [5]. In that work, the statistical principal component analysis (PCA) approach was applied to the RF emissions and provided a near real-time method to study the symmetry and cleanliness of the ablation [5]. However, some features cannot be estimated with PCA; therefore, there is a need to find a new and more accurate analysis method to evaluate the key features of ablation (e.g., hole depth and spatter area), these being important to produce high-quality surface ablation.
In this work, a new analysis method was applied to RES spectral data, which indeed can provide a real-time estimation of the depth and spatter area (SA). The purest material is the best option to study this process (fewer impurity ions produce lower-intensity impurity plasma-ion-related RF emissions in the RES data), and aluminium (Al) was selected because of its prevalence in the electronic, communication, automotive and aerospace industries [2,21,22]. In addition, studies highlight the importance of the laser ablation of Al for industry [21,23]. Other researchers have investigated different aspects of the plasma plumes generated via laser interaction with Al [24] and performed morphological evaluations of Al in laser processing [25,26].
The aim of this investigation was to determine which morphological or physical characteristics of the ablation process can be evaluated and predicted during the ablation process using this new RF power analysis method. This led us to find a clear correlation between the received RF power of the ablation process (defined as RFP2 parameter) and spatter area; in addition, by defining a new parameter related to RF power (RF regulation %, (RFR)) and comparing that with a laser parameter (defined as PRRL parameter), the in-process depth evaluation was determined.

2. Materials and Methods

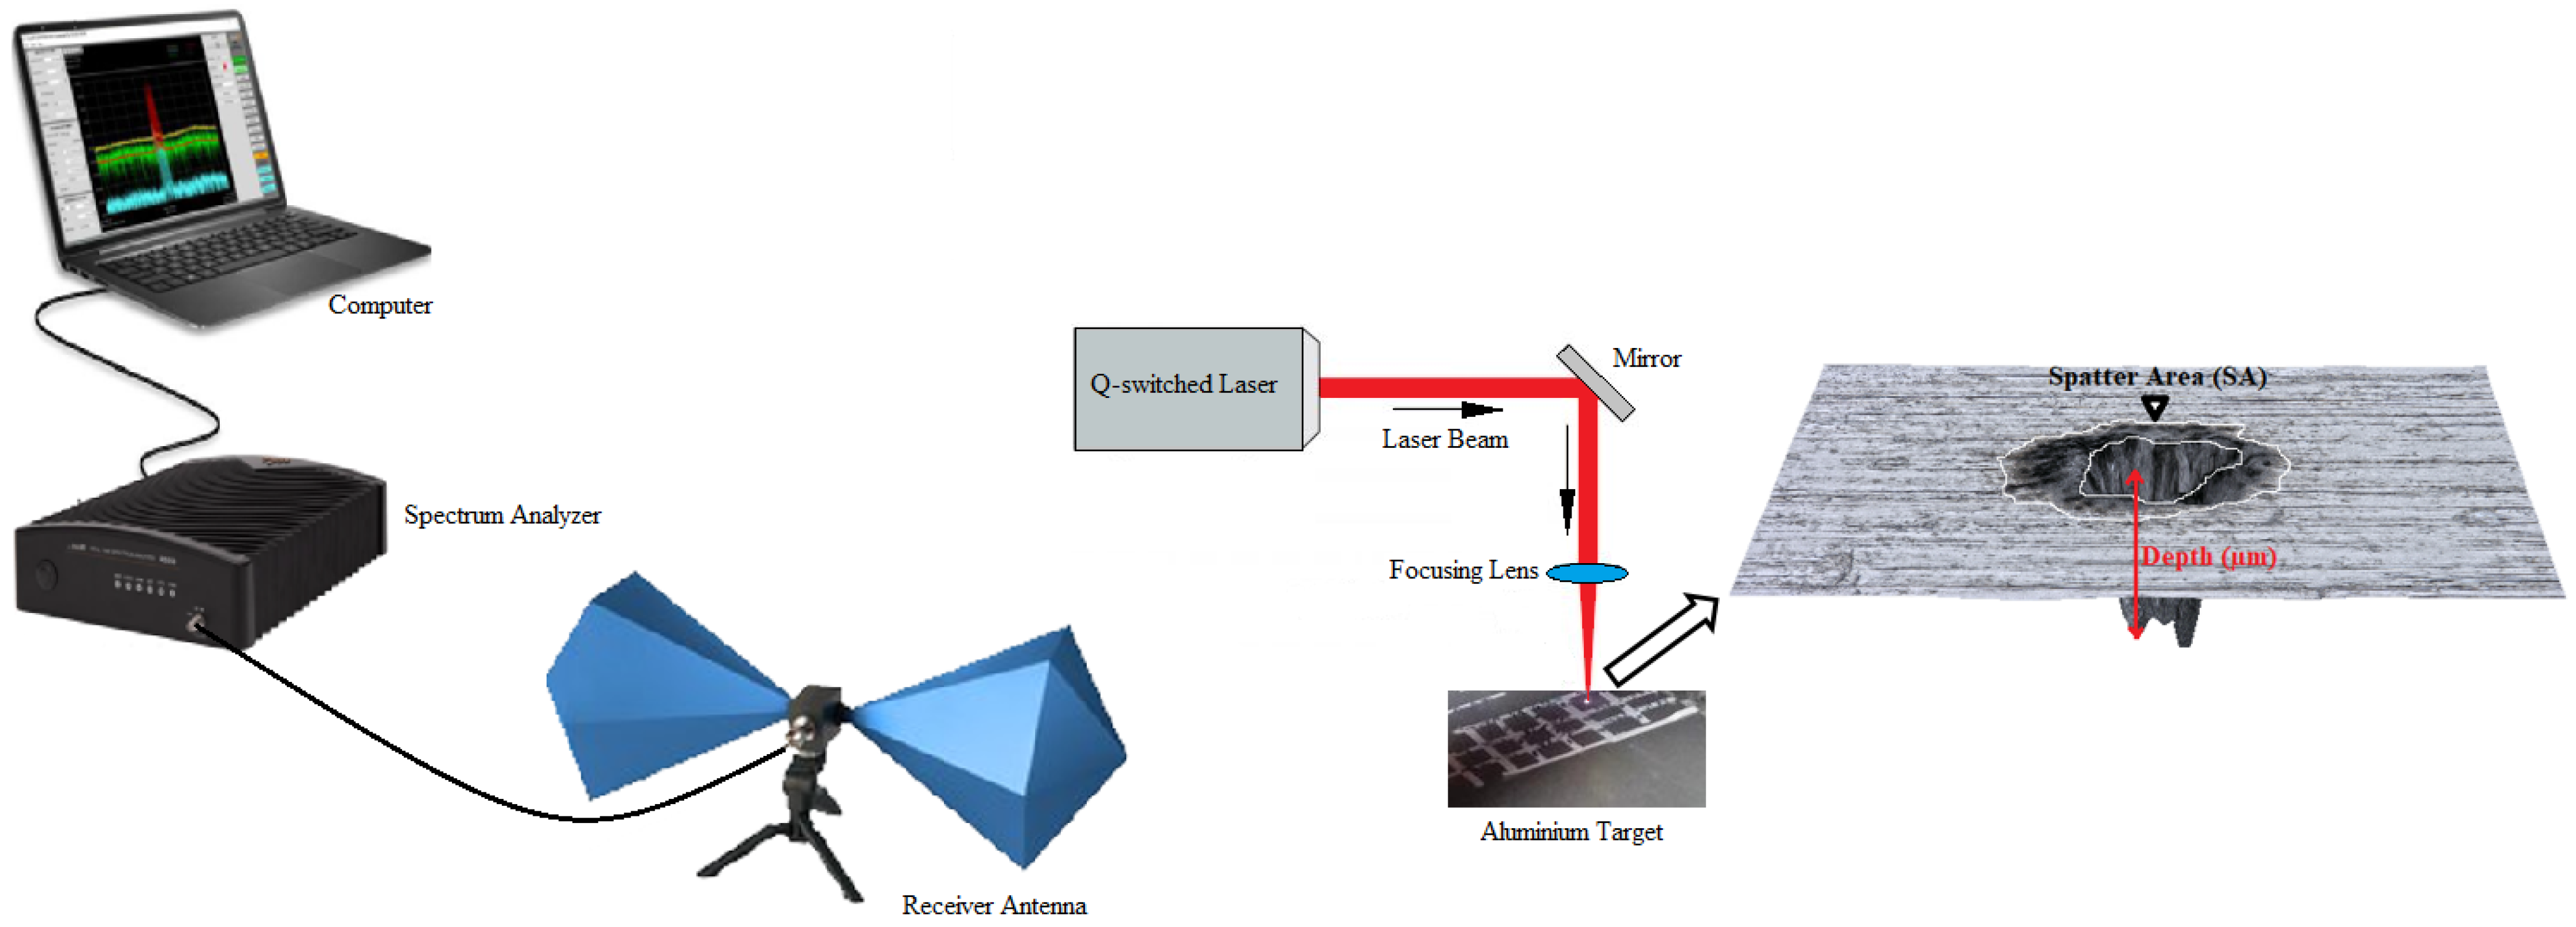
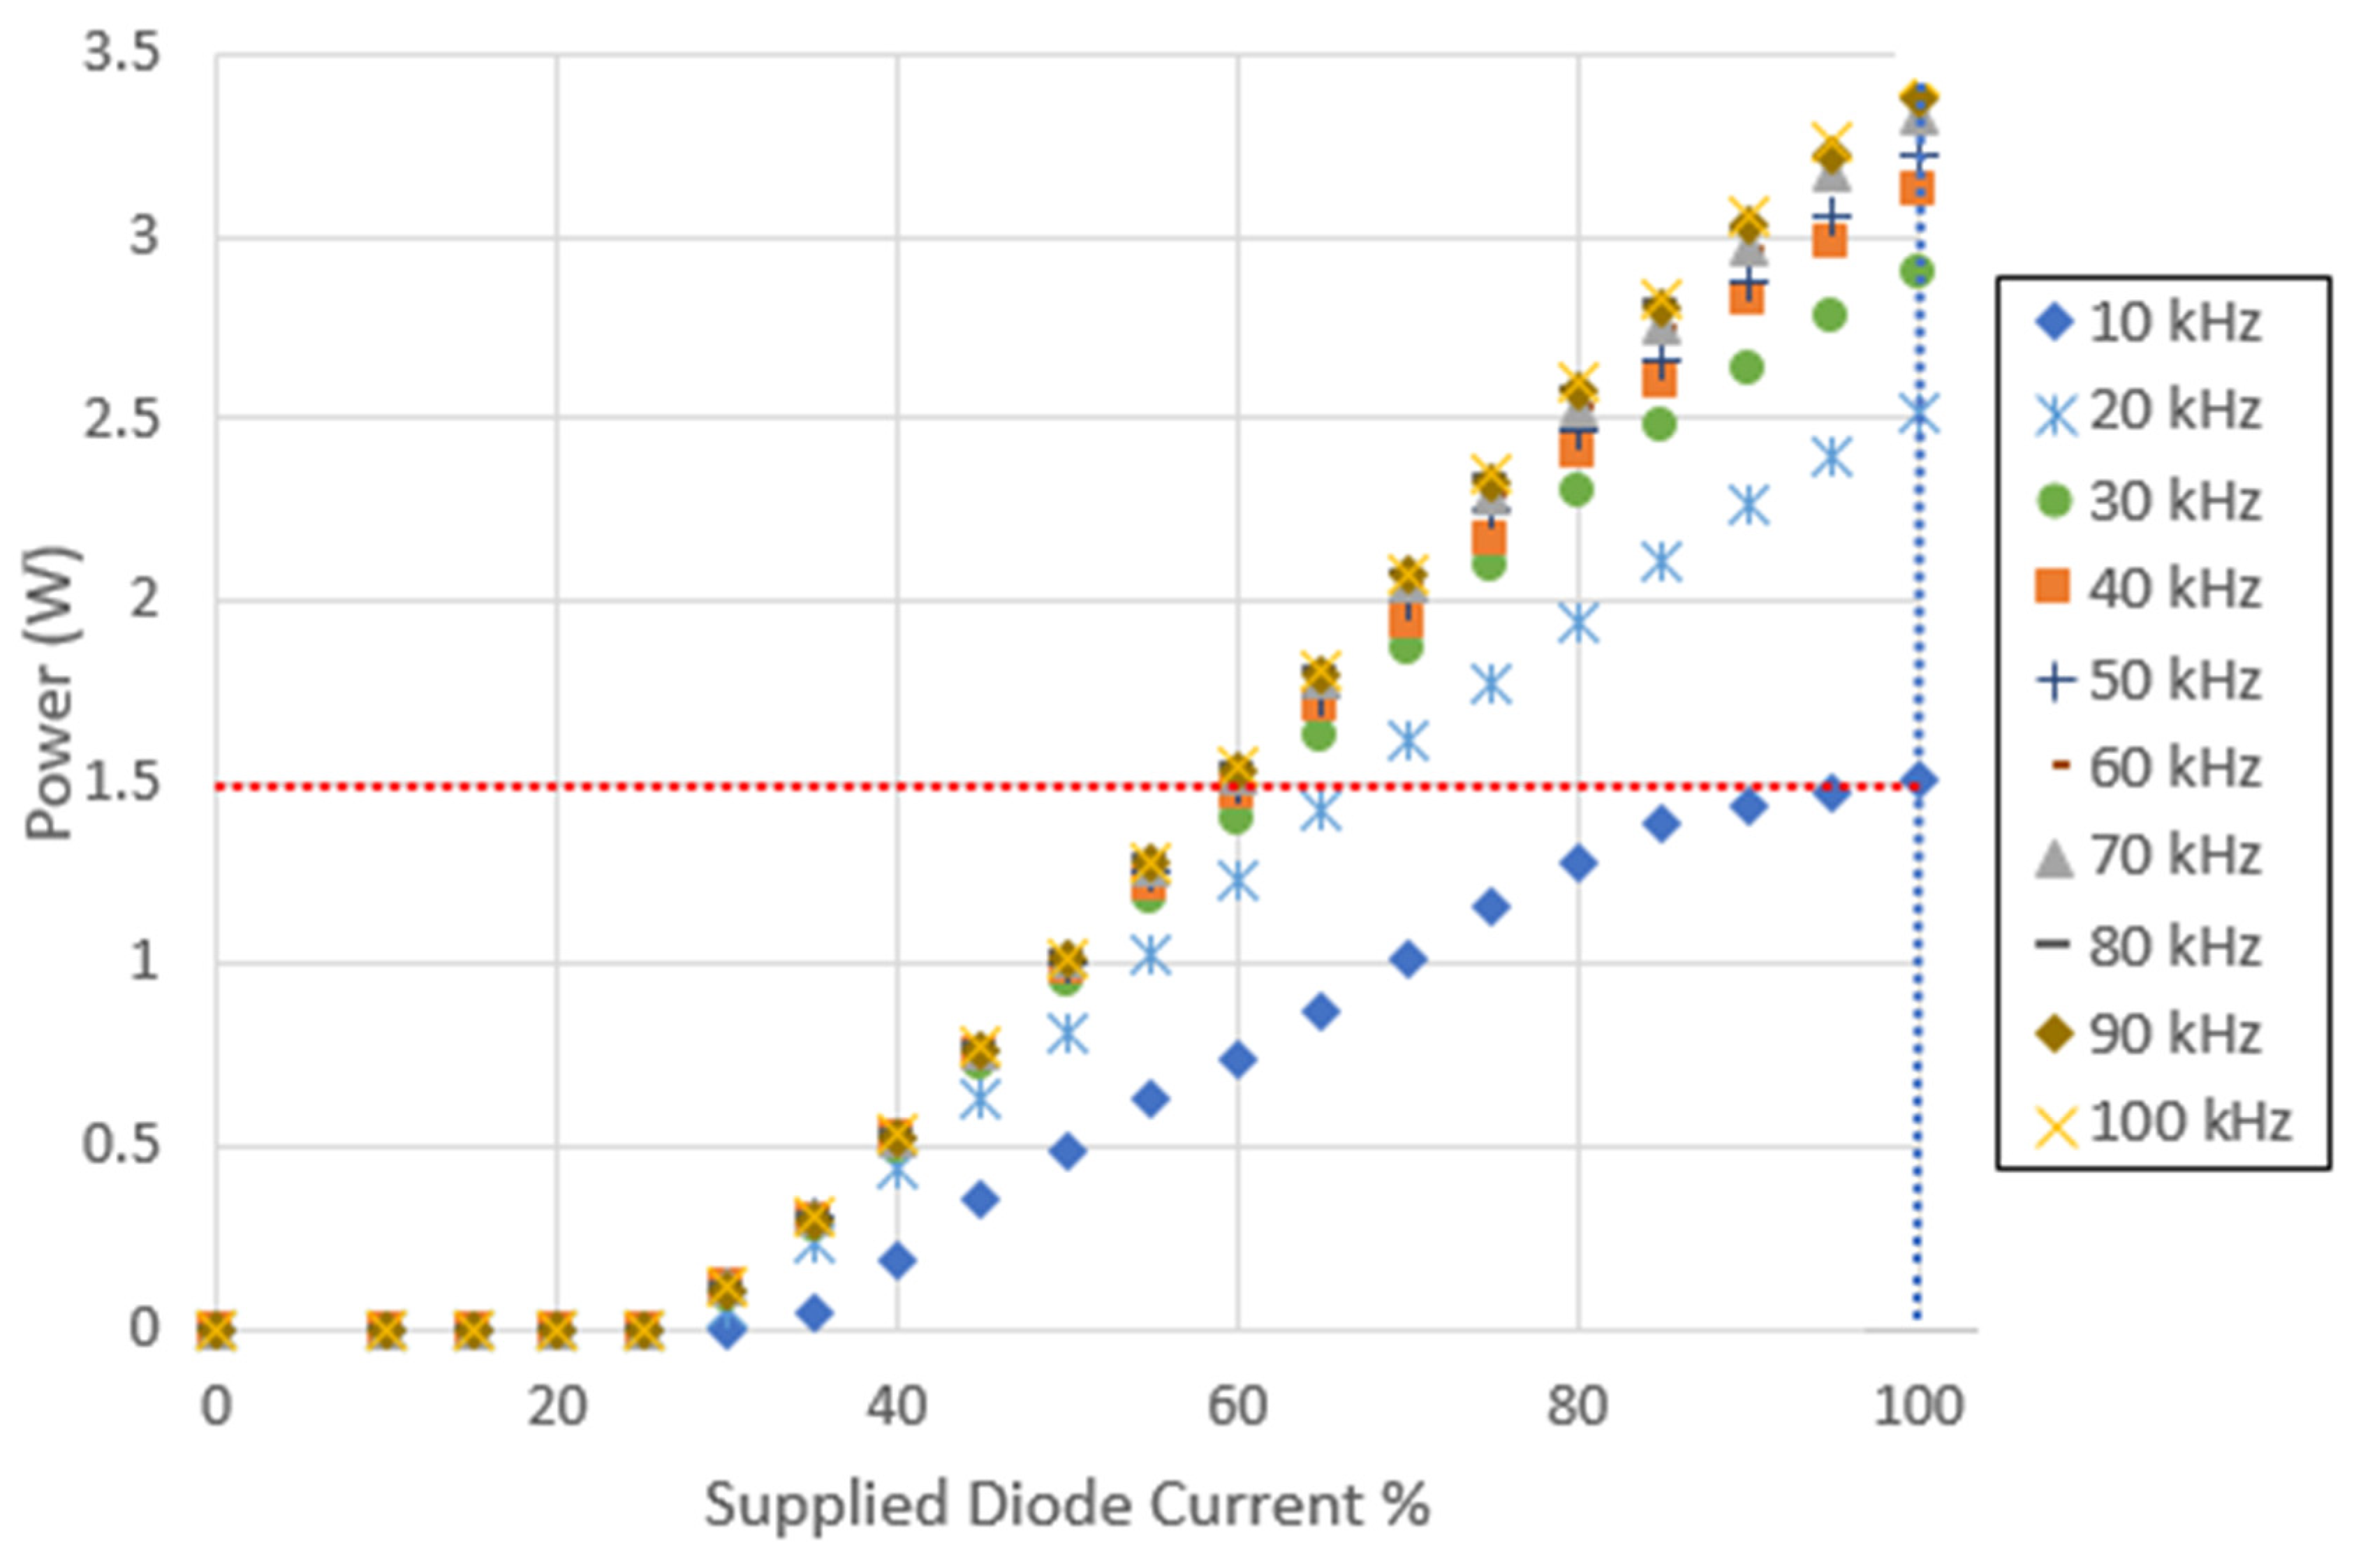
2.1. Experimental Setup and Materials

Figure 1 shows the principal scheme of the in situ RF receiving apparatus used for the investigations. The RF receiving setup included a spectrum analyser, antenna and computer. These comprised a spectrum analyzer (ThinkRF 5550 Spectrum Analyzer: 9 kHz–8 GHz, real-time bandwidth of 100 MHz, manufactured by thinkRF Corp., Ottawa, ON, Canada) and a BicoLOG 30100E active antenna (spectral range of 30 MHz–1 GHz) produced by Aaronia AG, Gewerbegebiet Aaronia AG, DE-54597 Strickscheid, Germany. The RF spectral data were recorded using the control software RTSA proprietary to ThinkRF. The laptop computer used was a Dell Latitude 5300 with an Intel® CoreTM i7-8665U CPU processor, clock speed of 1.90 GHz and running Windows 10.
A picosecond laser system at a 1064 nm wavelength (BrightSolutions 1064 WEDGE HF, BrightSolutions, Cura Carpignano, Italy) was used for all laser ablation experiments, offering a maximum power of 1.5 W at 10 kHz to 3.5 W at 100 kHz and a pulse repetition rate 10 to 100 kHz, according to Figure 2. The beam diameter was 140 µm in these experiments. Based on the manufacturer’s recommendation, the output power of the laser was set by changing the supplied diode current percentage, as shown in Figure 2. The laser ablation process for these experiments was set for 2 s and could be controlled either manually or using the RAYLASE software from RAYLASE GmbH (Wessling, Germany). A typical aluminium sheet (1050A standard, 99.5% purity) with a 1.2 mm thickness was used. More details on the composition of the material, including impurities and the corresponding contents, are provided in Appendix A.

2.2. Experimental Procedure

The experimental procedure in this work was categorised into two parts. The experiments were designed in two parts to study the capabilities of the new analysis method to recognize the ablation outcomes by changing the RRL and PL.
Part 1: Five points with the maximum supplied diode currents for five repetition rates of the laser (RRL) were considered as follows:
A schematic of the working repetition rates of the laser and the selected operation point for the experiments is illustrated in Figure 2. These five points are states where the laser had a nominal maximum suppled diode current (SDC) of 100%, which are indicated by the vertical, dotted line in Figure 2.
The average laser powers emitted to the target sample for each test, as measured by a calibrated power meter, are shown in Table 1 and Table 2.
Part 2: Nine points with the same laser power (horizontal, dashed line in Figure 2) at three different levels (maximum (Max), medium (Med) and minimum (Min)) and for three repetition rates (10, 20 and 30 kHz) were considered, as seen in Table 2.
The value of SDC (%), as shown in Table 2, was changed according to Figure 2 for each frequency in order to ensure that the requisite value of PL (W) was available. Henceforth, PL (%) is used instead of SDC (%) because the output power of the laser is, in fact, defined by the SDC (%).

2.3. Data Collecting and Analysis Method

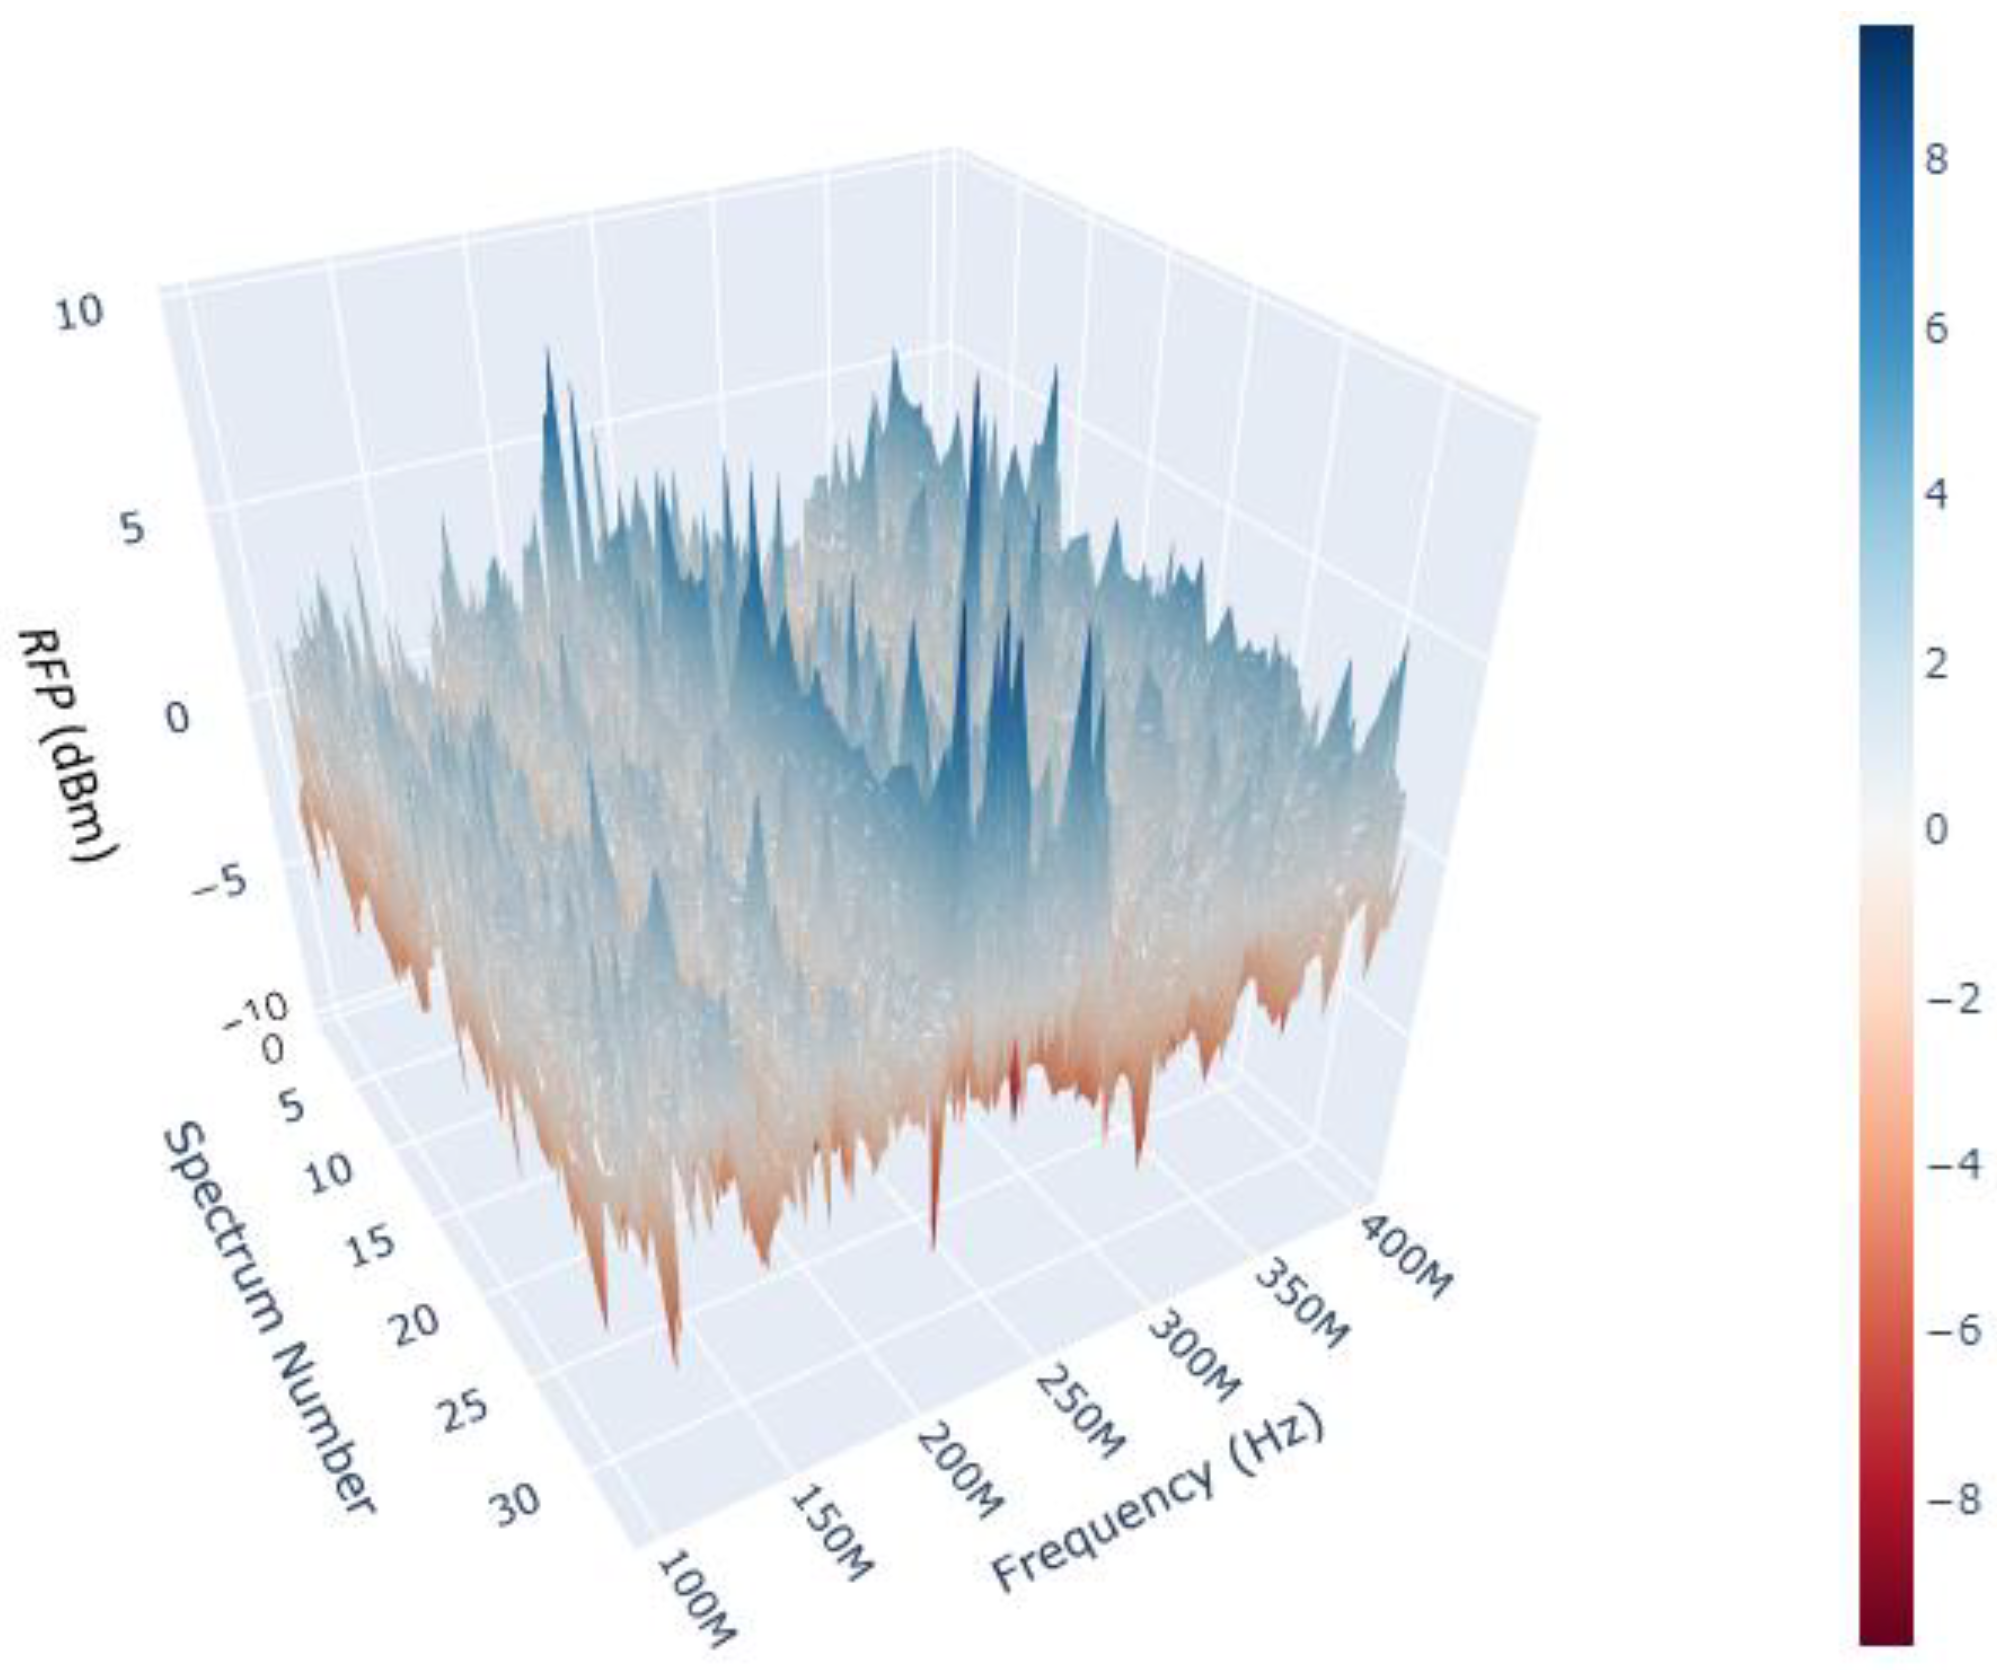
2.3.1. RF Spectra (In-Process) and Spectral Processing

The amplitudes of the radio frequency power (RFP) of the RF spectra were recorded across a two second long ablation process. Thirty-two spectra were recorded across the 2 s, i.e., a spectrum was acquired every 62.5 ms. After being subtracted from background noise and smoothed by a second order polynomial Savitzky–Golay (SG) filter, these data were then analysed in this study. An exemplar 3D plot of the received RF spectra for the 2 s ablation is illustrated in Figure 3, which was captured for the “10 kHz-Max” condition.
RFP represents the intensity of the RF frequencies carrying information about the plasma plume. RFP is the amplitude of the received RF power or intensity, which is released during the ablation process when there is a change in the shape of the surface formed due to the extraction of ejected material and the plasma plume [12]. As discussed in [5], on a macroscopic scale, ions and an increased density of higher-energy electron oscillations across an equilibrium position lead to different intensities of emitted ion plasma frequencies, ωpi, during the time period of the ablation, which for “normal” operating conditions occur in the 100–500 MHz range [5].
In order to analyse the RF spectral data and to enhance the differences in the spectra across the frequency and time ranges, the following function was defined:
R F P 2 = i = 0 n j = 0 m C i j 2
where C i j is the received RF power (RFP) of the spectra in the experiment (in dBm), i is the index number of the spectra, and j is the index number of the frequency bins. In these experiments, n = 32 and m = 15,898 (spectral bin resolution of 18.87 kHz across the 100 to 400 MHz frequency range).

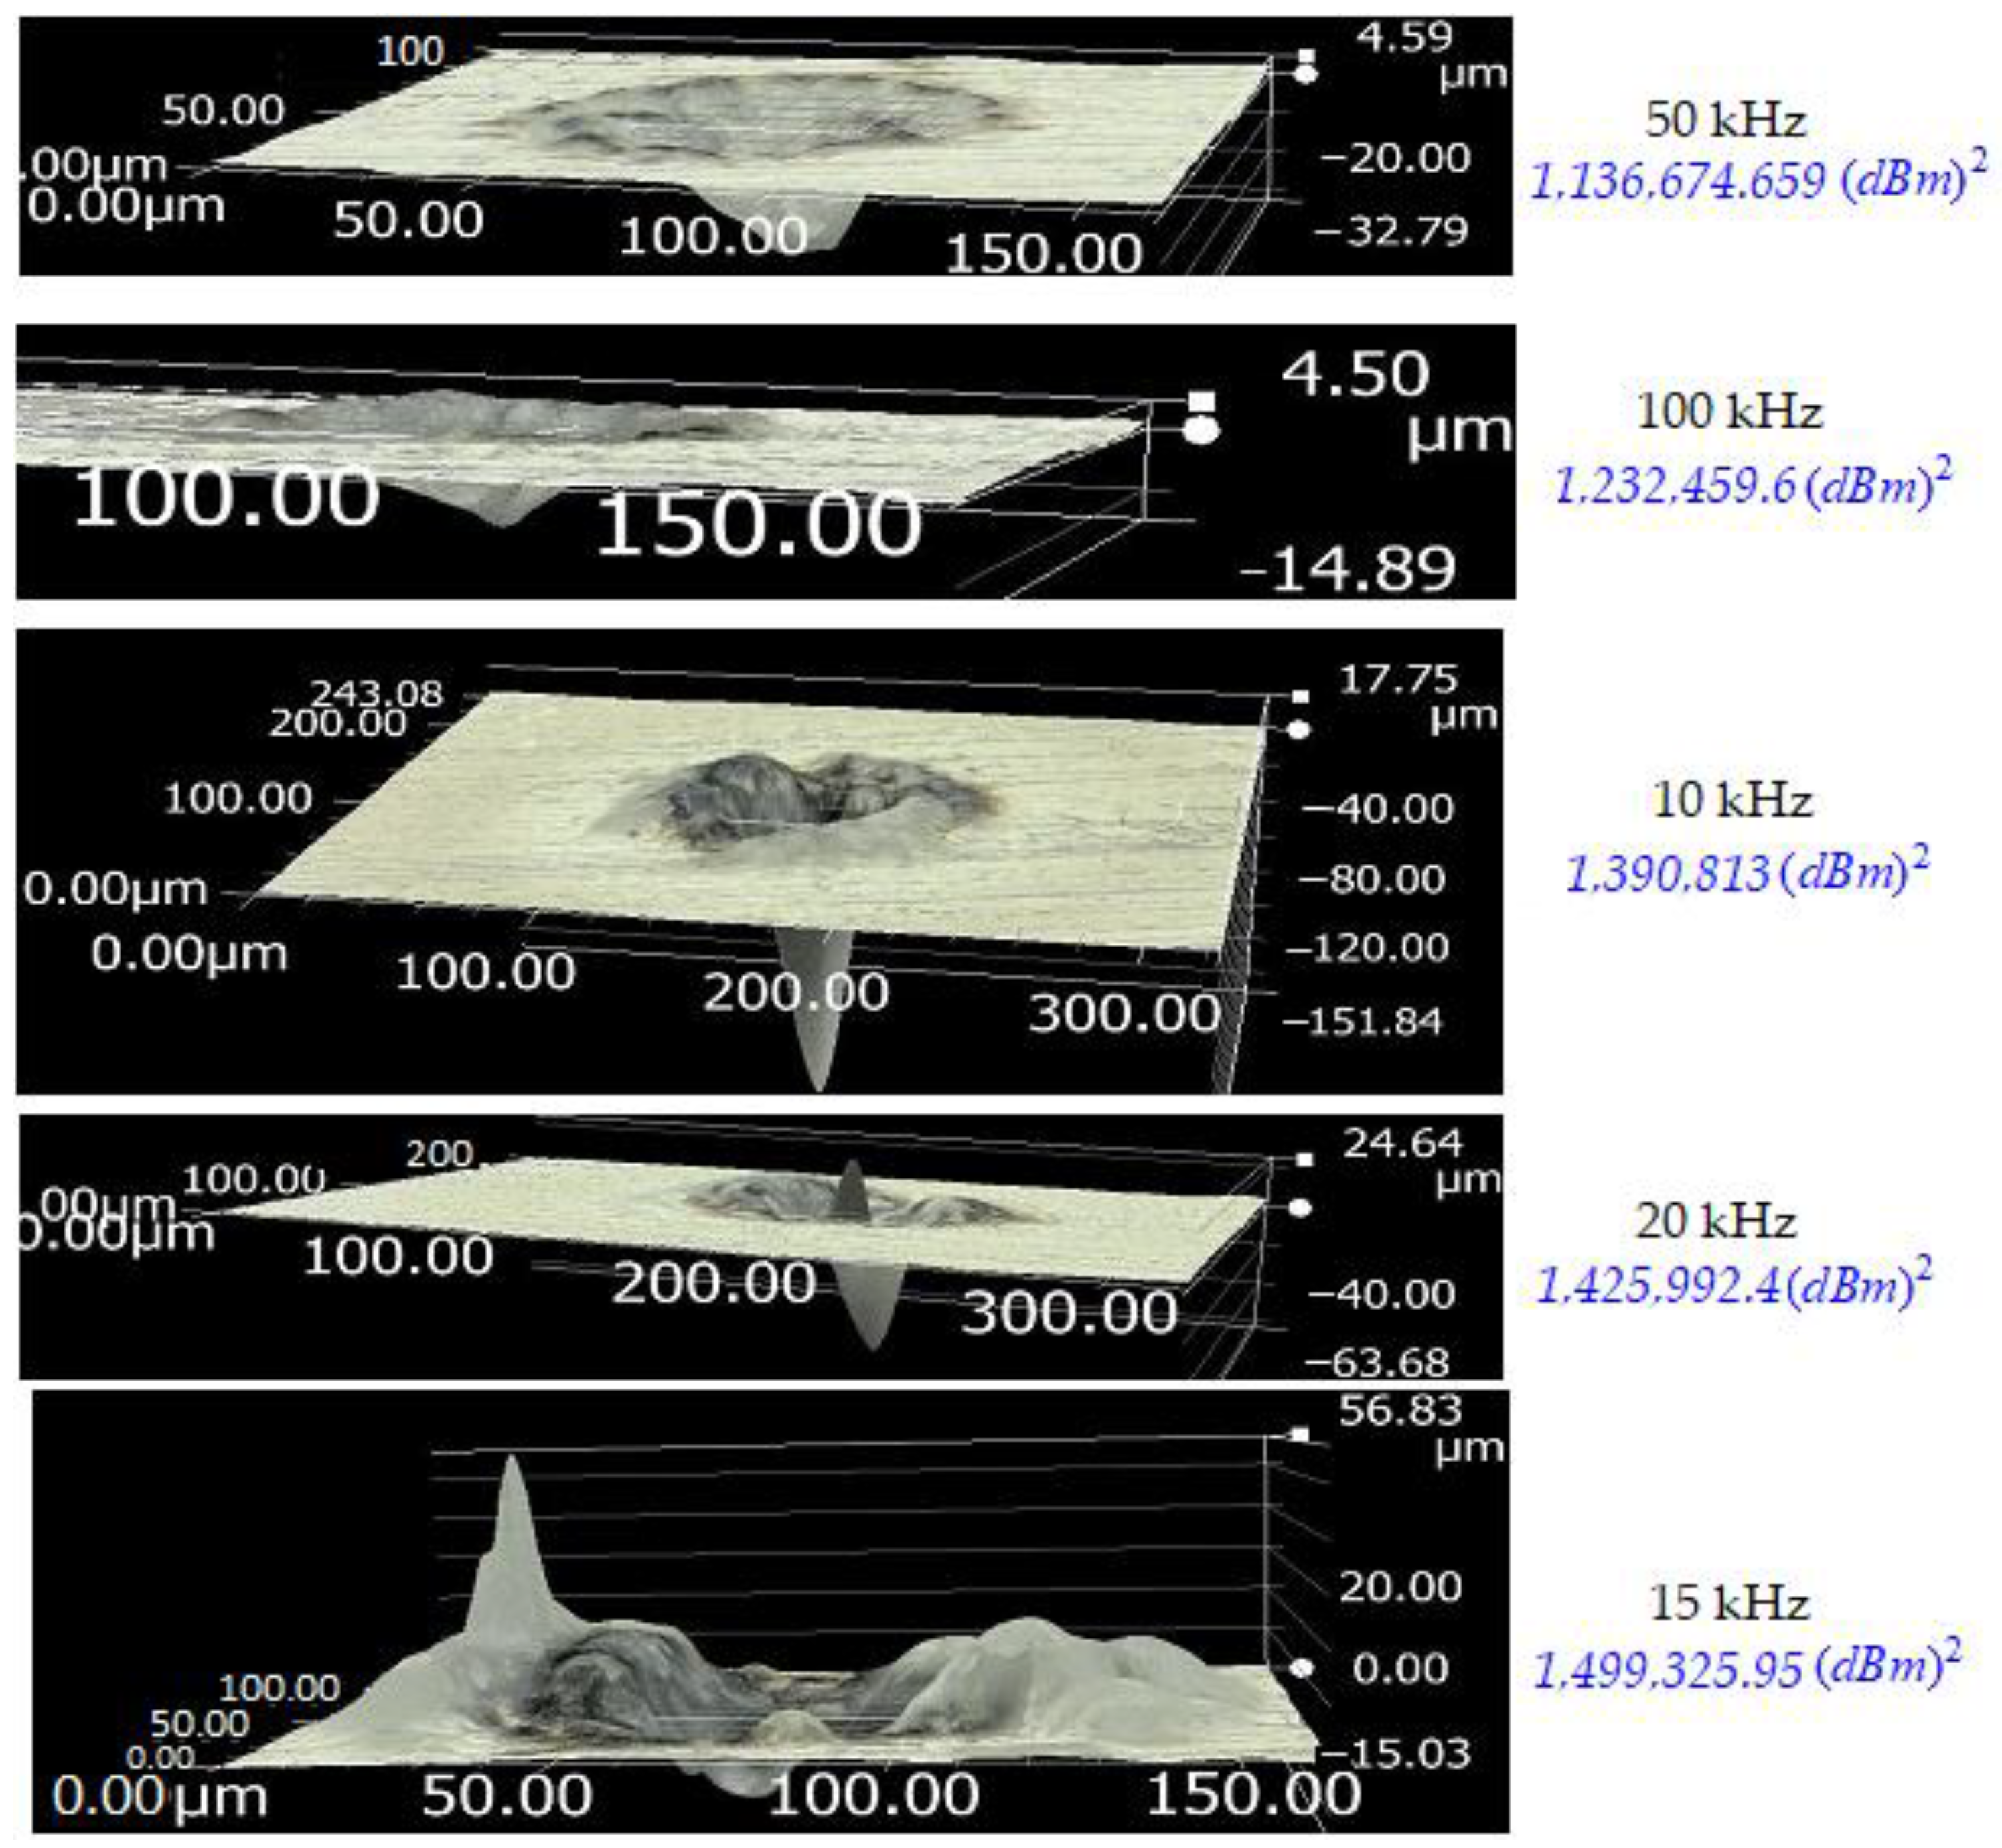
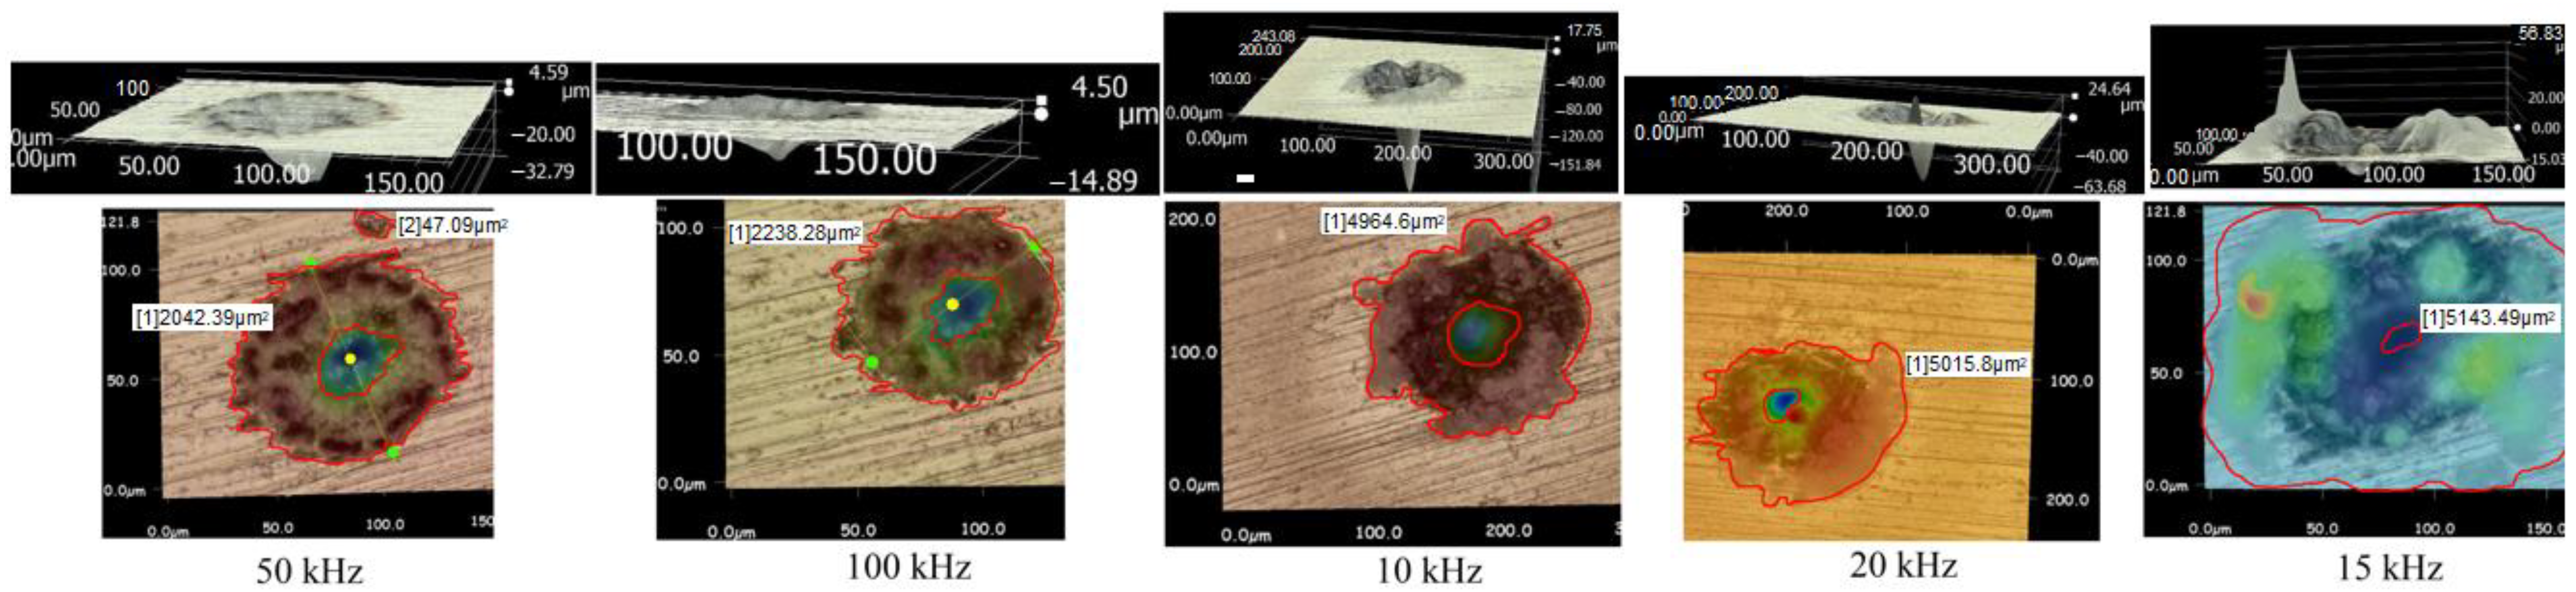
2.3.2. 3D Microscope (Post-Process)

After the samples were ablated and the RF spectra recorded, three-dimensional (3D) image maps of the samples were obtained using a 3D Optical Microscope (Keyence VHX-2000, manufactured by Keyence, Itasca, IL, USA). The spatter area and depth of ablation were measured, as also were the 2D profiles for analysing the depth of the ablated holes. The spatter area (µm2), illustrated on the right-hand side of Figure 1, is where the ejected material expands on the surface during the ablation process. The spatter area was measured with the Keyence microscope post-process software. In addition, the depth of ablation, specified in Figure 1, was measured by a 2D profile provided in the 3D Keyence software. Both of those features were measurable after preparation of the 3D images by the microscope.

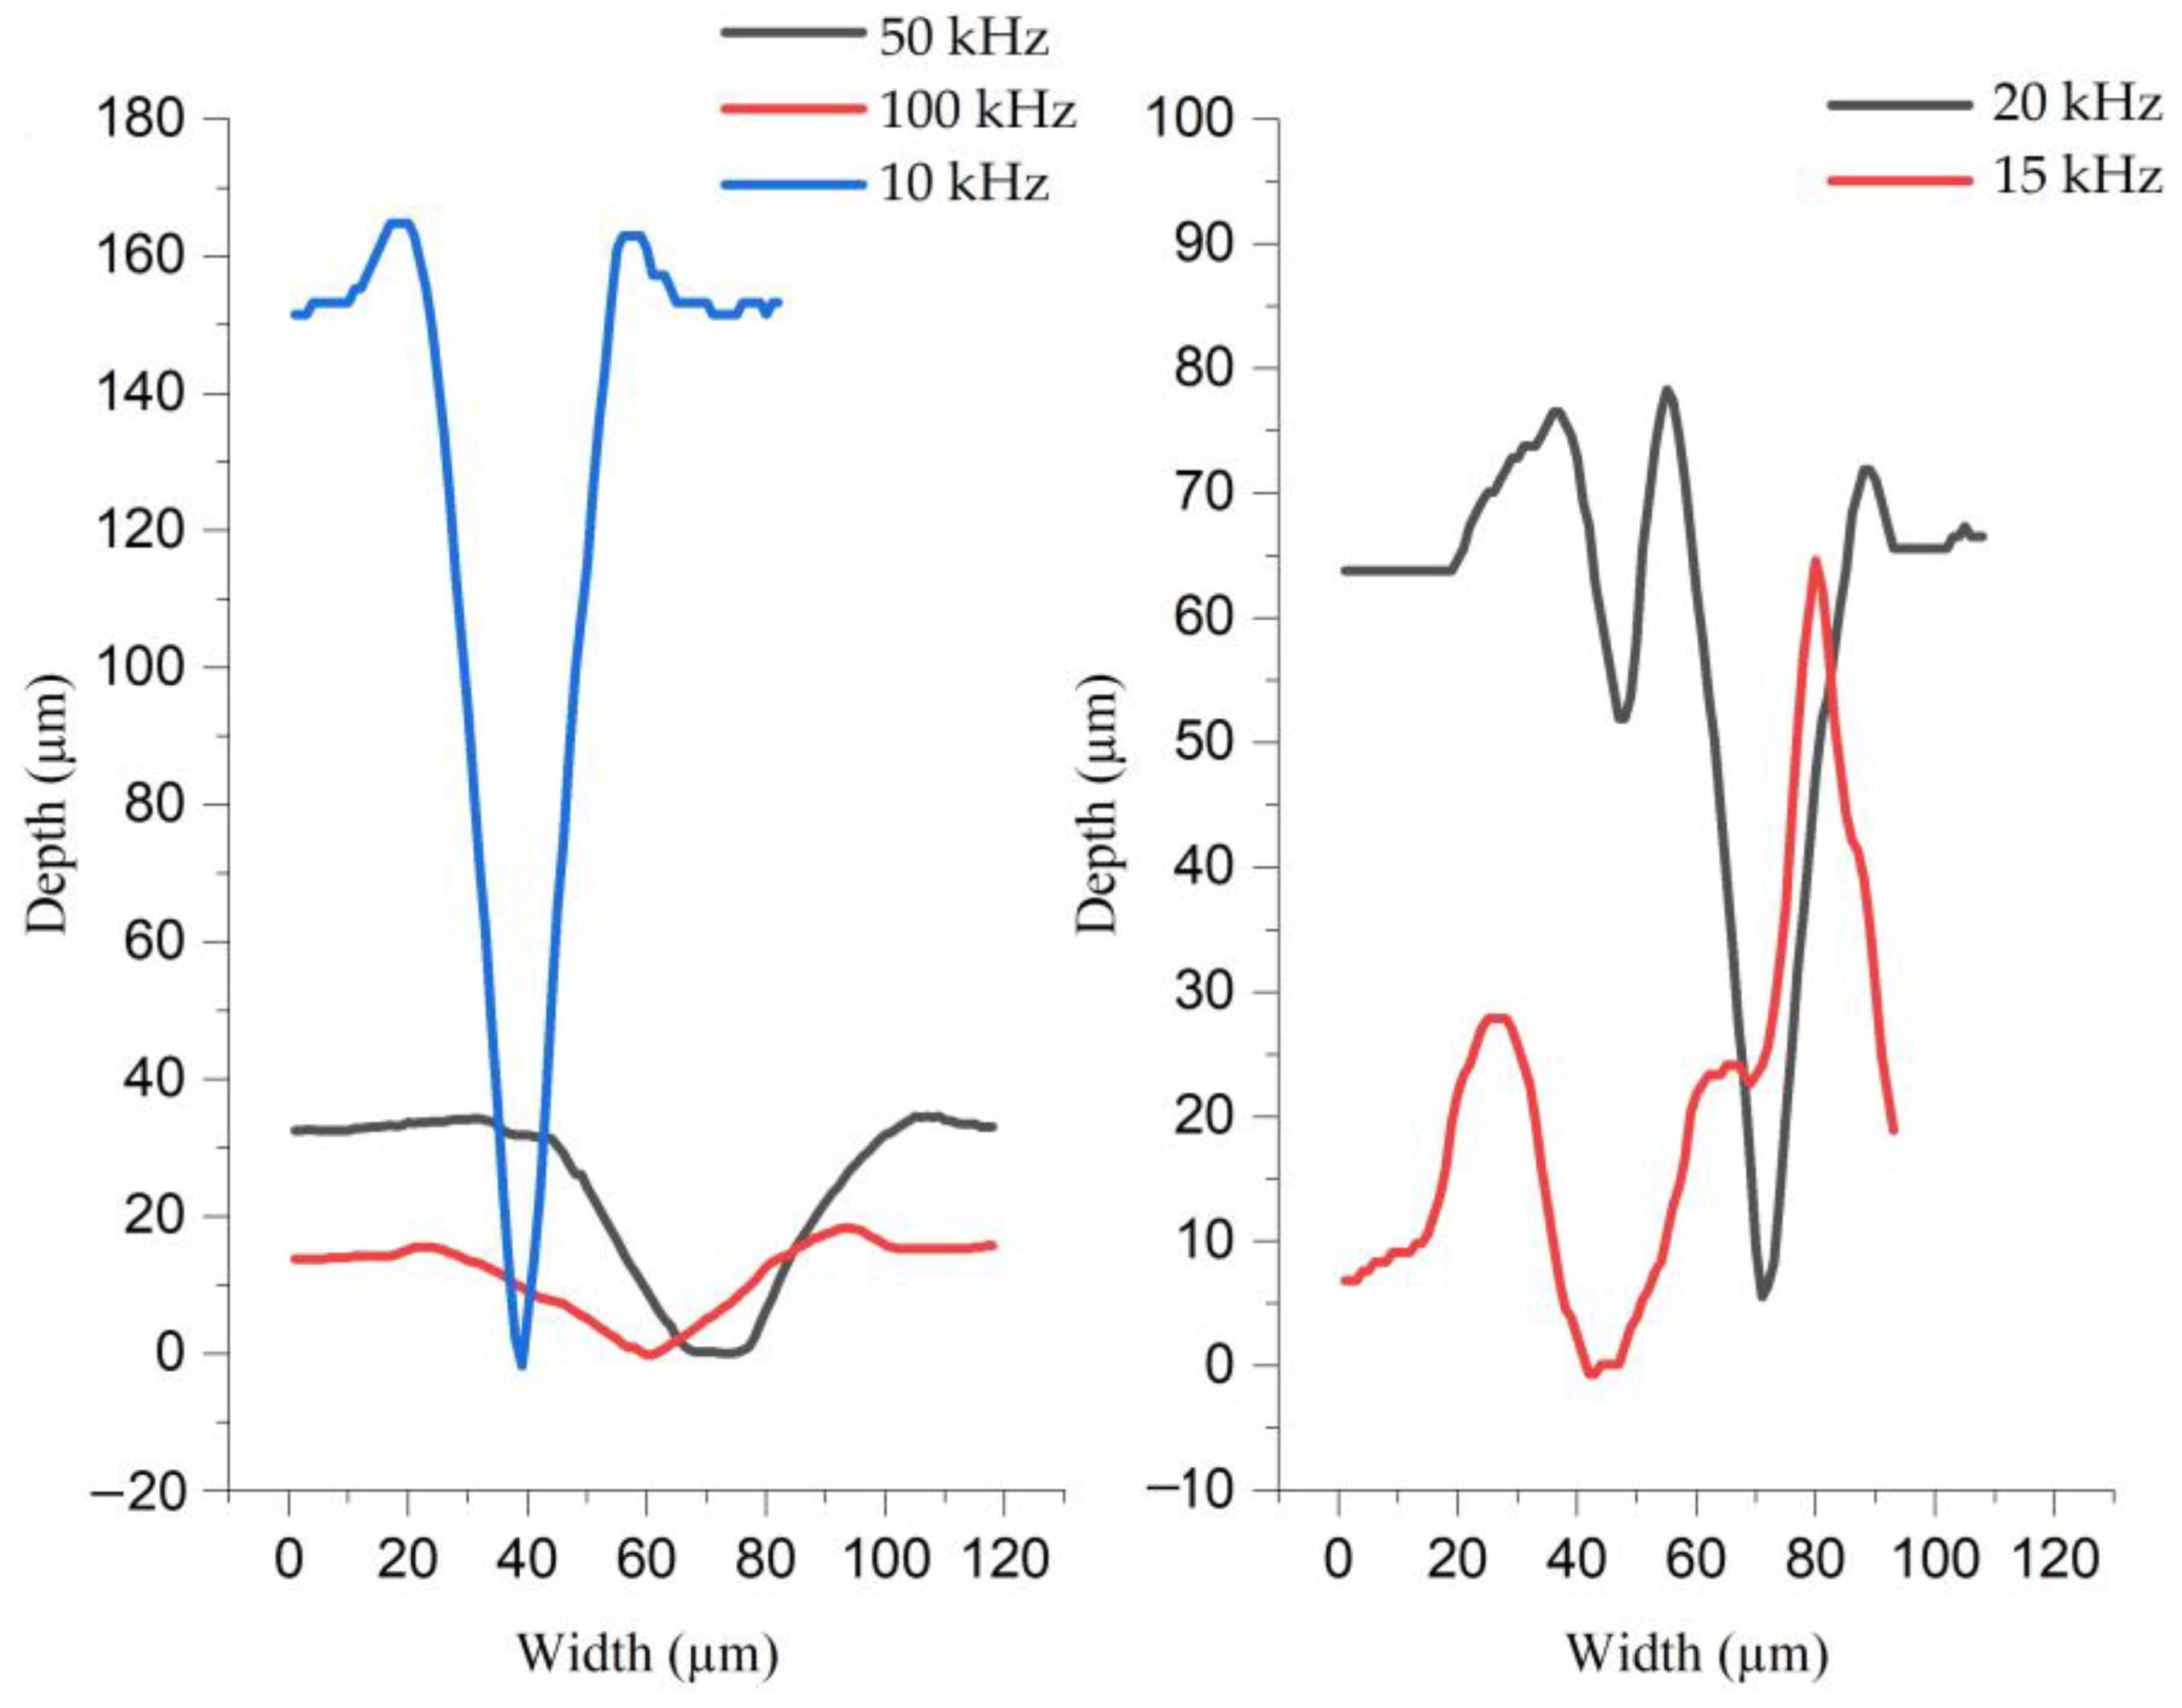
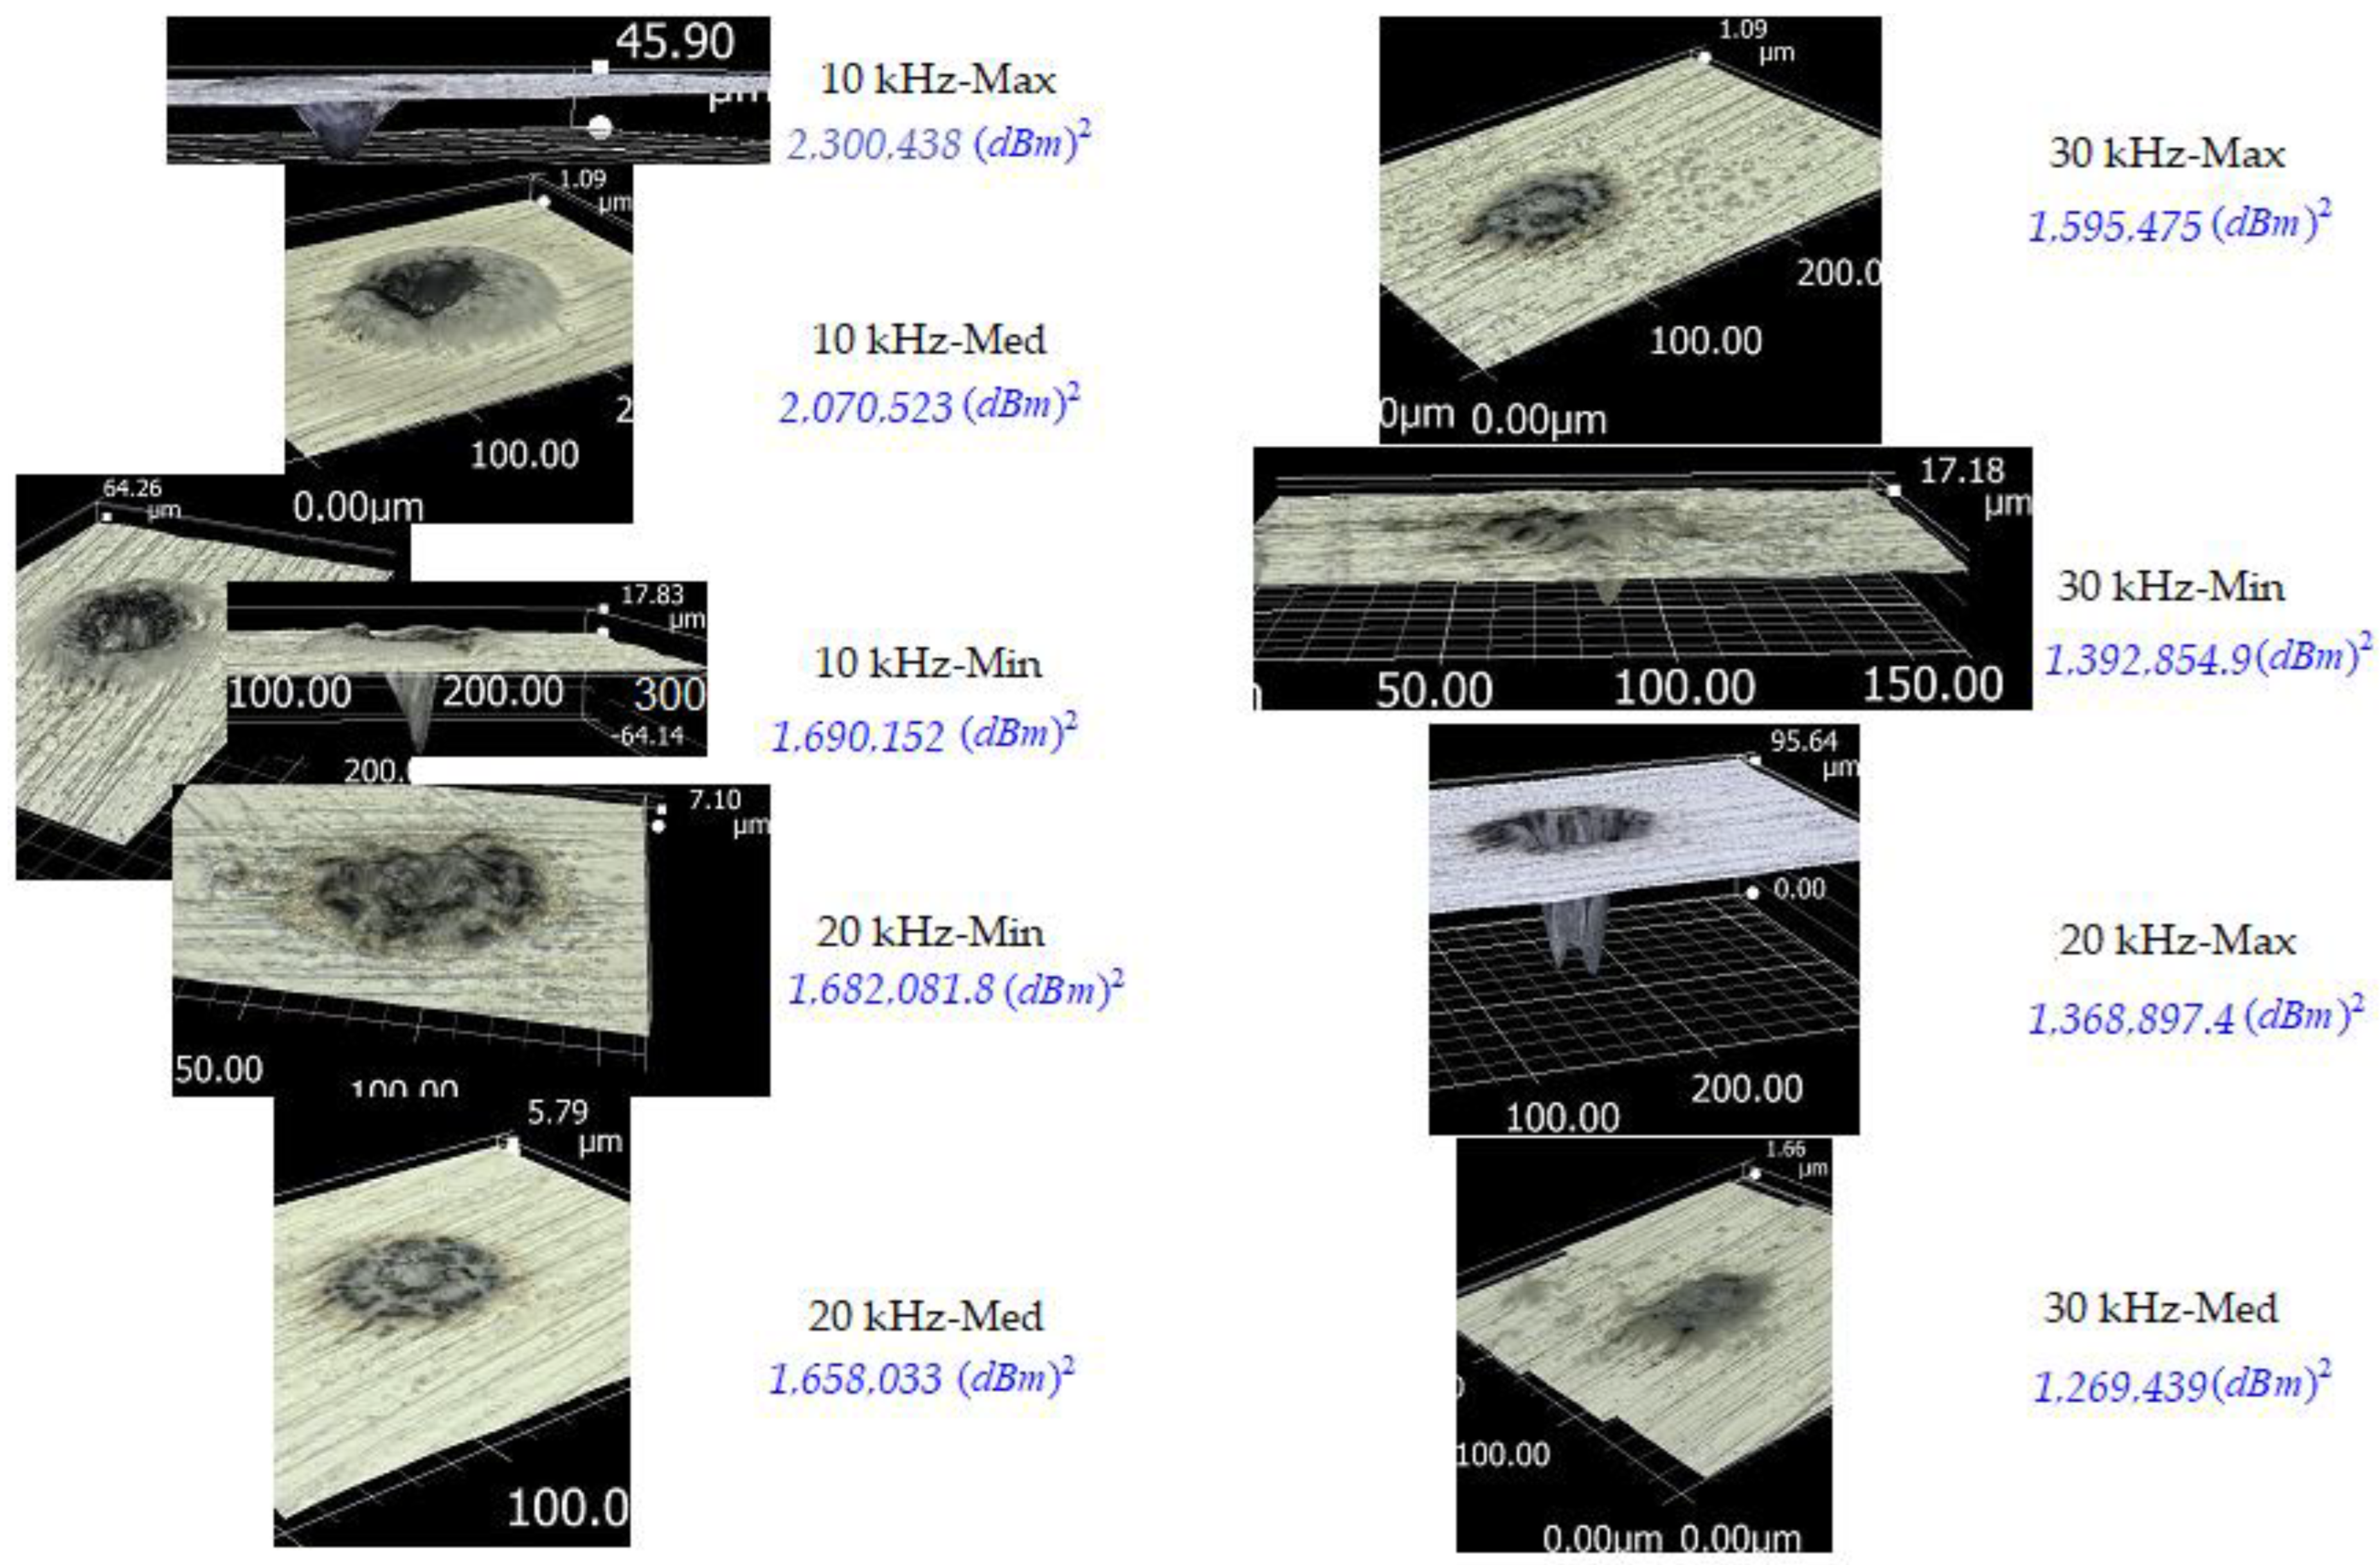
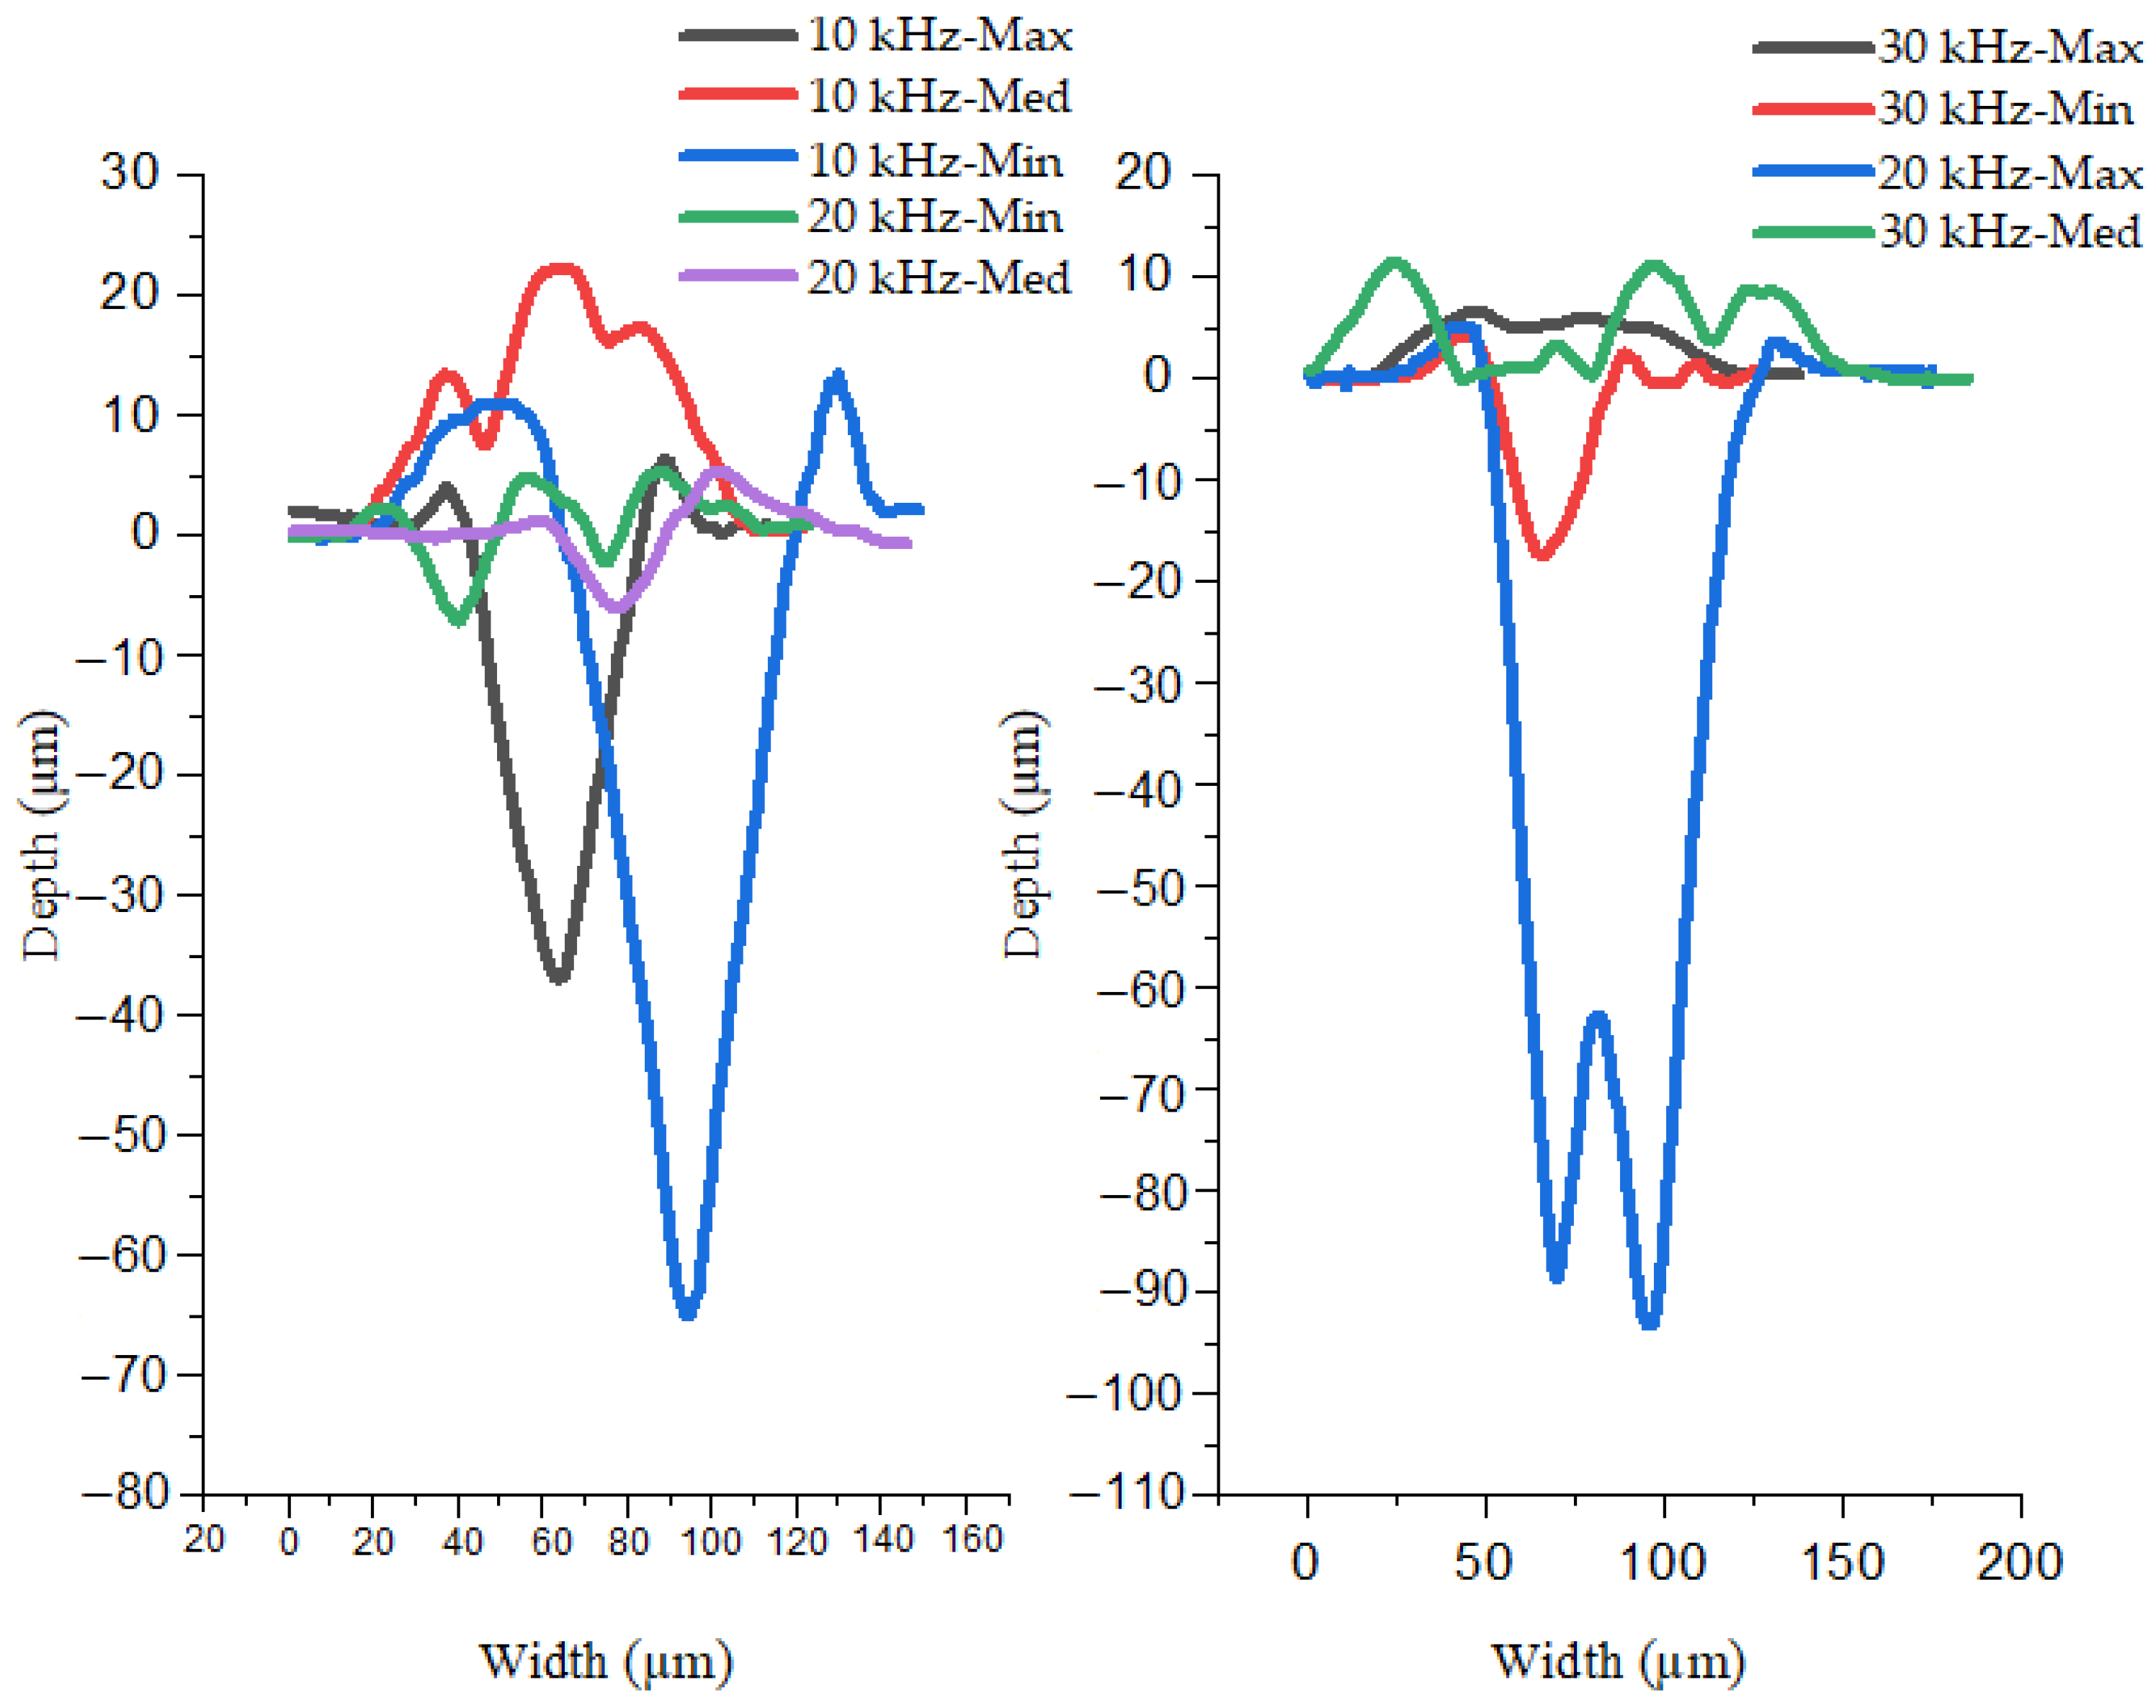
3. Results and Discussion

3.1. Received RF Power and Ablation Formation

The 3D microscopic images, 2D profile images of depth and 2D measured spatter area for the first category of samples (“Part 1”) are plotted in Figure 4, Figure 5 and Figure 6, respectively, and the second category of the samples (“Part 2”) are shown in Figure 7, Figure 8 and Figure 9 in the same sequence. Applying Equation (1) to the received RF powers, the values of the recorded RFP2 (dBm)2 are shown in Figure 4 and Figure 7 using blue typeface.
According to the results in Figure 4 and Figure 6, the highest received RF power was related to the 15 kHz repetition rate, where one can observe that the SA is also the maximum. In sequence, the minimum RFP2 to the maximum RFP2 values run from the laser repetition rates of 50, 100, 10, 20 to 15 kHz. The measured SAs are also in this sequence. Similarly, this relation was elucidated in the results from the second part of the experiments, as per Figure 7. The maximum to minimum received RFP2 values were related to a sequence running from 10 kHz-Max to 30 kHz-Med, and the measured SA are in this sequence as well, as shown in Figure 9. It is clear there was a correlation between RFP2 and SA, and this is now further elucidated.
Two related phenomena can also be observed: (i) the first is related to the RF energy that radiated from an ablated point across the timeframe of the ablation process; (ii) the second relates to the interaction of the laser beam energy with the surface that leads to measurable metallurgical, geometrical and quality characteristics of the ablated surface, such as spatter area, depth and ejected particles.
It is noteworthy that the RF power spectra data are related to the aforementioned second phenomenon, and knowledge of the laser parameters PL and RRL and the received RF power (in fact, we used RFP2) can be used to predict the SA and depth of ablation.
In this experiment, only two parameters of the laser were variable (PL (%) and RRL (kHz)), and the other parameters (such as ω: beam diameter) were constant. Thus, the laser fluence (F) was simply proportional to the pulse energy (Ep) or PL/RRL, according to Equation (2) below:
F = E p π ( ω / 2 ) 2 ; E p = P L ( % ) R R L
In this equation, the PL is normalised and, because of this, it is written as a percentage. To analyse this further, consider when a pulsed laser beam interacts with the metal surface, using the received RF power, and Equation (2). If the laser beam fluence is not sufficient to produce any hole depth, a large spatter area (SA) is created, and a significant RF power across a range of ion plasma frequencies, ωpi, is released (see 10 kHz-Med, 20 kHz-Med, 20 kHz-Min and 30 kHz-Max in Figure 8). Significant RF spectral components appear in the 100–400 MHz range, as confirmed in [5,19]. In some cases, the fluence is so low one cannot make significant changes to the SA on the surface (see, e.g., 30 kHz-Med in Figure 9 when a lower emitted RF power was captured). If the fluence of the laser is high enough, the surface can now be ablated/drilled. These holes are relatively deep, and the flows of melted solid move upwards or can be evaporated [3,6,17,22]. In this situation a more random phenomenon can occur. Sometimes this high fluence produces a deep hole without an SA (or with a smaller SA) (for example, 50, 100 and 10 kHz in Figure 5 and 20 kHz-Max in Figure 8), but sometimes the laser energy can drill a hole and produce a considerable SA (see 15 and 20 kHz in Figure 5 and Figure 6 and 10 kHz-Max in Figure 8 and Figure 9). While not fully understood, it is most likely that, if the material ejected via ablation hits the inner sidewall of the hole and does not have enough momentum, it cannot rise above and be extracted from the hole and, thus, it does not produce a spatter area (SA) on the surface. Therefore, we cannot receive all of the RF power, and one can only receive a fraction of the RF energy from the plasma plume further down in the hole.
The SA corresponding to each received RF power for the two parts of the experiments are summarised in Figure 10. It is clear that the relationship between SA and RFP2 is not linear. This can be observed from the linear regression plots in Figure 10a,b, i.e., the brown, dotted and straight lines in both plots. It appears that the actual relationship is more complex and can be an estimated fit by a series of polynomials, as shown by the blue, dotted curves in Figure 10a,b. This is not surprising, considering the complexity of the processes involved in the production of a spatter area. As one can observe from Figure 10a,b, the dependence of the SA on RFP2 is quite complicated. For example, that possible (poorer) fit to the data would be to use a simple linear regression, as shown in the brown, dotted lines in Figure 10, or the quartic fit (e.g., the blue, dotted lines). Another possibility is to use three straight-line fits, each with different slopes, which could indicate the involvement of different energies and RF generation mechanisms. The calculated equations related to the three fitted linear approximations are displayed in the coloured rectangles in Figure 10a,b. This can suggest an approximate estimation of the SA according to the received RFP2. For example, if we receive an RFP2 equal to 1,136,674.659 dBm2, as in the “Part 1” experiment (50 kHz), shown in Figure 10a, the calculated SA would be 2142.3594544 µm2, while the experiments resulted in an average value of 2089.48 µm2 using microscopy. As observed here, there is an approximately 50 µm2 error. Therefore, we can consider this fitting to be within a ±50 µm2 error. Similarly, consider the received RFP2 = 1,595,475 (30 kHz-Max in the “Part 2” experiment) in Figure 10b as an example. The calculated SA according to the fitted formula is 2271.3675 µm2, while the experimental measurement resulted in 2157.9 µm2, with an approximately 113 µm2 error. We expect that these errors can be lowered as more data are recorded. This will require further study.
While it may be coincidental, it is interesting to note that the piecewise slopes indicated by the purple lines for the two distinct experimental regimes, especially in Figure 10a, are nearly identical, indicating a similar SA vs. RFP2 dependency, albeit offset from each other. The significance of this will be explored in further work.
In Part 2 of the experiments, the applied power was the maximum (Max = 100%) for 10 kHz, and it was 68% and 60% for 20 and 30 kHz pulse rates, respectively. Therefore, the effective laser fluences will be lower, respectively. This is in addition to their higher RRLs, which also leads to lower fluence. Therefore, because of its lower pulse energy, the ablation depth for the 30 kHz repetition rate (the highest RRL in the second part of the experiments) cannot be high and, thus, the evaporation, plasma plume intensity and ejected particle flux will be lower. The RFP2 data confirm this hypothesis (see SA result according to received RFP2 in Figure 9). In addition, two other examples from the first set of experiments (50 and 100 kHz pulse rates in Figure 6) also support this hypothesis. Consequently, the combination of received RF power, PL (%) and RRL can be used for a reasonable analysis of the SA and depth of ablation.

3.2. Definition of RF Regulation (RFR) (%)

Based on the previous calculations, we defined a scaling factor, which we call the RF regulation. For determining this factor, the R F P 0 2 , which is the minimum RFP2 for the lowest SA with the deepest hole, was considered. In this experiment for the aluminium and a laser setting of 20 kHz-Max, the lowest SA and the deepest hole were produced (see Figure 7, Figure 8 and Figure 9). This condition is considered the initial state and, therefore, R F P 0 2 = 1,368,800 (dBm)2. Then, the RFR is calculated according to:
R F R e g u l a t i o n ( % ) = R F P 2 - R F P 0 2 R F P 0 2 × 100
Higher   R F R     larger   ( wider )   SA
If the RF regulation (RFR) percentage is close to zero, this implies that a lower RF power is received, and if it is higher than zero, this implies a higher received RF power.

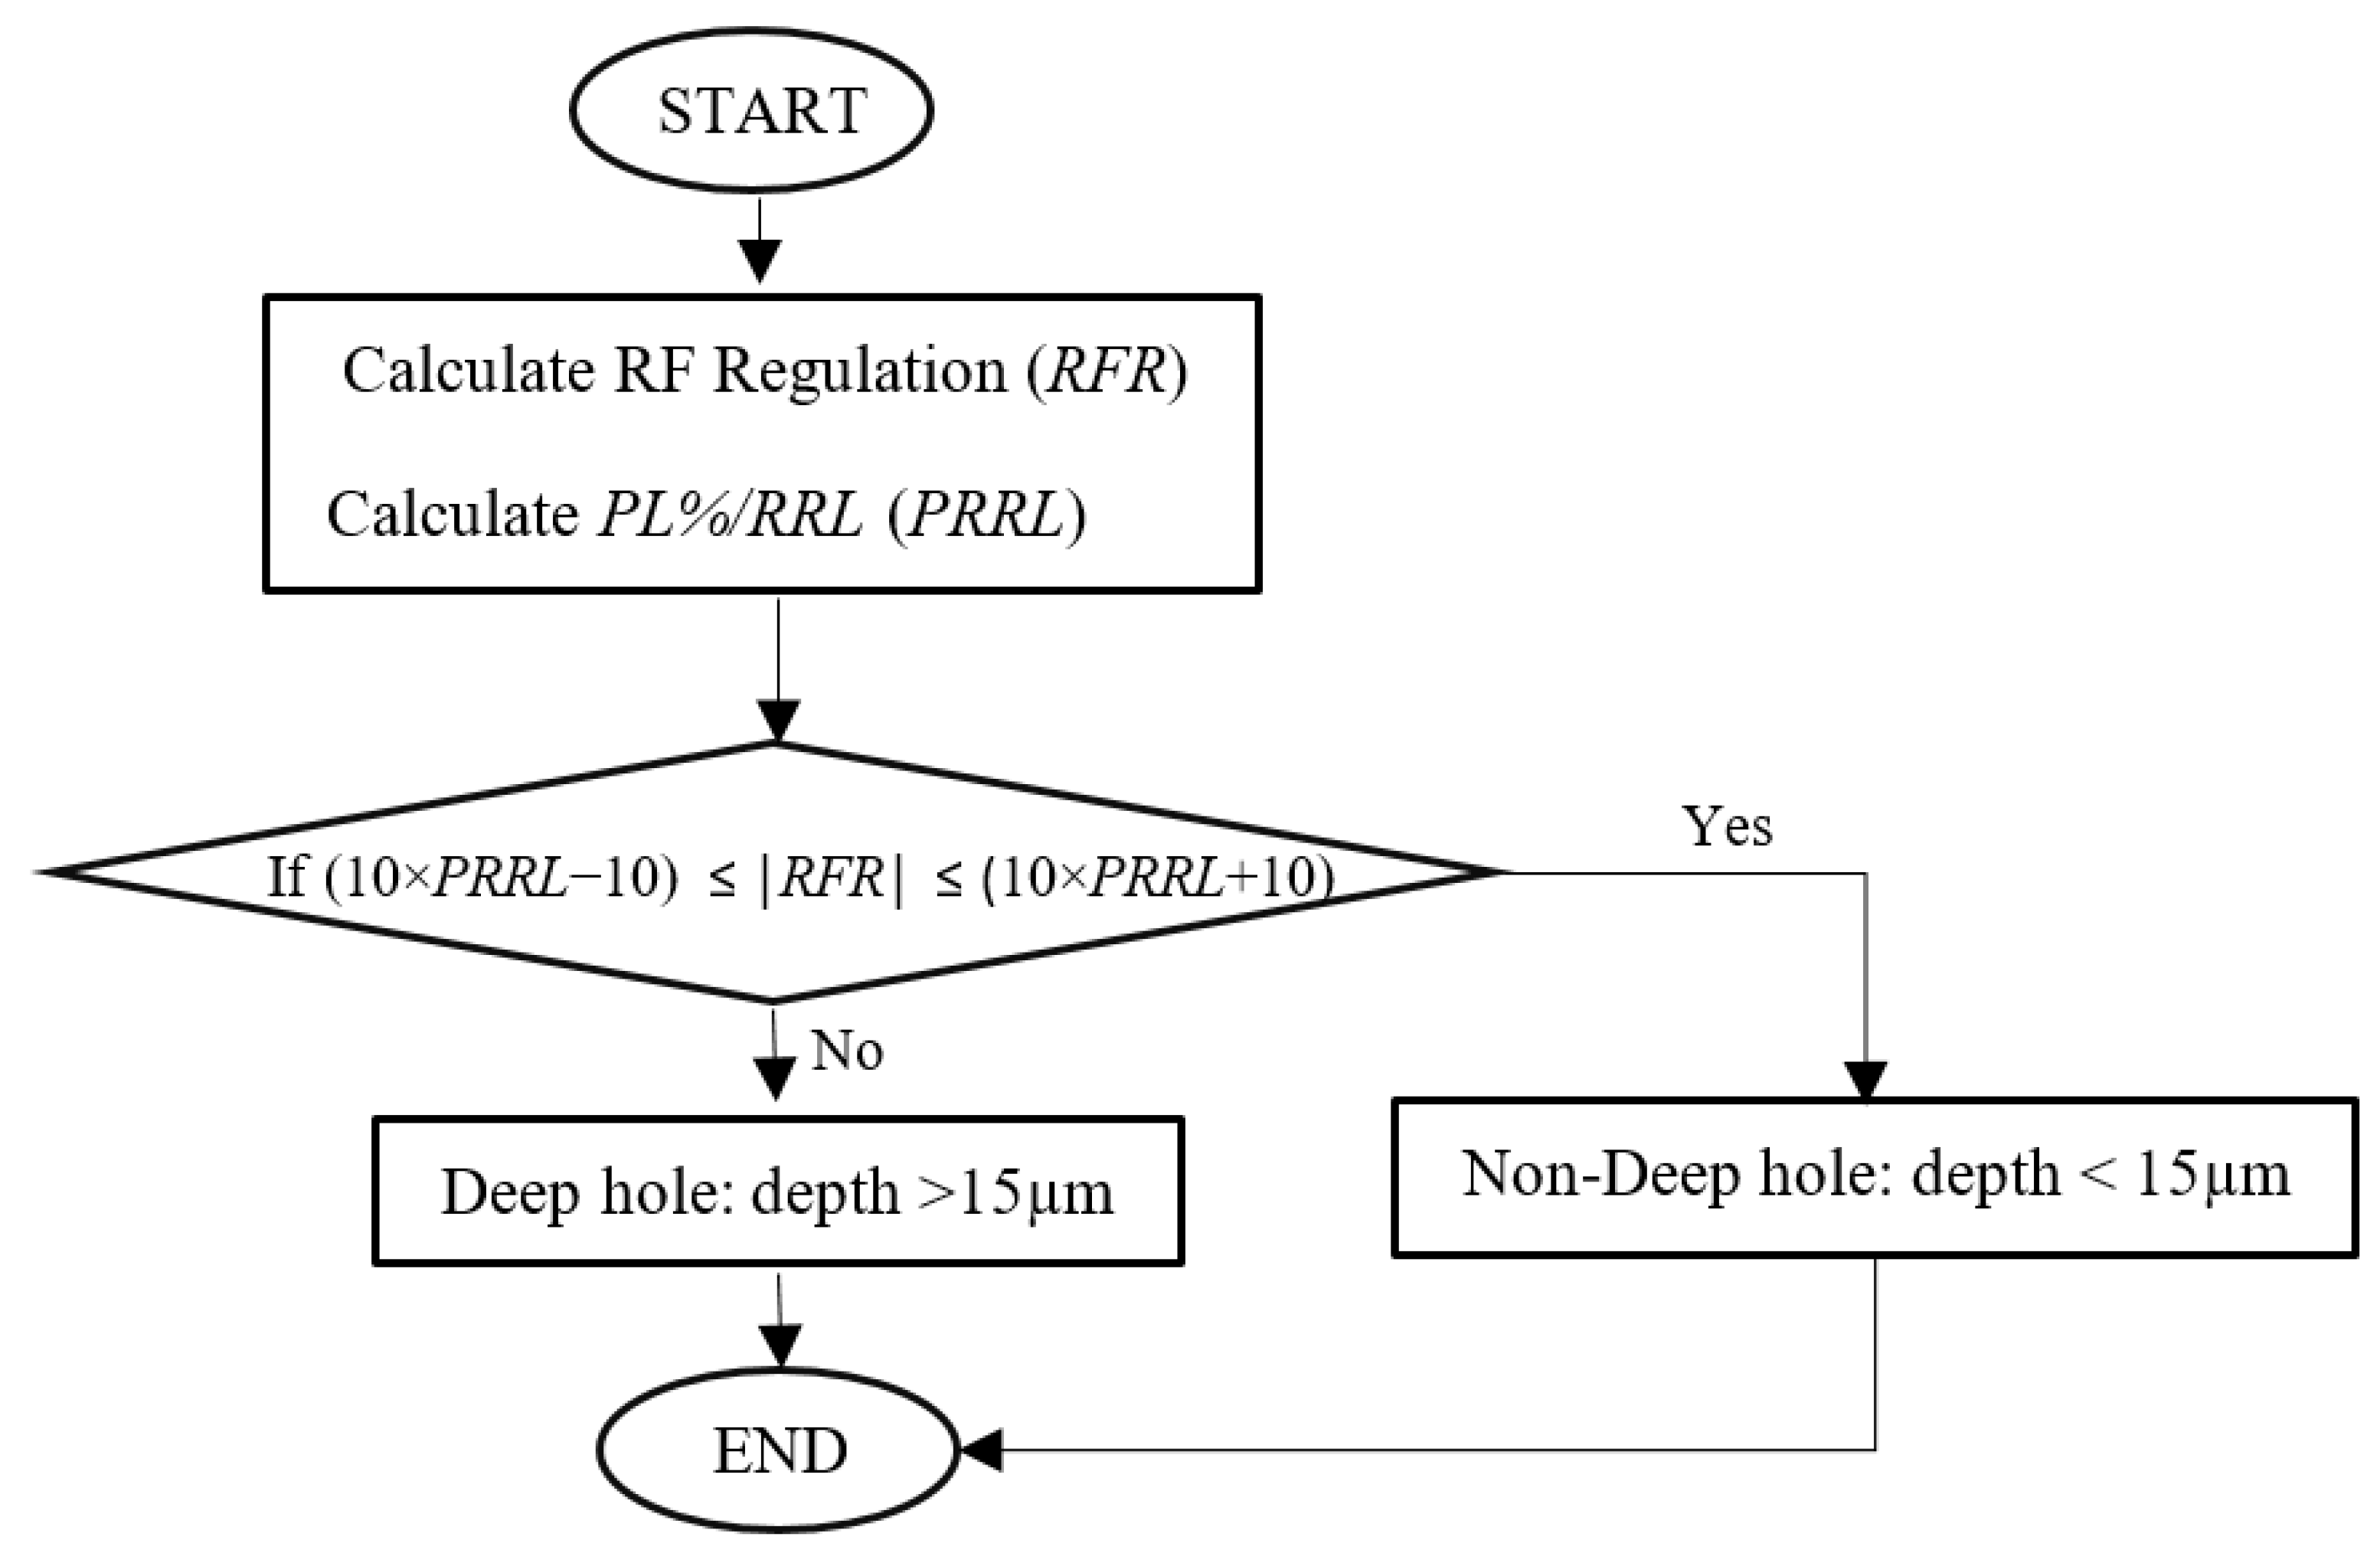
3.3. Diagnostic Process (Flowchart): How to Evaluate Depth of Ablation with RF Power by Considering Beam Characteristics (PL and RRL)

According to the above discussion and using Equation (2), the diagnostic and analysis process starts by calculating the RFR, but it is not enough. When the RF power is received from a random event due to the interaction of the laser with the surface, a knowledge of both the PL and RRL is also necessary. Since the laser fluence is inversely proportional to the RRL and directly proportional to the PL, one seeks to define the PL%/RRL ratio (PRRL) in this process.
After calculating the RFR and PRRL, a comparison is made between the RFR and 10 × PRRL, in accordance with the flowchart shown in Figure 11. The prefactor 10 was determined experimentally. This comparison can be used to determine if the laser pulse has enough energy to ablate the hole. For the circumstances described herein, we found that 10 × PRRL will be bigger than RFR. If the energy of the laser pulse is lower than that, then 10 × PRRL will be lower than RFR, and the ablated hole cannot be formed.
This diagnostic flowchart is based on the experimental results, and a summary of the aforementioned factors and measured ablation depths is provided in Table 3.
It was observed that a comparison between 10 × PRRL and RFR results in an estimation of the ablated depth. This reliability of this procedure is confirmed by experiment. For example, in the case of 10 kHz-Med, the RFR was approximately equal to 10 × PRRL. According to the diagnostic flowchart (Figure 11), the ablated depth should be less than 15 µm, which is confirmed in practice. Similar scenarios are also observed for 20 kHz-Min, 20 kHz-Med, 30 kHz-Max and 30 kHz-Med (i.e., the depths highlighted in bold in Table 3), where depth is smaller than 15 µm. The profiles of the ablated holes can also be clearly observed in Figure 8. In short, if the ∣RFR∣ is greater than (10 × (PRRL + 1)) or smaller than (10 × (PRRL − 1)), the depths of ablation are estimated to be larger than 15 µm.
This implies that the formation of an SA and ablated hole depths can be categorised. Examples of the diagnostics using the current experiments follow below:
Thus, not only are changes in depth being estimated but also the influence of laser parameters to change the depth, which can be evaluated and implemented in a real-time ablation process, wherein the values of RRL and PL can be controlled to produce a desirable ablation hole depth.

4. Conclusions

In this study, a prediction strategy was found by measuring the received RF power in real time and in-process to evaluate the formation of the spatter area and depth of laser ablation. The following conclusions were obtained:
(1)
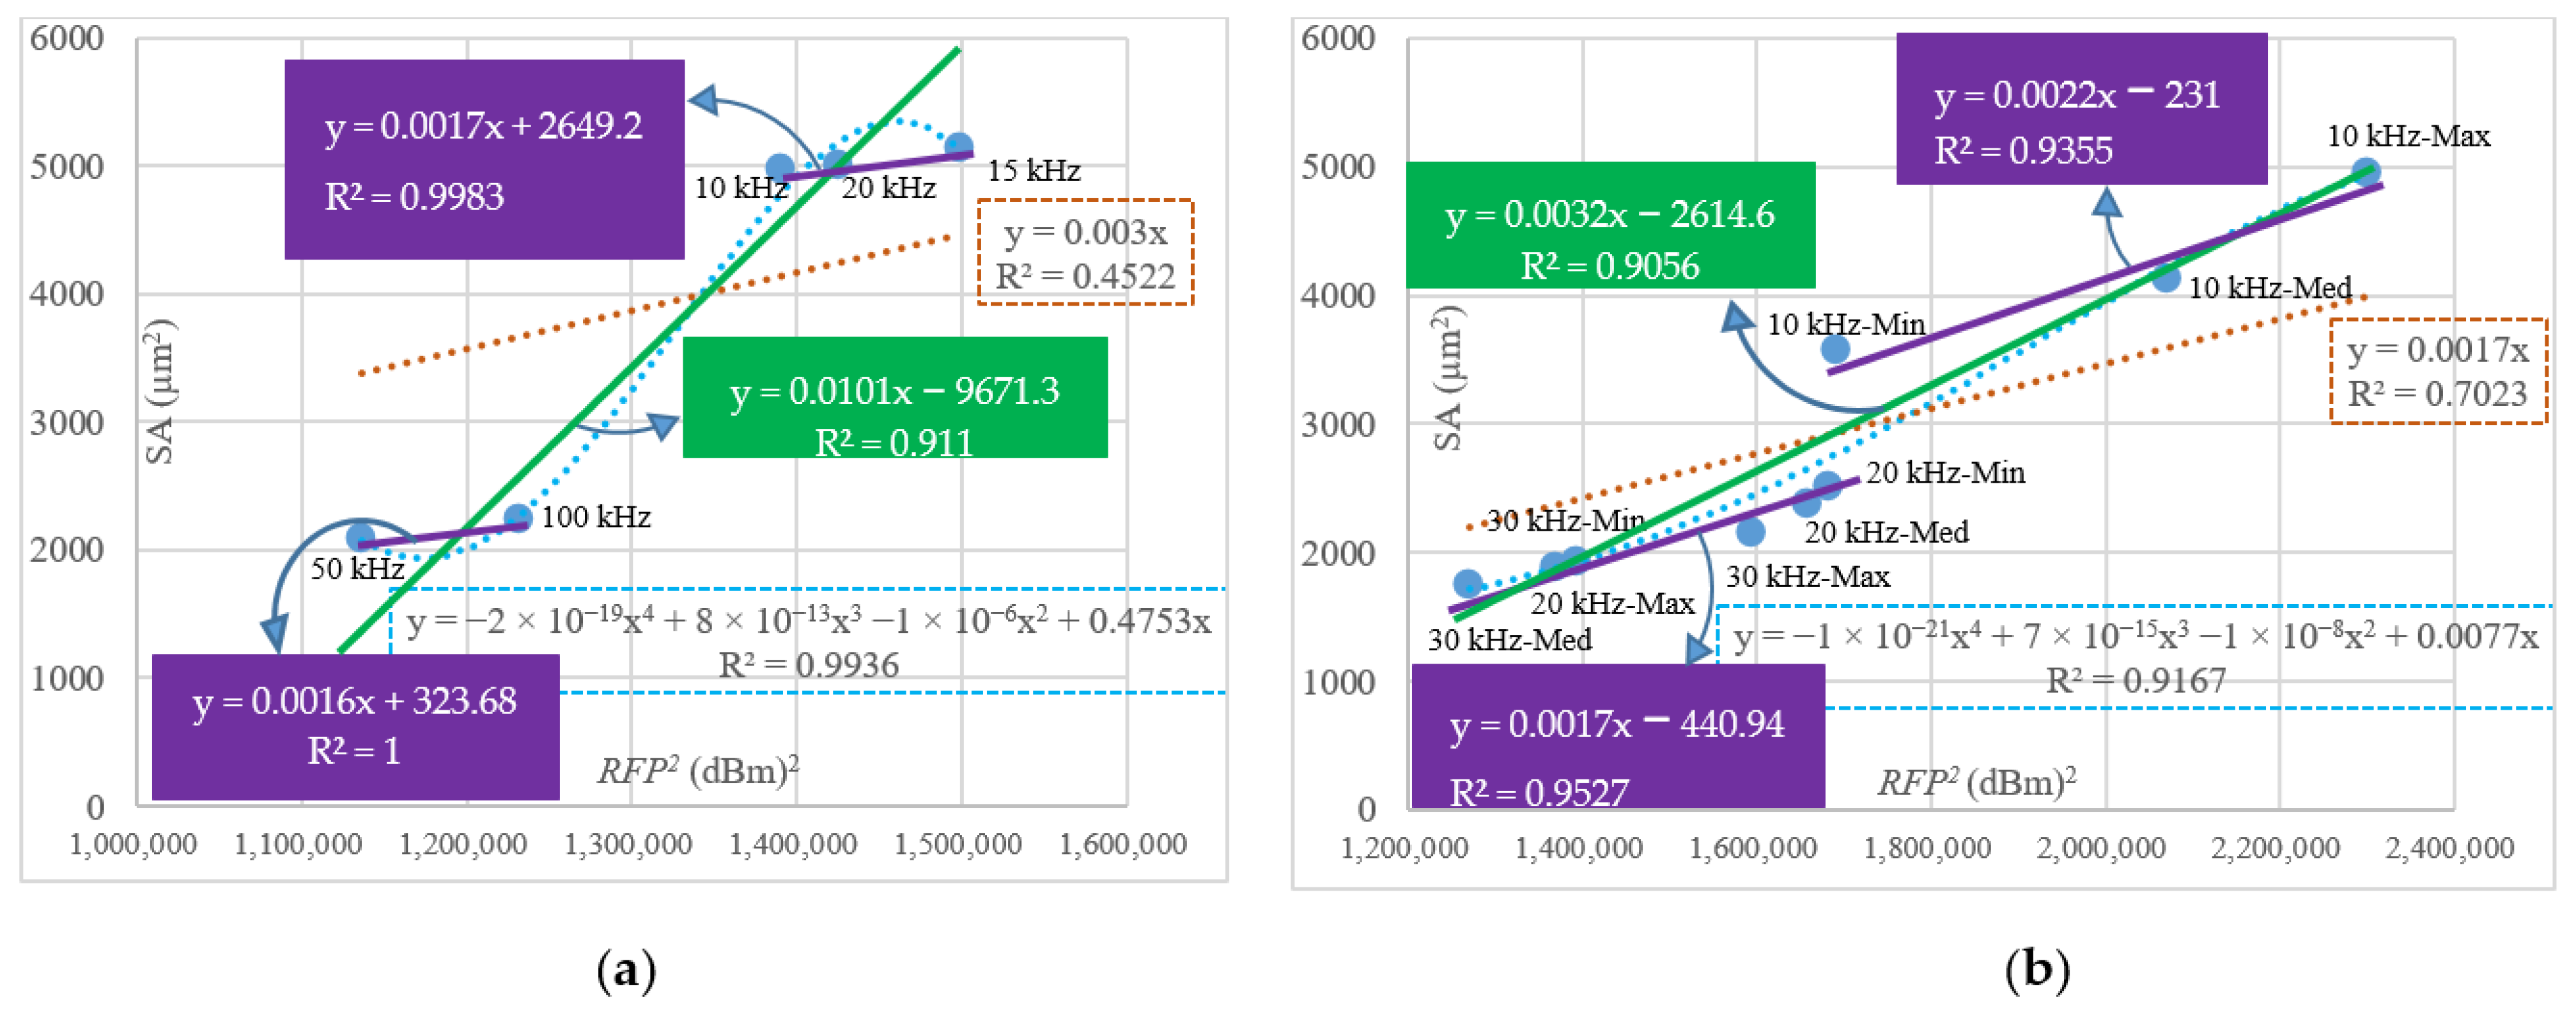
According to the experimental results, a relationship between RFP2 and spatter area (SA) was confirmed. It was observed that the greater the value of RFP2, the greater the extent of the SA formation. This leads to a real-time analysis factor to evaluate the SA in-process.
(2)
On the basis of (1), a calibration of the received RF data was conducted in order to define a factor called RF regulation % (RFR). In fact, RFR describes the SA variation on the surface. In another words, larger RFR values correspond to a larger SA.
(3)
Finally, by comparing the value of the PRRL (a factor of laser beam fluence) and RFR, a diagnostic process for real-time evaluation of the depth of ablation was proposed and experimentally confirmed. As a trial, this diagnostic process was tested based on whether the laser fluence for the ablation is large enough to form a hole depth greater than 15 µm, in aluminium. It was found that the received RFP will be less than an experimentally calibrated PRRL proportion (i.e., 10 × PL/RRL), which indicates that some RF power can escape from the deep hole with some interaction to the internal sidewall of the deeper ablated holes (i.e., received RF power decreases).
In summary, a technique based on measuring the RFP2 factor can provide a solution and real-time analysis options for the in-line assessment of spatter area and depth of laser metal ablation. This should help to better understand the ablation process and lead to a better control of laser micromachining parameters. It may also be useful to improve the hole quality using the obtained information in materials processing and manufacturing applications.

5. Patents

A patent application was filed on 23 December 2022 based on this work.

Author Contributions

Conceptualisation, M.S. and H.H.; methodology M.S. and H.H.; validation, M.S., H.H. and P.J.M.; investigation, M.S.; writing—original draft preparation, M.S.; writing—review and editing, P.J.M. and M.S.; supervision, P.J.M. All authors have read and agreed to the published version of the manuscript.

Funding

This publication has emanated from research supported by a research grant from Science Foundation Ireland (SFI), under grant number 16/RC/3872, and is cofunded under the European Regional Development Fund.

Data Availability Statement

The data presented in this study are available upon request from the corresponding author. The data are not publicly available due to the fact that the data form part of an ongoing study.

Acknowledgments

M.S. gratefully acknowledges the assistance of É. McCarthy. The authors acknowledge the Nano Research Facility in Dublin City University for the 3D microscopy.

Conflicts of Interest

The authors declare no conflict of interest.

Appendix A

Table A1. The composition table of the material, including the min. and max. percentages of impurities and the corresponding contents of Al 1050.
SiFeCuMnMgZnTiAl
Max.0.250.400.050.050.050.070.0599.5
Min.0.140.180.0010.0010.0010.0030.01299.64

References

  1. Breitling, D.; Ruf, A.; Dausinger, F. Fundamental aspects in machining of metals with short and ultrashort laser pulses. In Photon Processing in Microelectronics and Photonics III; SPIE: Bellingham, WA, USA, 2004; Volume 5339, pp. 49–63. [Google Scholar]
  2. Zhou, R.; Zhang, Z.; Hong, M. The art of laser ablation in aeroengine: The crown jewel of modern industry. J. Appl. Phys. 2020, 127, 080902. [Google Scholar]
  3. Zhao, W.; Wang, W.; Jiang, G.; Li, B.Q.; Mei, X. Ablation and morphological evolution of micro-holes in stainless steel with picosecond laser pulses. Int. J. Adv. Manuf. Technol. 2015, 80, 1713–1720. [Google Scholar] [CrossRef]
  4. Zhao, W.; Shen, X.; Liu, H.; Wang, L.; Jiang, H. Effect of high repetition rate on dimension and morphology of micro-hole drilled in metals by picosecond ultra-short pulse laser. Opt. Lasers Eng. 2020, 124, 105811. [Google Scholar] [CrossRef]
  5. Samimi, M.; Hosseinlaghab, H.; McCarthy, É.; McNally, P.J. Multi-Messenger Radio Frequency and Optical Diagnostics of Pulsed Laser Ablation Processes. J. Manuf. Mater. Process. 2022, 6, 106. [Google Scholar] [CrossRef]
  6. Mustafa, H.; Pohl, R.; Bor, T.C.; Pathiraj, B.; Matthews, D.T.A.; Römer, G. Picosecond-pulsed laser ablation of zinc: Crater morphology and comparison of methods to determine ablation threshold. Opt. Express 2018, 26, 18664–18683. [Google Scholar] [CrossRef] [Green Version]
  7. Zhu, H.; Zhang, Z.; Zhou, J.; Xu, K.; Zhao, D.; Tangwarodomnukun, V. A computational study of heat transfer and material removal in picosecond laser micro-grooving of copper. Opt. Laser Technol. 2021, 137, 106792. [Google Scholar] [CrossRef]
  8. Cheng, J.; Cao, J.; Huang, Y.; Edwardson, S.; Perrie, W.; Dearden, G.; Liu, D. Metal ablation study with a 10 picosecond laser under low and median fluence. Opt. Laser Technol. 2020, 121, 105792. [Google Scholar] [CrossRef]
  9. Li, X.; Guan, Y. Theoretical fundamentals of short pulse laser–metal interaction: A review. Nanotechnol. Precis. Eng. 2020, 3, 105–125. [Google Scholar] [CrossRef]
  10. Döring, S.; Richter, S.; Nolte, S.; Tünnermann, A. In situ imaging of hole shape evolution in ultrashort pulse laser drilling. Opt. Express 2010, 18, 20395–20400. [Google Scholar] [CrossRef]
  11. He, X.; Chen, B.; Chen, Y.; Li, R.; Wang, F. Femtosecond laser-ablation spark-induced breakdown spectroscopy and its application to the elemental analysis of aluminum alloys. J. Anal. At. Spectrom. 2018, 33, 2203–2209. [Google Scholar] [CrossRef]
  12. Li, Q.; Yang, L.; Hou, C.; Adeyemi, O.; Chen, C.; Wang, Y. Surface ablation properties and morphology evolution of K24 nickel based superalloy with femtosecond laser percussion drilling. Opt. Lasers Eng. 2018, 114, 22–30. [Google Scholar] [CrossRef]
  13. Hopp, B.; Kresz, N.; Vass, C.; Toth, Z.; Smausz, T.; Ignacz, F. Spatial separation of fast and slow components of pulsed laser plumes. Appl. Surf. Sci. 2002, 186, 298–302. [Google Scholar] [CrossRef]
  14. Bittencourt, J.A. Fundamentals of Plasma Physics; Springer Science & Business Media: Berlin/Heidelberg, Germany, 2004. [Google Scholar]
  15. Dendy, R.O. Plasma Physics: An Introductory Course; Cambridge University Press: Cambridge, UK, 1995. [Google Scholar]
  16. Döring, S.; Szilagyi, J.; Richter, S.; Zimmermann, F.; Richardson, M.; Tünnermann, A.; Nolte, S. Evolution of hole shape and size during short and ultrashort pulse laser deep drilling. Opt. Express 2012, 20, 27147–27154. [Google Scholar] [CrossRef]
  17. Döring, S.; Ullsperger, T.; Heisler, F.; Richter, S.; Tünnermann, A.; Nolte, S. Hole formation process in ultrashort pulse laser percussion drilling. Phys. Procedia 2013, 41, 431–440. [Google Scholar] [CrossRef]
  18. Shen, N.; Bude, J.D.; Ly, S.; Keller, W.J.; Rubenchik, A.M.; Negres, R.; Guss, G. Enhancement of laser material drilling using high-impulse multi-laser melt ejection. Opt. Express 2019, 27, 19864–19886. [Google Scholar] [CrossRef]
  19. Kumar, L.V.; Manikanta, E.; Leela, C.; Kiran, P.P. Effect of laser intensity on radio frequency emissions from laser induced breakdown of atmospheric air. J. Appl. Phys. 2016, 119, 214904. [Google Scholar] [CrossRef]
  20. Consoli, F.; Tikhonchuk, V.T.; Bardon, M.; Bradford, P.; Carroll, D.C.; Cikhardt, J.; Cipriani, M.; Clarke, R.J.; Cowan, T.E.; Danson, C.N.; et al. Laser produced electromagnetic pulses: Generation, detection and mitigation. High Power Laser Sci. Eng. 2020, 8, e22. [Google Scholar] [CrossRef]
  21. Ahn, D.-G.; Jung, G.-W. Influence of process parameters on drilling characteristics of Al 1050 sheet with thickness of 0.2 mm using pulsed Nd:YAG laser. Trans. Nonferrous Met. Soc. China 2009, 19, s157–s163. [Google Scholar] [CrossRef]
  22. Tunna, L.; O’Neill, W.; Khan, A.; Sutcliffe, C. Analysis of laser micro drilled holes through aluminium for micro-manufacturing applications. Opt. Lasers Eng. 2005, 43, 937–950. [Google Scholar] [CrossRef]
  23. Al-Sayyad, A.; Bardon, J.; Hirchenhahn, P.; Vaudémont, R.; Houssiau, L.; Plapper, P. Influence of aluminum laser ablation on interfacial thermal transfer and joint quality of laser welded aluminum–polyamide assemblies. Coatings 2019, 9, 768. [Google Scholar] [CrossRef] [Green Version]
  24. Smijesh, N.; Rao, K.H.; Chetty, D.; Litvinyuk, I.V.; Sang, R.T. Plasma plumes produced by laser ablation of Al with single and double pulse schemes. Opt. Lett. 2018, 43, 6081–6084. [Google Scholar] [CrossRef] [PubMed]
  25. Yuan, B.-S.; Wang, D.; Dong, Y.; Zhang, W.; Jin, G.-Y. Experimental study of the morphological evolution of the millisecond–nanosecond combined-pulse laser ablation of aluminum alloy. Appl. Opt. 2018, 57, 5743–5748. [Google Scholar] [CrossRef] [PubMed]
  26. Marimuthu, S.; Dunleavey, J.; Liu, Y.; Smith, B.; Kiely, A.; Antar, M. Characteristics of hole formation during laser drilling of SiC reinforced aluminium metal matrix composites. J. Mater. Process. Technol. 2019, 271, 554–567. [Google Scholar] [CrossRef]
Figure 1. Schematic of the experimental setup.
Jmmp 07 00056 g001
Figure 2. Power of laser (PL) for different repetition rates.
Jmmp 07 00056 g002
Figure 3. Received RF spectra for the spectra range 100–400 MHz across a 2 s long ablation process.
Jmmp 07 00056 g003
Figure 4. 3D microscopic images (left-hand side) and the values of the recorded RFP2 (dBm)2, written in the colour blue (right-hand side), for the received RF spectra of the “Part 1” experiments. As shown here, the RFP2 is displayed running from its lowest recorded value to its highest value. The values “50 kHz”, “100 kHz”, etc., refer to the repetition rate of laser (RRL).
Jmmp 07 00056 g004
Figure 5. 2D microscope profiles from the lowest RFP2, RRL = 50 kHz, to the highest, 15 kHz.
Jmmp 07 00056 g005
Figure 6. Spatter areas measured by 3D microscope, from the lowest SA (left) to the highest (right). The values “50 kHz”, “100 kHz”, etc., refer to the repetition rate of laser (RRL).
Jmmp 07 00056 g006
Figure 7. 3D microscope images and values of the RFP2 of the recorded RF spectra for the “Part 2” experiments. The 3D images are on the left side, and the values of the received RFP2 are on the right side, in blue, running from the highest RFP2 to the lowest value.
Jmmp 07 00056 g007
Figure 8. 2D microscope profiles (from highest RFP2, 10 kHz-Max, to the lowest, 30 kHz-Med).
Jmmp 07 00056 g008
Figure 9. Spatter areas measured by 3D microscopy from the highest SA to the lowest: 10 kHz-Max, 10 kHz-Med, 10 kHz-Min, 20 kHz-Min, 20 kHz-Med, 30 kHz-Max, 30 kHz-Min, 20 kHz-Max and 30 kHz-Med.
Jmmp 07 00056 g009
Figure 10. Spatter area (SA) and received RFP2 corresponding to the two second ablation process for experiments (a) Part 1 and (b) Part 2. The R-squared value of a fitted polynomial regression is shown using blue, dotted lines (the quartic polynomial for this fit is also shown). The linear regression fit is shown using the brown, dotted lines. The approximate fitted equations for the piecewise linear regression approximations (two purple lines and one green line for each chart) are shown in the coloured rectangles.
Jmmp 07 00056 g010
Figure 11. Flowchart of the in-process diagnostic of the depth of ablation formation using the received RF and laser properties.
Jmmp 07 00056 g011
Table 1. RRL (kHz), PL (W) and SDC (%) for the five points of the “Part 1” experiments.
StatuesRRL (kHz)PL (W)SDC (%)
10 kHz10 (kHz)1.5100%
15 kHz15 (kHz)2100%
20 kHz20 (kHz)2.5100%
50 kHz50 (kHz)3.2100%
100 kHz100 (kHz)3.5100%
Table 2. RRL (kHz), PL (W) and SDC (%) for nine points in the “Part 2” experiments.
StatuesRRL (kHz)PL (W)SDC (%)
10 kHz-Max10 (kHz)1.5100%
20 kHz-Max20 (kHz)1.568%
30 kHz-Max30 (kHz)1.560%
10 kHz-Med10 (kHz)0.7560%
20 kHz-Med20 (kHz)0.7549%
30 kHz-Med30 (kHz)0.7542%
10 kHz-Min10 (kHz)0.3541%
20 kHz-Min20 (kHz)0.3538%
30 kHz-Min30 (kHz)0.3534%
Table 3. RFR of the received RF power, calculated PRRL × 10 based on laser properties (RRL and PL) and measured SA and depth by 3D microscope for 9 states of laser hole ablation, from the maximum RFR and SA at the top to the minimum at the bottom of the table, together with the in-process depth diagnostic results. The depth lower than 10 µm are bolded.
Correlation of Spatter Area (SA) and RFR In-Process Depth Diagnostic ResultsPost-Process Depth Measurement Results
StatueSA (µm2)RFR (%)10 × PRRLIf Depth < 15 µm
(10 × PRRL−10) ≤ ∣RFR∣ ≤ (10 × PRRL + 10)
Depth (µm)
10 kHz-Max496268100No36.19
10 kHz-Med4124.951.260Yes0.78
10 kHz-Min3567.823.4741No63.52
20 kHz-Min2506.5522.8819Yes6.73
20 kHz-Med238921.1324.5Yes5.3
30 kHz-Max2157.916.5620Yes0.79
30 kHz-Min1934.581.7512No16.89
20 kHz-Max1885.10.0071134No94.57
30 kHz-Med1743.47−7.2514Yes0.88
Disclaimer/Publisher’s Note: The statements, opinions and data contained in all publications are solely those of the individual author(s) and contributor(s) and not of MDPI and/or the editor(s). MDPI and/or the editor(s) disclaim responsibility for any injury to people or property resulting from any ideas, methods, instructions or products referred to in the content.

