Article

Analysis of Spindle AE Signals and Development of AE-Based Tool Wear Monitoring System in Micro-Milling

Department of Mechanical Engineering, National Chung Hsing University, Taichung City 402, Taiwan
*
Author to whom correspondence should be addressed.
J. Manuf. Mater. Process. 2022, 6(2), 42; https://doi.org/10.3390/jmmp6020042
Submission received: 7 March 2022 / Revised: 2 April 2022 / Accepted: 5 April 2022 / Published: 7 April 2022
(This article belongs to the Special Issue Advances in Precision Machining Processes)

Abstract

:
Acoustic emission (AE) signals collected from different locations might provide various sensitivities to tool wear condition. Studies for tool wear monitoring using AE signals from sensors on workpieces has been reported in a number of papers. However, it is not feasible to implement in the production line. To study the feasibility of AE signals obtained from sensors on spindles to monitor tool wear in micro-milling, AE signals obtained from the spindle housing and workpiece were collected simultaneously and analyzed in this study for micro tool wear monitoring. In analyzing both signals on tool wear monitoring in micro-cutting, a feature selection algorithm and hidden Markov model (HMM) were also developed to verify the effect of both signals on the monitoring system performance. The results show that the frequency responses of signals collected from workpiece and spindle are different. Based on the signal feature/tool wear analysis, the results indicate that the AE signals obtained from the spindle housing have a lower sensitivity to the micro tool wear than AE signals obtained from the workpiece. However, the analysis of performance for the tool wear monitoring system demonstrates that a 100% classification rate could be obtained by using spindle AE signal features with a frequency span of 16 kHz. This suggests that AE signals collected on spindles might provide a promising solution to monitor the wear of the micro-mill in micro-milling with proper selection of the feature bandwidth and other parameters.

1. Introduction

Micro-mechanical cutting technology has attracted more attention in the past decades in micro-manufacturing due to the increase in demand for mechanical components with micro-features. A number of studies by Masuzawa [1], Dornfeld et al. [2], Chae et al. [3], and Balázs et al. [4] have been reported in the discussion of potential applications and challenges for the development of micro-mechanical cutting technology [1,2,3,4]. Micro-tool condition monitoring plays a vital role in maintaining the reliability and efficiency of the system in industry applications because of the weakness of micro-tools compared to their conventional counterparts. Tool condition monitoring uses signal features to identify the tool wear or breakage condition indirectly during cutting. A system, in general, includes a sensing module, a feature generation and selection module, and a classifier module. A number of studies that focused on conventional cutting tool condition monitoring have been reported over the past 40 years [5,6,7,8,9,10,11,12]; however, work related to micro-tool condition monitoring is still in the developing stages. Byrne et al. [5], Dimla et al. [6], and Rehorn et al. [7] reviewed the development of tool condition monitoring technology before Industry 4.0 was promoted around the world. In the past five years, Hopkins et al. [8], Nath et al. [9], Wong et al. [10], Serin et al. [11], and Kuntoğlu et al. [12] have also reviewed the development of tool condition monitoring technologies, focusing more on the application of deep learning algorithms. Kuntoğlu et al. [13] focused on a review of the features of various sensors and their applications in machining processes. Indirect sensing technologies, such as power, cutting force, vibration, and acoustic emission (AE) signals are considered as the candidates for detecting micro-tool condition based on the knowledge accumulated from the conventional cutting tool condition monitoring research [6]. Acoustic emission sensors attract considerable attention for tool condition monitoring in micro-cutting because of its high-frequency characteristics and the generation from the dislocation motion in the material [14,15,16]. In the early stages of application of AE signals to tool condition monitoring, Emel et al. [14] studied and confirmed the feasibility of applying AE signals to monitor tool wear in turning. In 2002, Lee et al. [15] used AE signals to explore the grain orientation and grain boundary effect in the precision cutting process. This study confirmed that, due to its high signal-to-noise ratio at very low depths of cut, AE is a leading sensing technology for monitoring precision machining processes. In the same year, Li [16] also reviewed the application of AE signals to monitor tool condition in turning. Griffin et al. [17] reported the use of AE signals to control the dimension deviations and prediction of surface roughness in the micro-machining of THz waveguides. In the development of the tool wear monitoring system, a stable sensor installation with reliable signals sensitive to tool wear change is a crucial issue for developing a reliable tool wear monitoring system. In general, the closer the sensors are installed to the cutting point, the more reliable are the AE signals that can be received for detecting tool wear change. Moreover, the increase in the path or interface for the AE signal transmission will reduce the signal energy significantly. Therefore, a number of researches have focused on the signals obtained from AE sensors installed on the workpiece in conventional or micro-milling/drilling processes [18,19,20,21,22,23,24,25,26], or the tool holder in the turning process [27,28]. For tool wear monitoring in conventional cutting, Klocke et al. [18] used AE signals obtained from sensors attached to the workpiece to separate the different cutting-edge engagements or different wear conditions of the drilling tools in step drilling. The k-means algorithm was used to classify different conditions. Hu et al. [19] also installed the AE sensor on the workpiece to collect AE signals to monitor four states of tool wear conditions in the milling of titanium alloy Ti-6Al-4V under MQL conditions. Support vector machine (SVM) integrated with linear discriminant analysis was adopted as the classifier. In 2021, Twardowski et al. [20] reported the use of workpiece AE signals to monitor flank wear in the milling of an aluminum-ceramic composite containing 10% SiC. A decision tree was adopted in this study to identify the tool condition. For tool wear monitoring in micro-machining, Tansel et al. [21] reported the use of AE signals to estimate the tool wear and breakage in micro-end-milling. Jemielniak and Arrazola [22] presented a study of applying the workpiece AE and cutting force signals to tool condition monitoring in the micro-milling of cold-work tool steel. The results revealed the strong influence of tool wear on acoustic emission signals. Kang et al. [23] presented results showing that acoustic emission (AE) signals acquired from a workpiece jig have para-metric features from 400 kHz to 600 kHz for variable machining conditions in micro-lens machining with a 200 μm diameter ball end mill. Malekiana et al. [24] reported the study of applying sensors including vibration, cutting force, and workpiece AE signals to the monitoring of tool wear in micro-milling, along with neuro-fuzzy algorithms. The results suggest that the fusion of three sensors provides a better classification rate than adopting only one sensor. Feng et al. [25] investigated the grinding force, system vibration, workpiece AE signals, and spindle load for tool wear monitoring in the micro-end grinding of ceramic materials. The results suggest that the combination of workpiece vibration and grinding force provides a better solution than AE signals. Prakash and Kanthababu [26] presented a study on tool condition monitoring using workpiece AE signals in the micro-end-milling of different materials including aluminum, copper, and steel alloys. A strong relationship between the tool wear (flank wear) and acoustic emission (AERMS) signals could be observed in this study. For tool wear monitoring in the turning process, Segreto et al. [27] presented work on tool wear estimation during the turning of Inconel 718 by the fusion of cutting force, AE, and vibration signal features along with artificial-neural-network-based machine learning paradigms. Chacon et al. [28] studied various AE signal features to predict flank tool wear in turning. For the tool wear monitoring in turning, an AE sensor installed on the tool holder will not interrupt the normal operation procedure and could be applied to the production line. However, an AE sensor with a cable installed on the workpiece for the milling/drilling process is not a good solution for industry applications. A tool wear monitoring system developed based on AE signals obtained from locations other than the workpiece in general cannot provide the same performance as AE signals obtained from locations on the workpiece. Therefore, how to find a proper location for AE installation and also improve the tool wear monitoring performance in micro-milling plays an important role to implement an AE-based tool wear monitoring system on the production line. In the conventional milling process, an AE sensor installed on the spindle, in general, could not provide enough signal features with respect to tool wear due to the signal being easily contaminated by the high-level AE energy generated by the spindle bearing. However, an AE sensor on the spindle housing might provide a practical solution in the production line due to the lower loading and AE signal generated from the bearing in micro milling, although the long and complex transmission path from the tool point to the sensor location still makes it more challenging to develop a reliable tool wear monitoring system compared to using AE signals collected from sensors on the workpiece.
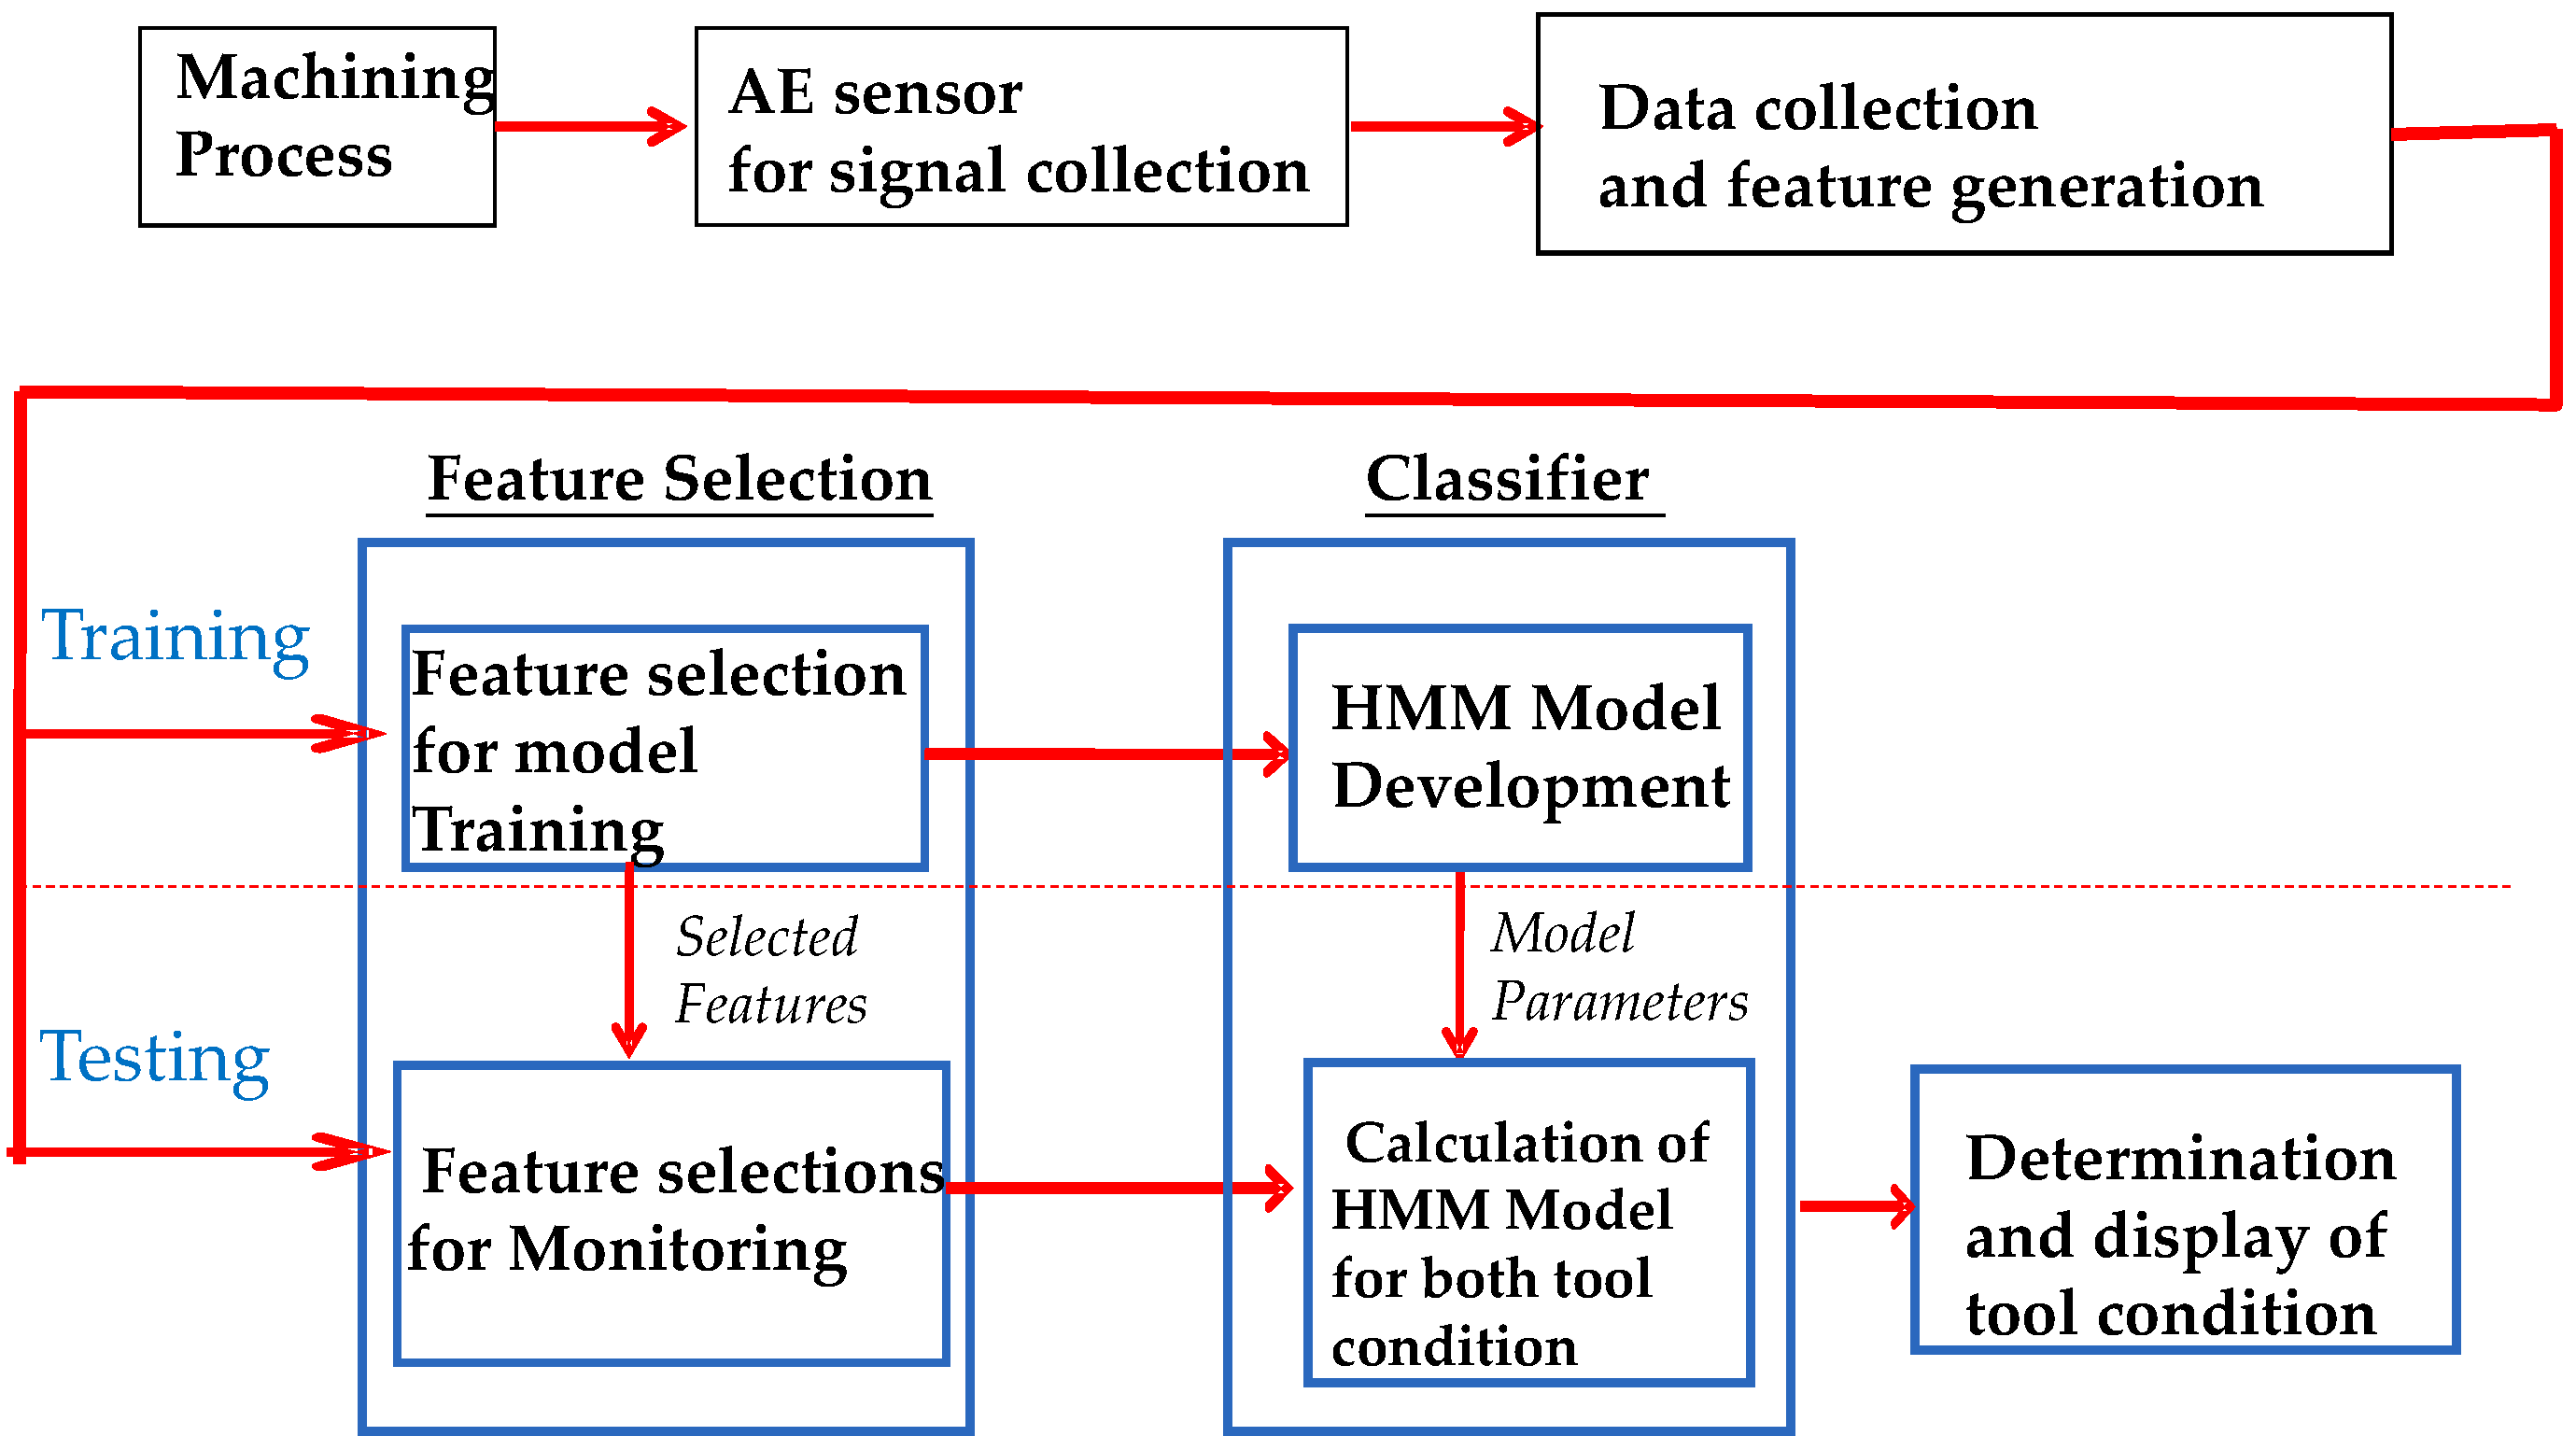
To evaluate the effect of AE sensor location on tool wear monitoring performance, reduce the amount of data for model training, and increase the reliability of the monitoring system in micro-milling, a sensor integrated with feature selection algorithms and the classifier design is necessary. A number of classifiers were reported for conventional tool condition monitoring systems in a number of review papers [5,6,7,8,9,10,11,12,13]. The hidden Markov model (HMM) is one of the classifiers generally used in tool condition monitoring systems. By properly assigning the observation sequences in the HMM model development, it provides the potential to consider the feature variation over the time domain or other feature space and reduce the noise effect on the system to improve the system reliability. A number of sensors have been reported in the application of HMM to tool condition monitoring for conventional sizes of tool in metal cutting, including the accelerometer [29,30], dynamometer [31,32,33,34], AE sensors [35], and multi-sensor integration [30,32]. Vallejo [29] monitored the cutting tool-wear condition in a milling process by using a continuous HMM and an accelerometer mounted to the fixture of the workpiece. The result demonstrates that the HMM classifier was capable of detecting the cutting tool condition within large variations in spindle speed and feed rate, with an accuracy of 84.19%. Kang et al. [30] proposed a method to identify three tool wear states with vibration signals and cutting force, along with a classifier design based on discrete hidden Markov models (DHMMs). The results suggest that the proposed method is effective for tool wear recognition and failure prediction. Baruah and Chinnam [31] presented a method for employing hidden Markov models (HMMs) and a Kistler 9257B dynamometer to identify the state of the cutting tool as well as facilitate estimation of the remaining useful life in the drilling process. Ertunc et al. [32] presented a study for the on-line identification of tool wear based on the measurement of cutting forces and power signals. The HMM is the selected classifier model in this study. Zhu et al. [33] proposed a multi-category classification approach, with continuous HMMs and cutting force features, for tool flank wear state identification in micro-milling. Averages of 92.5% and 90.5% could be achieved in this study for the micro-milling of copper and steel, respectively. Li and Liu [34] proposed an improved HMM along with cutting force to describe the tool wear process under switching cutting conditions in micro-milling. Ray et al. [
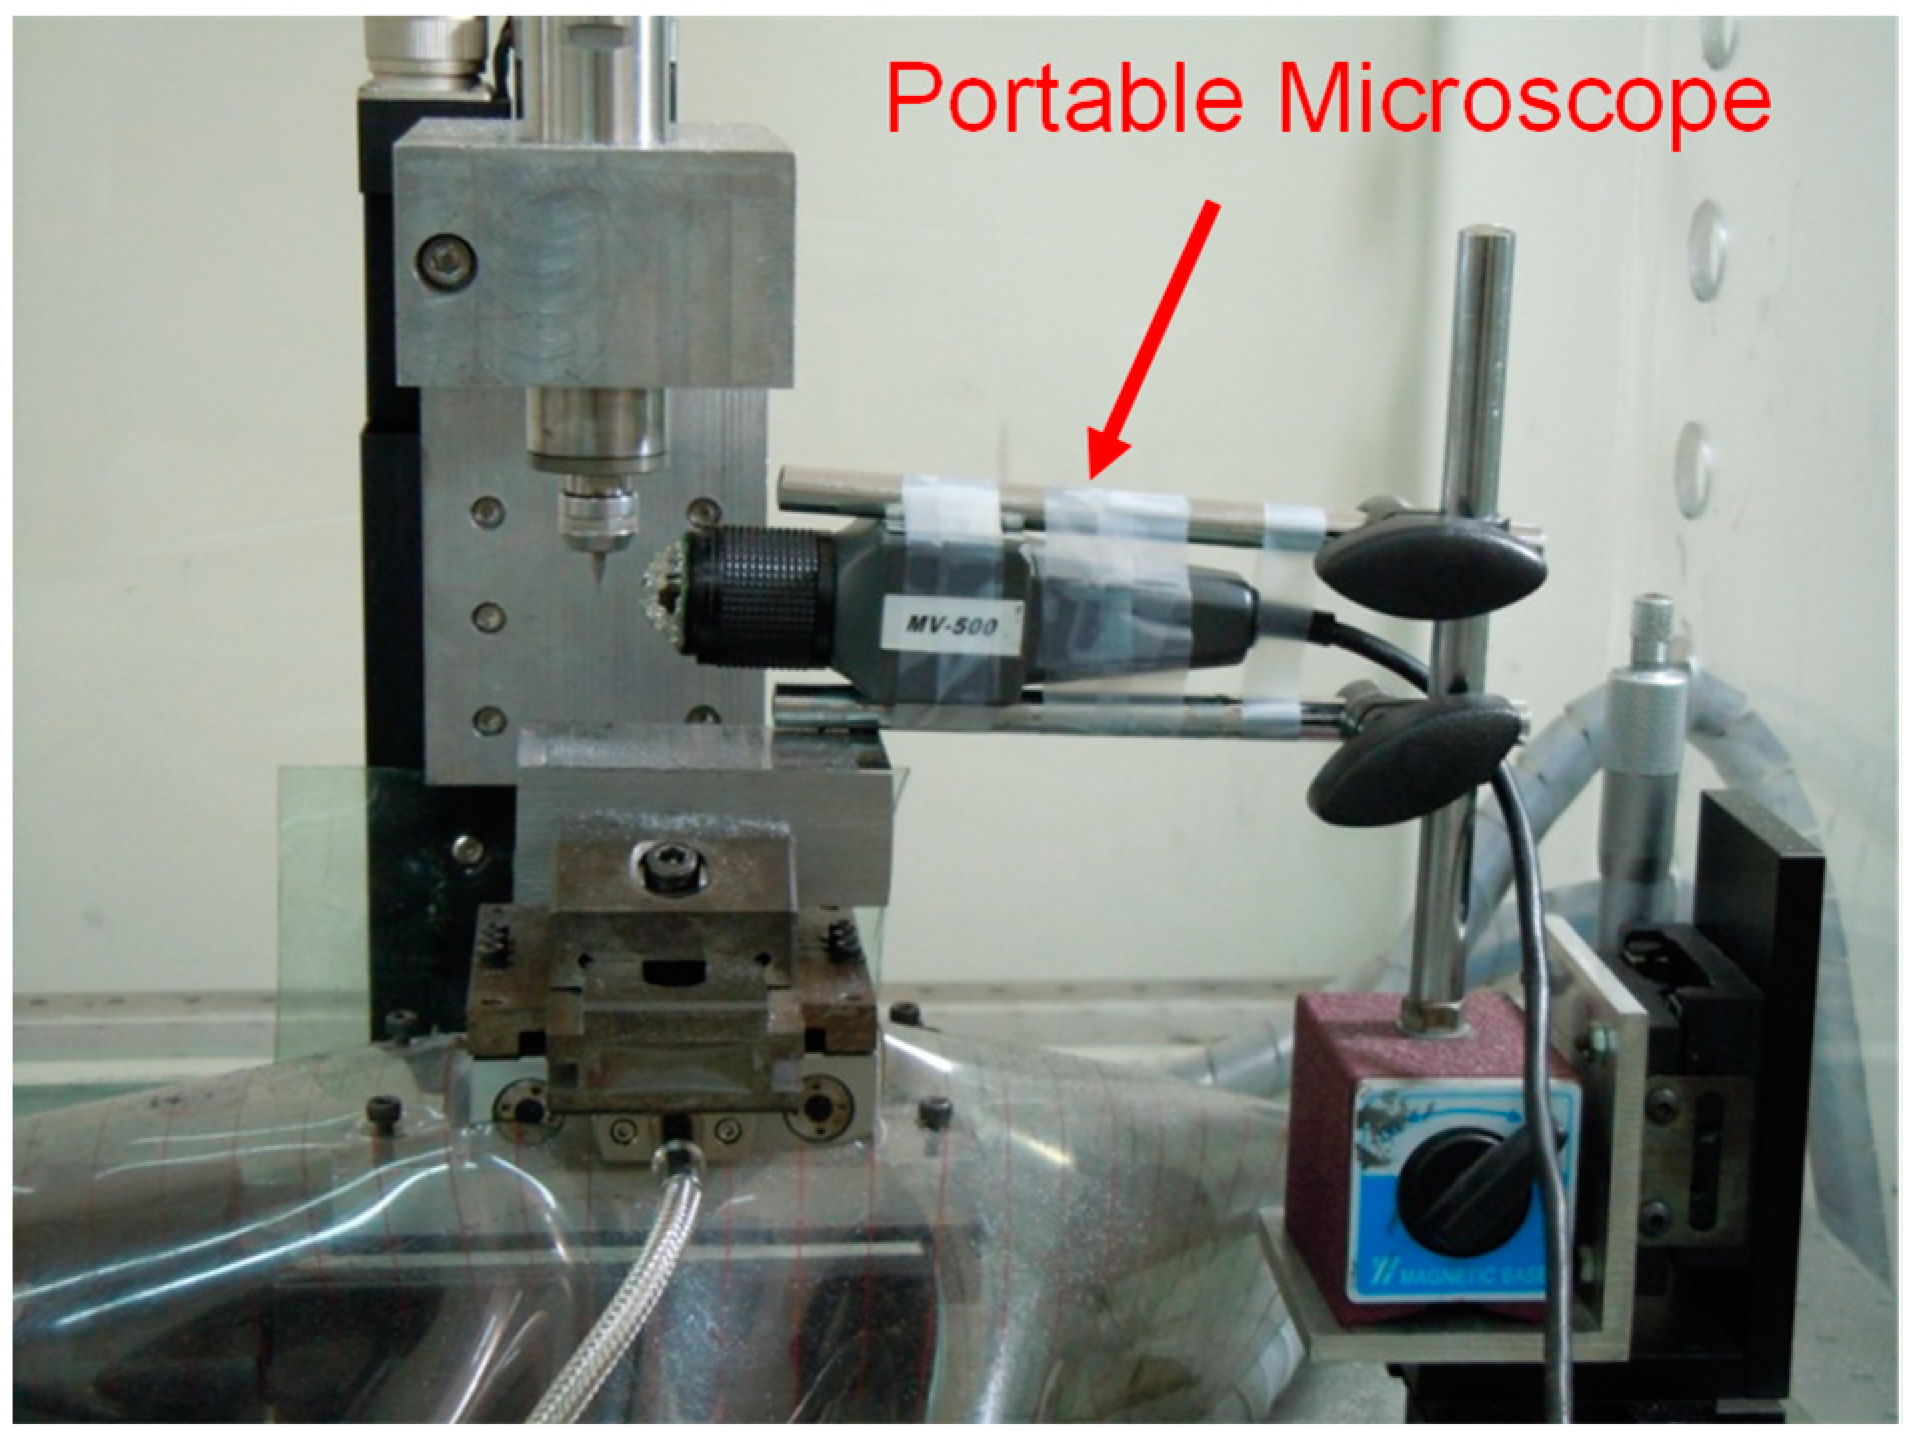
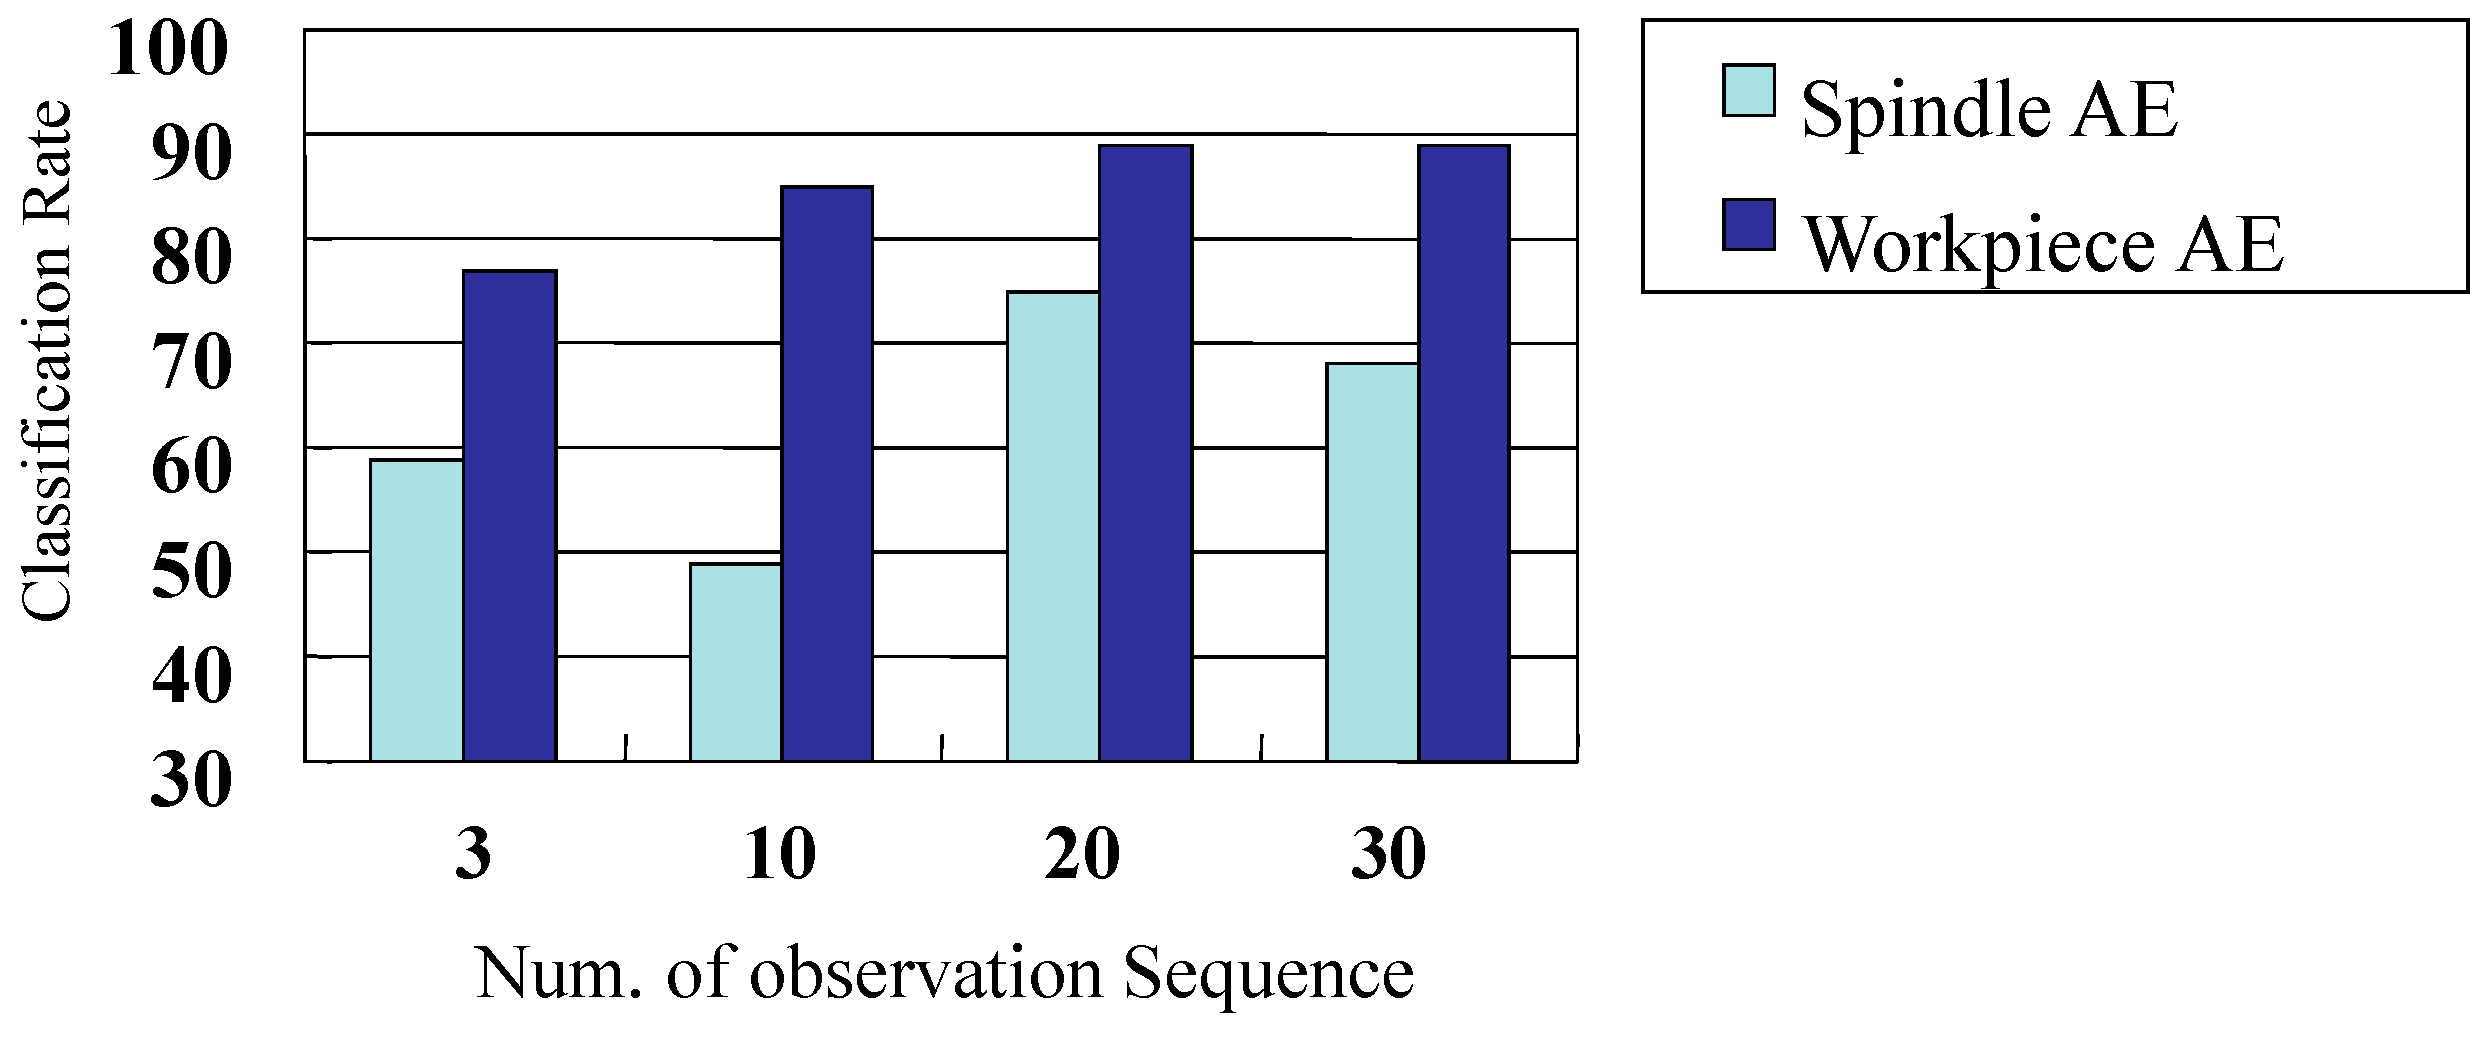
35] reported the use of hidden Markov models (HMMs) along with in-process recorded workpiece acoustic emission (AE) data, to probabilistically classify a tool’s current wear state, its likely future state, and to detect potential damage during ball-nosed milling of Titanium-5Al-5Mo-5V-3Cr. However, no study has been reported for studying the location effect by comparing AE signals obtained simultaneously from the workpiece to those obtained from the spindle area in micro-milling. In this study, to solve the problem of transferring the developed tool wear monitoring system with AE signals on the workpiece to the production line in micro-milling, AE signals collected from the AE sensor installed on a fixture clamped on the spindle housing were analyzed and compared to the signals obtained from the AE sensor installed on the workpiece. At the same time, due to the significant variation in signal distribution over frequency for various time spans in a single cutting pass, a hidden Markov model (HMM) was adopted as a classifier for identifying the tool wear condition based on the retrieved AE signals from both sensors to verify the effect of sensor location on the monitoring system in micro-milling. For collecting the signal for system analysis and development, an experiment was implemented with a 700 μm diameter micro-mill and an SK2 workpiece. The AE signals were collected by both AE sensors simultaneously. The frequency-domain features that closely correlated to the tool wear change were selected by the class mean scatter criteria for both AE signals. To evaluate the performance of a tool wear monitoring system based on spindle AE signals, the HMM-based classifiers were developed by AE signal features collected from sensors on the workpiece and spindle. For classifier design, the effect of system parameters on its performance was also analyzed.

2. Monitoring System Development

The schematic of the tool condition monitoring system developed to study the AE signals from both locations is shown in Figure 1. The AE signals obtained from the sensor on the spindle (spindle AE) and from the sensor on the workpiece (workpiece AE) were first collected simultaneously. The frequency domain features for both signals were generated by transforming time domain signals to frequency domain features by FFT. The HMM models for the sharp and worn tool were subsequently developed by the selected features of collected training signals. Once the models were developed, the unknown tool condition was determined by the AE signals and corresponding developed models. The process for the model development is shown in Figure 2, in which Fn represents the nth frequency feature, and λsn is the sharp tool model developed by the nth selected frequency feature of the AE signals with sharp tool implementation. λwn denotes the worn tool model developed by the same selected frequency of features with the worn tool set-up. In the evaluation of the monitoring system, the signals collected from the events other than those used for model development serve as the input data to the developed model. The system performance is determined by comparing the tool wear condition determined by the developed monitoring system to the tool wear condition determined on-line by a microscope. The schematic of determining the unknown tool condition with the developed model is shown in Figure 3, in which the tool state Sn based on the one selected feature is determined by referring to the model with a larger probability value based on the Vitervi algorithm. With a combination of the results obtained from various selected features, the final decision for the tool state is determined by fusing all decisions.
In signal analysis, a number of parameters including the bandwidth size of the frequency features, the choice of selected features, and the size of the observation sequences theoretically will affect the performance of the developed system. For the analysis of the feature-bandwidth effect on system performance, three bandwidth sizes, comprising 64 kHz, 32 kHz, and 16 kHz for the frequency features, were set up to investigate its effect on the noise reduction and classification performance. For the analysis of selected features that serve as input to the HMM model, three types of selections, comprising one-feature, three-feature, and five-feature selections, were studied to investigate its effect on the system performance. In studying the effect of the observation sequence on the system performance, observation vectors with 3, 10, 20, and 30 symbols were implemented to verify the system performance. For the study of the effect of the hidden states on the system, the features were normalized first and assigned to the corresponding hidden state designed in the model. The integers from 1 to 15 were chosen as the candidate hidden states, and 3, 5, and 7 hidden states were implemented to investigate the effect of the transition of states on the system performance.

3. Experimental Set-Up

An experiment was implemented on a micro-milling research platform to collect signals for the establishment of the HMM model and to evaluate the effect of the sensor location and system parameters on the performance of the monitoring system in the micro-milling, as shown in Figure 4. This set-up included a high-speed spindle of up to 60,000 rpm, an AE sensor (Kistler 8152B121, Kistler Instrument Corp., Amherst, NY, USA) on the fixture clamped onto the spindle housing, and the other AE sensor (the same type as that on the spindle) directly attached to the workpiece surface. The WC micro end mill, the workpiece with hardness of H R C 65, and the cutting conditions adopted in the tests are shown in Table 1, Table 2 and Table 3, respectively.
In the test, the signals from both sensors were collected simultaneously for each cutting pass. For each new micro end mill, five micro-milling passes were conducted and each cutting path was maintained in a consistent direction. To collect training and testing data for the signal feature analysis and the development of the tool monitoring system, 200 cutting passes with 40 new tools were conducted in this study. To avoid the orientation change of the tool with respect to the workpiece during tool installation, which would result in the change of the cutting edge/workpiece contact condition after measurement, the flank wear on the micro-tool was measured and recorded on-line with a portable microscope installed inside the workspace of the machine tool (Figure 5) when the cutting tool was stopped and remained on the tool holder. Wear measurement for each tool wear condition was repeated three times and the average values were recorded.

4. Results and Discussion

4.1. AE Signal Analysis for Tool Wear Change from Spindle Housing and Workpiece

To analyze the sensitivity and characteristics of spindle AE signals compared with workpiece AE signals, the time domain AE signals obtained from both sensors and their frequency responses were investigated. Tool wear condition and corresponding time domain AE signals obtained from the sensors installed on the spindle housing and workpiece are shown in Figure 6. In Figure 7, the frequency response of signals shown in Figure 6 could be observed. The tool wear levels obtained after each cutting path are shown in Table 4. As shown in Figure 7, the energy level increased as tool wear proceeded for both AE sensors; however, the frequency distribution of signals differed from each other with various installation locations. The energy of the signals obtained from the spindle housing were concentrated in the frequency range between 50 kHz and 150 kHz. By contrast, the energy of the signals obtained from the workpiece were concentrated between 150 kHz and 250 kHz. In addition, the signal change as tool wear proceeded for the AE signal on the spindle also differed from that obtained from the workpiece. A larger change was observed for the signal on the workpiece than that obtained from the AE sensor on the spindle. This result demonstrates that the spindle AE signal has a lower sensitivity to tool wear than the workpiece AE signal.
To reduce the amount of required data for the training of the classifier, it is important to find signal features that have a strong correlation with the change in monitored target. In this study, the class-mean-scattering criterion was used to investigate the scattering of each feature between tests to quantify the sensitivity of each frequency feature to the tool wear change. The scatter index J, which is defined by the ratio of between-class scattering to in-class scattering of the selected features [13], indicates the correlation of the features to the tool wear change (Figure 8) for spindle AE and workpiece AE signals. In comparison to the workpiece AE signals, the lower level of the index was observed for spindle AE signals. This result corresponds well to the analysis of signal energy change over the increase in tool wear. By considering the frequency features with the highest index J, the 360 kHz feature was observed as the highest for signals from the spindle. By contrast, the 180 kHz, 300 kHz, and 380 kHz features were the highest features for the workpiece AE signal. Based on the frequency response of the spindle AE signal in Figure 7, the frequency features that have strong correlation with the tool wear (with the higher index J) for spindle AE signals are at frequencies higher than 150 kHz. However, the signal in this frequency span has a lower signal energy. By contrast, most of the features with the higher index J for the workpiece AE are located in the frequency span with the higher energy in the frequency response. This result suggests that, differing from the workpiece AE signal, more composition of signals generated from events other than the cutting process contribute significantly to the spindle AE signal. However, the frequency signals higher than 150 kHz provide potential features to monitor the tool wear in micro-milling.
Because of the AE signals generated from the dislocation motion in the material, the signals detected by the AE sensor will closely relate to the chip formation and vary over time, as shown in Figure 9. Figure 8 shows the signals obtained in the first cutting path for a new tool. Therefore, if only a small time period of the signal is chosen for determining the tool condition, it will lose a number of characteristics of signals closely related to tool condition change and create a model that cannot efficiently represent the tool condition. The frequency response of the AE signal corresponding to three time-spans of the signals in Figure 9 are shown in Figure 10. Signal (a) represents the lowest energy period of signals, followed by signal (c). Signal (b) represents the highest energy for the collected signals. By comparing the frequency domain signal for three spans of signals in Figure 10, the frequency locations of the top energy features do not change considerably for the three cases; however, the feature energy level changes over the three cases. This result proves that the model created will fail in tool condition monitoring by only considering one span of collected signals and comparing the feature energy level in determining the tool condition. Therefore, the HMM model established by observing the series of span signals is expected to solve the problem and improve the system performance.

4.2. Effect of Feature Bandwidth on the System Performance

Noise caused by the background events or cutting system/material variation is always a significant issue to reduce the performance of a monitoring system in the production line. To increase the system robustness, generating and selecting proper features as input to the classifier is always an important step to increase the robustness of a developed monitoring system. In this study, after signals are transformed from the time domain to the frequency domain, the average energy amplitude for the individual frequency span of signals will be considered as a feature. Since the large frequency span will lower the contribution of signals that represent the monitored target and a small frequency span will increase the sensitivity to the noise or system variation, it is important to determine the proper frequency span for features. The effect of the corresponding bandwidth size (span of frequency) of the selected features on the system performance was analyzed in this study, comprising 64 kHz, 32 kHz, and 16 kHz set-ups. By considering the feature scattering between each test as tool wear proceeded, the index J for each feature was obtained for the spindle AE with various bandwidth sizes, as shown in Figure 11. The results were obtained based on 20 sets of data; that is, 10 sets for the sharp tool test and 10 sets for the worn tool test. Those for the workpiece AE signals are shown in Figure 12. For the spindle AE features, the 32 kHz bandwidth size set-up provided the higher index J for the features than the other two bandwidth size set-ups. In comparison with workpiece AE features, the higher index J of the spindle AE features was lower than the workpiece AE signal. However, the index J of 0.1 was still at the same level as the highest index J of 0.3 for the workpiece AE features.
The classification rate for tool conditions in the test stage using spindle AE features (other than the features used for HMM model development) and the HMM-based classifier are shown in Table 5 with various bandwidth size selections. The effect of the bandwidth size selection on the classification rate is demonstrated, and the 16 kHz bandwidth size selection provided superior classification than the other two cases with 3 and 5 features selected. By considering the features obtained from the sensor on the workpiece, the classification rate shown in Table 6 is higher than the case with features obtained from the spindle. The trend was consistent with the results observed for the feature scattering index J. Moreover, unlike the case for spindle AE features, the effect of the bandwidth size change on the classification rate cannot be observed clearly for the case with the workpiece AE features. The results suggest that, although the signals obtained from the spindle housing demonstrate a lower sensitivity to tool wear than its counterpart on the workpiece, proper bandwidth size selection is crucial and can provide a superior classification rate for HMM-based tool condition monitoring in micro-milling using the features retrieved from the spindle AE signal in this study.

4.3. Effect of HMM Parameters on the System Performance

In general, the volume of the hidden state selected and the length of the observation sequence were crucial in improving the monitoring system performance by reducing the effect from the variation of the cutting system, material, and the background noise. Two parameters (hidden state and observation sequence) were studied for both AE signals, and the various classification rates were obtained for spindle and workpiece AE features, as shown in Table 7 and Table 8, by changing both parameters in the study, along with changing the number of the selected features. The results indicate that, in both cases, the various features selected altered the final classification rate; however, its effect was not as substantial as that by the bandwidth size of the features. The improvement was observed by increasing the volume of the features selected from 1 to 3 in the case with the 32 kHz bandwidth and a higher size of the observation sequence set-up for spindle AE features. However, its effect cannot be observed clearly for the other case for the AE spindle feature. By contrast, the improvement in classification rate by selecting 5 features over 1 and 3 features was observed for workpiece AE features. The difference between the spindle AE and workpiece spindle cases may be caused by the higher frequency range features of the workpiece AE signal, which provides more information closely related to the tool wear condition change.
The average classification rates for various lengths of observation sequence are shown in Figure 13, Figure 14 and Figure 15 with the various bandwidth size set-ups. For the case with spindle AE signals and the 64 kHz or 32 kHz feature bandwidth set-ups, more than 10 observation events provided a superior classification rate than the 3-observation-events set-up. In the case with 16 kHz, 20 and 30 observation events provided superior solutions compared to the 3 and 10 observation set-ups. By considering the cases with workpiece AE signals, the length increase of the observation vector demonstrated improvement in classification of the tool condition. However, its effect was reduced in the case with the 64 kHz feature bandwidth. The results suggest that the noise effect on the misclassification can be reduced by increasing the number of observation events; however, its improvement was reduced with the higher feature bandwidth size because the higher feature bandwidth size also provides superior noise reduction capability.
The resolution of the hidden states is another parameter that must be determined by applying the HMM on tool condition monitoring. Using the same span range (from 1 to 15), 3, 5, and 7 hidden states were chosen to verify their effect on the final classification rate of the tool condition, as shown in Figure 16, Figure 17 and Figure 18. In the case with the 32 kHz feature bandwidth set-up and spindle AE signals, the increase in the hidden states improved the classification rate. However, the effect of changing the hidden state resolution on classification rate cannot be observed clearly in the other cases.
In comparing the cases with spindle AE signals to those with workpiece AE signals, the workpiece AE signals, as expected, provided superior performance in determining the tool condition of the micro-mill. However, based on the results obtained from Table 7 in this study, the AE signals obtained from the spindle housing demonstrated potential to provide a solution to monitor the micro-mill with the proper selection of feature bandwidth and other parameters. This could solve the problem that the developed system with the AE sensor on the workpiece in the laboratory could not be transferred directly to the production line.

5. Conclusions

To solve the problem of transferring the developed tool wear monitoring system with the AE signal on the workpiece to the production line in micro-milling, an AE sensor installed on a fixture on the spindle housing was proposed and implemented on a micro-milling research platform. Based on the results obtained in this study, contributions from this study can be summarized as follows:
  • To evaluate the sensor location effect on the micro tool wear monitoring, the results demonstrate that the signals obtained from both locations exhibited differing frequency ranges of energy distribution and the characteristics of signal change as tool wear proceeded. Moreover, the significant variation in signal distribution over frequency for various time spans in a single cutting pass was demonstrated in this study.
  • By applying the feature selection by the class mean scattering criterion and the HMM algorithm in determining the tool wear condition, the change in the feature bandwidth size exhibited a considerable effect on the monitoring performance for the cases using spindle AE signals, but a lower effect on the cases using workpiece AE signals.
  • By considering the effect of the HMM parameters on the system performance, the increase in the observation events will improve the classification rate of monitoring micro tool wear. However, its effect was more crucial for the cases with the lower classification rate and was reduced when more than 10 observation events were set up.
  • In the performance analysis of the developed system, the results demonstrated that a 100% classification rate could be obtained by using spindle AE signal features with a frequency span of 16 kHz. This suggests that the set-up with the AE sensor on a fixture on the spindle housing provides a potential solution to monitor the tool wear change in micro-milling in a production line with the proper selection of feature bandwidth and other parameters.

Author Contributions

Conceptualization, M.-C.L.; methodology, M.-C.L. and B.-S.W.; software, B.-S.W.; validation, B.-S.W. and M.-C.L.; formal analysis, B.-S.W. and M.-C.L.; investigation, B.-S.W. and M.-C.L.; resources, M.-C.L. and S.-J.C.; data curation, B.-S.W. and M.-C.L.; writing—original draft preparation, B.-S.W. and M.-C.L.; writing—review and editing, M.-C.L. and S.-J.C.; visualization, M.-C.L.; supervision, M.-C.L.; project administration, M.-C.L. and S.-J.C.; funding acquisition, M.-C.L. and S.-J.C. All authors have read and agreed to the published version of the manuscript.

Funding

This research received partial financial support from the Ministry of Science and Technology, Taiwan. Grant number MOST 110-2218-E-002-038.

Data Availability Statement

The study did not report any data.

Conflicts of Interest

The authors declare no conflict of interest.

References

  1. Masuzawa, T. State of the Art of Micromachining. CIRP Ann. 2000, 49, 473–488. [Google Scholar] [CrossRef]
  2. Dornfeld, D.; Min, S.; Takeuchi, Y. Recent Advances in Mechanical Micromachining. CIRP Ann. 2006, 55, 745–768. [Google Scholar] [CrossRef] [Green Version]
  3. Chae, J.; Park, S.; Freiheit, T. Investigation of Micro-Cutting Operations. Int. J. Mach. Tools Manuf. 2006, 46, 313–332. [Google Scholar] [CrossRef]
  4. Balázs, B.Z.; Geier, N.; Takács, M.; Davim, J.P. A Review on Micro-Milling: Recent Advances and Future Trends. Int. Int. J. Adv. Manuf. Technol. 2021, 112, 655–684. [Google Scholar] [CrossRef]
  5. Byrne, G.; Dornfeld, D.; Inasaki, I.; Ketteler, G.; König, W.; Teti, R. Tool Condition Monitoring (TCM)-the Status of Research and Industrial Application. CIRP Ann. 1995, 44, 541–567. [Google Scholar] [CrossRef]
  6. Snr, D.E.D. Sensor Signals for Tool-Wear Monitoring in Metal Cutting Operations–A Review of Methods. Int. J. Mach. Tools Manuf. 2000, 40, 1073–1098. [Google Scholar] [CrossRef]
  7. Rehorn, A.; Jiang, J.; Orban, P. State-of-the-art Methods and Results in Tool Condition Monitoring: A Review. Int. J. Adv. Manuf. Technol. 2005, 26, 693–710. [Google Scholar] [CrossRef]
  8. Hopkins, C.; Hosseini, A.A. Review of Developments in the Fields of the Design of Smart Cutting Tools, Wear Monitoring, and Sensor Innovation. IFAC PapersOnLine 2019, 52, 352–357. [Google Scholar] [CrossRef]
  9. Nath, C. Integrated Tool Condition Monitoring Systems and Their Applications: A Comprehensive Review. Procedia Manuf. 2020, 48, 852–863. [Google Scholar] [CrossRef]
  10. Wong, S.Y.; Chuah, J.H.; Yap, H.J. Technical Data-Driven Tool Condition Monitoring Challenges for CNC Milling: A Review. Int. J. Adv. Manuf. Technol. 2020, 107, 4837–4857. [Google Scholar] [CrossRef]
  11. Serin, G.; Sener, B.; Ozbayoglu, A.M.; Unver, H.O. Review of Tool Condition Monitoring in Machining and Opportunities for Deep Learning. Int. J. Adv. Manuf. Technol. 2020, 109, 953–974. [Google Scholar] [CrossRef]
  12. Kuntoğlu, M.; Aslan, A.; Pimenov, D.Y.; Usca, Ü.A.; Salur, E.; Gupta, M.K.; Mikolajczyk, T.; Giasin, K.; Kapłonek, W.; Sharma, S. A Review of Indirect Tool Condition Monitoring Systems and Decision-Making Methods in Turning: Critical Analysis and Trends. Sensors 2021, 21, 108. [Google Scholar] [CrossRef] [PubMed]
  13. Kuntoğlu, M.; Salur, E.; Gupta, M.K.; Sarıkaya, M.; Pimenov, D.Y. A State-Of-The-Art Review on Sensors and Signal Processing Systems in Mechanical Machining Processes. Int. J. Adv. Manuf. Technol. 2021, 116, 2711–2735. [Google Scholar] [CrossRef]
  14. Emel, E.; Kannatey-Asibu, E., Jr. Tool Failure Monitoring in Turning by Pattern Recognition Analysis of Ae Signals. ASME J. Eng. Ind. 1988, 110, 137–145. [Google Scholar] [CrossRef]
  15. Lee, Y.; Chang, A.; Dornfeld, D. Acoustic Emission Monitoring for the Diamond Machining of Oxygen-Free High-Conductivity Copper. J. Mater. Process. Technol. 2002, 127, 199–205. [Google Scholar] [CrossRef]
  16. Li, X. A Brief Review: Acoustic Emission Method for Tool Wear Monitoring during Turning. Int. J. Mach. Tools Manuf. 2002, 42, 157–165. [Google Scholar] [CrossRef] [Green Version]
  17. Griffin, J.M.; Diaz, F.; Geerling, E.; Clasing, M.; Ponce, V.; Taylor, C.; Turner, S.; Michael, E.A.; Mena, F.P.; Bronfman, L. Control of Deviations and Predictionof Surface Roughness from Micro Machining of THZ Waveguides using Acoustic Emission Signals. Mech. Syst. Signal Process. 2017, 85, 1020–1034. [Google Scholar] [CrossRef]
  18. Klocke, F.; Döbbeler, B.; Pullen, T.; Berg, T. Acoustic Emission Signal Source Separation for a Flank Wear Estimation of Drilling Tools. Procedia CIRP 2019, 79, 57–62. [Google Scholar] [CrossRef]
  19. Hu, M.; Ming, W.; An, Q.; Chen, M. Tool Wear Monitoring in Milling of Titanium Alloy Ti-6Al-4V under MQL Conditions Based on A New Tool Wear Categorization. Int. J. Adv. Manuf. Technol. 2019, 104, 4117–4128. [Google Scholar] [CrossRef]
  20. Twardowski, P.; Tabaszewski, M.; Wiciak–Pikuła, M.; Felusiak-Czyryca, A. Identification of Tool Wear using Acoustic Emission Signal and Machine Learning Methods. Precis. Eng. 2021, 72, 738–744. [Google Scholar] [CrossRef]
  21. Tansel, I.; Trujillo, M.; Nedbouyan, A.; Velez, C.; Bao, W.; Arkan, T.T.; Tansel, B. Micro-end-milling—III. Wear Estimation and Tool Breakage Detection using Acoustic Emission Signals. Int. J. Mach. Tools Manuf. 1998, 38, 1449–1466. [Google Scholar] [CrossRef]
  22. Jemielniak, K.; Arrazola, P.J. Application of AE and Cutting Force Signals in Tool Condition Monitoring in Micro-Milling. CIRP J. Manuf. Sci. 2008, 1, 97–102. [Google Scholar] [CrossRef]
  23. Kang, I.S.; Kim, J.S.; Kang, M.C.; Lee, K.Y. Tool Condition and Machined Surface Monitoring for Micro-Lens Array Fabrication in Mechanical Machining. J. Mater. Process. Technol. 2008, 201, 585–589. [Google Scholar] [CrossRef]
  24. Malekiana, M.; Park, S.S.; Jun, M.B.G. Tool Wear Monitoring of Micro-Milling Operations. J. Mater. Process. Technol. 2009, 209, 4903–4914. [Google Scholar] [CrossRef]
  25. Feng, J.; Kim, B.S.; Shih, A.; Ni, J. Tool Wear Monitoring for Micro-End Grinding of Ceramic Materials. J. Mater. Process. Technol. 2009, 209, 5110–5116. [Google Scholar] [CrossRef]
  26. Prakash, M.; Kanthababu, M. In-process Tool Condition Monitoring using Acoustic Emission Sensor in Microendmilling. Mach. Sci. Technol. 2013, 17, 209–227. [Google Scholar] [CrossRef]
  27. Segreto, T.; D’Addona, D.; Teti, R. Tool Wear Estimation in Turning of Inconel 718 Based on Wavelet Sensor Signal Analysis and Machine Learning Paradigms. Prod. Eng. 2020, 14, 693–705. [Google Scholar] [CrossRef]
  28. Ferrando Chacón, J.L.; Fernández de Barrena, T.; García, A.; Sáez de Buruaga, M.; Badiola, X.; Vicente, J. A Novel Machine Learning-Based Methodology for Tool Wear Prediction Using Acoustic Emission Signals. Sensors 2021, 21, 5984. [Google Scholar] [CrossRef]
  29. Vallejo, A., Jr.; Nolazco-Flores, J.; Morales-Menendez, R.; Enrique Sucar, L.; Rodrıguez, C. Tool-wear Monitoring based on Continuous Hidden Markov Models. Lect. Notes Comput. Sci. 2005, 3773, 880–890. [Google Scholar]
  30. Kang, J.; Kang, N.; Feng, C.J.; Hu, H.Y. Pattern Recognition of Tool Wear and Failure Prediction. In Proceedings of the World Congress on Intelligent Control and Automation (WCICA), Chongqing, China, 25–27 June 2008; pp. 6000–6005. [Google Scholar]
  31. Baruah, P.; Chinnam, R. HMMs for Diagnostics and Prognostics in Machining Processes. Int. J. Prod. Res. 2005, 43, 1275–1293. [Google Scholar] [CrossRef]
  32. Ertunc, H.; Loparo, K.; Ocak, H. Tool Wear Condition Monitoring in Drilling Operations using Hidden Markov Models (HMMs). Int. J. Mach. Tools Manuf. 2001, 41, 1363–1384. [Google Scholar] [CrossRef]
  33. Zhu, K.; Wong, Y.; Hong, G. Multi-category Micro-Milling Tool Wear Monitoring with Continuous Hidden Markov Models. Mech. Syst. Signal Process. 2009, 23, 547–560. [Google Scholar] [CrossRef]
  34. Li, W.; Liu, T. Time varying and condition adaptive hidden Markov model for tool wear state estimation and remaining useful life prediction in micro-milling. Mech. Syst. Signal Process. 2019, 131, 689–702. [Google Scholar] [CrossRef]
  35. Ray, N.; Worden, K.; Turner, S.; Villain-Chastre, J.-P.; Cross, E.J. Tool Wear Prediction and Damage Detection in Milling using Hidden Markov Models. In Proceedings of the ISMA 2016-International Conference on Noise and Vibration Engineering and USD2016-International Conference on Uncertainty in Structural Dynamics, Leuven, Belgium, 19–21 September 2016. [Google Scholar]
Figure 1. Schematic of tool condition monitoring.
Jmmp 06 00042 g001
Figure 2. Schematic of HMM model development.
Jmmp 06 00042 g002
Figure 3. Schematic of tool condition verification.
Jmmp 06 00042 g003
Figure 4. Experimental set-up for sensors in micro-milling.
Jmmp 06 00042 g004
Figure 5. Tool wear measurement by a portable microscope installed in the workspace.
Jmmp 06 00042 g005
Figure 6. Tool wear level and corresponding time domain signal for tool condition: (a) sharp tool; (b) worn tool.
Jmmp 06 00042 g006
Figure 7. Change in frequency response of AE signals for the increase in tool wear: (a) signals on spindle; (b) signals on workpiece.
Jmmp 06 00042 g007
Figure 8. Scatter index J for tool condition change with (a) signals on spindle; (b) signals on workpiece.
Jmmp 06 00042 g008
Figure 9. Spindle AE signal in the first cutting path for a new tool.
Jmmp 06 00042 g009
Figure 10. Spindle AE signals: (a) span a; (b) span b; (c) span c.
Jmmp 06 00042 g010
Figure 11. Feature scattering index J for adopting spindle AE signals: (a) bandwidth size 64 KHz; (b) bandwidth size 32 KHz; (c) bandwidth size 16 KHz.
Jmmp 06 00042 g011
Figure 12. Feature scattering index J for adopting workpiece AE signals: (a) bandwidth size 64 KHz; (b) bandwidth size 32 KHz; (c) bandwidth size 16 KHz.
Jmmp 06 00042 g012
Figure 13. Effect of observation sequence on classification rate (64 KHz feature bandwidth).
Jmmp 06 00042 g013
Figure 14. Effect of observation sequence on classification rate (32 KHz feature bandwidth).
Jmmp 06 00042 g014
Figure 15. Effect of observation sequence on classification rate (16 kHz feature bandwidth).
Jmmp 06 00042 g015
Figure 16. Effect of hidden state on the classification rate of tool wear condition (64 KHz feature bandwidth).
Jmmp 06 00042 g016
Figure 17. Effect of hidden state on the classification rate of tool wear condition (32 KHz feature bandwidth).
Jmmp 06 00042 g017
Figure 18. Effect of hidden state on the classification rate of tool wear condition (16 KHz feature bandwidth).
Jmmp 06 00042 g018
Table 1. Dimension of micro end mill.
Num. of ToothTool Diameter D (mm) (mm)d (mm)L (mm)
20.71.4338
Jmmp 06 00042 i001
Table 2. Composition of SK2 workpiece.
CSiMnPSNiCrCu
1.15–1.250.15–0.350.15–0.50 ≦ 0.030 ≦ 0.030 ≦ 0.250 ≦ 0.030 ≦ 0.25
Table 3. Cutting parameters.
Tool Diameter (mm)Spindle Speed (rpm)Feed Rate (μm/rev)Depth of Cut (mm)Workpiece Material
0.750,0000.60.2SK2 Steel
Table 4. Flank wear level after cutting.
Cutting PathAfter 1st CuttingAfter 2nd CuttingAfter 3rd CuttingAfter 4th CuttingAfter 5th Cutting
Wear average (mm)0.0120.0130.0160.0260.038
Table 5. Classification rate with AE signals on spindle and 30 observation sequences. Unit (%).
Bandwidth Size64 KHz32 KHz16 KHz
Num. of Feature Selection353535
Num. of Hidden State3708080859590
580808080100100
78080859010095
Table 6. Classification rate with AE signals on workpiece and 30 observation sequences. Unit (%).
Bandwidth Size64 KHz32 KHz16 KHz
Num. of Feature Selection353535
Num. of Hidden State310010095100100100
510010010010010090
7100100100100100100
Table 7. Classification rate with different feature bandwidths and observation sequences (spindle AE signals). Unit: %.
Num. of Feature Selection123
Num. of Observation Sequence
310203031020303102030
64 kHzSharp100100100100100100100100100100100100
Worn604060406040604050408060
Average807080708070807075709080
32 kHzSharp10050505010010010010010090100100
Worn809080608070806090808070
Average907065559085908095859085
16 kHzSharp10010090100100100100100100100100100
Worn8010010090801001001008010010090
Average901009595901001001009010010095
Table 8. Classification rate with different feature bandwidths and observation sequences (workpiece AE signals). Unit: %.
Num. of Feature Selection123
Num. of Observation Sequence
310203031020303102030
64 kHzSharp100100100100100100100100100100100100
Worn908010010080100100100100100100100
Average959010010090100100100100100100100
32 kHzSharp100908010010010010010090100100100
Worn50100100100901001009090100100100
Average759590100951001009590100100100
16 kHzSharp100100100100100100100100100100100100
Worn70808080901001001009010090100
Average85909090951001001009010095100
Publisher’s Note: MDPI stays neutral with regard to jurisdictional claims in published maps and institutional affiliations.

