
Flexural Fatigue Test—A Proposed Method to Characterize the Lifetime of Conductor Tracks on Polymeric Substrates

 , ,
, ,
Abstract
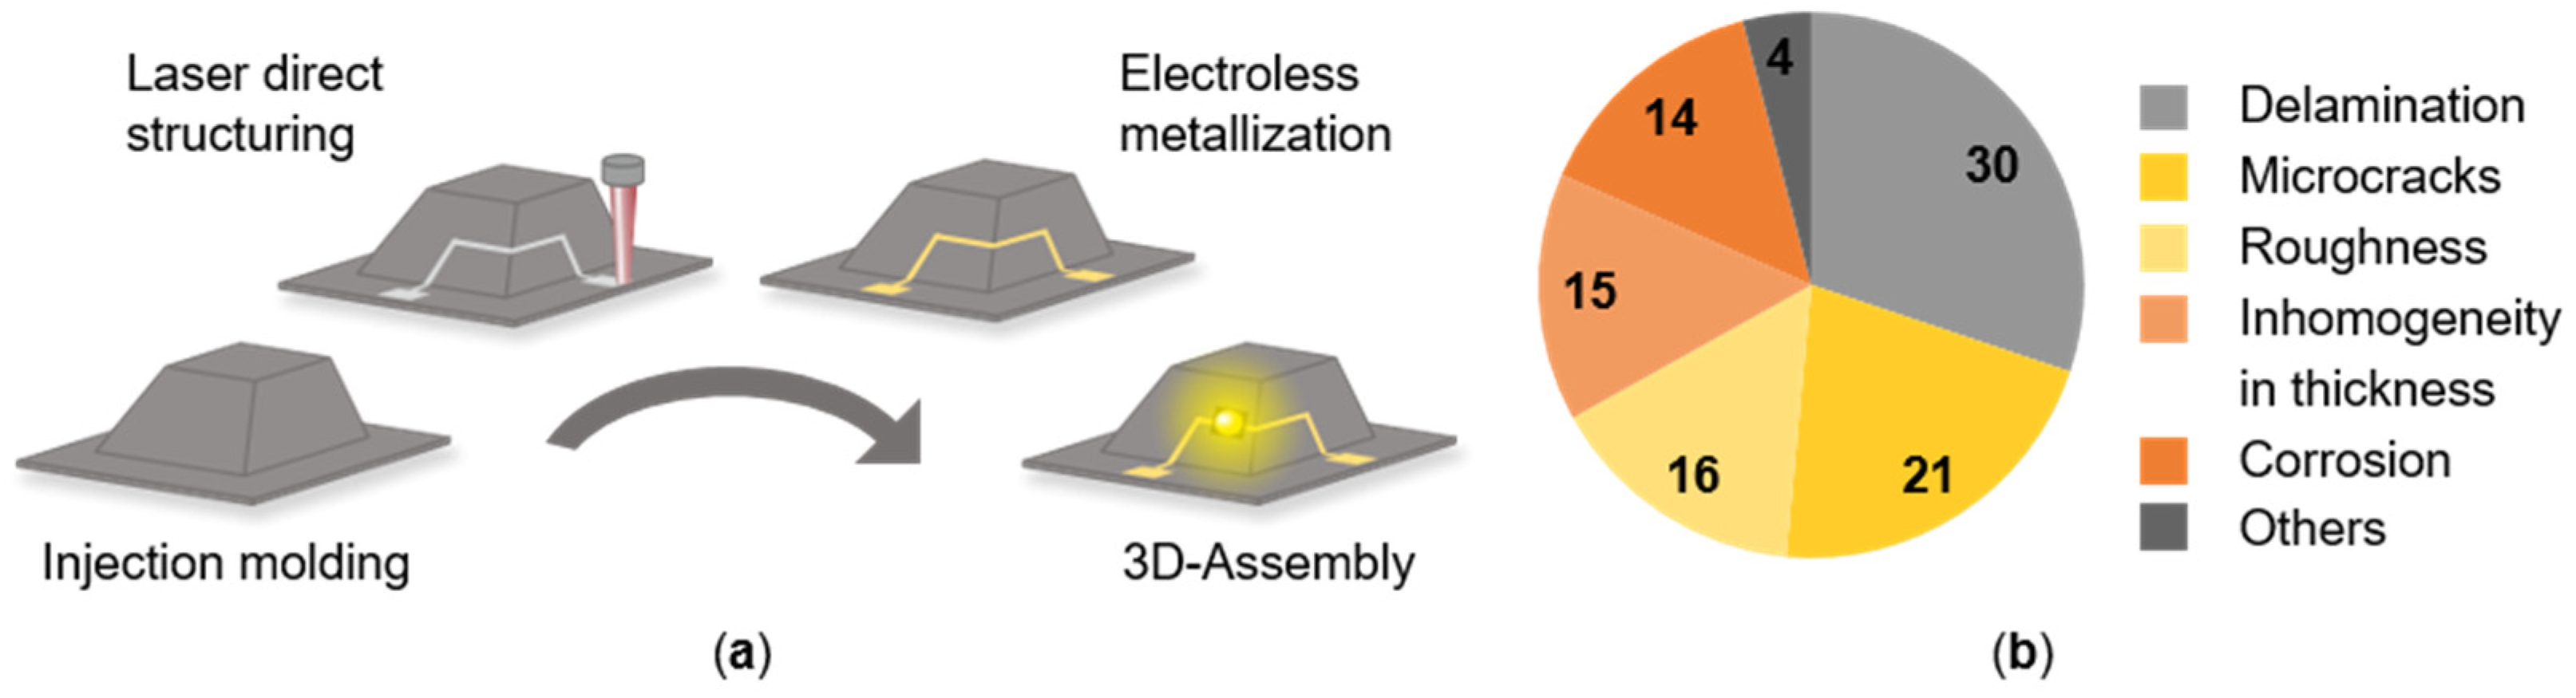
:1. Introduction
2. Materials and Methods
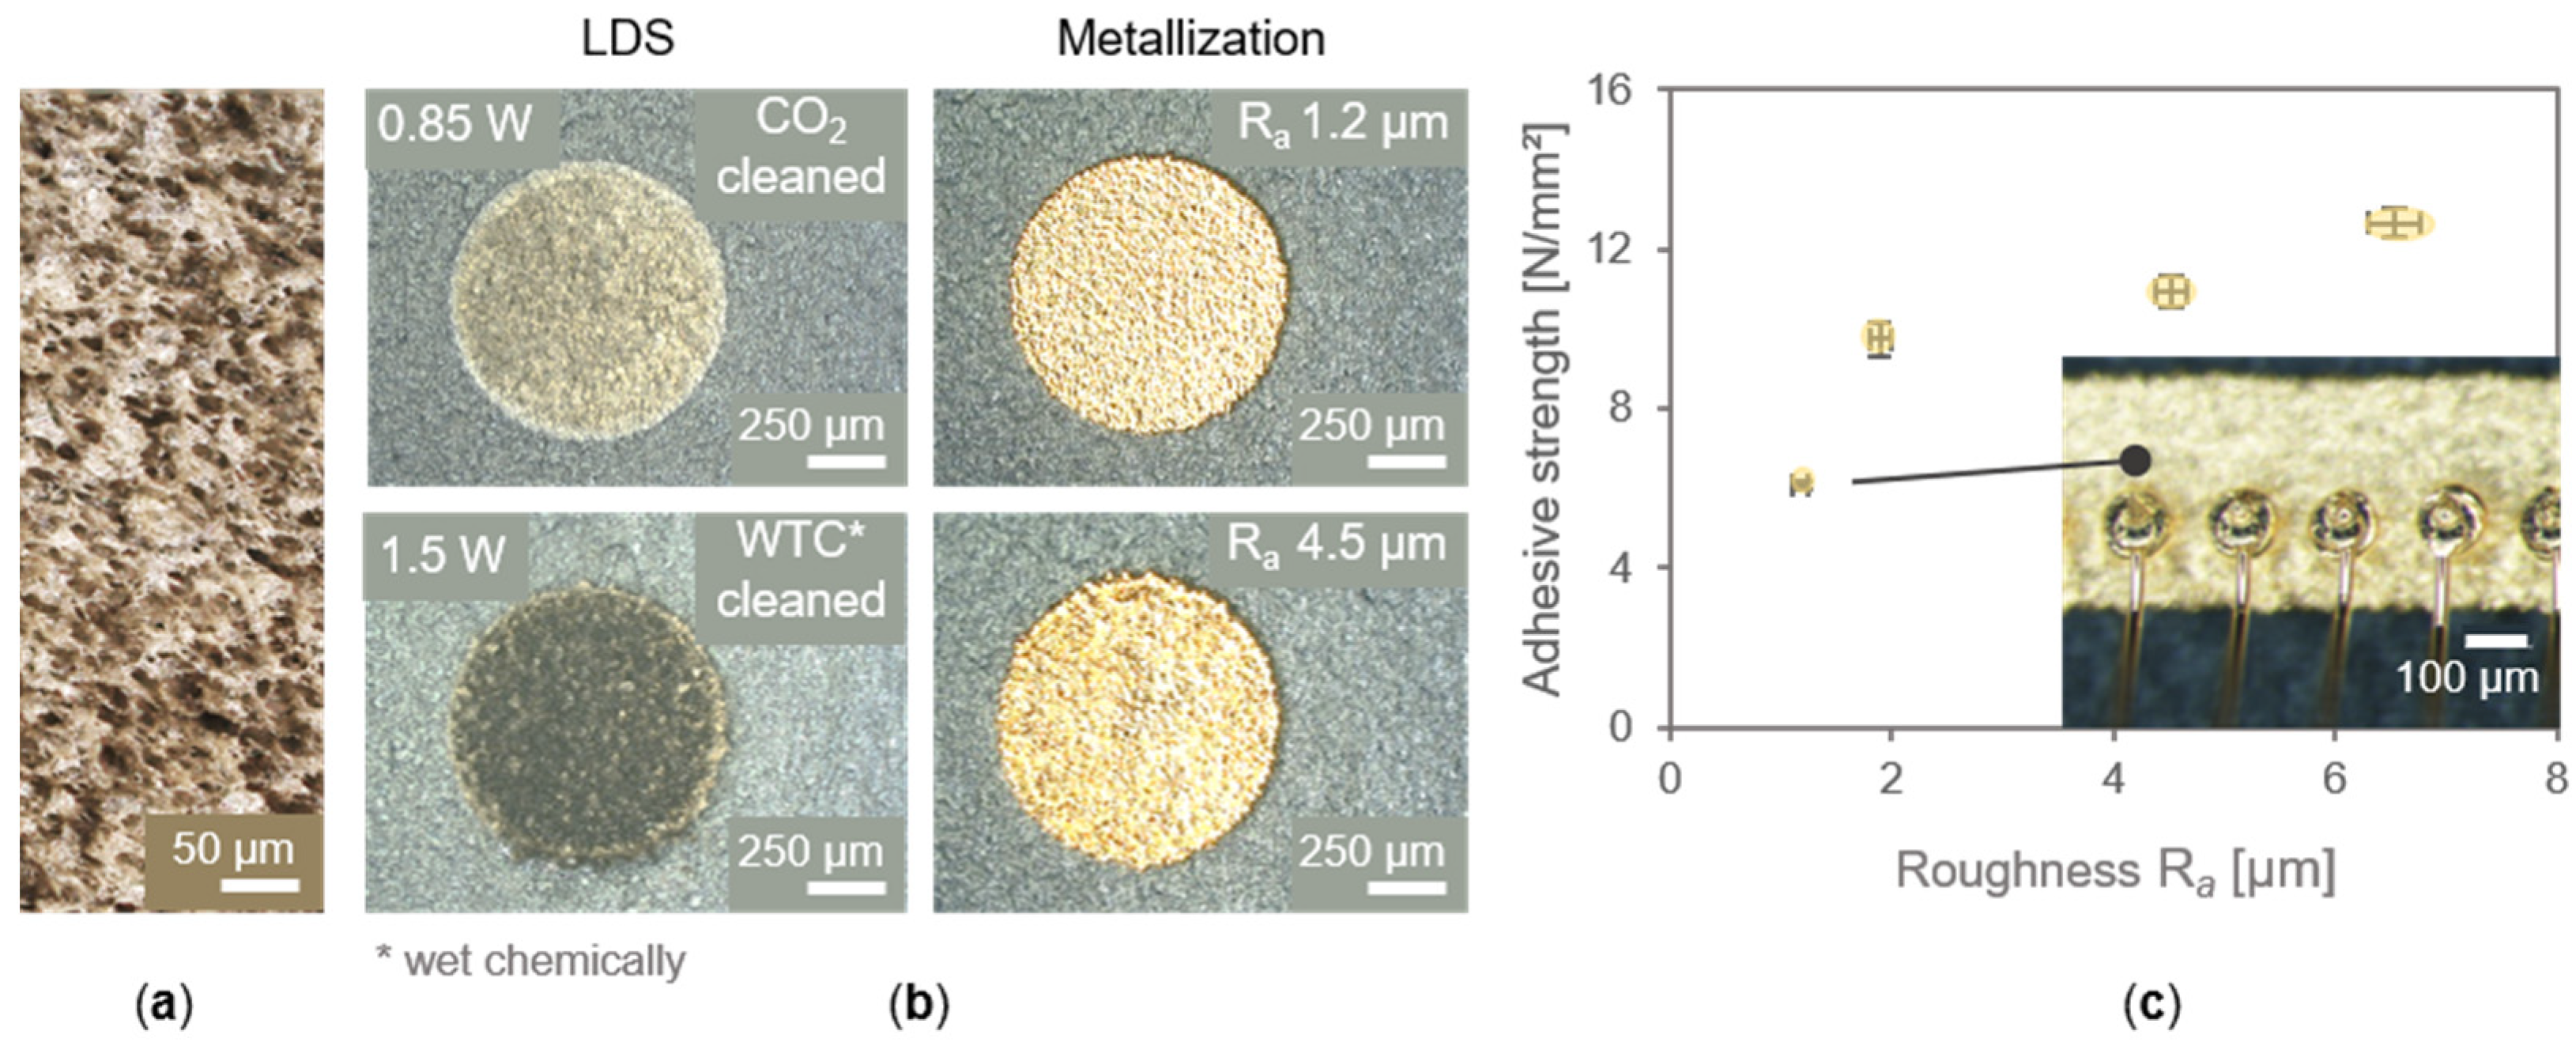
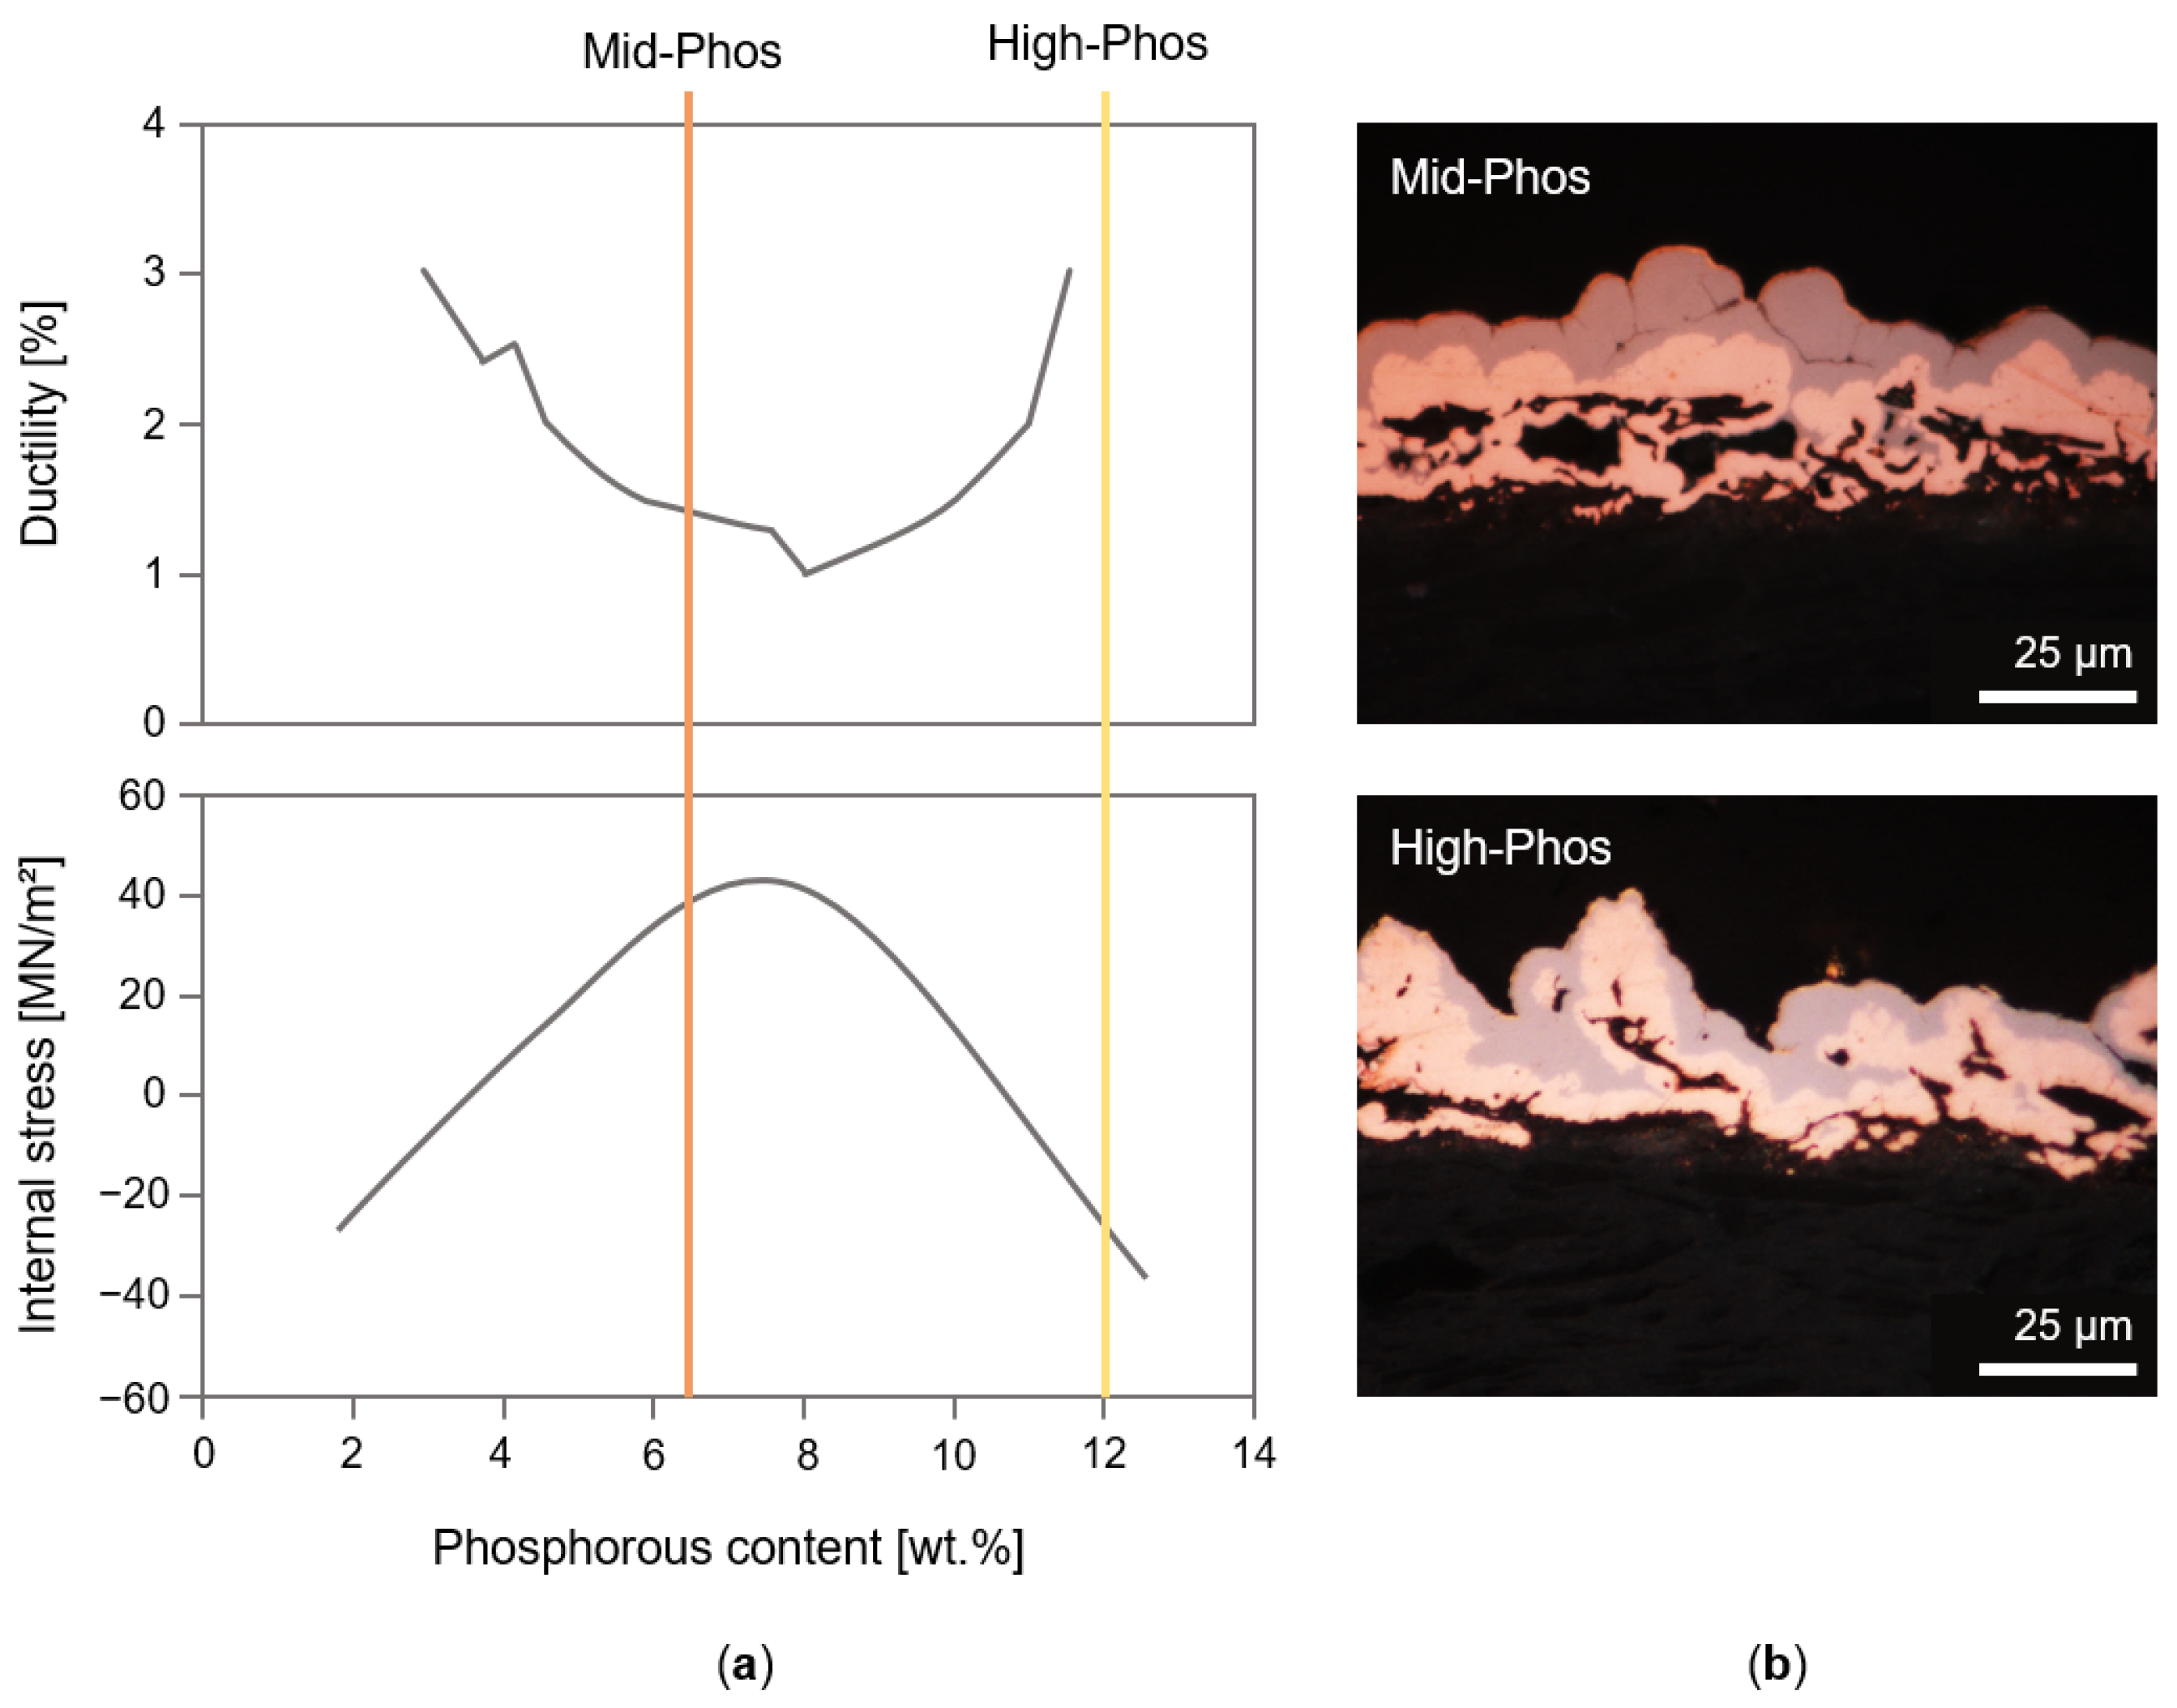
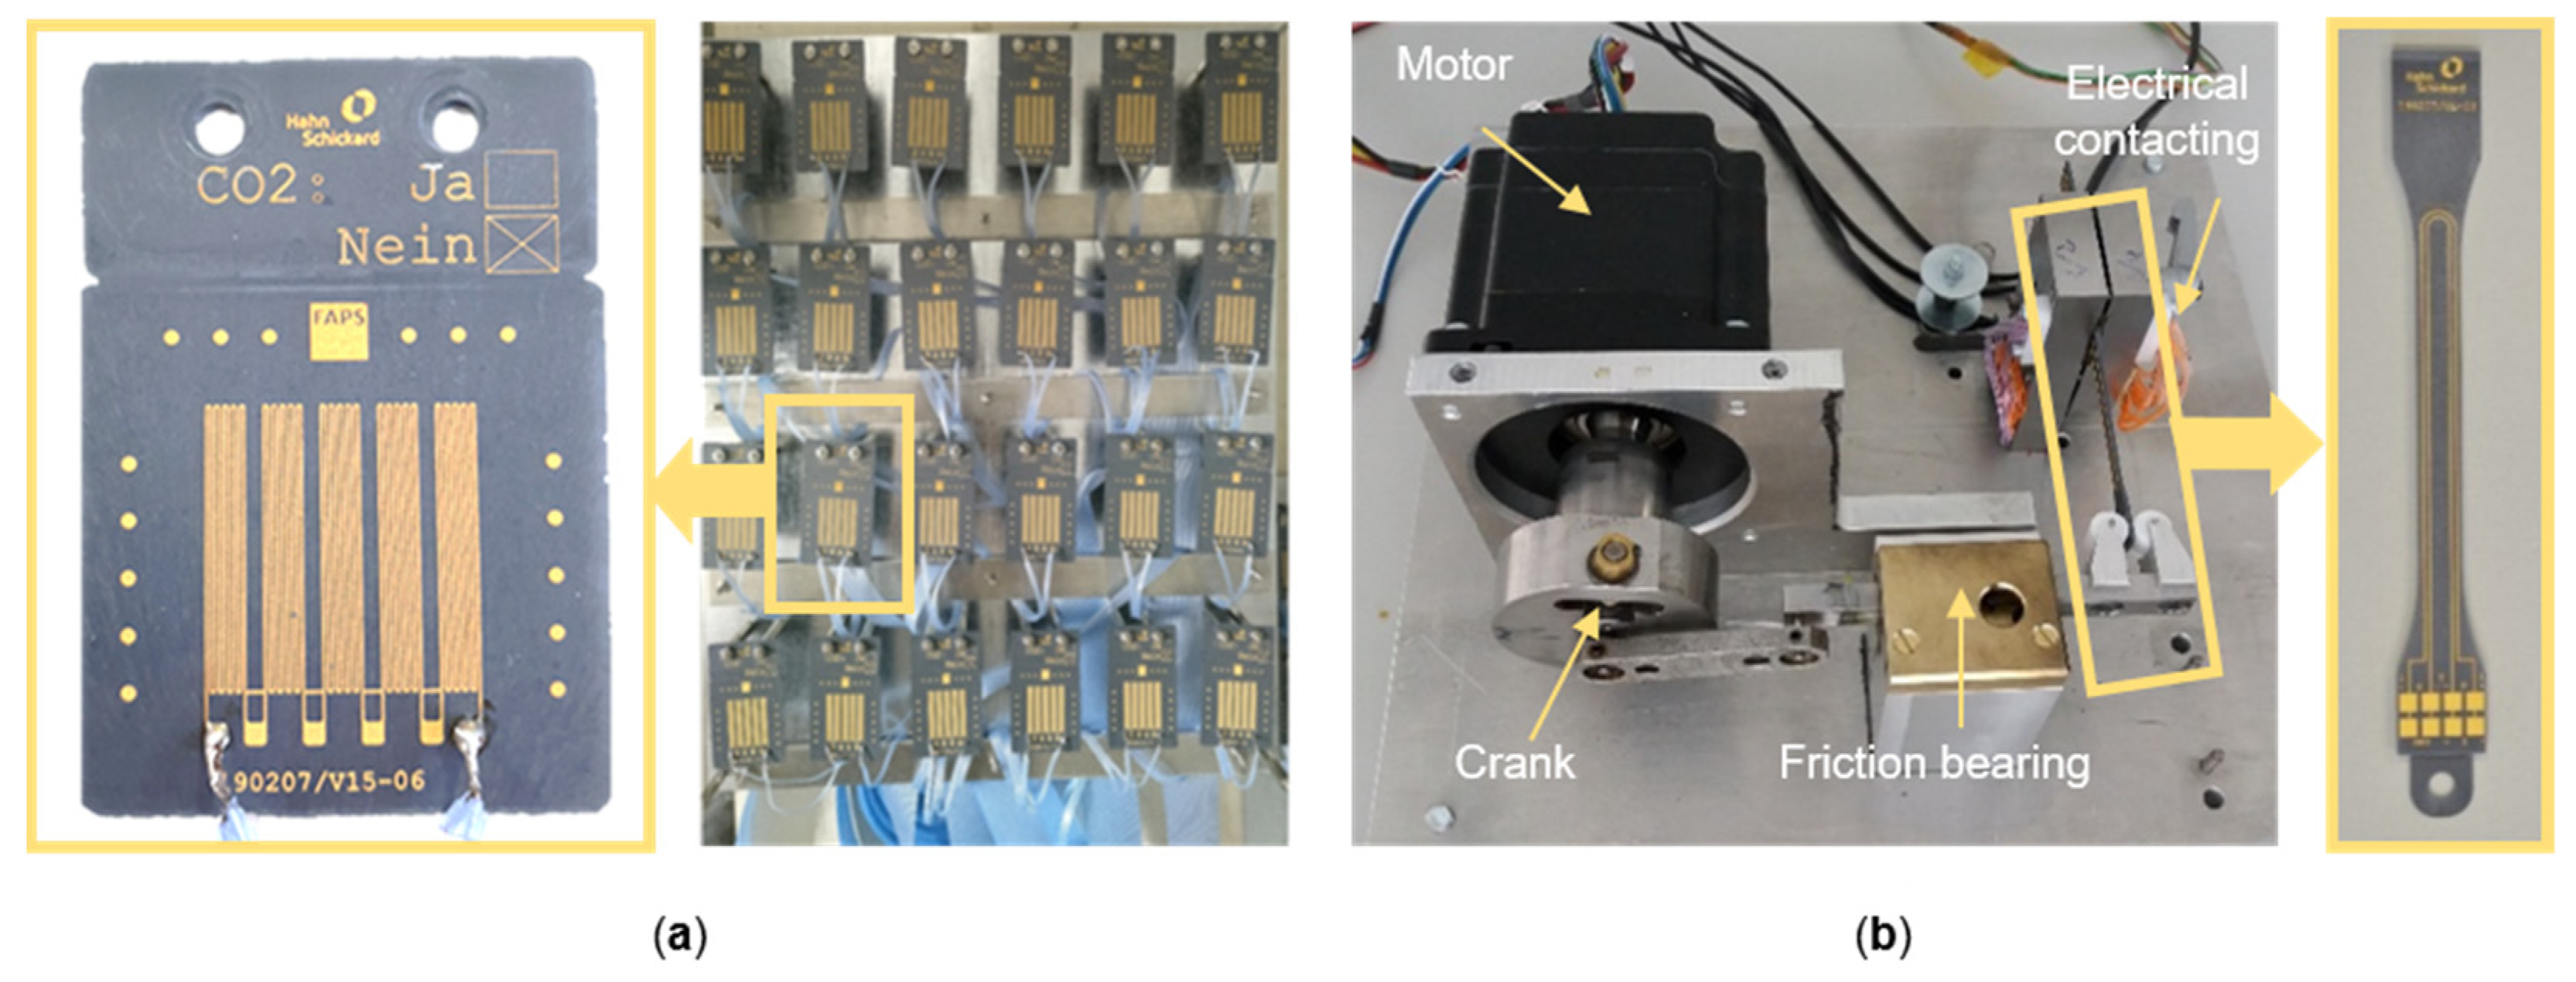
2.1. Sample Fabrication
2.2. Lifetime Investigations
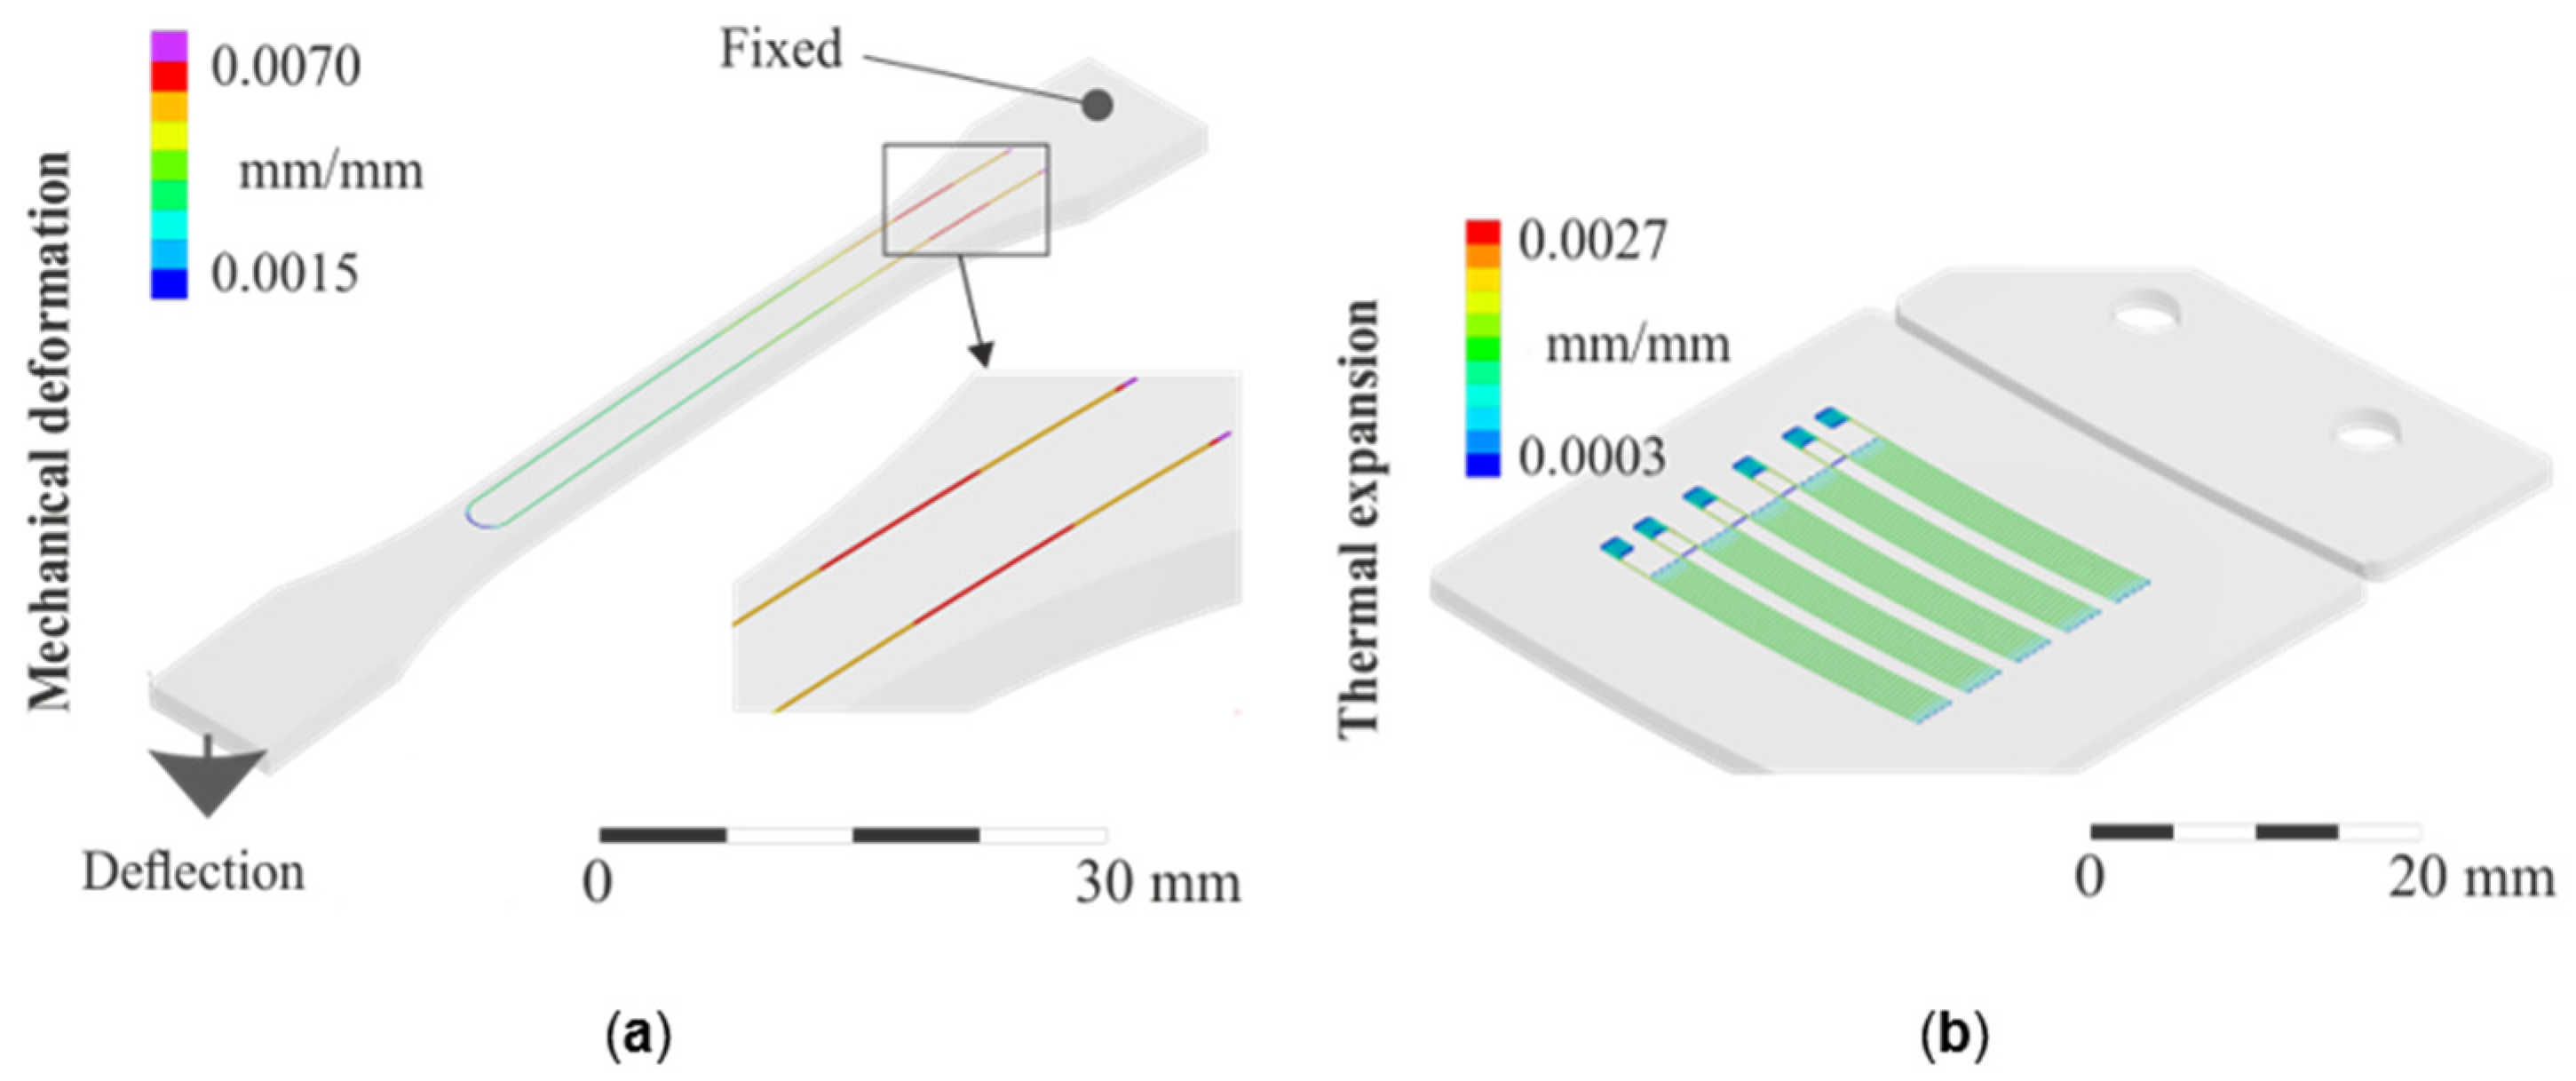
2.3. Thermomechanical Simulation
3. Results
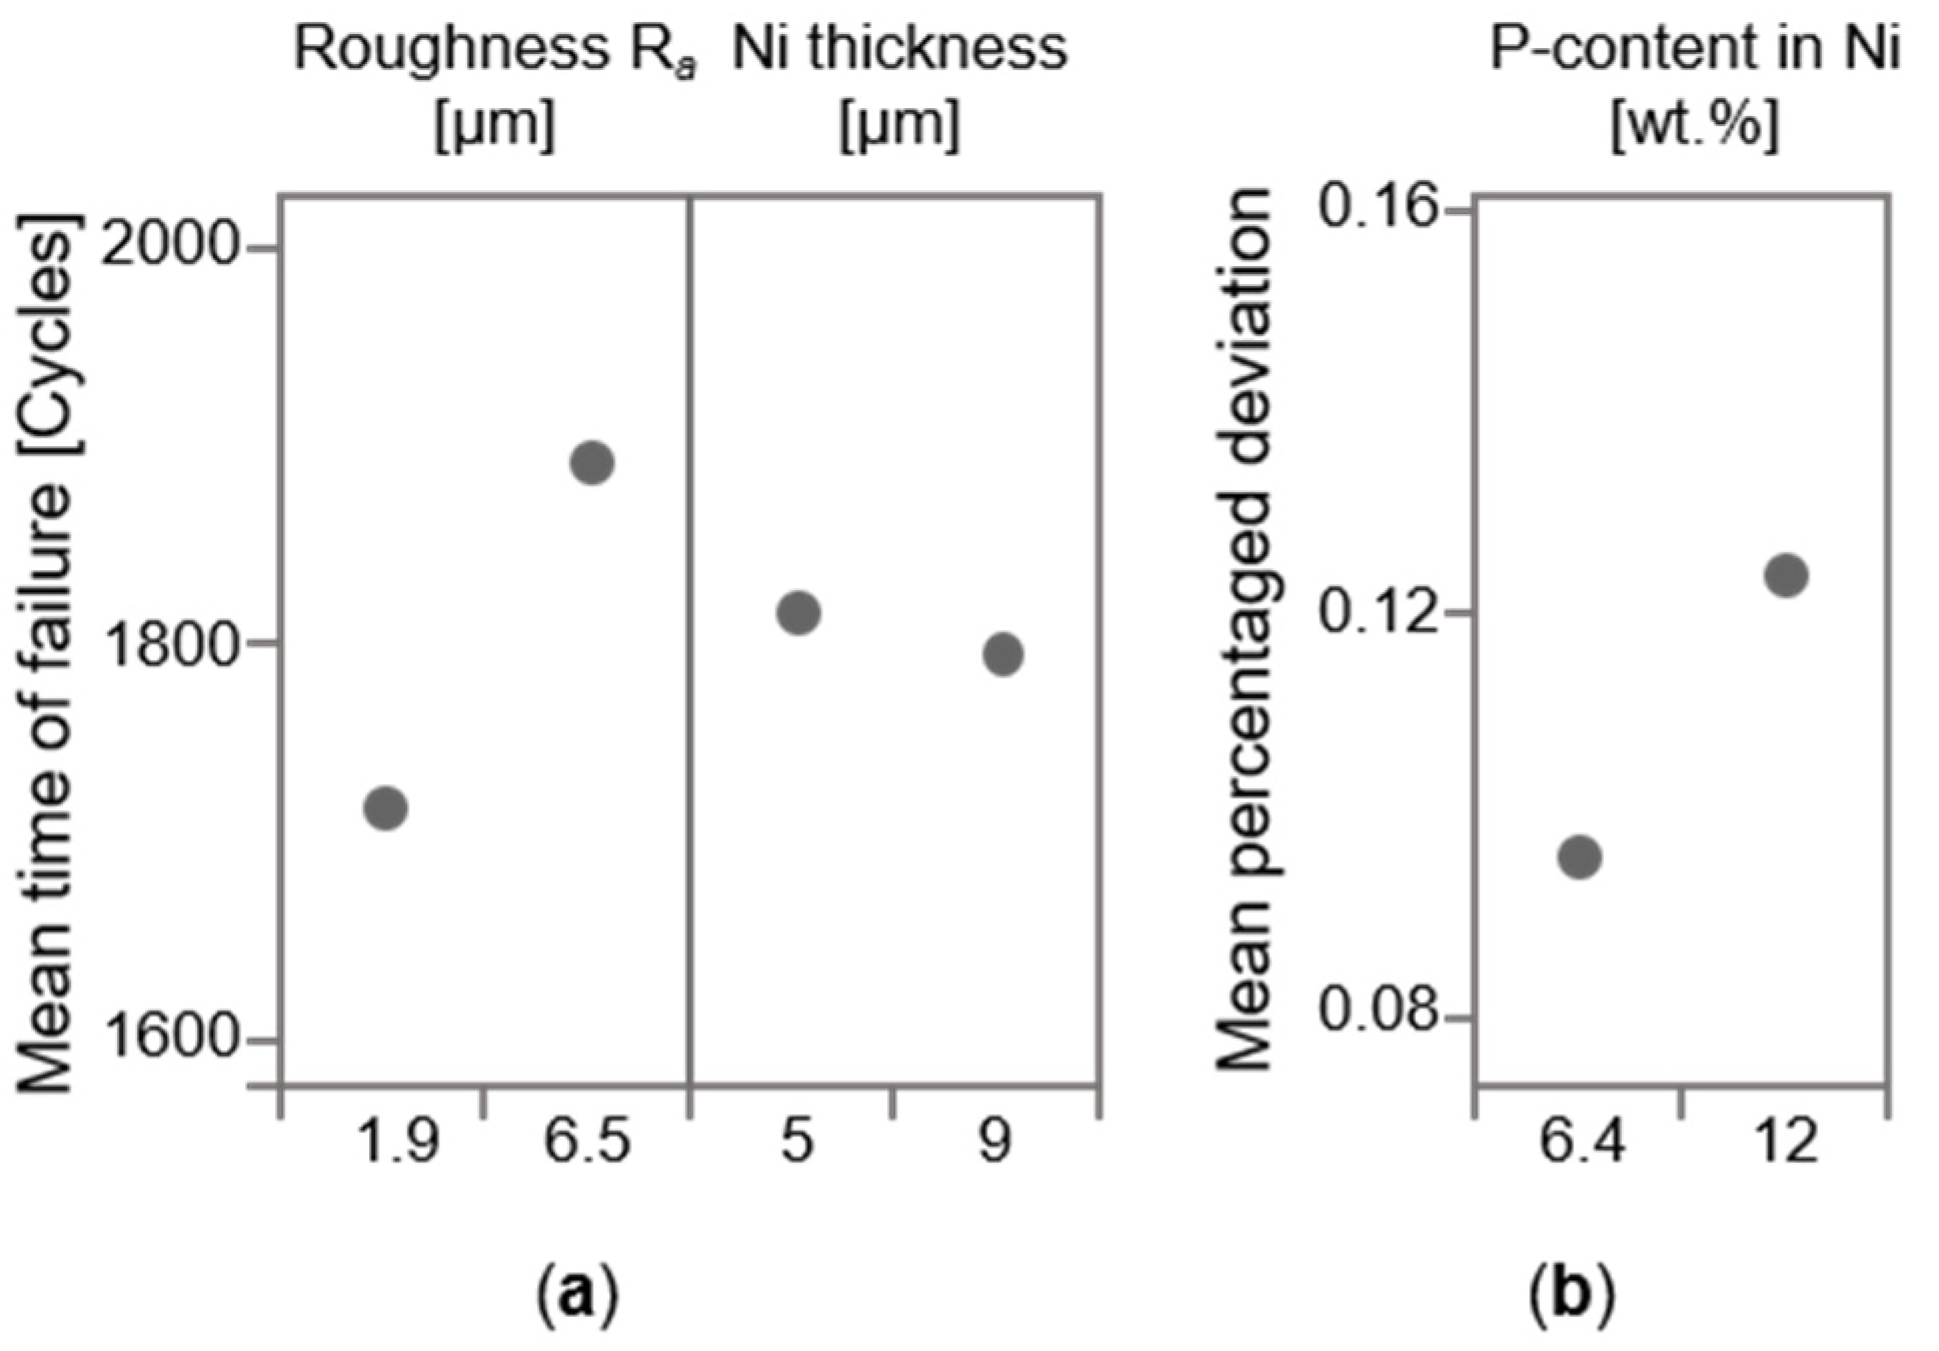
3.1. Flexural Fatigue Tests
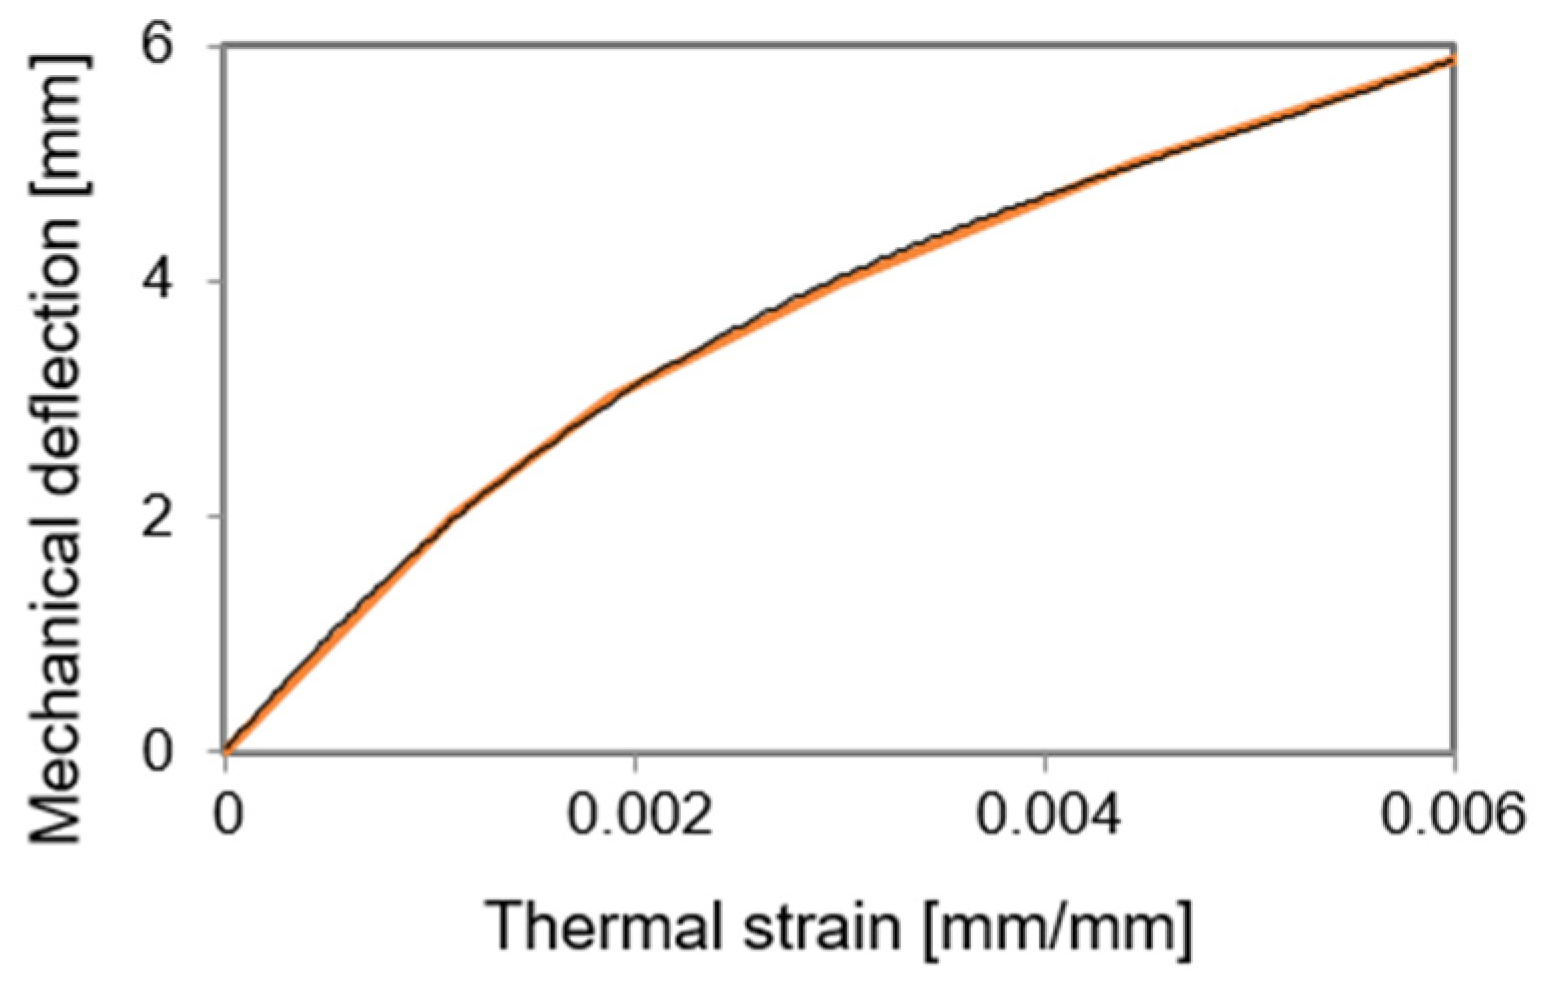
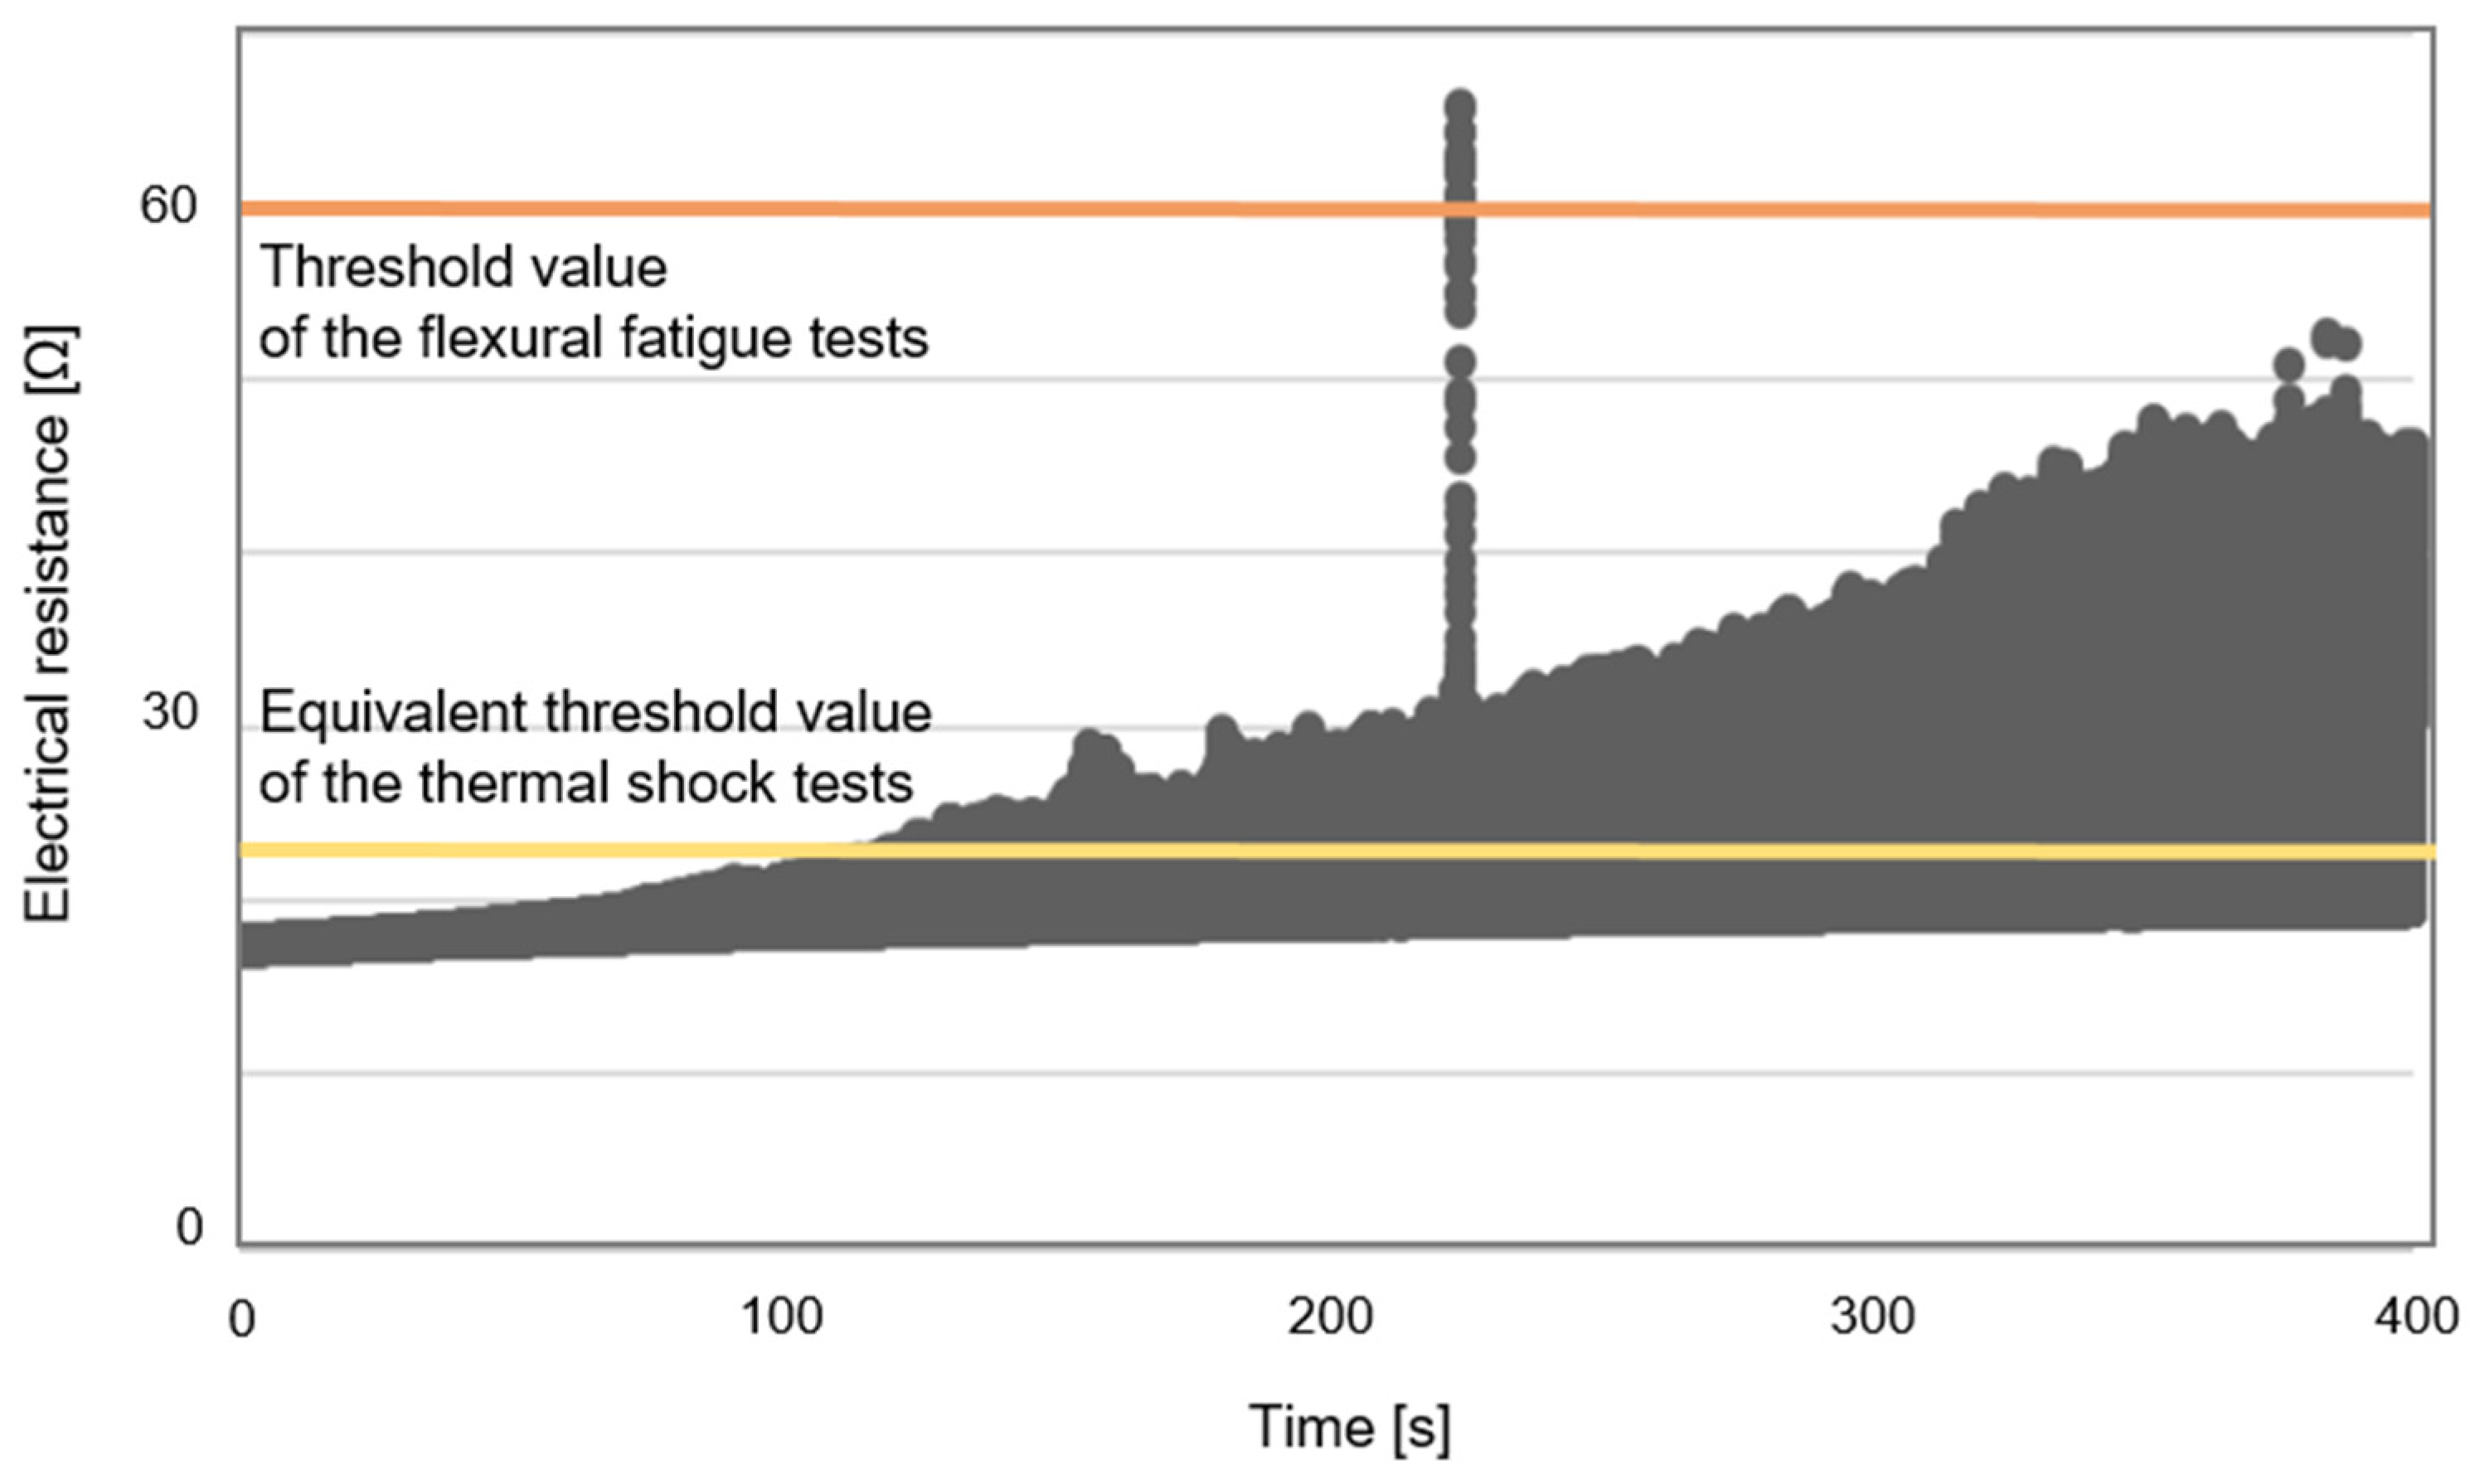
3.2. Simulation-Assisted Correlation with Standardized Thermal Shock Tests
4. Discussion
5. Conclusions
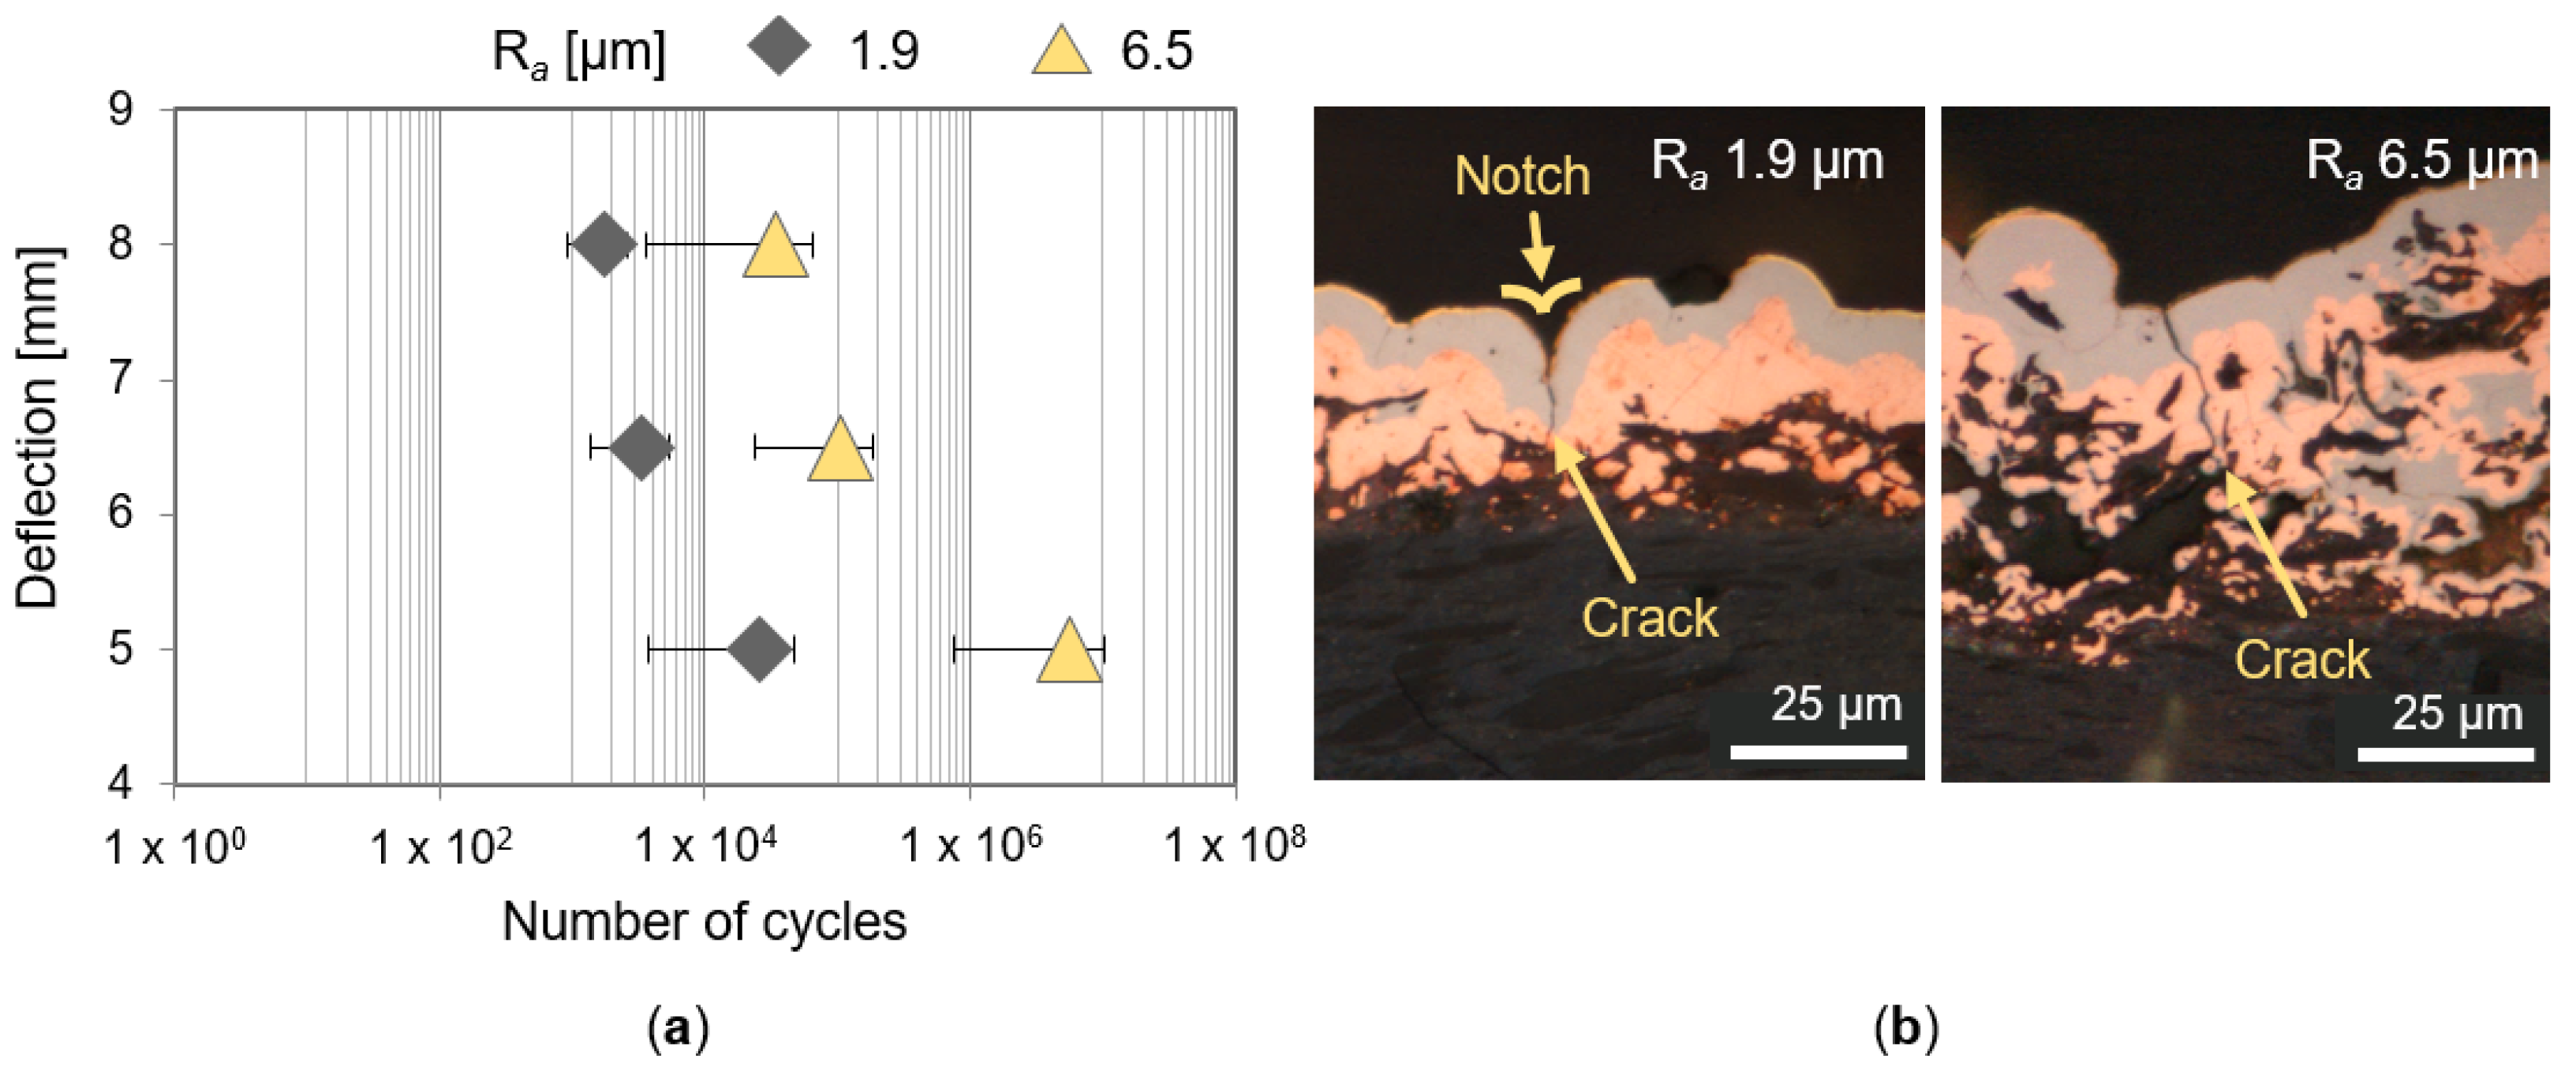
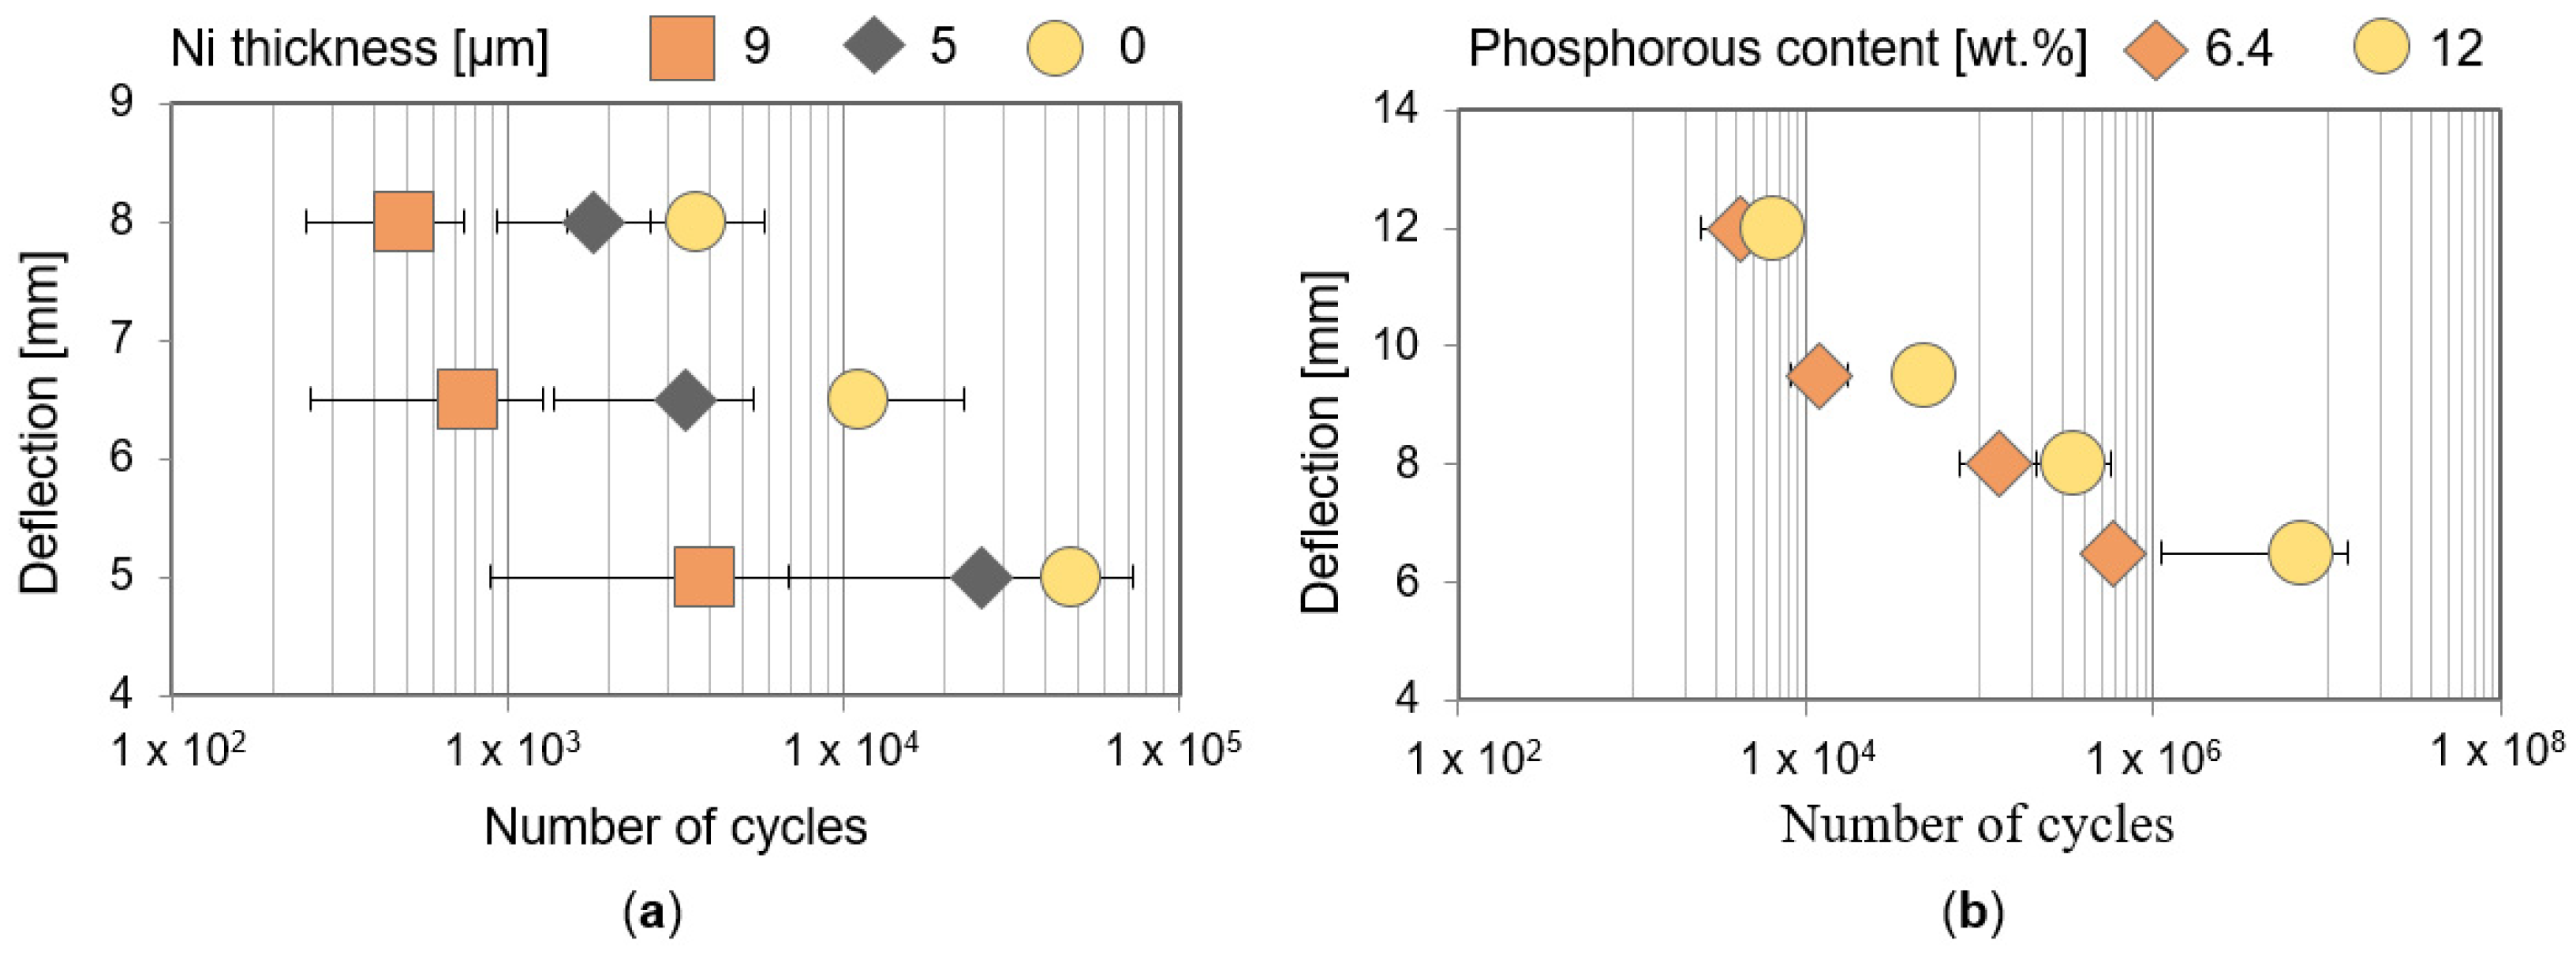
- It could be verified that a high surface roughness and a low nickel thickness, along with an increased phosphorous content in the nickel layer, yields conductor tracks with an enhanced lifetime under flexural load.
- Similar trends regarding the lifetime of conductor tracks on MID were observed in comparison to a standardized thermal shock test, whereas the proposed method required a significantly shorter test time.
- Further adjustments of the flexural fatigue test setup need to be made to be able to also consider the influence of temperature on the polymer-metal bond in the proposed method as well as a comparable threshold value based on the initial resistance of each part, as in the case of the standardized thermal shock test.
- The flexural fatigue test cannot fully replace the standardized thermal shock test, as it is limited to 2D, but it can function as time-efficient supplementation, when compiling suitable process parameters for a certain application.
Author Contributions
Funding
Data Availability Statement
Acknowledgments
Conflicts of Interest
References
- Franke, J. Three-Dimensional Molded Interconnect Devices (3D-MID): Materials, Manufacturing, Assembly and Applications for Injection Molded Circuit Carriers; Carl Hanser Verlag GmbH & Co. KG: Munich, Germany, 2014; ISBN 978-1-56990-552-4. [Google Scholar]
- Naundorf, G.; Wissbrock, H. Conductor Track Structures and Method for Production Thereof. U.S. Patent 7060421B2, 13 June 2006. [Google Scholar]
- Khandpur, R.S. Printed Circuit Boards: Design, Fabrication, Assembly and Testing; Tata McGraw-Hill Education: New York, NY, USA, 2005; ISBN 978-0-07-058814-1. [Google Scholar]
- Fechtelpeter, C.; Jürgenhake, C.; Fritz, K.-P.; Grözinger, T.; Müller, H.; Wild, P. Zuverlässigkeit bei MID—Hemmnisse, Potentiale, Handlungsfelder (Reliabilty of MID—Obstacles, Potentials and Fields of Action); Forschungsvereinigung Räumliche Elektronische Baugruppen 3-D MID e.V.: Nuremberg, Germany, 2015. [Google Scholar]
- Kuhn, T.; Franke, J. Influences on Crack Initiation in Conductor Tracks on Three-Dimensional Thermoplastic Substrates. In Proceedings of the 2017 Pan Pacific Microelectronics Symposium (Pan Pacific), Kauai, HI, USA, 6–9 February 2017; pp. 1–7. [Google Scholar]
- Suárez, A.; Veiga, F.; de Lacalle, L.N.L.; Polvorosa, R.; Lutze, S.; Wretland, A. Effects of Ultrasonics-Assisted Face Milling on Surface Integrity and Fatigue Life of Ni-Alloy 718. J. Mater. Eng. Perform. 2016, 25, 5076–5086. [Google Scholar] [CrossRef]
- AlShareedah, O.; Nassiri, S.; Dolan, J.D. Pervious Concrete under Flexural Fatigue Loading: Performance Evaluation and Model Development. Constr. Build. Mater. 2019, 207, 17–27. [Google Scholar] [CrossRef]
- Kasu, S.R.; Deb, S.; Mitra, N.; Muppireddy, A.R.; Kusam, S.R. Influence of Aggregate Size on Flexural Fatigue Response of Concrete. Constr. Build. Mater. 2019, 229, 116922. [Google Scholar] [CrossRef]
- Jia, Y.; Yang, Y.; Liu, G.; Gao, Y.; Yang, T.; Hu, D. Reliability Assessment of Flexural Fatigue Failure of Asphalt Mixture: A New Perspective. Constr. Build. Mater. 2020, 257, 119553. [Google Scholar] [CrossRef]
- Carlesso, D.M.; Cavalaro, S.; de la Fuente, A. Flexural Fatigue of Pre-Cracked Plastic Fibre Reinforced Concrete: Experimental Study and Numerical Modeling. Cem. Concr. Compos. 2021, 115, 103850. [Google Scholar] [CrossRef]
- Lall, P.; Narangaparatnbil, J.; Leever, B.; Miller, S. Effect of Use Parameters on Fatigue-Life of Flexible Substrates under Bending Loads. In Proceedings of the 2019 18th IEEE Intersociety Conference on Thermal and Thermomechanical Phenomena in Electronic Systems (ITherm), Las Vegas, NV, USA, 28–31 May 2019; pp. 1072–1081. [Google Scholar]
- Urasinska-Wojcik, B.; Chilton, N.; Todd, P.; Elsworthy, C.; Bates, M.; Roberts, G.; Gibbons, G.J. Integrated Manufacture of Polymer and Conductive Tracks for Real-World Applications. Addit. Manuf. 2019, 29, 100777. [Google Scholar] [CrossRef]
- Zhang, B.; Shan, G.; Su, F. Impact Reliability Analysis of a Rigid-Flex PCB System under Acceleration Loads. Microelectron. Reliab. 2021, 127, 114374. [Google Scholar] [CrossRef]
- Grellmann, W.; Seidler, S. Kunststoffprüfung; Carl Hanser Verlag GmbH & Co. KG: Munich, Germany, 2015; ISBN 978-3-446-44390-7. [Google Scholar]
- Mueller, H.; Groezinger, T.; Weser, S.; Eberhardt, W.; Zimmermann, A. Investigations on Flexural Fatigue Strength of Conductor Paths Fabricated by LPKF-LDS® Technology. J. Micro Nano-Manuf. 2017, 6, 011004. [Google Scholar] [CrossRef]
- DIN EN ISO 4288:1998-04; Geometrical Product Specifications (GPS)—Surface Texture: Profile Method—Rules and Procedures for the Assessment of Surface Texture (ISO 4288:1996). Beuth Verlag GmbH: Berlin, Germany, 1998.
- Goth, C.; Kuhn, T.; Gion, G.; Franke, J. Hot Pin Pull Method—New Test Procedure for the Adhesion Measurement for 3D-MID. Available online: https://www.scientific.net/AMR.1038.115 (accessed on 28 December 2020).
- Parkinson, R. Properties and Applications of Electroless Nickel; Nickel Development Institute: Toronto, ON, Canada, 1997. [Google Scholar]
- VECTRA® E840i LDS. Available online: https://tools.celanese.com/products/datasheet/US/VECTRA%C2%AE%20E840i%20LDS (accessed on 21 February 2022).
- Grözinger, T. Untersuchungen Zu Zuverlässigkeit Und Lebensdauermodellen Für Gelötete SMD Auf Spritzgegossenen Schaltungsträgern (Investigations of the Reliability and Life Cycle Models of Soldered SMD on Injection-Molded Circuit Carriers). Ph.D. Thesis, University of Stuttgart, Stuttgart, Germany, 2015. [Google Scholar]
- Kakisawa, H.; Sumitomo, T. The Toughening Mechanism of Nacre and Structural Materials Inspired by Nacre. Sci. Technol. Adv. Mater. 2011, 12, 064710. [Google Scholar] [CrossRef] [PubMed]
- Warkentin, D. Untersuchungen Zu Kapazitiven Beschleunigungssensoren Aus Metallbeschichtetem Kunststoff (Investigations on Capacitive Acceleration Sensors Made of Metal-Coated Plastic). Ph.D. Thesis, University of Stuttgart, Stuttgart, Germany, 2005. [Google Scholar]


| Variant | Roughness Ra (µm) | Nickel Thickness (µm) | Phosphorous Content in Nickel (wt.%) |
|---|---|---|---|
| V1 | 1.9 | 0 | - |
| V2 | 1.9 | 5 | 6.4 |
| V3 | 1.9 | 9 | 6.4 |
| V4 | 6.5 | 5 | 6.4 |
| V5 | 6.5 | 3 | 6.4 |
| V6 | 6.5 | 3 | 12.0 |
| Material | Young’s Modulus20°C ║[GPa] | Young’s Modulus20°C ├[GPa] | CTE−40°C [ppm/K] ║/├ | CTE150°C [ppm/K] ║/├ |
|---|---|---|---|---|
| LCP | 10.3 | 6.0 | 9.2/23.2 | 14.3/32.7 |
| Cu/Ni | 99.8 | 15.4 | 15.4 |
Publisher’s Note: MDPI stays neutral with regard to jurisdictional claims in published maps and institutional affiliations. |
© 2022 by the authors. Licensee MDPI, Basel, Switzerland. This article is an open access article distributed under the terms and conditions of the Creative Commons Attribution (CC BY) license (https://creativecommons.org/licenses/by/4.0/).
Share and Cite
Petillon, S.; Knöller, A.; Bräuer, P.; Helm, D.; Grözinger, T.; Weser, S.; Eberhardt, W.; Franke, J.; Zimmermann, A. Flexural Fatigue Test—A Proposed Method to Characterize the Lifetime of Conductor Tracks on Polymeric Substrates. J. Manuf. Mater. Process. 2022, 6, 41. https://doi.org/10.3390/jmmp6020041
Petillon S, Knöller A, Bräuer P, Helm D, Grözinger T, Weser S, Eberhardt W, Franke J, Zimmermann A. Flexural Fatigue Test—A Proposed Method to Characterize the Lifetime of Conductor Tracks on Polymeric Substrates. Journal of Manufacturing and Materials Processing. 2022; 6(2):41. https://doi.org/10.3390/jmmp6020041
Chicago/Turabian StylePetillon, Simon, Andrea Knöller, Philipp Bräuer, David Helm, Tobias Grözinger, Sascha Weser, Wolfgang Eberhardt, Jörg Franke, and André Zimmermann. 2022. "Flexural Fatigue Test—A Proposed Method to Characterize the Lifetime of Conductor Tracks on Polymeric Substrates" Journal of Manufacturing and Materials Processing 6, no. 2: 41. https://doi.org/10.3390/jmmp6020041