Article

Research of Slamming Load Characteristics during Trans-Media Aircraft Entry into Water

1
Key Lab of Smart Prevention and Mitigation of Civil Engineering Disasters, Ministry of Industry and Information Technology, Harbin Institute of Technology, Harbin 150090, China
2
Laboratory for Space Environment and Physical Sciences, Harbin Institute of Technology, Harbin 150001, China
3
Frontiers Science Center for Matter Behave in Space Environment, Harbin Institute of Technology, Harbin 150001, China
4
Key Lab of Structures Dynamic Behavior and Control of the Ministry of Education, Harbin Institute of Technology, Harbin 150090, China
*
Author to whom correspondence should be addressed.
Drones 2024, 8(3), 89; https://doi.org/10.3390/drones8030089
Submission received: 16 February 2024 / Revised: 1 March 2024 / Accepted: 4 March 2024 / Published: 6 March 2024

Abstract

:
The trans-media aircraft water entry process generates strong slamming loads that will seriously affect the stability and safety of the aircraft. To address this problem, we design a fixed-wing aircraft configuration and employ numerical simulations with the volume of fluid (VOF) multiphase flow model, standard k-epsilon turbulence model, and dynamic mesh technique. We explore the characteristics of aircraft subjected to bang loads under different conditions. The results show the following: the pressure load on the aircraft surface increases with higher water entry velocity; larger entry angles lead to more drastic changes in the aircraft’s drag coefficient, demonstrating strong nonlinear characteristics; the greater the angle of attack into the water, the greater the pressure load on the root underneath the wing, with little effect on the pressure load on the head; and the water entry drag coefficient and average pressure load follow an increasing order of conical head, hemispherical head, and flat head. These findings provide theoretical references for studying the load characteristics during trans-media water entry of various flying bodies and optimizing fuselage structural strength.

1. Introduction

The object-in-water problem has a background of wide ranging engineering applications and significance to important scientific research, such as for unmanned underwater vehicles (UUV) launching into the water, underwater reconnaissance vehicles, bionic vehicle water landing, airdrop of objects at sea, etc. The impact velocity of trans-media aircraft into water is large [1], accompanied by complex turbulence and phase change, which instantly generates strong slamming loads. Problems such as vehicle structural damage, connection failure, and motion instability may occur. Therefore, it is of great significance to investigate the characteristics of the slamming load suffered by the aircraft during the trans-media water entry process to improve the structural safety and stability of the aircraft and ensure the safe entry of the aircraft into the water. Depending on the means of study, studies are categorized as experimental, theoretical, and numerical simulation studies. The experimental models have evolved from spheres, vertebrae, wedge-shaped blocks, etc. to vehicles and navigational bodies. Gilbarg et al. [2] carried out the ball drop test to investigate the effect of atmospheric pressure on the sphere entry phenomenon. Wang et al. [3] used four high-speed cameras to test the free-fall of a sphere and observed the phenomena of entry splash, bubble closure, etc. Shams et al. [4] used wedges to conduct a drop test to investigate the effect of asymmetric wedge impacts on the process of fluid–structure interaction. Liu et al. [5] used a high-speed camera to capture the development pattern of vacuoles during the high-speed water entry of a vehicle model, and obtained the loading characteristics of the vehicle surface through an acceleration sensor. Crandell et al. [6] used a plastic kingfisher model to simulate the process of kingfisher swooping dive, and investigated the effect of the beak’s morphology on the dive performance by combining this with a computational fluid dynamics (CFD) simulation. Qi et al. [7] carried out a launching entry test of an autonomous underwater vehicle (AUV) under different conditions and compared it with the CFD. The numerical simulation results were compared with the CFD simulation results, and the change rule of impact load and the test phenomena such as vacuoles and overturning were obtained. Chen et al. [8,9] conducted a test of the navigator’s tilted entry into the water and explored the development rule of the vacuole morphology as well as the relationship between the resistance and the shape of the navigator’s head. In their theoretical research, Korobkin [10] improved the Logvinovich method, obtained the modified Logvinovich model (MLM) method, and carried out theoretical research on the water entry of a wedge with a larger angle of inclination. Shiffman [11] assumed that the water is an incompressible fluid, and the impact force of a vertebral body vertically entering into the water surface was given a theoretical value through iterative calculation. Truscott et al. [12,13] combined the aforementioned theories and experiments to carry out a study of the water entry current field problem and illustrated the effect of the water entry angle on the ballistic stability through a series of high-speed water entry tests. In recent years, with the development of computers, numerical simulation has become an efficient and convenient means of research. G. Oger et al. [14] carried out a numerical simulation of two-dimensional wedge block water entry using the smoothed particle hydrodynamics (SPH) method. Wang et al. [15] carried out a three-dimensional wedge vertical water entry simulation and obtained the results of the change in load and the phenomenon of the development of the vacuole. Hou et al. [16] used a six-degree-of-freedom cylinder model to carry out a three-dimensional numerical simulation and investigated the mechanism of the evolution of vacuole. Shi et al. [17,18] used the arbitrary Lagrange–Euler (ALE) numerical method to simulate the water entry process of an AUV and analyzed the characteristics of the vacuole and the impact load law under different conditions. Wang et al. [19] used the VOF method and overset mesh to carry out a numerical simulation of the water entry of an AUV under different conditions, and explored the change rule of the trajectory of the AUV. Wang et al. [20] improved the SPH model and simulated the elastic cylinder water entry process, verified the validity of the improved SPH model, and analyzed the dynamic response characteristics such as deformation and impact force when the elastic structure enters water. In summary, scholars in the past have carried out a lot of research on the problem of water entry of objects through experiments, theoretical analysis, and numerical simulation. Most of this research is centered on the morphology of super vacuoles during high-speed water entry, the characteristics of water entry impact loads, the stability of water entry ballistic paths, etc., and good results and conclusions have been obtained. Research on the aircraft water entry motion attitude and head shape on the water entry drag and bang load characteristics is still insufficient. In this paper, the VOF multiphase flow model and standard k-epsilon turbulence model in Fluent, combined with dynamic mesh technology [21], are used to carry out the three-dimensional numerical simulation of the unmanned aerial vehicle (UAV) trans-media water ingress and analyze the effects of velocity, angle, angle of attack, and head shape on the slamming load on the fuselage in the process of the vehicle’s water ingress to provide references for UAVs and other aerial vehicles to enter water trans-media and the optimization of their fuselage structural strength design.

2. Materials and Methods

This paper is based on Fluent for numerical computation; the unmanned aerial vehicle is defined as a rigid body, involving solid, liquid, and gas phases; the VOF multiphase flow model and standard k-epsilon turbulence model are used, which are combined with dynamic mesh technology; and the motion of the vehicle is defined through the user-defined function.

2.1. Control Equations

Since the UAV enters the water at a low velocity, it can be assumed that the water is an incompressible fluid and the heat energy generated during the movement is negligible [22]; the basic equations required for the calculation are as follows:
The continuity equation:
ρ m t + ( ρ m U ) = 0
Momentum equation:
t ( ρ m U ) + ( ρ m U U ) = p + τ i j + S
Viscous shear stress:
τ i j = μ m [ ( u i x j + u j x i ) 2 3 δ i j u k x k ]
The density of the mixture:
ρ m = k = 1 n α k ρ k
U = k = 1 n α k ρ k U k ρ m
k = 1 n α k = 1
μ m = k = 1 n α k μ k
where U denotes the mass-averaged velocity vector of the mixture; α k denotes the volume fraction of the k-th phase; μ m denotes the kinetic viscosity of the mixture; S denotes the original term generated by volumetric forces or customized by the user; U k denotes the velocity vector of the kth phase; ρ k denotes the density of the kth phase; μ k denotes the kth phase’s kinetic viscosity; m denotes the mixing phase; l denotes the water phase; g denotes the air phase; and v denotes the water vapor phase.

2.2. Multiphase Flow Modeling

The VOF multiphase flow model is used to simulate the motion of gas–liquid two-phase flow. The model is a numerical method for solving incompressible, viscous, transient, and free surface flows. The basic idea is to track the fluid flow in each cell grid by constructing a function and determining the shape of the free surface according to the function value and derivative value of this function. The model takes velocity and pressure as the basic variables and solves the Navier–Stokes equations directly and differentially under the fixed grid of Euler to deal with the complex free-surface changes as well as wave breaking [23]. The following equation is satisfied:
C t + ( U ¯ C ) = 0
where, when C = 1 , it means that the cell is all first-phase fluid, i.e., a fluid grid; when C = 0 , it means that there is no first-phase fluid in the cell, i.e., an empty grid; and when 0 < C < 1 , it means that the cell is the air–water interface cell, i.e., an interface.

2.3. Turbulence Modeling

The standard k-epsilon turbulence model is used to deal with turbulent phenomena. The model can better predict flows such as buoyancy-free planar jets, flat-walled boundary layers, pipe flows, no or weak spins, etc., can be applied to a wide range of applications, and is easy to converge [24].
The turbulent kinetic energy k transport equation is given by the following:
t ( ρ k ) + x i ( ρ k u i ) = x j μ + μ t σ k k x j + G k + G b ρ ε Y M + S K
The turbulent dissipation rate ε transport equation is given by the following:
t ( ρ ε ) + x i ( ρ ε u i ) = x j μ + μ t σ ε ε x j + C 1 ε ε k G k + C 3 ε G b C 2 ρ ε 2 k + S ε
where G k denotes turbulent kinetic energy from the mean velocity gradient; G b denotes turbulent kinetic energy from buoyancy; S k and S ε denote user-defined source terms; and C 1 ε , C 2 ε , and C 3 ε are constants.

2.4. Geometric Modeling of the Aircraft

Trans-media vehicles, a kind of special vehicle with the capability of both sea and air amphibious operation, absorbs the performance advantages of underwater vehicles and air vehicles and improves the stability and efficiency of trans-ocean and air operation, and its unique ability to cross multiple media brings new challenges and opportunities to the field of science and technology. However, the prerequisites of this multi-media flight make the design of its airframe structure face complex and unavoidable contradictions. In this paper, by using a streamlined cylinder as the basis for the shape of the aircraft, we aim to reduce the drag force when moving in water. In order to adapt to the demand of low-speed flight in the air, it is combined with the design of a flat wing to ensure stable flight in the air. The overall fuselage has a length of 0.7 m and a height of 0.3 m. Considering that the shape has a great influence on the drag coefficient when moving in the water, which in turn affects the stability of the aircraft [25], the wing is specially designed with a length of 0.9 m, a width of 0.2 m, and an aspect ratio of 4.5. This design helps to reduce the contact area of the vehicle when it enters into the water to ensure the stability of the aircraft in the air and, at the same time, maximizes the reduction in the water aircraft’s drag. The model is shown in Figure 1. We define the aircraft shape as a rigid body with a density of 2000 kg/m3 and a weight of 32 kg.

2.5. Numerical Modeling of UAV Water Entry

A rectangular body was chosen as the computational domain with dimensions of 2.7 m in length, 1.4 m in width, 2 m in height, and a water depth of 1.1 m. The upper boundary was defined as a pressure outlet, while the rest of the boundaries were walls, as shown in Figure 2. The pressure at the upper boundary was set to 101,325 P a , and both water and air were stationary in the initial conditions of the simulation. This means that at the initial moment of the simulation, the vehicle is located above the water surface and is stationary. The control variable method is used to investigate the effect of a single variable on the slamming loads applied to the aircraft by varying the entry angle α, the entry angle of attack β, the velocity V, and the head shape, which helps to systematically analyze the effect of each variable on the aircraft subjected to the slamming load.

2.6. Grid Division

The aircraft moving from the air into the water involves dynamic mesh and fluid–structure coupling; the calculation process is easy to disperse, so there are high requirements for the accuracy of the calculation, and the complexity of the model and the speed of the calculation are taken into account, so with the use of Workbench Meshing tetrahedral non-structural mesh division, mesh encryption around the vehicle, and adding five layers of the boundary layer mesh, the computation process to turn on the mesh is adaptive [26]. The skewness of the initial mesh is less than 0.65, as shown in Figure 3.

2.7. Grid-Independent Verification

In numerical simulation, the number and quality of grids (e.g., orthogonality, skewness, etc.) will affect the calculation accuracy, and the number of grids being too small may make the calculation results deviate seriously from the actual situation, while the number of grids being too large will lead to slow progress of the calculation, being extremely demanding on the performance of the computer. Therefore, the mesh division should be the appropriate number of meshes under the premise of ensuring the quality of the mesh so that the calculation results can be faster while still meeting the accuracy requirements. In this paper, three different numbers of grids are divided—1.2 million, 2.5 million, and 3.8 million, respectively—with the rest of the conditions remaining the same to calculate the pressure on the nose part of the aircraft in the process of entering the water, and the resulting data are compared, as shown in Figure 4.
It can be seen that, for the three different cases, the maximum pressure changes on the nose part of the aircraft during water entry are the same, and the numerical differences are not significant, so it can be assumed that the influence of the number of grids on the results can be neglected in this numerical simulation. Therefore, to improve the computational efficiency, 1.2 million grids are used in this paper for subsequent numerical simulations under different conditions.

2.8. Validation of the Validity of Numerical Simulations

To verify the effectiveness of the numerical simulation method in this paper, the modeling method was used to numerically simulate a ball falling into water [27] as in the literature, and compared with the experimental results and simulation results of a ball falling into water from a height of 0.5 m in the literature; the constructed model is shown in Figure 5, the comparison with the qualitative analysis of the position of the ball in the experimental process is shown in Figure 6, and the comparison with the quantitative analysis of the simulation results is shown in Figure 7.
Figure 6a,b shows the experimental results from the previous work when the ball just touches the water surface and when it is completely submerged in the water, with a time interval of 0.131 s. Figure 6c,d shows the numerical simulation results when the ball just touches the water surface and when it is completely submerged in the water, with a time interval of 0.134 s. The error is 2.29%, which shows that the numerical simulation results are very close to the experimental results from the previous work.
As can be seen in Figure 7, the two curves are in good agreement, the overall trend is consistent, and the values are very close. The maximum pressure peak value obtained by the numerical simulation method in this paper occurs at t = 0.0219 s, with a value of 17.054 k P a , and the maximum pressure peak value in the literature occurs at t = 0.0212 s, with a value of 16.603 k P a . The time error is 3.3%, and the pressure value error is 2.71%. The errors are within the acceptable range; therefore, based on the above comparison results, it can be concluded that the numerical simulation method used in this paper is accurate and reliable.

3. Results

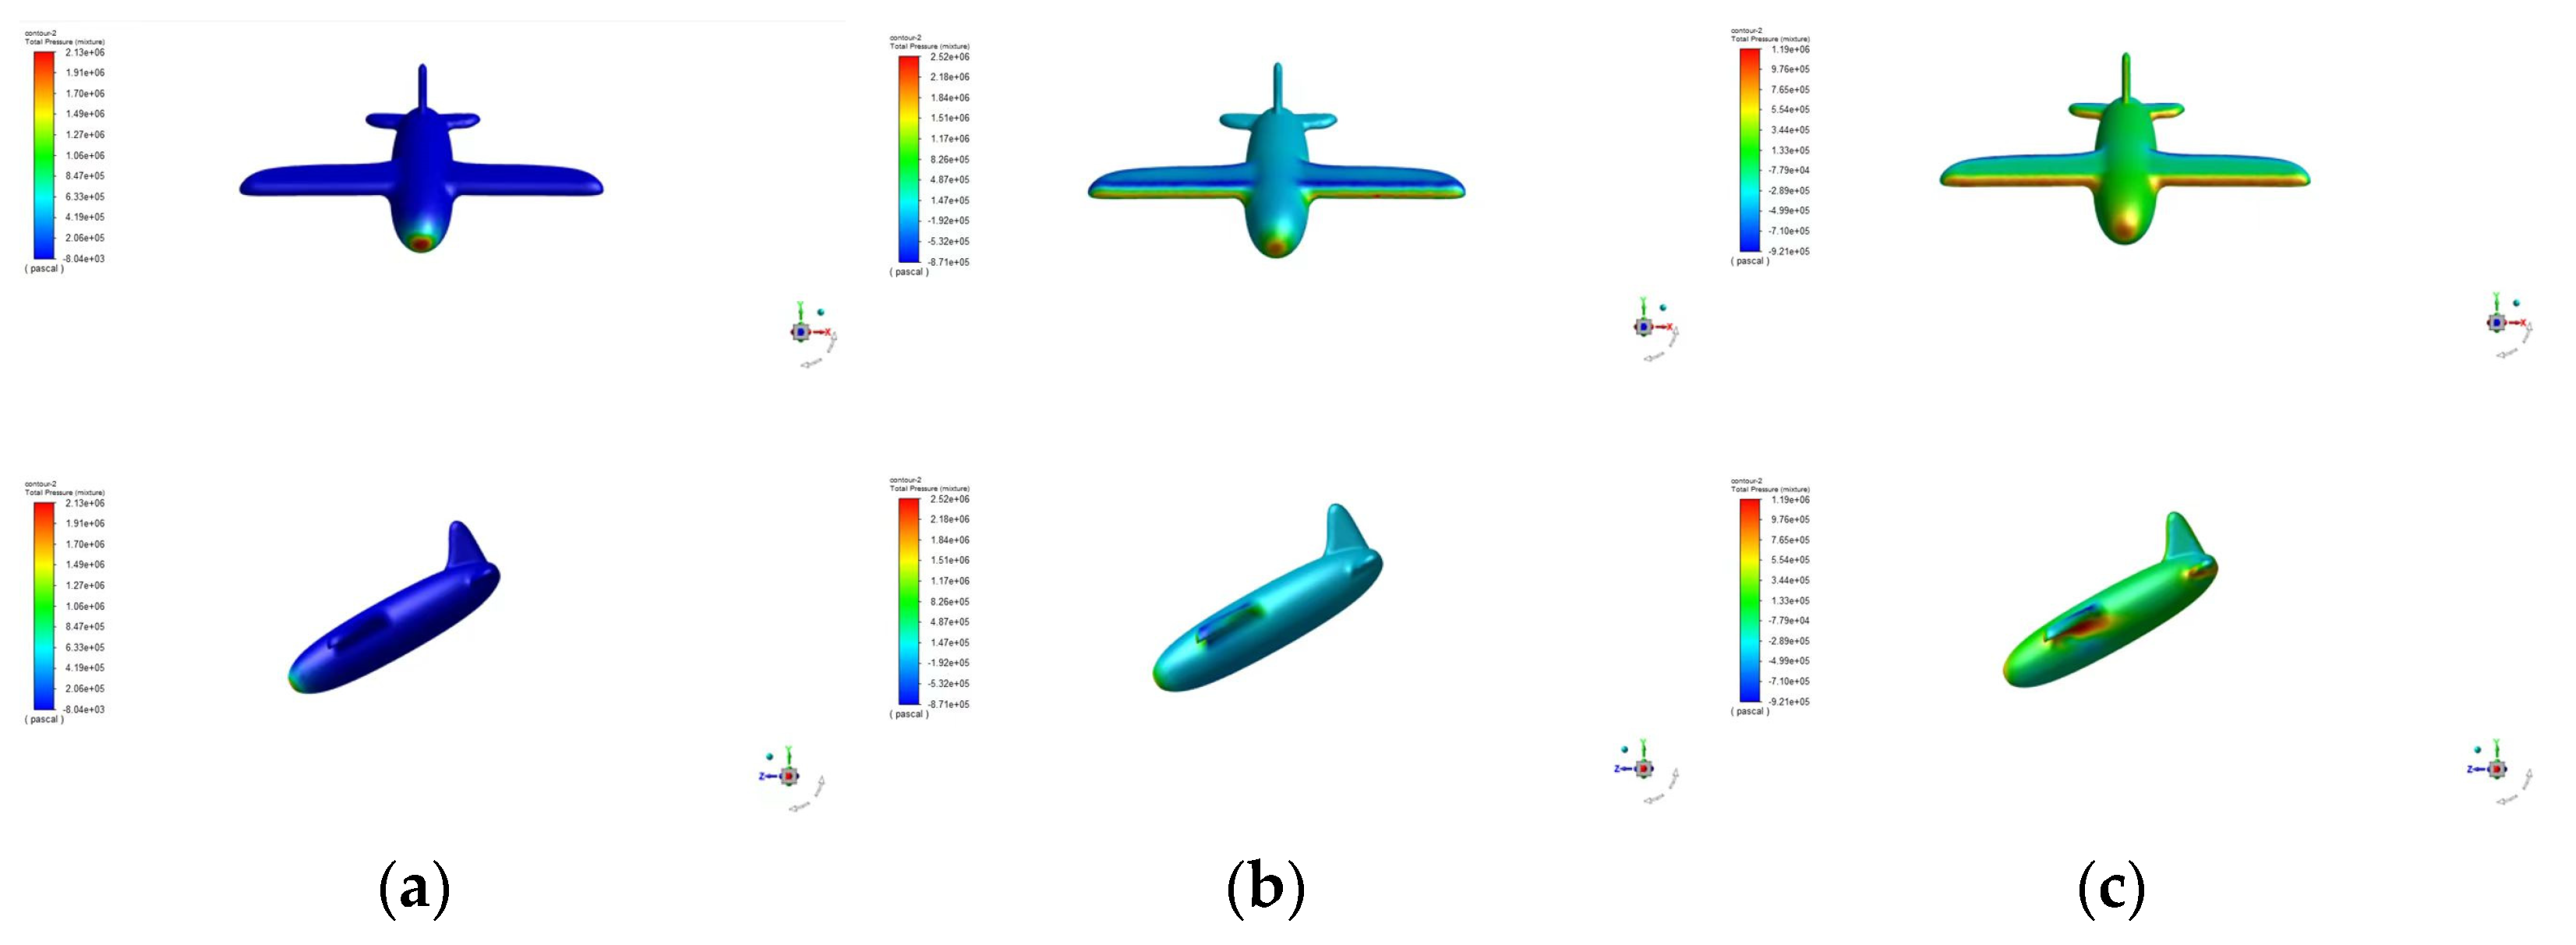
3.1. Pressure Characteristics

Figure 8 shows the pressure clouds on the surface of the aircraft at different moments (V = 45 m/s, α = 30°, β = 0°). It can be seen that in the process of the vehicle entering the water, the pressure peak occurs in the nose area first, then in the leading edge of the wing, and finally in the leading edge of the horizontal tail. With the increase in water entry depth, the pressure on the fuselage of the aircraft increases gradually, but it is always smaller than the pressure on the nose, wings, and tail, and the overall pressure distribution is symmetric about the aircraft axis [28].
Three relatively high-pressure zones appeared on the surface of the aircraft during the water entry process, which were the nose part, the leading edge of the wing, and the leading edge of the horizontal tail. Considering that the aircraft water entry is a speed-decreasing process, the tail part is the last point of contact with the water and the area is small, so the tail part cannot be considered; according to the symmetry of the pressure distribution, four monitoring points are taken on the surface of the nose part, and two monitoring points are taken on the surface of the leading edge of the wing, as shown in Figure 9, to further study the characteristics of the aircraft subject to the slamming loads.
Figure 10 shows the time-dependent pressure change images of each monitoring point of the aircraft. It can be observed that monitoring points 1, 2, 3, and 4 in the nose area first show peak values during the aircraft’s entry into the water, and monitoring points 5 and 6 at the leading edge of the wing then show peak values. The pressure peak of monitoring point 1 in the center of the nose is much larger than the other monitoring points, and the pressure peak of monitoring point 3 at the right end of the nose area is the smallest. The pressure peaks at monitoring points 5 and 6 on the leading edge of the wing are relatively close to each other. As the depth of water entry increases, the pressure at monitoring point 2 tends toward 0. The reason is that the surface of the aircraft at monitoring point 2 gradually tends to be parallel to the water surface. During the whole process of water entry, the peak pressure at monitoring point 1 in the nose part of the aircraft lasts the longest and the pressure is the largest, and the pressure gradually decreases in all directions. On the leading edge of the wing, the peak pressure at monitoring point 5 appears first, followed by the peak pressure at monitoring point 6, and the value is slightly larger, the reason being that monitoring point 5 at the root of the leading edge of the wing touches the water surface earlier than monitoring point 6 at the end, and the speed continues to decay. Based on the above results, monitoring point 1 with the highest pressure can be taken for further study.

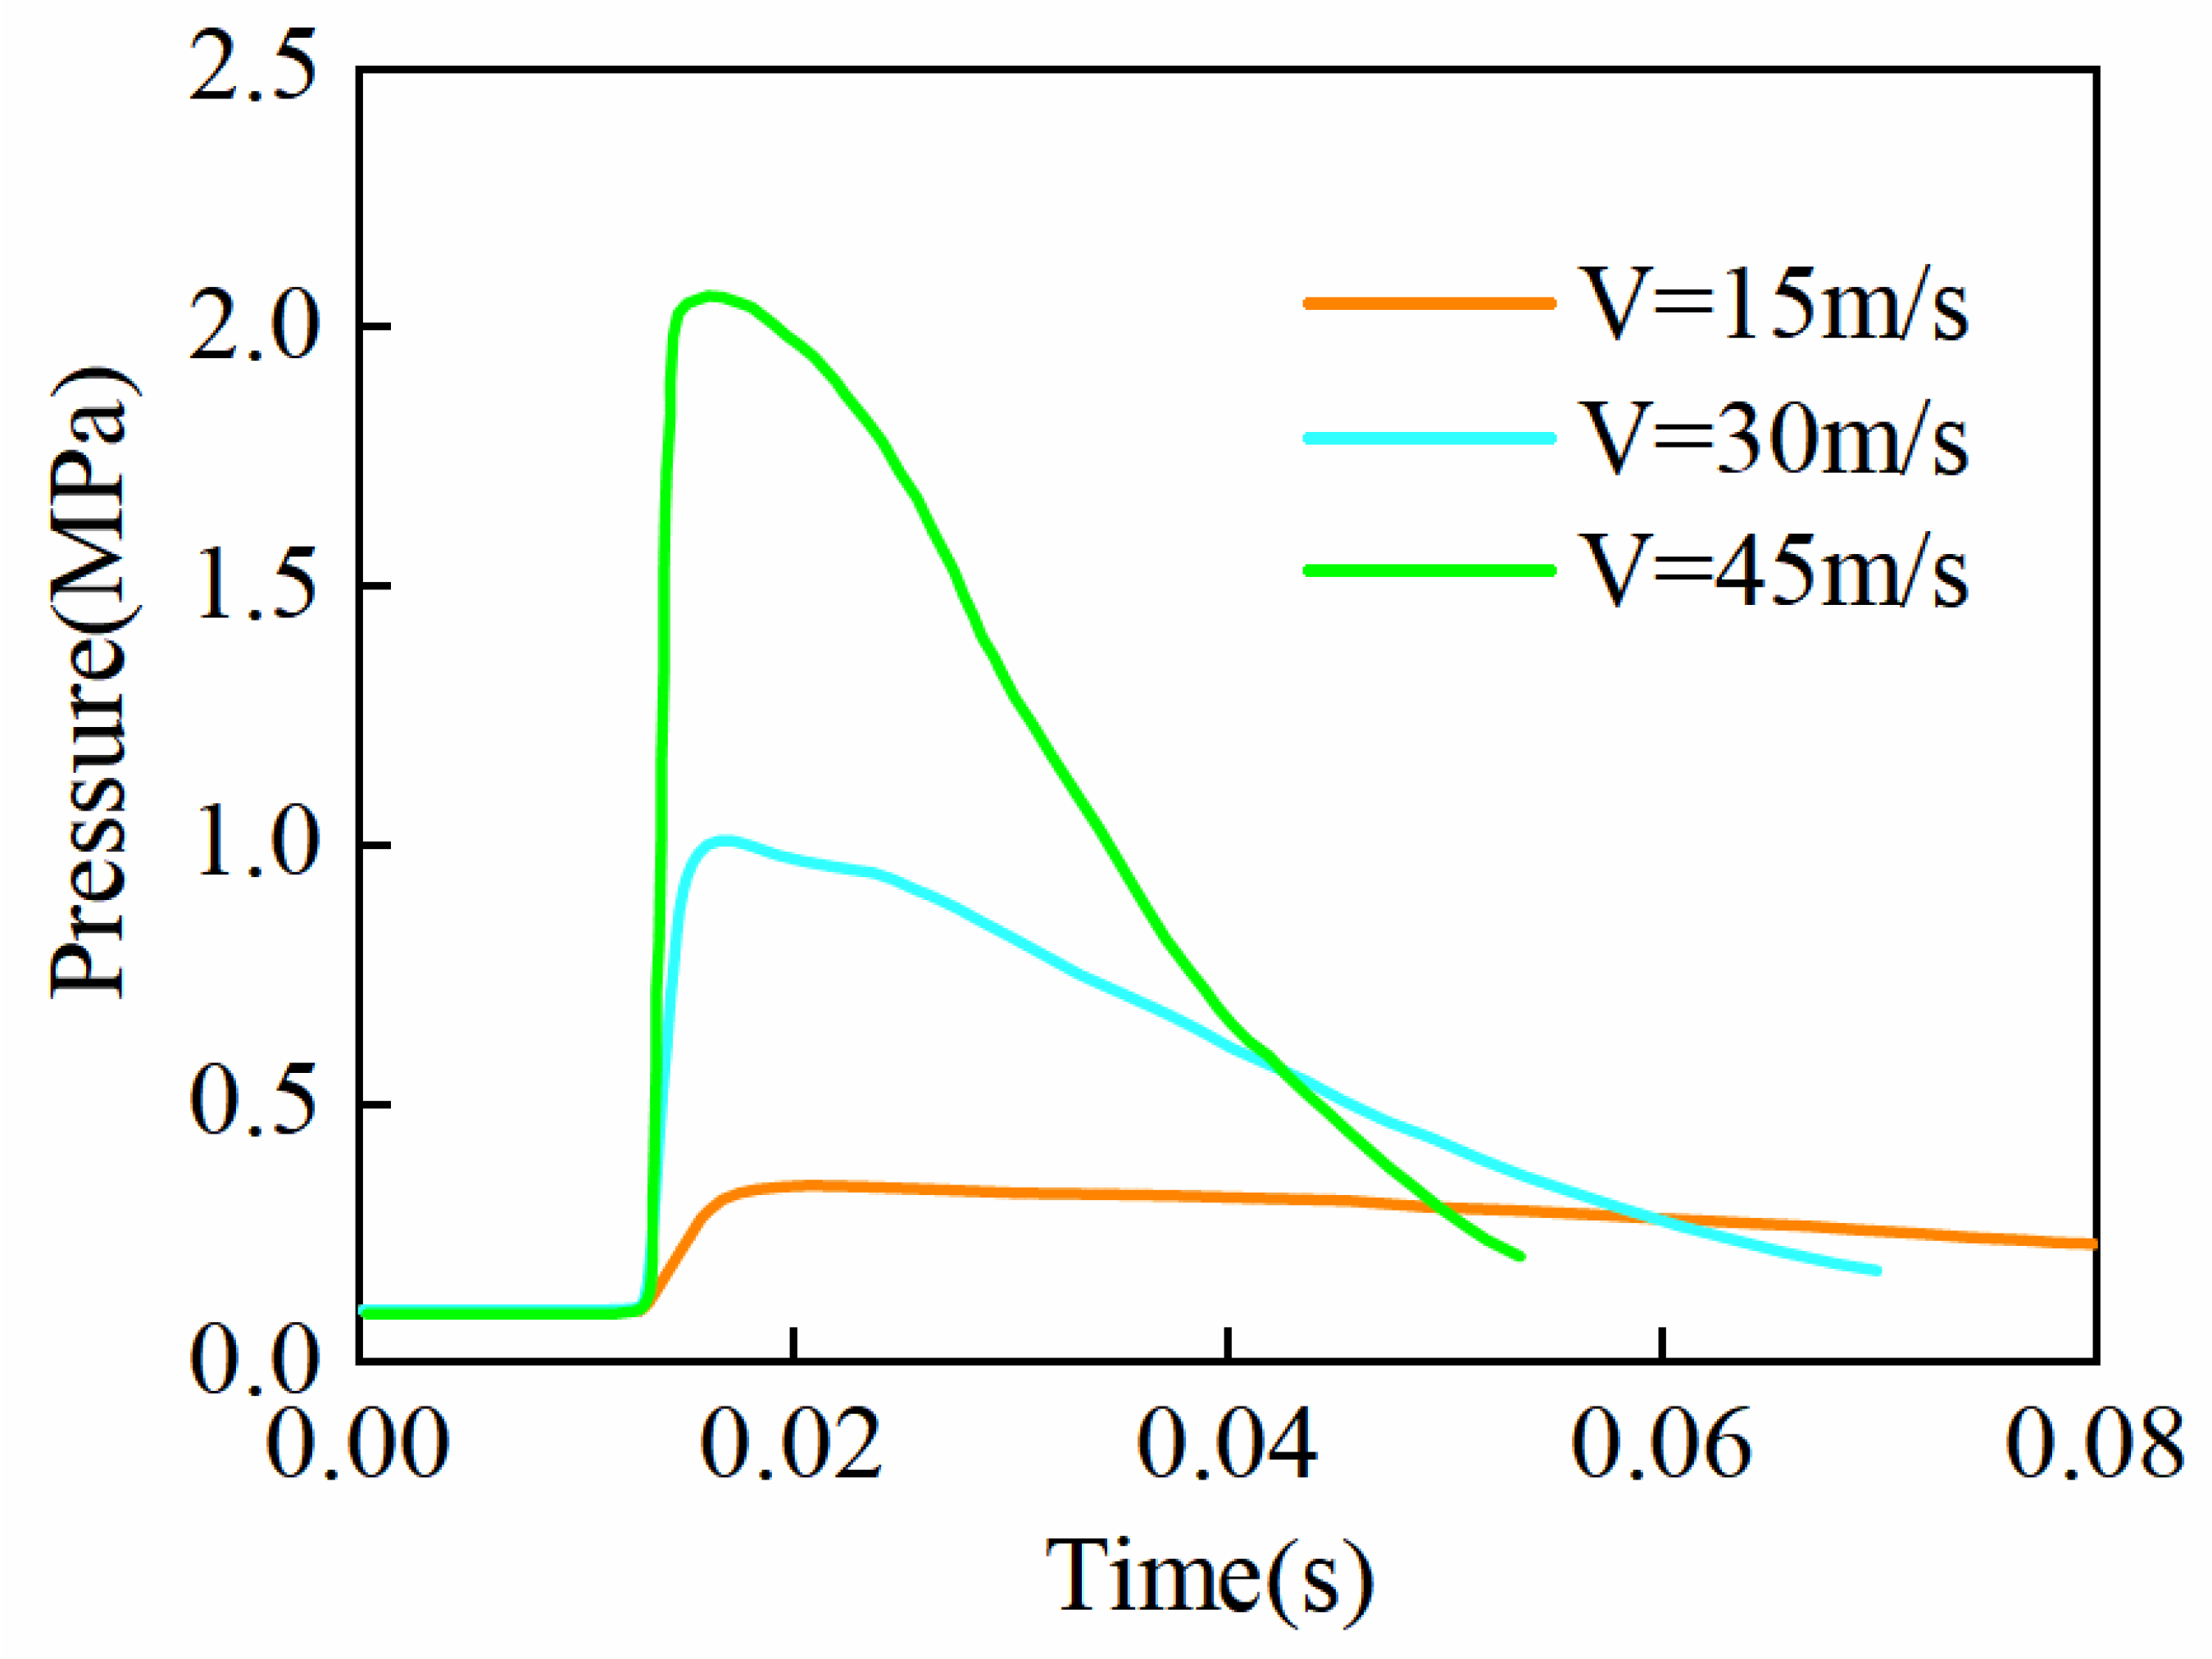
3.2. Effect of Water Entry Velocity on the Aircraft Subjected to Slamming Loads

The water entry velocity has a crucial effect on the slamming load suffered by the aircraft; to further investigate the effect of water entry velocity on the slamming loads suffered by the vehicle during the water entry process [29,30], the control variable method is adopted, the water entry angle is set to 30°, the water entry angle of attack is set to 0°, and the water entry velocities are set to 15 m/s, 30 m/s, and 45 m/s to compute the pressure–time curve of monitoring point 1 on the nose part of the aircraft (which has been tuned to the same starting point at the moment of the water entry), as well as the velocity change curves, which are shown in Figure 11 and Figure 12, respectively.
According to Figure 11, it can be seen that after the aircraft impacted the free liquid surface at low speed, the pressure peak appeared on the surface of the aircraft in a very short time, which could be several times to dozens of times the atmospheric pressure. The pressure peak at monitoring point 1 appeared first under the speed of 45 m/s, followed by the pressure peak under the speed of 30 m/s, and the last pressure peak appeared under the case of 15 m/s. The larger the water entry velocity, the larger the peak pressure, and the shorter the duration of the peak pressure. With the increase in water entry depth, the pressure values of the three curves are reduced to several times atmospheric pressure, and the difference between the three gradually decreases. It can be seen that in the early stage of the aircraft descending into the water, its surface is subjected to a strong impact load, so it is critical to optimize the design of the structure of the aircraft into the water.
According to Figure 12, it can be seen that the larger the velocity, the shorter the interval of time from contacting the water surface to complete submergence of the aircraft, and the more the velocity decays, the more the kinetic energy decays, which is due to the increase in the kinetic energy transferred to the water by the aircraft. The slope of the velocity curve is the acceleration; comparing the slopes of the three curves, it can be observed that the greater the entry velocity into the water, the greater the absolute value of the acceleration of the aircraft into the water and the greater the impact load. The slopes of the three curves gradually decrease with time and tend to stabilize; the reason is that the speed of the aircraft gradually decreases, and the drag also decreases and tends to stabilize.

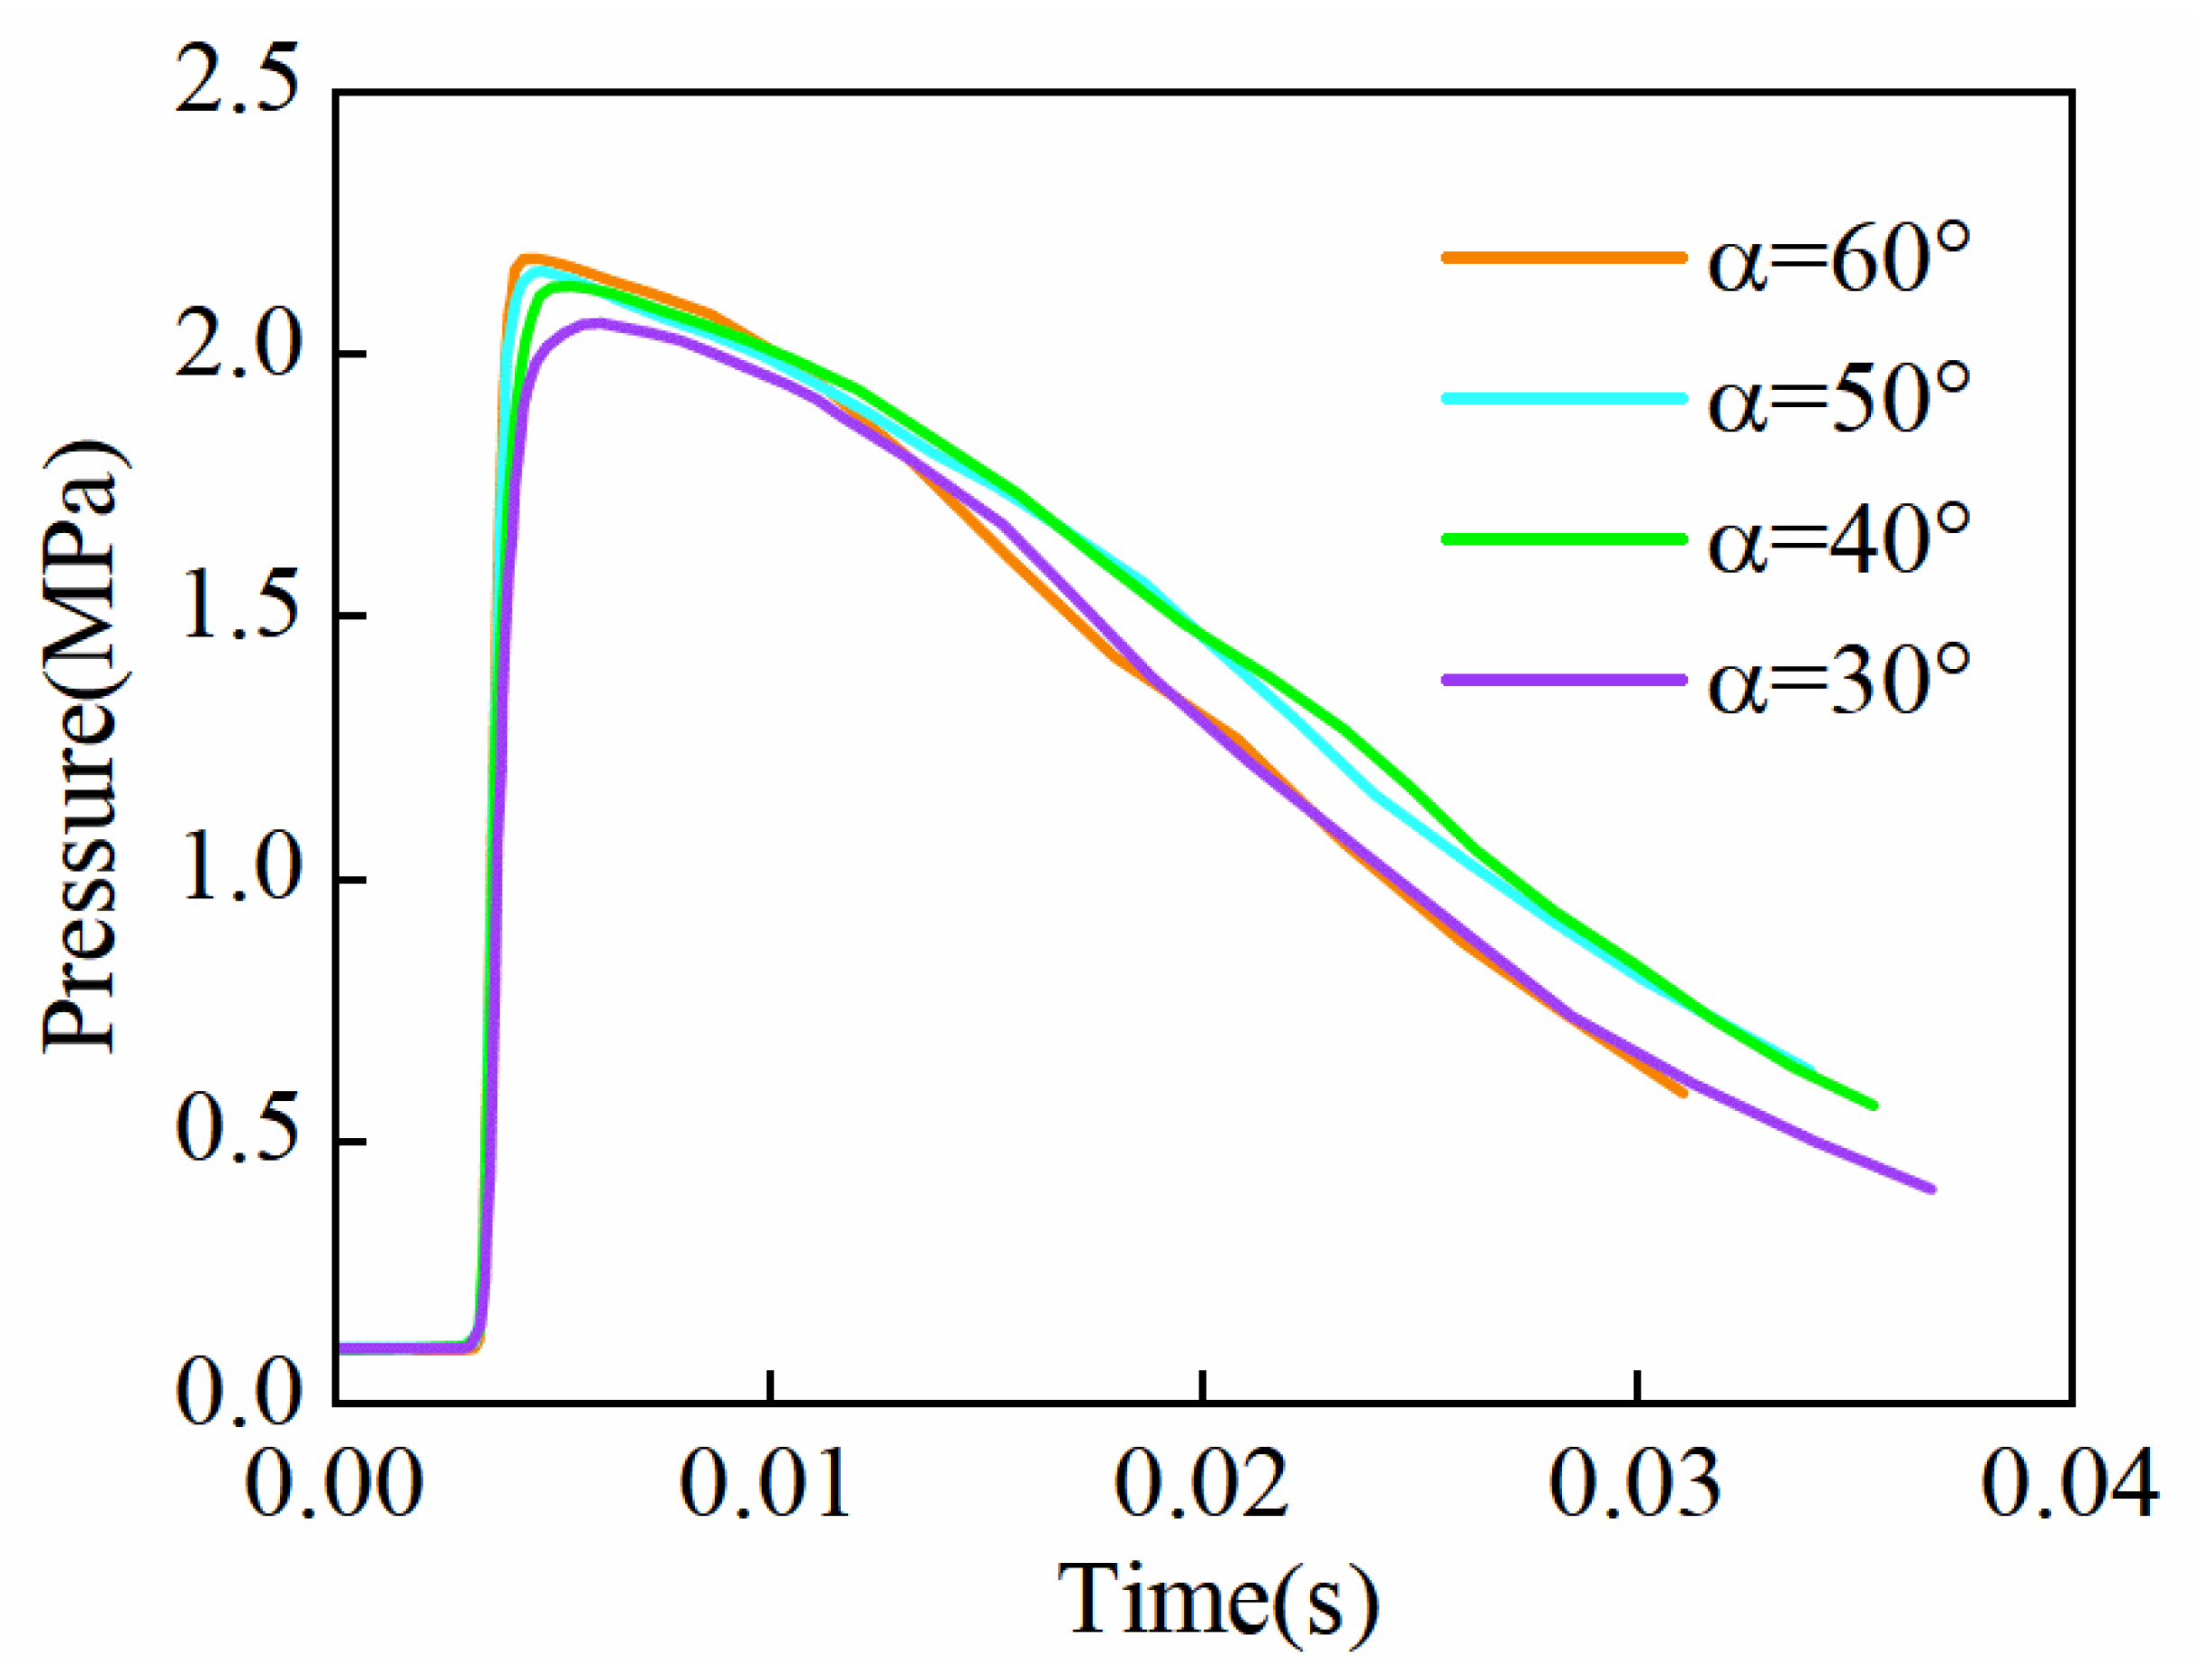
3.3. Influence of the Angle of Water Entry on the Aircraft Subjected to Slamming Loads

In general, the trans-media vehicle water entry process occurs at a certain tilt angle, and the water entry angle may cause a certain degree of impact on the aircraft water entry process such as in the force situation [31,32], so the water entry angle is a non-negligible impact factor in the process of the aircraft water entry. In this paper, the angle between the longitudinal axis of the aircraft and the horizontal direction is defined as the water entry angle. Setting the water entry speed at 45 m/s, and keeping the water entry angle of attack unchanged at 0°, the pressure–time curve on the surface of monitoring point 1 is calculated by setting the water entry angle as 30°, 40°, 50°, and 60° (to facilitate the comparison, the moment of water entry has been adjusted to the same starting point), as is the curve of the velocity change, as shown in Figure 13 and Figure 14, respectively.
According to Figure 13, it can be seen that at the same moment of water entry, the pressure peak occurs firstly in the case of 60°, and then according to the angle of water entry in descending order; the larger the angle of water entry, the larger the pressure peak is. The difference between the four curves is not big, so it can be seen that the change in the water entry angle does not have a serious effect on the surface of the aircraft by the slamming load.
According to Figure 14, it can be seen that the slopes of the four curves increase with the increase in the water entry angle, i.e., the absolute value of the deceleration motion is larger, which can correspond to the larger drag force on the surface of the aircraft in Figure 13. Considering the reason to be that the larger the angle of water entry, the larger the collision area between the nose and the water at the moment of water entry, it leads to a larger resistance, so the design of structural strength should focus on the consideration of the case of a large angle of water entry.
The formula for calculating the drag of an aircraft traveling in a fluid is as follows:
F = 1 2 C d ρ V 2 S
where F is the drag force on the aircraft in the water; C d is the monitored drag coefficient; ρ is the density of the water; V is the velocity of the aircraft relative to the water; and S is the area of the wing. According to Figure 14, it can be seen that the velocity of the aircraft changes smoothly in the process of entering the water, while the drag coefficient change curve in Figure 15 is more violent, and the larger the angle of entering the water, the more violent the change in the drag coefficient. Therefore, the angle of water entry has a serious impact on the drag effect on the aircraft, which in turn affects the stability of the aircraft. Therefore, the situation where the aircraft enters the water at a large angle should be given special attention.

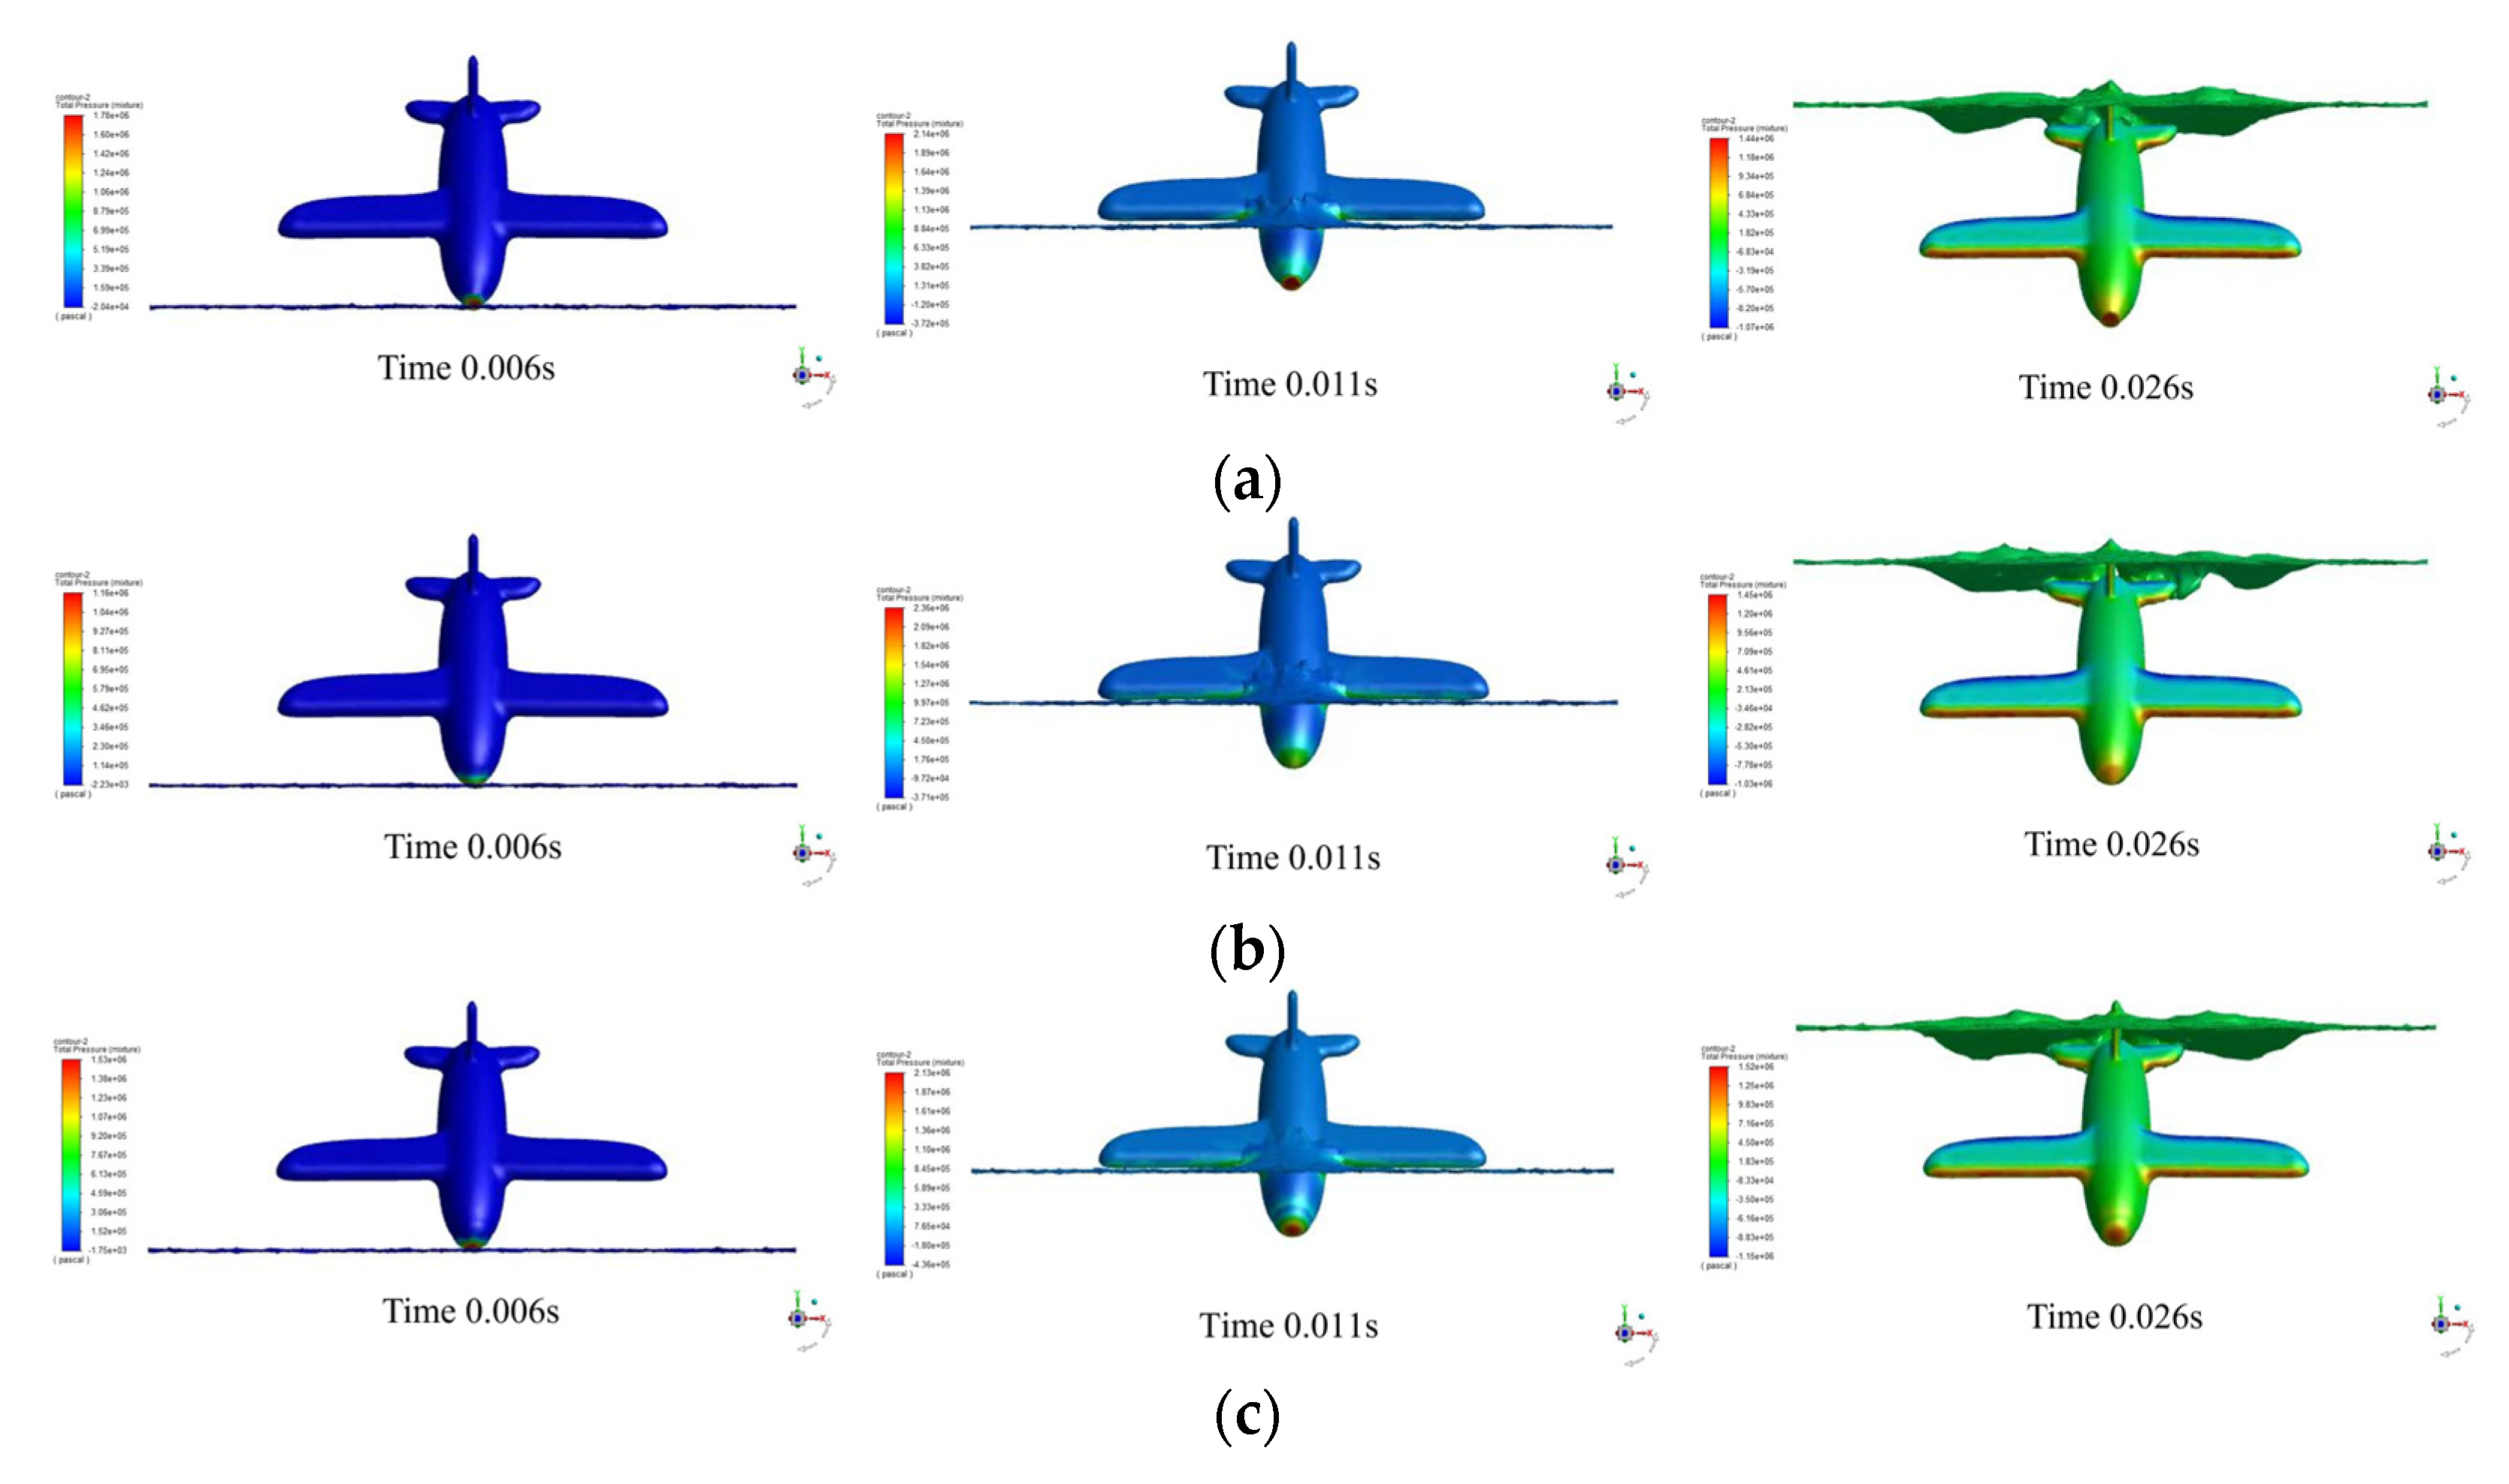
3.4. Effect of Angle of Attack into Water on the Aircraft Subjected to Slamming Loads

The velocity of the aircraft is set at 45 m/s, the angle of water entry is set at 60°, the angles of attack are set at 0° and 45°, and the attitude diagrams of the aircraft in the process of transmedia are intercepted. Starting from contacting the water surface, the intercepts were taken every 0.005 s to compare and study the differences in the motion of the aircraft under different angles of attack [33,34], as shown in Figure 16.
According to Figure 16, it can be seen that when the angle of attack is 0°, the first part of the nose of the aircraft touches the water surface in the process of entering the water, and the fuselage has a small tendency to press down on the water surface. When the angle of attack is 45°, the aircraft has an obvious tendency to press down on the water surface, and the water splash is bigger, so the root of the wing of the aircraft generates a strong slamming load. The head of the aircraft and the root of the wing, respectively, contact the water surface at the moment of the pressure cloud, as shown in Figure 17. It can be seen that the head of the aircraft and the root under the wing are the two most concentrated parts of the load. Therefore, monitoring point 7 is taken as the head of the aircraft (when the angle of attack is changed, monitoring point 7 changes with the part touching the water, so it is not labeled), and monitoring point 8 is the root under the wing of the vehicle (as shown in Figure 16b). Under the condition of setting the inlet velocity to 45 m/s and the inlet angle to 60°, the pressure–time curves at monitoring points 7 and 8 were calculated by setting the inlet angle of attack to 0°, 15°, 30°, and 45° (the inlet moments were adjusted to the same starting point for the sake of easy comparison), which are shown in Figure 18 and Figure 19, respectively.
According to Figure 18, it can be seen that the change in the angle of attack into the water has little effect on the peak pressure at the location where the head of the aircraft touches the water. According to Figure 19, it can be seen that the larger the angle of attack into the water, the larger the peak pressure suffered by monitoring point 8 (the root under the wing of the vehicle). When the angle of attack is small, the value of monitoring point 8 will be increased in the late stage of the aircraft water entry, but the value is still small, so when the angle of attack for water entry is large, the structural strength of the root part of the wing of the aircraft should be emphasized.

3.5. Effect of Head Shape on the Aircraft Subjected to Slamming Loads

Considering that the head shape of the aircraft has a crucial influence on the aircraft water entry process [35], this paper studies three different head shapes based on the designed aircraft, as shown in Figure 20, and sets the initial velocity of the water entry as 45 m/s, the water entry angle to 60°, and the angle of attack to 0° to investigate the influence of the head shape on the aircraft subjected to the slamming loads.
Figure 21 shows the pressure clouds obtained from the three types of aircraft heads entering the water at the three special moments of when the head just touches the water, the leading edge of the wing touches the water, and the fuselage enters the water completely. It can be seen that the maximum slamming loads at the moment of the aircraft entering the water appear in the head, the leading edge of the wing, and the leading edge of the tail. Taking the head of the aircraft as the monitoring point, the pressure curve and the drag coefficient curve are obtained, which are shown in Figure 22 and Figure 23, respectively.
Based on Figure 22 and Figure 23, it can be seen that the flat head model has the largest drag coefficient, the conical has the smallest drag coefficient, and the hemispherical has a drag coefficient that is in the middle of those two. The slamming load suffered by the head of the conical head model is smaller than the other two head models; the reason for this is that the angle of direct impact between the conical head and the water surface is the smallest, which can drain the water well to the surface of the aircraft without obvious load concentration phenomena. The peak load of the hemispherical model is slightly larger than that of the flat head model, but the average pressure load suffered by the flat head model is larger than that of the other head types, which is considered to be because the angle between the flat head model and the surface of the water is the largest in terms of direct impact.

4. Discussion

In this paper, Fluent is used to carry out the numerical simulation of the aircraft water entry process, for the mesh division and the design of the scheme will have a certain impact on the slamming load suffered by the aircraft water entry process.
In terms of meshing, an unstructured tetrahedral mesh is used, which has no regular topology and no layer concept, and the distribution of the mesh nodes is arbitrary, which is more flexible compared to the structured mesh, and can better deal with the fluid–structure coupling as well as the dynamic mesh problem. However, the unstructured mesh requires higher mesh quality, so the mesh reconstruction may produce a low-quality mesh, which in turn affects the accuracy of the results.
When adjusting the vehicle water entry attitude, the water entry angle in the Y-Z plane as well as the angle of attack are considered, but there are uncertainties in the X direction, which may lead to the deviation of the simulation results from the actual situation. In addition, the model may have some limitations in dealing with aircraft water entry under extreme conditions, such as large air turbulence and strong fluctuations in the water surface.
Four parameters are considered, namely, water entry velocity, water entry angle, water entry angle of attack, and head shape, among which the change in water entry velocity has the most obvious effect on the slamming load on the fuselage as a whole; the change in water entry angle and water entry angle of attack had little effect on the maximum slamming load on the fuselage, but will have an effect on the load distribution; and the head shape only has an obvious effect on the load on the head of the vehicle, but has little effect on the load distribution on the fuselage.
To more fully investigate the complex process of aircraft transmedia water entry, future research could focus on improving the accuracy and applicability of the model under extreme conditions, as well as its general applicability to fixed-wing aircraft with varying aspect ratios and a variety of bionic vehicles, and will require field tests of low-speed water entry of the aircraft under different parameters to validate its performance in real-world scenarios.

5. Conclusions

In this paper, a fixed-wing aircraft shape is designed and, using the VOF multiphase flow model and standard k ε turbulence model, combined with six DOF dynamic mesh technology, numerical simulation of the process of the aircraft entering the water is performed and the validity of the simulation experimentally verified by changing the entry speed, entry angle, angle of attack, and the head shape to obtain the characteristics of the aircraft’s pressure distribution and the change rule of the slamming load. The results show the following:
  • At the beginning of water entry, the aircraft is momentarily subjected to a large slamming load, followed by a gradual decrease in the load. The maximum pressure load occurs at the head of the aircraft. The next largest load occurs at the root of the leading edge of the wing.
  • Velocity change has a great effect on the aircraft subjected to the slamming load at the moment of water entry; the greater the velocity, the greater the pressure load on the aircraft at the moment of water entry, the greater the absolute value of acceleration of the decelerating motion, and the more the velocity decays.
  • When the aircraft enters the water at different angles, the larger the angle is, the earlier the pressure peak appears at the moment of entering the water, and the value is larger, but there is little difference in the effect on the velocity decay. The drag coefficient changes drastically when entering the water at a large angle, which will affect the stability of the aircraft operation.
  • As the angle of attack of the vehicle increases, the magnitude of the pressure load suffered by the root under the wing increases significantly, and the pressure load at the position of the head touching the water does not change much.
  • The drag coefficient of the aircraft in the process of entering the water shows a general trend of increasing, with multiple extreme values and strong nonlinearity. The drag coefficient of the flat-head model is the largest, that of the conical is the smallest, and that of the hemispherical is in the middle of those two. The conical head model suffered the smallest pressure load, the flat head model suffered the largest average pressure load, and the hemispherical model was in the middle of those two.

Author Contributions

Conceptualization, L.L. and L.T.; methodology, L.L., L.T. and X.Z.; software, X.L. and L.L.; validation, X.L. and L.L.; formal analysis, X.L. and L.L.; investigation, L.L., L.T. and X.Z.; resources, L.L., L.T. and X.Z.; data curation, X.L. and L.L.; writing—original draft preparation, X.L. and L.L.; writing—review and editing, L.L. and L.T.; visualization, L.L. and L.T.; supervision, L.L. and L.T.; project administration, L.L.; funding acquisition, L.L. and L.T. All authors have read and agreed to the published version of the manuscript.

Funding

This research was funded by Fundamental Research Funds for the Central Universities, grant number 2022FRFK060007, and Science Fund for Excellent Young Scholars of Heilongjiang Province, grant number YQ2020F007, and National Natural Science Foundation of China, grant number 6191101340.

Institutional Review Board Statement

Not applicable.

Informed Consent Statement

Not applicable.

Data Availability Statement

The data presented in this study are available on request from the corresponding author.

Conflicts of Interest

The authors declare no conflicts of interest for publishing in this journal.

References

  1. Sun, Y.; Liu, X.; Cao, K.; Shen, H.; Li, Q.; Chen, G.; Xu, J.; Ji, A. Design and Theoretical Research on Aerial-Aquatic Vehicles: A Review. J. Bionic Eng. 2023, 20, 2512–2541. [Google Scholar] [CrossRef]
  2. Gilbarg, D.; Anderson, R.A. Influence of Atmospheric Pressure on the Phenomena Accompanying the Entry of Spheres into Water. J. Appl. Phys. 1948, 19, 127–139. [Google Scholar] [CrossRef]
  3. Shams, A.; Jalalisendi, M.; Porfiri, M. Experiments on the water entry of asymmetric wedges using particle image velocimetry. Phys. Fluids 2015, 27, 027103. [Google Scholar] [CrossRef]
  4. Wang, Q.; Zhao, C.; Lu, H.; Liu, H. Experimental observation on water entry of a sphere in regular wave. Theor. Appl. Mech. Lett. 2023, 13, 100473. [Google Scholar] [CrossRef]
  5. Liu, Z.; Shi, Y.; Wu, K.; Zhao, H.; Pan, G. Experimental study on load characteristics of vehicle during high-speed water entry. Ocean Eng. 2023, 288, 116052. [Google Scholar] [CrossRef]
  6. Crandell, K.E.; Howe, R.O.; Falkingham, P.L. Repeated evolution of drag reduction at the air-water interface in diving kingfishers. J. R. Soc. Interface 2019, 16, 20190125. [Google Scholar] [CrossRef] [PubMed]
  7. Qi, D.; Feng, J.; Xu, B.; Zhang, J.; Li, Y. Investigation of water entry impact forces on airborne-launched AUVs. Eng. Appl. Comput. Fluid Mech. 2016, 10, 473–484. [Google Scholar] [CrossRef]
  8. Chen, C.; Yuan, X.; Dang, J.; Xu, Q. Experimental Investigation into Impact Load during Oblique Water-entry of a Supercavitating Vehicle at 20°. Acta Armamentarii 2018, 39, 1159–1164. [Google Scholar] [CrossRef]
  9. Chen, C.; Ma, Q.; Wei, Y.; Wang, C. Experimental study on the cavity dynamics in high-speed oblique water-entry. Fluid Dyn. Res. 2018, 50, 045511. [Google Scholar] [CrossRef]
  10. Korobkin, A. Analytical models of water impact. Eur. J. Appl. Math. 2004, 15, 821–838. [Google Scholar] [CrossRef]
  11. Shiffman, M.; Spencer, D.C. The force of impact on a cone striking a water surface (vertical entry). Commun. Pure Appl. Math. 1951, 4, 379–417. [Google Scholar] [CrossRef]
  12. TRUSCOTT, T.T.; TECHET, H.A. Water entry of spinning spheres. J. Fluid Mech. 2009, 625, 135–165. [Google Scholar] [CrossRef]
  13. Truscott, T.T.; Epps, P.B.; Belden, J. Water Entry of Projectiles. Annu. Rev. Fluid Mech. 2014, 46, 355–378. [Google Scholar] [CrossRef]
  14. Oger, G.; Doring, M.; Alessandrini, B.; Ferrant, P. Two-dimensional SPH simulations of wedge water entries. J. Comput. Phys. 2005, 213, 803–822. [Google Scholar] [CrossRef]
  15. Wang, J.; Lugni, C.; Faltinsen, M.O. Experimental and numerical investigation of a freefall wedge vertically entering the water surface. Appl. Ocean Res. 2015, 51, 181–203. [Google Scholar] [CrossRef]
  16. Hou, Z.; Sun, T.; Quan, X.; Zhang, G.; Sun, Z.; Zong, Z. Large eddy simulation and experimental investigation on the cavity dynamics and vortex evolution for oblique water entry of a cylinder. Appl. Ocean Res. 2018, 81, 76–92. [Google Scholar] [CrossRef]
  17. Shi, Y.; Pan, G.; Yan, G.; Yim, S.C. Numerical study on the cavity characteristics and impact loads of AUV water entry. Appl. Ocean Res. 2019, 89, 44–58. [Google Scholar] [CrossRef]
  18. Shi, Y.; Xiao, P.; Zhao, H.; Pan, G. Experimental Research on the Influences of Head Shape and Surface Properties on the Water Entry Cavity. J. Mar. Sci. Eng. 2022, 10, 1411. [Google Scholar] [CrossRef]
  19. Wang, X.; Shi, Y.; Pan, G.; Chen, X.; Zhao, H. Numerical research on the high-speed water entry trajectories of AUVs with asymmetric nose shapes. Ocean Eng. 2021, 234, 109274. [Google Scholar] [CrossRef]
  20. Wang, L.; Yang, Y.; Yang, Q. Research on the Water Entry of the Fuselage Cylindrical Structure Based on the Improved SPH Model. Appl. Sci. 2023, 13, 10801. [Google Scholar] [CrossRef]
  21. Xie, H.; Ren, H.; Li, H.; Tao, K. Numerical prediction of slamming on bow-flared section considering geometrical and kinematic asymmetry. Ocean Eng. 2018, 158, 311–330. [Google Scholar] [CrossRef]
  22. Wei, J.; Sha, Y.; Hu, X.; Yao, J.; Chen, Y. Aerodynamic Numerical Simulation Analysis of Water–Air Two-Phase Flow in Trans-Medium Aircraft. Drones 2022, 6, 236. [Google Scholar] [CrossRef]
  23. Wen, X.; Ong, M.C.; Yin, G. On the three-dimensional effects of the water entry of wedges. Appl. Ocean Res. 2023, 138, 103649. [Google Scholar] [CrossRef]
  24. Wang, Q.; Yu, P.; Zhang, B.; Li, G. Experimental Study and Numerical Simulation of the Water Entry of a Ship-Like Symmetry Section with an Obvious Bulbous Bow. Pol. Marit. Res. 2021, 28, 16–34. [Google Scholar] [CrossRef]
  25. Zhuang, Q.; Zhang, H.; Zhao, C.; He, X.; Liu, Y.; Liu, Z.; Li, S.; Zhu, R.; Wu, D. Effects of the launch parameters on trans-phase stability performance and mechanism for submarine-launched missiles model. Ocean Eng. 2023, 283, 115083. [Google Scholar] [CrossRef]
  26. Pain, C.C.; Umpleby, A.P.; de Oliveira, C.R.E.; Goddard, A.J.H. Tetrahedral mesh optimization and adaptivity for steady-state and transient finite element calculations. Comput. Methods Appl. Mech. Eng. 2001, 190, 3771–3796. [Google Scholar] [CrossRef]
  27. Liu, Y. Experimental and Cfd Simulation Study on the Water Entry of 3d Axisymmetric Structures. Ph.D. Thesis, Harbin Engineering University, Harbin, China, 2017. [Google Scholar] [CrossRef]
  28. Liu, X.; Liu, F.; Ren, H.; Chen, X.; Xie, H. Experimental investigation on the slamming loads of a truncated 3D stern model entering into water. Ocean Eng. 2022, 252, 110873. [Google Scholar] [CrossRef]
  29. Yan, G.; Pan, G.; Shi, Y.; Chao, L.; Zhang, D. Experimental and numerical investigation of water impact on air-launched AUVs. Ocean Eng. 2018, 167, 156–168. [Google Scholar] [CrossRef]
  30. Zhao, H.; Shi, Y.; Pan, G.; Huang, Q. Study on Impact Load and Head Cap Load Reduction Performance of Vehicle Entering Water at High Speed. J. Mar. Sci. Eng. 2022, 10, 1905. [Google Scholar] [CrossRef]
  31. Liu, X.; Luo, K.; Yuan, X.; Qi, X. Numerical study on the impact load characteristics of a trans-media vehicle during high-speed water entry and flat turning. Ocean Eng. 2023, 273, 113986. [Google Scholar] [CrossRef]
  32. Fu, Z.; Sun, L.; Zhi, M.; Wang, P.; Wang, D. Numerical study on the dynamic characteristics of a vehicle with a multistage load reduction structure during oblique water entry. Ocean Eng. 2024, 295, 116778. [Google Scholar] [CrossRef]
  33. Ma, W.; Zhang, H.; Hu, Z.; Sa, H.; Zhang, W. Numerical Simulation on Near-water-surface Skipping Motion of Trans-media Vehicle. J. Phys. Conf. Ser. 2023, 2599, 012004. [Google Scholar] [CrossRef]
  34. Wang, C.; Huang, Q.; Lu, L.; Pan, G.; Gao, S. Numerical investigation of water entry characteristics of a projectile in the wave environment. Ocean Eng. 2024, 294, 116821. [Google Scholar] [CrossRef]
  35. Zhao, G.; Chen, T.; Guo, Z.; Zhang, W. Experimental study on ballistic stability of truncated cone projectile in high-speed oblique water entry. Ocean Eng. 2023, 283, 115078. [Google Scholar] [CrossRef]
Figure 1. Aircraft model diagram: (a) three-dimensional diagram; (b) top view; (c) front view.
Drones 08 00089 g001
Figure 2. Computational domain: (a) three-dimensional diagram; (b) two-dimensional diagram.
Drones 08 00089 g002
Figure 3. Model grid: (a) overall grid; (b) encrypted mesh for aircraft fuselage.
Drones 08 00089 g003
Figure 4. Pressure maps obtained for different number of grids.
Drones 08 00089 g004
Figure 5. Computational model.
Drones 08 00089 g005
Figure 6. Diagram of the position of the ball falling into the water; (a) test t = 0.210 s; (b) test t = 0.341 s; (c) simulation t = 0.319 s; (d) simulation t = 0.453 s.
Drones 08 00089 g006
Figure 7. Comparison of the results of the simulation with previous work [27].
Drones 08 00089 g007
Figure 8. Vehicle surface pressure cloud at different moments (V = 45 m/s, α = 30°, β = 0°): (a) T = 0.011 s; (b) T = 0.019 s; (c) T = 0.037 s.
Drones 08 00089 g008
Figure 9. Map of monitoring sites.
Drones 08 00089 g009
Figure 10. Pressure time curve at each monitoring point (V = 45 m/s, α = 30°, β = 0°).
Drones 08 00089 g010
Figure 11. Pressure time-course curves at different speeds for monitoring point 1 (α = 30°, β = 0°).
Drones 08 00089 g011
Figure 12. Aircraft velocity change curve (α = 30°, β = 0°).
Drones 08 00089 g012
Figure 13. Pressure time-course curves for monitoring point 1 at different entry angles (V = 45 m/s, β = 0°).
Drones 08 00089 g013
Figure 14. Velocity change curves at different entry angles (V = 45 m/s, β = 0°).
Drones 08 00089 g014
Figure 15. Curves of variation in drag coefficient at different water entry angles (V = 45 m/s, β = 0°).
Drones 08 00089 g015
Figure 16. Volume fractions 2D plot (V = 45 m/s, α = 60°): (a) angle of attack β = 0°; (b)angle of attack β = 45°.
Drones 08 00089 g016aDrones 08 00089 g016b
Figure 17. Aircraft surface pressure cloud at different moments (V = 45 m/s, α = 60°): (a) T = 0.007 s; (b) t = 0.01 s.
Drones 08 00089 g017
Figure 18. Pressure–time curves for monitoring point 7 at different angles of attack into the water (V = 45 m/s, α = 60°).
Drones 08 00089 g018
Figure 19. Pressure–time curves for monitoring point 8 at different angles of attack into the water (V = 45 m/s, α = 60°).
Drones 08 00089 g019
Figure 20. Models of different head types of aircrafts: (a) flat; (b) conical; (c) hemispherical.
Drones 08 00089 g020
Figure 21. Pressure clouds for different head types (V = 45 m/s, α = 60°, β = 0°): (a) flat; (b) conical; (c) hemispherical.
Drones 08 00089 g021
Figure 22. Pressure time course curves for different head types (V = 45 m/s, α = 60°, β = 0°).
Drones 08 00089 g022
Figure 23. Resistance coefficient curves for different head types (V = 45 m/s, α = 60°, β = 0°).
Drones 08 00089 g023
Disclaimer/Publisher’s Note: The statements, opinions and data contained in all publications are solely those of the individual author(s) and contributor(s) and not of MDPI and/or the editor(s). MDPI and/or the editor(s) disclaim responsibility for any injury to people or property resulting from any ideas, methods, instructions or products referred to in the content.

