

Improved Radar Detection of Small Drones Using Doppler Signal-to-Clutter Ratio (DSCR) Detector

Abstract
:1. Introduction
2. Materials and Methods
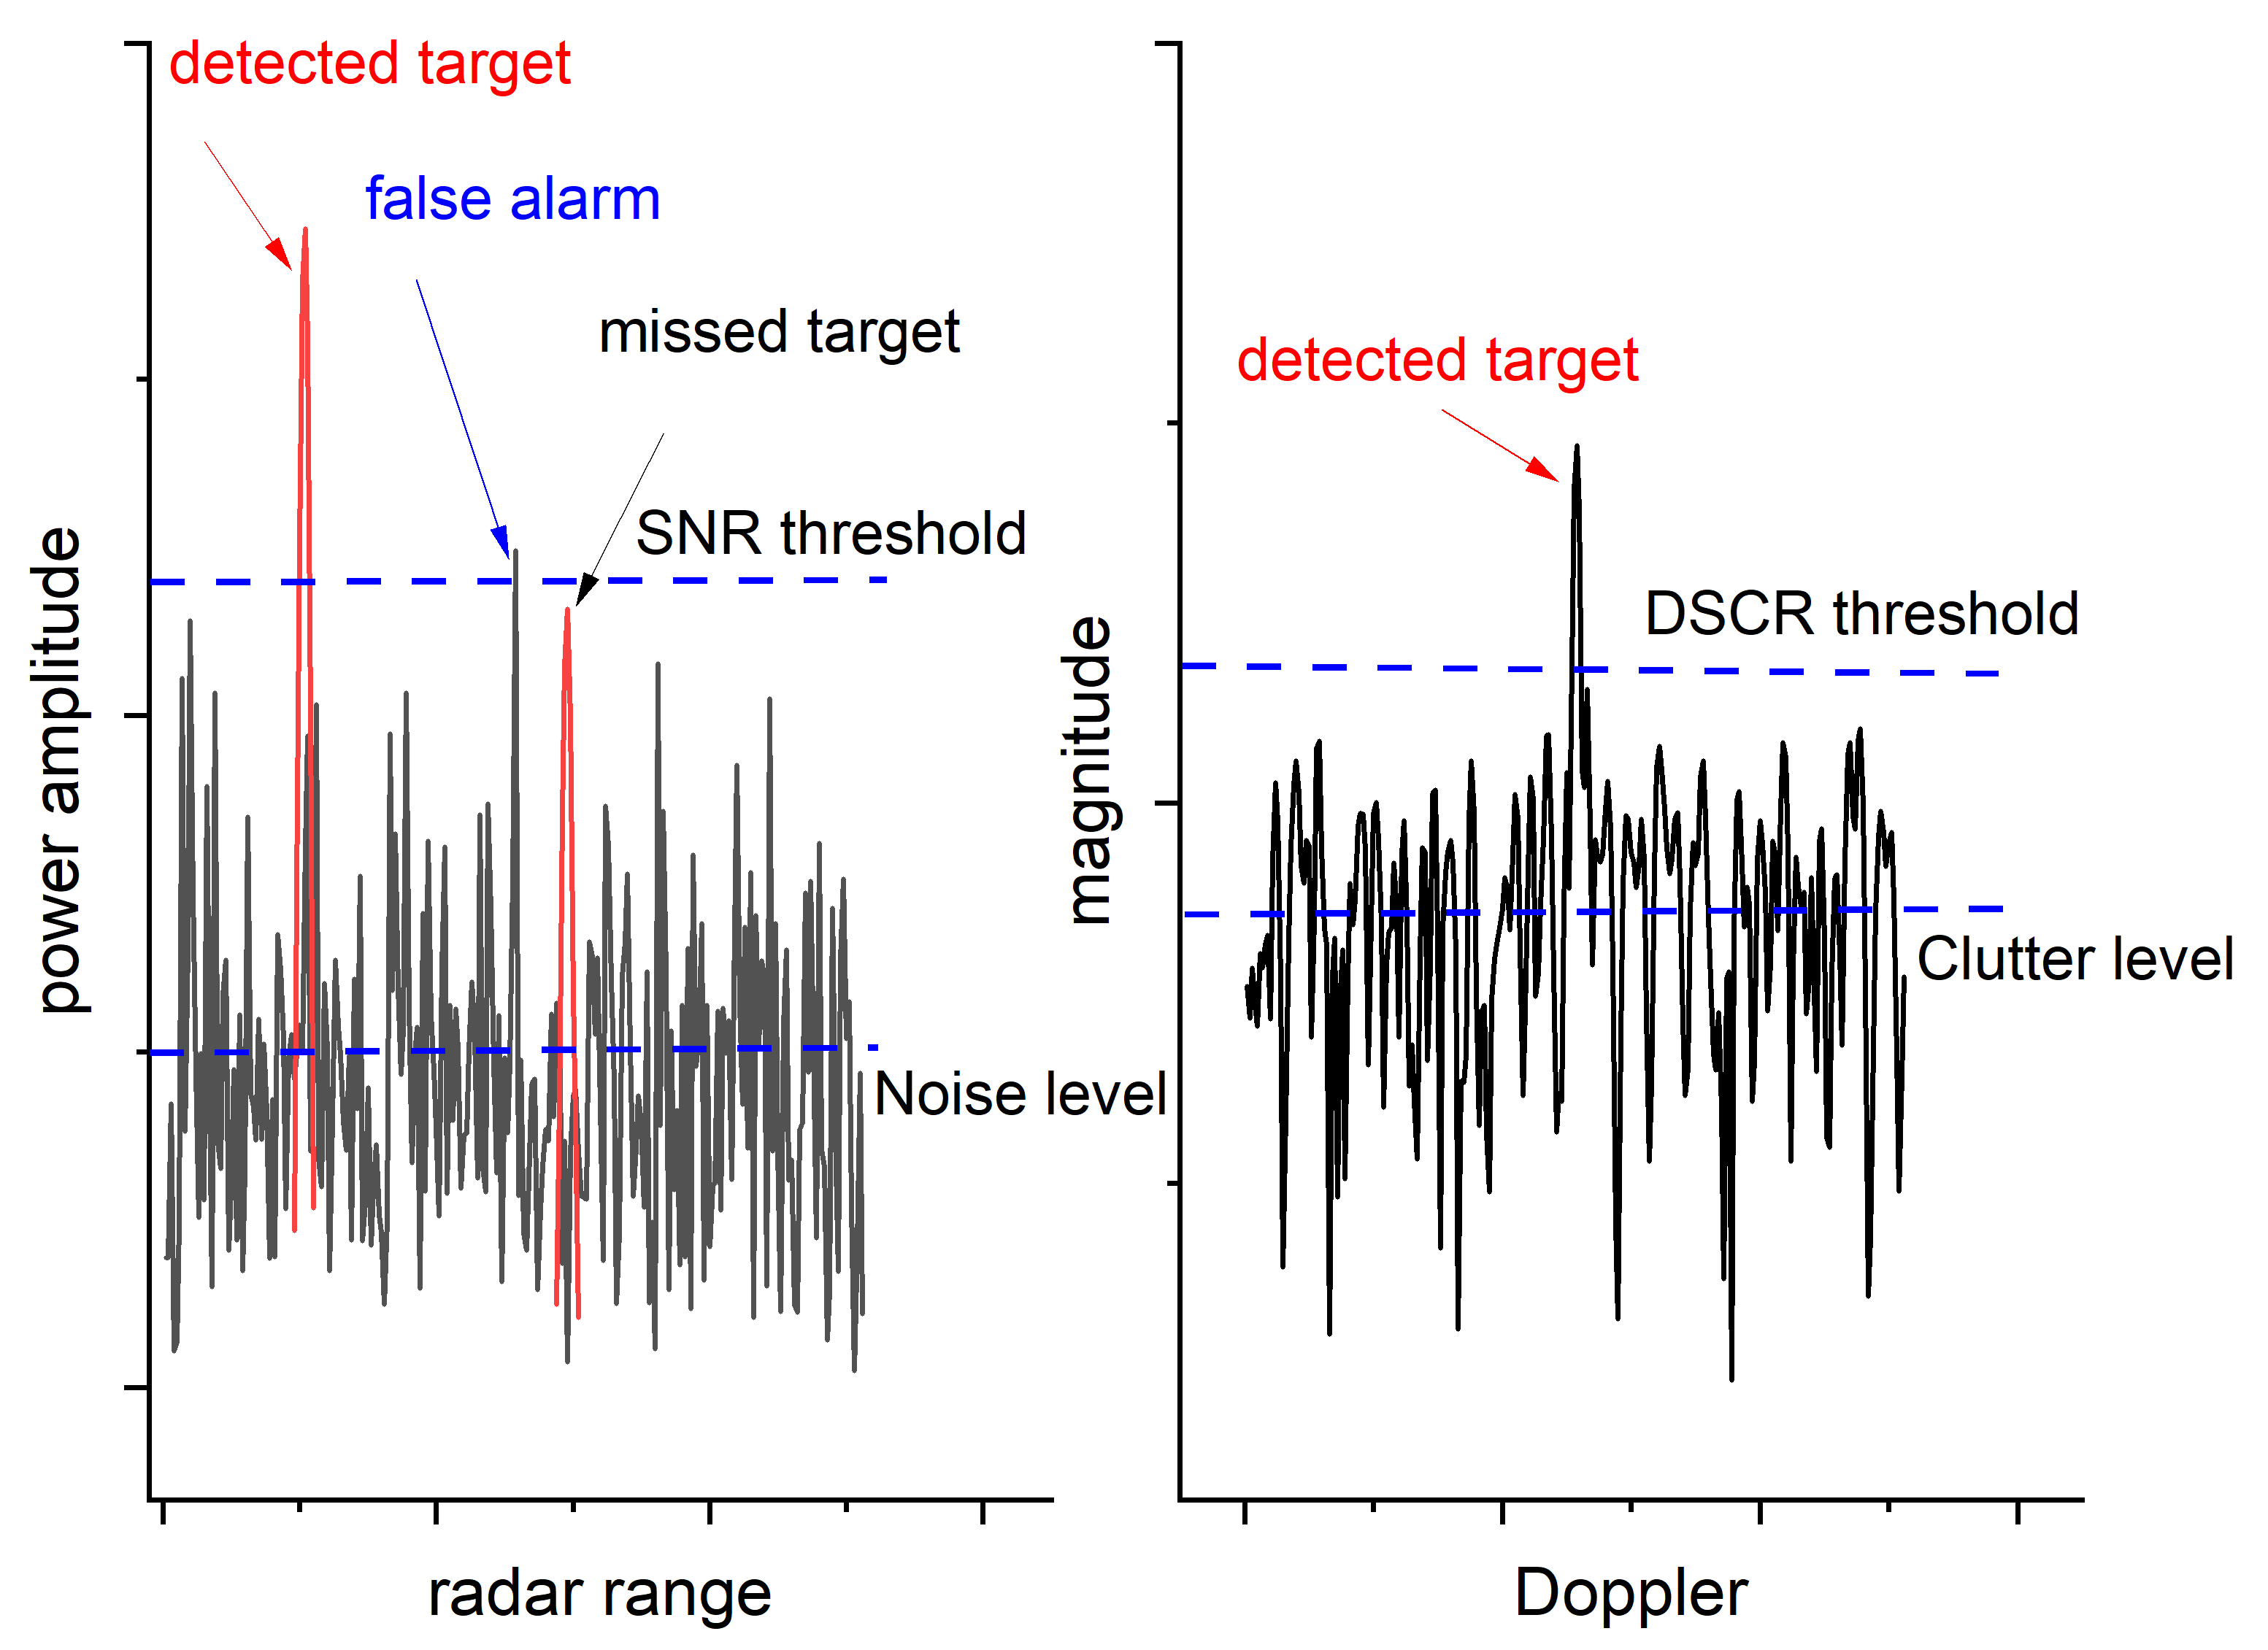
2.1. Theoretical Model
2.2. Algorithm Description
- (1)
- Obtain the radar echoes raw data, , in one radar resolution cell, and calculate its Doppler spectrum, .
- (2)
- Search the spectrum, , to locate the strongest Doppler shift of D starting from the beginning point of M. Generally, we assume that the Doppler points below M belong to the background clutter. Calculate the maximum DSCR of the strongest Doppler shift of .
- (3)
- Compare the value of the maximum DSCR with the detection threshold . If the DSCR is above the threshold, then it is a target. Otherwise, it is not.
| Algorithm 1: Calculating the maximum DSCR value. |
| 1: Function begins: 2: Compute the Fourier transform of X(n) using fast Fourier transform (FFT), store it in F(k). 3: Initialize a variable Ma to zero. 4: while each index i from M to N-M, do 5: if F(i) > Ma, then 6: update Ma to F(i) and D to i. 7: end if 8: end while 9: Compute the mean value of F(k) and store it in a variable Me. 10: Compute the spectral contrast ratio (DSCR), Ds, as the ratio of Ma to Me. 11: Translate the Ds into a dB value using 10log10(Ds). 12: Return the values of Ds and D. 13: Function end. |
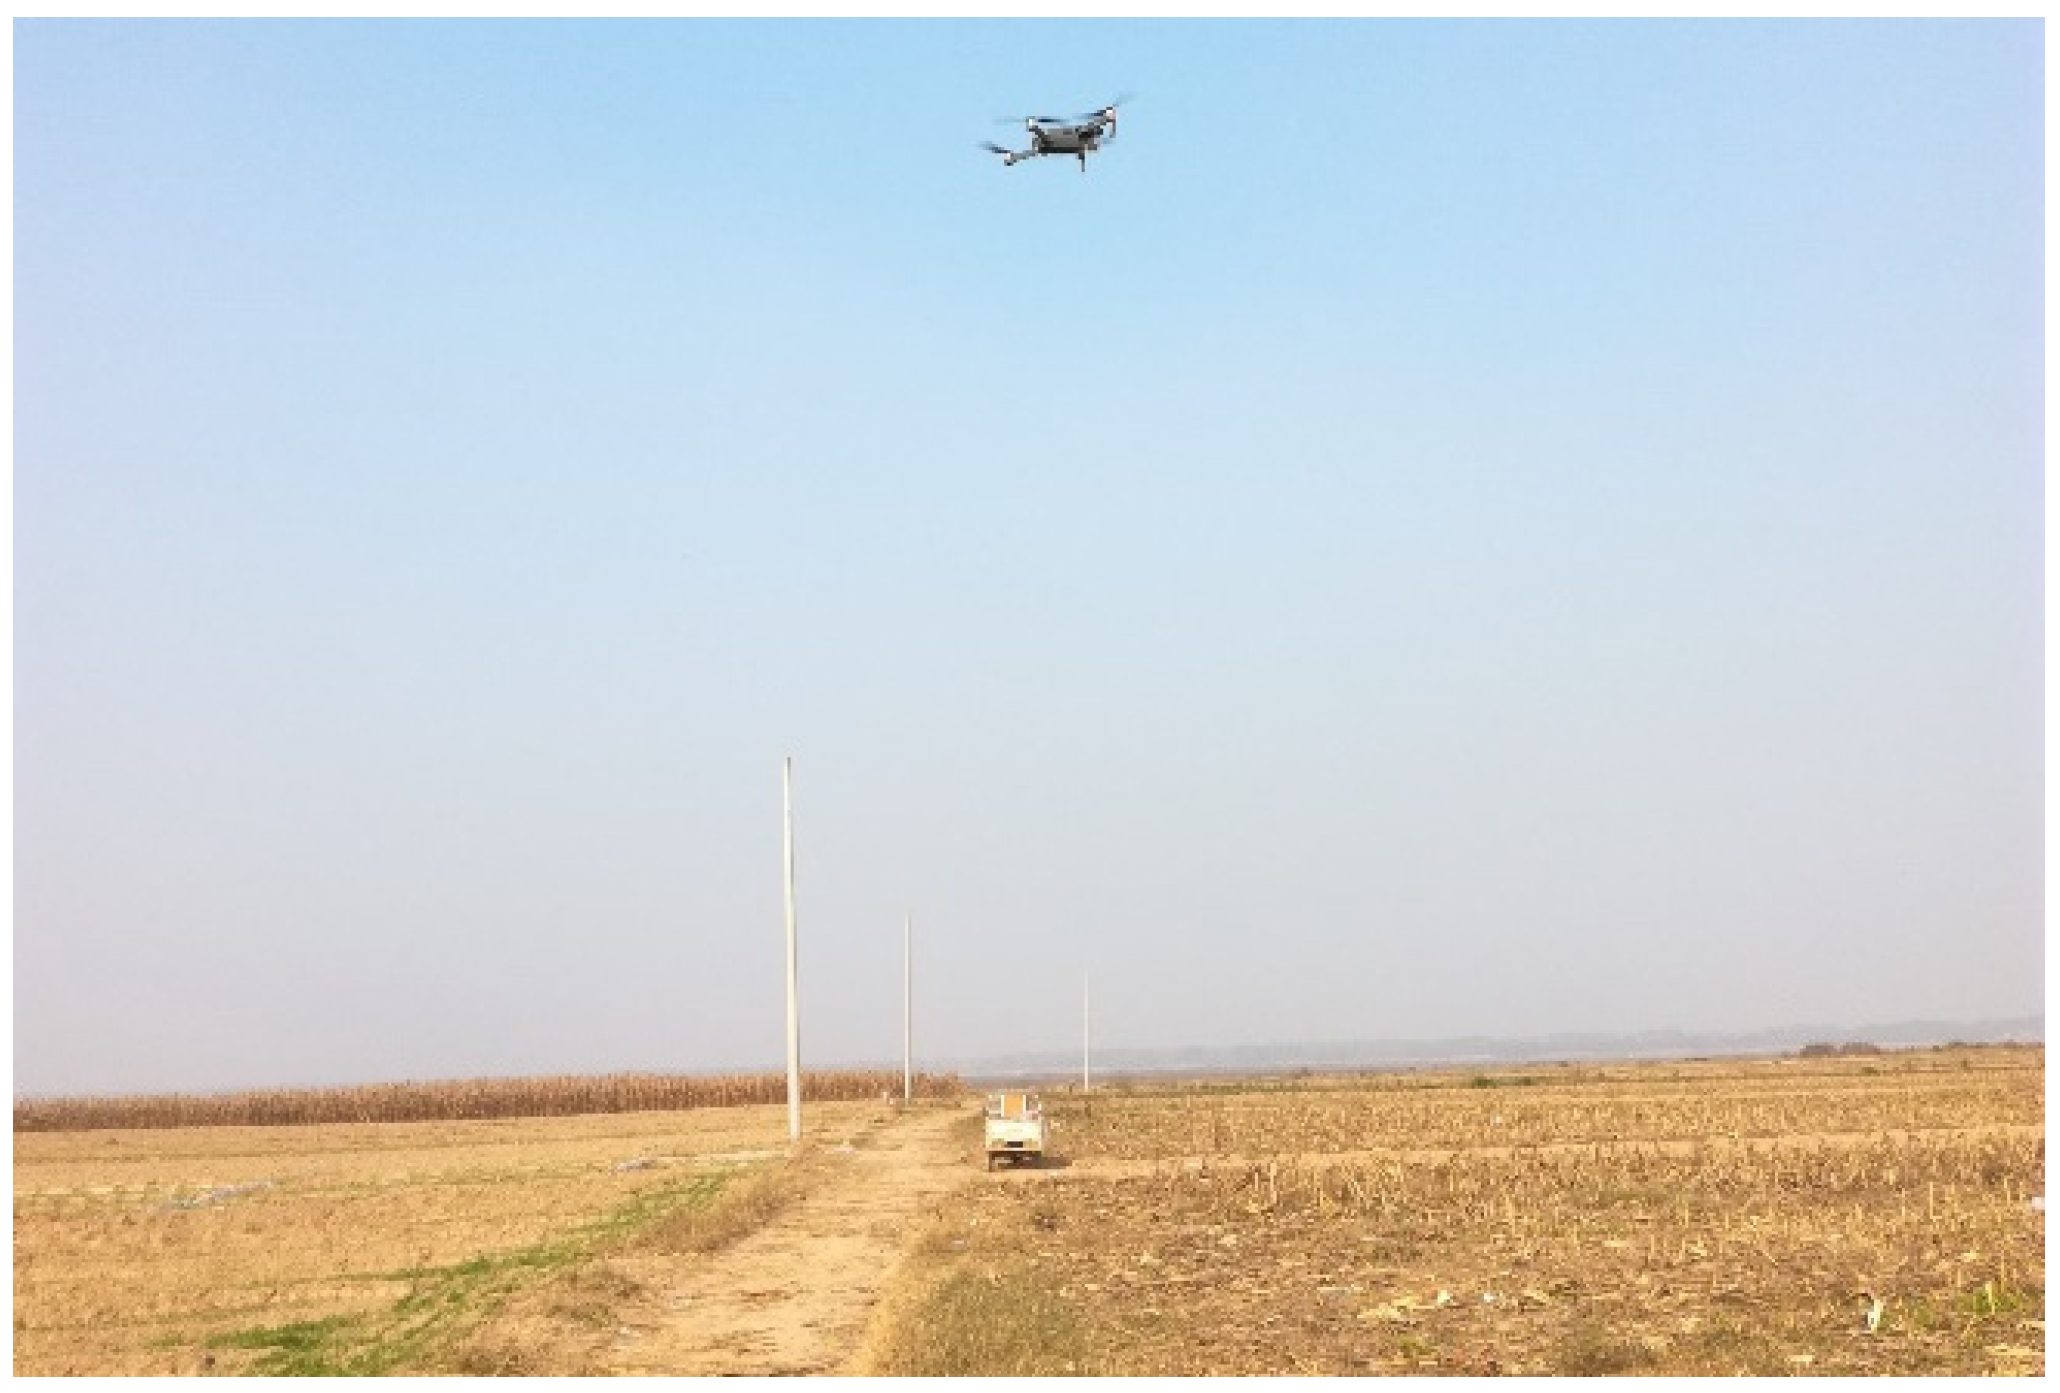
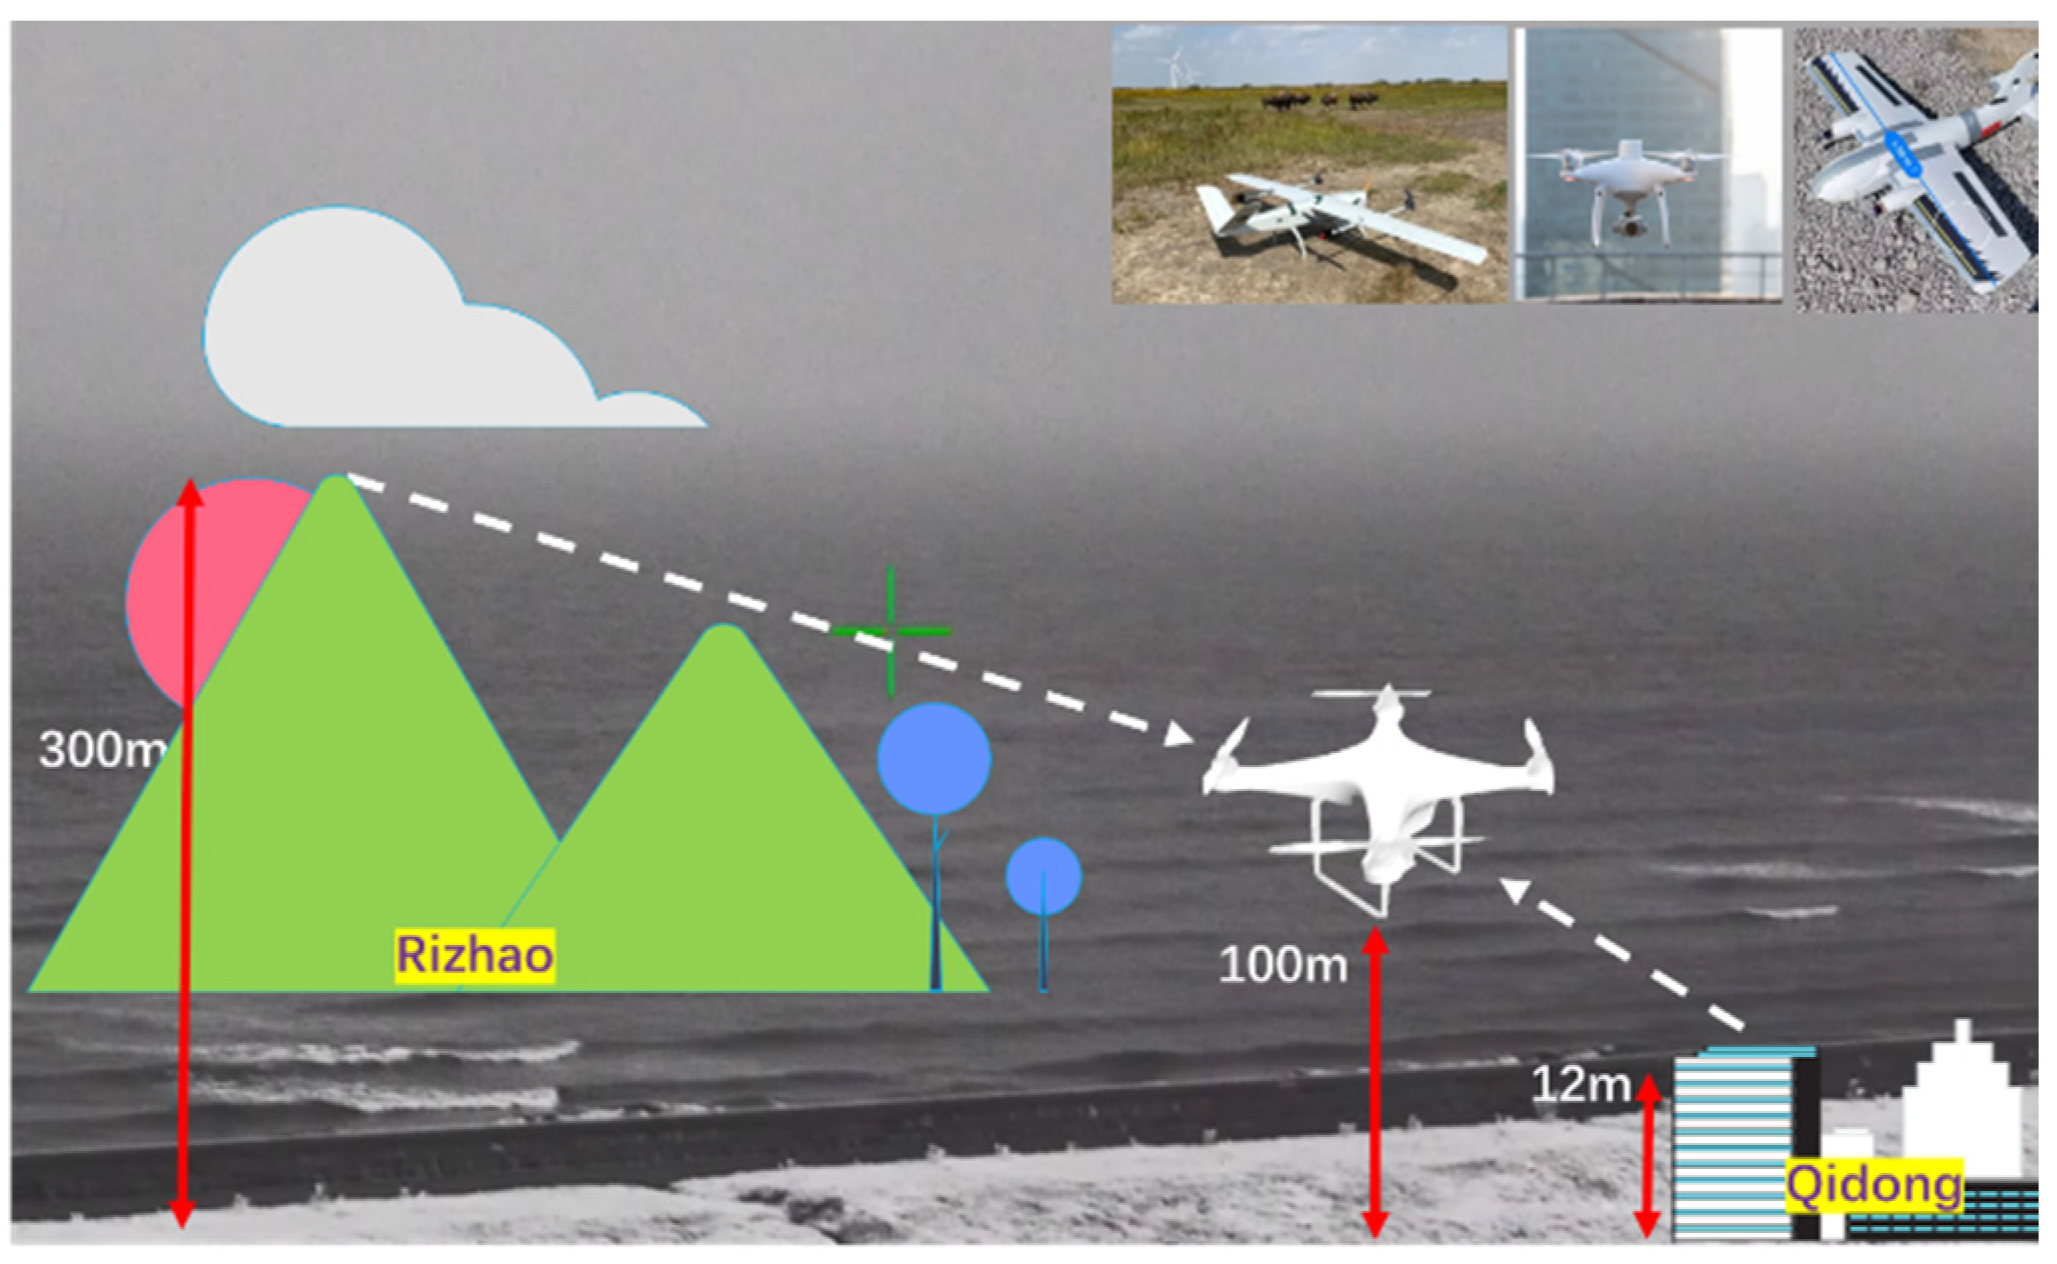
2.3. Experimental Tests
- (1)
- Ku-band radar test
- (2)
- X-band radar test
3. Results
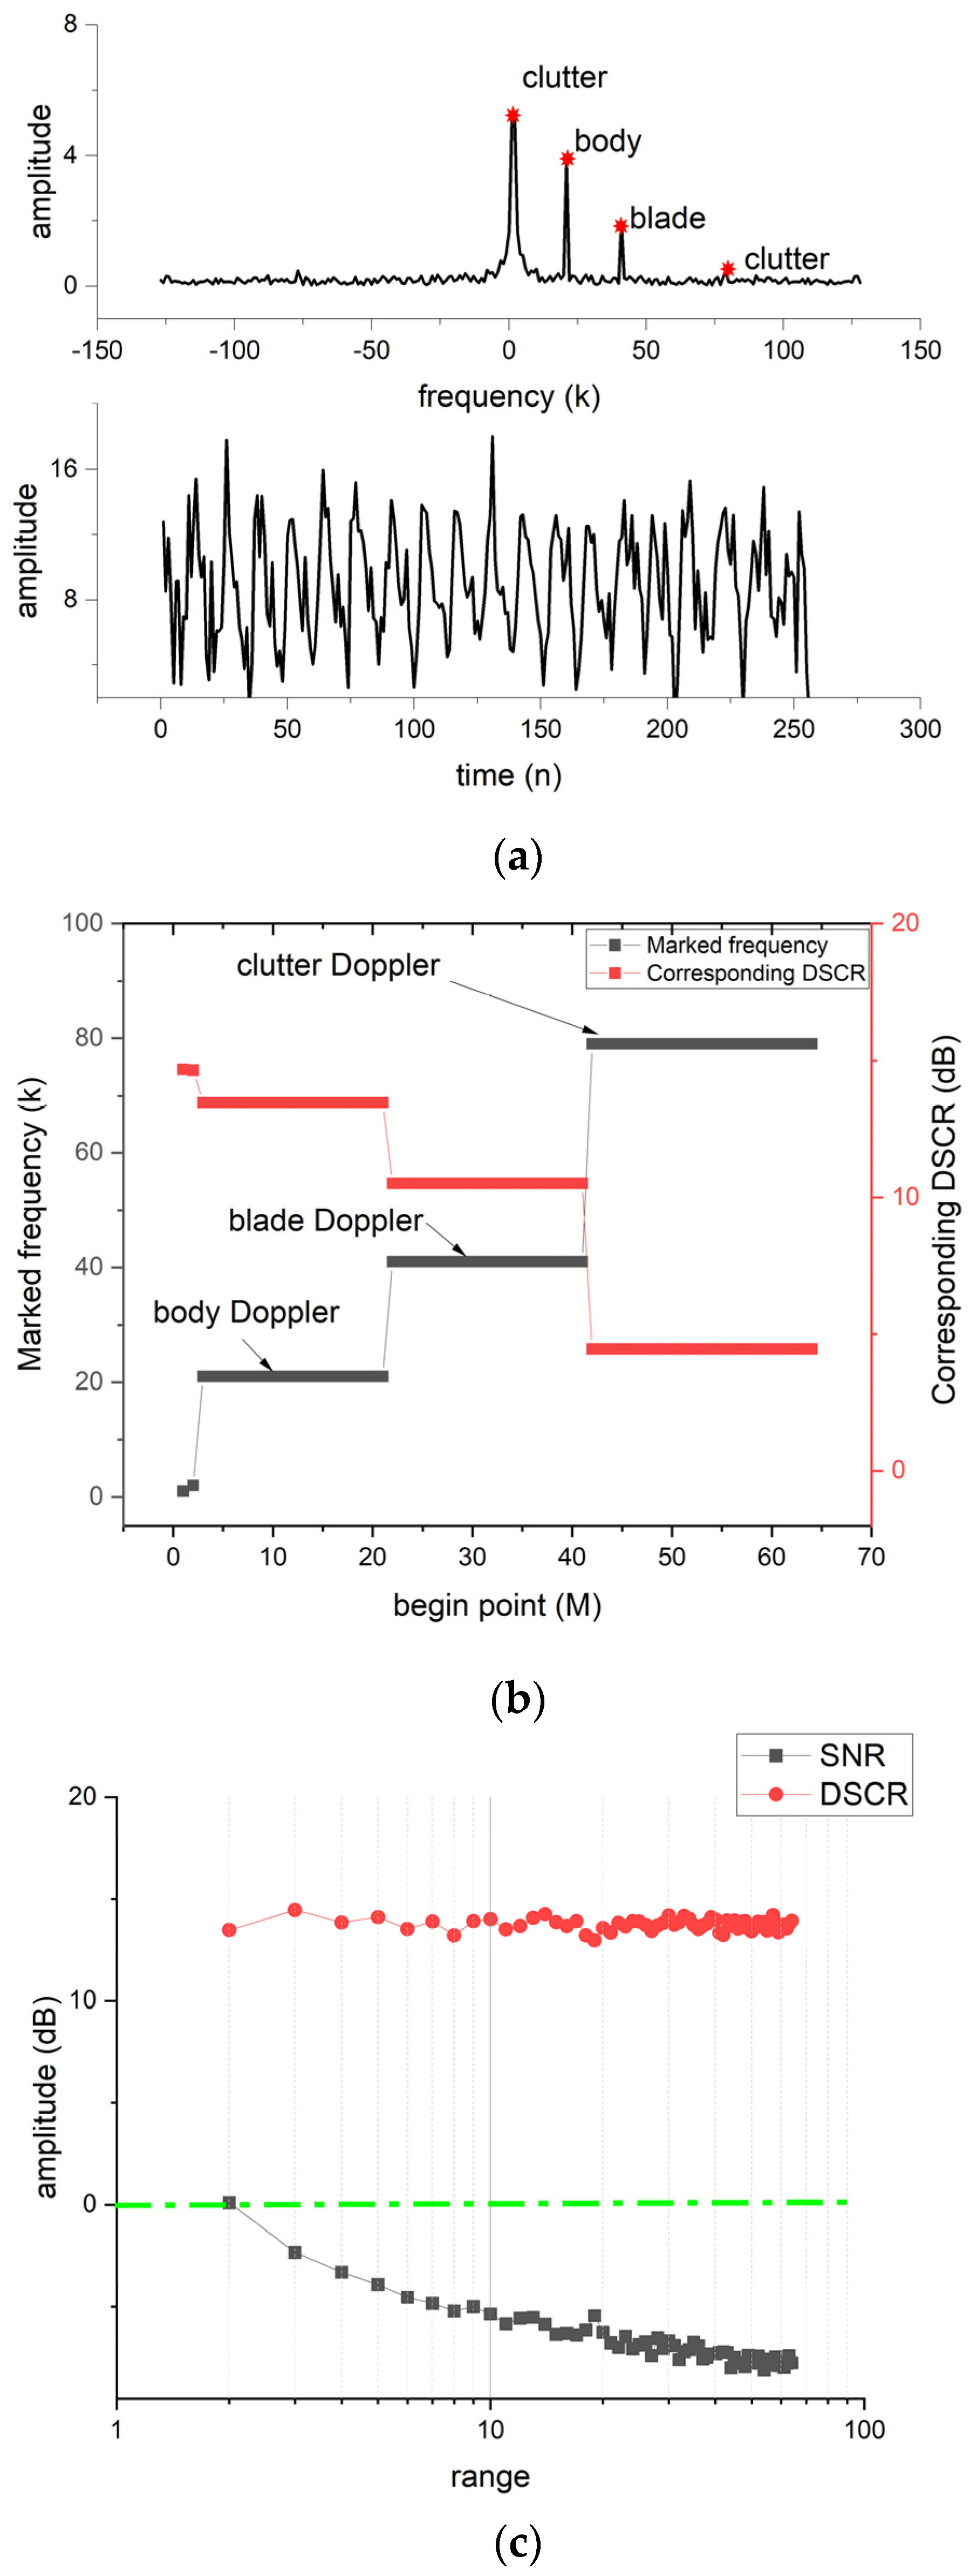
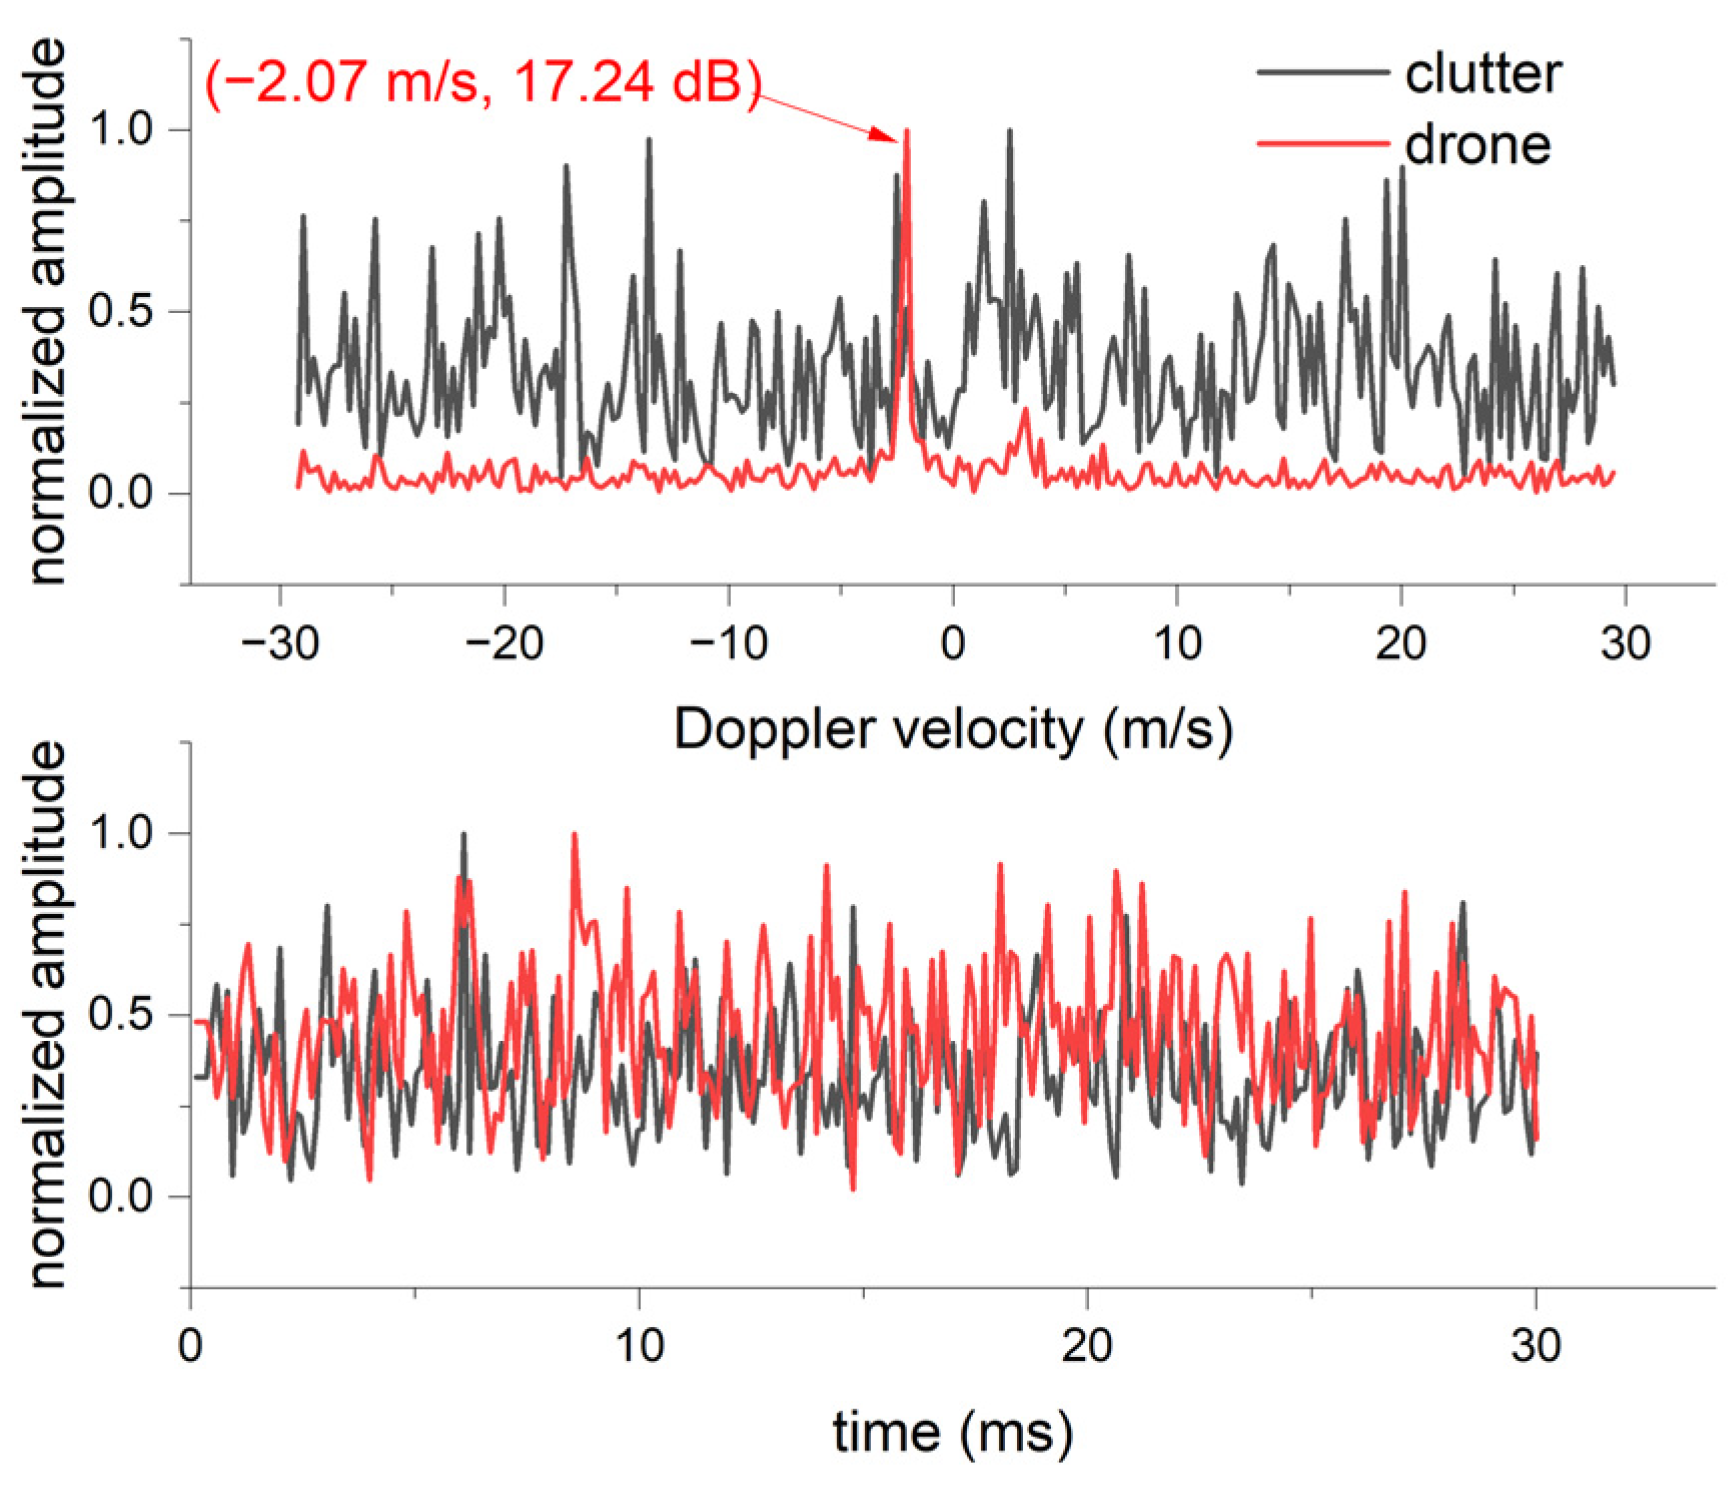
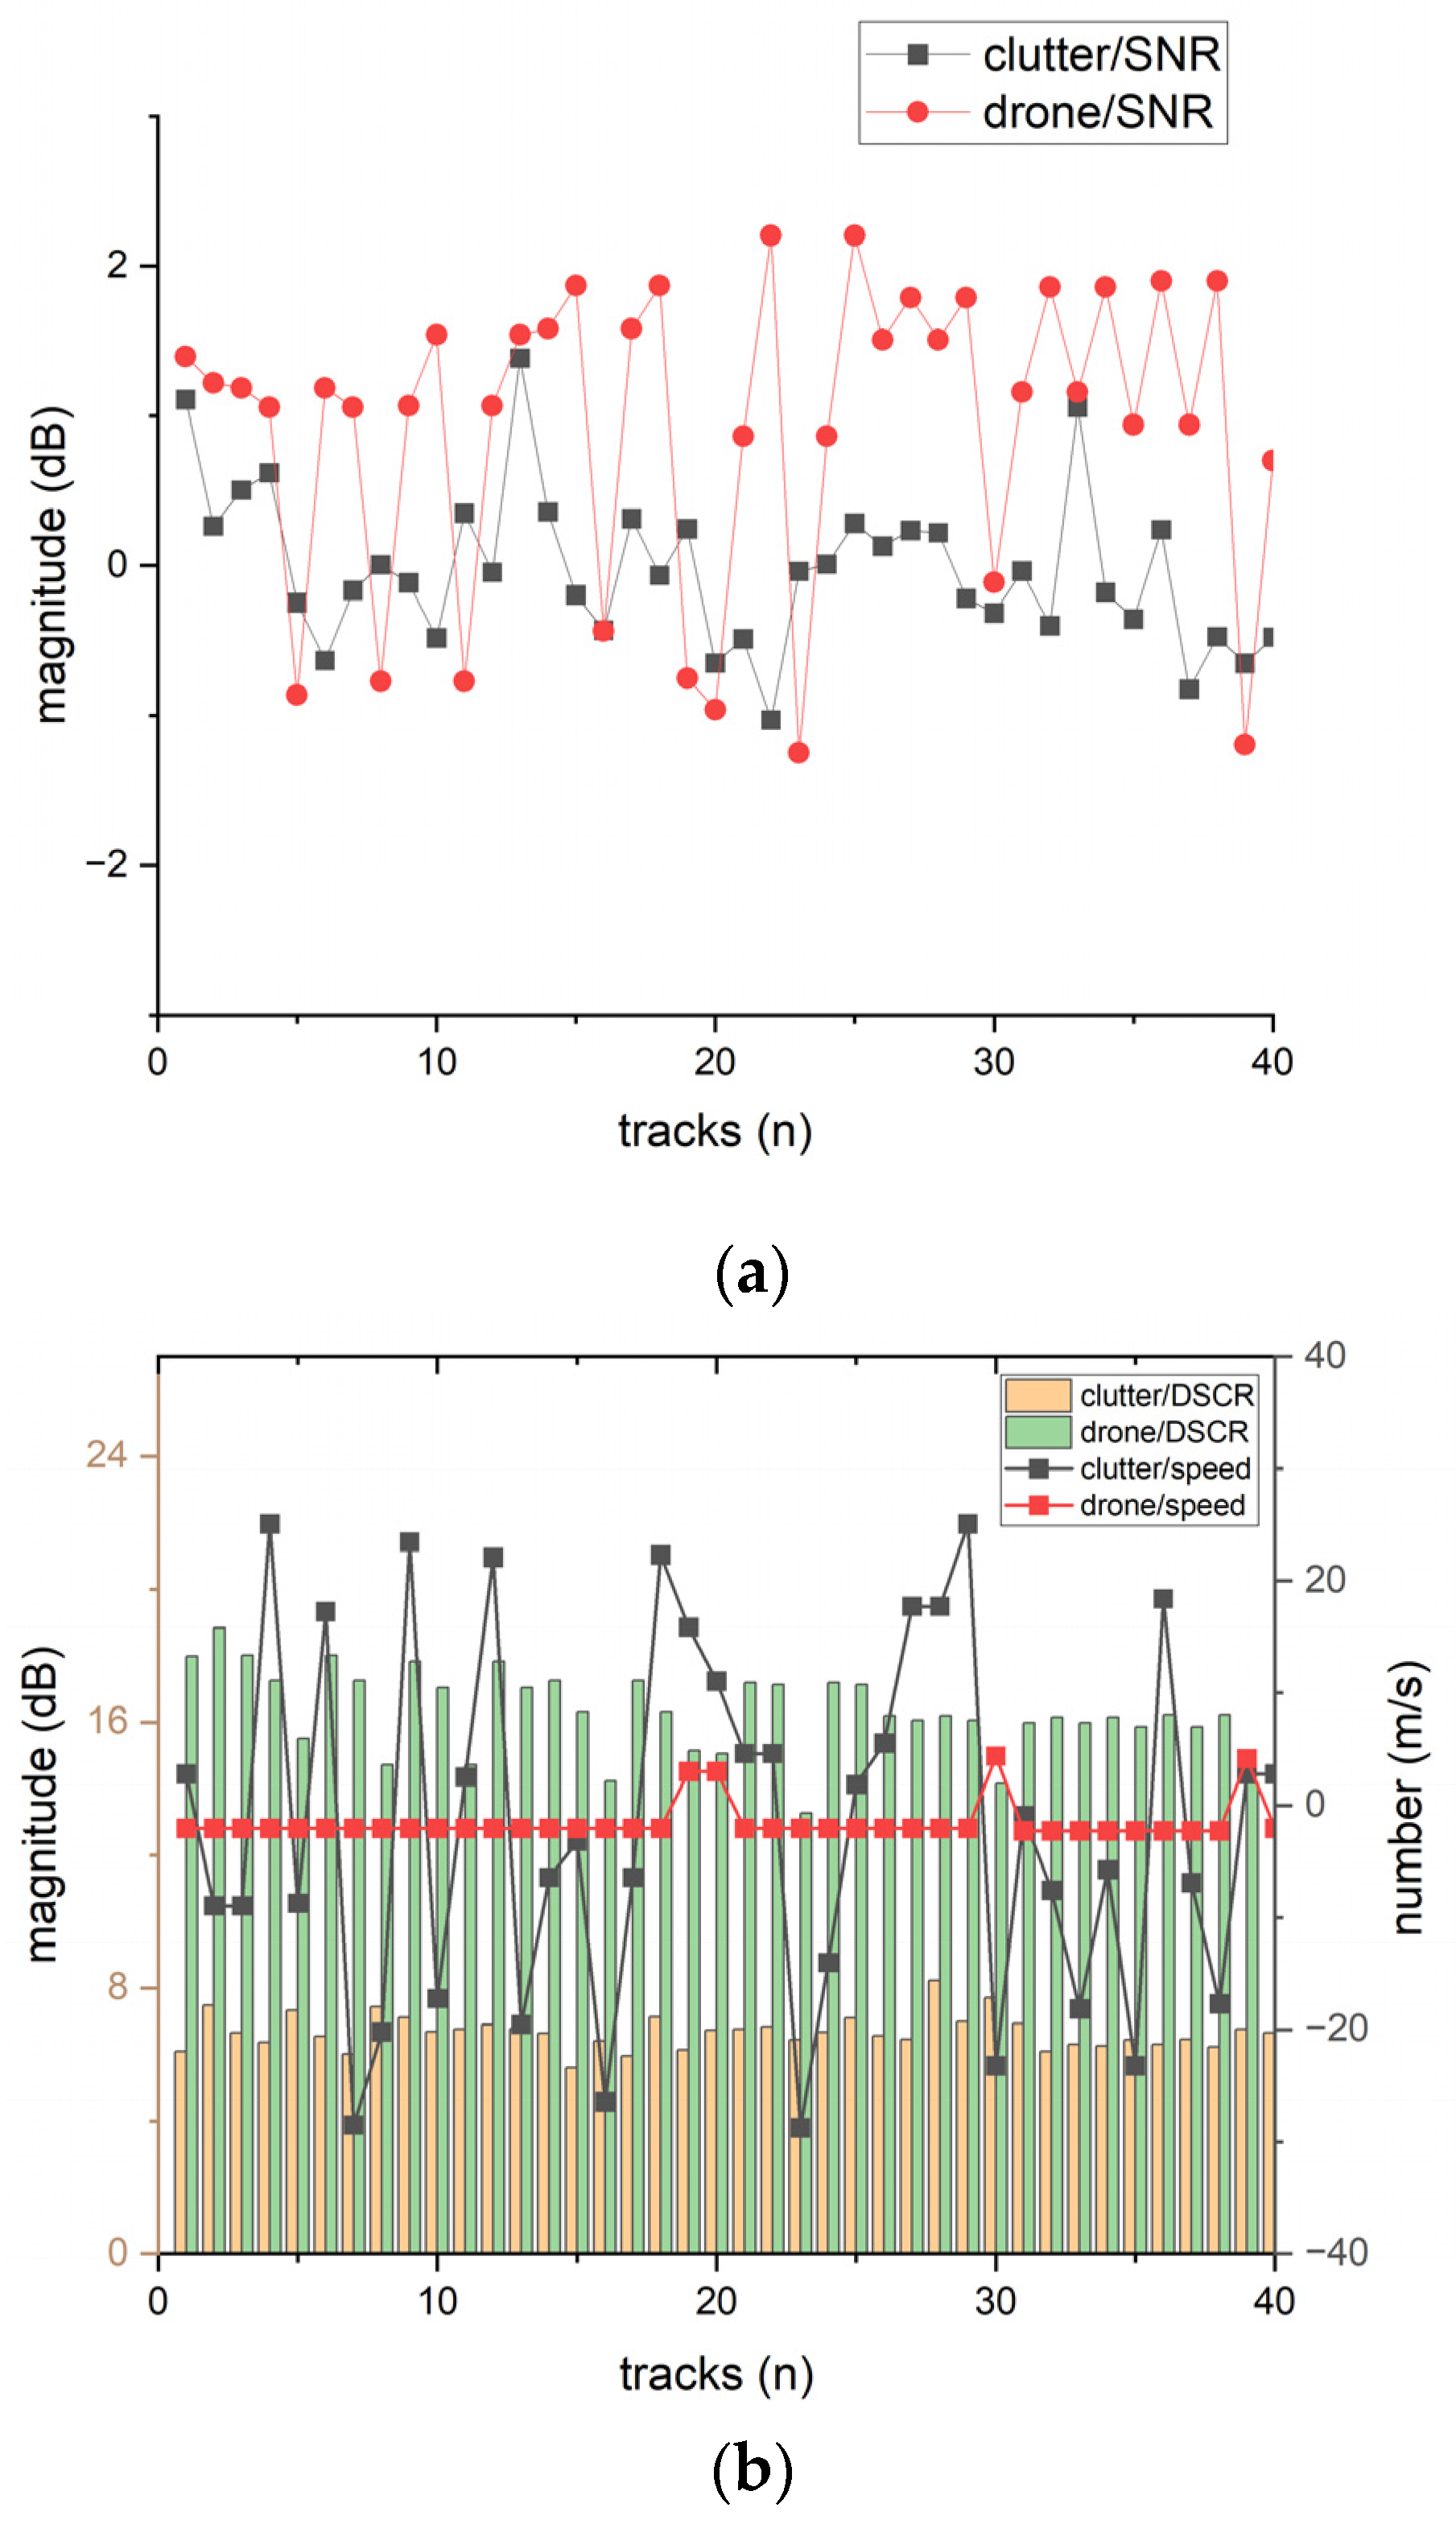
3.1. Simulated Result
3.2. Real Ku-Band Radar Data
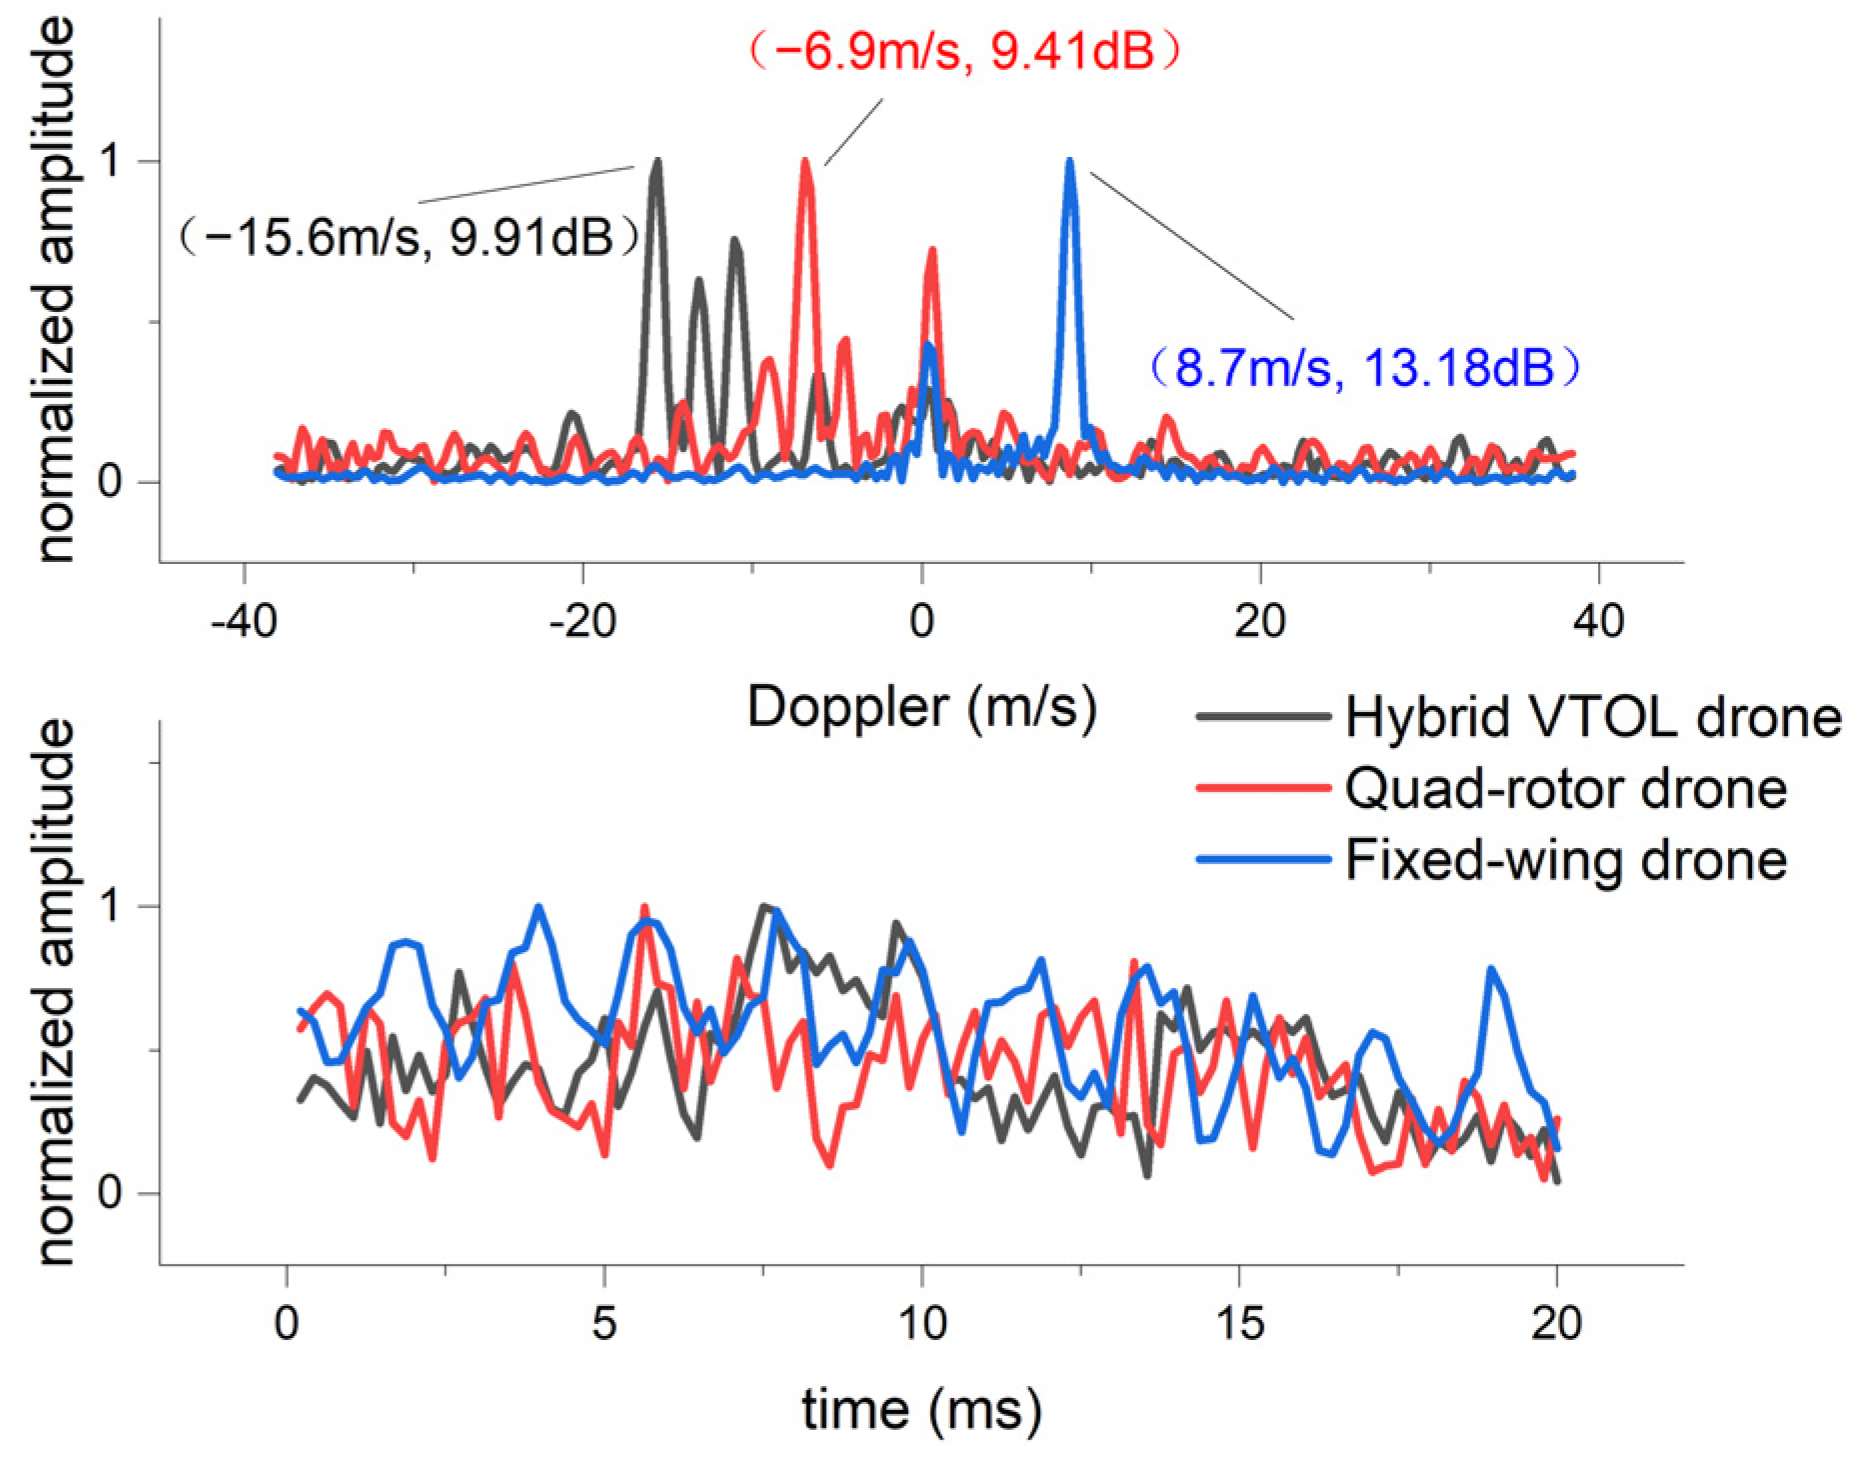
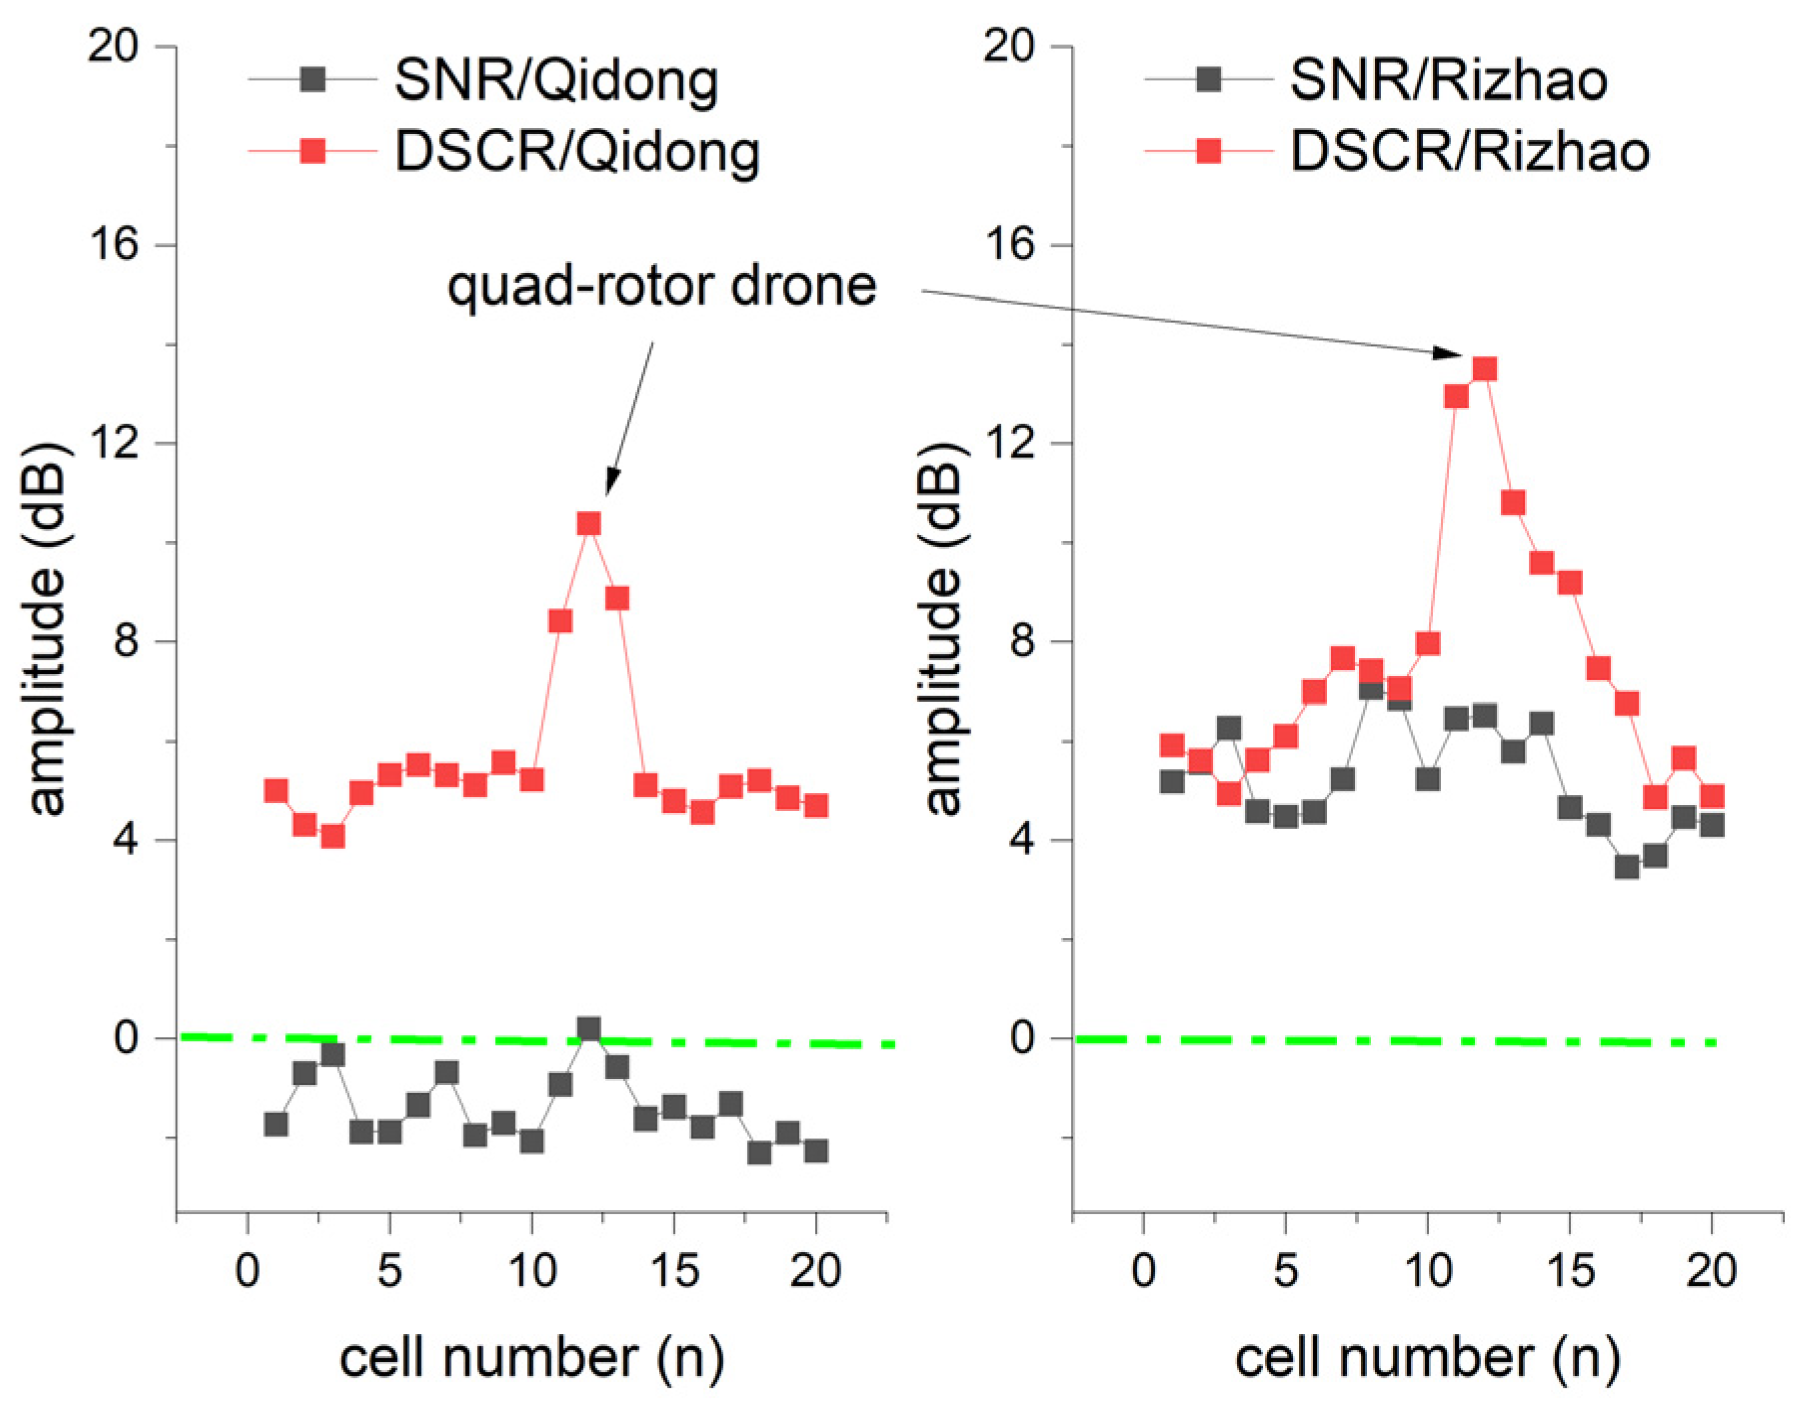
3.3. Real X-Band Radar Data
4. Discussion
5. Conclusions
Author Contributions
Funding
Institutional Review Board Statement
Informed Consent Statement
Data Availability Statement
Acknowledgments
Conflicts of Interest
References
- Čisar, P.; Pinter, R.; Čisar, S.M.; Gligorijević, M. Principles of Anti-Drone Defense. In Proceedings of the 2020 11th IEEE International Conference on Cognitive Infocommunications (CogInfoCom), Online on MaxWhere 3D Web, 23–25 September 2020; pp. 19–26. [Google Scholar]
- Shi, X.; Yang, C.; Xie, W.; Liang, C.; Shi, Z.; Chen, J. Anti-Drone System with Multiple Surveillance Technologies: Architecture, Implementation, and Challenges. IEEE Commun. Mag. 2018, 56, 68–74. [Google Scholar] [CrossRef]
- Gong, J.; Yan, J.; Li, D.; Kong, D.; Hu, H. Interference of Radar Detection of Drones By Birds. Prog. Electromagn. Res. M 2019, 81, 1–11. [Google Scholar] [CrossRef]
- Markow, J.; Balleri, A.; Catherall, A. Statistical analysis of in-flight drone signatures. IET Radar Sonar Navig. 2022, 16, 1737–1751. [Google Scholar] [CrossRef]
- Svanström, F.; Alonso-Fernandez, F.; Englund, C. Drone Detection and Tracking in Real-Time by Fusion of Different Sensing Modalities. Drones 2022, 6, 317. [Google Scholar] [CrossRef]
- Ezuma, M.; Anjinappa, C.K.; Funderburk, M.; Guvenc, I. Radar Cross Section Based Statistical Recognition of UAVs at Microwave Frequencies. IEEE Trans. Aerosp. Electron. Syst. 2022, 58, 27–46. [Google Scholar] [CrossRef]
- HECHT, E. Drones in the Nagorno-Karabakh War: Analyzing the Data. Available online: https://www.militarystrategymagazine.com (accessed on 3 May 2023).
- Park, S.; Kim, H.T.; Lee, S.; Joo, H.; Kim, H. Survey on Anti-Drone Systems: Components, Designs, and Challenges. IEEE Access 2021, 9, 42635–42659. [Google Scholar] [CrossRef]
- Wellig, P.; Speirs, P.; Schuepbach, C.; Oechslin, R.; Renker, M.; Boeniger, U.; Pratisto, H. Radar systems and challenges for C-UAV. In Proceedings of the International Radar Symposium, Bonn, Germany, 20–22 June 2018; pp. 1–8. [Google Scholar]
- U.S. Army UAS Center of exCellenCe. “Eyes of the Army” U.S. Army Roadmap for Unmanned Aircraft Systems 2010–2035; U.S. Army: Arlington County, VA, USA, 2010. [Google Scholar]
- Zheng, J.; Chen, R.; Yang, T.; Liu, X.; Liu, H.; Su, T.; Wan, L. An Efficient Strategy for Accurate Detection and Localization of UAV Swarms. IEEE Internet Things J. 2021, 8, 15372–15381. [Google Scholar] [CrossRef]
- Zheng, J.; Yang, T.; Liu, H.; Su, T.; Wan, L. Accurate Detection and Localization of Unmanned Aerial Vehicle Swarms-Enabled Mobile Edge Computing System. IEEE Trans. Ind. Inform. 2021, 17, 5059–5067. [Google Scholar] [CrossRef]
- Qi, D.; Zhang, J.; Liang, X.; Li, Z.; Zuo, J.; Lei, P. Autonomous Reconnaissance and Attack Test of UAV Swarm Based on Mosaic Warfare Thought. In Proceedings of the 2021 6th International Conference on Robotics and Automation Engineering (ICRAE), Guangzhou, China, 19–22 November 2021; pp. 79–83. [Google Scholar]
- Zhou, Y.; Rao, B.; Wang, W. UAV Swarm Intelligence: Recent Advances and Future Trends. IEEE Access 2020, 8, 183856–183878. [Google Scholar] [CrossRef]
- Dale, H.; Baker, C.; Antoniou, M.; Jahangir, M.; Atkinson, G.; Harman, S. SNR-dependent drone classification using convolutional neural networks. IET Radar Sonar Navig. 2022, 16, 22–33. [Google Scholar] [CrossRef]
- VizcarroCarretero, M.; Harmanny, R.I.A.; Trommel, R.P. Smart-CFAR, a machine learning approach to floating level detection in radar. In Proceedings of the EuRAD 2019—2019 16th European Radar Conference, Paris, France, 2–4 October 2019; pp. 161–164. [Google Scholar]
- Skolnik, M.I. Introduction to Radar Systems; McGraw Hill Book Co.: New York, NY, USA, 1999; Volume 19. [Google Scholar]
- Humphreys, E.; Antoniou, M.; Baker, C.; Stafford, W. Cognitive Approaches to Detection of Small Targets. In Proceedings of the EuRAD 2020—2020 17th European Radar Conference, Utrecht, The Netherlands, 10–15 January 2021; pp. 366–369. [Google Scholar]
- Roldan, I.; del-Blanco, C.R.; Duque de Quevedo, Á.; Ibañez Urzaiz, F.; Gismero Menoyo, J.; Asensio López, A.; Berjón, D.; Jaureguizar, F.; García, N. DopplerNet: A convolutional neural network for recognising targets in real scenarios using a persistent range–Doppler radar. IET Radar Sonar Navig. 2020, 14, 593–600. [Google Scholar] [CrossRef]
- Tait, P. Introduction to Radar Target Recognition; Institution of Electrical Engineers: London, UK, 2006; ISBN 9781849190831. [Google Scholar]
- Amrouche, N.; Khenchaf, A.; Berkani, D. Multiple target tracking using track before detect algorithm. In Proceedings of the 2017 19th International Conference on Electromagnetics in Advanced Applications, ICEAA 2017, Verona, Italy, 11–15 September 2017; pp. 692–695. [Google Scholar]
- Buzzi, S.; Lops, M.; Venturino, L. Track-before-detect procedures for early detection of moving target from airborne radars. IEEE Trans. Aerosp. Electron. Syst. 2005, 41, 937–954. [Google Scholar] [CrossRef]
- Kim, K.; Uney, M.; Mulgrew, B. Estimation of Drone Micro-Doppler Signatures via Track-Before-Detect in Array Radars. In Proceedings of the 2019 International Radar Conference (RADAR), Toulon, France, 23–27 September 2019. [Google Scholar] [CrossRef]
- Guerraou, Z.; Khenchaf, A.; Comblet, F.; Leouffre, M.; Lacrouts, O. Particle Filter Track-Before-Detect for Target Detection and Tracking from Marine Radar Data. In Proceedings of the 2019 IEEE Conference on Antenna Measurements & Applications (CAMA), Kuta, Indonesia, 23–25 October 2019; pp. 1–4. [Google Scholar]
- Chen, V.C. The Micro-Doppler Effect in Radar; Artech House: Norwood, MA, USA, 2011; ISBN 9781608070572. [Google Scholar]
- Palamà, R.; Fioranelli, F.; Ritchie, M.; Inggs, M.; Lewis, S.; Griffiths, H. Measurements and discrimination of drones and birds with a multi-frequency multistatic radar system. IET Radar Sonar Navig. 2021, 15, 841–852. [Google Scholar] [CrossRef]
- Hanif, A.; Muaz, M.; Hasan, A.; Adeel, M. Micro-Doppler Based Target Recognition With Radars: A Review. IEEE Sens. J. 2022, 22, 2948–2961. [Google Scholar] [CrossRef]
- Skolnik, M. Radar Handbook, 3rd ed.; McGraw-Hill Education: New York, NY, USA, 2008. [Google Scholar]


| Category | Size | Maximum Gross Takeoff Weight (Pounds) | Normal Operating Altitude (ft) | Airspeed (Knots) |
|---|---|---|---|---|
| Group 1 | Small | <20 | <1200 AGL 3 | <100 |
| Group 2 | Medium | 21–55 | <3500 AGL | <250 |
| Group 3 | Large | <1320 | <18,000 MSL 4 | <250 |
| Group 4 | Larger | >1320 | <18,000 MSL | Any airspeed |
| Group 5 | Largest | >1320 | >18,000 MSL | Any airspeed |
| Drone Type | Hybrid VTOL Fixed-Wing | Multirotor | Fixed-Wing |
|---|---|---|---|
| Model | TX25A | Phantom 4 | Albatross 1 |
| Manufacturer | Harryskydream Inc. | DJI Inc. | Homemade |
| Flight weight | 26 kg | 1.38 kg | 0.3 kg |
| Wingspan | 360 cm | 40 cm | 108 cm |
| Body size | 197 cm | 40 cm | 80 cm |
| Blade length | 30 cm | 20 cm | 10 cm |
| Rotor number | 5 | 4 | 2 |
| Cruise speed | 25 m/s | 15 m/s | 10 m/s |
| Aero-frame materials | FRP (Fiber reinforced plastic) | PC (Polycarbonate) | EPP (Expanded polypropylene) |
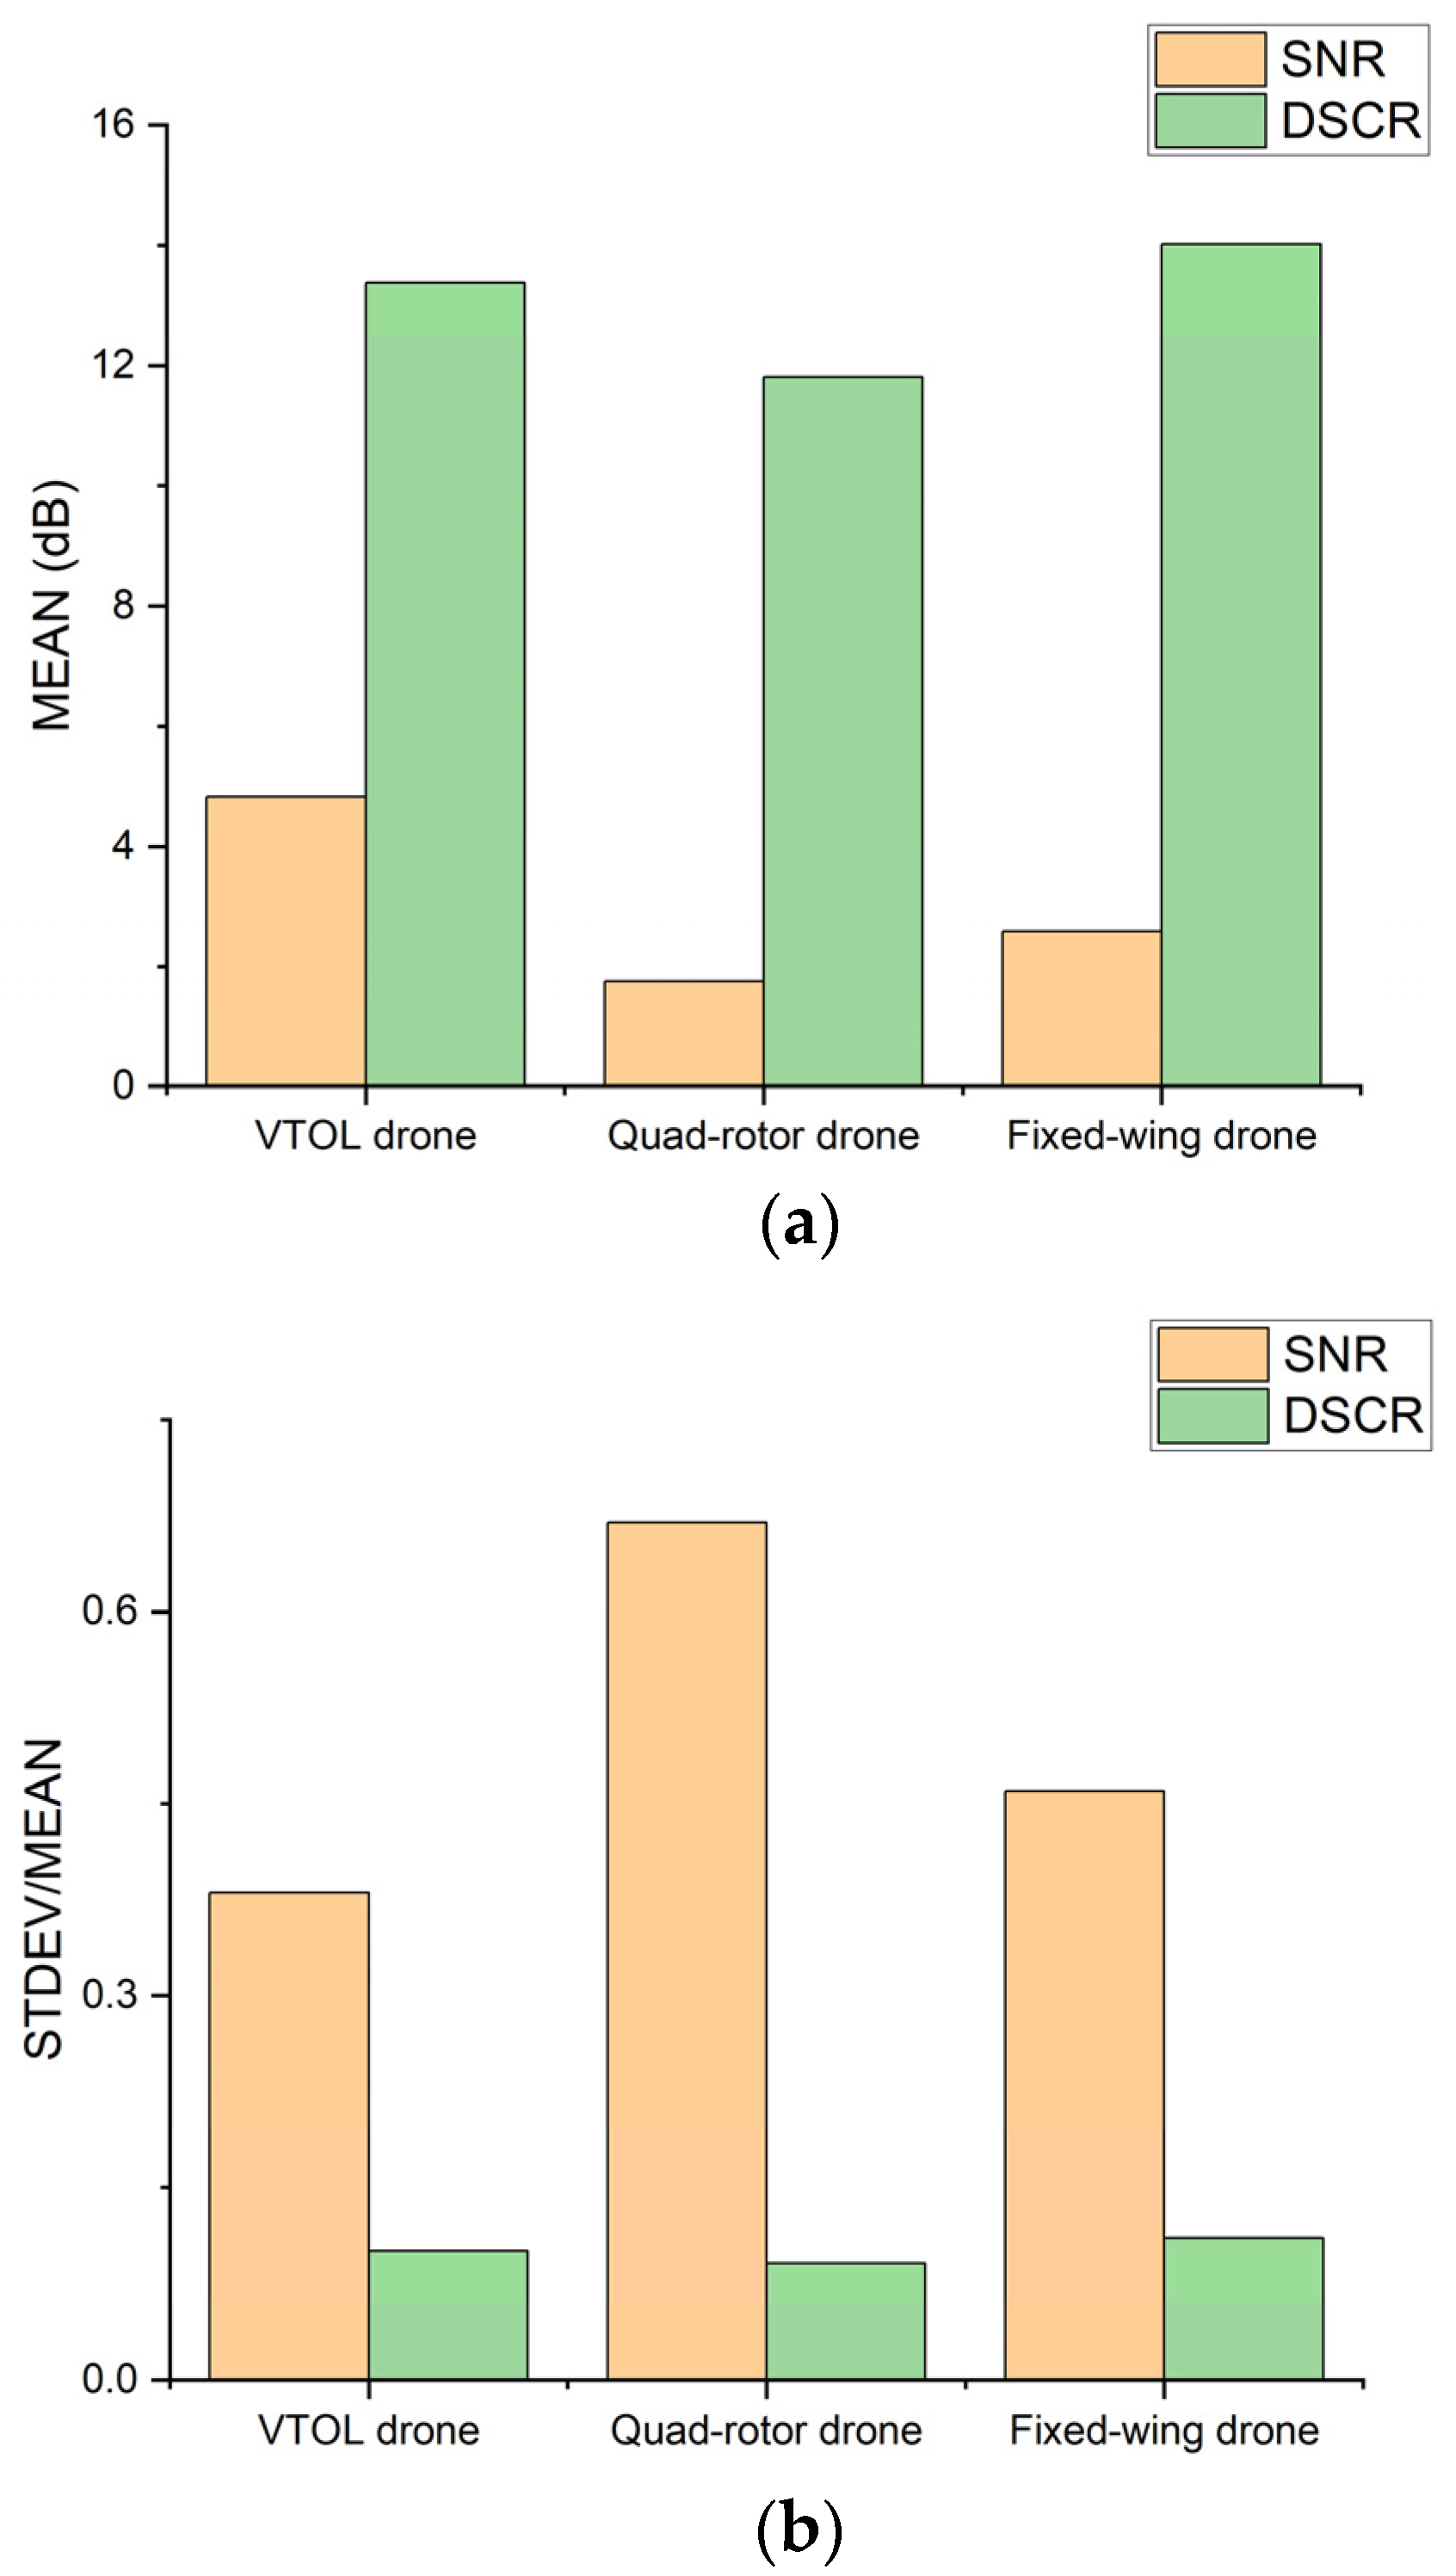
| Drone Types | Hybrid VTOL Drone | Quad-Rotor Drone | Fixed-Wing Drone | |
|---|---|---|---|---|
| Detection Background | Sea | Sea | Ground | |
| Detection Ranges | 8~14 km | 10 km | 5 km | |
| SNR | MIN (dB) | 2.58 | 0.20 | 0.70 |
| MAX (dB) | 8.07 | 4.28 | 5.13 | |
| MEAN (dB) | 4.83 | 1.76 | 2.59 | |
| STDEV (dB) | 1.86 | 1.18 | 1.19 | |
| STDEV/MEAN | 0.38 | 0.67 | 0.46 | |
| DSCR | MIN (dB) | 11.24 | 10.06 | 11.09 |
| MAX (dB) | 17.08 | 14.13 | 16.83 | |
| MEAN (dB) | 13.38 | 11.81 | 14.02 | |
| STDEV (dB) | 1.38 | 1.15 | 1.52 | |
| STDEV/MEAN | 0.10 | 0.09 | 0.11 | |
| Solutions | Detection | Recognition |
|---|---|---|
| Solution 1 | SNR detector | Kinetic features (e.g., trace) |
| Solution 2 | SNR detector | Signals signatures (e.g., micro-Doppler) |
| Solution 3 | DSCR detector | Kinetic features (e.g., trace) |
| Solution 4 | DSCR detector | Signals signatures (e.g., micro-Doppler) |
Disclaimer/Publisher’s Note: The statements, opinions and data contained in all publications are solely those of the individual author(s) and contributor(s) and not of MDPI and/or the editor(s). MDPI and/or the editor(s) disclaim responsibility for any injury to people or property resulting from any ideas, methods, instructions or products referred to in the content. |
© 2023 by the authors. Licensee MDPI, Basel, Switzerland. This article is an open access article distributed under the terms and conditions of the Creative Commons Attribution (CC BY) license (https://creativecommons.org/licenses/by/4.0/).
Share and Cite
Gong, J.; Yan, J.; Hu, H.; Kong, D.; Li, D. Improved Radar Detection of Small Drones Using Doppler Signal-to-Clutter Ratio (DSCR) Detector. Drones 2023, 7, 316. https://doi.org/10.3390/drones7050316
Gong J, Yan J, Hu H, Kong D, Li D. Improved Radar Detection of Small Drones Using Doppler Signal-to-Clutter Ratio (DSCR) Detector. Drones. 2023; 7(5):316. https://doi.org/10.3390/drones7050316
Chicago/Turabian StyleGong, Jiangkun, Jun Yan, Huiping Hu, Deyong Kong, and Deren Li. 2023. "Improved Radar Detection of Small Drones Using Doppler Signal-to-Clutter Ratio (DSCR) Detector" Drones 7, no. 5: 316. https://doi.org/10.3390/drones7050316