Article

Transmission Line Segmentation Solutions for UAV Aerial Photography Based on Improved UNet

1
School of Electrical and Automation, Wuhan University, Wuhan 430072, China
2
Hubei Key Laboratory of Power Equipment & System Security for Integrated Energy, Wuhan 430072, China
*
Author to whom correspondence should be addressed.
Drones 2023, 7(4), 274; https://doi.org/10.3390/drones7040274
Submission received: 23 March 2023 / Revised: 14 April 2023 / Accepted: 15 April 2023 / Published: 17 April 2023
(This article belongs to the Special Issue Intelligent Image Processing and Sensing for Drones)

Abstract

:
The accurate and efficient detection of power lines and towers in aerial drone images with complex backgrounds is crucial for the safety of power grid operations and low-altitude drone flights. In this paper, we propose a new method that enhances the deep learning segmentation model UNet algorithm called TLSUNet. We enhance the UNet algorithm by using a lightweight backbone structure to extract the features and then reconstructing them with contextual information features. In this network model, to reduce its parameters and computational complexity, we adopt DFC-GhostNet (Dubbed Full Connected) as the backbone feature extraction network, which is composed of the DFC-GhostBottleneck structure and uses asymmetric convolution to capture long-distance targets in transmission lines, thus enhancing the model’s extraction capability. Additionally, we design a hybrid feature extraction module based on convolution and a transformer to refine deep semantic features and improve the model’s ability to locate towers and transmission lines in complex environments. Finally, we adopt the up-sampling operator CARAFE (Content-Aware Re-Assembly of FEature) to improve segmentation accuracy by enhancing target restoration using contextual neighborhood pixel information correlation under feature decoding. Our experiments on public aerial photography datasets demonstrate that the improved model requires only 8.3% of the original model’s computational effort and has only 21.4% of the original model’s parameters, while achieving a reduction in inference speed delay by 0.012 s. The segmentation metrics also showed significant improvements, with the mIOU improving from 79.75% to 86.46% and the mDice improving from 87.83% to 92.40%. These results confirm the effectiveness of our proposed method.

1. Introduction

Transmission lines are a critical part of the power system with broad coverage, long transmission distances, and high reliability requirements. However, these lines are often exposed to a complex external environment, where the presence of vegetation and buildings of varying heights on the ground poses a potential threat. The proximity of these objects to high-voltage transmission lines can lead to accidents such as line tripping. Furthermore, during the inspection process, the wings of the drone may collide or tangle with the power lines, which poses a significant risk to the safety of the drone’s flight and the stable operation of power facilities. Therefore, it is crucial to effectively monitor and segment transmission lines to ensure the safety of the power grid and low-altitude drones.
The detection methods for transmission lines can be divided into traditional image-processing methods and deep learning-based methods. Among the two methods for detecting transmission lines, traditional image-processing methods have been used for transmission line extraction based on edge detection algorithms. For example, Zhou et al. [1] proposed a color space variable-based classification and feature extraction method for transmission line images. It classifies images based on the relationship between the values of variables in each color space of the transmission line image and its corresponding image features, specifically focusing on different light intensities. Then, the edge extraction of power line images is performed by the OTSU (NobuyukiOtsumethod) algorithm [2]. This method mainly considers the power line segmentation under different lighting conditions; although the power lines are effectively extracted, the application scenario is mainly the power lines under low- to high-altitude photography. That is, the background is mainly the sky. When the perspective shifts from high altitude to low altitude shooting, the background is mostly houses, mountains, and rivers. As such, this type of algorithm cannot effectively solve the power line segmentation in complex backgrounds. Zhou et al. [3] took an improved Ratio operator [4] with horizontal orientation to extract power lines and then group and fit the power line segments. Since the experimental object of this literature is mainly for power line segmentation in horizontal distribution scenarios, it has a certain specificity. At the same time, the Ratio operator is susceptible to complex backgrounds with large variations in pixel gray values, especially for areas with relatively flat gray values, which are not as effective as the normal operator. Zhou et al. [5] perform transmission line segmentation in complex backgrounds by proposing a detection operator based on local contextual information. Compared with the literature 4 comprehensive optimization of power lines under a variety of angle changes, mainly considering the horizontal, vertical, and diagonal distribution of transmission lines, with a certain degree of algorithmic stability. Some studies are also based on Hough transform [6] for transmission line detection [7,8]. Shan et al. [9] design auxiliary devices for the segmentation of transmission lines and the method does not have a universal. In summary, since this type of algorithm does not introduce any prior knowledge and the algorithm model does not need to prepare a large number of samples for training in advance, it has the advantage of a low sample size requirement due to its less restrictive way of data collection. In addition, the power lines extracted using the Hough transform tend to lose the width information [10]. Both edge detection-based power line extraction algorithms and power line extraction algorithms with a priori knowledge share a common challenge: it is difficult to adaptively adjust the model parameters to maintain the good performance of the algorithm in the scenario-changing test data. All these methods use artificially defined shallow features in constructing power line extraction models.
In this problem, deep learning models with their strong feature extraction capability are effectively used in the field of power systems. A variety of deep learning-based image classification, target recognition, image segmentation, and other power vision algorithms are rapidly developing [11,12,13,14,15,16]. Two power-line recognition algorithms based on VGG-19 [17] and ResNet-50 [18] in aerial images are proposed by Yetgin Ö E et al. [19]. However, this method can only determine whether the image contains power lines and does not achieve the segmentation and detection of power lines. The optimal model for detailed detection of power lines is the segmentation model and the classification model can only determine the presence or absence of power lines in the transmission line in the image. The target detection model can only be presented in the form of a rectangular box and when the transmission line spans the whole picture, the detection effect will occupy the whole picture with a rectangular box, which is not conducive to the accurate positioning of the transmission line and is likely to generate too much redundant information. In the segmentation of power lines for transmission lines. Yang et al. [20] designed to use VGG-16 as the feature extraction backbone of UNet and combine the attention mechanism based on global average pooling and global maximum pooling for UNet skipping connection layer information supplementation. Finally, the four decoding layers of UNet are fused as a whole to output the final segmentation features. Since the process involves the fusion of four different scale features, it can effectively reduce the loss of multi-scale feature information, but at the same time, it also brings an increase in computational effort. Han et al. [21] proposed a UNet segmentation model based on GhostNet as the backbone by optimizing and improving the model. For light-weighting, the model and the attention mechanism Shuffle Attention further optimize the detection accuracy of the model, achieving effective segmentation of power lines. However, the actual test speed in the article is still low, mainly because the decoder part of the segmentation network still has a large amount of computation. In segmentation studies targeting complex backgrounds, Xu et al. [22] also use VGG-16 as the feature extraction backbone to construct an improved UNet-based powerline segmentation network. In this study, a multi-level feature aggregation module is adapted to detect power lines at different pixel widths and orientations. That is, the two features after neighboring convolution are fused again for output, and the output features are then combined with the attention mechanism for semantic information enrichment and background noise suppression. The SPP (Spatial Pyramid Pooling) module is also combined with the perceptual field enhancement, Finally, the four features of the multiscale output are then fused for the overall output. Gao et al. [23] take proposed an efficient parallel branching network for real-time segmentation of overhead power lines. However, the data in these two literature studies are mainly processed by cropping the images at large resolutions and turning them into small-resolution images. From a complex background at a large resolution to a single background at a small resolution, the whole picture consists only of power lines and some of the power lines’ attached power equipment. Choi et al. [24] propose a fusion of visible and infrared images of power lines for UNet model-based segmentation detection. The fusion method based on the channel attention mechanism is adopted to achieve the fusion of infrared images and visible images. This achieves effective segmentation of transmission lines in complex contexts by aiding the segmentation of power lines with the help of data from homomodal heterogeneous sources. However, by the above directions of model optimization for complex backgrounds, more pre-processing must take place, and the models cannot be directly used for actual detection scenarios.
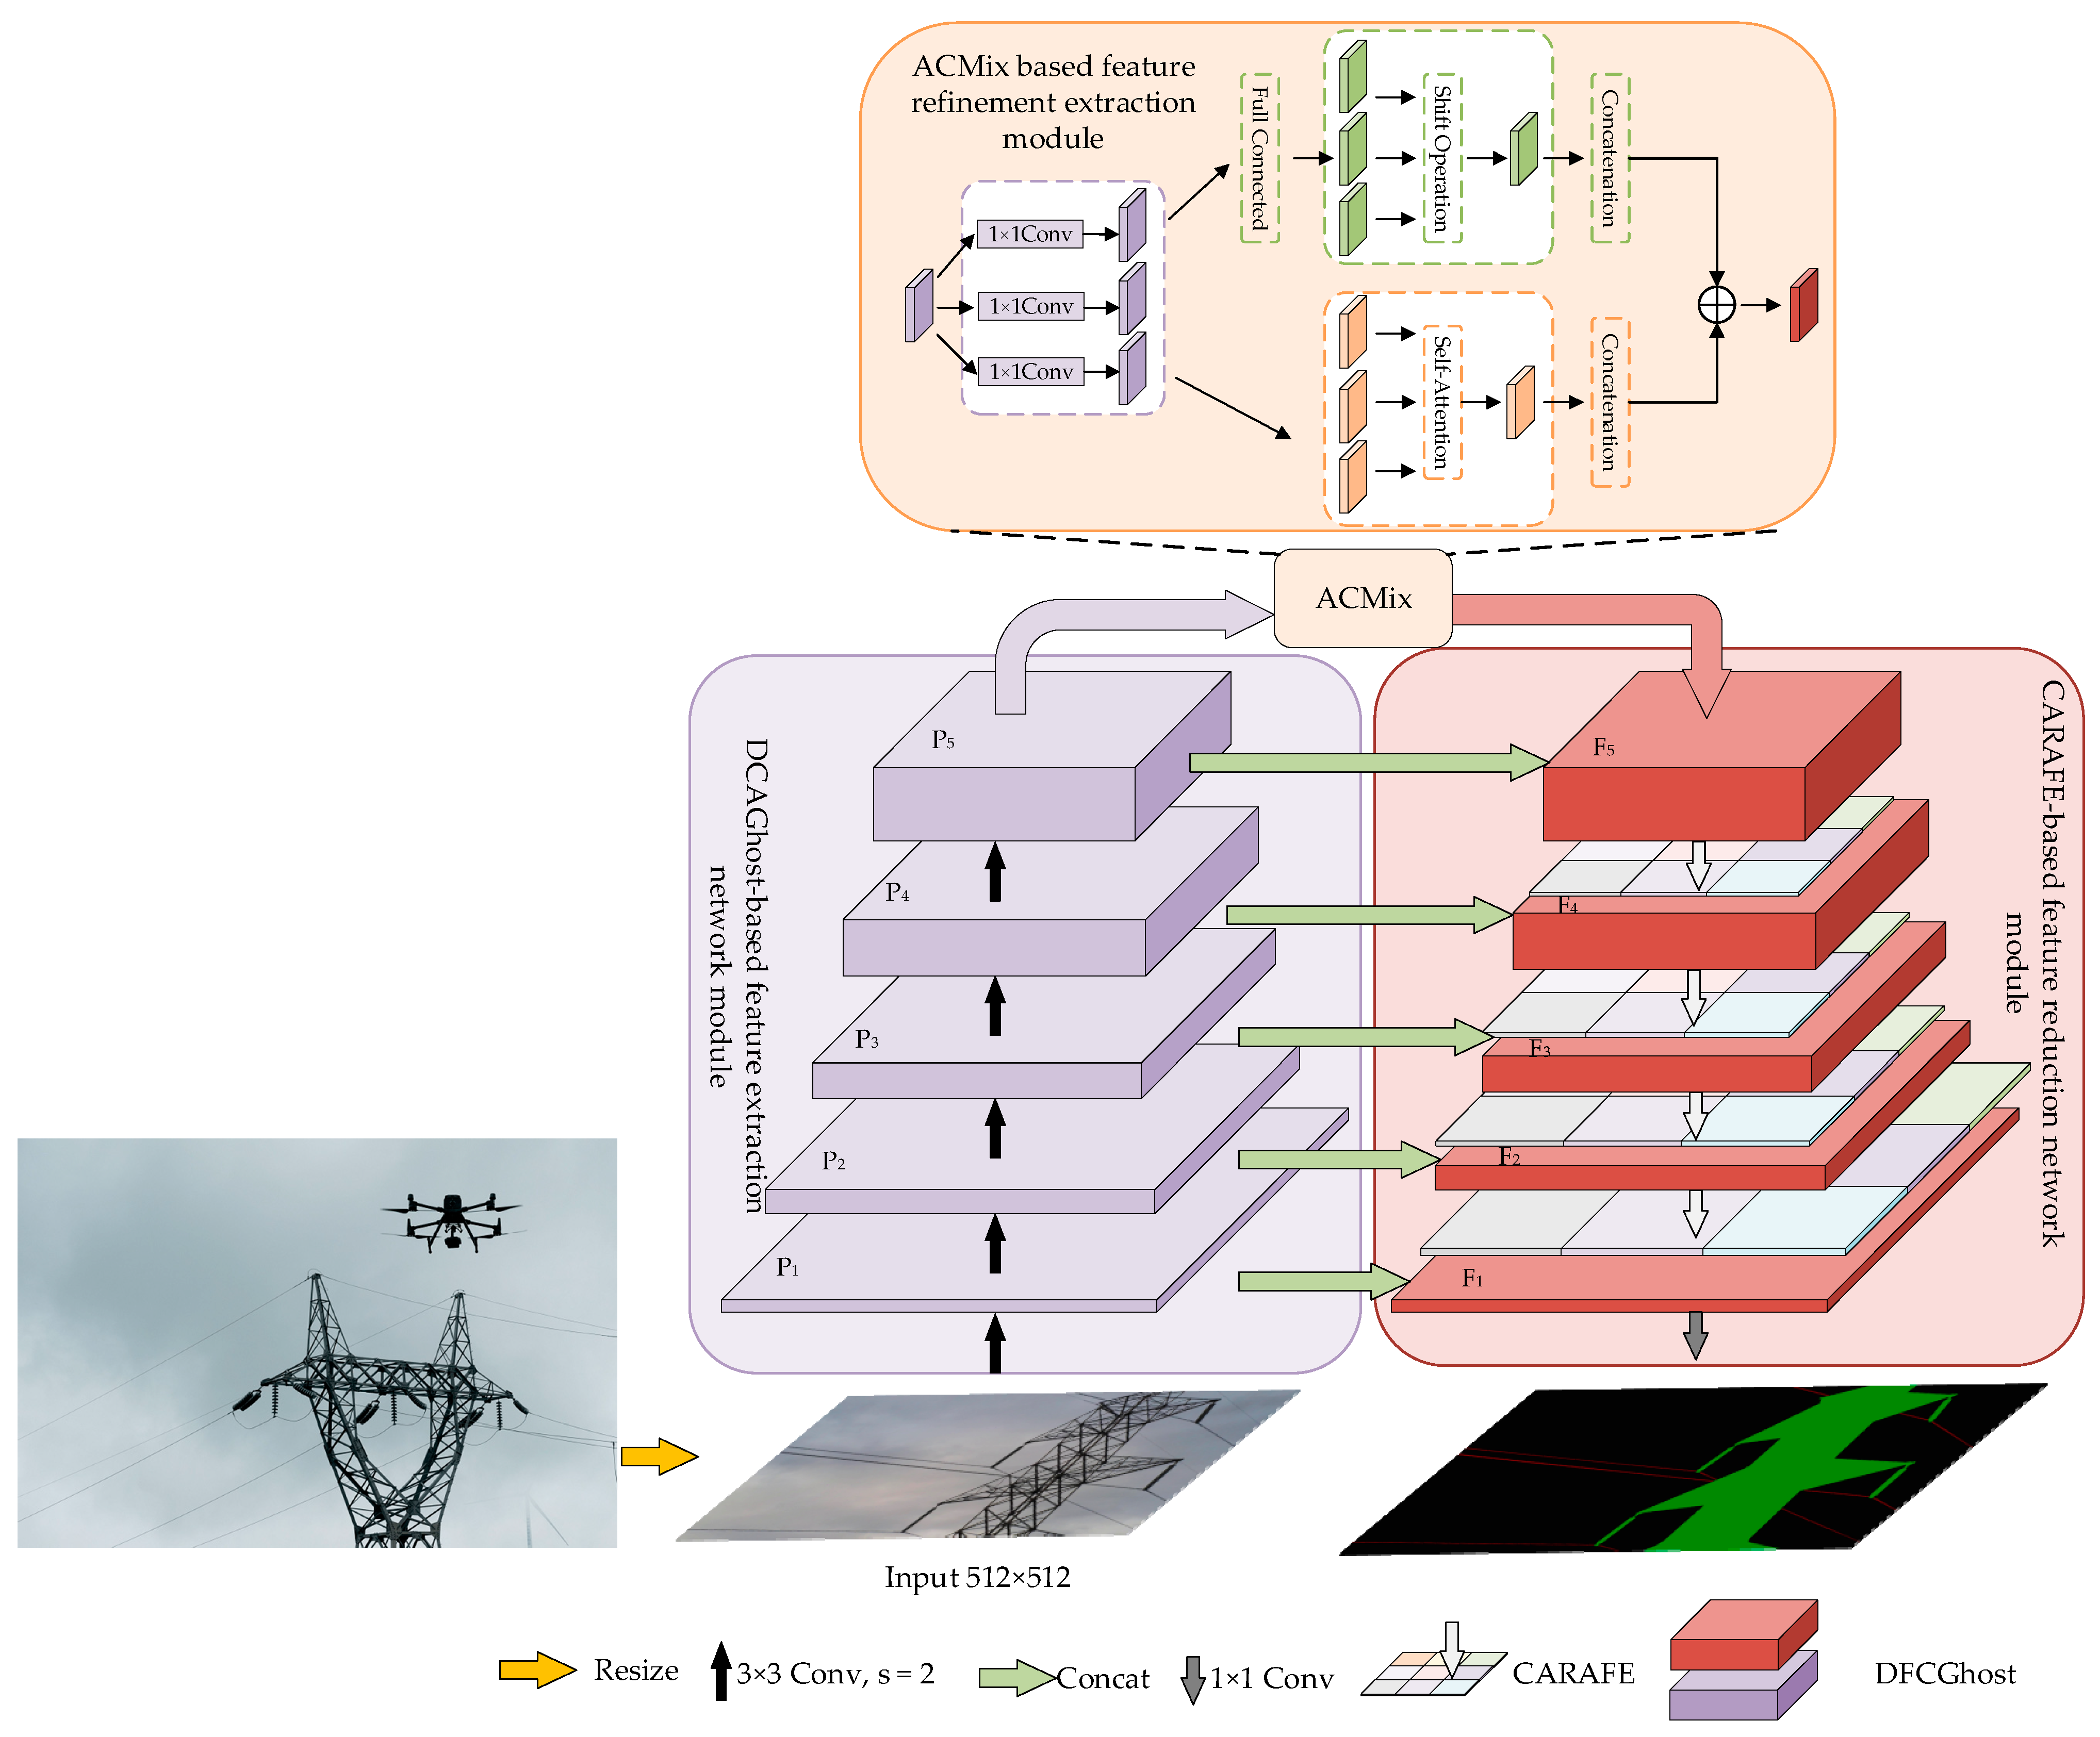
Based on the above problem analysis, this paper proposes a lightweight real-time semantic segmentation network. The network adopts a structure that combines local feature refinement and global receptive field enhancement to effectively solve the problem of power line segmentation in complex backgrounds. Considering the characteristics of power lines, an up-sampling algorithm that combines adjacent pixel information is designed to achieve detailed segmentation of power lines and power poles. In detail, the innovations of this paper are as follows:
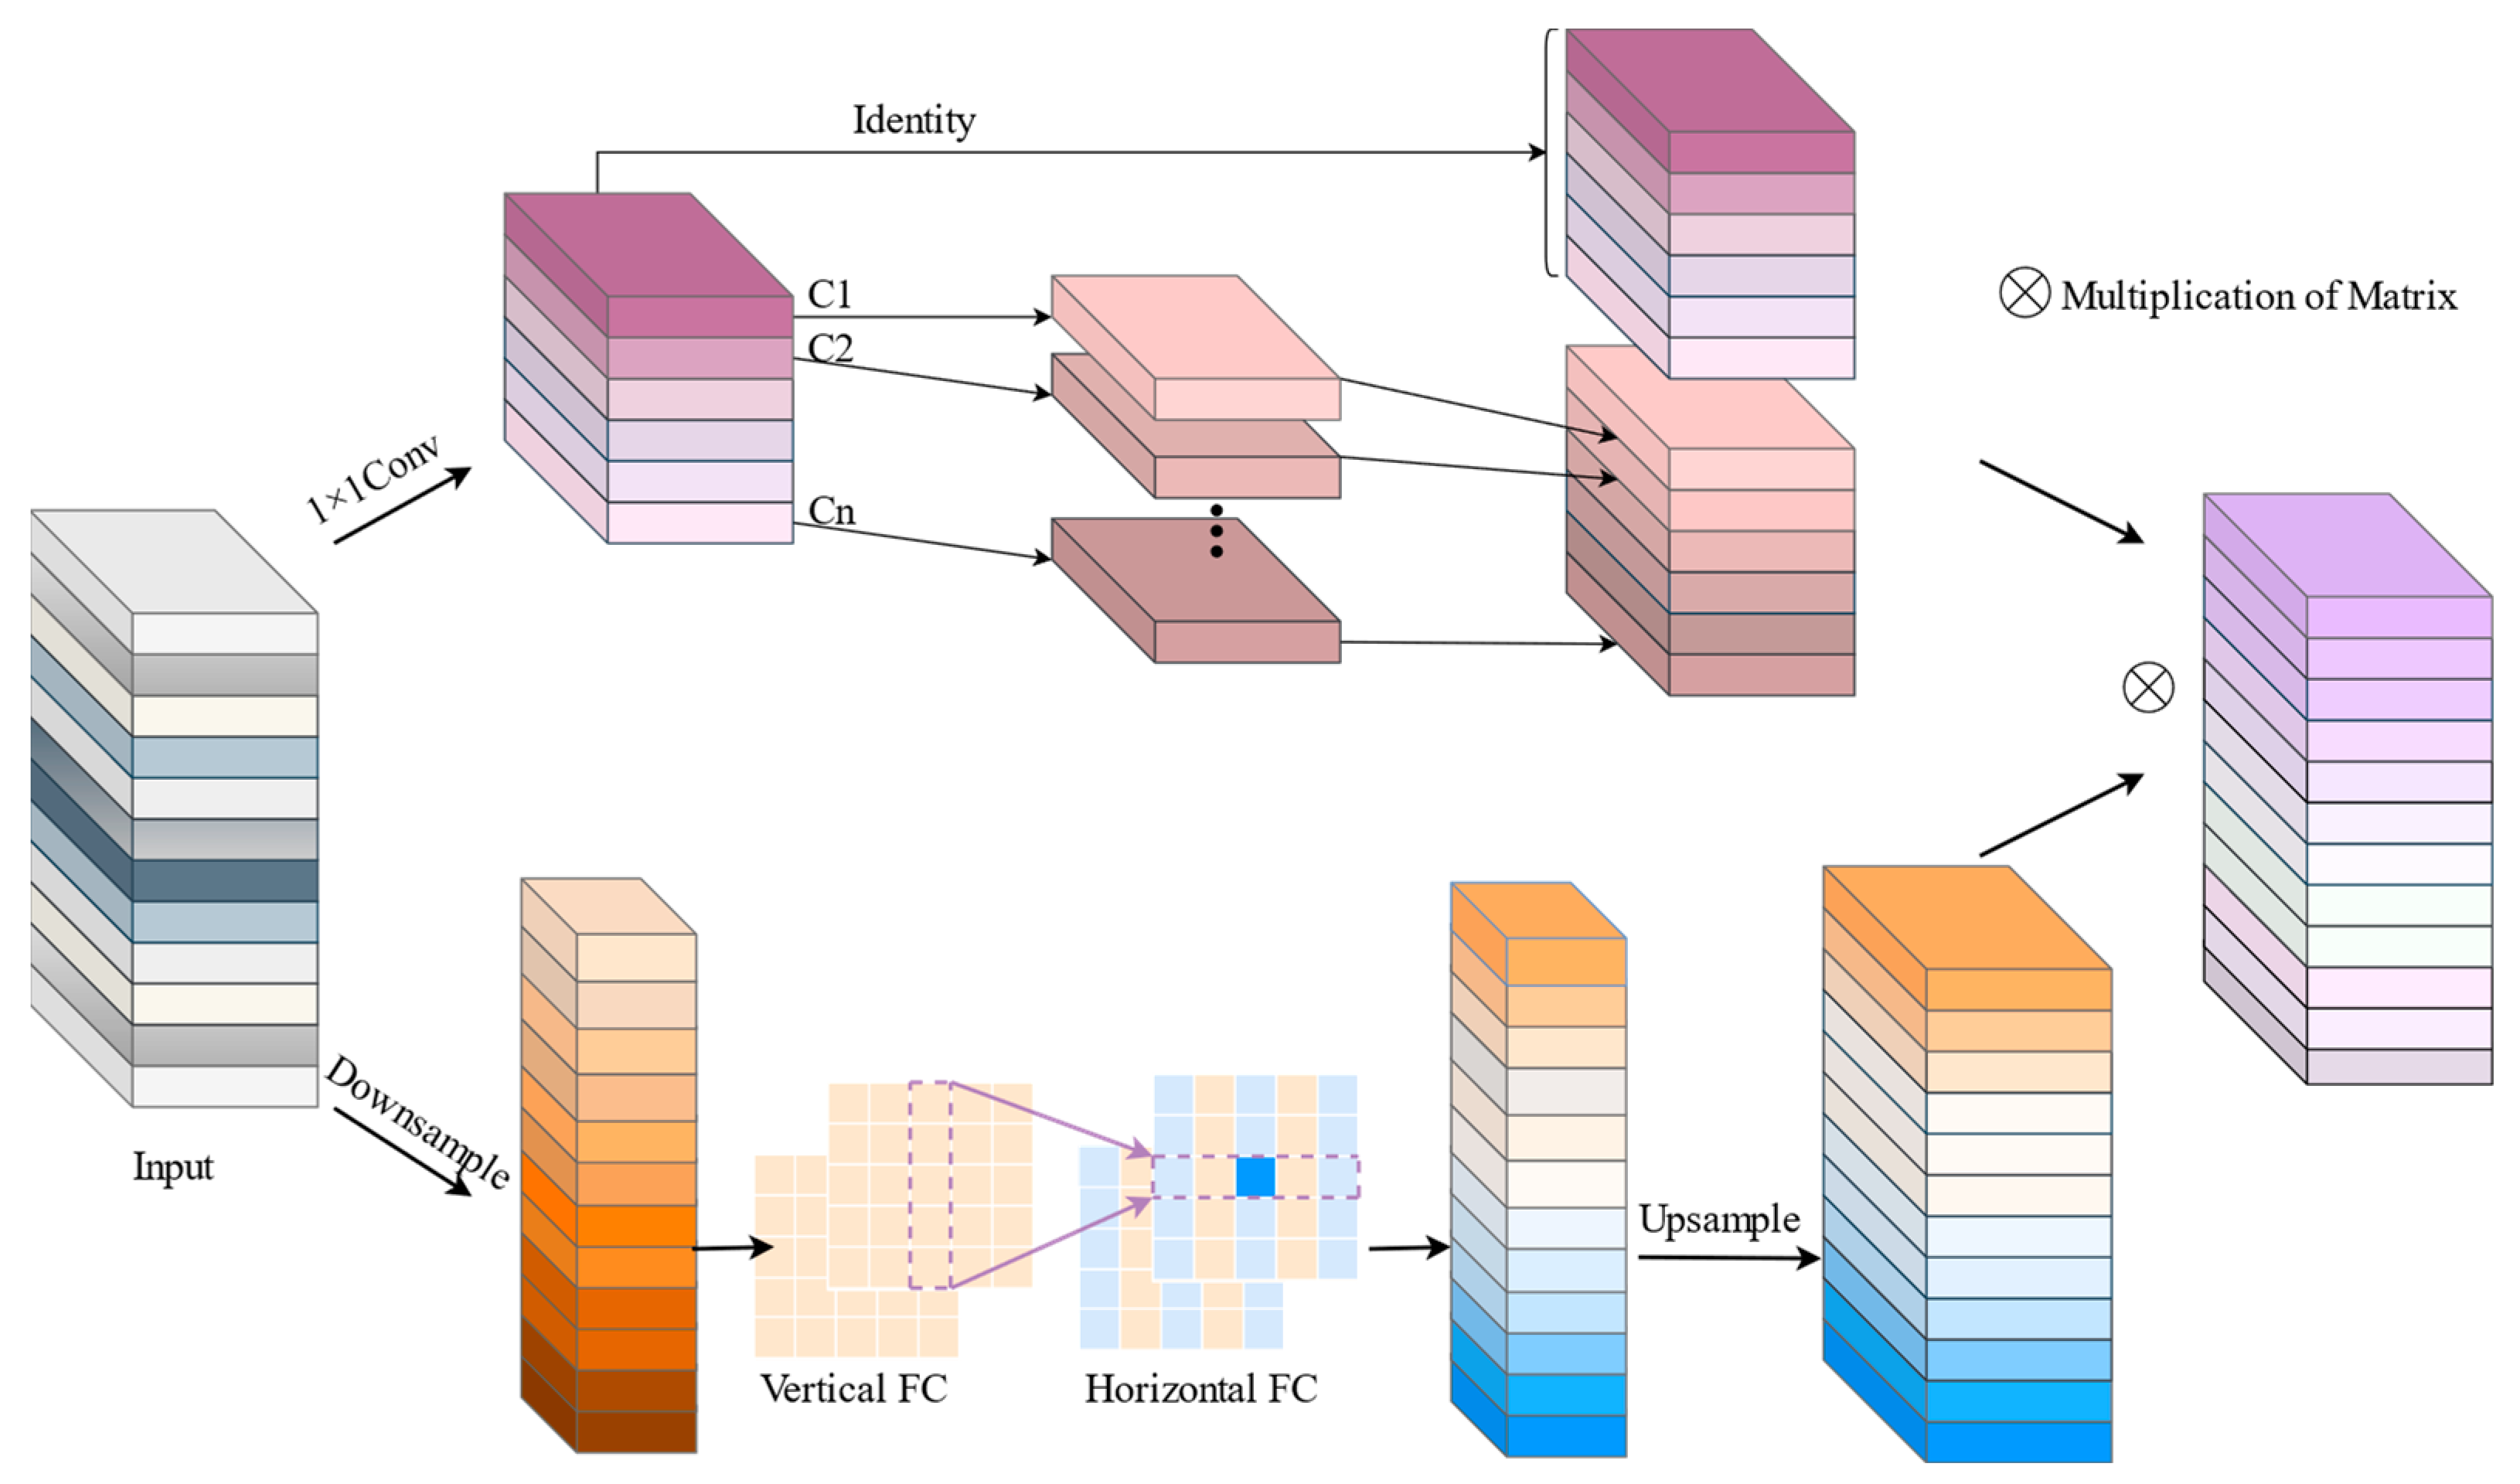
(1) To effectively extract features from power lines and towers, a lightweight DFC-GhostNet feature extraction module has been designed and incorporated into the backbone feature extraction network. Since both power lines and towers have long-range target features, the design divides the symmetric convolutional kernel into two modules: horizontal-based perceptual field enhancement and vertical-based perceptual field enhancement, based on the lightweight GhostNet architecture. This is intended to enable effective target identification and feature extraction.
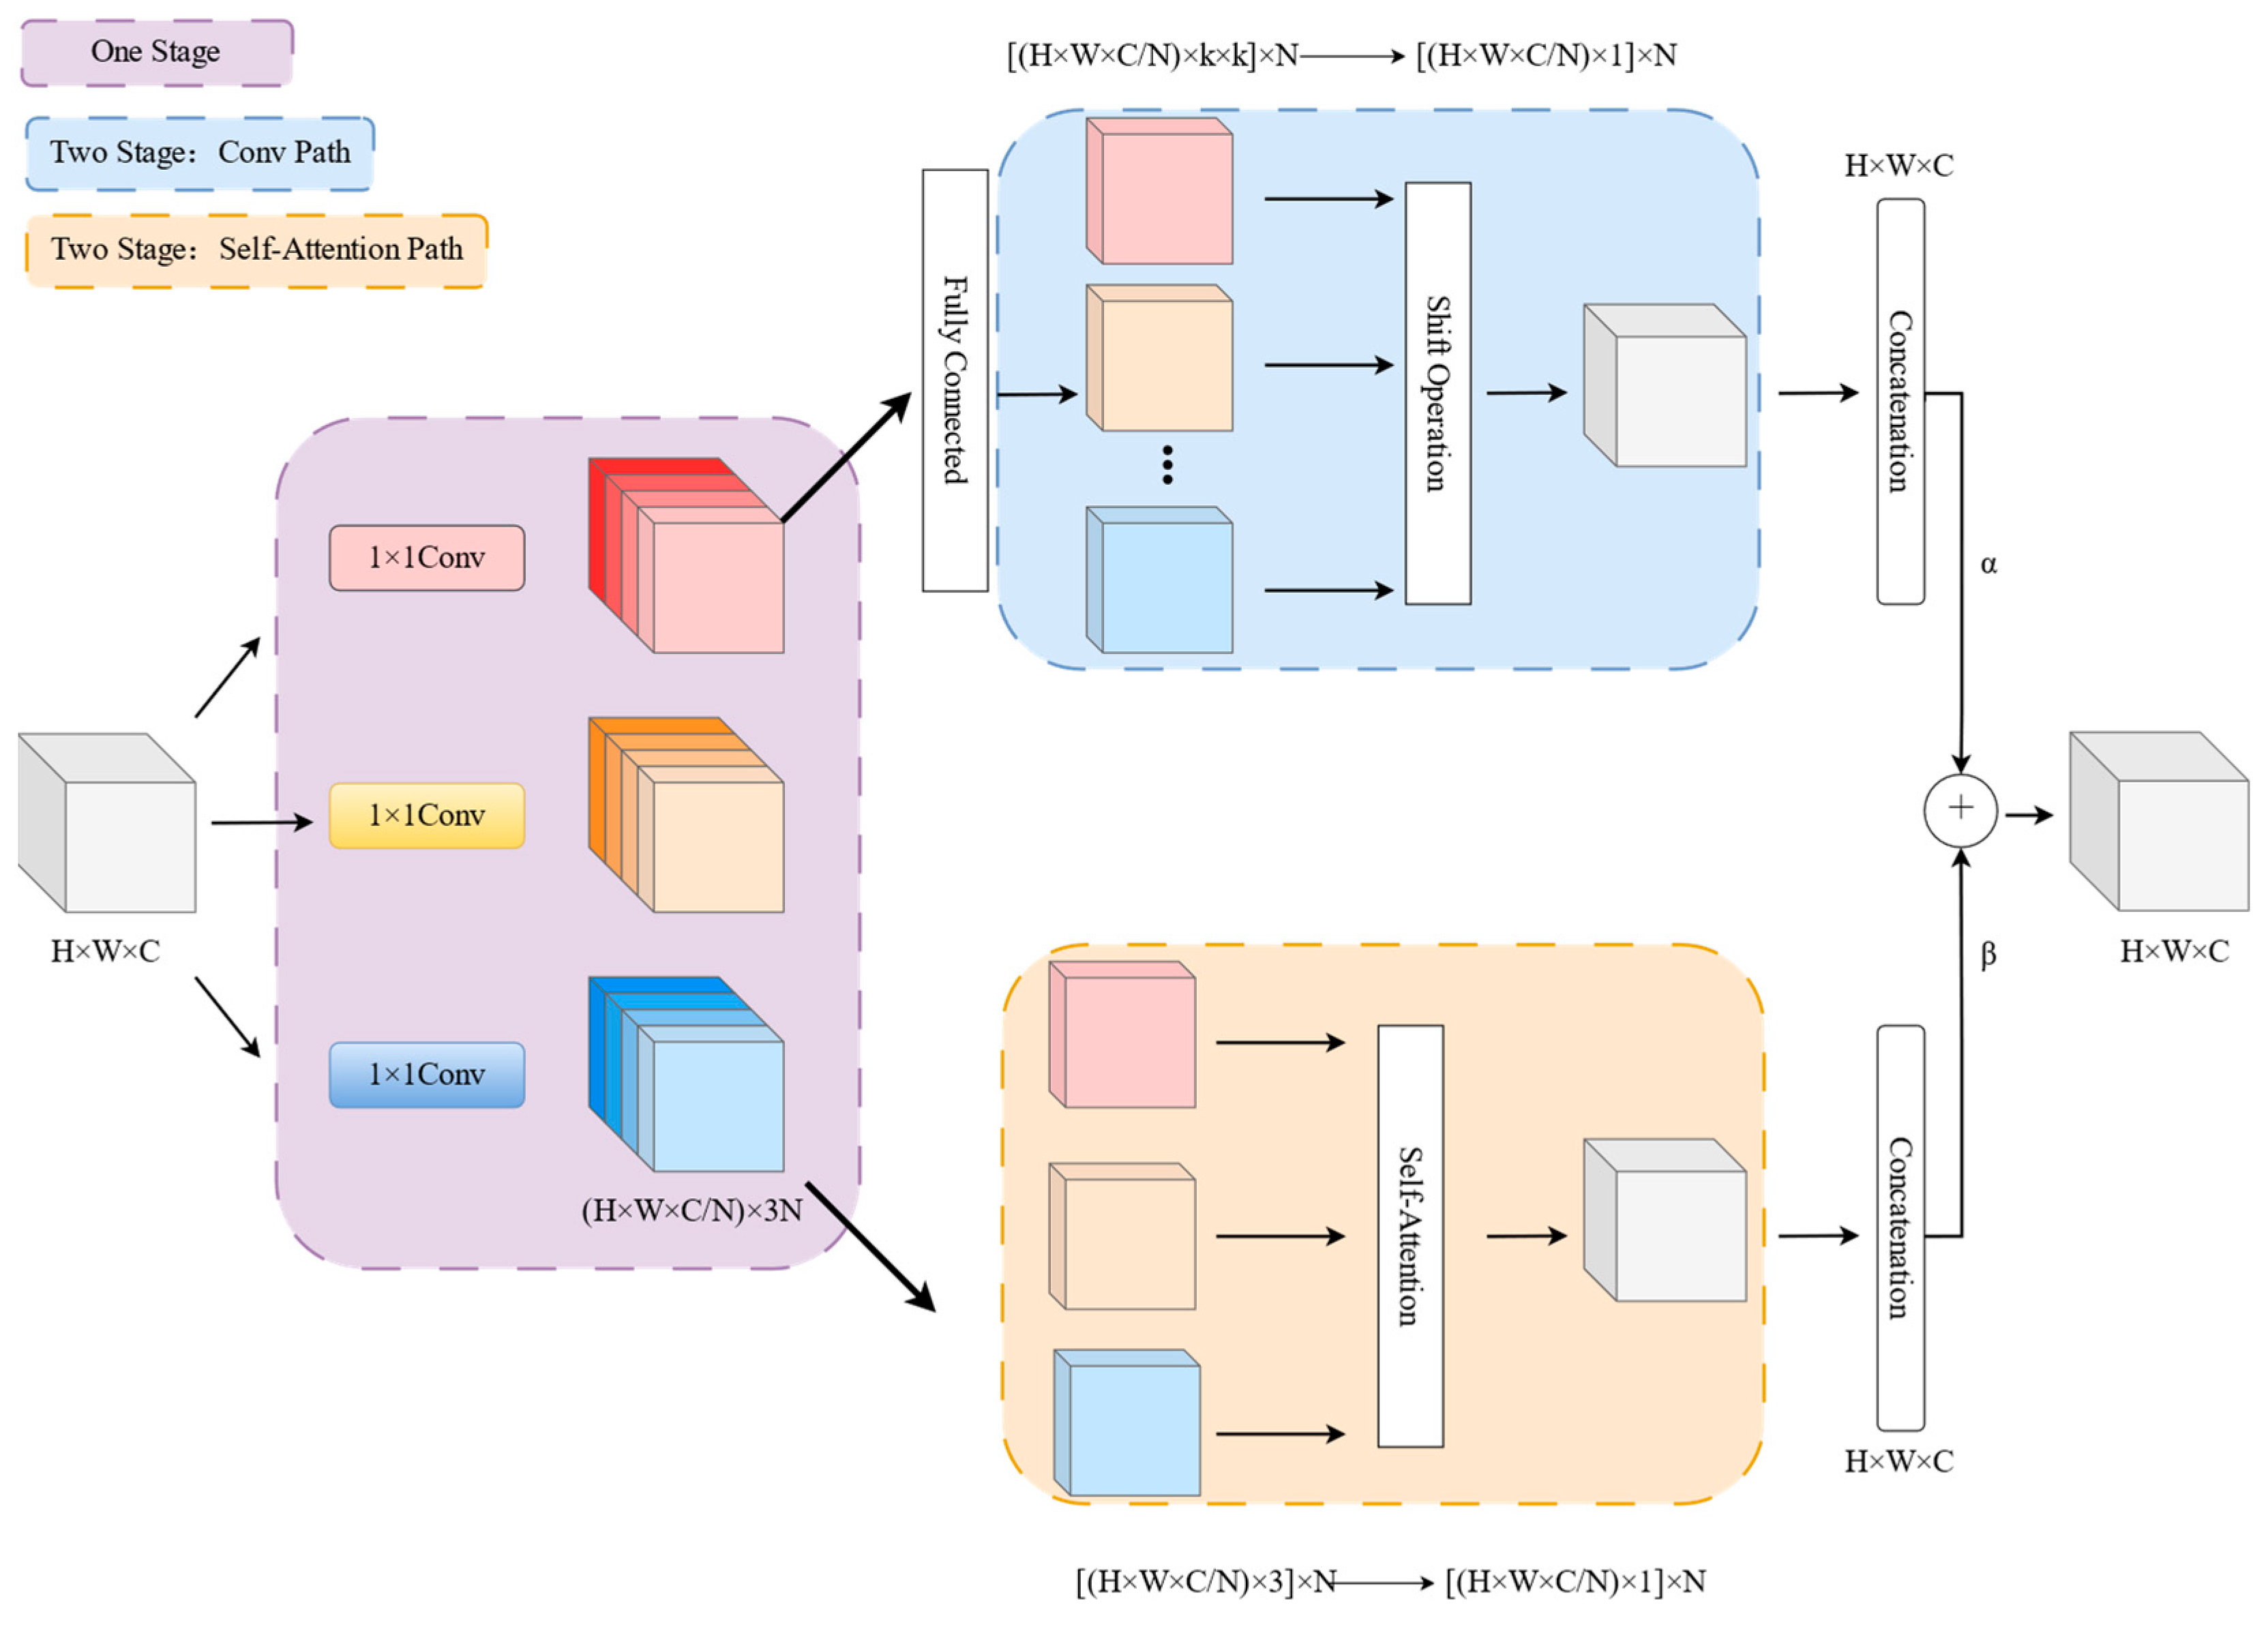
(2) The refinement module of features is designed from the perspective of power line and pole tower feature refinement, combining a convolutional module with local sensory fields and a transformer module with global sensory in deep semantic features to refine target feature areas in complex backgrounds.
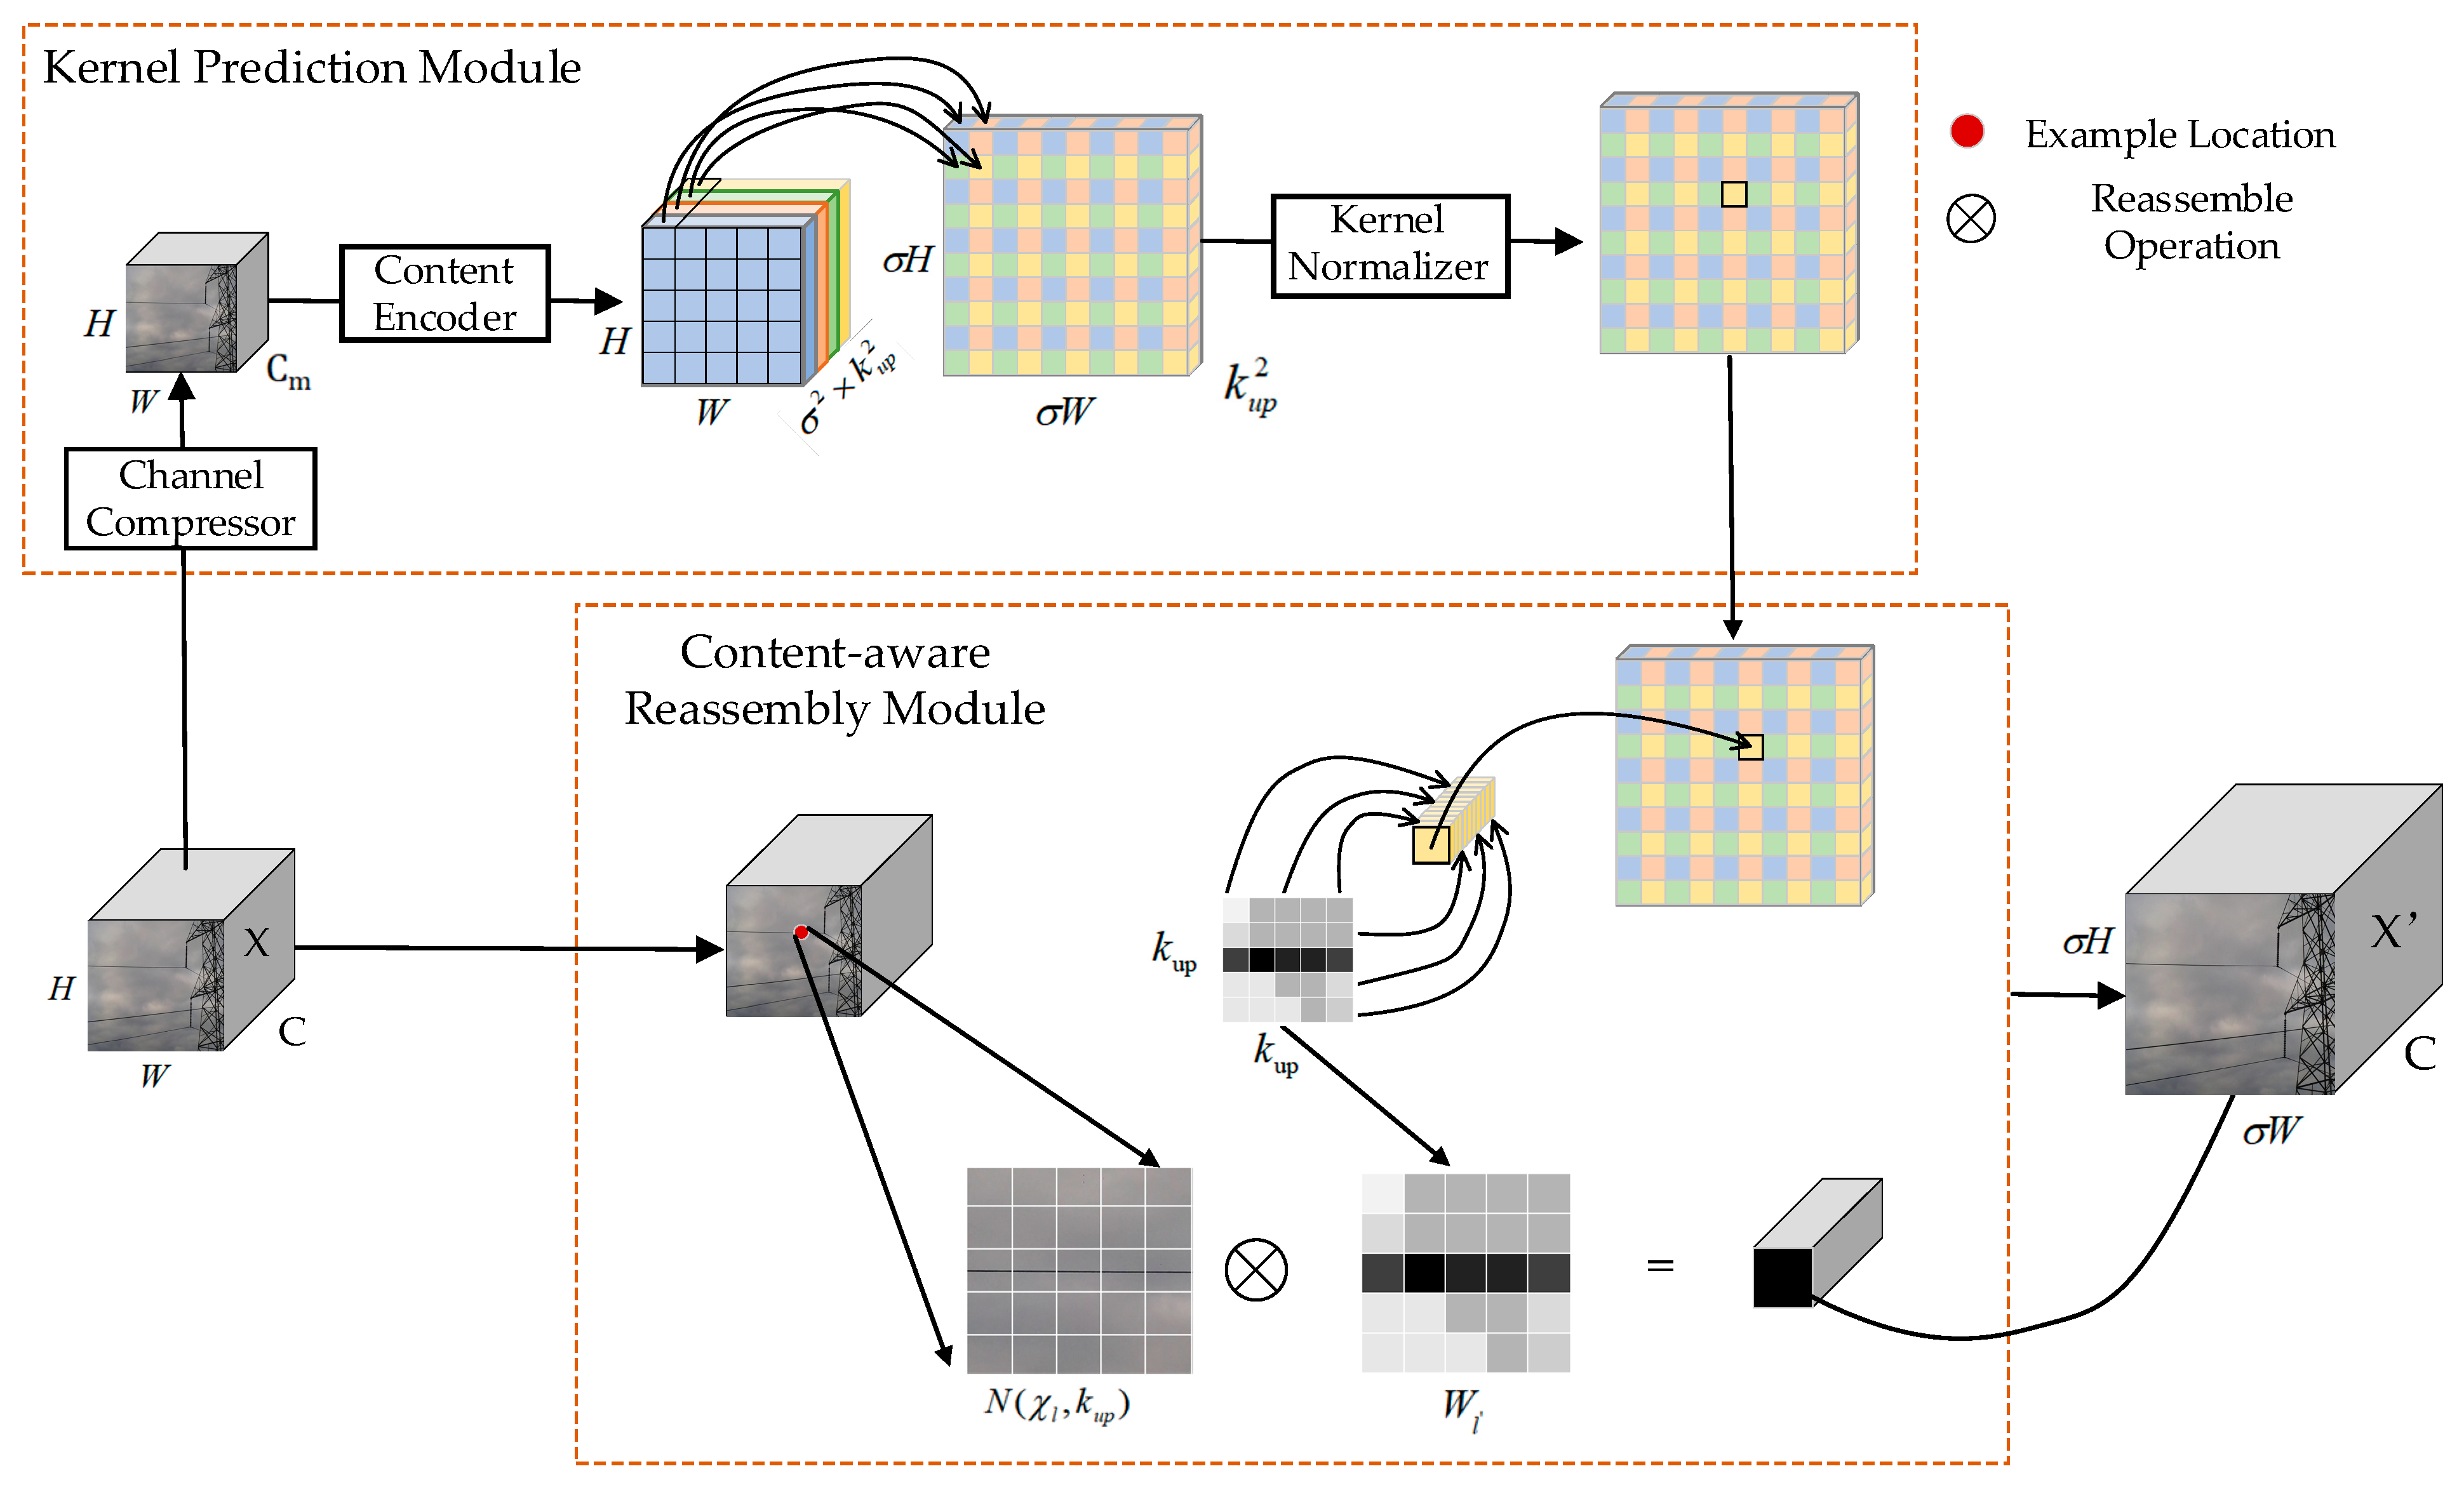
(3) In the process of feature image restoration from low resolution to high resolution, i.e., the decoder part of the semantic segmentation model. Traditional upsampling only considers the information distribution of sub-pixel points and without consider the semantic information of the entire feature map, which leads to the loss of feature map information, and the deconvolution leads to the increase of computation or even Checkerboard Artifacts, which affects the performance of the model. Therefore, a content-aware feature recombination module is designed. This module is mainly to construct a learnable upsampling operator for each pixel in low resolution to learn the distribution of image features. This paper aims to realize upsampling based on input content to improve the feature decoding effect of the final output layer.

2. Materials and Methods

2.1. Dataset Introduction

The dataset used in this paper is derived from publicly available data, where this dataset recorded videos collected by a UAV, Parrot-ANAFI, in two different states in the USA to guarantee the varieties of the scenes. The locations are randomly selected without any intentions or treatments to avoid noisy backgrounds. The UAV contains a 4K HDR camera and up to 2.8× lossless zoom. Zooming is exploited when collecting the video data to guarantee the high resolution of the objects without manual cropping. The dataset is extracted from a set of 80 videos. All aerial videos have a resolution of 3840 × 2160 with 30 fps. Different views were taken during data acquisition, including the front view, top view, and side view. This was mainly used to ensure that the deep learning model can detect the target from any angle [25]. The specific data are shown in Figure 1.
The dataset has a total of 1240 sample images; each image contains two categories of power transmission lines and power towers, corresponding to the Cable and Tower in the label, respectively. Since the distribution of targets in the image is different, the number of targets cannot be calculated by the number of image sheets, so the distribution of the number of pixel points is taken for comparison. The distribution of various types of target pixel points in this dataset is shown in Table 1. The Labelme software was used to annotate the sample images to produce the dataset in COCO format [26].

2.2. Methods

2.2.1. Introduction of the UNet Model

UNet is a convolutional neural network for image segmentation, proposed in a paper by Olaf Ronneberger et al. in 2015, whose main idea is to combine the contextual and local information of an image to improve the segmentation accuracy [27]. The overall structure is shown in Figure 2.
The structure of UNet is divided into two parts: the encoding path and the decoding path. The encoding path is used to extract the features and the decoding path is used to map the features back to the dimensions of the input image. There are cross-layer connections between the encoding and decoding paths, and these cross-layer connections help retain high-resolution feature information. Specifically:
(1) The encoding path consists of a series of convolution, maximum pooling, and ReLU activation functions. It starts from the input image, downsamples the feature map each time, and doubles the number of channels of the feature map. The result of this process is the generation of a series of high-level feature representations that preserve the global and semantic information of the image. The expression of the Relu function is as in Equation (1). This function is mainly used for the feature nonlinearization process in the model.
f ( x ) = m a x ( 0 , x )
(2) The decoding path also consists of a series of convolutional and ReLU activation functions. It starts at the last layer of the encoding path, doubles the resolution of the feature map, and halves the number of channels each time. In the decoding path, each layer is stitched with the feature map of the corresponding layer in the encoding path to preserve the high-resolution feature information. The final output feature map size is equal to the input image size.
(3) Cross-layer connections are a key part of UNet. They connect the feature maps between the encoding path and the decoding path so that each layer in the decoding path can utilize the high-level feature representation of the corresponding layer in the encoding path. This helps to retain more contextual and semantic information, thus improving segmentation accuracy.

2.2.2. Comparison of Base Models

In this paper, after studying and researching the UNet model, we also compare the existing semantic segmentation algorithms with the UNet model, such as ResUnet [28], ENet [29], PSPNet [30], Deeplabv3+ [31], HRNetv2 [32] and SegFormer [33] models, and designed multiple groups of baseline semantic segmentation detection models for comparison of segmentation experimental results; in the comparison of the segmentation results we took the following experimental index as the accuracy index of the model.
(1)
mPrecision
m P r e c i s i o n = T P N × ( T P + F P )
TP (True Positive) denotes positive samples correctly classified and FP (False Positive) denotes negative samples incorrectly classified. N denotes the number of categories of segmentation. Precision indicates the fraction of classes that are considered positive by the classifier and are indeed positive as a percentage of the classes considered positive by the classifier. Since it is a multi-category segmentation, the value of the mean Precision is taken as mPrecision.
(2)
mRecall
m R e c a l l = T P N × ( T P + F N )
FN (False Negative) denotes the misclassified positive sample. Recall indicates the fraction of classes that the classifier considers to be positive and are indeed positive as a percentage of all classes that are indeed positive. Since it is a multi-category segmentation, the value of the mean Recall is taken as mRecall.
(3)
mPA
m P A = 1 N i = 0 N p i i j = 0 N p i j
mPA is the category mean pixel accuracy. where i denotes the true value and j denotes the predicted value. pii denotes the prediction of i to i. pij denotes the prediction of i to j. The overall view is to calculate the proportion of correctly classified pixel points to all true categories, which is the same as the calculation principle of mRecall. In addition, the subsequent experimental results show that the values are the same for both.
(4)
mIOU
m I O U = T P N × ( F P + F N + T P )
mIOU (mean Intersection over Union) is the classification of the mean intersection ratio. That is the mean value under the intersection of the total true label and the predicted value and the ratio.
(5)
mDice
m D i c e = 2 × P r e c i s i o n × R e c a l l N × ( P r e c i s i o n + R e c a l l ) = 2 × T P N × ( F P + 2 × T P + F N )
mDice (mean Dice similarity coefficient) is another form of expression for the Intersection over Union. It represents the overlapping similarity between the segmentation result and the true result.
Each experimental metric is taken from the mean segmentation effect of the two segmentation objects of power lines and power poles. The experimental results are shown in Table 2:
(1) From the perspective of detection accuracy, the UNet network has the highest detection accuracy among similar models, but still has poor segmentation of transmission lines in some complex scenes. As shown in Figure 3. Figure 3a shows the transmission line in the background of trees and houses. Figure 3c shows the segmentation experiment with the sky in the background. The experimental results show that there are obvious problems of incorrect segmentation and omitted segmentation in test Figure 3b (marked by the blue area in the figure). For simple background transmission, line segmentation presents better results, as shown in Figure 3d.
(2) From the perspective of detection speed: E-Net model has the smallest number of model parameters and computational effort. It can also be found that despite the small number of parameters of ResUNet, its GFLOPs value is very large. The main reason is that its structure has a large number of residual branches. The UNet model also has large parameters and GFLOPs. To better apply the model-to-edge applications, it is necessary to improve the light weighting of the UNet model and further improve the detection accuracy.

2.2.3. Feature Extraction Module Based on DFC-GhostNet

In computer vision, the architecture of deep neural networks plays a crucial role in various tasks. To better apply the model to mobile applications, it is necessary to consider not only the performance of the model, but also its computational efficiency, especially the actual inference speed. VGG-16 is mainly adopted as the backbone feature extraction network in more UNet model studies. While VGG-16 mainly takes 3 × 3 convolution for stacking, 3 × 3 convolution has a larger model computation. Based on this problem, another solution is to replace the original 3 × 3 convolution with a depth-separable convolution, such as MobileNetv3 [34], GhostNet [35], EfficientNet [36], ShuffleNet [37], etc. In the depth-separable convolution, the input feature maps (H × W × C) are first grouped by channel dimension, which is conducive to the dispersion of channels and the reduction of model computation. Here is a comparison of the computational effort with the original convolution.
Suppose the input feature map size is H × W × c1. The size of the convolution kernel is h1 × w1 × c2. The output feature size is H × W × c2. If the depth-separable convolution is taken for feature extraction, then the number of parameters of the model will be reduced by a factor of g, where g is the number of groups split by the group convolution for the feature channel. The comparison of their computational effort is as follows:
p C o n v = ( h 1 × w 1 × c 1 ) × c 2
p G _ C o n v = ( h 1 × w 1 × c 1 g ) × c 2 g × g = ( h 1 × w 1 × c 1 g ) × c 2
N = p C o n v p G _ C o n v = ( h 1 × w 1 × c 1 ) × c 2 ( h 1 × w 1 × c 1 g ) × c 2 = g
The above equation mainly describes the change in the covariate size of the model after taking the depth-separable convolution. Based on the above ideas, this paper first conducted different backbone comparison experiments under depth-separable convolution based on the experimental results in Table 3.
From the above experiments:
(1) In terms of model size and inference speed, the backbone under depth-separable convolution has a significant increase in computation and inference speed compared to the original model. The GFLOPs based on GhostNet are only less than 16% of the original model. MobileNetv3 is only 35.8% of the original model in the calculation of the number of parameters. The optimized models are lower than the original model in terms of inference delay.
(2) In terms of detection accuracy indicators, the light-weighting network with the highest detection accuracy is based on the GhostNet backbone. An mIOU improvement of 3.71% is found compared to the original network segmentation, along with an mDice improvement of 2.57%, mPA improvement of 2.89%, mPrecision improvement of 2.94%, and an mRecall improvement of 2.89%.
(3) In general, The UNet model based on GhostNet backbone has a significant advantage in detection accuracy compared to similar Light-weighting models with depth-separable convolution. Therefore, the subsequent adoption of the design of a light-weighting backbone model based on GhostNet should be prepared. Since the above experiments only changed the backbone encoding structure to GhostNet structure, subsequent experiments will adopt the same structure of GhostConv for feature extraction for the whole decoder, which is used to further reduce the computation of the model.
One of the main GhostNet models taken by the Ghost module is shown in Figure 4. First, the input features are compressed by the 1 × 1 convolution of the channels. Then take the residuals to construct the feature extraction method, where the upper branch takes a constant mapping of the residual branch to retain the original information. The lower branch takes a 3 × 3 depth-separable convolution and convolves the features in groups based on the number of channels. Finally, the two are connected based on Concat to complete the feature extraction. The above structure forms a Ghost unit and the whole network relies on the Ghost unit to form.
Since the segmented objects in this paper are power lines and power towers, where the power lines are mainly thin and long targets, and the distribution area is not central in the image, but the data across the whole image, it is necessary to further optimize the backbone feature extraction by combining the characteristics of the segmented targets. Thus, Ghost convolution was considered for modeling based on long-range perceptual field enhancement.
In the study of attention mechanism, the channel-based attention mechanism can effectively explore the correlation between channels and at the same time adopt the fully connected way to combine the global feature map with the weight matrix, which can effectively enhance the weight of the target channels and suppress the proportion of invalid channels. The direct use of FC layers will bring about an increase in computation, so the design decomposes the original FC layers into feature extraction based on the horizontal and vertical directions so that the two FC layers model long-distance spatial information along their respective directions and finally combine the two FC layers to obtain the global perception field [38]. The structure is shown in Figure 5.
The overall calculation process is shown in Equation (10).
Y = X * F 1 × 1 Y = C o n c a t ( [ Y , Y * F d p ] ) A = U P ( C o n v 1 × 5 ( C o n v 5 × 1 ( D o w n ( X ) ) ) ) O = S i g m i o d ( A ) Y
The formula is mainly described as the building block for the GhostNet convolution, where X represents the features of the input, F1×1 represents 1 × 1 convolution, Y’ Represents the feature output after 1 × 1 convolution, Fdp is the depth-wise convolutional filter, and Y is the out feature of GhostNet. A is the attention mechanism branch, and the last O is the output weighted by the attention mechanism, where Sigmoid is the activation function.
The features modeled by the global perceptual field are fused with the original Ghost module features to effectively compensate for the loss of the global perceptual field of the original lightweight network, which results in less accurate transmission line segmentation.

2.2.4. Complex Background Feature Refinement Module Based on ACmix

Since power line targets in transmission lines are more subtle than tower targets, the model requires higher detail feature extraction in the recognition of power lines. A larger proportion of complex backgrounds are more likely to be blended into small target pixels at long distances. The reasonable use of attention mechanisms facilitates feature extraction networks to focus on target regions, learning the distribution pattern from the features, recalibrating them, and focusing on the position so that the segmentation model can capture the key information more efficiently and improve the segmentation ability of the model. The hybrid self-attentive and convolutional module ACMix(Mixed self-Attention Convolution) proposed in the literature [39] effectively combines the advantages of traditional convolutional and self-attentive modules. The Former leverages an aggregation function over a localized receptive field according to the convolution filter weights, which are shared in the whole feature map. The intrinsic characteristics impose crucial inductive biases for image processing. Comparably, the self-attention module applies a weighted average operation based on the context of input features, where the attention weights are computed dynamically via a similarity function between related pixel pairs. The flexibility enables the attention module to focus on different regions adaptively and capture more informative features and further distinguish the background from the detection target [39].
The ACmix structure is shown in Figure 6, which consists of two main phases:
(1) The feature learning stage. The input features are projected by three 1 × 1 convolutions, and N feature fragments are reconstructed separately to obtain a rich intermediate feature set containing 3 × N feature maps to project features into a deeper space.
(2) The feature aggregation stage. The aggregation of information is performed according to both convolution and self-attentiveness and the features are aggregated mainly in terms of local and global information enhancement.
Specifically, for the convolutional path with a convolutional kernel size of k, a lightweight fully connected layer is first used to generate k2 feature maps, and new features are generated by shifting and aggregating to process the input features in a convolutional manner to collect information from the local sensory field.
For the self-attention path, ACmix collects intermediate features into N groups, each group contains three features, corresponding to three feature mappings as Q (Query), K (Key), and V (Value), following the self-attentive module approach to collect information. Suppose fij and gij denote the tensor corresponding to the input and output of the pixel. Nk(i, j) denotes the local pixel region with (i, j) as the center and spatial width k. Then, A ( W q ( l ) f i j , W k ( l ) f i j ) is the corresponding weight with respect to Nk(i, j), as shown in Equation (11):
A ( W q ( l ) f i j , W k ( l ) f a b ) = s o f t max N k ( i , j ) ( ( W q ( l ) f i j ) T ( W k ( l ) f a b ) d )
Equation (11) mainly describes the expression of the Transformer attention mechanism, where W q ( l ) and W k ( l ) are the projection matrices of Q and K. d is the characteristic dimension of W q ( l ) fij. Meanwhile, in ACmix the multi-head self-attention is divided into two phases, as shown in Equations (12) and (13):
q i j ( l ) = W q ( l ) f i j , k i j ( l ) = W k ( l ) f i j , v i j ( l ) = W v ( l ) f i j
g i j = | | N l = 1 ( a , b N k ( i , j ) A ( q i j ( l ) , k i j ( l ) , v i j ( l ) ) )
where W v ( l ) is the projection matrices of V, q i j ( l ) , k i j ( l ) , and v i j ( l ) are query, key, and value matrices respectively. || is a cascade of N attention head outputs. The weight matrix is calculated by Equation (12) and the weighted characteristic information is obtained by Equation (13).
Finally, the final output Fout of ACmix is obtained by summing the outputs of the two-second stage pathways with additional learnable scalars α and β, as shown in Equation (14).
F o u t = α F a t t + β F c o n v
Equation (14) describes the final features after taking the weighted fusion of self-attentive mechanism feature extraction and convolutional feature extraction. Fatt is the output of the self-attentive path and Fconv is the output of the convolutional path.

2.2.5. Feature Reconstruction Based on Contextual Neighborhood Pixel Information

Since the transmission line segmentation network also requires image restoration of the encoded features, the restored image is classified based on pixel points and the final set of classified pixel points is the final segmentation target. Therefore, the performance of the feature upsampling operator largely affects the continuity of pixel point segmentation. Currently, the nearest-neighbor sampling or bilinear interpolation sampling in the UpSample method is more commonly used. However, this method considers only sub-pixel domains. That is, image restoration by only some discrete feature pixels cannot capture the rich semantic information required for dense prediction tasks. Transmission lines in the power line object mainly across the characteristics of the map interval are large and the power tower is mainly a concentrated area. There is also a deconvolution operation, whose computational process mainly applies the same convolution kernel on the whole image for decoding the features without considering the correlation of the underlying feature content, which limits its responsiveness to local changes. Meanwhile, deconvolution is computationally intensive and prone to checkerboard artifacts. Based on the above two problems, this paper designs the CARAFE feature recombination operator for the restoration of features after depth encoding on transmission lines, and its structure is shown in Figure 7:
In Figure 7, CARAFE consists of two main modules, namely the kernel prediction module and the content-aware reassembly module [40]. One of the kernel prediction modules is constructed as follows:
(1) In the kernel prediction module, the features are first compressed using 1 × 1 convolution for channel-based compression. The main purpose is to reduce the computational effort of the subsequent steps.
(2) Build a content-aware upsampling-based kernel. This kernel is mainly used to perform feature reduction for each pixel point in the original feature map. Since the size of the original image is H × W × C, it takes δ × δ × k × k for each pixel point of any H × W (where δ is the upsampling multiplicity and k is the kernel size corresponding to each pixel point). Therefore, the total required prediction kernel size is δ × H × δ × W × k × k. So, for the encoding of the content, the feature channel obtained in the first step is taken to be transformed by 3 × 3 convolution into δ × δ × k × k. Finally, the upper sampling kernel of δ × H × δ × W × k × k is obtained.
(3) To improve the convergence of the model, the third step performs softmax-based normalization of the upsampling obtained in the second step so that the convolution kernel weights sum to 1.
Finally, a new feature recombination module is constructed by fusing the created upsampling kernel prediction module with the original features.

2.2.6. Improved UNet Algorithm Structure

In summary, the overall structure of the improved segmentation algorithm is shown in Figure 8. In this paper, we first propose to take the DFC-Ghost convolution block instead of the original convolution to extract the features of transmission line images, mainly by dividing the original FC layer into feature extraction based on the horizontal direction and vertical direction, it solves the problem of an excessive amount of model parameters on the one hand and improves the modeling ability of spatial information for long-distance semantic features on the other hand. Secondly, feature reuse is performed in the high semantic feature layer, and the hybrid attention structure built by the convolution module with local perceptual field enhancement and the Transformer module with global perceptual field enhancement is adopted for feature refinement to enhance model recognition in complex environments. Then, the decoder part also adopts DFC-Ghost convolutional block to extract features to ensure the light weighting of the model, while constructing a feature up-sampling structure based on convolutional kernel reorganization to effectively capture the neighboring pixel information for feature reduction. Finally, the output is segmented by 1 × 1 convolution for multi-category features. Meanwhile, the improved UNet model we have designed is used for transmission line segmentation. Therefore, we abbreviate the final fused improved model as TLSUNet.
Meanwhile, the overall computational flow of the method designed in this paper is shown in Figure 9. In the process, we mainly train the collected data for model input, and in the process of training, we perform model loss, optimization, updating of weight parameters, and testing of the model’s performance. Finally, the training is completed and the optimal result is saved. In the model generalization capability validation, data from the test set are selected for validation. On the one hand, the performance metrics of the model under the test set are obtained, and on the other hand, the analysis of the image detection speed and the visualization of the detection results are performed.

3. Experimental Results and Analysis

3.1. Experimental Environment and Setting

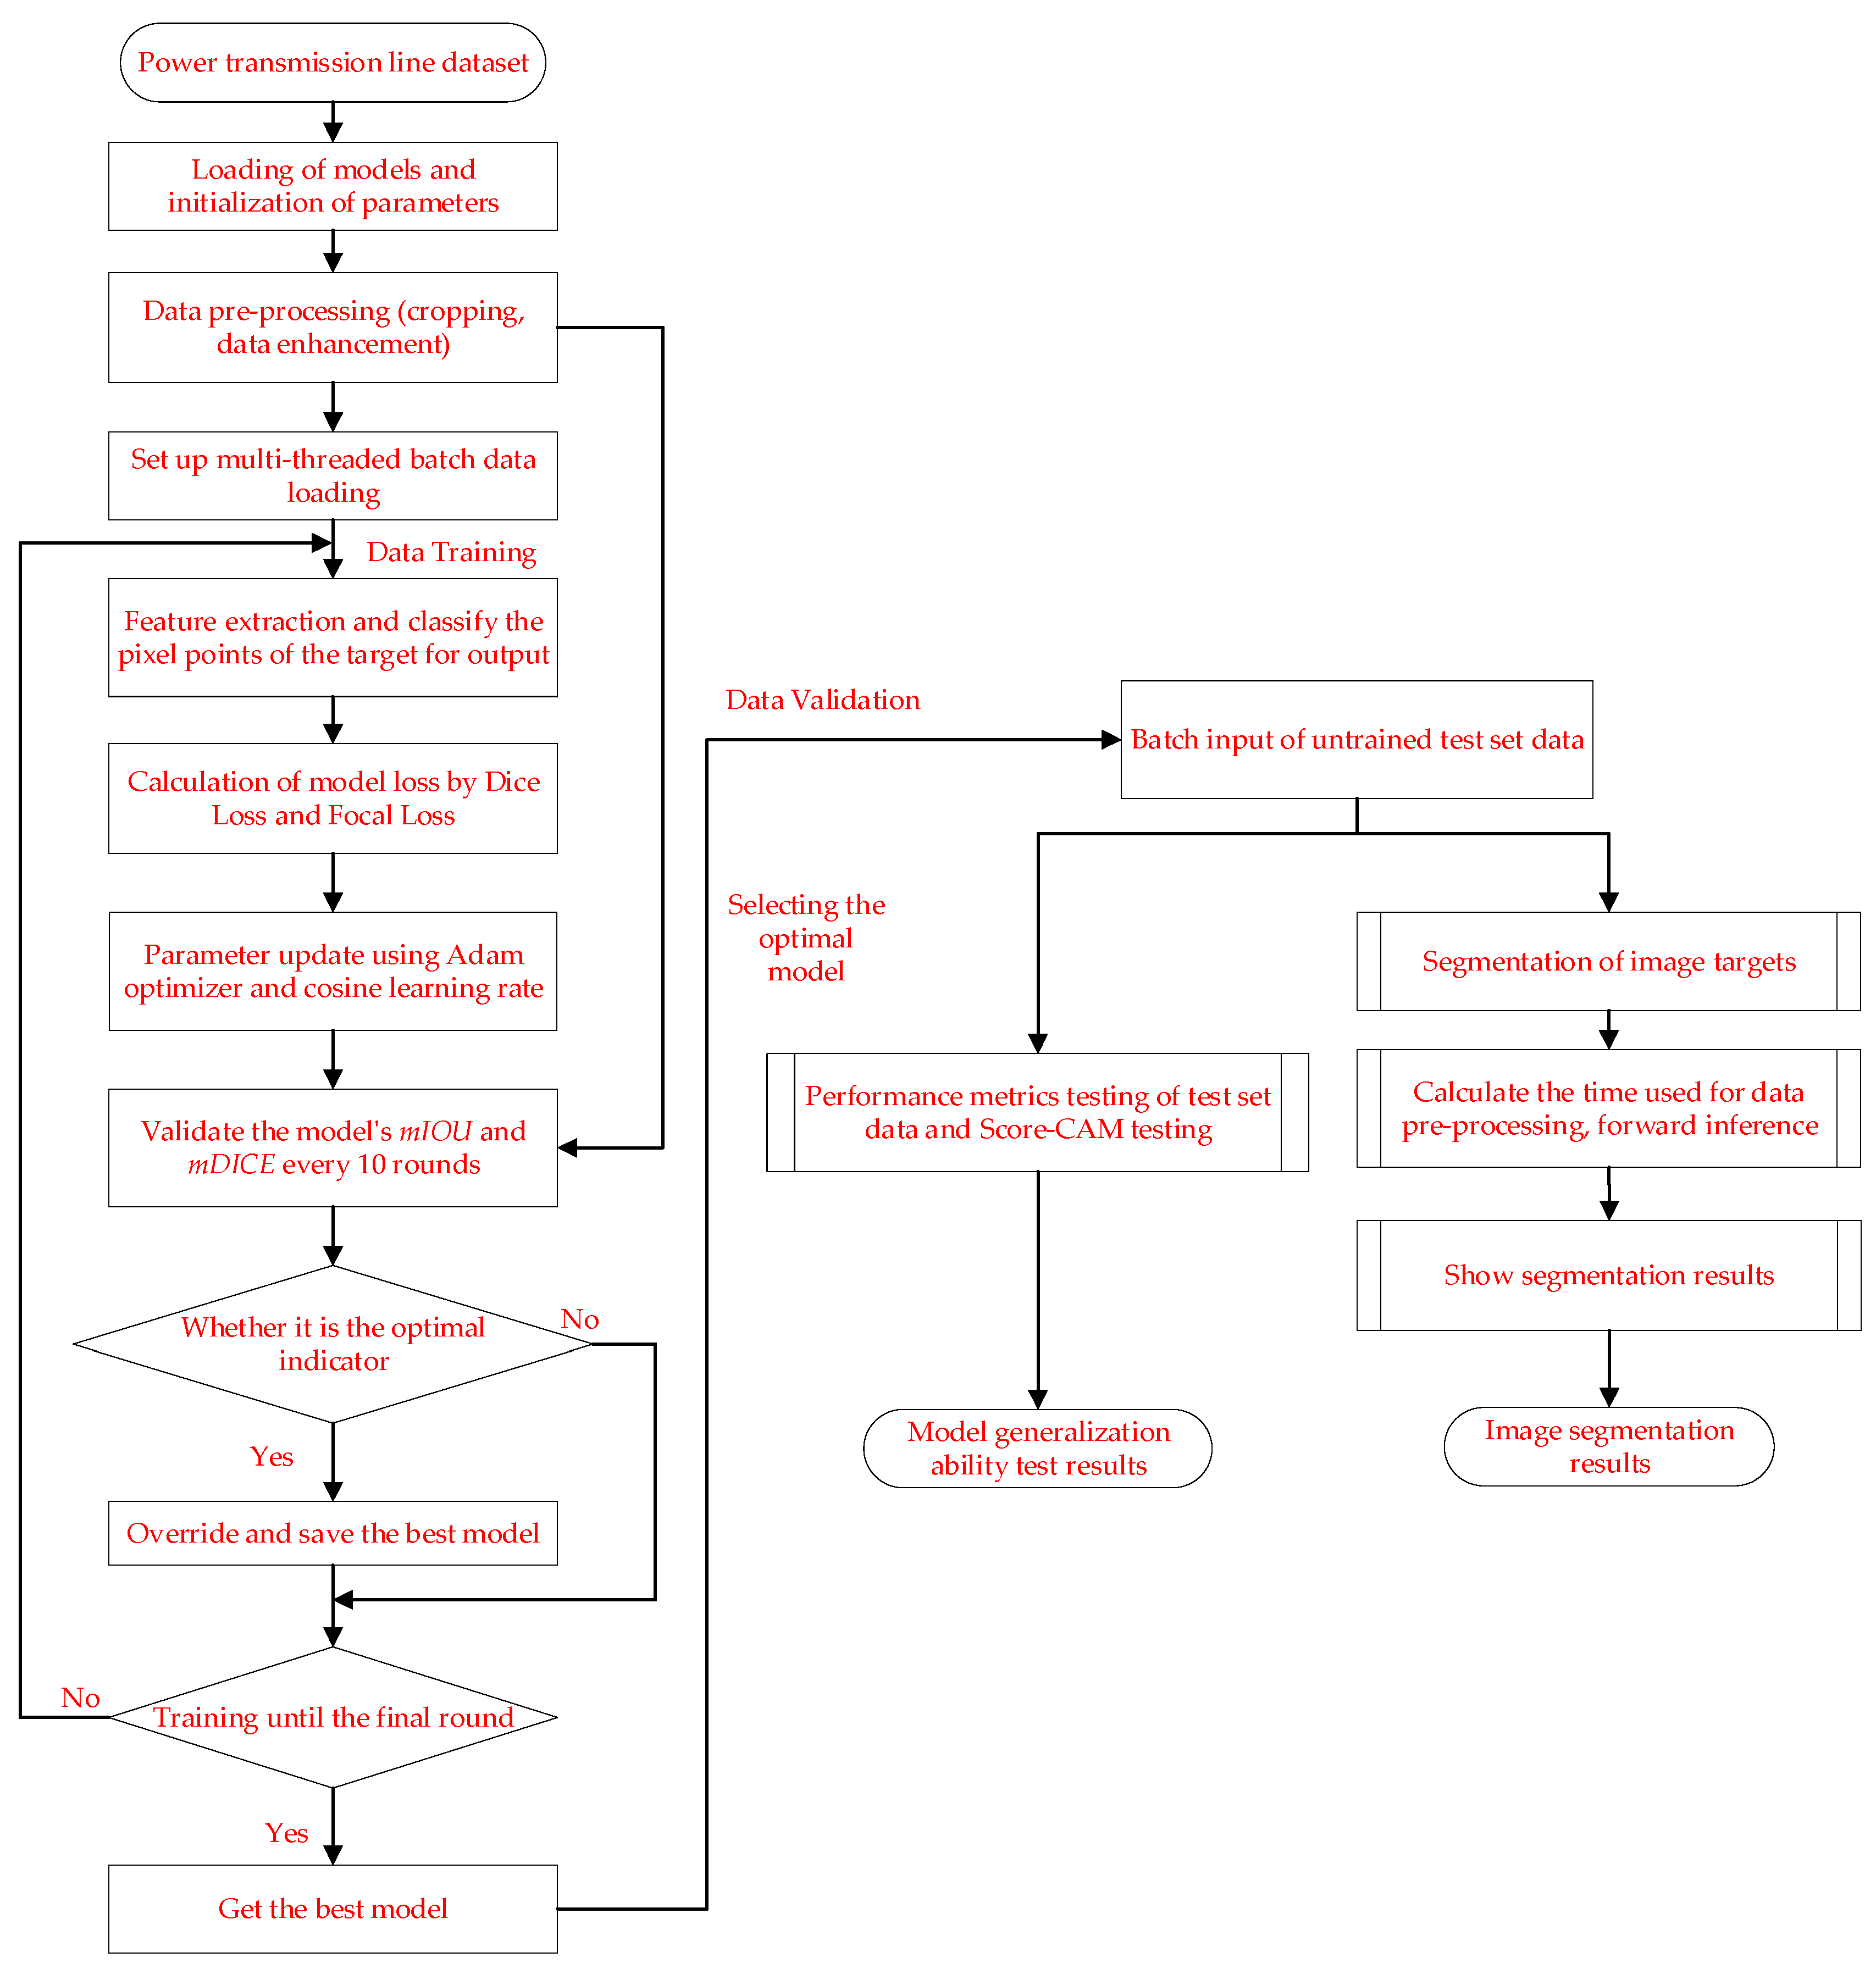
The data are randomly divided into the training set, validation set, and test set in the ratio of 8:1:1. The training set is used to train the model parameters of the segmentation algorithm to obtain the training weights for this dataset. Validation sets are used to monitor the training process and prevent training overfitting. The test set is used to test the training effect and algorithm performance. No data augmentation was performed before training.
This experiment was conducted on an Ubuntu 18.08 system with Python version 3.8.0, CUDA version 11.2, and a deep learning framework based on PyTorch 1.8 environment for training and testing. The training was conducted with two NVIDIA GeForce RTX 3090-24G graphics cards and the graphics card used for the data tested in this article was the NVIDIA GeForce GTX 1050 Ti-4G. Table 4 contains the experimental parameters and settings.
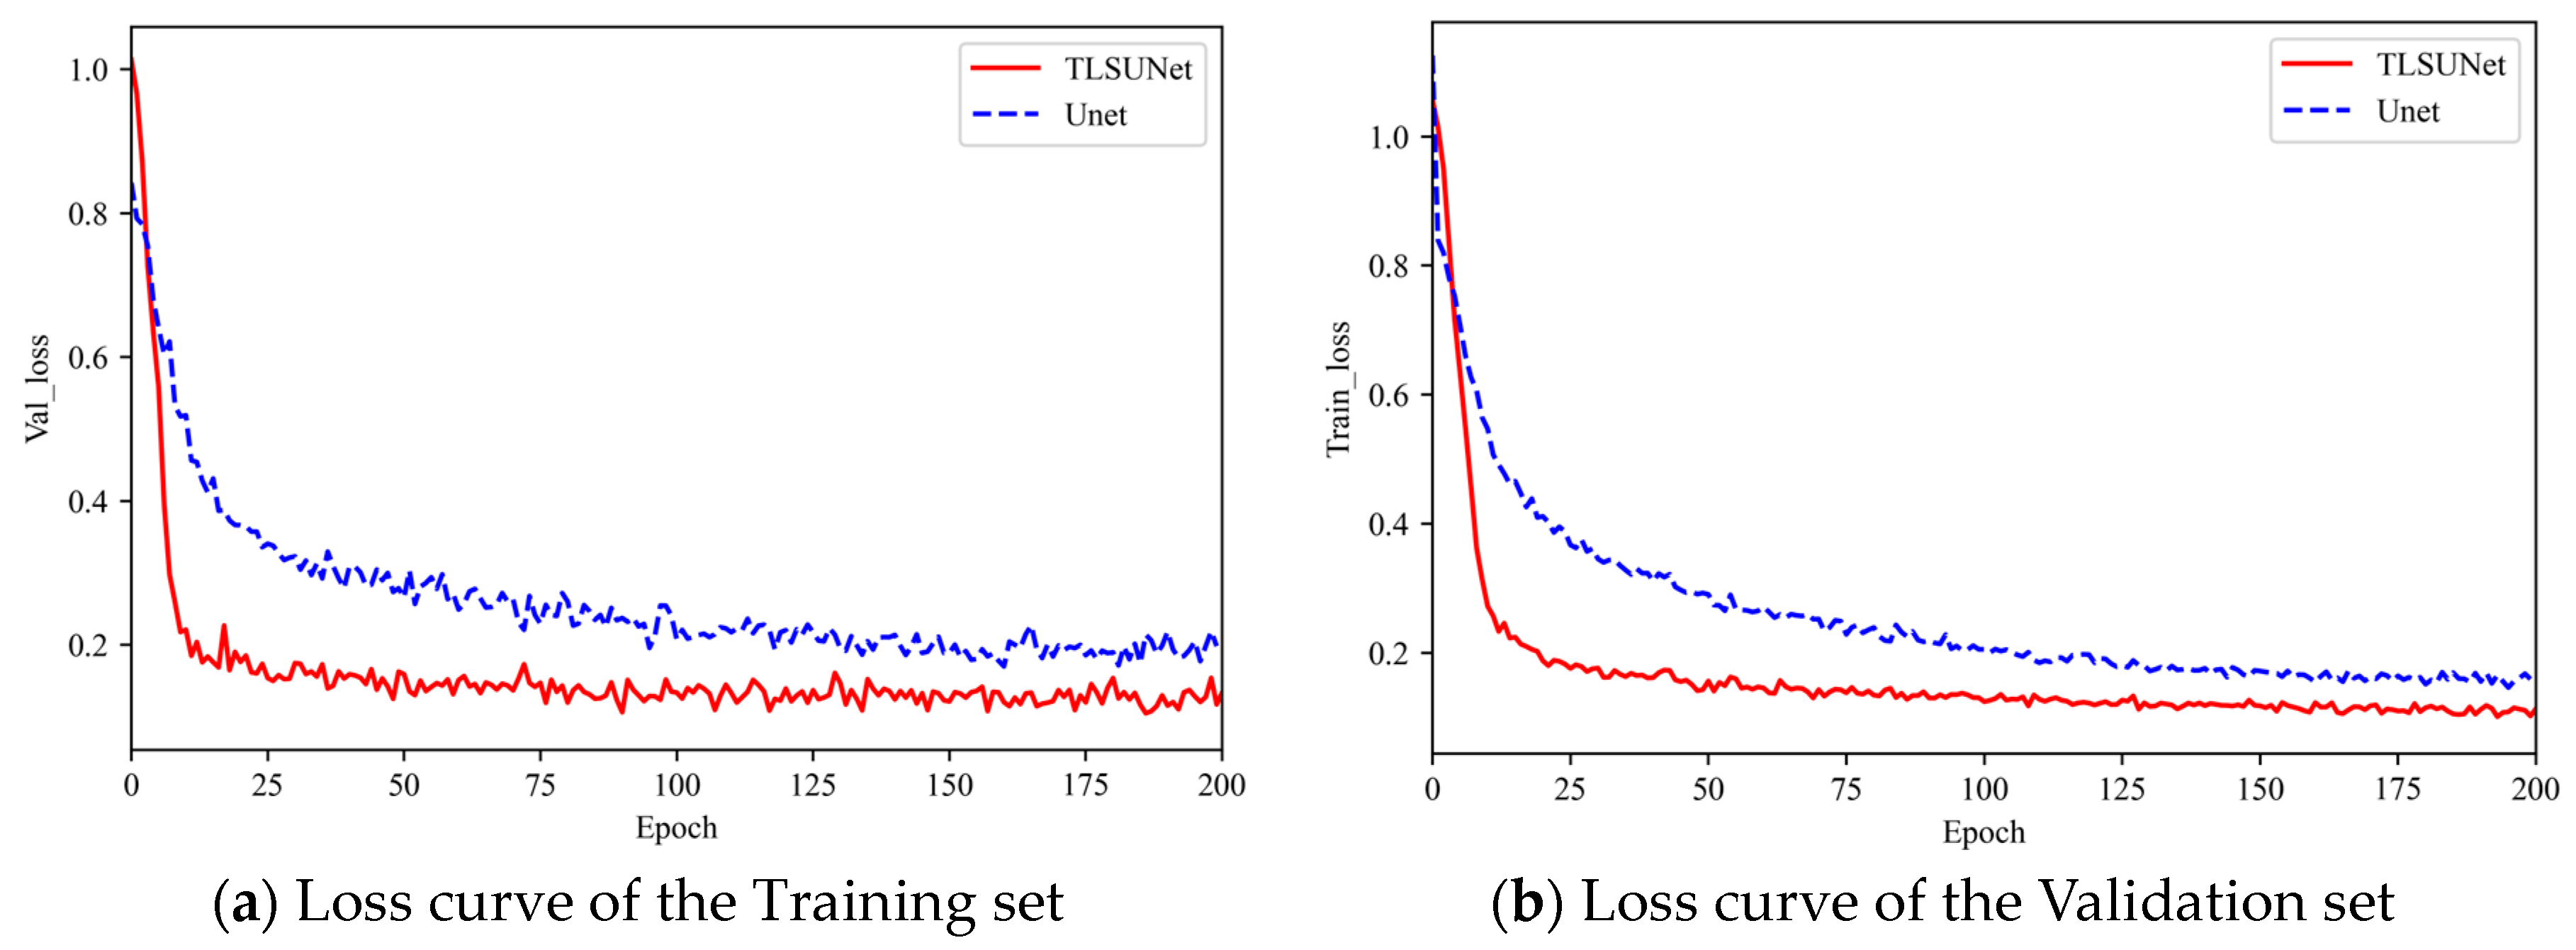
A comparison of the loss curves of the training and validation sets during the training process is shown in Figure 10. A total of 200 rounds were trained; the initial learning of the model was 0.0001, the momentum was 0.9, and the learning rate was optimized using cosine decay. The batch size was 4, and Iterative optimization of model parameters took place using Adam optimizer. Figure 10a shows the training loss convergence of the improved model and the original model. Figure 10b shows the validation loss convergence of the improved model and the original model. Among them, we will finally fuse all the improved models named TLSUNet (UNet + DFC-Ghost + ACmix + CARAFE), which is the red curve in Figure 10 and Figure 11. From the figure, it can be seen that the improved model has faster loss convergence and lower loss value than the original model, The model is smooth in the region around 150 rounds. Figure 11a,b show the validation set change curves of the mIOU and mDice metrics of the model before and after the improvement. As can be seen from the curves, the mIOU and mDice indexes of the improved model are higher than those of the original model, verifying the effectiveness of the model improvement.

3.2. Comparison of Splitting Accuracy Metrics

To verify the effectiveness of the improved algorithm, ablation experiments were conducted in the same environment, as shown in Table 5:
(1) From the perspective of detection accuracy, the UNet model without any improvements as a baseline “+” indicates a mix of modules. mIOU has been improved by 6.71 compared to the original model, mDice by 4.57 compared to the original model, mPA by 4.36 compared to the original model, mRecall by 4.36 compared to the original model, and mPrecision is improved by 4.9 compared to the original model. At the same time, the results of different ablation experiments are better compared to the original model. The above enhancement verifies the feasibility of the improved scheme in terms of detection accuracy.
(2) From the perspective of detection speed, in this paper, by performing DFCGhost-based model lightweighting on both the encode and decode of the original model. The improved model on GFLOPs is only 8.3% of the computational effort of the original model, and the number of parameters is only 21.4% of the original model. The inference speed delay is reduced by 0.012 s. The above enhancement verifies the feasibility of the improved scheme in terms of detection speed.

3.3. Test Image Comparison

To verify the actual detection effect of the model, Table 6 exemplifies the detection results of the algorithm before and after the improvement of the test set. In Table 6, the first line is the real image under the aerial image, and the second line Ground Truth is the real label image after labeling the target through Labelme. It is mainly used for evaluating and comparing the predicted images during the training process. With the help of the second section, the mentioned evaluation index is used to judge the results between the real map and the predicted map. The following is the prediction result graph of the comparison model.
(1) The first of these images is a typical power line segmentation in a complex background. The fusion improvement model (TLSUNet) can better segment power lines in complex backgrounds, the rest of the models have intermittent segmentation or mis-segmentation problems.
(2) The second picture and the third picture show the division of power lines and towers with the sky in the background. The second picture is a wood-type tower and the other is a fence-type tower. The fusion improvement model (TLSUNet) model can better achieve the effective segmentation of power lines and different types of towers, while the rest of the network has the problem of missed segmentation.
(3) The fourth image shows the simultaneous segmentation of the pole tower and power line in a complex background, where the background is a more complex mountainous area and there is interference from the road color being similar to the pole tower. The fusion improvement model (TLSUNet) can better achieve the effective segmentation of power lines and towers. The above segmentation results also verify the feasibility of the improved scheme for image generalization ability detection.

3.4. Test Image with Score-CAM Comparison

Finally, this paper visualizes and compares the areas of interest of the images through the Score-cam heatmap. The principle of the Score-cam is mainly to weigh the feature map with the score of the target region to remove the dependence on the feature gradient (due to the complexity of the gradient information and the problem of gradient disappearance for activation functions such as Sigmoid and ReLU) [41]. The final result is obtained by taking a linear combination of weights and activation maps. The calculation principle is shown in Equation (15).
H l k = σ ( U P ( A l k ) ) C l k = f ( X * H l k ) f ( X )
In Equation (15), A l k denotes the size of the output feature map, l indicates the feature hierarchy of the output, and k denotes the number of channels corresponding to each feature layer. σ ( ) is the sigmoid activation function. The value interval is used to normalize the feature map. H l k denotes the size of the original output image size. f(X) is the input feature map, and f(X* H l k ) is the weighted result of the input feature map. C l k is the region of interest of the obtained model for the input image.
Through the visualization of the heat map, we know that the heat map is concerned with the location of the target segmentation area, and the darker color represents the focus of attention on the region; as such, the proportion of attention to the outward diffusion is reduced. The first image in Table 7 shows the complex background power line segmentation detected earlier, and the heat map shows that the improved model (TLSUNet) has a clear focus on transmission lines, and the rest of the models all show breakpoints or a low level of color-based focus. The second image shows the segmentation of multiple transmission line towers. The improved model (TLSUNet) pays better attention to all the towers present in the image, especially the long-distance ones. The third and fourth sheets show two types of targets for the same diagram and the improved model (TLSUNet) has a clear focus on the pairs of transmission lines and towers. The heat map-based analysis results also verify the improved scheme’s feasibility in enhancing the image segmentation capability.

4. Discussion

To achieve efficient and accurate segmentation of power lines and power towers in transmission lines, in this paper we propose an improved UNet segmentation algorithm. In this study, we verified the effectiveness of the improved network in terms of segmentation accuracy and segmentation speed by comparing the basic segmentation network with the improved network, and have better solved the power lines and power towers in the transmission line under the complex background. In addition, on this basis, we will further conduct research on the following points:
(1) Use the researched lightweight segmentation network on the edge hardware to conduct test experiments to verify whether its inference speed can meet the requirements of normal inspection, and provide a reference for further performance optimization.
(2) It can be seen from Table 6 that at present, only the division of power lines and power towers can be realized, and more power transmission line equipment will be introduced in the future for detection, to further improve the demand for transmission line inspection.
(3) Further combine mobile edge terminals with UAVs to achieve fully autonomous line inspection requirements. At the same time, it is necessary to further consider the detection effect of the model in dense urban places.

5. Conclusions

For efficient segmentation of power lines and power towers in transmission lines in a complex context, this paper proposes a segmentation algorithm based on an improved UNet structure, and the following conclusions can be drawn by analyzing and comparing the effects of relevant factors on the segmentation effect through existing power transmission data sets.
(1) To address the lightweight problem of the model, this paper designs the DFCGhost convolutional feature extraction network, which is used for the compression of the number of parameters on the one hand, and enhances the feature extraction process in the horizontal and vertical directions at the same time, so that the model can be modeled with long-distance spatial information. The results indicate an improvement of 1.62 in mIOU and 1.16 in mDice of the model. Secondly, the complex background is the main factor affecting the model segmentation, so the deep semantic features are refined and weight extracted by combining the convolution module with local perceptual field enhancement and the transformer module with global perceptual field enhancement. The results showed that the model improved mIOU by 3.46 and mDice by 2.28. Finally, high-precision decoding of features is achieved by using CARAFE’s feature parameter reconstruction to improve the usability of features. The results showed that the model had been improved by 2.85 for mIOU and 1.91 for mDice.
(2) The results of the ablation experiments show that the model incorporating all improvements improves by 6.71 on mIOU, 4.57 on mDice, 4.8 on mPrecision, 4.36 on mRecall, and 4.36 on mPA for power lines and power towers.
(3) The fusion experimental model is tested on the computer side and the results show that the parameters of the lightweight model are only 8.3% of the computation of the original model, and the number of parameters is only 21.4% of the original model. The inference speed delay is reduced by 0.012 s. The test results can play a certain role in the intelligent inspection of power system automation.
At the same time, the power line segmentation task realized in this paper can provide a feasible technical solution and reference for UAV automatic line following inspection technology.

Author Contributions

Conceptualization, L.Q. and M.H.; methodology, L.Q.; software, M.H.; validation, M.H., X.D., S.Z. and H.L.; formal analysis, L.Q.; writing—original draft preparation, L.Q. and M.H.; writing—review and editing, M.H.; visualization, X.D., S.Z. and H.L.; supervision, K.L. and L.Q. All authors have read and agreed to the published version of the manuscript.

Funding

This work was supported by the National Key R & D Program of China (No. 2020YFB0905900).

Data Availability Statement

Dataset link: https://github.com/R3ab/ttpla_dataset (accessed on 14 December 2022).

Conflicts of Interest

The authors declare no conflict of interest.

References

  1. Zhou, F.; Ren, G. Image classification and feature extraction of transmission line based on color space variable. Power Syst. Prot. Control 2018, 46, 89–98. [Google Scholar]
  2. Otsu, N. A threshold selection method from gray-level histograms. IEEE Trans. Syst. Man Cybern. 1979, 9, 62–66. [Google Scholar] [CrossRef]
  3. Zhao, L.; Wang, X.; Dai, D.; Long, J.; Tian, M.; Zhu, G. Automatic Extraction Algorithm of Power Line in Complex Background. High Volt. Eng. 2019, 45, 218–227. [Google Scholar]
  4. Touzi, R.; Lopes, A.; Bousquet, P. A statistical and geometrical edge detector for SAR images. IEEE Trans. Geosci. Remote Sens. 1988, 26, 764–773. [Google Scholar] [CrossRef]
  5. Zhao, L.; Wang, X.; Yao, H.; Tian, M.; Gong, L. Power Line Extraction Algorithm Based on Local Context Information. High Volt. Eng. 2021, 47, 2553–2563. [Google Scholar]
  6. Duda, R.O.; Hart, P.E. Use of the Hough transformation to detect lines and curves in pictures. Commun. ACM 1972, 15, 11–15. [Google Scholar] [CrossRef]
  7. Yuan, C.; Guan, Y.; Zhang, J.; Yuan, C. Power line extraction based on improved Hough transform. Beijing Surv. Mapp. 2018, 32, 730–733. [Google Scholar] [CrossRef]
  8. Cao, H.; Zeng, W.; Shi, Y.; Xu, P. Power line detection based on Hough transform and overall least squares method. Comput. Technol. Dev. 2018, 28, 164–167. [Google Scholar]
  9. Shan, H.; Zhang, J.; Cao, X.; Li, X.; Wu, D. Multiple auxiliaries assisted airborne power line detection. IEEE Trans. Ind. Electron. 2017, 64, 4810–4819. [Google Scholar] [CrossRef]
  10. Zhao, L.; Wang, X.; Yao, H.; Tian, M. Survey of Power Line Extraction Methods Based on Visible Light Aerial Image. Power Syst. Technol. 2021, 45, 1536–1546. [Google Scholar]
  11. Li, Z.; Zhang, Y.; Wu, H.; Suzuki, S.; Namiki, A.; Wang, W. Design and Application of a UAV Autonomous Inspection System for High-Voltage Power Transmission Lines. Remote Sens. 2023, 15, 865. [Google Scholar] [CrossRef]
  12. Jenssen, R.; Roverso, D. Automatic autonomous vision-based power line inspection: A review of current status and the potential role of deep learning. Int. J. Electr. Power Energy Syst. 2018, 99, 107–120. [Google Scholar]
  13. Zhang, Y.; Yuan, X.; Li, W.; Chen, S. Automatic power line inspection using UAV images. Remote Sens. 2017, 9, 824. [Google Scholar] [CrossRef]
  14. Senthilnath, J.; Kumar, A.; Jain, A.; Harikumar, K.; Thapa, M.; Suresh, S. BS-McL: Bilevel segmentation framework with metacognitive learning for detection of the power lines in UAV imagery. IEEE Trans. Geosci. Remote Sens. 2021, 60, 1–12. [Google Scholar] [CrossRef]
  15. Fan, Z.; Shi, L.; Xi, C.; Wang, H.; Wang, S.; Wu, G. Real-Time Power Equipment Meter Recognition Based on Deep Learning. IEEE Trans. Instrum. Meas. 2022, 71, 1–15. [Google Scholar] [CrossRef]
  16. Dong, X.; Fu, R.; Gao, Y.; Qin, Y.; Ye, Y.; Li, B. Remote sensing object detection based on receptive field expansion block. IEEE Geosci. Remote Sens. Lett. 2021, 19, 1–5. [Google Scholar] [CrossRef]
  17. Simonyan, K.; Zisserman, A. Very deep convolutional networks for large-scale image recognition. arXiv 2014, arXiv:1409.1556. [Google Scholar]
  18. He, K.; Zhang, X.; Ren, S.; Sun, J. Deep residual learning for image recognition. In Proceedings of the IEEE Conference on Computer Vision and Pattern Recognition, Las Vegas, NV, USA, 30 June 2016; pp. 770–778. [Google Scholar]
  19. Yetgin, Ö.E.; Benligiray, B.; Gerek, Ö.N. Power line recognition from aerial images with deep learning. IEEE Trans. Aerosp. Electron. Syst. 2018, 55, 2241–2252. [Google Scholar] [CrossRef]
  20. Yang, L.; Fan, J.; Xu, S.; Li, E.; Liu, Y. Vision-based power line segmentation with an attention fusion network. IEEE Sens. J. 2022, 22, 8196–8205. [Google Scholar] [CrossRef]
  21. Han, G.; Zhang, M.; Li, Q.; Liu, X.; Li, T.; Zhao, L. A Lightweight Aerial Power Line Segmentation Algorithm Based on Attention Mechanism. Machines 2022, 10, 881. [Google Scholar] [CrossRef]
  22. Xu, C.; Li, Q.; Zhou, Q.; Zhang, S.; Yu, D.; Ma, Y. Power line-guided automatic electric transmission line inspection system. IEEE Trans. Instrum. Meas. 2022, 71, 1–18. [Google Scholar] [CrossRef]
  23. Gao, Z.; Yang, G.; Li, E.; Liang, Z.; Guo, R. Efficient parallel branch network with multi-scale feature fusion for real-time overhead power line segmentation. IEEE Sens. J. 2021, 21, 12220–12227. [Google Scholar] [CrossRef]
  24. Choi, H.; Yun, J.P.; Kim, B.J.; Jang, H.; Kim, S.W. Attention-based multimodal image feature fusion module for transmission line detection. IEEE Trans. Ind. Inform. 2022, 18, 7686–7695. [Google Scholar] [CrossRef]
  25. Abdelfattah, R.; Wang, X.; Wang, S. Ttpla: An aerial-image dataset for detection and segmentation of transmission towers and power lines. In Proceedings of the Asian Conference on Computer Vision, Kyoto, Japan, 4 December 2020. [Google Scholar]
  26. Available online: https://github.com/r3ab/ttpla_dataset (accessed on 14 December 2022).
  27. Ronneberger, O.; Fischer, P.; Brox, T. U-net: Convolutional networks for biomedical image segmentation. In Proceedings of the Medical Image Computing and Computer-Assisted Intervention—MICCAI 2015: 18th International Conference, Munich, Germany, 5–9 October 2015; Springer International Publishing: Cham, Switzerland, 2015; pp. 234–241. [Google Scholar]
  28. Song, K.; Yang, G.; Wang, Q.; Xu, C.; Liu, J.; Liu, W.; Shi, C.; Wang, Y.; Zhang, G. Deep learning prediction of incoming rainfalls: An operational service for the city of Beijing China. In Proceedings of the 2019 International Conference on Data Mining Workshops (ICDMW), Beijing, China, 8–11 November 2019; pp. 180–185. [Google Scholar]
  29. Paszke, A.; Chaurasia, A.; Kim, S.; Culurciello, E. Enet: A deep neural network architecture for real-time semantic segmentation. arXiv 2016, arXiv:1606.02147. [Google Scholar]
  30. Zhao, H.; Shi, J.; Qi, X.; Wang, X.; Jia, J. Pyramid scene parsing network. In Proceedings of the IEEE Conference on Computer Vision and Pattern Recognition, Honolulu, HI, USA, 21–26 July 2017; pp. 2881–2890. [Google Scholar]
  31. Chen, L.-C.; Zhu, Y.; Papandreou, G.; Schroff, F.; Adam, H. Encoder-decoder with atrous separable convolution for semantic image segmentation. In Proceedings of the European Conference on Computer Vision (ECCV), Munich, Germany, 8–14 September 2018; pp. 801–818. [Google Scholar]
  32. Sun, K.; Xiao, B.; Liu, D.; Wang, J. Deep high-resolution representation learning for human pose estimation. In Proceedings of the IEEE/CVF Conference on Computer Vision and Pattern Recognition, Long Beach, CA, USA, 15–20 June 2019; pp. 5693–5703. [Google Scholar]
  33. Xie, E.; Wang, W.; Yu, Z.; Anandkumar, A.; Alvarez, J.M.; Luo, P. SegFormer: Simple and efficient design for semantic segmentation with transformers. Adv. Neural Inf. Process. Syst. 2021, 34, 12077–12090. [Google Scholar]
  34. Howard, A.; Sandler, M.; Chu, G.; Chen, L.-C.; Chen, B.; Tan, M. Searching for mobilenetv3. In Proceedings of the IEEE/CVF International Conference on Computer Vision, Seoul, Republic of Korea, 27 October–2 November 2019; pp. 1314–1324. [Google Scholar]
  35. Han, K.; Wang, Y.; Tian, Q.; Guo, J.; Xu, C.; Xu, C. Ghostnet: More features from cheap operations. In Proceedings of the IEEE/CVF Conference on Computer Vision and Pattern Recognition, Seattle, WA, USA, 14–19 June 2020; pp. 1580–1589. [Google Scholar]
  36. Tan, M.; Le, Q. Efficientnet: Rethinking model scaling for convolutional neural networks. In Proceedings of the International Conference on Machine Learning, Long Beach, CA, USA, 10–15 June 2019; pp. 6105–6114. [Google Scholar]
  37. Zhang, X.; Zhou, X.; Lin, M.; Sun, J. Shufflenet: An extremely efficient convolutional neural network for mobile devices. In Proceedings of the IEEE Conference on Computer Vision and Pattern Recognition, Salt Lake City, UT, USA, 18–22 June 2018; pp. 6848–6856. [Google Scholar]
  38. Tang, Y.; Han, K.; Guo, J.; Xu, C.; Xu, C.; Wang, Y. GhostNetV2: Enhance Cheap Operation with Long-Range Attention. arXiv 2022, arXiv:2211.12905. [Google Scholar]
  39. Pan, X.; Ge, C.; Lu, R.; Song, S.; Chen, G.; Huang, Z.; Huang, G. On the integration of self-attention and convolution. In Proceedings of the IEEE/CVF Conference on Computer Vision and Pattern Recognition, New Orleans, LA, USA, 18–24 June 2022; pp. 815–825. [Google Scholar]
  40. Wang, J.; Chen, K.; Xu, R.; Liu, Z.; Loy, C.C.; Liu, D. Carafe: Content-aware reassembly of features. In Proceedings of the IEEE/CVF International Conference on Computer Vision, Seoul, Republic of Korea, 27 October–2 November 2019; pp. 3007–3016. [Google Scholar]
  41. Wang, H.; Wang, Z.; Du, M.; Yang, F.; Zhang, Z.; Ding, S.; Mardziel, P.; Hu, X. Score-CAM: Score-weighted visual explanations for convolutional neural networks. In Proceedings of the IEEE/CVF Conference on Computer Vision and Pattern Recognition Workshops, Seattle, WA, USA, 14–19 June 2020; pp. 24–25. [Google Scholar]
Figure 1. A sample dataset from different perspectives.
Drones 07 00274 g001
Figure 2. UNet structure diagram.
Drones 07 00274 g002
Figure 3. Test result graph of UNet model.
Drones 07 00274 g003
Figure 4. GhostNet convolutional structure.
Drones 07 00274 g004
Figure 5. DFC-GhostNet convolutional structures.
Drones 07 00274 g005
Figure 6. Structure of ACMix.
Drones 07 00274 g006
Figure 7. Structure of CARAFE.
Drones 07 00274 g007
Figure 8. Transmission line segmentation model diagram.
Drones 07 00274 g008
Figure 9. Transmission line segmentation flow chart.
Drones 07 00274 g009
Figure 10. Loss curve of the model.
Drones 07 00274 g010
Figure 11. Evaluation metrics curve of the model.
Drones 07 00274 g011
Table 1. Distribution of segmentation targets.
TargetBackgroundCableTower
Total target pixels/million109,86022,51037,140
Table 2. Comparison of common semantic segmentation algorithms.
ModelmIOUmDicemPAmRecallmPrecisionParameters (M)GFLOPs (G)Runtime (s)
UNet79.7587.8386.8186.8188.8924.89457.7060.0516
ResUNet 70.4380.8580.1880.1881.5913647.930.0761
E-Net 61.3172.8869.8269.8281.460.3494.4320.0139
PSPNet 63.9470.9770.1270.1275.882.3766.0310.0238
Deeplabv3+ 77.4485.6884.8884.8886.585.8152.8750.0337
HRNet 70.1979.5975.6975.6984.609.64232.9480.0282
SegFormer 74.6483.5582.8082.8084.3813.72026.6960.0352
Table 3. Comparison of Semantic Segmentation Models under Light-weighting Backbone.
BackbonemIOUmDicemPAmRecallmPrecisionGFLOPs (G)Parameters (M)Runtime (s)
Original79.7587.8386.8186.8188.89457.70624.890.0516
MobileNetv3 81.1388.6886.8686.8690.7171.3298.9100.0205
GhostNet 83.4690.4089.7089.7091.8370.8419.5840.0284
EfficientNet 82.4989.6589.0889.0890.24102.39226.6920.0304
ShuffleNet 68.3279.5773.7273.7287.9376.3319.0080.0194
Table 4. Parameter Settings.
Size of ImageBatch_SizeMomentumInitial LrMin_LrLr_Decay_TypeOptimizerIterations
512 × 51240.9e−4e−6cosAdam200
Table 5. Comparison of ablation experiments.
ModelmIOUmDicemPAmRecallmPrecisionGFLOPs (G)Parameters (M)Runtime (s)
UNet79.7587.8386.8186.8188.89457.70624.890.0516
DFCGhost + UNet81.3788.9987.4787.4790.6129.8664.7730.0254
ACmix + UNet83.2190.1188.6088.6091.77453.43125.7210.0584
UNet + CARAFE82.6089.7488.5988.5990.98482.49325.7650.0929
UNet + DFCGhost + ACmix85.1491.5090.0790.0793.0030.9924.7220.0276
UNet + DFCGhost + CARAFE85.2291.5690.4990.4992.6741.2355.9520.0641
UNet + ACmix + CARAFE86.3392.2590.9290.9293.70480.34426.4780.1039
UNet + DFC-Ghost + ACmix + CARAFE86.4692.4091.1791.1793.6938.3595.3270.0396
Table 6. Comparison of test set data.
ModelDrones 07 00274 i001Drones 07 00274 i002Drones 07 00274 i003Drones 07 00274 i004
Ground TruthDrones 07 00274 i005Drones 07 00274 i006Drones 07 00274 i007Drones 07 00274 i008
UNetDrones 07 00274 i009Drones 07 00274 i010Drones 07 00274 i011Drones 07 00274 i012
ResUNetDrones 07 00274 i013Drones 07 00274 i014Drones 07 00274 i015Drones 07 00274 i016
ENetDrones 07 00274 i017Drones 07 00274 i018Drones 07 00274 i019Drones 07 00274 i020
PSPNetDrones 07 00274 i021Drones 07 00274 i022Drones 07 00274 i023Drones 07 00274 i024
DeepLabv3+Drones 07 00274 i025Drones 07 00274 i026Drones 07 00274 i027Drones 07 00274 i028
HRNetDrones 07 00274 i029Drones 07 00274 i030Drones 07 00274 i031Drones 07 00274 i032
SegFormerDrones 07 00274 i033Drones 07 00274 i034Drones 07 00274 i035Drones 07 00274 i036
TLSUNetDrones 07 00274 i037Drones 07 00274 i038Drones 07 00274 i039Drones 07 00274 i040
Table 7. Comparison of heat map visualization.
ModelDrones 07 00274 i041Drones 07 00274 i042Drones 07 00274 i043Drones 07 00274 i044
UNetDrones 07 00274 i045Drones 07 00274 i046Drones 07 00274 i047Drones 07 00274 i048
ResUNetDrones 07 00274 i049Drones 07 00274 i050Drones 07 00274 i051Drones 07 00274 i052
ENetDrones 07 00274 i053Drones 07 00274 i054Drones 07 00274 i055Drones 07 00274 i056
PSPNetDrones 07 00274 i057Drones 07 00274 i058Drones 07 00274 i059Drones 07 00274 i060
DeepLabv3+Drones 07 00274 i061Drones 07 00274 i062Drones 07 00274 i063Drones 07 00274 i064
HRNetDrones 07 00274 i065Drones 07 00274 i066Drones 07 00274 i067Drones 07 00274 i068
SegFormerDrones 07 00274 i069Drones 07 00274 i070Drones 07 00274 i071Drones 07 00274 i072
TLSUNetDrones 07 00274 i073Drones 07 00274 i074Drones 07 00274 i075Drones 07 00274 i076
Disclaimer/Publisher’s Note: The statements, opinions and data contained in all publications are solely those of the individual author(s) and contributor(s) and not of MDPI and/or the editor(s). MDPI and/or the editor(s) disclaim responsibility for any injury to people or property resulting from any ideas, methods, instructions or products referred to in the content.

